infrastructure: buildings, support systems, and industrial
TRANSCRIPT

16.3. Infrastructure in the Arctic . . . . . . . . . . . . . . . . . . . . . . . . . .92616.3.1. Ultraviolet radiation and construction materials . . . . . . . . . .92816.3.2. Buildings . . . . . . . . . . . . . . . . . . . . . . . . . . . . . . . . . . . . . . . . . .92916.3.3. Road and railway embankments and work pads . . . . . . . . . . .93016.3.4. Pipelines . . . . . . . . . . . . . . . . . . . . . . . . . . . . . . . . . . . . . . . . . .93116.3.5.Water-retaining structures . . . . . . . . . . . . . . . . . . . . . . . . . . . .93316.3.6. Off-road transportation routes . . . . . . . . . . . . . . . . . . . . . . . .93316.3.7. Offshore transportation routes . . . . . . . . . . . . . . . . . . . . . . . .93416.3.8. Damage to infrastructure . . . . . . . . . . . . . . . . . . . . . . . . . . . .93516.3.9. Energy consumption for heating . . . . . . . . . . . . . . . . . . . . . . .93616.3.10. Natural resources . . . . . . . . . . . . . . . . . . . . . . . . . . . . . . . . . .936
16.4. Engineering design for a changing climate . . . . . . . . . . . . . .93716.4.1. Risk-based evaluation of potential climate change impacts . .93816.4.2. Design thawing and freezing indices . . . . . . . . . . . . . . . . . . . .93816.4.3. Coastal areas . . . . . . . . . . . . . . . . . . . . . . . . . . . . . . . . . . . . . .940
16.4.3.1. Severe erosion in Tuktoyaktuk, Canada . . . . . . . . . . .94016.4.3.2. Erosion threatens Russian oil storage facility . . . . . .940
16.4.4. Summary . . . . . . . . . . . . . . . . . . . . . . . . . . . . . . . . . . . . . . . . . .94016.5. Gaps in knowledge and research needs . . . . . . . . . . . . . . . .941References . . . . . . . . . . . . . . . . . . . . . . . . . . . . . . . . . . . . . . . . . . . .941
Contents
Summary . . . . . . . . . . . . . . . . . . . . . . . . . . . . . . . . . . . . . . . . . . . . .90816.1. Introduction . . . . . . . . . . . . . . . . . . . . . . . . . . . . . . . . . . . . . . .90816.2. Physical environment and processes related to
infrastructure . . . . . . . . . . . . . . . . . . . . . . . . . . . . . . . . . . . . . .90816.2.1. Observed changes in air temperature . . . . . . . . . . . . . . . . . . .90816.2.2. Permafrost . . . . . . . . . . . . . . . . . . . . . . . . . . . . . . . . . . . . . . . .909
16.2.2.1. Observed changes in permafrost . . . . . . . . . . . . . . . .91016.2.2.2. Observed changes in freezing and thawing indices . .91016.2.2.3. Projected changes in permafrost . . . . . . . . . . . . . . . .91216.2.2.4. Projected changes in freezing and thawing indices . .91316.2.2.5. Engineering concerns . . . . . . . . . . . . . . . . . . . . . . . . .91416.2.2.6.Areas south of the permafrost border . . . . . . . . . . .91616.2.2.7. Summary . . . . . . . . . . . . . . . . . . . . . . . . . . . . . . . . . . .916
16.2.3. Natural hazards . . . . . . . . . . . . . . . . . . . . . . . . . . . . . . . . . . . .91716.2.3.1. Infrastructure and natural hazards . . . . . . . . . . . . . . .91716.2.3.2. Factors affecting slope stability and failure . . . . . . . .91716.2.3.3. Potential impacts of climate change on avalanche
and slide activity . . . . . . . . . . . . . . . . . . . . . . . . . . . . .91816.2.3.4. Summary . . . . . . . . . . . . . . . . . . . . . . . . . . . . . . . . . . .920
16.2.4. Coastal environment . . . . . . . . . . . . . . . . . . . . . . . . . . . . . . . .92016.2.4.1. Observed changes in the coastal environment . . . . .92116.2.4.2. Projected changes in the coastal environment . . . . .922
16.2.5.Arctic Ocean . . . . . . . . . . . . . . . . . . . . . . . . . . . . . . . . . . . . . . .92316.2.5.1. Observed changes in sea-ice extent . . . . . . . . . . . . .92316.2.5.2. Projected changes in sea-ice extent . . . . . . . . . . . . . .924
Chapter 16
Infrastructure: Buildings, Support Systems, and IndustrialFacilities
Lead AuthorArne Instanes
Contributing AuthorsOleg Anisimov, Lawson Brigham, Douglas Goering, Lev N. Khrustalev, Branko Ladanyi, Jan Otto Larsen
Consulting AuthorsOrson Smith, Amy Stevermer, Betsy Weatherhead, Gunter Weller
908 Arctic Climate Impact Assessment
16.1. Introduction
There are increased concerns related to the impact ofprojected climate change on arctic infrastructure,particularly how future climate change may:
• increase the environmental stresses structures areexposed to, particularly in comparison to designspecifications, and cause increased risk and dam-age to infrastructure and threat to human lives;
• affect geohazards and the impacts of extremeevents;
• affect natural resource development scenarios inthe Arctic; and
• affect socioeconomic development in the Arctic.
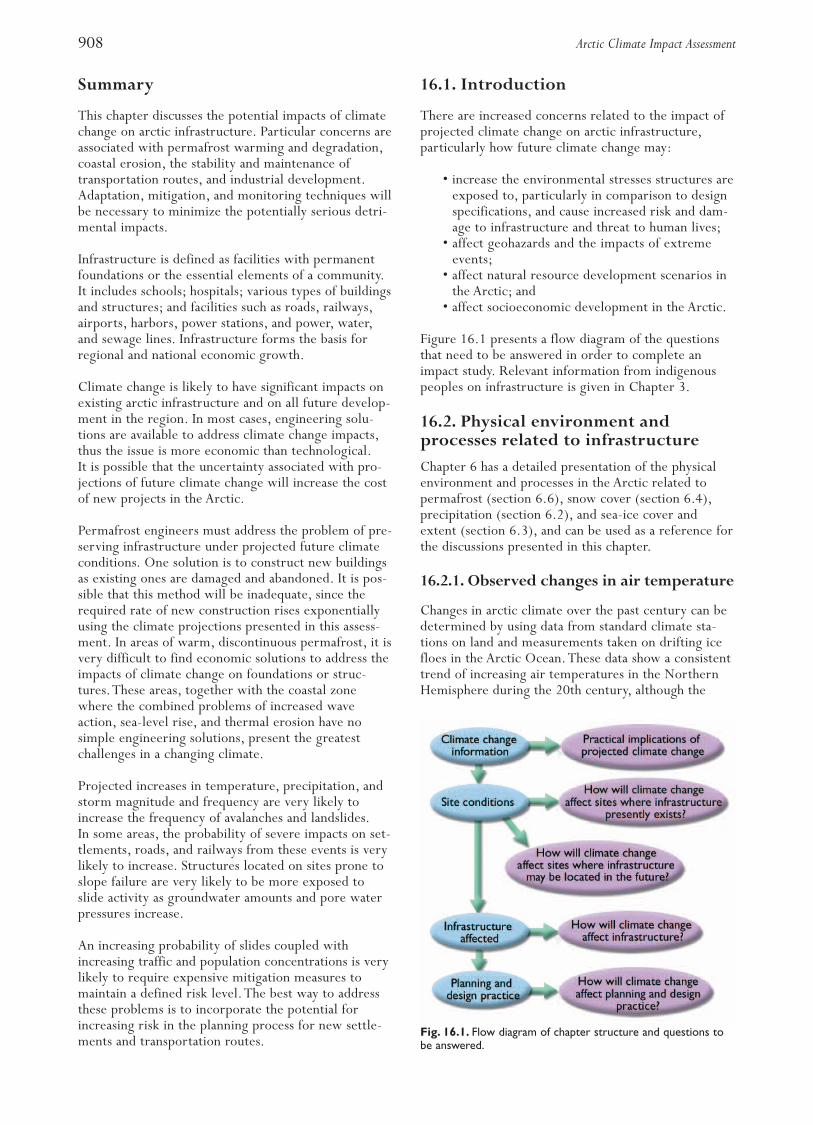
Figure 16.1 presents a flow diagram of the questionsthat need to be answered in order to complete animpact study. Relevant information from indigenouspeoples on infrastructure is given in Chapter 3.
16.2. Physical environment andprocesses related to infrastructureChapter 6 has a detailed presentation of the physicalenvironment and processes in the Arctic related topermafrost (section 6.6), snow cover (section 6.4),precipitation (section 6.2), and sea-ice cover andextent (section 6.3), and can be used as a reference forthe discussions presented in this chapter.
16.2.1. Observed changes in air temperature
Changes in arctic climate over the past century can bedetermined by using data from standard climate sta-tions on land and measurements taken on drifting icefloes in the Arctic Ocean.These data show a consistenttrend of increasing air temperatures in the NorthernHemisphere during the 20th century, although the
Summary
This chapter discusses the potential impacts of climatechange on arctic infrastructure. Particular concerns areassociated with permafrost warming and degradation,coastal erosion, the stability and maintenance oftransportation routes, and industrial development.Adaptation, mitigation, and monitoring techniques willbe necessary to minimize the potentially serious detri-mental impacts.
Infrastructure is defined as facilities with permanentfoundations or the essential elements of a community.It includes schools; hospitals; various types of buildingsand structures; and facilities such as roads, railways,airports, harbors, power stations, and power, water,and sewage lines. Infrastructure forms the basis forregional and national economic growth.
Climate change is likely to have significant impacts onexisting arctic infrastructure and on all future develop-ment in the region. In most cases, engineering solu-tions are available to address climate change impacts,thus the issue is more economic than technological.It is possible that the uncertainty associated with pro-jections of future climate change will increase the costof new projects in the Arctic.
Permafrost engineers must address the problem of pre-serving infrastructure under projected future climateconditions. One solution is to construct new buildingsas existing ones are damaged and abandoned. It is pos-sible that this method will be inadequate, since therequired rate of new construction rises exponentiallyusing the climate projections presented in this assess-ment. In areas of warm, discontinuous permafrost, it isvery difficult to find economic solutions to address theimpacts of climate change on foundations or struc-tures.These areas, together with the coastal zonewhere the combined problems of increased waveaction, sea-level rise, and thermal erosion have nosimple engineering solutions, present the greatestchallenges in a changing climate.
Projected increases in temperature, precipitation, andstorm magnitude and frequency are very likely toincrease the frequency of avalanches and landslides.In some areas, the probability of severe impacts on set-tlements, roads, and railways from these events is verylikely to increase. Structures located on sites prone toslope failure are very likely to be more exposed toslide activity as groundwater amounts and pore waterpressures increase.
An increasing probability of slides coupled withincreasing traffic and population concentrations is verylikely to require expensive mitigation measures tomaintain a defined risk level.The best way to addressthese problems is to incorporate the potential forincreasing risk in the planning process for new settle-ments and transportation routes.
Fig. 16.1. Flow diagram of chapter structure and questions tobe answered.

Chapter 16 • Infrastructure: Buildings, Support Systems, and Industrial Facilities 909
observed changes are not spatially uniform (Anisimov,2001).While in some regions of the Arctic the warm-ing trend was as great as 5 ºC per century, areas ofdecreasing temperatures were observed in easternCanada, the North Atlantic, and Greenland (Anisimovand Fitzharris, 2001; Borzenkova, 1999a,b; Jones etal., 1999; Serreze et al., 2000).
Figure 16.2 shows the change in observed surface airtemperature between 1954 and 2003 (see also section2.6.2). Patterns of annual air temperature change indi-cate that the recent warming has been greatest inAlaska, northwestern Canada, and Siberia (Fig. 16.2a).Temperature increases in winter were much greaterthan increases in the annual mean temperature: up to3 to 4 ºC over Alaska, northwestern Canada, andSiberia (Fig. 16.2b). In southern Greenland andIceland, annual mean temperatures decreased byapproximately 1 ºC, while winter temperaturesdecreased by 1 to 2 ºC. A winter temperature decreaseof 1 to 2 ºC was also observed in Chukotka.
On the North Slope of Alaska and in northern Siberia,air temperatures increased by 2 to 4 ºC, while theglobal mean air temperature increase over the 20thcentury was only about 0.6 ºC.This pattern is consis-tent with the hypothesis that the contemporary warm-ing is largely caused by anthropogenic greenhouse gasemissions. Section 2.6.2 discusses observed arctic tem-perature changes in detail, while section 4.4.2 providesprojections of future arctic temperature change.
16.2.2. Permafrost
Permafrost underlies most of the surfaces in the terres-trial Arctic. Permafrost depths vary from a few to
many hundreds of meters (Brown et al., 1997).At selected locations in Yakutia with a cold continentalclimate, permafrost occurs to depths of 1500 m.Most biogeochemical and hydrological processes inpermafrost are confined to the active (seasonallythawed) layer, which varies from several tens of cen-timeters to several meters in depth. Seasonal thawdepth and the temperature of the frozen ground aretwo important parameters that must be accounted forin the design of infrastructure built on permafrost.These parameters control key cryogenic processes,such as creep, thaw settlement, adfreeze bond (bondbetween frozen soil and the material embedded in it),frost heave, and frost jacking (annually repeated foun-dation uplift caused by frost heave; see Andersland andLadanyi (1994) for further discussion of these process-es). Seasonal thaw depth and frozen-ground tempera-ture both depend on ground-surface temperature, heatflow from the interior of the earth, snow cover, vegeta-tion, and soil properties.
Owing to their low thermal conductivity, snow coverand vegetation (with the underlying organic layer)attenuate annual variations in air temperature and areimportant regulators of permafrost temperature anddepth of seasonal thaw at the local scale.The tempera-ture of permafrost under a thick layer of snow may beseveral degrees higher than in nearby permafrost thatlacks snow cover. In summer, the thermal conductivityof the vegetation and underlying organic layer is typi-cally much smaller than in winter.This reduces sum-mer heat fluxes and keeps permafrost temperatureslower than they would be in the absence of vegetation.A controlled experiment near Fairbanks, Alaska, pro-duced permafrost degradation to a depth of 6.7 m overa 26-year period, simply by removing the insulating
Fig. 16.2. Change in observed surface air temperature between 1954 and 2003: (a) annual mean; (b) winter (Chapman and Walsh,2003, using data from the Climatic Research Unit, University of East Anglia, www.cru.uea.ac.uk/temperature).
Annual
No Data No Data
(b)(a) Winter (Dec–Feb)
(ºC)
+4
+3
+2
+1
0
-1
-2

910 Arctic Climate Impact Assessment
layer of vegetation (Linell, 1973). Finally, thermal con-ductivity is typically 20 to 35% lower in thawed miner-al soils than in frozen mineral soils. Consequently, themean annual temperature below the level of seasonalthawing may be 0.5 to 1.5 ºC lower than on theground surface.
The extreme arctic environment requires unique cold-regions engineering and infrastructure solutions thataccount for severe climate conditions, the presence ofpermafrost, and various cryogenic processes that mayhave destructive effects on structures. Since infrastruc-ture is designed to withstand variations in environmen-tal parameters within a prescribed range, informationabout past changes in arctic climate and environmentalconditions is crucial for developing optimum engineer-ing solutions for future infrastructure and safe manage-ment of existing structures.
16.2.2.1. Observed changes in permafrost
Changes in permafrost temperature due to increasing airtemperatures were observed in Russia as early as 1970.Pavlov (1997) presented data indicating that the meanannual permafrost temperature increased by 2.0 to 2.5ºC at a depth of 3 m and by 1.0 ºC at a depth of 10 mbetween 1979 and 1995. Observations of soil tempera-ture changes at the Marre-Sale geocryological station inthe southwestern region of the Yamal Peninsula (Table16.1) are especially illustrative. Similar changes havebeen observed in Alaska (Osterkamp and Romanovsky,
1999) and elsewhere (section 6.6.1.2). Changes inactive-layer thickness have also been observed.
The Global Terrestrial Network for Permafrost (GTN-P)and the Circumpolar Active Layer Monitoring (CALM)program were established to monitor such changes.The GTN-P was initiated by the International Perma-frost Association (IPA) to organize and manage a globalnetwork of permafrost observatories for detecting, mon-itoring, and projecting climate change (Burgess et al.,2000b).The network, authorized under the GlobalClimate Observing System and its associated organiza-tions, consists of two observational components: theactive layer and the thermal state of the underlyingpermafrost. CALM, established in 1990, provides theactive-layer monitoring component (Brown et al.,2000), while GTN-P provides monitoring of the thermalstate of the permafrost.The European Community proj-ect, Permafrost and Climate in Europe, contributes tothe GTN-P and monitors nine boreholes in mountainpermafrost (see also IPCC, 2001).
16.2.2.2. Observed changes in freezing andthawing indices
The strength and deformation characteristics of frozensoils are dependent on soil type, temperature, density,ice content, unfrozen water content, salinity, stressstate, and strain rate (section 16.2.2.5).Thawing offrozen soil, or even an increase in the temperature offrozen soil, may lead to deteriorating strength anddeformation characteristics, accelerated settlement,and possible foundation failure.
The design of foundations in permafrost regionsmust, therefore, always include an evaluation of themaximum active-layer thickness and permafrosttemperature that may occur in the foundation soilsduring the lifetime of the structure. The initial andlong-term bearing capacity of the foundation can thenbe determined.
Description of ground surface andsubsurface soil type
Depth(m)
Soil temperature(ºC)
Mean Increase
Slope with willow–green mosscover; sand to 0.7 m, loam
3 -5.4 2.2
6 -5.3 1.2
10 -5.2 0.8
Horizontal hilly peatland withgrass–shrub–moss–lichen cover;peat to 0.75 m, ice, sand
3 -5.6 1.1
6 -5.6 1.0
10 -5.6 0.7
Polygonal tundra with moss–lichen–grass–shrub cover; sand
3 -6.5 1.3
6 -6.5 1.1
10 -6.4 0.6
Runoff zone on gentle southernslope, cloudberry–sedge–sphagnum–hypnum bog; sand, loam
3 -3.6 0.5
6 -3.8 0.2
10 -3.9 0.1
Bottom of dried lakes,meadow bottom with sedge– hypnum bog; peat-enriched sand
3 -3.4 1.1
6 -3.8 0.7
10 -3.9 0.5
Hilly and tussocky polygonal tun-dra covered with shrub, grass, andlichen; sand
3 -4.2 1.2
6 -4.4 1.0
10 -4.4 0.7
Table 16.1. Soil temperatures measured between 1979 and1995 at the Marre-Sale station, southwestern Yamal Peninsula,Russia (Pavlov, 1997).
Table 16.2. Number of meteorological stations in each ACIAregion (Instanes and Mjureke, 2002a).
ACIA region Number ofstations
Iceland 1 1
Svalbard 1 1
Norway and Finland 1 2
Northwest Russia 1 1
Siberia 2 6
Alaska 3 5
Canada 4 3
Greenland 4 2Region 1:Arctic Europe, East Greenland, European Russian North, North AtlanticRegion 2: Central SiberiaRegion 3: Chukotka, Bering Sea,Alaska, western arctic CanadaRegion 4: Northeast Canada, Labrador Sea, Davis Strait,West Greenland

Chapter 16 • Infrastructure: Buildings, Support Systems, and Industrial Facilities 911
Instanes A. (2003) presented a review of the use of airfreezing and thawing indices for permafrost engineer-ing design.The air thawing index (ATI) is a usefulparameter to determine the “magnitude” of the thawingseason and can be used to calculate active-layer thick-ness and maximum permafrost temperatures.The airthawing index is defined as the integral of the sinu-soidal variation in mean daily or monthly air tempera-ture (T) during one year for T >0 ºC (the air freezingindex, AFI, is defined as the integral of the sinusoidalair temperature variation during one year for T <0 ºC).
Ground-surface temperatures differ from air tempera-tures. If observations of ground-surface temperaturesare not available, they can be estimated from air tem-peratures using an empirically determined n-factor.Andersland and Ladanyi (1994) listed approximaten-factors for different types of surfaces.Variations insnow cover will also affect ground temperatures.
Instanes A. and Mjureke (2002a) carried out an exten-sive analysis of historic freezing and thawing indices forarctic meteorological stations. Many of these stationshave more than 100 years of continuous temperaturerecords.The data used in this analysis were meanmonthly air temperatures from Russian datasets pro-
vided by O. Anisimov (State Hydrological Institute, St.Petersburg, Russia, 2001).
Twenty-one stations were chosen for this study, usingthe following criteria:
• the four ACIA regions (section 18.3) should berepresented;
• station time series should be of considerablelength (>30 years);
• station time series should be continuous;• priority should be given to meteorological sta-
tions located near population concentrations andmajor infrastructure; and
• stations should be evenly distributed throughoutthe Arctic.
All the stations are north of 60º N and within the areacovered by the Arctic Monitoring and AssessmentProgramme (AMAP) and the ACIA.Table 16.2 showsthe number of stations in each ACIA region.
From an engineering point of view, current and pastdesign levels of thawing and freezing indices are ofinterest mainly in comparison with values projectedfor the future. The impact of climate change on arctic
Table 16.3. Percentage of unusually warm summers and unusually warm winters between 1981 and 2000 (Instanes and Mjureke, 2002a).
Station Location Summer WinterObserved
1981–2000a
(%)
Expectedb
(%)Trendc Observed
1981–2000d
(%)
Expectedb
(%)Trendc
Akureyri Iceland 22 17 (+) 19 17 0
Ammassalik Greenland 0 19 - 7 19 -
Anadyr Russia 15 20 (-) 18 19 0
Barrow Alaska 39 24 + 46 24 +
Bethel Alaska 37 25 + 31 25 (+)
Kuglutuk (Coppermine) Canada 60 32 + 49 32 (+)
Coral Harbour Canada 29 35 (-) 37 35 0
Fairbanks Alaska 52 21 + 28 20 (+)
Fort Smith Canada 46 24 + 55 24 +
Naryan-Mar Russia 33 26 (+) 18 26 (-)
Nome Alaska 50 20 + 33 20 +
Nuuk Greenland 0 14 - 5 14 -
Salekhard Russia 35 17 + 29 16 +
Sodankylä Finland 7 21 - 15 21 (-)
Svalbard Airport Svalbard 47 25 + 26 25 0
Turukhansk Russia 20 17 0 33 17 +
Valdez Alaska 64 24 + 80 24 +
Vardø Norway 9 13 0 21 13 (+)
Verkhoyansk Russia 40 17 + 51 17 +
Vilyuysk Russia 34 19 + 41 19 +
Yakutsk Russia 22 16 (+) 50 16 +apercentage of years with an air thawing index higher than the mean for the entire period of record plus one standard deviation; bthe value from an ideal random dataseries, without trends; c + indicates warming, (+) indicates weak or possible warming, 0 indicates no trend, (-) indicates possible or weak cooling, and - indicates cooling;dpercentage of years with an air freezing index lower than the mean for the entire period of record minus one standard deviation.

912 Arctic Climate Impact Assessment
infrastructure will be very dependent on how futuretemperature levels relate to past design levels andhistoric variability at a specific site. However, ananalysis of historic records in terms of freezing andthawing indices can provide indications of temperatureincreases between 1981 and 2000 (Instanes A. andMjureke, 2002a).
Table 16.3 presents the percentage of unusually warmsummers and unusually warm winters between 1981and 2000. An unusually warm summer is defined ashaving an ATI higher than the mean value for the entirestation record plus one standard deviation; an unusual-ly warm winter is defined as having an AFI lower thanthe mean value for the entire station record minus onestandard deviation.
Five stations exhibit both significant winter air temper-ature increases after 1970 and an unusually high fre-quency of warm winter events between 1981 and2000.These stations are Fort Smith (Canada),Valdez(Alaska), and Verkhoyansk,Vilyuysk, and Yakutsk (cen-tral Russia). Four additional stations had a significantlyhigh frequency of warm winter seasons between 1981and 2000: Barrow and Nome (Alaska), and Salekhardand Turukhansk (central Russia).Two Greenland sta-tions, Ammassalik and Nuuk, show clear evidence of arecent decrease in winter air temperatures.
Eight stations show evidence of significant recentsummer air temperature increases in combinationwith a significantly high number of very warm summerseasons between 1981 and 2000 compared to theentire period of record.These are Barrow, Fairbanks,Nome, and Valdez (Alaska); Kuglutuk (Coppermine)and Fort Smith (Canada); Svalbard Airport; andVerkhoyansk (Central Russia). Bethel (Alaska) andSalekhard and Vilyuysk (central Russia) had a signifi-cantly high frequency of warm summer seasonsbetween 1981 and 2000.
The two Greenland stations and Sodankylä (Finland)show evidence of recent air temperature decreases inboth the mean ATI and the extreme summer values.
The results suggest a spatial pattern of recent climatechange and are in agreement with results from otherstudies (e.g., AMAP, 1997). According to Table 16.3,temperatures have increased in central Russia, Alaska,and western Canada, while temperatures havedecreased in southern Greenland.The trends are lessclear in the Nordic countries and northwestern Russia.
16.2.2.3. Projected changes in permafrost
A constant rate of increase in air temperature is project-ed to have two related effects on ground temperature:
• an increase in the mean annual temperature at theground surface, which will slowly propagate togreater depths and, depending on latitude, pro-duce either a thinning or a complete disappear-ance of the permafrost layer; and
• changes in the annual amplitude of seasonalground-temperature variation, damped withdepth, and affected by related changes in precipita-tion (snow cover), groundwater hydrology, andvegetation. However, Riseborough (1990) pointedout that at temperatures close to 0 ºC, latent heateffects may dominate and result in a smaller ampli-tude depending on the ice content of the soils.
Climate change is very likely to reduce the area occu-pied by frozen ground and to cause shifts between thezones of continuous, discontinuous, and sporadicpermafrost. These changes can be projected usingmathematical models of permafrost driven by scenar-ios of climate change. Projections of permafrostchange in 2030, 2050, and 2080 using output from thefive ACIA-designated climate models are presented insection 6.6.1.3.
The potential effects of increasing mean annual ground-surface temperature on permafrost will be very differ-ent for continuous and discontinuous permafrost zones.In the continuous zones, increasing air temperatures arevery likely to increase permafrost temperatures andpossibly increase the depth of the active layer (Burgess
Maximum thaw deptha (m) Increase (%)
1990–1999 2090–2099
Barrow 0.7 1 43
Bethel 1.8 13 622
Naryan-Mar 1.4 1.8 29
Nuuk 1.1 1.7 55
Svalbard Airport 0.8 1.1b 38
Turukhansk 1.3 1.6 23
Verkhoyansk 1.4 1.5 7aThaw depths calculated for a theoretical sandy soil layer. Soil profile may not berepresentative for every location; bprojection for 2040–2049.
Mean ground-surfacetemperature (ºC)
Soil strengthloss (%)
1990–1999 2090–2099
Barrow -12 -7 23
Bethel -2 0 40
Naryan-Mar -4 -3 12
Nuuk -2.5 -0.5 34
Svalbard Airport -6 -4a 17
Turukhansk -7 -5 15
Verkhoyansk -16 -12 14aProjection for 2040–2049.
Table 16.4. Comparison of maximum thaw depths simulatedfor 1990–1999 and 2090–2099 (Instanes A. and Mjureke, 2002b).
Table 16.5. Mean ground-surface temperature for 1990–1999(observed) and 2090–2099 (simulated) and the resulting loss in soilbearing strength at 10 m depth between the two periods (InstanesA. and Mjureke, 2002b; strength loss calculated after Ladanyi, 1996).

Chapter 16 • Infrastructure: Buildings, Support Systems, and Industrial Facilities 913
et al., 2000a; Esch and Osterkamp, 1990; Osterkampand Lachenbruch, 1990). In the discontinuous zone, theeffects of a few degrees increase in the mean annualpermafrost temperature are very likely to be substantial(Harris, 1986). Since the temperature of most of thispermafrost is presently within a few degrees of themelting point, the permafrost is likely to disappear.Except for the southernmost zone of sporadic perma-frost, many centuries will be required for the frozenground to disappear entirely. However, increases inactive-layer depth and thawing of the warmest perma-frost from the top have already been observed (Burgesset al., 2000a; Esch and Osterkamp, 1990; Harris, 1986;Osterkamp and Lachenbruch, 1990).
Anisimov et al. (1997) used a permafrost model andclimate scenarios for 2050 produced by general circu-lation models (GCMs) to project changes in active-layer thickness in the Arctic.The results of this studyindicated that changes in active-layer thickness willvary by region, increasing by 10 to 15% to more than50% between the mid-1990s and 2050. Instanes A. andMjureke (2002b) used the ACIA-designated models(section 4.2.7) to project changes in active-layer thick-ness and maximum permafrost temperature for sevenof the sites in Table 16.3: Barrow, Bethel, Naryan-Mar,Nuuk, Svalbard Airport,Turukhansk, and Verkhoyansk.The analysis used an identical soil profile with the samethermal properties for all the locations; therefore, itcan only be used as an indication of relative climate dif-ferences between sites.The increase in maximum thawdepths between 1990–1999 and 2090–2099 and thechanges in mean ground-surface temperature and soilbearing strength between 1990–1999 and 2090–2099are presented in Tables 16.4 and 16.5, respectively.
The response of permafrost to climate change involvesan important temperature threshold associated with
phase change beyond which future temperatureincreases will cause thawing of the frozen ground.The time required to reach this temperature thresholddepends on the initial permafrost temperature and therate of temperature increase.Table 16.6 presents pro-jected changes in various types of permafrost soils fordifferent rates of warming.
The projections discussed in this section suggest that aprogressive increase in active-layer depth and tempera-ture of the frozen ground is likely to be a relativelyshort-term reaction to climate change in permafrostregions. Changes in seasonal thaw depth are very likelyto change the water-storage capacity of near-surfacepermafrost at local and regional scales, with substantialeffects on vegetation, soil hydrology, and runoff, whichwill ultimately lead to changes in larger-scale processessuch as landslides, erosion, and sedimentation.
With respect to cold-regions engineering and infrastruc-ture in locations affected by permafrost, the temperatureof the frozen ground and the depth of seasonal thawingis of critical importance for effective construction plan-ning and the evaluation of potentially hazardous situa-tions at existing facilities. Although the effects of anincrease in mean annual air temperature on permafrostcan be projected in a general sense, it is more difficult toproject these effects for specific locations and regions.Factors such as microclimate, as well as soil type, icecontent, and salinity will play a role, and may not neces-sarily be well known or readily projected (Riseborough,1990; Smith M. and Riseborough, 1983, 1985).
16.2.2.4. Projected changes in freezing andthawing indices
Freezing and thawing indices were calculated usingmean monthly air temperatures projected for 2000 to
Table 16.6. Projected changes in permafrost soils between 2000 and 2100 for different rates of increase in mean annual air tempera-ture and different soil types (Parmuzin and Chepurnov, 2001).
Warming trend (ºC/yr) Tini (ºC)
T2100 (ºC) Year thawing begins Thaw depth in 2100 (m)
0.06 0.03 0.01 0.06 0.03 0.01 0.06 0.03 0.01
Sands, loamy sands, loams -7 to -9 -2 to -4 -5 to -7 -6 to -8 no permafrost thawing <1.5 <1.2 <0.8
Sands
-5 to -7 -1 to -2 -2 to -4 -4 to -6 2080–2090
no permafrostthawing
<6 <1.3 <0.8
Loamy sands, loams <3.5
Peat <1.5
Sands
-3 to -5 -0.5 to -1 -1 to -2 -2 to -4 2050–2070
2080–2100
littlethawing
6–13 <6 <1.2
Loamy sands, loams 3.5–8 <4
Peat 1.5–3
Sands
-1 to -3 0 to -0.5 0 to -1 -0.5 to -2 2010–2040
2030–2080
littlethawing
13–20 10–15 <1.2
Loamy sands, loams 8–15 6–8
Peat 3–5 <4
Sands
0 to -1 ~0 2000–2010
2010–2030
2060–2090
15–25 13–20 10–15
Loamy sands, loams 10–16 7–12 1.5– 4
Peat 4–6 <5 <1.5Tini: initial mean annual temperature of permafrost soils;T2100: mean annual temperature of permafrost soils projected for 2100.

914 Arctic Climate Impact Assessment
2100 by the ACIA-designated climate models for the21 stations shown in Table 16.3 (Instanes A. andMjureke, 2002b). Output from four of the five ACIA-designated models (CGCM2 – Canadian Centre forClimate Modelling and Analysis, CSM_1.4 – NationalCenter for Atmospheric Research, GFDL-R30_c –Geophysical Fluid Dynamics Laboratory, and HadCM3– Hadley Centre for Climate Prediction and Research)was used for the analysis, along with a composite four-model mean (MEAN4).
In addition, results from empirical downscaling(Hanssen-Bauer et al., 2000) using the 2 m air tempera-ture field from the ECHAM4/OPYC3 GSDIO integra-tion (see section 4.6.2) were applied to Svalbard Airport.
Figures 16.3 and 16.4 show observed and projectedfreezing and thawing indices for Kugluktuk (Copper-mine), Canada, from 1933 to 2100.The indices for1933 to 2000 were calculated from meteorologicalobservations, while the indices from 2000 to 2100 arebased on output from the ACIA-designated models.
The figures show that the projections based on outputfrom the different models “fit” the observed record to
varying degrees.This is one of the major problems withusing GCMs for impact studies. However, indices com-puted using output from the different models showgenerally similar trends.This suggests that the rawmodel output can probably be adjusted so that comput-ed indices start where the observations leave off, pro-viding better projections of future trends in freezingand thawing indices.
Plots similar to Figs. 16.3 and 16.4 showing observedand projected freezing and thawing indices for the 21stations in Table 16.3 are reported by Instanes A. andMjureke (2002b).
16.2.2.5. Engineering concerns
The physical and mechanical properties of frozen soilsare generally temperature-dependent, and these depend-encies are most pronounced at temperatures within 1 to2 ºC of the melting point. Esch and Osterkamp (1990)summarize most of the engineering concerns related topermafrost warming as follows.
• Warming of permafrost body at depth.a. Increase in creep rate of existing piles and
footings.b. Increased creep of embankment founda-
tions.c. Eventual loss of adfreeze bond support for
pilings.• Increases in seasonal thaw depth (active layer).
a.Thaw settlement during seasonal thawing.b. Increased frost-heave forces on pilings.c. Increased total and differential frost heave
during winter.• Development of residual thaw zones (taliks).
a. Decrease in effective length of piling locat-ed in permafrost.
b. Progressive landslide movements.c. Progressive surface settlements.
Frozen-ground behavior
A constant rate of surface temperature increase due toprojected climate change is very likely to lead to anincrease in active-layer thickness.Woo et al. (1992),Kane et al. (1991), and Nakayama et al. (1993)attempted to simulate numerically the increase inactive-layer thickness projected to result from climatechange. Comparable simulations have been performedfor three locations in the Mackenzie Basin, Canada(Burgess et al., 2000a).
In contrast to frozen rocks and dense gravels, whosestrength depends mainly on mineral bonds and internalfriction, the bulk of the mechanical strength of fine-grained frozen soils is due to ice bonding. Rising surfacetemperatures are likely to increase the unfrozen watercontent of fine-grained soils and decrease the ice bond-ing (cohesion) of soil particles, resulting in a gradualloss of strength in these soils.
Fig. 16.4. Observed and projected thawing indices for Kugluktuk(Coppermine), Canada (Instanes A. and Mjureke, 2002b).
Fig. 16.3. Observed and projected freezing indices for Kugluktuk(Coppermine), Canada (Instanes A. and Mjureke, 2002b).

Chapter 16 • Infrastructure: Buildings, Support Systems, and Industrial Facilities 915
Soil and rocks can be classified by their sensitivity toclimate change, similar to the classification normallyused in permafrost engineering. In order of increasingsensitivity (defined by the potential impacts of climatechange on strength and thaw settlement), geologicalmaterials are classified as follows.
1. Rocks• dense, with ice only in pores; and• shattered, with ice filling cracks and fissures
(an existing rock mass classification systemcan be used for evaluating the degree offragmentation and fissures).
2. Gravels and sands (according to their density andmoisture content).
3. Silts (according to their density and moisturecontent).
4. Clays (according to their density and moisturecontent).
5. Organic soils and peat.6. Ground ice.
Andersland and Ladanyi (1994) provided a moredetailed classification of frozen soils.
Frozen soil will settle to a certain extent when com-pletely thawed. For a given soil type, the amount ofthaw settlement can be related to the increase inactive-layer thickness, the soil bulk or dry density, andits ice saturation or total water content. Several corre-lations between the unit thaw settlement and the physi-cal properties of frozen soils have been published (Haasand Barker, 1989; Johnson et al., 1984; Johnston,1981; Ladanyi, 1994; McRoberts et al., 1978; Nixon,1990a; Speer et al., 1973). One such correlationrelates the percentage of thaw settlement to the frozenbulk density and is the preferred methodology forengineering purposes (first published by Speer et al.,1973, and completed by Johnston, 1981). In the last
20 years, several such correlations between thaw set-tlement and frozen bulk density for a wide range offrozen soils have been published (Haas and Barker,1989; Leroueil et al., 1990; Nelson R. et al., 1983),and some have also been expressed by empirical equa-tions. “Thaw sensitivity maps” for specific permafrostregions can be created using information from climatemodels, surficial geology maps, organic soil maps,ground temperature data, and the above-mentionedcorrelations. Smith S. et al. (2001), Smith S. andBurgess (1998, 1999, 2004) and Nelson F. et al. (2002)have constructed such maps for Canada and thecircumpolar Arctic.
The strength of frozen soil depends not only on tem-perature, but also on soil density, ice content, andsalinity. It is also affected by the degree of confinementand the applied strain rate.
The sensitivity of frozen-soil strength to a temperatureincrease can be expressed by the ratio:
∆qfi
ST = qfi Eqn. 16.1
where qfi is the strength at temperature θi=-Ti, and
∆qfi is its variation due to a temperature increase ∆Ti
(see Fig. 16.5).The strength sensitivity index can alsobe expressed in terms of frozen soil creep parameters(Ladanyi, 1995, 1996, 1998).
The strength sensitivity index, ST, defined in equation16.1, may be a useful measure for evaluating the lossof strength in frozen soils in regions where climatechange is not projected to cause complete permafrostthawing.The index requires information about thetemperature sensitivities of strength and creep intypical arctic soils. Although some information alreadyexists, further laboratory and field tests of permafrostsoils are required. By combining information aboutpermafrost occurrence, soil types and characteristics,and projected climate change, it may be possible toconstruct maps of projected effects on permafrost.Such maps would show not only the projected trendsin active-layer depth and permafrost thawing, but alsothe projected reduction in permafrost strength.Permafrost sensitivity maps of this kind would beuseful for projecting the effects of climate change onexisting facilities in the Arctic, and for establishingguidelines for the design of new facilities.Vyalov et al.(1988) proposed the delineation of permafrost sensitiv-ity zones in the Arctic, based on the mean annualground temperature of permafrost (often measured atthe level of negligible annual temperature amplitude,10 to 20 m below the surface).
Frost heave is the result of ice lenses developing assoils freeze. Temperatures below 0 ºC and frost-susceptible soils are required for frost heave to occur,while the availability of water and the freezing ratedetermine the degree of frost heave. The first two
Fig. 16.5. Variation in frozen-soil strength with temperature(Ladanyi, 1996).

916 Arctic Climate Impact Assessment
conditions generally do not differ much betweenpermafrost and seasonal freezing regions. However,the availability of groundwater for ice accumulation inthe active layer is different in the two regions. Theactive layer is generally thinner in permafrost regions,thus the freezing rate is rapid and there is less timeavailable for ice lens growth. In addition, the presenceof nearly impermeable permafrost below the activelayer may limit the water available for lens formationin permafrost areas, so that for comparable soil condi-tions there is less frost heave in permafrost regionsthan in regions of seasonal freezing. An increase in themean annual air temperature is very likely to increasethe thickness of the layer subjected to freeze-thawcycles and subsequent frost heave.
Thaw settlement and pile creep
An increase in the mean annual air temperature inpermafrost regions is very likely to lead to an increasein the thickness of the active layer, resulting inincreased thaw settlement during seasonal thawing;and is very likely to lead to a decrease in frozen-ground creep strength (long-term strength of frozensoil), resulting in an increase in the creep settlementrate of existing piles and footings.
Numerical simulations that assume a specific rate ofwarming have been used to project the degree of set-tlement effects on existing and future structures in theArctic. Nixon (1990a,b, 1994) used a one-dimensionalgeothermal model and assumed a mean surface tem-perature increase of 0.1 ºC/yr for 25 years to examinethe effects on thaw depth and pile creep settlement.The simulation of thaw depth below insulated surfacesin discontinuous permafrost projects a doubling ofthaw depth after 25 years compared to a case with notemperature increase.
Thawing of permafrost soils can result in subsidence ofthe surface, thermokarst, and activation of freeze–thawrelated processes such as solifluction. Parmuzin andChepurnov (2001) projected soil subsidence in sandyloam soils by 2100 given different rates of warmingand different soil ice content (Table 16.7). Other stud-ies have projected the thaw settlement potential forMackenzie Basin soils (Aylsworth et al., 2000; Burgesset al., 2000a; Burgess and Smith, 2003).
Such projections of the possible consequences ofclimate change may help inform the design of futurefacilities in permafrost regions.
16.2.2.6. Areas south of the permafrost border
In the Arctic and subarctic, there are large land areassouth of the permafrost border that experience frostaction during winter. Annual freezing of the top soillayer commonly causes frost heave of foundations andstructures. Highway structures and embankmentslocated above the frost-heave zone usually experienceincreased surface roughness and bumps (Anderslandand Ladanyi, 1994). During the spring thaw, the bear-ing capacity of the structure may be considerablyreduced, causing breakup of the pavement structureand failure of the embankment. It is possible that pro-jected climate change will reduce the problems associ-ated with winter frost action in these areas.
16.2.2.7. Summary
It is possible that projected climate change will be afactor in engineering projects if its effects go beyondthose anticipated within the existing conservativedesign approach.Therefore, engineering design shouldtake into account projected climate change where
Initial (2000) permafrostsoil temperature (ºC)
Volumetric ice content of soil (%)
Air temperature increase (ºC/yr)0.06 0.03 0.01
Subsidence by 2100 (m)
-7 to -9 >40 no subsidence no subsidence no subsidence
-5 to -7
>40 <1.5
no subsidence no subsidence20–40 0.4–0.7
<20 <0.5
-3 to -5
>40 1.5–3.5 0.5–1.0
no subsidence20–40 0.7–1.5 <0.5
<20 <0.7 <0.1
-1 to -3
>40 3.5–6.0 1.0–1.5
no subsidence20–40 1.5–3.5 0.5–1.0
<20 <1.5 <0.5
0 to -1
>40 5.5–6.5 3.5–5.0 <0.5
20–40 3.5–5.5 1.5–3.5 <0.3
<20 <3.5 <0.5 <0.1
Table 16.7. Projected soil subsidence between 2000 and 2100 due to the thawing of frozen deposits in sandy loam soils (Parmuzinand Chepurnov, 2001).

Chapter 16 • Infrastructure: Buildings, Support Systems, and Industrial Facilities 917
appropriate and where the potential effects representan important component of the geothermal design.
The sensitivity of permafrost soil strength to projectedclimate change can be mapped using a simple strengthsensitivity index, such as the one proposed in this sec-tion. A risk-based procedure for analyzing structuresbased on their sensitivity to the potential consequencesof climate change is a reasonable approach to incorpo-rating climate change concerns into the design process(section 16.4.1).The project-screening tool developedand currently in use in Canada is a very good guidelinefor such an approach (Bush et al., 1998).
16.2.3. Natural hazards
In some regions of the Arctic, climate change is project-ed to lead to increasing temperature and precipitation(sections 4.4.2, 4.4.3, and 6.2.3) and increasing stormfrequency (Hanssen-Bauer and Forland, 1998).The typeof precipitation is very likely to change as the tempera-ture increases.Where the average winter temperature isclose to 0 ºC, a higher frequency of precipitation fallingas rain instead of snow is expected. Runoff from thearctic river basins is likely to increase due to greatersnow depth resulting from increased winter precipita-tion and to increased thawing of permafrost resultingfrom surface warming in summer. Greater winter snowdepth coupled with rapid melting caused by higherspring temperatures is likely to increase the possibilityof floods in the arctic river basins and increase erosionin thawing permafrost riverbanks.Thawing permafrostand increasing depth of the thawed layer are likely tomake slopes vulnerable to slides caused by erosion,increasing pore water pressure, and earthquakes.
Floods and slides in soil, rock, and snow are directly orindirectly connected to weather phenomena. Slides insoil and rock can also be triggered by earthquakes.Most structures in the Arctic are located and designedbased on historic observations of extreme weatherevents to meet defined criteria for acceptable risk.Climate change is very likely to change the probabilityof natural hazard occurrences.This implies that criteriafor the location and design of infrastructure must berevised to keep risks at defined levels.
16.2.3.1. Infrastructure and natural hazards
Settlements are often located in areas of low hazardrisk to avoid floods, mudflows, slides, and avalanches.River embankments are designed to control riversduring extreme flood events. The location and designof communities and structures are determined basedon the risk of hazard occurrence (e.g., permanent set-tlements in Norway are only permitted in areas wherethe annual probability of natural hazards is less than1 x 10-3). Highways and railways crossing steep terrainare located where the risk of closure and accidentsdue to natural hazards is acceptable, or can be mitigat-ed by protection facilities (e.g., snow sheds).
Houses, highways, roads, railways, transmission lines,and other infrastructure are sometimes located in areasexposed to snow accumulation and drifting. Highwaysand railways may be subjected to traffic restrictions orclosure by high wind velocities and related snow drift-ing.To avoid dangerous snow accumulation, regulationsin some areas dictate that houses and transmission linesare located in terrain where snow depths are accept-able or appropriate protection has been installed.At present, regulations governing the design of thesefacilities are based on acceptable risks of extreme snowdepth, ice loads, wind forces, and storm frequencies.
16.2.3.2. Factors affecting slope stability andfailure
Acceptable risk is directly related to the probability ofslides and avalanches. Factors important to slope stabil-ity include the groundwater regime, and erosioncaused by surface water flow, freeze–thaw processes,and human activity.The groundwater regime is affectedby precipitation and meltwater infiltration. For a spe-cific slope, the probability of slides can often be relatedto threshold values for water infiltration caused by theintensity and duration of rain and snowmelt.
Snow accumulation in avalanche release areas in moun-tainous regions of the Arctic (Scandinavia, Iceland,Russia, and North America) is dependent on windvelocity and duration in addition to the intensity ofsnowfall. Avalanche probability depends primarily onthe rate of snow accumulation in the release area.Theprobability of slush avalanches (where water-saturatedsnow releases as a slide) is related to the porosity andpermeability of the snow, which play a key role in snowstability. Slush avalanches release when the rate of waterinfiltration by rain and snowmelt reaches a thresholdvalue for the specific type of snow on the slope.
Thawing of permafrost caused by climate change willpossibly also influence the stability of a particular site.As shown in section 16.2.2.5, the strength of frozensoil drops rapidly as the temperature rises above 0 ºC.The development of a weak saturated layer betweenfrozen and unfrozen material can trigger landslides;slopes along arctic rivers are particularly sensitive tofailure due to erosion of the toe of the slope (Dyke etal., 1997; Dyke, 2000). Such landslides are known asactive-layer detachment slides or skin flows, which canalso be triggered by forest fires that burn away the insu-lating organic layer, leading to increased absorption ofsolar radiation and more rapid thaw of the active layer.
Reservoirs are used to control flooding in some water-sheds, but most arctic watersheds are unregulated.Flood intensity is dependent on precipitation andsnowmelt rates and is tempered by the ability of thesoil ability to absorb water.
Mudflows and debris flows are triggered as a conse-quence of a rapid increase in pore water pressure

918 Arctic Climate Impact Assessment
together with runoff-induced erosion (Sandersen et al.,1996).They occur during periods of intense rainstormsor as a consequence of rapid melting of snow and ice.Severe mudflows can also occur as a result of rapiddrainage of glacier-dammed lakes due to glacial melt-ing; examples of this phenomenon include the catastro-phes in the Sima Valley (Norway) in 1893 and 1937,and in the city of Tyrnyauz (Caucasus) in 1977 and1992 (Seinova, 1991; Seinova and Dandara, 1992).
16.2.3.3. Potential impacts of climate changeon avalanche and slide activity
The ACIA-designated climate models forced with theB2 emissions scenario project that mean annual arctictemperatures (60º–90º N) will increase 1.2 ºC by2011–2030, 2.5 ºC by 2041–2060, and 3.7 ºC by2071–2090 compared to the 1981–2000 baseline(5-model average, see section 4.4.2).The increase isprojected to have an uneven spatial distribution, withthe greatest increase in the Russian and CanadianArctic, and the smallest increase in areas close to theAtlantic and Pacific coasts (IPCC, 2001).The changesare also projected to vary seasonally, with the greatesttemperature increases occurring in winter.
The Norwegian Meteorological Institute projects thattemperatures in Norway will increase by 0.2 to 0.7 ºCbetween 2000 and 2010.The greatest increase is pro-jected to occur in part of the Norwegian Arctic inwinter (Haugen and Debenard, 2002). Regional down-scaling of temperature projections for other regions ofthe Arctic has not been performed, but would be usefulfor assessing the potential impacts of climate change onnatural hazards.
As a consequence of rising temperatures, the ACIA-designated models project average increases in precipi-tation of 4.3% by 2011–2030, 7.9% by 2041–2060,and 12.3% by 2071–2090 compared to the 1981–2000baseline (section 4.4.3). Precipitation increases areprojected to be greatest in winter, and smallest in sum-mer (when a decrease is projected for some Russianwatersheds).
Changes in the extent of snow cover in the Arctic arevery likely to be influenced by both temperature andprecipitation. Increasing temperature in a region isvery likely to lead to earlier spring snowmelt andreduced snow cover extent at the end of the winter.Conversely, increasing precipitation is very likely tolead to greater snow depth in winter, especially in thecoldest parts of the region.The ACIA-designated mod-els project decreases in arctic snow-cover extent of3–7%, 5–13%, and 9–18% by 2011–2030, 2041–2060, and 2071–2090, respectively, compared to the1981–2000 baseline (section 6.4.3).The decrease insnow extent between the baseline (1981–2000) and2071–2090 is projected to be greatest in spring (4.9 x10⁶ km2) and winter (3.8 x 10⁶ km2), and lowest insummer (1.1 x 10⁶ km2) and autumn (3.3 x 10⁶ km2).
Storms also affect avalanche and slide activity, and areprojected to increase in frequency (5 to 10%) andamplitude over the 21st century (IPCC, 2001; seeFig. 16.6). For the west coast of Norway, the Norwe-gian Meteorological Institute projects a higher frequen-cy of storms and greater amplitudes of storm activityover the next 50 years, combined with a 20% precipi-tation increase and a temperature increase of 2 to 3 ºC,with the greatest change occurring in winter (Hackett,2001; Haugen et al., 1999).
Avalanche activity depends on the rate of snow accu-mulation, which is dependent on temperature (<0 ºC),precipitation rate, and storm frequency. A change inany of these factors is very likely to have an impact onavalanche activity. Increasing snow precipitation is like-ly to occur in areas with continental climates and high-altitude coastal regions, leading to an increase in ava-lanche activity. For example, an increase in precipita-tion rates and storm magnitude is likely to increasesnow accumulation intensity in high-altitude avalancherelease areas. Because avalanche run-out distance isrelated to the volume of snow released, it is possiblethat greater snow accumulation will cause longer run-outs than have historically occurred, resulting inincreased risk to settlements and infrastructure.
As snow accumulation primarily occurs at tempera-tures below 0 ºC, snow-cover extent and depth willdepend on the duration of the frost period and the pre-cipitation environment in any given area. In regions ofthe Arctic with long cold periods and low precipita-tion, changes in temperature and precipitation willhave a negligible influence on avalanche activity. Con-versely, in regions where winter temperatures arepresently close to 0 ºC and precipitation rates are high,the snow environment has a high sensitivity to changesin climate. For example, Naryan-Mar in northwestRussia (67.6º N, 53º E) has a typical arctic continentalclimate, with an average January temperature of-18.9 ºC and a snow cover less sensitive to tempera-ture change than Vardø in Norway (70.37º N, 31.1º E),which has a typical maritime climate and an averageJanuary temperature of -5.1 ºC.
Fig. 16.6. Storm track activity (geopotential meters – gpm) overnorthwest Europe projected by the ECHAM4/OPYC greenhouse-gas scenario (4-yr running mean).The non-linear climate trendobtained from quadratic curve fitting is marked by the smoothcurve (Ulbrich and Christoph, 1999, cited in IPCC, 2001).

Chapter 16 • Infrastructure: Buildings, Support Systems, and Industrial Facilities 919
In the continental Russian, Canadian, and Alaskanregions of the Arctic, the winter is long and cold, withfew periods of temperature above 0 ºC.The coastalareas of Scandinavia and Iceland and the west coast ofNorth America have shorter and warmer winters witha higher frequency of temperature fluctuations around0 ºC. A winter temperature change of a few degrees incold continental regions of the Arctic is very likely toaffect the duration of the winter, but not very likely toaffect the snow environment.
As temperature is dependent on altitude, mountainareas with relatively low average temperatures are verylikely to be less affected by temperature change thanlower-elevation coastal areas. At low altitudes in awarmer maritime climate such as that of Scandinavia,the frequency of precipitation falling as rain is verylikely to increase in the future.The frequency of snowavalanches with release areas at low altitudes (below500 to 1000 m) is likely to be reduced due to thischange in precipitation type. Increases in the frequencyof rainstorms and intensity of storm precipitation arelikely to lead to an increasing frequency of mudflows,as well as an increasing frequency of slush flows wherethe rate of thaw together with intense rain precipita-tion is the triggering mechanism (Hestnes, 1994).A higher frequency of winter rain events is very likelyto increase the number of wet snow and slush ava-lanches. However, the duration of slush flow activity inthe Arctic is projected to be shorter (Sidorova et al.,2001).The frequency of mudflows and debris flows isprojected to increase, as the summer season is project-ed to be longer, with greater amounts of precipitationand a higher frequency of extreme events such as rain-storms and storm-induced flooding (Glazovskaya andSeliverstov, 1998). For Iceland, storm frequency andprecipitation falling as rain are projected to increasealong the east coast and decrease along the west coast,owing to a reduction in the ice sheet along theGreenland coast (Olafsson, pers. comm., University ofIceland, Reykjavik, 2003).
In maritime climates, the frequency of avalanches withlong run-out distances is likely to decrease, owing to aprojected change in snow type (from dry-snow to wet-snow and slush avalanches).This is very likely to have apositive effect on transportation routes in some areas.As the frequency of dry-snow avalanches with longrun-out distances decreases, the exposure of highwaysand buildings to avalanches will be reduced.
Increased precipitation is projected to influencegroundwater flow. Higher temperatures will probablyalso increase the thaw rate in spring and summer,increasing groundwater flow and flood potential.In low-altitude areas where snow is presently the pre-dominant form of winter precipitation, an increase inwinter rain events is likely to lead to a higher probabil-ity of slides in rock and soils (Fig. 16.7). Slopes thatare stable under the current precipitation regime arelikely to gradually become unstable if the frequencyand magnitude of rainstorms increase (Sandersen etal., 1996), leading to a potential increase in rock andsoil slide activity until a new equilibrium is established.
A change in the groundwater regime is also likely toaffect the pore water pressure in quick clays (materialsthat can change rapidly from solid to liquid state) thatare typical of some fjord districts in the Scandinavianand Canadian Arctic (Bjerrum, 1955; Janbu, 1996;Larsen et al., 1999), and may cause instability of thesematerials. Quick-clay slides (Fig. 16.8) have causedserious disasters with loss of lives and properties.Together with increased floods and erosion by rivers,higher amounts of groundwater are very likely toincrease the risk of quick-clay slides in the future.
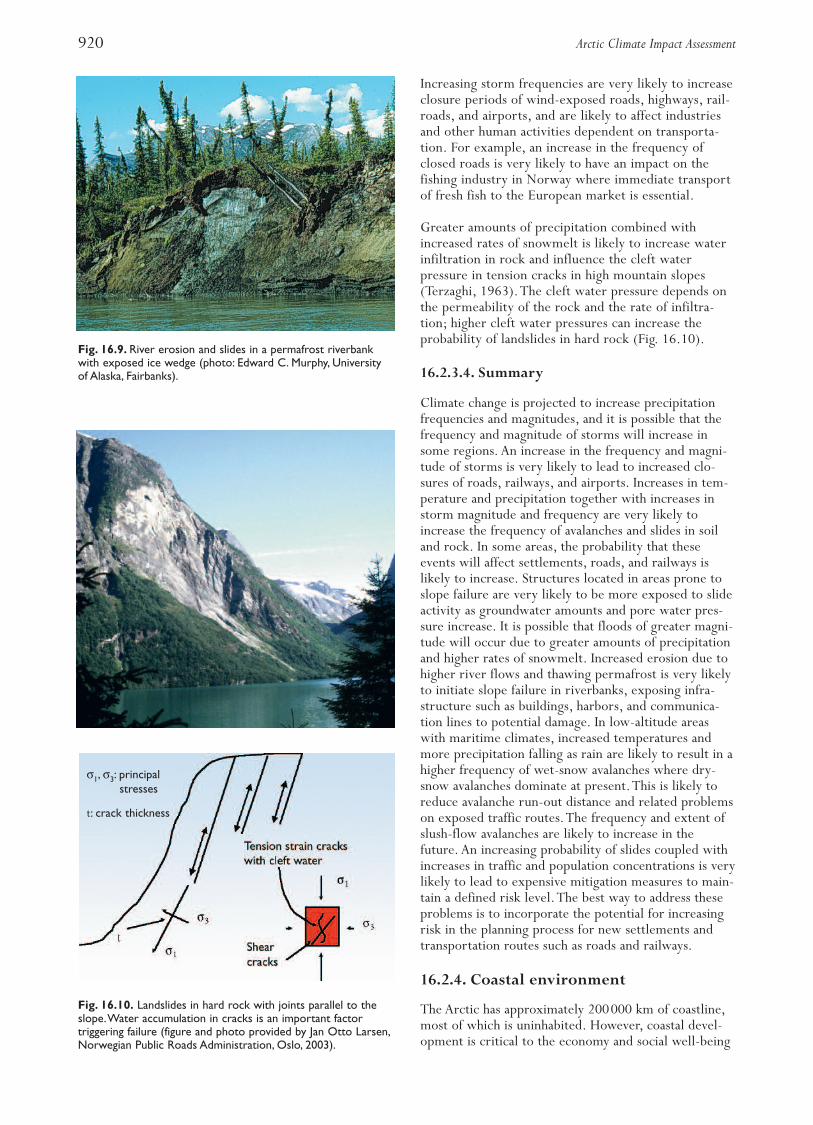
As shown in sections 6.6.1.2 and 6.8.2, observed airtemperature changes in the Arctic have increased thethaw depth in permafrost areas and increased the dis-charge of water to the Arctic Ocean from Eurasia(Shiklomanov, et al., 2002).These changes are causingnumerous slides in permafrost riverbanks (Fig. 16.9).
Fig. 16.7. Debris slide in a saturated moraine during springthaw, Lofoten, northern Norway, 1998 (photo: Jan Otto Larsen,Norwegian Public Roads Administration, Oslo).
Fig. 16.8. Slide in a quick-clay deposit,Verdalen, Norway (photo:Jan Otto Larsen, Norwegian Public Roads Administration, Oslo).
920 Arctic Climate Impact Assessment
Increasing storm frequencies are very likely to increaseclosure periods of wind-exposed roads, highways, rail-roads, and airports, and are likely to affect industriesand other human activities dependent on transporta-tion. For example, an increase in the frequency ofclosed roads is very likely to have an impact on thefishing industry in Norway where immediate transportof fresh fish to the European market is essential.
Greater amounts of precipitation combined withincreased rates of snowmelt is likely to increase waterinfiltration in rock and influence the cleft waterpressure in tension cracks in high mountain slopes(Terzaghi, 1963).The cleft water pressure depends onthe permeability of the rock and the rate of infiltra-tion; higher cleft water pressures can increase theprobability of landslides in hard rock (Fig. 16.10).
16.2.3.4. Summary
Climate change is projected to increase precipitationfrequencies and magnitudes, and it is possible that thefrequency and magnitude of storms will increase insome regions. An increase in the frequency and magni-tude of storms is very likely to lead to increased clo-sures of roads, railways, and airports. Increases in tem-perature and precipitation together with increases instorm magnitude and frequency are very likely toincrease the frequency of avalanches and slides in soiland rock. In some areas, the probability that theseevents will affect settlements, roads, and railways islikely to increase. Structures located in areas prone toslope failure are very likely to be more exposed to slideactivity as groundwater amounts and pore water pres-sure increase. It is possible that floods of greater magni-tude will occur due to greater amounts of precipitationand higher rates of snowmelt. Increased erosion due tohigher river flows and thawing permafrost is very likelyto initiate slope failure in riverbanks, exposing infra-structure such as buildings, harbors, and communica-tion lines to potential damage. In low-altitude areaswith maritime climates, increased temperatures andmore precipitation falling as rain are likely to result in ahigher frequency of wet-snow avalanches where dry-snow avalanches dominate at present.This is likely toreduce avalanche run-out distance and related problemson exposed traffic routes.The frequency and extent ofslush-flow avalanches are likely to increase in thefuture. An increasing probability of slides coupled withincreases in traffic and population concentrations is verylikely to lead to expensive mitigation measures to main-tain a defined risk level.The best way to address theseproblems is to incorporate the potential for increasingrisk in the planning process for new settlements andtransportation routes such as roads and railways.
16.2.4. Coastal environment
The Arctic has approximately 200000 km of coastline,most of which is uninhabited. However, coastal devel-opment is critical to the economy and social well-being
Fig. 16.9. River erosion and slides in a permafrost riverbankwith exposed ice wedge (photo: Edward C. Murphy, Universityof Alaska, Fairbanks).
Fig. 16.10. Landslides in hard rock with joints parallel to theslope.Water accumulation in cracks is an important factor triggering failure (figure and photo provided by Jan Otto Larsen,Norwegian Public Roads Administration, Oslo, 2003).
σ1, σ3: principal stresses
t: crack thickness

Chapter 16 • Infrastructure: Buildings, Support Systems, and Industrial Facilities 921
of nearly all arctic residents (see also Chapters 3, 12,and 15). Natural-resource development is concentratedalong the coast, and the development of resources inthese remote areas is constrained because of challengingtransportation routes (Smith O. and Levasseur, 2002).
Arctic coastal dynamics are often affected directly orindirectly by the presence of permafrost. Permafrostcoasts are especially vulnerable to erosive processes asice beneath the seabed and shoreline melts from con-tact with warmer air and water.Thaw subsidence at theshore allows additional wave energy to reach unconsol-idated erodible materials. Low-lying, ice-rich arcticpermafrost coasts are the most vulnerable to thaw sub-sidence and subsequent wave-induced erosion.
The southern half of Alaska has coastal characteristicsdominated by erodible glacial deposits and high tides.Cook Inlet, in south-central Alaska, has a 10 m tidalrange at its northern extreme and an eroding shorelineof glacially deposited bluffs, as illustrated in Fig. 16.11(Smith O. and Levasseur, 2002). Freezing of brackishwater and ice deposition on broad tidal flats createhuge blocks of “beach ice” (Fig. 16.12) that, when setafloat by higher tides, can carry coarse sediments fordistances of over a hundred kilometers. Of all CookInlet sea ice, these sediment-laden ice blocks present
the greatest danger to ships in winter.The complexdynamics of bluff erosion and ice-borne sedimenttransport will become even more difficult to forecastwith sea-level rise and a more erratic storm climate.
16.2.4.1. Observed changes in the coastalenvironment
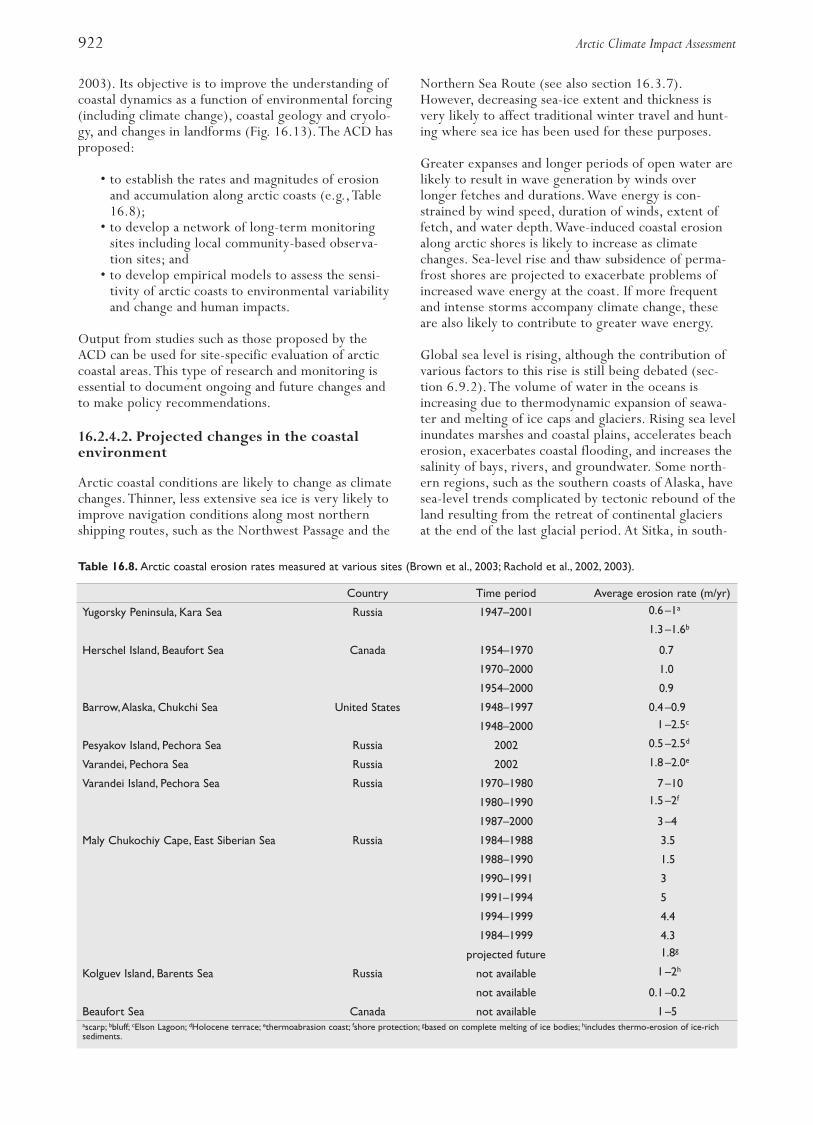
Coastal erosion rates vary considerably across theArctic. As indicated in Fig. 16.13, erosion rates aredependent on environmental forcing, sedimentology,geocryology, geochemistry, and anthropogenic distur-bance of the coastline. In fine-grained icy silty–clayeysediments, average erosion rates are typically 1 to3 m/yr, while in silty–sandy sediments with high icecontent that are directly exposed to waves and stormsurges, erosion rates can be as high as 10 to 15 m/yrunder extreme weather conditions. Frozen rock andsediments with low ice content may have erosion ratesas low as 0.1 m/yr. Anthropogenic disturbance of thecoastline can increase erosion rates, but there are alsoexamples from Varandei in the Pechora Sea indicatingthat shore protection techniques can slow erosionrates.Table 16.8 presents examples of erosion ratesalong the arctic coast.
Erosion rates have increased along the arctic coast overthe past 30 years. Coastal residents are concernedabout the observed changes and the future of arcticcoastal communities. However, arctic coastal surveydata are often inadequate to reliably quantify accelerat-ing shoreline retreat. Baseline surveys using satelliteimagery will help the assessment of erosion rates andsystematic planning of future responses significantly.Understanding of circumpolar coastal dynamics is alsoinadequate. Improved understanding of the physicalprocesses involved in arctic coastal erosion willimprove techniques for shore protection and other mit-igation measures that may be necessary in the future.
The Arctic Coastal Dynamics project (ACD) is a recentinternational initiative, sponsored by the InternationalArctic Sciences Committee and the IPA, to addresscoastal change in the Arctic (Rachold et al., 2002,
Fig. 16.11. Processes affecting bluff erosion in Cook Inlet, south-central Alaska (redrawn from Smith O. and Levasseur, 2002).
Fig. 16.12. Beach ice in macro-tidal zones of Alaska (photo pro-vided by Orson Smith, University of Alaska,Anchorage).
Fig. 16.13. Processes affecting coastal erosion in the Arctic(redrawn from Rachold et al., 2002).
922 Arctic Climate Impact Assessment
2003). Its objective is to improve the understanding ofcoastal dynamics as a function of environmental forcing(including climate change), coastal geology and cryolo-gy, and changes in landforms (Fig. 16.13).The ACD hasproposed:
• to establish the rates and magnitudes of erosionand accumulation along arctic coasts (e.g.,Table16.8);
• to develop a network of long-term monitoringsites including local community-based observa-tion sites; and
• to develop empirical models to assess the sensi-tivity of arctic coasts to environmental variabilityand change and human impacts.
Output from studies such as those proposed by theACD can be used for site-specific evaluation of arcticcoastal areas.This type of research and monitoring isessential to document ongoing and future changes andto make policy recommendations.
16.2.4.2. Projected changes in the coastalenvironment
Arctic coastal conditions are likely to change as climatechanges.Thinner, less extensive sea ice is very likely toimprove navigation conditions along most northernshipping routes, such as the Northwest Passage and the
Northern Sea Route (see also section 16.3.7).However, decreasing sea-ice extent and thickness isvery likely to affect traditional winter travel and hunt-ing where sea ice has been used for these purposes.
Greater expanses and longer periods of open water arelikely to result in wave generation by winds overlonger fetches and durations.Wave energy is con-strained by wind speed, duration of winds, extent offetch, and water depth.Wave-induced coastal erosionalong arctic shores is likely to increase as climatechanges. Sea-level rise and thaw subsidence of perma-frost shores are projected to exacerbate problems ofincreased wave energy at the coast. If more frequentand intense storms accompany climate change, theseare also likely to contribute to greater wave energy.
Global sea level is rising, although the contribution ofvarious factors to this rise is still being debated (sec-tion 6.9.2).The volume of water in the oceans isincreasing due to thermodynamic expansion of seawa-ter and melting of ice caps and glaciers. Rising sea levelinundates marshes and coastal plains, accelerates beacherosion, exacerbates coastal flooding, and increases thesalinity of bays, rivers, and groundwater. Some north-ern regions, such as the southern coasts of Alaska, havesea-level trends complicated by tectonic rebound of theland resulting from the retreat of continental glaciersat the end of the last glacial period. At Sitka, in south-
Country Time period Average erosion rate (m/yr)
Yugorsky Peninsula, Kara Sea Russia 1947–2001 0.6 –1a
1.3 –1.6b
Herschel Island, Beaufort Sea Canada 1954–1970 0.7
1970–2000 1.0
1954–2000 0.9
Barrow,Alaska, Chukchi Sea United States 1948–1997 0.4 –0.9
1948–2000 1 –2.5c
Pesyakov Island, Pechora Sea Russia 2002 0.5 –2.5d
Varandei, Pechora Sea Russia 2002 1.8 –2.0e
Varandei Island, Pechora Sea Russia 1970–1980 7 –10
1980–1990 1.5 –2f
1987–2000 3 –4
Maly Chukochiy Cape, East Siberian Sea Russia 1984–1988 3.5
1988–1990 1.5
1990–1991 3
1991–1994 5
1994–1999 4.4
1984–1999 4.3
projected future 1.8g
Kolguev Island, Barents Sea Russia not available 1 –2h
not available 0.1 –0.2
Beaufort Sea Canada not available 1 –5ascarp; bbluff; cElson Lagoon; dHolocene terrace; ethermoabrasion coast; fshore protection; gbased on complete melting of ice bodies; hincludes thermo-erosion of ice-richsediments.
Table 16.8. Arctic coastal erosion rates measured at various sites (Brown et al., 2003; Rachold et al., 2002, 2003).

Chapter 16 • Infrastructure: Buildings, Support Systems, and Industrial Facilities 923
east Alaska, the net effect is falling sea level. However,arctic coasts have a wide variation of tectonic trends.Low-lying coastal plains in the Arctic are generally nottectonically active, which is another reason why theyare vulnerable to the adverse effects of sea-level rise.Global sea-level rise will possibly allow more waveenergy to reach the coast and induce erosion as wavesbreak at the shore.
Reduced sea-ice extent and thickness are very likely toprovide opportunities for the export of naturalresources and other waterborne commerce over newnorthern shipping routes. Reduced sea ice in thecoastal regions of the Arctic Ocean is very likely toresult in longer navigation seasons along the RussianArctic coast, in the Canadian Arctic, along the easternand western coasts of Greenland, and around Alaska.Enhanced regional arctic navigation, such betweenEurope and the Kara Sea, and potential trans-arcticvoyages using icebreaking container ships and tankers,is very likely to shorten distances between markets andimprove the delivery times for valuable products.
Climate change is also likely to change the use of arcticrivers for transportation routes, water sources, andhabitat. Increased precipitation is very likely to result inhigher stream flows and more flooding. Conditions forcommercial river navigation will possibly improve thetransport of minerals and bulk exports to tidewater.Erosion of thawing permafrost banks is very likely toaccelerate, threatening the infrastructure of rural arcticriver communities. River-ice breakup is very likely tooccur earlier and ice jams and flooding risks are likelyto be more difficult to project.The projection and pre-vention of ice-jam flooding warrant further study.
Higher sea levels at the mouths of rivers and estuariesare likely to allow salt to travel further inland, chang-ing riparian habitats. Furthermore, climate change isprojected to result in more frequent and intensestorms accompanied by stronger winds.These windsare very likely to induce even higher water levels at thecoast, accompanied by higher waves. Storms are also
likely to result in more intense rainfall at the coast,increasing runoff-related erosion and the mobile sedi-ment in coastal waters.
Coastal communities are sensitive to climate change.Engineering solutions are available for shore protection(flood barriers, dikes, breakwaters, erosion control)but may not be able to reduce erosion rates sufficientlyto save specific settlements. Moreover, while these pro-tective measures may address one problem, they maycreate another by altering the dynamics of erosion anddeposition processes.
16.2.5. Arctic Ocean
16.2.5.1. Observed changes in sea-ice extent
Climatic and environmental changes in the Arctic Basininclude changes in air temperature, water temperatureand salinity, and the distribution, extent, and thicknessof sea ice.There is compelling empirical evidence ofconsistent environmental changes across the ArcticOcean, including increases in air temperature, reduc-tions in sea-ice extent, and freshening of the BeaufortSea mixed layer (Maslanik et al., 1996; McPhee et al.,1998). Data from ice-floe measurements show a slightair temperature increase with statistically significantwarming in May and June between 1961 and 1990.Air temperature anomalies in the Arctic Basin have beenstrongly positive since 1993. Between 1987 and 1997,the mean annual air temperature increased by 0.9 ºC(Aleksandrov and Maistrova, 1998), comparable to tem-perature changes observed in the terrestrial Arctic.
The area of warm Atlantic waters in the polar basinincreased by almost 500000 km2 over the past threedecades (Kotlyakov, 1997), and the inflowing fresh-water has warmed (Carmack, 2000; Carmack et al.,1995). Measurements from submarines indicate thatsurface waters in the Arctic Ocean basin warmed by0.5 to 1 ºC from the mid-1970s to the mid-1990s,with maximum warming observed in the Kara Sea(Alekseev et al., 1997).
One of the most valuable and graphic records of sea-ice extent changes in the Northern Hemisphere wasproduced by Walsh and Chapman (2001). Figure 16.14shows a 103-year record (1900–2002) of sea-iceextent. A decreasing trend in sea-ice extent, starting inthe mid-20th century, is evident for all four seasons.The greatest decreases have occurred in summer andspring: over the past 50 years, summer sea-ice extenthas decreased by nearly 3 x 10⁶ km2. Although thedecrease in sea-ice extent has been unevenly distrib-uted around the coastal margins of the Arctic Ocean,it has provided greater marine access for ships.
Satellites have recorded increasing areas of open wateralong the Russian Arctic coast and in the Beaufort Sea.Figure 16.15 is a satellite passive microwave imageshowing the extent of arctic sea ice on 22 September
Fig. 16.14. Sea-ice extent in the Northern Hemispherebetween 1900 and 2002 (Walsh and Chapman, 2001, updated).

924 Arctic Climate Impact Assessment
2002 – the date of the minimum observed extent inthe 103-year record.This image illustrates the largeareas of open water surrounding the Arctic Basin at thesummer minimum extent of sea ice. Of significance forthe Northern Sea Route, the only pack ice reaching theRussian Arctic coast is along the northern tip ofSevernaya Zemlya; the sea ice in this image has alsoretreated record distances in the Beaufort, Chukchi,and East Siberian Seas.
Sea-ice conditions in the Canadian Arctic are very com-plex. Observations of minimum sea-ice extent in the
eastern and western regions of the Canadian Arcticbetween 1969 and 2003 (Fig. 16.16) illustrate theextraordinary interannual variability of the ice condi-tions. Although the trends in sea-ice extent are nega-tive in both regions over the period shown, the year-to-year variability is extreme and sometimes differsbetween the two regions. For example, one of thelargest observed minimum extents in the westernregion (for the period shown) occurred in 1991, whilein the eastern region the minimum sea-ice extent thatyear was relatively low.While these observations indi-cate a recent overall decrease in the extent of sea ice inthe Northwest Passage, the interannual and spatial vari-ability is not conducive to planning a reliable marinetransportation system.
16.2.5.2. Projected changes in sea-ice extent
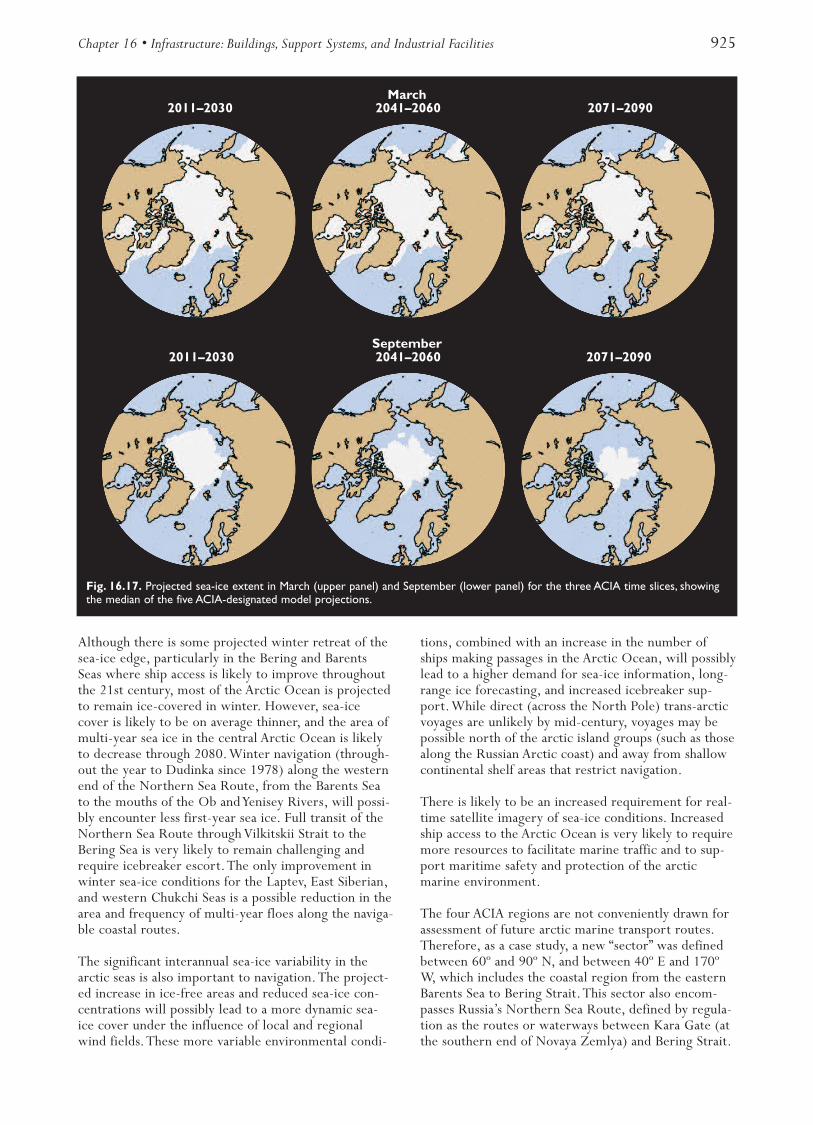
Figure 16.17 shows the median of the sea-ice extentsprojected by the five ACIA-designated climate modelsfor the three ACIA time slices. However, an importantlimitation of the ACIA-designated models is that theycannot resolve the complex geography of the CanadianArctic and thus cannot provide adequate sea-ice projec-tions for this region. In summer, the models project asubstantial retreat of sea ice throughout the entireArctic Ocean for each ACIA time slice, except for partsof the Canadian Archipelago and along the northerncoast of Greenland. By mid-century (September2041–2060), most of the alternative routes in theNorthwest Passage and Northern Sea Route are project-ed to be nearly ice-free; three of the five models projectopen water conditions across the entire lengths of both.By the end of the 21st century, vast areas of the ArcticOcean are projected to be ice-free in summer, increas-ing the possibility of shipping across the Arctic Ocean.
Fig. 16.16. Annual minimum sea-ice extent in (a) the eastern and (b) the western regions of the Canadian Arctic between 1969 and2003, from a composite of remotely sensed and ground-based measurements. Lavender lines show linear trends (redrawn from figureprovided by the Canadian Ice Service, 2004).
Fig. 16.15. Satellite image of arctic sea-ice extent on 22 September 2002 (figure provided by William Chapman,University of Illinois, 2003).
Sea-ice concentration (%)100
80
60
40
20
0
Chapter 16 • Infrastructure: Buildings, Support Systems, and Industrial Facilities 925
Although there is some projected winter retreat of thesea-ice edge, particularly in the Bering and BarentsSeas where ship access is likely to improve throughoutthe 21st century, most of the Arctic Ocean is projectedto remain ice-covered in winter. However, sea-icecover is likely to be on average thinner, and the area ofmulti-year sea ice in the central Arctic Ocean is likelyto decrease through 2080.Winter navigation (through-out the year to Dudinka since 1978) along the westernend of the Northern Sea Route, from the Barents Seato the mouths of the Ob and Yenisey Rivers, will possi-bly encounter less first-year sea ice. Full transit of theNorthern Sea Route through Vilkitskii Strait to theBering Sea is very likely to remain challenging andrequire icebreaker escort.The only improvement inwinter sea-ice conditions for the Laptev, East Siberian,and western Chukchi Seas is a possible reduction in thearea and frequency of multi-year floes along the naviga-ble coastal routes.
The significant interannual sea-ice variability in thearctic seas is also important to navigation.The project-ed increase in ice-free areas and reduced sea-ice con-centrations will possibly lead to a more dynamic sea-ice cover under the influence of local and regionalwind fields.These more variable environmental condi-
tions, combined with an increase in the number ofships making passages in the Arctic Ocean, will possiblylead to a higher demand for sea-ice information, long-range ice forecasting, and increased icebreaker sup-port.While direct (across the North Pole) trans-arcticvoyages are unlikely by mid-century, voyages may bepossible north of the arctic island groups (such as thosealong the Russian Arctic coast) and away from shallowcontinental shelf areas that restrict navigation.
There is likely to be an increased requirement for real-time satellite imagery of sea-ice conditions. Increasedship access to the Arctic Ocean is very likely to requiremore resources to facilitate marine traffic and to sup-port maritime safety and protection of the arcticmarine environment.
The four ACIA regions are not conveniently drawn forassessment of future arctic marine transport routes.Therefore, as a case study, a new “sector” was definedbetween 60º and 90º N, and between 40º E and 170ºW, which includes the coastal region from the easternBarents Sea to Bering Strait.This sector also encom-passes Russia’s Northern Sea Route, defined by regula-tion as the routes or waterways between Kara Gate (atthe southern end of Novaya Zemlya) and Bering Strait.
March2011–2030 2041–2060 2071–2090
September2011–2030 2041–2060 2071–2090
Fig. 16.17. Projected sea-ice extent in March (upper panel) and September (lower panel) for the three ACIA time slices, showingthe median of the five ACIA-designated model projections.

926 Arctic Climate Impact Assessment
As shown in Fig. 16.17, the median of the ACIA-designated model projections suggests that, in all thetime slices, most coastal waters of the Eurasian Arctic(along the Northern Sea Route) will be relatively ice-free in September. Figure 16.18 illustrates theSeptember sea-ice extents projected by each of the fivemodels for the Eurasian Arctic sector used in thisanalysis. During September, the month of minimumsea-ice extent in the Arctic Ocean, the models consis-tently project sea ice in the vicinity of SevernayaZemlya during each of the ACIA time slices. For shipsto travel north of Severnaya Zemlya, highly capable,more expensive icebreaking ships would be necessary.However, it is more likely that ships would sail throughthe deep waters of Vilkitskii Strait to the south –between the Kara and Laptev Seas north of the TaymirPeninsula – where more open water is very likely to befound. Four of the five models also project open waterto the east and north of the New Siberian Islands inSeptember. Ships sailing along the Northern Sea Routeare likely to take advantage of these ice-free conditionsto avoid the shallow, narrow passages along theEurasian coast. In addition, if there is a continuedreduction in the proportion of winter multi-year seaice in the Central Arctic Ocean (Johannessen et al.,1999), it is very likely that first-year sea ice will domi-nate the entire maritime region of the Northern SeaRoute throughout the year, with a decreasing frequen-cy of intrusions of multi-year sea ice into the coastalseas. Such changes in sea-ice conditions would have key
implications for ship construction (e.g., potentiallylower construction costs) and route selection along theNorthern Sea Route in summer and winter.
16.3. Infrastructure in the Arctic
Infrastructure is defined as facilities with permanentfoundations or the essential elements of a community.It includes schools; hospitals; various types of buildingsand structures; and facilities such as roads, railways, air-ports, pipelines, harbors, power stations, and power,water, and sewage lines. Infrastructure forms the basisfor regional and national economic growth. In theArctic, the largest population concentrations are locatedin North America and Russia (Freitag and McFadden,1997), as is much of the existing infrastructure.
Most arctic facilities are connected with populationconcentrations, extraction of natural resources, or mili-tary activity. In the case of industrial or military devel-opments, facilities typically include industrial buildingsand warehouses, crew and worker quarters, embank-ments (roadway, airport, work pad), pipelines (bothchilled and warm), and excavations of different types.Many industrial buildings must be designed to accom-modate heavy equipment, increasing demands on thefoundation system. In the case of human settlements,infrastructure includes public transportation systems,utility generation and distribution facilities, and build-ings associated with residential or business activities.In addition to the complexity presented by the widerange in requirements of the different types of infra-structure, the problems associated with climate changeare compounded by the range of environmental condi-tions over which human activities occur, extending fromthe sporadic permafrost/seasonal frost zone to the highArctic with its cold, continuous permafrost layer.
Some of the engineering projects that are likely to beaffected by climate change are as follows (see also Bushet al., 1998; Nixon, 1994).
• Northern pipelines are likely to be affected byfrost heave and thaw settlement. Slope stability isalso likely to be an issue in discontinuous perma-frost (Nixon et al., 1990).
• The settlement of shallow pile foundations inpermafrost could possibly be accelerated by tem-perature increases over the design life of a struc-ture (~20 years). However, over the same period,there is very likely to be less of an effect on thedeeper piles used for heavier structures (Nixon etal., 1990).
• Large tailings disposal facilities might be affected(negatively or positively) by climate change, dueto the long-term effects on tailings layers.Thereis some chance that layers that freeze during win-ter deposition in northern seasonal-frost orpermafrost areas would thaw out many yearslater, releasing excess water and contaminantsinto groundwater.There is some chance that
(a) 2011–2030
(b) 2041–2060
(c) 2071–2090
Fig. 16.18. September sea-ice extent in the Eurasian Arcticprojected by each of the five ACIA-designated climate models.
CGCM2 CSM_1.4 HadCM3 GFDL-R30_c ECHAM4/OPYC3
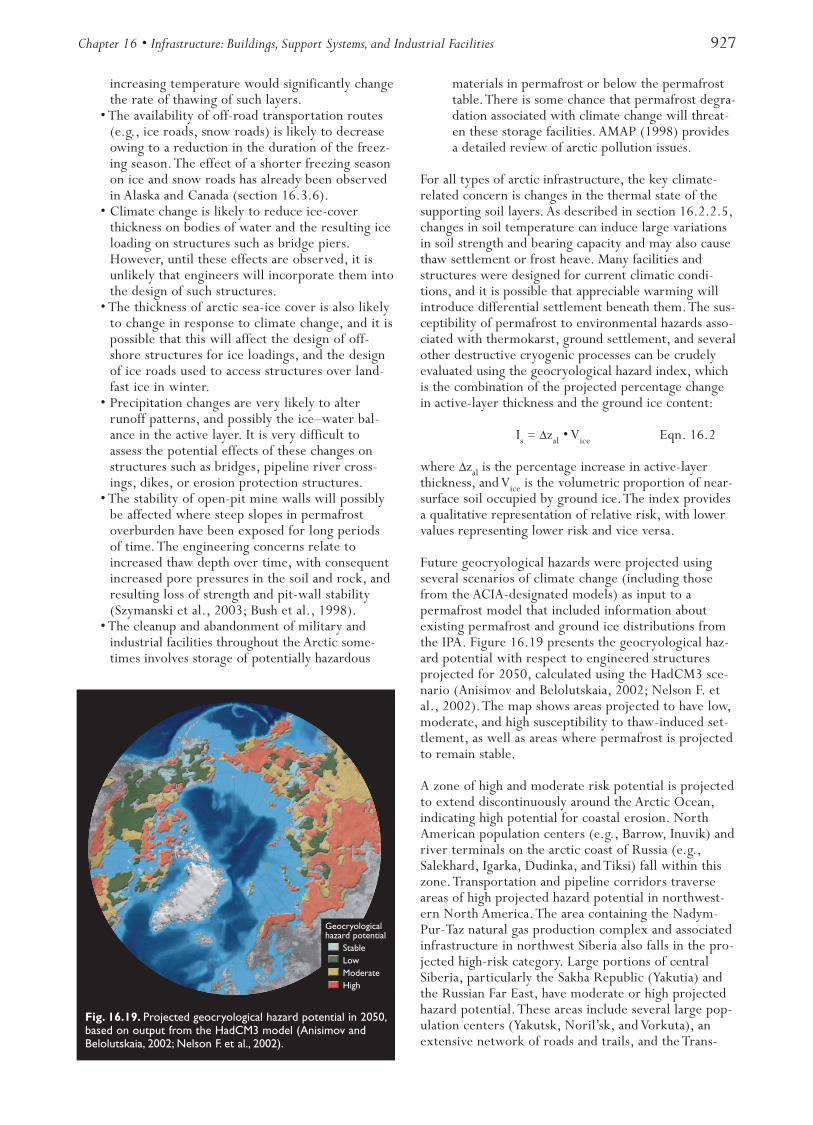
Chapter 16 • Infrastructure: Buildings, Support Systems, and Industrial Facilities 927
increasing temperature would significantly changethe rate of thawing of such layers.
• The availability of off-road transportation routes(e.g., ice roads, snow roads) is likely to decreaseowing to a reduction in the duration of the freez-ing season.The effect of a shorter freezing seasonon ice and snow roads has already been observedin Alaska and Canada (section 16.3.6).
• Climate change is likely to reduce ice-coverthickness on bodies of water and the resulting iceloading on structures such as bridge piers.However, until these effects are observed, it isunlikely that engineers will incorporate them intothe design of such structures.
• The thickness of arctic sea-ice cover is also likelyto change in response to climate change, and it ispossible that this will affect the design of off-shore structures for ice loadings, and the designof ice roads used to access structures over land-fast ice in winter.
• Precipitation changes are very likely to alterrunoff patterns, and possibly the ice–water bal-ance in the active layer. It is very difficult toassess the potential effects of these changes onstructures such as bridges, pipeline river cross-ings, dikes, or erosion protection structures.
• The stability of open-pit mine walls will possiblybe affected where steep slopes in permafrostoverburden have been exposed for long periodsof time.The engineering concerns relate toincreased thaw depth over time, with consequentincreased pore pressures in the soil and rock, andresulting loss of strength and pit-wall stability(Szymanski et al., 2003; Bush et al., 1998).
• The cleanup and abandonment of military andindustrial facilities throughout the Arctic some-times involves storage of potentially hazardous
materials in permafrost or below the permafrosttable.There is some chance that permafrost degra-dation associated with climate change will threat-en these storage facilities. AMAP (1998) providesa detailed review of arctic pollution issues.
For all types of arctic infrastructure, the key climate-related concern is changes in the thermal state of thesupporting soil layers. As described in section 16.2.2.5,changes in soil temperature can induce large variationsin soil strength and bearing capacity and may also causethaw settlement or frost heave. Many facilities andstructures were designed for current climatic condi-tions, and it is possible that appreciable warming willintroduce differential settlement beneath them.The sus-ceptibility of permafrost to environmental hazards asso-ciated with thermokarst, ground settlement, and severalother destructive cryogenic processes can be crudelyevaluated using the geocryological hazard index, whichis the combination of the projected percentage changein active-layer thickness and the ground ice content:
Is = ∆zal • Vice Eqn. 16.2
where ∆zal is the percentage increase in active-layerthickness, and Vice is the volumetric proportion of near-surface soil occupied by ground ice.The index providesa qualitative representation of relative risk, with lowervalues representing lower risk and vice versa.
Future geocryological hazards were projected usingseveral scenarios of climate change (including thosefrom the ACIA-designated models) as input to apermafrost model that included information aboutexisting permafrost and ground ice distributions fromthe IPA. Figure 16.19 presents the geocryological haz-ard potential with respect to engineered structuresprojected for 2050, calculated using the HadCM3 sce-nario (Anisimov and Belolutskaia, 2002; Nelson F. etal., 2002).The map shows areas projected to have low,moderate, and high susceptibility to thaw-induced set-tlement, as well as areas where permafrost is projectedto remain stable.
A zone of high and moderate risk potential is projectedto extend discontinuously around the Arctic Ocean,indicating high potential for coastal erosion. NorthAmerican population centers (e.g., Barrow, Inuvik) andriver terminals on the arctic coast of Russia (e.g.,Salekhard, Igarka, Dudinka, and Tiksi) fall within thiszone.Transportation and pipeline corridors traverseareas of high projected hazard potential in northwest-ern North America.The area containing the Nadym-Pur-Taz natural gas production complex and associatedinfrastructure in northwest Siberia also falls in the pro-jected high-risk category. Large portions of centralSiberia, particularly the Sakha Republic (Yakutia) andthe Russian Far East, have moderate or high projectedhazard potential.These areas include several large pop-ulation centers (Yakutsk, Noril’sk, and Vorkuta), anextensive network of roads and trails, and the Trans-
Geocryologicalhazard potential
StableLowModerateHigh
Fig. 16.19. Projected geocryological hazard potential in 2050,based on output from the HadCM3 model (Anisimov andBelolutskaia, 2002; Nelson F. et al., 2002).

928 Arctic Climate Impact Assessment
Siberian and Baikal–Amur mainline railroads.TheBilibino nuclear power station and its grid occupy anarea of projected high hazard potential in the RussianFar East. Areas of lower projected hazard potential areassociated with mountainous terrain and cratons (geo-logically stable interior portions of continents) wherebedrock is at or near the surface.
Three main design approaches are employed whenusing permafrost soils as foundations for structures andinfrastructure (Andersland and Ladanyi, 1994):
• to maintain the existing ground thermal regime(referred to as Principle I in Russia, and the pas-sive method in North America);
• to accept changes in the ground thermal regimecaused by construction and operation, or to mod-ify foundation materials prior to construction(referred to as Principle II in Russia, and theactive method in North America); and
• to use conventional foundation methods if thesoils are thaw stable.
With the first two methods, it is necessary to estimatethe maximum active-layer thickness and the maximumpermafrost temperature as a function of depth that thestructure will be subjected to in its lifetime.The airthawing index can be used to calculate active-layerthickness and maximum permafrost temperatures as afunction of depth and time of year (see section16.2.2.2). Other approaches can also be used tocalculate active-layer thickness (e.g., using a full sur-face energy balance).
A significant consequence of permafrost degradation islikely to be a change in the maintenance conditions ofmany structures, especially for those that weredesigned without consideration of potential climatechange. Projections of the change in bearing capacityand durability of foundations as temperatures changeillustrate the potential for damage as a result of climatechange.The results of such calculations for Yakutsk arepresented in Table 16.9.
For structures utilizing Principle I (permafrost conser-vation), the table illustrates that foundation failureswill possibly begin when the mean annual air tempera-ture increases by a small amount (a few tenths of a
degree), and extend to all foundations when theincrease exceeds 1.5 ºC.This indicates that there is lit-tle margin for safety in the bearing capacity related tochanges in air temperature. For structures utilizingPrinciple II (permafrost thawing), design is based onallowable deformations. As with structures utilizingPrinciple I, no factor of safety is included in the design.However, foundation failures will occur a relativelylong time after the temperature changes.This meansthat the change in temperature affects only the durabil-ity of the foundations.Table 16.9 shows that a smallincrease in air temperature substantially affects the sta-bility of the building, and the safety of the foundationdecreases sharply with rising temperatures.
Temperature increases can result in a significantdecrease in the lifetime and potential failure of thestructure (Khrustalev, 2000, 2001). Permafrost engi-neers, therefore, face the problem of preserving infra-structure under projected future climate conditions.The compensation method (putting new buildings intooperation as existing ones are damaged and abandoned)appears to be one of the possible ways to address thisproblem. However, Khrustalev (2000, 2001) states thatthis method will be inadequate, since the required rateof new construction rises exponentially from 5% perdecade in 1980–1990 to 108% per decade in 2030–2040 (assuming a linear increase in mean annual tem-perature of 0.075 ºC/yr) .
Various methods have been suggested to addresstemperature-related foundation problems.Techniquesto reduce warming and thawing, such as heat pumps,convection embankments, thermosyphons, winter-ventilated ducts, and passive cooling systems, arealready common practice in North America, Scandi-navia, and Russia (Andersland and Ladanyi, 1994;Couture et al., 2003; Goering and Kumar, 1996;Instanes, B., 2000; Khrustalev and Nikiforov, 1990;Smith S. et al., 2001).
16.3.1. Ultraviolet radiation andconstruction materials
Ultraviolet (UV) radiation adversely affects many mate-rials used in construction and other outdoor applica-tions. Exposure to UV radiation can alter the mechani-cal properties of synthetic polymers used in paint andplastics, and natural polymers present in wood.Increased exposure to UV radiation due to stratosphericozone depletion is therefore likely to decrease the use-ful life of these materials (Andrady et al., 1998).
The impact of UV radiation on infrastructure in theArctic is influenced by two compounding factors: thehigh surface reflectivity of snow or ice and long hours ofsunlight. Both factors have strong seasonal components,generally resulting in increased UV radiation levels inthe late spring.While the level of UV radiation incidenton a horizontal surface (e.g., a flat roof) may be consid-erably lower in the Arctic than at mid-latitudes, the level
Increase in mean annual air temperature (ºC)
0 0.5 1.0 1.5 2.0
Bearing capacity of structures builtusing Principle I (%)
100 93 85 73 50
Foundation durabilityof structures builtusing Principle II (%)
100 68 46 42 23
Table 16.9. Projected decrease in the bearing capacity anddurability of foundations in Yakutsk for different increases in airtemperature (Khrustalev, 2000).

Chapter 16 • Infrastructure: Buildings, Support Systems, and Industrial Facilities 929
of UV radiation incident on a vertical surface (e.g., asouth-facing wall) may be higher than that on a horizon-tal surface at some times of the year, when reflectionfrom snow augments the direct UV radiation incident onthe surface. Materials degradation is often related to thetotal accumulated UV radiation exposure.
Long days during the arctic summer can result in largedaily doses of UV radiation, even when noon levelsremain moderate. If UV radiation levels increase as aresult of ozone depletion or changes in cloud cover, theimpacts on materials are likely to include earlier degra-dation and significant discoloration.
For natural polymers found in wood, exposure to UVradiation can lead to a decrease in the useful lifetime ofthe product. Even small doses of UV radiation maydarken wood surfaces. Other effects of increased expo-sure to UV radiation on wood are less certain.Thedamage to finished wood products is limited primarilyby protective surface coatings, but increased UV radia-tion levels will possibly lead to increased costs formore frequent painting or other maintenance.
The construction industry is increasingly turning tosynthetic polymers for use in building materials. In theUnited States and Western Europe, the building sectoruses 20 to 30% of the annual production of plastics(Mader, 1992). Plastics and other synthetic polymerproducts are used for a number of applications, includ-ing irrigation, water distribution and storage, and infishing nets and agricultural films.
During the manufacture of virtually all polymer prod-ucts, impurities can be introduced that make the endproduct susceptible to photodegradation by UV radia-tion. Although stabilizers may be added to retard pho-todegradation effects, their inclusion can substantiallyincrease the cost of the final product. Unfortunately,much of the research on UV-induced degradation hasbeen conducted on pure polymer resins, leading toproblems in extrapolating the findings to processedproducts of the same polymer.
The effects of UV radiation on materials are closelytied to other environmental factors, including ambienttemperatures. Polar regions have experienced thegreatest ozone depletion and therefore the greatestpotential increases in UV-B radiation levels. However,the cooler temperatures in these locations can helpprevent rapid degradation of materials. Materials havedifferent sensitivities that can depend on wavelengthand dose. Some materials contain stabilizers designedto mitigate degradation, but the efficacy of those stabi-lizers under spectrally altered (e.g., higher than normalUV) conditions is not always known (Andrady, 1997).
UV-induced polymer deterioration has been widelyobserved. Polyvinyl chloride tends to undergo discol-oration or yellowing, and to lose impact strength.This loss of impact strength can eventually lead to
cracking and other irreversible damage. Anotherpolymer, polycarbonate, undergoes a rearrangementreaction when exposed to UV-B or UV-C radiation.When irradiated at longer wavelengths, including visi-ble wavelengths, polycarbonates undergo oxidativereactions that result in yellowing (Factor et al., 1987).
Polystyrene, used as expanded foam in both building andpackaging applications, also undergoes light-inducedcolor changes. In polyethylene and polypropylene, whichare used extensively in agricultural mulch films, green-house films, plastic pipes, and outdoor furniture, the lossof tensile properties and strength is a particular concern(Hamid and Pritchard, 1991; Hamid et al., 1995).
The cost of more frequent replacement of woods andpolymers is likely to be higher in the Arctic than atlower latitudes because of the increased cost of shippingand placement. Environmental stresses in the Arctic,including high winds and repeated freezing and thawing,will possibly exacerbate minor materials problems thatdevelop as a result of UV radiation damage.
16.3.2. Buildings
Several foundation systems are currently in use forindustrial, commercial, and residential structures situ-ated in the Arctic and subarctic.When building sitesare underlain by permafrost, the foundation systemmust ensure that any warmth emanating from thestructure does not induce thawing of the permafrostlayer. For many structures, this is accomplished by ele-vating the building above the ground surface on a pileor adjustable foundation system.The resulting air spaceensures that heat from the structure will not inducepermafrost warming.Thousands of structures rangingfrom single-family residences to large living quartersand apartment blocks are currently supported on pilefoundations, including many residential structures inthe permafrost zones of Alaska, Canada, and Scandi-navia, and many apartment buildings in Siberia.In most of these areas, existing structures are perform-ing well, and there has been little evidence that climatechange is inducing failures. However, as noted in sec-tion 16.3.8 many Siberian buildings are experiencingsignificant rates of structural failure that may be con-nected to increasing temperatures.
The bearing capacity of piles embedded in permafrostdepends on the type of frozen soil (clay, silt, or sand),its temperature, and the length of pile embedment inthe permafrost layer. A safe pile design is usually basedon the calculated maximum temperatures of the frozensoil along the embedded pile length, determined fromdata on the mean annual temperature of the site andthe seasonal temperature variation. Pile foundations areparticularly sensitive to permafrost temperaturesbecause of the large increase in creep rates as tempera-tures approach 0 ºC (see section 16.2.2.5). For thisreason, extra cooling measures, such as the use ofthermopiles (thermosyphon-cooled pilings), are some-

930 Arctic Climate Impact Assessment
times taken in the warmer discontinuous permafrostzone in order to lower temperatures and ensure a sta-ble permafrost–piling bond.
An increase in ground temperature along an existingpile is very likely to reduce its bearing capacity orincrease the rate of its settlement for two reasons: anincrease in the active-layer thickness will reduce theeffective embedment length of the pile; and increasedtemperature will reduce the strength of the frozen soil.As a result, if soil warming occurs, an existing struc-ture founded on piles will experience an increasing set-tlement rate that is likely to lead to uneven settlementand damage to the structure.
The design of all future structures founded on pilesembedded in permafrost soils should take into accountprojected future temperature increases. Depending onthe estimated useful lifetime of the structure, the piledesign should preferably be based on projected tem-perature conditions at the end of its lifetime. For anyparticular pile type, unless bearing on rock, this willresult in longer pile length and increased cost.
Very light buildings in permafrost areas are often estab-lished directly on the ground surface and supported bya system of adjustable mechanical jacks providing a suf-ficient crawl space below the heated and insulated floorof the building and the ground surface. Although suchbuildings will not produce thaw settlement of underly-ing permafrost, they are likely to be subject to theeffects of regional thaw settlement due to rising tem-peratures and the resulting increase in active-layerthickness. Although settlement in these types of build-ings can be adjusted by the jacking system, the differen-tial settlement of water supply and sewage evacuationpipes attached to the building must also be addressed.
Depending on local meteorological conditions, thefoundation soils of buildings constructed on elevatedfoundation systems (either pile or adjustable supports)are likely to be less prone to temperature increases asclimate change occurs.This is due to the combinedinfluence of shielding the surface from solar radiativeinput (due to shading by the structure) and eliminationof snow cover at the surface beneath the building, bothof which have a significant cooling effect on ground-surface temperatures.
For industrial and equipment buildings that must sup-port large floor loads, pile foundations are sometimestoo costly.These buildings often have a slab-on-gradefoundation with insulation installed beneath the floor tohelp protect the underlying permafrost. In addition tothe insulation, some sort of cooling system under theslab is required to remove heat from beneath the struc-ture. Both active and passive refrigeration systems havebeen employed for this purpose, but passive systems aregenerally preferred due to their lower operational andmaintenance costs. Passive systems are based on eitherthermosyphon or air-duct cooling systems, and utilize
low ambient temperatures during winter to refreeze abuffer layer of non-frost-susceptible material beneaththe building.The buffer layer typically consists of a padof granular material that is placed before building con-struction and sized to contain the seasonal thaw thatdevelops beneath the building during summer monthswhen the passive cooling system is inactive.
Increasing air temperature is very likely to have a detri-mental effect on the operation of these foundation sys-tems for two reasons. Higher air temperatures are like-ly to lengthen the thaw season and place increasedrequirements on the thickness of the buffer layerand/or the insulation system, and reduced air freezingindices (section 16.2.2.4) are very likely to decreasethe capacity of the passive cooling system to refreezethe buffer layer material during winter.
As a result, existing buildings built on slabs are likelyto experience an increasing failure rate as air tempera-tures rise and produce either significantly longer thawseasons or a reduced freezing index. Future designs forsuch buildings will need to take into account tempera-ture increases projected for the lifetime of the struc-ture.This is very likely to increase costs due to theneed for additional buffer layer material and highercooling capacities.
16.3.3. Road and railway embankmentsand work pads
Transportation routes are likely to be particularly sus-ceptible to destructive frost action under conditions ofchanging climate. Garagulya et al. (1997) developed amap showing areas with various probabilities of naturalhazards.This map indicated that the regions of highestsusceptibility to frost heave and thaw settlement arelocated along the Arctic Circle.
The design of road and railway embankments in theArctic is complicated by the presence of underlyingpermafrost, due to the possibility of thaw settlementand significant permanent embankment deformation ifthermal disturbance occurs.The situation is exacerbatedby complex thermal interactions between the embank-ment and the surrounding environment. Embankmentconstruction often produces a significant alteration ofthe surface microclimate that results in an increase inmean annual surface temperature of several degrees ascompared to natural conditions. Precise temperatureincreases are a complex function of embankment sur-face conditions, maintenance operations (e.g., snowclearing patterns), and the pre-existing natural vegeta-tion, and are sometimes difficult to project.
In the continuous permafrost zone, where the perma-frost layer and surface conditions are generally colder,surface warming due to embankment construction canusually be accommodated using well-established designpractices. In this case, the embankment thickness isadjusted to ensure that seasonal thawing is contained

Chapter 16 • Infrastructure: Buildings, Support Systems, and Industrial Facilities 931
within the embankment itself, thus avoiding thawing ofthe underlying permafrost.The required embankmentthickness is sensitive to climatic conditions, tending toincrease significantly with warmer conditions.
In the discontinuous permafrost zone, permafrost andground-surface temperatures are warmer, often withina few degrees of the melting point. In this zone, it ismore difficult to accommodate surface warming due toembankment construction since the resulting meansurface temperatures are often above the meltingpoint. In this case, long-term thaw of the permafrostlayer can be expected and cost-effective design strate-gies are currently unavailable. In a limited number ofcases, techniques such as thermosyphon, air duct, orconvection cooling systems have been used to mitigatethese problems (Andersland and Ladanyi, 1994;Goering, 2003; Goering and Kumar, 1996; Instanes,B., 2000; Phukan, 1985), however, the expense associ-ated with these systems severely limits their utility.In practice, even under current climatic conditions,many road and railway embankments located in regionsof warm discontinuous permafrost experience highfailure rates and resulting high maintenance costs.Typical problems include differential thaw settlementand shoulder failure due to thawing permafrost, result-ing in an uneven, cracked embankment surface (Fig.16.20).The timescales associated with permafrost thawbeneath embankments are of the order of the embank-ment lifetime (20 to 30 years), thus necessitating acontinuous maintenance program.
Increasing temperatures are very likely to affectembankment performance in both the continuous anddiscontinuous permafrost zones and should be consid-ered in the design of future projects. In the discontinu-ous permafrost zone, the problems associated withpermafrost thaw described above are very likely toincrease as increasing air temperature adds to thewarming influence of embankment construction.This is very likely to result in increased failure ratesand higher maintenance costs. As climate changereduces permafrost extent in the southern discontinu-
ous permafrost zone, some reduction in these embank-ment problems is possible, although the timescales forprojected warming and thaw are much longer thantypical project lifetimes.
In the continuous permafrost zone, increasing tempera-tures are likely to have negative impacts on embank-ment performance for two reasons:
• increased surface temperatures will necessitategreater embankment thicknesses in order to con-tain the seasonal thaw depth.This is very likely tohave a large impact on project costs due to thedifficulty and expense associated with obtainingappropriate granular material for embankmentconstruction; and
• as air and surface temperatures increase, a designregime shift will possibly occur in associationwith the northward movement of the boundarybetween the discontinuous and continuouspermafrost zones. It is possible that increasingembankment thickness alone will no longer besufficient to protect underlying permafrost andgreater failure rates will occur, similar to thoseseen in the discontinuous permafrost zone.
As a result, it is likely that existing road, rail, or air-port embankments will experience increasing failurerates both in the continuous and discontinuous perma-frost zones. Future embankment designs should incor-porate the effects of projected temperature increasesover the lifetime of the project, which is likely toincrease construction costs.
16.3.4. Pipelines
Many of the earth’s remaining oil and gas reserves arelocated in regions of the Arctic far from populationcenters.These areas include the North Slope of Alaska,the Canadian Arctic, northwestern Russia, and Siberia.The limited exploitation of these resources to date hasrelied primarily on pipeline systems to transport prod-ucts to market. Future expansion of these pipeline net-works is likely given the increasing demand for fossilfuels worldwide. Examples include the large gas pipe-line projects currently under consideration to connectnatural gas reserves in the Alaskan and western Canad-ian Arctic to southern Canada and the continentalUnited States. Many of the current and anticipatedpipeline routes cross extensive areas of continuous anddiscontinuous permafrost and require special designconsiderations.
Oil and gas pipelines differ in their interactions withthe surrounding environment because of variations inoperating temperature.Transmission of oil throughpipelines usually takes place at high temperaturesbecause of high oil-well production temperatures andreduced pumping losses. Conversely, natural gas trans-mission through pipelines often takes place at tempera-tures below freezing in order to increase gas density
Fig. 16.20. Typical embankment cracking and differential thawsettlement in the discontinuous permafrost zone of InteriorAlaska (Photo: Larry Hinzman, University of Alaska, Fairbanks).

932 Arctic Climate Impact Assessment
and throughput. High- or low-temperature pipelinespresent different challenges to designers and will reactin different ways to increased air temperatures.
Gas and oil pipelines are normally constructed belowthe ground surface, as this reduces construction costsand provides other benefits. In the case of warm-oilpipelines, this becomes problematic in areas wherepermafrost is encountered.The desire to keep the oilwarm to limit viscosity and pumping costs is in directconflict with the requirement to maintain the frozenstate of the surrounding soil. If the pipeline is buried,no practical amount of insulation will prevent the warmoil from thawing surrounding permafrost, thus resultingin loss of strength, thaw settlement, and probable linefailure. As a result, designers have relied on one of twomethods to avoid permafrost degradation:
• an elevated oil pipeline that is supported abovethe ground surface on some sort of pile founda-tion, thus limiting the possibility of permafrostthaw; or
• a more conventional buried pipeline design, withthe oil chilled to near-permafrost temperatures(typically below 0 ºC for a large part of the year).
A major shortcoming of both methods, particularlywith regard to potential climate change, is theirreliance on the permafrost layer for structural support.In the first case, the piles are embedded in the perma-frost, as for a building foundation, and the adfreezebond between the pile and the permafrost supports theload. In the second case, the integrity of the pipetrench and support of the pipeline are dependent onthe structural integrity of the underlying permafrost.Both methods result in increased cost; the first due tothe large expense of constructing an elevated line, andthe second due to the high pumping costs associatedwith moving chilled oil and related problems withpotential wax formation in the line.
The best-known example of an existing elevatedarctic oil pipeline is the Trans Alaska Pipeline System(TAPS), which stretches 1280 km from Prudhoe Bayto the ice-free port of Valdez in southern Alaska.This pipeline is elevated for just over half of its lengthin order to avoid potential permafrost problems.The northern sections, where permafrost tempera-tures are cold (lower than approximately -5 ºC),utilize non-refrigerated pile supports and a work-padembankment designed to protect underlying perma-frost. In the more southerly sections, where warmerdiscontinuous permafrost is encountered, the pilesutilize a passive refrigeration system consisting ofpairs of thermosyphons installed in each piling. Morethan 120 000 thermosyphons are used (Sorensen et al.,2003). The thermosyphons are designed to ensure thatany excess heat transported downward from the pipe-line or entering the ground surface due to construc-tion disturbance will not cause thawing of the perma-frost where the piles are embedded.
Owing to the extensive use of pile supports, elevatedoil pipelines are sensitive to increasing air and soil tem-peratures, as are building-support pilings. Increasedsoil temperatures are very likely to reduce the bearingcapacity of these systems because of the reduction inthe strength of the adfreeze bond between the frozensoil and the pile. In addition, increased air tempera-tures are very likely to result in a greater active-layerdepth, which will reduce the effective embedmentlength of the pile in the frozen zone. Some of theseeffects can be countered by the use of refrigeratedpiles, as in the case of TAPS; however, increased airtemperatures are also very likely to reduce the abilityof these systems to provide adequate cooling. It is alsopossible that the pipeline right-of-way and work-padembankment will begin to experience increased prob-lems with thaw settlement due to the combination ofsurface disturbance and increasing air temperature.These factors should be considered during the designstage of future projects.
The Norman Wells Pipeline, which runs 896 kmthrough the western Canadian Arctic from NormanWells, Northwest Territories, to Zama City, Alberta,is an example of a chilled pipeline that is buried inpermafrost terrain.The oil is chilled by a refrigerationsystem before it enters the line at Norman Wells, andoperates at near-ambient permafrost temperatures. Eventhough the oil is chilled to minimize permafrost distur-bance, the designers anticipated a significant amount ofthaw settlement and/or frost heave along the route(Nixon et al., 1984).To resist the anticipated loadingdue to thaw strain or frost heave, a relatively high-strength system consisting of a small-diameter thick-wall pipe was used.Two major design/performanceissues were identified as the most significant for thisproject: adequate thermal conditions must be main-tained such that design loads due to thaw settlement orfrost heave are not exceeded; and permafrost thaw with-in the pipeline trench and right-of-way must be limitedin order to avoid slope instability (and potential land-slides) in areas of sloped terrain.
Variations in line operating conditions have resulted insignificant movement of the pipe due to thaw settle-ment and frost heave. In some places, thaw settlementnear the pipeline trench has exceeded the design pro-jections of 1 m (Burgess and Smith, 2003), and increas-es in thaw depth have reduced the factor of safety forslope stability (Oswell et al., 1998).
Many of the difficult operational issues identified abovefor buried ambient-temperature pipelines result fromthe thermal interaction between the pipe and thesurrounding ground.These difficulties are likely to beexacerbated if air temperatures also change over time.Increased air temperatures are likely to aggravate prob-lems with thaw settlement along the right-of-way anddecrease slope stability.To some extent, it may bepossible to reduce the severity of these problems bydecreasing the operational temperatures of the pipeline,
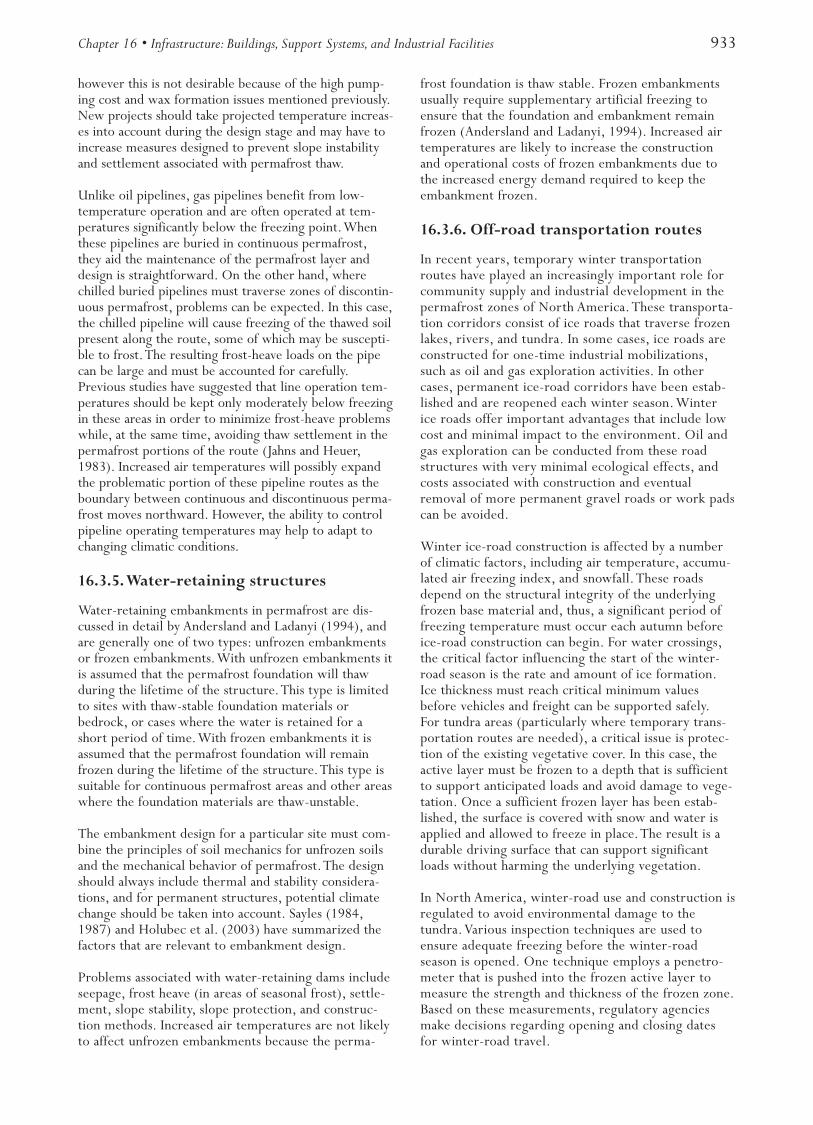
Chapter 16 • Infrastructure: Buildings, Support Systems, and Industrial Facilities 933
however this is not desirable because of the high pump-ing cost and wax formation issues mentioned previously.New projects should take projected temperature increas-es into account during the design stage and may have toincrease measures designed to prevent slope instabilityand settlement associated with permafrost thaw.
Unlike oil pipelines, gas pipelines benefit from low-temperature operation and are often operated at tem-peratures significantly below the freezing point.Whenthese pipelines are buried in continuous permafrost,they aid the maintenance of the permafrost layer anddesign is straightforward. On the other hand, wherechilled buried pipelines must traverse zones of discontin-uous permafrost, problems can be expected. In this case,the chilled pipeline will cause freezing of the thawed soilpresent along the route, some of which may be suscepti-ble to frost.The resulting frost-heave loads on the pipecan be large and must be accounted for carefully.Previous studies have suggested that line operation tem-peratures should be kept only moderately below freezingin these areas in order to minimize frost-heave problemswhile, at the same time, avoiding thaw settlement in thepermafrost portions of the route (Jahns and Heuer,1983). Increased air temperatures will possibly expandthe problematic portion of these pipeline routes as theboundary between continuous and discontinuous perma-frost moves northward. However, the ability to controlpipeline operating temperatures may help to adapt tochanging climatic conditions.
16.3.5.Water-retaining structures
Water-retaining embankments in permafrost are dis-cussed in detail by Andersland and Ladanyi (1994), andare generally one of two types: unfrozen embankmentsor frozen embankments.With unfrozen embankments itis assumed that the permafrost foundation will thawduring the lifetime of the structure.This type is limitedto sites with thaw-stable foundation materials orbedrock, or cases where the water is retained for ashort period of time.With frozen embankments it isassumed that the permafrost foundation will remainfrozen during the lifetime of the structure.This type issuitable for continuous permafrost areas and other areaswhere the foundation materials are thaw-unstable.
The embankment design for a particular site must com-bine the principles of soil mechanics for unfrozen soilsand the mechanical behavior of permafrost.The designshould always include thermal and stability considera-tions, and for permanent structures, potential climatechange should be taken into account. Sayles (1984,1987) and Holubec et al. (2003) have summarized thefactors that are relevant to embankment design.
Problems associated with water-retaining dams includeseepage, frost heave (in areas of seasonal frost), settle-ment, slope stability, slope protection, and construc-tion methods. Increased air temperatures are not likelyto affect unfrozen embankments because the perma-
frost foundation is thaw stable. Frozen embankmentsusually require supplementary artificial freezing toensure that the foundation and embankment remainfrozen (Andersland and Ladanyi, 1994). Increased airtemperatures are likely to increase the constructionand operational costs of frozen embankments due tothe increased energy demand required to keep theembankment frozen.
16.3.6. Off-road transportation routes
In recent years, temporary winter transportationroutes have played an increasingly important role forcommunity supply and industrial development in thepermafrost zones of North America. These transporta-tion corridors consist of ice roads that traverse frozenlakes, rivers, and tundra. In some cases, ice roads areconstructed for one-time industrial mobilizations,such as oil and gas exploration activities. In othercases, permanent ice-road corridors have been estab-lished and are reopened each winter season.Winterice roads offer important advantages that include lowcost and minimal impact to the environment. Oil andgas exploration can be conducted from these roadstructures with very minimal ecological effects, andcosts associated with construction and eventualremoval of more permanent gravel roads or work padscan be avoided.
Winter ice-road construction is affected by a numberof climatic factors, including air temperature, accumu-lated air freezing index, and snowfall.These roadsdepend on the structural integrity of the underlyingfrozen base material and, thus, a significant period offreezing temperature must occur each autumn beforeice-road construction can begin. For water crossings,the critical factor influencing the start of the winter-road season is the rate and amount of ice formation.Ice thickness must reach critical minimum valuesbefore vehicles and freight can be supported safely.For tundra areas (particularly where temporary trans-portation routes are needed), a critical issue is protec-tion of the existing vegetative cover. In this case, theactive layer must be frozen to a depth that is sufficientto support anticipated loads and avoid damage to vege-tation. Once a sufficient frozen layer has been estab-lished, the surface is covered with snow and water isapplied and allowed to freeze in place.The result is adurable driving surface that can support significantloads without harming the underlying vegetation.
In North America, winter-road use and construction isregulated to avoid environmental damage to thetundra. Various inspection techniques are used toensure adequate freezing before the winter-roadseason is opened. One technique employs a penetro-meter that is pushed into the frozen active layer tomeasure the strength and thickness of the frozen zone.Based on these measurements, regulatory agenciesmake decisions regarding opening and closing datesfor winter-road travel.

934 Arctic Climate Impact Assessment
Climatic conditions play a strong role in determiningthe opening and closing dates for winter-road travel,although inspection techniques and load requirements,among other factors, are also important. Increased airtemperature and reductions in the annual air freezingindex are very likely to have a negative impact on theduration of the winter-road season.This will possiblybecome particularly problematic for oil and gasexploration because of the time needed at the begin-ning and end of the ice-road season for mobilizationand demobilization.
Hinzman et al. (in press) present historic data for theopening and closing dates for tundra travel on the NorthSlope of Alaska that show a substantial reduction in theduration of the winter-road season (from over 200 daysin the early 1970s to just over 100 days in 2002).The rate of reduction has been fairly consistent over theintervening years and is due primarily to delayed open-ing dates (from early November in the 1970s to lateJanuary in the 2000s), although closing dates have alsobeen occurring earlier in the spring. Reductions in theduration of the winter-road season have also occurred inthe Canadian Arctic, however the reductions are muchsmaller than those observed in Alaska, and in some casesthe season length has increased.
Fig. 16.21 shows historic data for opening and closingdates of winter roads on the North Slope of Alaska andin Canada’s Northwest Territories.The data for theNorth Slope are for temporary winter roads usedprimarily for oil and gas exploration, whereas the datafor the Northwest Territories are for the winter roadsbetween Inuvik and Tuktoyaktuk (187 km) and betweenthe Yellowknife Highway and Wha Ti (103 km).Thefigure illustrates the reduction in season length for theNorth Slope of Alaska, and a trend of later opening
dates for the Wha Ti road. Data for the Inuvik-Tuktoyaktuk road, however, indicate an increased sea-son length.
The observed trend in Alaska shows that climatechange is likely to lead to decreased availability of off-road transportation routes (ice roads, snow roads, etc.)due to reduced duration of the freezing season.
16.3.7. Offshore transportation routes
The global economy of the 21st century will need thenatural resources of the Arctic and subarctic. Air trans-port remains unprofitable for mineral payloads andattention to arctic shipping is growing as a result.Road, rail, and pipeline routes are complicated in thefar north by tectonically active glacier-contorted land-scapes, low-lying frozen ground, and fragile ecosys-tems. Shorter routes from resource to tidewater mini-mize terrestrial complications only if a port can bebuilt at the coast. New ice-breaking ship designs arecontinually improving the efficiency of arctic shipping.Growing evidence of climate change indicates that ice-free navigation seasons will probably be extended andthinner sea ice will probably reduce constraints onwinter ship transits (section 16.2.5). Additional north-ern port capacity is critical to the success of arcticshipping strategies associated with northern resourcedevelopment and potential climate change. Difficultiesrelated to freezing temperatures, snow accumulation,and extended darkness compound the challenges ofgeotechnical, structural, architectural, mechanical,electrical, transportation, and coastal engineering indesigning and operating sea and river ports.
The International Northern Sea Route Programme wasa six-year (June 1993 – March 1999) internationalresearch program designed to create an extensiveknowledge base about the ice-infested shipping lanesalong the coast of the Russian Arctic, from NovayaZemlya in the west to the Bering Strait in the east.This route was previously named the NortheastPassage, but is now more often known by its Russianname – the Northern Sea Route.
Projected reductions in sea-ice extent are likely toimprove access along the Northern Sea Route and theNorthwest Passage. Projected longer periods of openwater are likely to foster greater access to all coastalseas around the Arctic Basin.While voyages across theArctic Ocean (over the pole) will possibly become fea-sible this century, longer navigation seasons along thearctic coasts are more likely. Development of the off-shore continental shelves and greater use of coastalshipping routes will possibly have significant social,political, and economic consequences for all residentsof arctic coastal areas.
Output from the five ACIA-designated climate modelswas used to project the length of the navigation seasonalong the Northern Sea Route based on the amount of
Fig. 16.21. Opening and closing dates for winter roads on theNorth Slope of Alaska and the Inuvik–Tuktoyaktuk andYellowknife Highway–Wha Ti winter roads in western Canada(North Slope data after Hinzman et al., in press; Canadian datafrom the Government of the Northwest Territories, Departmentof Transportation, www.hwy.dot.gov.nt.ca/highways/, 2003).
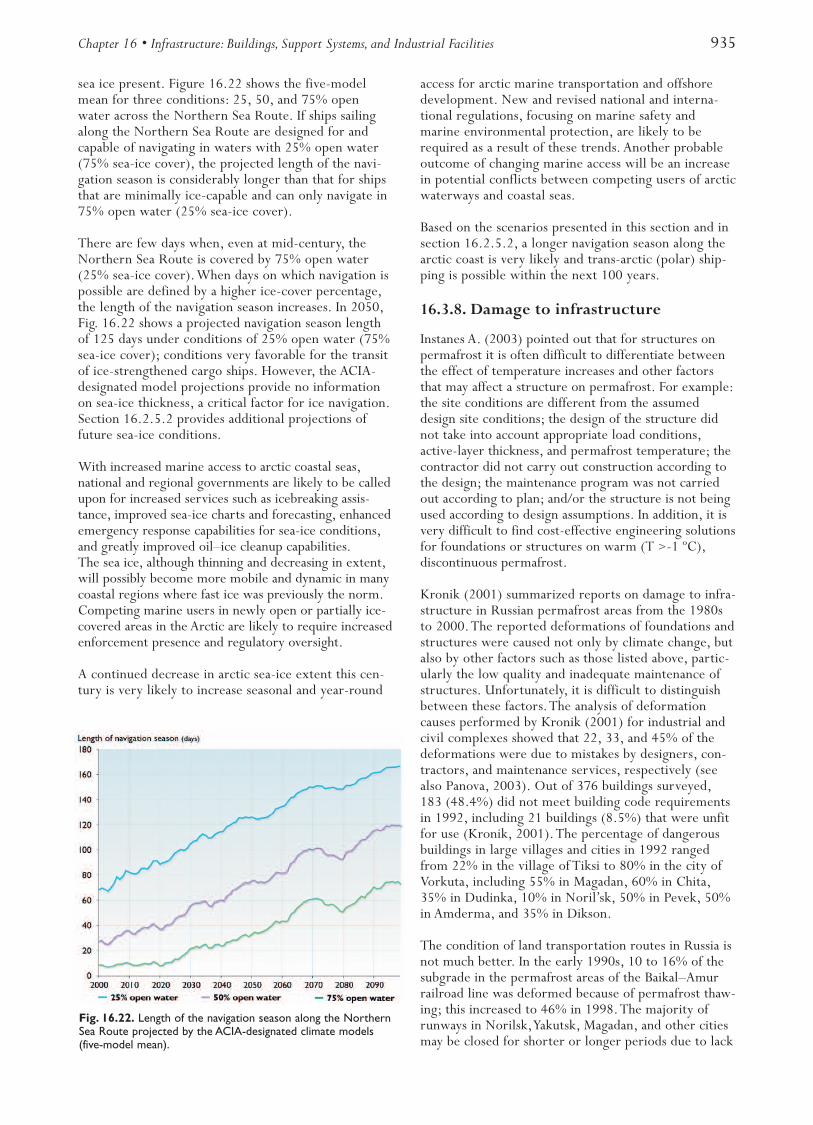
Chapter 16 • Infrastructure: Buildings, Support Systems, and Industrial Facilities 935
sea ice present. Figure 16.22 shows the five-modelmean for three conditions: 25, 50, and 75% openwater across the Northern Sea Route. If ships sailingalong the Northern Sea Route are designed for andcapable of navigating in waters with 25% open water(75% sea-ice cover), the projected length of the navi-gation season is considerably longer than that for shipsthat are minimally ice-capable and can only navigate in75% open water (25% sea-ice cover).
There are few days when, even at mid-century, theNorthern Sea Route is covered by 75% open water(25% sea-ice cover).When days on which navigation ispossible are defined by a higher ice-cover percentage,the length of the navigation season increases. In 2050,Fig. 16.22 shows a projected navigation season lengthof 125 days under conditions of 25% open water (75%sea-ice cover); conditions very favorable for the transitof ice-strengthened cargo ships. However, the ACIA-designated model projections provide no informationon sea-ice thickness, a critical factor for ice navigation.Section 16.2.5.2 provides additional projections offuture sea-ice conditions.
With increased marine access to arctic coastal seas,national and regional governments are likely to be calledupon for increased services such as icebreaking assis-tance, improved sea-ice charts and forecasting, enhancedemergency response capabilities for sea-ice conditions,and greatly improved oil–ice cleanup capabilities.The sea ice, although thinning and decreasing in extent,will possibly become more mobile and dynamic in manycoastal regions where fast ice was previously the norm.Competing marine users in newly open or partially ice-covered areas in the Arctic are likely to require increasedenforcement presence and regulatory oversight.
A continued decrease in arctic sea-ice extent this cen-tury is very likely to increase seasonal and year-round
access for arctic marine transportation and offshoredevelopment. New and revised national and interna-tional regulations, focusing on marine safety andmarine environmental protection, are likely to berequired as a result of these trends. Another probableoutcome of changing marine access will be an increasein potential conflicts between competing users of arcticwaterways and coastal seas.
Based on the scenarios presented in this section and insection 16.2.5.2, a longer navigation season along thearctic coast is very likely and trans-arctic (polar) ship-ping is possible within the next 100 years.
16.3.8. Damage to infrastructure
Instanes A. (2003) pointed out that for structures onpermafrost it is often difficult to differentiate betweenthe effect of temperature increases and other factorsthat may affect a structure on permafrost. For example:the site conditions are different from the assumeddesign site conditions; the design of the structure didnot take into account appropriate load conditions,active-layer thickness, and permafrost temperature; thecontractor did not carry out construction according tothe design; the maintenance program was not carriedout according to plan; and/or the structure is not beingused according to design assumptions. In addition, it isvery difficult to find cost-effective engineering solutionsfor foundations or structures on warm (T >-1 ºC),discontinuous permafrost.
Kronik (2001) summarized reports on damage to infra-structure in Russian permafrost areas from the 1980sto 2000.The reported deformations of foundations andstructures were caused not only by climate change, butalso by other factors such as those listed above, partic-ularly the low quality and inadequate maintenance ofstructures. Unfortunately, it is difficult to distinguishbetween these factors.The analysis of deformationcauses performed by Kronik (2001) for industrial andcivil complexes showed that 22, 33, and 45% of thedeformations were due to mistakes by designers, con-tractors, and maintenance services, respectively (seealso Panova, 2003). Out of 376 buildings surveyed,183 (48.4%) did not meet building code requirementsin 1992, including 21 buildings (8.5%) that were unfitfor use (Kronik, 2001).The percentage of dangerousbuildings in large villages and cities in 1992 rangedfrom 22% in the village of Tiksi to 80% in the city ofVorkuta, including 55% in Magadan, 60% in Chita,35% in Dudinka, 10% in Noril’sk, 50% in Pevek, 50%in Amderma, and 35% in Dikson.
The condition of land transportation routes in Russia isnot much better. In the early 1990s, 10 to 16% of thesubgrade in the permafrost areas of the Baikal–Amurrailroad line was deformed because of permafrost thaw-ing; this increased to 46% in 1998.The majority ofrunways in Norilsk,Yakutsk, Magadan, and other citiesmay be closed for shorter or longer periods due to lack
Fig. 16.22. Length of the navigation season along the NorthernSea Route projected by the ACIA-designated climate models(five-model mean).

of maintenance.The main gas and oil transmission linesin the permafrost region have also suffered damagerelated to permafrost thawing: 16 breaks were record-ed on the Messoyakha–Noril’sk pipeline in 2000.
16.3.9. Energy consumption for heating
A reduction in the demand for heating energy is apotential positive effect of climate change in the Arcticand subarctic.The air-temperature threshold thatdefines the beginning of the cold period, when addi-tional heating of living facilities, businesses, and indus-trial buildings is necessary, varies within and betweencountries. In North America and Western Europe, mostcivil buildings, private houses, apartment complexes,and even most buildings in large cities have local heat-ing systems. In the United States the temperaturethreshold for heating is defined as 65 ºF (17.8 ºC),but because the local systems are very flexible and canbe manipulated individually, evaluation of energy con-sumption is complex.
In Eastern Europe and Russia, most urban buildingshave centralized heating systems. Under standard con-
936 Arctic Climate Impact Assessment
ditions, such systems operate when the mean daily airtemperature falls below 8 ºC (47 ºF). Because of thelarge thermal inertia of these centralized heating sys-tems, comfortable indoor temperatures (e.g., 18 ºC)are usually maintained throughout the winter.
Figure 16.23 shows the annual demand for heatingenergy (in 1000 ºC-days) when building heating isrequired (mean daily air temperature below 8 ºC) cal-culated for current climatic conditions. Annual heatingdegree-day totals characterize the demand for heatingover the entire cold period. Daily heating degree-daysare calculated by subtracting the mean daily tempera-ture from the 8 ºC threshold (e.g., a day with a meandaily temperature of 5 ºC would result in three heatingdegree-days); days with a mean temperature at orabove 8 ºC result in zero heating degree-days.
Anisimov (1999) used the GFDL, ECHAM-1 (Max-Planck Institute for Meteorology), and HadCM tran-sient climate scenarios for 2050 to calculate thereduction in the duration of the heating period andchanges in the number of heating degree-days relativeto 1999. Projected reductions in the number of heat-ing degree-days (Fig. 16.24) can be used as a metricfor the reduction in heating energy consumption.Figure 16.25 shows the percentage reduction in theduration of the heating period between 1999 and2050; this decrease is projected to vary from a fewweeks to more than a month, depending on theregional effects of climate change.
The energy savings from decreased demand for heatingin northern regions are likely to be offset by increasesin the temperature and duration of the warm period,leading to greater use of air conditioning.
16.3.10. Natural resources
The Arctic has large oil and natural gas reserves.Most are located in Russia: oil in the Pechora Basin,natural gas in the Lower Ob Basin, and other potentialoil and gas fields along the Siberian coast. Canadian oiland gas fields are concentrated in two main basins in
Fig. 16.24. Projected decrease in the number of heating degree-days in 2050 as a percentage of 1999 values, calculated using the(a) ECHAM-1; (b) GFDL; and (c) HadCM climate scenarios (Anisimov, 1999).
Demand(1000 ºC-days)
<0.50.5–0.151.5–2.52.5–3.53.5–4.54.5–5.55.5–6.56.5–7.57.5–8.58.5–9.59.5–10.5
10.5–11.5>11.5
Fig. 16.23. Annual demand for heating energy (Anisimov, 1999).
(a) (b) (c)Decrease in heating
degree-days (%)
<00
0–55–1010–1515–2020–2525–3030–3535–4040–4545–50>50
Chapter 16 • Infrastructure: Buildings, Support Systems, and Industrial Facilities 937
the Mackenzie Delta–Beaufort Sea region and in thehigh Arctic. Prudhoe Bay (Alaska) is the largest oilfield in North America, and other fields have beendiscovered or are likely to be present along theBeaufort Sea coast. Oil and gas fields also exist inother arctic waters, for example, the Barents Sea andoff the west coast of Greenland. The Arctic is animportant supplier of oil and gas to the global market,and it is possible that climate change will have bothpositive and negative financial impacts on theexploration, production, and transportation activitiesof this industry.
Climate change impacts on oil and gas developmenthave so far been minor, but are likely to result in bothfinancial costs and benefits in the future. For example,offshore oil exploration and production is likely tobenefit from less extensive and thinner sea ice becauseof cost reductions in the construction of platforms thatmust withstand ice forces. Conversely, ice roads, nowused widely for access to offshore activities and facili-ties, are likely to be useable for shorter periods andless safe than at present.The thawing of permafrost, onwhich buildings, pipelines, airfields, and coastal instal-lations supporting oil development are located, is verylikely to adversely affect these structures and the costof maintaining them (Parker, 1998;Weller and Lange,1999;Weller et al., 1999).
The Arctic holds large stores of minerals, ranging fromgemstones to fertilizers. Russia extracts the largestquantities, including nickel, copper, platinum, apatite,tin, diamonds, and gold, mostly on the Kola Peninsulabut also in Siberia. Canadian mines in the Yukon andNorthwest Territories supply lead, zinc, copper, andgold. Gold mining continues in Alaska, along withextraction of lead and zinc deposits from the Red DogMine, which contains two-thirds of US zinc resources.Coal mining also occurs in several areas of the Arctic.Mining activities in the Arctic are an important con-tributor of raw materials to the global economy andare likely to benefit from improved transportationconditions to bring products to market, due to a longerice-free shipping season.
The coal and mineral extraction industries in the Arcticare important contributors to national economies, andthe actual extraction process is not likely to be muchaffected by climate change. However, climate changewill possibly affect the transportation of coal and min-erals. Mines that export their products using marinetransport are likely to experience savings due toreduced sea-ice extent and a longer shipping season.Conversely, mining facilities with roads on permafrostare likely to experience higher maintenance costs asthe permafrost thaws (Parker, 1998;Weller and Lange,1999;Weller et al., 1999).
Any expansion of oil and gas activities and mining islikely to require expansion of air, marine, and landtransportation systems.The benefits of a longer ship-ping season in the Arctic, with the possibility of easytransit through the Northern Sea Route and NorthwestPassage for at least part of the year, are likely to be sig-nificant. Other benefits are likely to include deeperdrafts in harbors and channels as sea level rises, areduced need for ice strengthening of ship hulls and off-shore oil and gas platforms, and a reduced need for ice-breaker support. Conversely, coping with greater waveheights, and possible flooding and erosion threats tocoastal facilities, is likely to result in increased costs.
16.4. Engineering design for achanging climateClimate change is likely to affect infrastructure in differ-ent ways, as has been described in previous sections ofthis chapter. Some infrastructure may be relatively insen-sitive to climate change or easily adaptable to changingconditions. In other cases, a large sensitivity may existand/or the consequences of any failure may be high(Esch, 1993; Ladanyi et al., 1996, Khrustalev, 2001,2000). For infrastructure in the first category, a detailedanalysis of the potential impacts of climate change maynot be important, particularly given the high level ofuncertainty associated with local climate trends that willaffect individual projects. Conversely, for projects wherehigh sensitivity or large consequences are possible, adetailed analysis may be warranted.
Fig. 16.25. Projected reduction in the duration of the heating period between 1999 and 2050, calculated using the (a) ECHAM-1;(b) GFDL; and (c) HadCM climate scenarios (Anisimov, 1999).
(a) (b) (c) Reduction in heatingperiod duration
(weeks)<00
0–11–22–33–44–55–66–77–88–99–10>10

938 Arctic Climate Impact Assessment
16.4.1. Risk-based evaluation of potentialclimate change impacts
Bush et al. (1998) presented a methodology for consid-ering the impact of projected climate change withinthe framework of the engineering design process.Theyalso explained how the same methodology can be uti-lized to identify and prioritize concerns about existingfacilities with respect to climate change impacts.Themethod involves a multi-step approach that first assess-es the sensitivity of a given project to climate changeand then the consequences of any potential failures.The relationship between sensitivity and consequencesdefines the risk that climate change poses to the proj-ect. Finally, the degree of sensitivity and the severity ofthe consequences are used to determine what level ofclimate-change impact analysis should be carried outfor a given project.
The sensitivity of a particular infrastructure project toclimate change is determined by a number of factors,including the initial soil and permafrost temperatures,the temperature dependence of the material proper-ties, the project lifetime, and the existing over-designor safety margin that might be included in the designfor other reasons. Bush et al. (1998) included a proce-dure for categorizing these effects and determining theclimate sensitivity of a project using a scale of high,medium, or low.
Any analysis of the consequences of failure begins witha determination of all relevant failure scenarios.Thesescenarios are then evaluated qualitatively using a scaleof catastrophic, major, minor, or negligible, consider-ing not only potential physical damage to the infra-structure but also socioeconomic or cultural impacts.
The final step in the screening process involves thedetermination of the level of climate-change impactanalysis required at the design stage. Bush et al. (1998)included a table that suggests a level of analysis as afunction of the degree of risk indicated by the projectsensitivity and failure consequences. Level A requires adetailed quantitative analysis relying on numerical geo-technical models with refined input parameters, inde-pendent expert review, and a field-monitoring programwith periodic evaluation of performance. Level Brequires more limited quantitative analysis and alsosuggests a field-monitoring program. Level C suggeststhe use of qualitative analysis based on professionaljudgment, and Level D does not require any analysis ofclimate change impacts.This framework provides anorganized approach to incorporating projected climatechange into the design of arctic infrastructure projects.
16.4.2. Design thawing and freezingindices
Section 16.2.2.2 introduced the concept of air thawingand freezing indices. For design purposes, the designair thawing index (ATI) is commonly defined as the
average ATI for the three warmest summers in the lat-est 30 years of record, or the warmest summer in thelatest 10 years of record if 30 years of record are notavailable (Andersland and Anderson, 1978; Anderslandand Ladanyi, 1994).
In Norway, statistical analysis of historic meteorologicaldata is used to determine design air freezing indices(AFIs) with varying probabilities of occurrence(Heiersted, 1976). A similar approach can be used fordetermining design ATIs in permafrost areas (Instanes,A., 2003).
Table 16.10 shows different design ATIs and theirprobability of occurrence.The two-year design ATI(ATI2) is approximately equal to the 30-year mean ofthe ATI.The average ATI for the three warmest sum-mers in the latest 30 years of record usually lies some-where between ATI20 and ATI50.The magnitude ofpotential thawing incorporated in a design is dependenton the type of foundation or structure and the conse-quences of differential settlement or failure. For roadembankments, ATI2 to ATI10 is commonly used, whilefor buildings, ATI50 to ATI100 is used. For more sensi-tive structures, such as power plants and oil or gaspipelines, higher design ATIs should be considered.
In thermal analyses using advanced methods such asfinite-element models, the design ATI is usually repre-sented by a time series or sine curve that combines anaverage winter (AFI2) and a design summer. Maximumthaw depth and permafrost temperature are usuallycaused by a combination of warm winters and summers.Therefore, combinations of warm winters (low AFI) andwarm summers (high ATI) should also be considered.
Section 16.2.2.4 describes projected changes in freez-ing and thawing indices calculated using output fromthe ACIA-designated climate models. Figures 16.26and 16.27 present an example of projected designfreezing and thawing indices for Kugluktuk (Copper-mine), Canada.The values from 1940 to 2000 arebased on observations, while those from 2000 to 2100are based on output from the CGCM2 model.The fig-ures show curves for the 30-year mean value (probabil-ity of occurrence 50%); the mean of the warmest 3years during the last 30 years; the warmest year duringthe last 10 years; AFI20/ATI20 (probability of occurrence
Table 16.10. Design air thawing indexes (ATIs).
Magnitude ofthawing
Probability ofoccurrence in anygiven year (%)
Predicted number ofoccurrences
ATI2 50 once in 2 years
ATI10 10 once in 10 years
ATI20 5 once in 20 years
ATI100 1 once in 100 years
ATI1000 0.1 once in 1000 years
ATI10 000 0.01 once in 10000 years
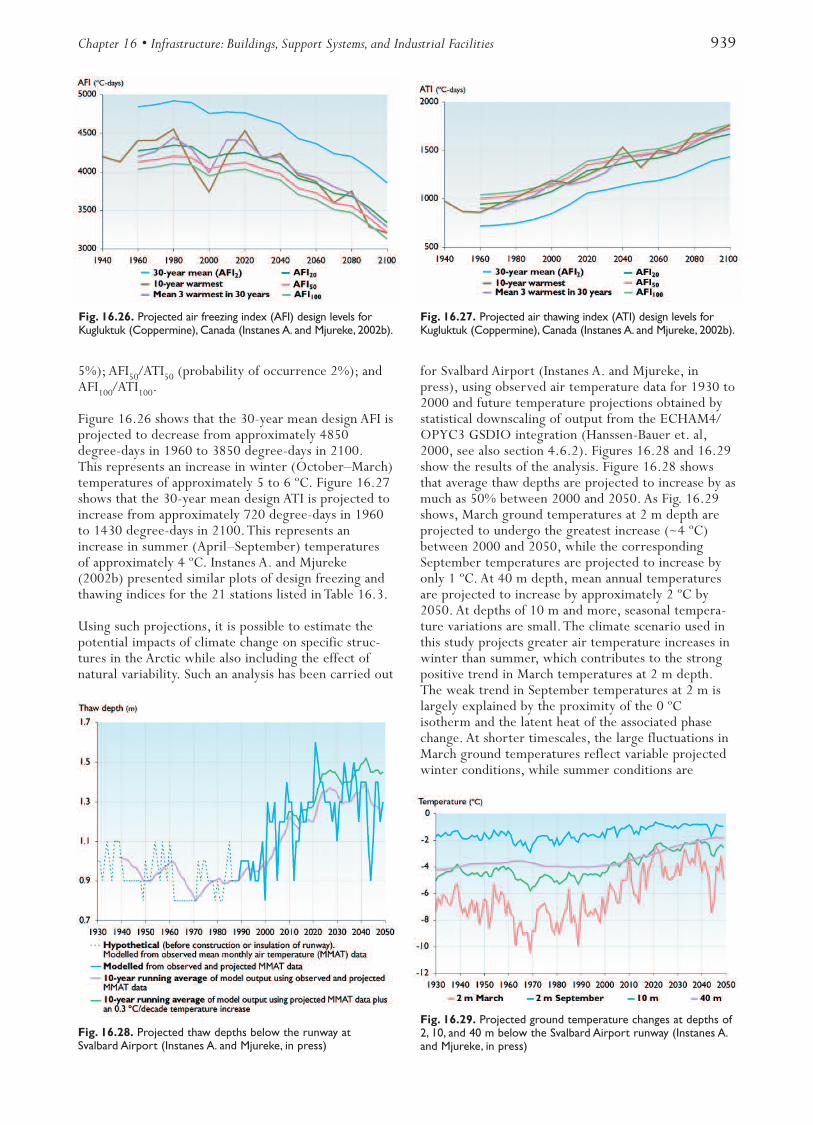
Chapter 16 • Infrastructure: Buildings, Support Systems, and Industrial Facilities 939
5%); AFI50/ATI50 (probability of occurrence 2%); andAFI100/ATI100.
Figure 16.26 shows that the 30-year mean design AFI isprojected to decrease from approximately 4850degree-days in 1960 to 3850 degree-days in 2100.This represents an increase in winter (October–March)temperatures of approximately 5 to 6 ºC. Figure 16.27shows that the 30-year mean design ATI is projected toincrease from approximately 720 degree-days in 1960to 1430 degree-days in 2100.This represents anincrease in summer (April–September) temperaturesof approximately 4 ºC. Instanes A. and Mjureke(2002b) presented similar plots of design freezing andthawing indices for the 21 stations listed in Table 16.3.
Using such projections, it is possible to estimate thepotential impacts of climate change on specific struc-tures in the Arctic while also including the effect ofnatural variability. Such an analysis has been carried out
for Svalbard Airport (Instanes A. and Mjureke, inpress), using observed air temperature data for 1930 to2000 and future temperature projections obtained bystatistical downscaling of output from the ECHAM4/OPYC3 GSDIO integration (Hanssen-Bauer et. al,2000, see also section 4.6.2). Figures 16.28 and 16.29show the results of the analysis. Figure 16.28 showsthat average thaw depths are projected to increase by asmuch as 50% between 2000 and 2050. As Fig. 16.29shows, March ground temperatures at 2 m depth areprojected to undergo the greatest increase (~4 ºC)between 2000 and 2050, while the correspondingSeptember temperatures are projected to increase byonly 1 ºC. At 40 m depth, mean annual temperaturesare projected to increase by approximately 2 ºC by2050. At depths of 10 m and more, seasonal tempera-ture variations are small.The climate scenario used inthis study projects greater air temperature increases inwinter than summer, which contributes to the strongpositive trend in March temperatures at 2 m depth.The weak trend in September temperatures at 2 m islargely explained by the proximity of the 0 ºCisotherm and the latent heat of the associated phasechange. At shorter timescales, the large fluctuations inMarch ground temperatures reflect variable projectedwinter conditions, while summer conditions are
Fig. 16.26. Projected air freezing index (AFI) design levels forKugluktuk (Coppermine), Canada (Instanes A. and Mjureke, 2002b).
Fig. 16.27. Projected air thawing index (ATI) design levels forKugluktuk (Coppermine), Canada (Instanes A. and Mjureke, 2002b).
Fig. 16.28. Projected thaw depths below the runway atSvalbard Airport (Instanes A. and Mjureke, in press)
Fig. 16.29. Projected ground temperature changes at depths of2, 10, and 40 m below the Svalbard Airport runway (Instanes A.and Mjureke, in press)

940 Arctic Climate Impact Assessment
projected to be more uniform.This analysis suggeststhat the design of structures sensitive to thaw settle-ment should utilize the risk-based method described insection 16.4.1.
Instanes A. (2003) reported that the design lifetime forstructures in permafrost regions is typically 30 to50 years.Within this time frame, the structure shouldfunction according to design with normal maintenancecosts.Total rehabilitation, demolition, and replacementof old structures must be expected and are part of sen-sible infrastructure planning and engineering practice.The effects of climate change on arctic infrastructureare, as previously indicated, difficult to quantify.Structural damage is often blamed on climate change,when a thorough investigation and case history indi-cates that the cause is either human error or the designlifetime being exceeded.
16.4.3. Coastal areas
Numerous arctic communities face the challenge ofincreased coastal erosion and warming of permafrost.The combined problems of increased wave action, sea-level rise, and thermal erosion have no simple engineer-ing solutions.Two examples of erosion problems threat-ening communities and industrial facilities in Canadaand Russia are discussed in the following sections.Coastal erosion is discussed in detail in section 6.9.
16.4.3.1. Severe erosion in Tuktoyaktuk, Canada
Tuktoyaktuk is the major port in the western CanadianArctic and the only permanent settlement on the low-lying Beaufort Sea coast.The location of Tuktoyaktukmakes it highly vulnerable to increased coastal erosiondue to decreased extent and duration of sea ice, acceler-ated thawing of permafrost, and sea-level rise.The Tuk-toyaktuk Peninsula is characterized by sandy spits, barri-er islands, and a series of lakes that have resulted fromcollapsed ground due to permafrost thawing (“thermo-karst” lakes). Erosion is already a serious problem in andaround Tuktoyaktuk, threatening cultural and archeologi-cal sites and causing the abandonment of an elementaryschool, housing, and other buildings. Successive shore-line protection structures have been rapidly destroyed bystorm surges and accompanying waves.
As climate change proceeds and sea-level rise acceler-ates, impacts are likely to include further landwardretreat of the coast, erosion of islands, more frequentflooding of low-lying areas, and breaching of fresh-water thermokarst lakes and their consequent conver-sion into brackish or saline lagoons.The current highrates of cliff erosion are projected to increase due tohigher sea levels, increased thawing of permafrost, andthe increased potential for severe coastal storms duringthe extended open-water season. Attempts to controlerosion at Tuktoyaktuk will become increasingly expen-sive as the surrounding coastline continues to retreat,and the site could ultimately become uninhabitable.
16.4.3.2. Erosion threatens Russian oil storagefacility
The oil storage facility at Varandei on the Pechora Seawas built on a barrier island. Damage to the dunes andbeach due to construction and use of the facility accel-erated natural rates of coastal erosion.The Pechora Seacoasts are considered to be relatively stable, exceptwhere disturbed by human activity. Because this site hasbeen perturbed, it is more vulnerable to damage fromstorm surges and the accompanying waves that willbecome a growing problem as climate continues towarm. As with the other sites discussed here, the reduc-tion in sea-ice extent and duration, thawing coastalpermafrost, and rising sea level are projected to exacer-bate the existing erosion problem.This provides anexample of the potential for combined impacts of cli-mate change and other anthropogenic disturbances.Sites already threatened due to human activity are oftenmore vulnerable to the impacts of climate change.
16.4.4. Summary
In areas of continuous permafrost, projected climatechange is not likely to pose an immediate threat toinfrastructure if the correct permafrost engineeringdesign procedures have been followed; the infrastruc-ture has not already been subjected to one of the fac-tors mentioned at the beginning of this section orstrains exceeding design values; and the infrastructureis not located on ice-rich terrain or along coastlinessusceptible to erosion. Maintenance costs are likely toincrease relative to those at present, but it should bepossible to gradually adjust arctic infrastructure(through replacement and changing design approachesover time) to a warmer climate.
Projected climate change is very likely to have a seri-ous effect on existing infrastructure in areas of discon-tinuous permafrost. Permafrost in these areas is alreadyat temperatures close to thawing, and further tempera-ture increases are very likely to result in extremelyserious impacts on infrastructure. However, consider-able engineering experience with discontinuouspermafrost has been accumulated over the past centu-ry. Human activities and engineering construction veryoften lead to extensive thawing of both continuous anddiscontinuous permafrost.Techniques to addresswarming and thawing are already commonly used inNorth America and Scandinavia.
If the projections and trends presented in this assess-ment do occur over the next five to ten years, this isvery likely to have a serious impact on the future designof engineering structures in permafrost areas. However,engineering design should still be based on actual mete-orological observations and a risk-based method.
The most important engineering considerations relatedto projected climate change include: that risk-basedmethods should be used to evaluate projects in terms

Chapter 16 • Infrastructure: Buildings, Support Systems, and Industrial Facilities 941
of potential climate change impacts; that design airthawing and freezing indices should be updated annual-ly to account for observed climate variations andchange; and that mitigation techniques such as artificialcooling of foundation soils should be considered as sit-uations require.
In coastal areas, shore protection measures have tosome extent reduced local erosion rates. However,thawing and erosion of ice-rich coastal sediments is aprocess that has been ongoing since the last glaciationand cannot be reversed given present climate trends.
16.5. Gaps in knowledge and researchneedsThe main gaps in knowledge are the lack of site-specif-ic scenarios providing the probability of occurrence ofvarious meteorological conditions (temperature, pre-cipitation, wind, snow and sea-ice thickness andextent, waves, and erosion rates). Monitoring of infra-structure and the coastal environment is essential, asare climate sensitivity analyses.
It is also important to combine engineering knowledgewith socioeconomic development scenarios and envi-ronmental impact assessments (see Chapters 3, 12, and15) to evaluate how projected climate change mayaffect human lives in the Arctic in the future. Studiesexamining impacts and socioeconomic assessmentshave been performed in Canada (Couture et al., 2001).Studies are also underway for other regions of theArctic, including Alaska (University of Alaska, Instituteof Social and Economic Research) and northwestRussia (Centre for Economic Analysis, Oslo; Norwe-gian Institute of International Affairs, Oslo; and theFridtjof Nansen Institute, Bergen).
References Alekseev, G.V., Z.V. Bulatov,V.F. Zakharov and V.P. Ivanov, 1997.
Influx of very warm water in the Arctic basin. Doklady AkademiiNauk SSSR, 356:401–403.
Aleksandrov,Ye.I. and V.V. Maistrova, 1998. Comparison of the airtemperature measurements for the polar regions.The Antarctica,34:60–72.
AMAP, 1997. Arctic Pollution Issues: A State of the ArcticEnvironment. Arctic Monitoring and Assessment Programme,Oslo, 188pp.
AMAP, 1998. AMAP Assessment Report: Arctic Pollution Issues.Arctic Monitoring and Assessment Programme, Oslo, xii+859pp.
Andersland, O.B. and D.M. Anderson, 1978. GeotechnicalEngineering for Cold Regions. McGraw-Hill.
Andersland, O.B. and B. Ladanyi, 1994. An Introduction to FrozenGround Engineering. Chapman & Hall, 352pp.
Andrady, A.L., 1997.Wavelength sensitivity in polymer photo-degradation. Advances in Polymer Science, 128:49–94.
Andrady, A.L., S.H Hamid, X. Hu and A.Torikai, 1998. Effects ofincreased solar ultraviolet radiation on materials. Journal ofPhotochemistry and Photobiology B, 46:96–103.
Anisimov, O.A., 1999. Impacts of anthropogenic climate change onheating and air conditioning of buildings. Meteorology andHydrology, 6:10–17. (In Russian)
Anisimov, O.A. 2001. Predicting patterns of near-surface air tempera-ture using empirical data. Climatic Change, 50:297–315.
Anisimov, O.A. and M.A. Belolutskaia, 2002. Effects of changing cli-mate and degradation of permafrost on infrastructure in northernRussia. Meteorology and Hydrology, 9:15–22. (In Russian)
Anisimov, O.A. and B. Fitzharris, 2001. Polar Regions (Arctic andAntarctic). In: J. McCarthy, O. Canziani, N.A. Leary, D.J. Dokkenand K.S.White (eds.). Climate Change 2001: Impacts, Adaptation,and Vulnerability, pp. 801–841. Contribution of Working Group IIto the Third Assessment Report of the Intergovernmental Panel onClimate Change. Cambridge University Press.
Anisimov, O.A., N.I. Shiklomanov and F.E. Nelson, 1997. Effects ofglobal warming on permafrost and active-layer thickness: resultsfrom transient general circulation models. Global and PlanetaryChange, 61:61–77.
Aylsworth, J.M, M.M. Burgess, D.T. Desrochers, A. Duk-Rodkin,T. Robertson and J.A. Traynor, 2000. Surficial geology, subsurfacematerials, and thaw sensitivity of sediments. In: L.D. Dyke andG.R. Brooks (eds.). The Physical Environment of the MackenzieValley, Northwest Territories: a Baseline for the Assessment ofEnvironmental Change. Geological Survey of Canada Bulletin,547:41–47.
Bjerrum, L., 1955. Stability of natural slopes in quick clay.Geotechnique, 5(1):101–119.
Borzenkova, I.I., 1999a. Environmental indicators of recent globalwarming. In:Yu.A. Pykh (ed.). Environmental Indices, pp.455–465. EOLSS Publishing.
Borzenkova, I.I., 1999b. About natural indicators of the present globalwarming. Meteorology and Hydrology, 6:98–116.
Brown, J., O.J. Ferrians, J.A. Heginbottom and E.S. Melnikov, 1997.International Permafrost Association Circum-Arctic Map ofPermafrost and Ground Ice Conditions. Circum-Pacific map series,CP-45. U.S. Geological Survey.
Brown, J., K.M. Hinkel and F.E. Nelson, 2000.The circumpolar activelayer (CALM) program: research designs and initial results. PolarGeography, 24:163–258.
Brown, J., M.T. Jorgenson, O.P. Smith and W. Lee, 2003. Long-termrates of erosion and carbon input, Elson Lagoon, Barrow, Alaska.In: M. Phillips, S.M. Springman and L.U. Arenson (eds.).Permafrost: Proceedings of the Eighth International Conference onPermafrost, pp. 101–106. A.A. Balkema.
Burgess, M.M. and S.L. Smith, 2003. 17 years of thaw penetration andsurface settlement observations in permafrost terrain along theNorman Wells pipeline, Northwest Territories, Canada. In: M.Phillips, S.M. Springman and L.U. Arenson (eds.). Permafrost:Proceedings of the Eighth International Conference on Permafrost,pp. 1073–1078. A.A. Balkema.
Burgess, M.M., D.T. Desrochers and R. Saunders, 2000a. Potentialchanges in thaw depth and thaw settlement for three locations inthe Mackenzie Valley. In: L.D. Dyke and G.R. Brooks (eds.).ThePhysical Environment of the Mackenzie Valley, NorthwestTerritories: a Baseline for the Assessment of EnvironmentalChange. Geological Survey of Canada Bulletin, 547:187–195.
Burgess, M.M., S.L. Smith, J. Brown,V. Romanovsky and K. Hinkel,2000b. Global terrestrial network for permafrost (GTNet-P):Permafrost monitoring contributing to global climate observations.Geological Survey of Canada, Current Research 2000-E14, 8pp.
Bush, E., D.A. Etkin, D. Hayley, E. Hivon, B. Ladanyi, B. Lavender,G. Paoli, D. Riseborough, J. Smith, and M. Smith, 1998. ClimateChange Impacts on Permafrost Engineering Design. EnvironmentCanada, Environmental Adaptation Research Group, Downsview,Ontario.
Carmack, E.C., 2000. Review of the Arctic Ocean’s freshwater budg-et: sources, storage and export. In: E.L. Lewis, E.P. Jones, P.Lemke,T.D. Prowse and P.Wadhams (eds.).The Freshwater Budgetof the Arctic Ocean. Kluwer Academic Publishers.
Carmack, E.C., R.W. Macdonald, F.A. Perkin, F.A. McLaughlin andR.J. Pearson, 1995. Evidence for warming of Atlantic water inthe southern Canadian basin of the Arctic Ocean: Results fromthe Larsen-93 Exhibition. Geophysical Research Letters,22:1061–1064.
Chapman,W.L. and J.E.Walsh, 2003. Observed climate change in theArctic, updated from Chapman and Walsh, 1993. Recent variationsof sea ice and air temperatures in high latitudes. Bulletin of theAmerican Meteorological Society, 74(1):33–47.http://arctic.atmos.uiuc.edu/CLIMATESUMMARY/2003/
Couture, R., S.D. Robinson and M.M. Burgess, 2001. Climatechange, permafrost degradation and impacts on infrastructure:two cases studies in the Mackenzie Valley. Proceedings of the 54thCanadian Geotechnical Conference, 4–9 September 2001,Calgary, 2:908–915.
Couture, R., S. Smith, S.D. Robinson, M.M. Burgess and S. Solomon,2003. On the hazards to infrastructure in the Canadian North asso-ciated with thawing of permafrost. In: Proceedings of Geohazards2003.Third Canadian Conference on Geotechnique and NaturalHazards, pp. 97–104.
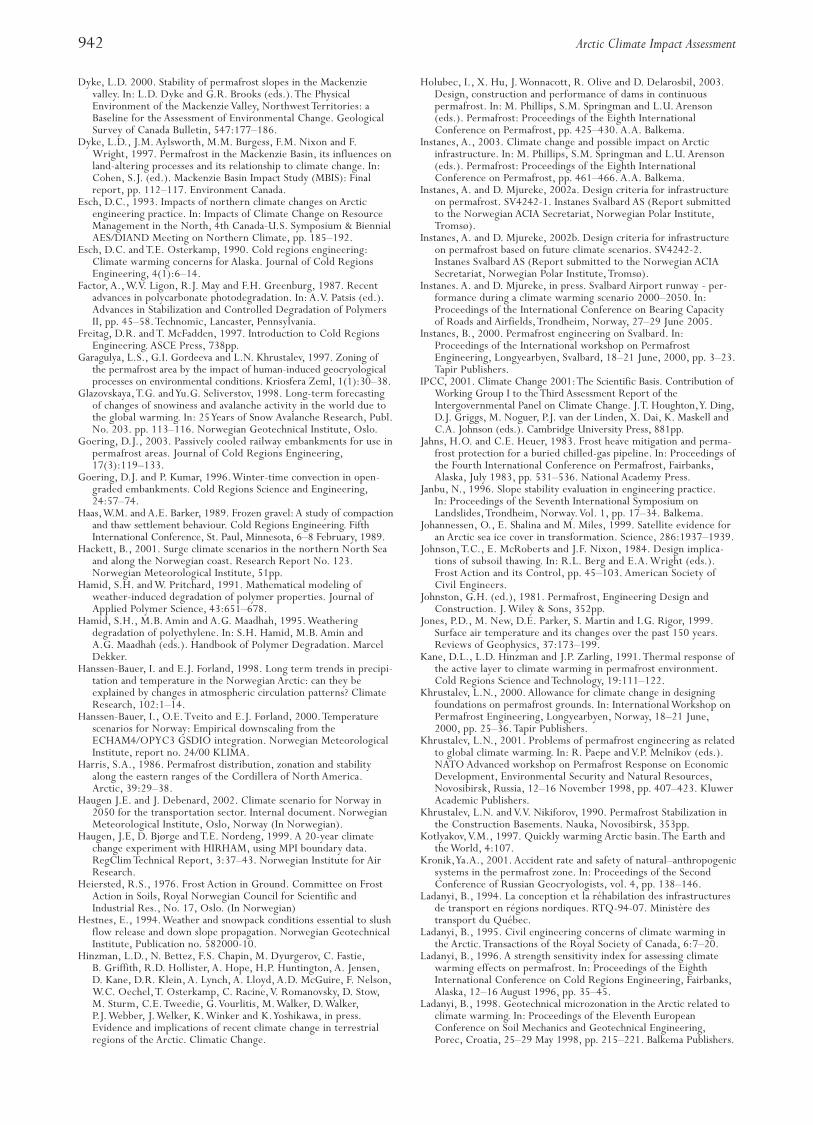
942 Arctic Climate Impact Assessment
Dyke, L.D. 2000. Stability of permafrost slopes in the Mackenzie valley. In: L.D. Dyke and G.R. Brooks (eds.).The PhysicalEnvironment of the Mackenzie Valley, Northwest Territories: aBaseline for the Assessment of Environmental Change. GeologicalSurvey of Canada Bulletin, 547:177–186.
Dyke, L.D., J.M. Aylsworth, M.M. Burgess, F.M. Nixon and F.Wright, 1997. Permafrost in the Mackenzie Basin, its influences onland-altering processes and its relationship to climate change. In:Cohen, S.J. (ed.). Mackenzie Basin Impact Study (MBIS): Finalreport, pp. 112–117. Environment Canada.
Esch, D.C., 1993. Impacts of northern climate changes on Arctic engineering practice. In: Impacts of Climate Change on ResourceManagement in the North, 4th Canada-U.S. Symposium & BiennialAES/DIAND Meeting on Northern Climate, pp. 185–192.
Esch, D.C. and T.E. Osterkamp, 1990. Cold regions engineering:Climate warming concerns for Alaska. Journal of Cold RegionsEngineering, 4(1):6–14.
Factor, A.,W.V. Ligon, R.J. May and F.H. Greenburg, 1987. Recentadvances in polycarbonate photodegradation. In: A.V. Patsis (ed.).Advances in Stabilization and Controlled Degradation of PolymersII, pp. 45–58.Technomic, Lancaster, Pennsylvania.
Freitag, D.R. and T. McFadden, 1997. Introduction to Cold RegionsEngineering. ASCE Press, 738pp.
Garagulya, L.S., G.I. Gordeeva and L.N. Khrustalev, 1997. Zoning ofthe permafrost area by the impact of human-induced geocryologicalprocesses on environmental conditions. Kriosfera Zeml, 1(1):30–38.
Glazovskaya,T.G. and Yu.G. Seliverstov, 1998. Long-term forecastingof changes of snowiness and avalanche activity in the world due tothe global warming. In: 25 Years of Snow Avalanche Research, Publ.No. 203. pp. 113–116. Norwegian Geotechnical Institute, Oslo.
Goering, D.J., 2003. Passively cooled railway embankments for use inpermafrost areas. Journal of Cold Regions Engineering,17(3):119–133.
Goering, D.J. and P. Kumar, 1996.Winter-time convection in open-graded embankments. Cold Regions Science and Engineering,24:57–74.
Haas,W.M. and A.E. Barker, 1989. Frozen gravel: A study of compactionand thaw settlement behaviour. Cold Regions Engineering. FifthInternational Conference, St. Paul, Minnesota, 6–8 February, 1989.
Hackett, B., 2001. Surge climate scenarios in the northern North Seaand along the Norwegian coast. Research Report No. 123.Norwegian Meteorological Institute, 51pp.
Hamid, S.H. and W. Pritchard, 1991. Mathematical modeling ofweather-induced degradation of polymer properties. Journal ofApplied Polymer Science, 43:651–678.
Hamid, S.H., M.B. Amin and A.G. Maadhah, 1995.Weathering degradation of polyethylene. In: S.H. Hamid, M.B. Amin and A.G. Maadhah (eds.). Handbook of Polymer Degradation. MarcelDekker.
Hanssen-Bauer, I. and E.J. Forland, 1998. Long term trends in precipi-tation and temperature in the Norwegian Arctic: can they beexplained by changes in atmospheric circulation patterns? ClimateResearch, 102:1–14.
Hanssen-Bauer, I., O.E.Tveito and E.J. Førland, 2000.Temperaturescenarios for Norway: Empirical downscaling from theECHAM4/OPYC3 GSDIO integration. Norwegian MeteorologicalInstitute, report no. 24/00 KLIMA.
Harris, S.A., 1986. Permafrost distribution, zonation and stabilityalong the eastern ranges of the Cordillera of North America.Arctic, 39:29–38.
Haugen J.E. and J. Debenard, 2002. Climate scenario for Norway in2050 for the transportation sector. Internal document. NorwegianMeteorological Institute, Oslo, Norway (In Norwegian).
Haugen, J.E, D. Bjørge and T.E. Nordeng, 1999. A 20-year climatechange experiment with HIRHAM, using MPI boundary data.RegClim Technical Report, 3:37–43. Norwegian Institute for AirResearch.
Heiersted, R.S., 1976. Frost Action in Ground. Committee on FrostAction in Soils, Royal Norwegian Council for Scientific andIndustrial Res., No. 17, Oslo. (In Norwegian)
Hestnes, E., 1994.Weather and snowpack conditions essential to slushflow release and down slope propagation. Norwegian GeotechnicalInstitute, Publication no. 582000-10.
Hinzman, L.D., N. Bettez, F.S. Chapin, M. Dyurgerov, C. Fastie,B. Griffith, R.D. Hollister, A. Hope, H.P. Huntington, A. Jensen,D. Kane, D.R. Klein, A. Lynch, A. Lloyd, A.D. McGuire, F. Nelson,W.C. Oechel,T. Osterkamp, C. Racine,V. Romanovsky, D. Stow,M. Sturm, C.E.Tweedie, G.Vourlitis, M.Walker, D.Walker,P.J.Webber, J.Welker, K.Winker and K.Yoshikawa, in press.Evidence and implications of recent climate change in terrestrialregions of the Arctic. Climatic Change.
Holubec, I., X. Hu, J.Wonnacott, R. Olive and D. Delarosbil, 2003.Design, construction and performance of dams in continuouspermafrost. In: M. Phillips, S.M. Springman and L.U. Arenson(eds.). Permafrost: Proceedings of the Eighth InternationalConference on Permafrost, pp. 425–430. A.A. Balkema.
Instanes, A., 2003. Climate change and possible impact on Arcticinfrastructure. In: M. Phillips, S.M. Springman and L.U. Arenson(eds.). Permafrost: Proceedings of the Eighth InternationalConference on Permafrost, pp. 461–466. A.A. Balkema.
Instanes, A. and D. Mjureke, 2002a. Design criteria for infrastructureon permafrost. SV4242-1. Instanes Svalbard AS (Report submittedto the Norwegian ACIA Secretariat, Norwegian Polar Institute,Tromsø).
Instanes, A. and D. Mjureke, 2002b. Design criteria for infrastructureon permafrost based on future climate scenarios. SV4242-2.Instanes Svalbard AS (Report submitted to the Norwegian ACIASecretariat, Norwegian Polar Institute,Tromsø).
Instanes. A. and D. Mjureke, in press. Svalbard Airport runway - per-formance during a climate warming scenario 2000–2050. In:Proceedings of the International Conference on Bearing Capacityof Roads and Airfields,Trondheim, Norway, 27–29 June 2005.
Instanes, B., 2000. Permafrost engineering on Svalbard. In:Proceedings of the International workshop on PermafrostEngineering, Longyearbyen, Svalbard, 18–21 June, 2000, pp. 3–23.Tapir Publishers.
IPCC, 2001. Climate Change 2001:The Scientific Basis. Contribution ofWorking Group I to the Third Assessment Report of theIntergovernmental Panel on Climate Change. J.T. Houghton,Y. Ding,D.J. Griggs, M. Noguer, P.J. van der Linden, X. Dai, K. Maskell andC.A. Johnson (eds.). Cambridge University Press, 881pp.
Jahns, H.O. and C.E. Heuer, 1983. Frost heave mitigation and perma-frost protection for a buried chilled-gas pipeline. In: Proceedings ofthe Fourth International Conference on Permafrost, Fairbanks,Alaska, July 1983, pp. 531–536. National Academy Press.
Janbu, N., 1996. Slope stability evaluation in engineering practice.In: Proceedings of the Seventh International Symposium onLandslides,Trondheim, Norway.Vol. 1, pp. 17–34. Balkema.
Johannessen, O., E. Shalina and M. Miles, 1999. Satellite evidence foran Arctic sea ice cover in transformation. Science, 286:1937–1939.
Johnson, T.C., E. McRoberts and J.F. Nixon, 1984. Design implica-tions of subsoil thawing. In: R.L. Berg and E.A. Wright (eds.).Frost Action and its Control, pp. 45–103. American Society ofCivil Engineers.
Johnston, G.H. (ed.), 1981. Permafrost, Engineering Design andConstruction. J.Wiley & Sons, 352pp.
Jones, P.D., M. New, D.E. Parker, S. Martin and I.G. Rigor, 1999.Surface air temperature and its changes over the past 150 years.Reviews of Geophysics, 37:173–199.
Kane, D.L., L.D. Hinzman and J.P. Zarling, 1991.Thermal response ofthe active layer to climate warming in permafrost environment.Cold Regions Science and Technology, 19:111–122.
Khrustalev, L.N., 2000. Allowance for climate change in designingfoundations on permafrost grounds. In: International Workshop onPermafrost Engineering, Longyearbyen, Norway, 18–21 June,2000, pp. 25–36.Tapir Publishers.
Khrustalev, L.N., 2001. Problems of permafrost engineering as relatedto global climate warming. In: R. Paepe and V.P. Melnikov (eds.).NATO Advanced workshop on Permafrost Response on EconomicDevelopment, Environmental Security and Natural Resources,Novosibirsk, Russia, 12–16 November 1998, pp. 407–423. KluwerAcademic Publishers.
Khrustalev, L.N. and V.V. Nikiforov, 1990. Permafrost Stabilization inthe Construction Basements. Nauka, Novosibirsk, 353pp.
Kotlyakov,V.M., 1997. Quickly warming Arctic basin.The Earth andthe World, 4:107.
Kronik,Ya.A., 2001. Accident rate and safety of natural–anthropogenicsystems in the permafrost zone. In: Proceedings of the SecondConference of Russian Geocryologists, vol. 4, pp. 138–146.
Ladanyi, B., 1994. La conception et la réhabilation des infrastructuresde transport en régions nordiques. RTQ-94-07. Ministère destransport du Québec.
Ladanyi, B., 1995. Civil engineering concerns of climate warming inthe Arctic.Transactions of the Royal Society of Canada, 6:7–20.
Ladanyi, B., 1996. A strength sensitivity index for assessing climatewarming effects on permafrost. In: Proceedings of the EighthInternational Conference on Cold Regions Engineering, Fairbanks,Alaska, 12–16 August 1996, pp. 35–45.
Ladanyi, B., 1998. Geotechnical microzonation in the Arctic related toclimate warming. In: Proceedings of the Eleventh EuropeanConference on Soil Mechanics and Geotechnical Engineering,Porec, Croatia, 25–29 May 1998, pp. 215–221. Balkema Publishers.

Chapter 16 • Infrastructure: Buildings, Support Systems, and Industrial Facilities 943
Ladanyi, B., M.W. Smith and D.W. Riseborough, 1996. Assessing theclimate warming effects on permafrost engineering. In: Proceed-ings of the 49th Canadian Geotechnical Conference of theCanadian Geotechnical Society, St. John’s, Newfoundland, 23–25September 1996, pp. 295–302.
Larsen, J.O., L. Grande, S. Matsuura, S. Asano,T. Okamoto and S.G. Park, 1999. Slide activity in quick clay related to pore waterpressure and weather parameters. In: Proceedings of the NinthInternational Conference and Field Trip on Landslides, pp. 81–88.
Leroueil, S., G. Dionne and M. Allard, 1990.Tassement et consolida-tion au dégel d’un silt argileux à Kangiqsualujjuak. Fifth CanadianPermafrost Conference, Collection Nordicana No. 54, pp.309–316. Laval University, Quebec.
Linell, K.A, 1973. Long-term effects of vegetative cover on permafroststability in an area of discontinuous permafrost. In: North Americancontribution, Second International Conference on Permafrost,Yakutsk, USSR, pp. 688–693. National Academy of Sciences.
Mader, F.W., 1992. Plastics waste management in Europe.Macromolecular Symposia, 57:15–31.
Maslanik, J.A., M.C. Serreze and R.G. Barry, 1996. Recent decreasesin Arctic summer ice cover and linkages to atmospheric circulationanomalies. Geophysical Research Letters, 23:1677–1680.
McPhee, M.G.,T.P. Stanton, J.H. Morison and D.G. Martinson, 1998.Freshening of the upper ocean in the Central Arctic: Is perennialsea ice disappearing? Geophysical Research Letters, 25:1729–1732.
McRoberts, E.C.,T.C. Law and E. Moniz, 1978.Thaw settlementstudies in the discontinuous permafrost zone. Proceedings of theThird International Conference on Permafrost, Edmonton, Alberta,pp. 700–706.
Nakayama,T.,T. Sone and M. Fukuda, 1993. Effects of climate warm-ing on the active layer. In: Proceedings of the Sixth InternationalConference on Permafrost, Beijing, pp. 488–493.
Nelson, F.E., O.A. Anisimov and N.I. Shiklomanov, 2002. Climatechange and hazard zonation in the circum-Arctic permafrostregions. Natural Hazards, 26(3):203–225.
Nelson, R.A., U. Luscher, R.W. Rooney and A.A. Stramler, 1983.Thaw strain data and thaw settlement predictions for Alaskan silts.In: Proceedings of the Fourth International Conference on Perma-frost, Fairbanks, Alaska, pp. 912–917. National Academy Press.
Nixon, J.F., 1990a. Effect of climate warming on pile creep in perma-frost. Journal of Cold Regions Engineering, ASCE, 4(1):67–73.
Nixon, J.F., 1990b. Seasonal and climate warming effects on pile creepin permafrost. In: Proceedings of the Fifth Canadian PermafrostConference, Québec, July, 1990, pp. 335–340.
Nixon, J.F., 1994. Climate Change as an Engineering DesignConsideration. Report prepared by Nixon Geotech Ltd. for theCanadian Climate Centre, Environment Canada, Downsview,Ontario, 11 pp.
Nixon, J.F., J. Stuchly and A.R. Pick, 1984. Design of Norman Wellspipeline for frost heave and thaw settlement. In: Proceedings of theThird International Offshore Mechanics and Arctic EngineeringSymposium, American Society of Mechanical Engineers, NewOrleans, Louisiana.
Nixon, J.F., N.A. Sortland and D.A. James, 1990. Geotechnicalaspects of northern gas pipeline design. Collection Nordicana No.54, Laval University, Québec, Canada, Proceedings of the FifthCanadian Permafrost Conference, pp. 299–307.
Osterkamp,T.E. and A.H. Lachenbruch, 1990.Thermal regime ofpermafrost in Alaska and predicted global warming. Journal of ColdRegions Engineering, 4(1):38–42.
Osterkamp,T.E. and V.E. Romanovsky, 1999. Evidence of warmingand thawing of discontinuous permafrost in Alaska. Permafrost andPeriglacial Processes, 10:17–37.
Oswell, J.M., A.J. Hanna and R.M. Doblanko, 1998. Update on theperformance of slopes on the Norman Wells Pipeline Project. In:Proceedings of the Seventh International Conference onPermafrost,Yellowknife, North West Territories.
Panova,Y.V., 2003. Permafrost processes inducing disastrous effects inengineering constructions, Medvezhje gas-field,Western Siberia.In: M. Phillips, S.M. Springman and L.U. Arenson (eds.).Permafrost: Proceedings of the Eighth International Conference onPermafrost, pp. 121–122. A.A. Balkema.
Parker,W.B., 2001. Effect of permafrost changes on economic develop-ment, environmental security and natural resource potential inAlaska. In: R.Paepe and V.P. Melnikov (eds.). NATO Advancedworkshop on permafrost response on economic development, envi-ronmental security and natural resources, Novosibirsk, Russia,12–16 November 1998. pp. 293–296. Kluwer Academic Publishers.
Parmuzin, S.Yu. and M.B. Chepurnov, 2001. Prediction of permafrostdynamics in the European North of Russia and Western Siberia in the21st century. Moscow University Geology Bulletin, no. 4. (In Russian)
Pavlov, A.V., 1997. Cryological and climatic monitoring of Russia:methodology, observation results, and prediction. KriospheraZemli, 1(1):47–58.
Phukan, A., 1985. Frozen Ground Engineering. Prentice-Hall Inc. 336pp.Rachold,V., J. Brown and S. Solomon (eds.), 2002. Arctic Coastal
Dynamics. Report of an International Workshop, Potsdam,Germany, 26–30 November 2001. Reports on Polar Research 413,103pp.
Rachold,V., J. Brown, S. Solomon and J.L. Sollid (eds.), 2003. ArcticCoastal Dynamics - Report of the Third International Workshop.Oslo, 2–5 December 2002. Reports on Polar and Marine Research443, 127pp.
Riseborough, D.W., 1990. Soil latent heat as a filter of the climate sig-nal in permafrost. Collection Nordicana No. 54, Laval University,Québec, Proceedings of the Fifth Canadian Permafrost Conference,pp. 199–205.
Sandersen, F., S. Bakkehøi, E. Hestnes and K. Lied, 1996.The influ-ence of meteorological factors on the initiation of debris flows,rockslides and rockmass stability. In: Proceedings of the SeventhInternational Symposium on Landslides,Trondheim, Norway, pp.97–114. Balkema.
Sayles, F. H. 1984. Design and performance of water-retaining embank-ments in permafrost. In: North American Contribution, SecondInternational Conference on Permafrost, Fairbanks, Alaska, July17–22 1983. Final Proceedings, pp. 31–42. National Academy Press.
Sayles, F.H. 1987. Embankment dams on permafrost: design and per-formance summary. US Army Cold Regions Research EngineeringLaboratory, Special Report 87–11.
Seinova, I., 1991. Past and present changes of mudflow intensity in theCentral Caucasus. Mountain Research and Development, 11(1):13–17.
Seinova, I. and N. Dandara, 1992. Hydro-technical arrangements forecologically rational protection of the debris flow hazard.Internationales Symposium Interpraevent 1992 - Bern,Tagungspublikation, Band 3, pp. 315–326.
Serreze, M.C., J.E.Walsh, F.S. Chapin III,T.E. Osterkamp,V. Dyurgerov and D.M. Smith, 2000. Recent increase in the lengthof the melt season of perennial Arctic sea ice. Geophysical ResearchLetters, 25:655–658.
Shiklomanov, A.I., R.B. Lammers and C.J.Vorosmarty, 2002.Contemporary changes in Eurasian pan-Arctic river discharge.American Geophysical Union 83[47]. American Geophysical UnionMeeting, 6–10 December 2002, San Francisco.
Sidorova,T., N. Belaya and V. Perov, 2001. Distribution of slushflows innorthern Europe and their potential change due to global warming.Annals of Glaciology, 32:237–240.
Smith, M.W. and D.W. Riseborough, 1983. Permafrost sensitivity toclimate change. In: Proceedings of the Fourth InternationalConference on Permafrost, Fairbanks, Alaska, pp. 1178–1183.National Academy Press.
Smith, M.W. and D.W. Riseborough, 1985.The sensitivity of thermalpredictions to assumptions in soil properties. Proceedings of theFourth International Conference on Ground Freezing, Sapporo,Japan,Vol. I, pp. 17–23. Balkema.
Smith, O.P. and G. Levasseur, 2002. Impact of climate change ontransportation infrastructures in Alaska. Discussion paper.Department of Transportation Workshop, 1–2 October, 2002,Washington D.C. 11pp.
Smith, S.L. and M.M Burgess, 1998. Mapping the response of perma-frost in Canada to climate warming. Current Research 1998-E,Geological Survey of Canada, pp. 163–171.
Smith, S.L. and M.M. Burgess, 1999.Mapping the sensitivity ofCanadian permafrost to climate warming. In: M.Tranter, R.Armstrong, E. Brun, G. Jones, M. Sharp and M.Williams (eds.).Interactions between the Cryosphere, Climate and GreenhouseGases, pp. 71–80. IAHS Publication No. 256.
Smith, S.L. and M.M. Burgess, 2004. Sensitivity of Permafrost toClimate Warming in Canada. Geological Survey of Canada Bulletin579, 24 pp.
Smith, S.L., M.M. Burgess and J.A. Heginbottom, 2001. Permafrostin Canada, a challenge to northern development. In: G.R. Brooks(ed.). A Synthesis of Geological Hazards in Canada. GeologicalSurvey of Canada Bulletin 548, pp. 241–264.
Sorensen, S., J. Smith and J. Zarling, 2003.Thermal performance ofTAPS heat pipes with non-condensable gas blockage. In: M.Phillips, S.M. Springman and L.U. Arenson (eds.). Permafrost:Proceedings of the Eighth International Conference on Permafrost,pp. 1097–1102. Balkema.
Speer,T.L., G.H.Watson and R.K. Rowley, 1973. Effects of groundice variability and resulting thaw settlements on buried warm oilpipelines. In: Proceedings of the Second International Conferenceon Permafrost,Yakutsk, Russia, pp. 746–752.
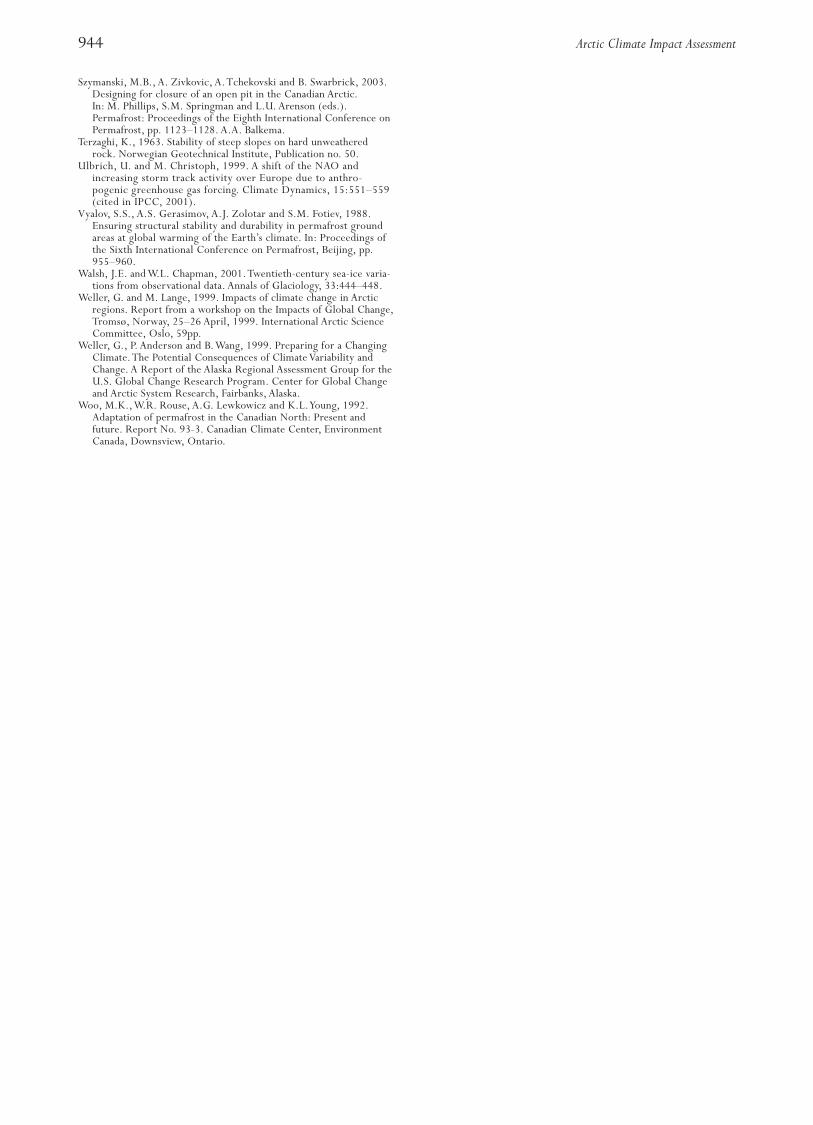
944 Arctic Climate Impact Assessment
Szymanski, M.B., A. Zivkovic, A.Tchekovski and B. Swarbrick, 2003.Designing for closure of an open pit in the Canadian Arctic.In: M. Phillips, S.M. Springman and L.U. Arenson (eds.).Permafrost: Proceedings of the Eighth International Conference onPermafrost, pp. 1123–1128. A.A. Balkema.
Terzaghi, K., 1963. Stability of steep slopes on hard unweatheredrock. Norwegian Geotechnical Institute, Publication no. 50.
Ulbrich, U. and M. Christoph, 1999. A shift of the NAO andincreasing storm track activity over Europe due to anthro-pogenic greenhouse gas forcing. Climate Dynamics, 15:551–559(cited in IPCC, 2001).
Vyalov, S.S., A.S. Gerasimov, A.J. Zolotar and S.M. Fotiev, 1988.Ensuring structural stability and durability in permafrost groundareas at global warming of the Earth’s climate. In: Proceedings ofthe Sixth International Conference on Permafrost, Beijing, pp.955–960.
Walsh, J.E. and W.L. Chapman, 2001.Twentieth-century sea-ice varia-tions from observational data. Annals of Glaciology, 33:444–448.
Weller, G. and M. Lange, 1999. Impacts of climate change in Arcticregions. Report from a workshop on the Impacts of Global Change,Tromsø, Norway, 25–26 April, 1999. International Arctic ScienceCommittee, Oslo, 59pp.
Weller, G., P. Anderson and B.Wang, 1999. Preparing for a ChangingClimate.The Potential Consequences of Climate Variability andChange. A Report of the Alaska Regional Assessment Group for theU.S. Global Change Research Program. Center for Global Changeand Arctic System Research, Fairbanks, Alaska.
Woo, M.K.,W.R. Rouse, A.G. Lewkowicz and K.L.Young, 1992.Adaptation of permafrost in the Canadian North: Present andfuture. Report No. 93-3. Canadian Climate Center, EnvironmentCanada, Downsview, Ontario.