ingredient branding - simple search207186/fulltext01.pdfkeywords: ingredient branding, consumer...
TRANSCRIPT

1
School of management and economics Master Thesis in International Marketing Strategy
Ingredient branding
- In high involvement and high cost product categories - Authors: Stefan Birgersson 791105 David Göransson 820605 Mikael Swärdh 820108
Examiner: Anders Pehrsson Tutor: Urban Ljungquist
2
Abstract Ingredient branding implies that a company incorporates an additional brand into their
product in order to increase consumer awareness. This has been proven to be successful in
certain product categories such as computers and food. These products can be seen as low
involvement and low cost products, since they are bought frequently and generally involves
low risk for the consumer. Ingredient branding has never been tested on product categories
that are categorised as high involvement and high cost, which is therefore the intention of this
thesis. By investigating consumers’ attitudes and perception of quality, towards
advertisements with and without ingredient brands, we conclude that ingredient branding does
not affect consumers in high involvement and high cost product categories, nor in a positive
or negative way.
Keywords: Ingredient branding, consumer behaviour, involvement, risk perception
3
Preface During this thesis we have realised that no matter how much experience one has regarding
how to conduct a study, problems will arise. Problems that occurred we overcame thanks to
our own experience and good tutoring. We would therefore like to thank, Urban Ljungquist at
the school of economics and management at Växjö University, for his great patience and help.
We would also like to thank Anders Pehrsson who has guided us thru this master course,
International Marketing Strategy.
While collecting our empirical data at both the University and in Växjö city, we were amazed
over how helpful people can be. Therefore, thanks to all anonymous respondents that
participated in our study.
Finally, this has been a great experience and an excellent finish for us when we now are
heading for the world outside the University. Pleasant reading.
Växjö 2006-05-29
Regards,
------------------------- ---------------------
Stefan Birgersson Mikael Swärdh
-----------------------
David Göransson

4
Summary Background Organisations have used brands and branding for more than a hundred
years. Today’s organisations however, are trying to renew the ways branding can be used as a strategy, by using branding in more diverse settings. One of them is ingredient branding which can be seen as a cooperative branding strategy, where one organisation incorporates the brand of another company into their products. Ingredient branding has received wide recognition among academics as well as practitioners. It has also proven to raise consumer attitudes and perceptions of quality towards products in certain product categories. However, it has never been tested in product categories that can be considered more as investments where the consumer gets highly involved in the purchase.
Objective Our objective is to see if the use of an ingredient brand can bring forth the
same positive effects on consumers’ attitudes, perceptions of quality and risk perception, in high cost and high involvement product categories, as in low involvement and low cost product categories. We also aim to explain our findings by turning towards consumer behaviour theory involving the consumer decision making process, level of involvement and perceived risks involved when conducting a purchase that is considered as high cost and high involvement.
Methodology The research methodology used in this thesis is to some extent a replica of
previous studies conducted within ingredient branding. We conducted a survey which was divided into two parts, the first was pictorial where advertisements were showed and the second part consisted of follow up questions. The survey was conducted among 100 respondents consisting of 50 students at Växjö University and 50 non-students at a shopping centre at the outskirts of Växjö.
Conclusion By using SPSS we can conclude that the use of ingredient brands within
high involvement and high cost product categories had no significant effect. It was only the perceived quality that showed a minor change, but this change was too minor to be considered considerable. We were also able to show that the salesperson is important within product categories concerned with high involvement and high cost; however consumers tend to follow their own feelings when going through with the purchase.
Limitations The research design used in this thesis could have been conducted in several
different manners. Therefore we can not exclude the fact that our conclusion might be a result of the research design and that different results might have been found if we had we used a different research design.
Future research Writing this thesis we have gained insights on how several aspects of our
study could have been conducted differently. We recommend that a similar study should be conducted again, this time with well known host brands and ingredient brands that focus on utilitarian needs from a consumer perspective. A more representing respondent group would also increase the arguments for generalisation among a wider population.

5
Table of content
Background ........................................................................................................................6
Problem discussion .............................................................................................................7
Problem formulation...........................................................................................................9
Purpose...............................................................................................................................9
Delimitations ......................................................................................................................9
Theoretical Framework.........................................................................................................10 Ingredient Branding ..........................................................................................................10
The decision making process ............................................................................................12
Involvement......................................................................................................................13
Perceived risk ...................................................................................................................16
Research design....................................................................................................................18 Research Design and Stimuli ............................................................................................18
Data collection method .....................................................................................................19
Data analysis ....................................................................................................................22
Validity ............................................................................................................................23
Reliability.........................................................................................................................24
Data collection .....................................................................................................................26 The effects of ingredient branding ....................................................................................26
Perceptions of risk ............................................................................................................29
Involvement......................................................................................................................30
Analysis ...............................................................................................................................34 Ingredient Branding ..........................................................................................................34
Decision Making Process..................................................................................................35
Involvement......................................................................................................................35
Perceived Risk..................................................................................................................37
Conclusion ...........................................................................................................................39 Limitations .......................................................................................................................40
Future Research................................................................................................................41
Reference list........................................................................................................................42 Appendix 1-7

6
Introduction Ingredient branding appeared in the 90’s as a complement to existing branding strategies. It implies that a company incorporates a second, well known, brand into their products in order to increase consumer awareness and brand equity. This introducing chapter will present what researchers, so far, have concluded on the subject and also where we found our theoretical blind spot that has led to our problem formulation.
Background Within the area of international marketing the issue of branding plays an important roll. The
use of brands and branding is not a new idea; in fact the use of branding is over 100 years old.
Today’s organisations are trying to renew this area by using branding in more diverse settings.
In the Journal of Marketing Management one definition of a brand is offered by Peter Doyle,
Professor of Warwick University: “A name, symbol, design or some combination which
identifies the product of a particular organisation as having a substantial, differential
advantage” (O’Malley 1991 as in Rooney 1995). A second definition is given by Albaum
(2002) who claims that a brand can be categorised as “anything that that identifies a seller’s
goods or services and distinguishes them from others”.
Cooperation among organisations has been discussed as a way of creating a competitive edge.
The reasons for cooperation can vary and include anything from finding a partner to share
expenses with, to the need for a certain competence that can not be located within the
organisation (Alter 1993). A successful example of this is the case of the microprocessor
manufacturer Intel and their campaign Intel inside. By building a strong brand name Intel
gained consumer awareness and as a result, computer manufacturers, for example IBM,
decided to use the Intel processor in their computers. IBM also makes sure that the consumers
are aware of the fact that their computers are using Intel processors by highlighting this in
advertisement campaigns and showing the Intel logo on their products. By using their Intel
Inside campaign, Intel has gone from being a part of the computer to becoming a reason for
why consumers purchase a certain computer. “Products that don't boast the presence of Intel
inside are bound to arouse suspicion among consumers. People will wonder, why don't they
use Intel chips? Are they using something cheaper, or not as good?"
(www.intangiblebusiness.com, 2006-04-05).
The above example of IBM and Intel is a form of cooperative branding strategy, referred to by
many authors as ingredient branding (Vaidyanathan and Aggarwal 2000, Uggla 2004, Desai
and Keller 2002). In the 1990´s the issue of ingredient branding appeared as a complement to

7
earlier studies on co-branding. Ingredient branding is a strategic choice that can create another
input of quality and give a competitive edge for companies. Ingredient branding implies that a
supplier that produces components or ingredients incorporates their product into a final
product that has been developed by another company. A further example, apart from IBM and
Intel, is the use of the well known ingredient Dolby in many stereos and receivers, developed
by other manufacturers, which are considered as host brands (www.eirepreneur.com 2006-04-
06). Positive effects have also been shown in a previous study by Vaidyanathan and Aggarwal
(2000), who proved their hypothesis that consumers’ attitudes towards a product will become
more positive if a well known brand is incorporated into a host brand. They also proved that
both perceived quality and brand equity was perceived as higher.
Problem discussion As can be seen from the above examples, prior research has mainly focused on ingredient
branding on products that have relatively low cost and a low consumer involvement. Another
popular example of ingredient branding, used in previous studies, is the case of NutraSweet
and Diet-Coke. To purchase a Diet-Coke the consumer will not have to put a lot of effort in
seeking information about the product and evaluate different alternatives in order to decide if
this is a sound purchase. To buy an IBM-computer on the other hand the consumer will
normally have to get more involved in the purchase as there are alternatives with different
features that might suit different users differently. A computer is also a product that is kept for
a longer period of time and hence consumers get more involved in their purchase. These
examples are often mentioned in prior research. The purchase of a Diet-Coke requires very
little consumer involvement and is of no financial risk for the consumer. A computer would
require more involvement and could perhaps constitute a financial risk but is according to us
not a product of high involvement and high cost. Examples of products that would fit in this
category would be considered more as investments, such as buying a house or a car. Solomon
et al (2002) claims that the consumers perceived risk increase as the price of a product
increases and also that there are several different risks that might affect the consumer
differently. When the perceived risk is high the consumer will tend to become more involved
in the purchase and the questions is whether ingredient branding will affect consumers in the
same way when they are purchasing products that require them to get highly involved.
When discussing ingredient branding researchers such as Vaidyanathan and Aggarwal (2000)
conclude that products with low cost and low involvement such as Coca-Cola and NutraSweet

8
have been found to be successful, since the consumers’ attitudes perceptions of quality
increases when an ingredient brand is added. These products are categorised as having low
cost, being bought frequently, require low consumer involvement, product classes and brands
are often familiar and little effort is required to make the purchase. Hence there are few and
small risks involved that the consumer needs to consider before and during the purchase
(Solomon et al 2002). Within the field of ingredient branding researchers have focused little
on products with a higher level of involvement and cost and the furthest extended example
seems to be the case of IBM and Intel which often appear in prior research.
Within the field of consumer behaviour, researchers make a distinction between buying a
product out of habit and on the other hand conducting more research before deciding to make
the purchase. The latter example is categorised as a high involvement process and could for
example be the purchase of a car. Purchases of this kind fall into the complex buyer behaviour
category (Engel 1995, Kotler 1997 as in Reed et al 2004). Purchases within this category are
seen as expensive, bought infrequently, perceived to be risky and also to be highly self
expressive. Within purchases of this kind the consumer will normally seek out the retailer or
sales person and a face-to-face interaction is normally required (Reed et al 2004). This raises
the question if ingredient branding would be as effective in this product category as in low
involvement categories? The consumer might pick up signals from, for example advertising,
that they find interesting and also motivational for a future purchase. However, despite this,
when the purchase/investment is being evaluated and alternatives are taken into consideration,
there is normally an increased need for a consultant/specialist that might affect the consumer’s
perceptions, concerning the product and its attributes (Solomon et al 2002). When the
perceived risk and the cost of the product increase, the consumer will often require the
expertise of a salesperson. When this interaction occurs, a level of trust is required in order to
reduce the amount of perceived risk and uncertainty (Mitchell 1999).
Since prior studies have shown a positive effect of ingredient branding within low
involvement and low cost products such as food and computers, it becomes relevant to
investigate if the same positive effects can be found when it involves high involvement and
high cost products, such as buying a house or a car.
9
Problem formulation What effects does ingredient branding have within high involvement and high cost product
categories?
Purpose The purpose is to investigate the effects of ingredient branding, by examining changes in
consumer attitudes and perceptions of quality towards advertisement with and without an
ingredient brand. The purpose is further to explain our finding by using theories on consumer
behaviour, as these theories state that consumers act differently when purchasing low
involvement and low cost products, compared to high involvement and high cost products.
Delimitations To further explain our specific choice of products for this thesis we refer to Reed et al (2004)
who claim that within the complex buyer behaviour category the relationship with the dealer
or salesperson is of great importance. Hence we are focusing on products that fall into this
category, where the consumer will require or normally seek out an intermediary to get better
knowledge about the product.
10
Theoretical Framework In this theoretical chapter we will first make a presentation of ingredient branding and explain what previous researchers have concluded on the subject. We follow up this discussion with theories on consumer behaviour since researchers mention that there is a difference in buying behaviour when it comes to products with high cost and high involvement and products with low cost and low involvement.
Ingredient Branding Ingredient branding, in which key attributes of one brand are incorporated into another brand
as ingredients, is becoming increasingly popular among marketers (Wright 1975, Keller and
Aaker 1990, Simonin and Ruth 1998, Keller 1998 as in Desai & Keller, 2002). In ingredient
branding there is no need for companies to jointly research or develop a new product, nor is
there a need to heavily invest in efforts to bring the organisations together when entering new
markets (Blackett and Boad 1999). Ingredient branding is more closely related to the brand
than the actual product that is incorporated and hence, not just any supplier from a particular
product category will do. Another important characteristic of ingredient branding is that both
partners rely on each other to get an awareness boast in order to attract more consumers, by
promoting the brands together.
When a company wishes to gain a competitive advantage there are multiple ways to proceed.
Ingredient branding does not include the introduction of a new product. Instead companies
add an ingredient to an existing product and the ingredient brand lends their reputation and
their value in order to increase the value of a host brand (Vaidyanathan & Aggarwal 2000).
Ingredient branding should modify the host brand to the better as a result from the value that
the ingredient brand adds to the host brand. The host brand therefore increases their own
brand equity by sending signals to the costumers that they are combining the quality of two
products instead of one. The result of ingredient branding is dependent on the importance of
the ingredient brand and the consumers associations to it (Desai & Keller 2002). It is therefore
important to notice that ingredient branding will not automatically imply success. By using
ingredient branding, two brands can present a better composite attribute profile for the
consumer by combining and using two complementary brands (Park, Jun & Shocker 1996 as
in Desai & Keller 2002). Hence, the result of ingredient branding is depending on the
consumers associations to both brands (Vaidyanathan & Aggarwal 2000). It is therefore of
great importance that the companies that use ingredient branding clearly makes sure that the

11
consumer understands the benefits that the ingredient brand is suppose to contribute to the
host brand. There could be problems for the company with the host brand to make the
ingredient brand tangible for the consumer. One could draw similarities to the offer of a
service where it is not always easy for the consumer to see the value when the new benefit is
something that he or she expects anyway (Moore 2003). Hence both brands must fit in order
to contribute value; otherwise the result of ingredient branding could be that both brands
suffer from dilution (Vaidyanathan & Aggarwal 2000).
In a previous study by Voss and Gammoh (2004) where a fake branded product was exposed
together with two well known brand/products the researchers found that consumers’ attitudes
and perceptions of quality increased when a second well known brand was added. The brands
where exposed as ingredients in an advertisement in two different ways. First, only the fake
branded product was shown alone and secondly the same product was shown with one of the
well known brands. The researchers found that the respondents evaluated the second
alternative higher when it came to attitudes and perceived quality of the product. Voss and
Gammoh (2004) hence proved that an unknown primary brand will receive higher quality and
better consumer attention when a well known brand is present. However, they could not
support the assumption that a second well known brand would increase the effect compared to
when only one well known brand was added. As a result they concluded that ingredient
branding was indeed effective, however more than one added brand would not increase the
effect further (Voss & Gammoh 2004).
In a similar study, Vaidyanathan and Aggarwal (2000) found support for their hypothesis that
the attitude towards a product would increase if a well known ingredient brand was added.
They also found supporting evidence that the perceived quality would increase when a
familiar ingredient brand was added and also that the well known ingredient brands reputation
or brand equity would not be affected negatively by association with an unfamiliar brand. In
their study Vaidyanathan and Aggarwal (2000) used an unfamiliar cereal manufacturer and
showed the participants a picture of the product and asked the respondents to evaluate the
products quality and also state what attitude they had towards the product. In a second
depiction, an identical cereal breakfast picture was shown with the difference that the logo of
a well known raisin manufacturer was added. The respondents were told that the cereal now
contained the raisins of this manufacturer and were asked to make the same evaluation as
earlier.

12
As seen from the examples above ingredient branding has been proven successful when it
comes to increasing consumers’ attitudes and perceptions of quality towards a product.
However, these investigations have been aimed at products with low cost and low consumer
involvement and hence little is known about how effective ingredient branding is in high cost,
high involvement products, such as buying a house or a car. This is the focus of this thesis and
in the next part of this theoretical chapter we aim to find out how consumers act and think
when it comes to purchasing products within this category.
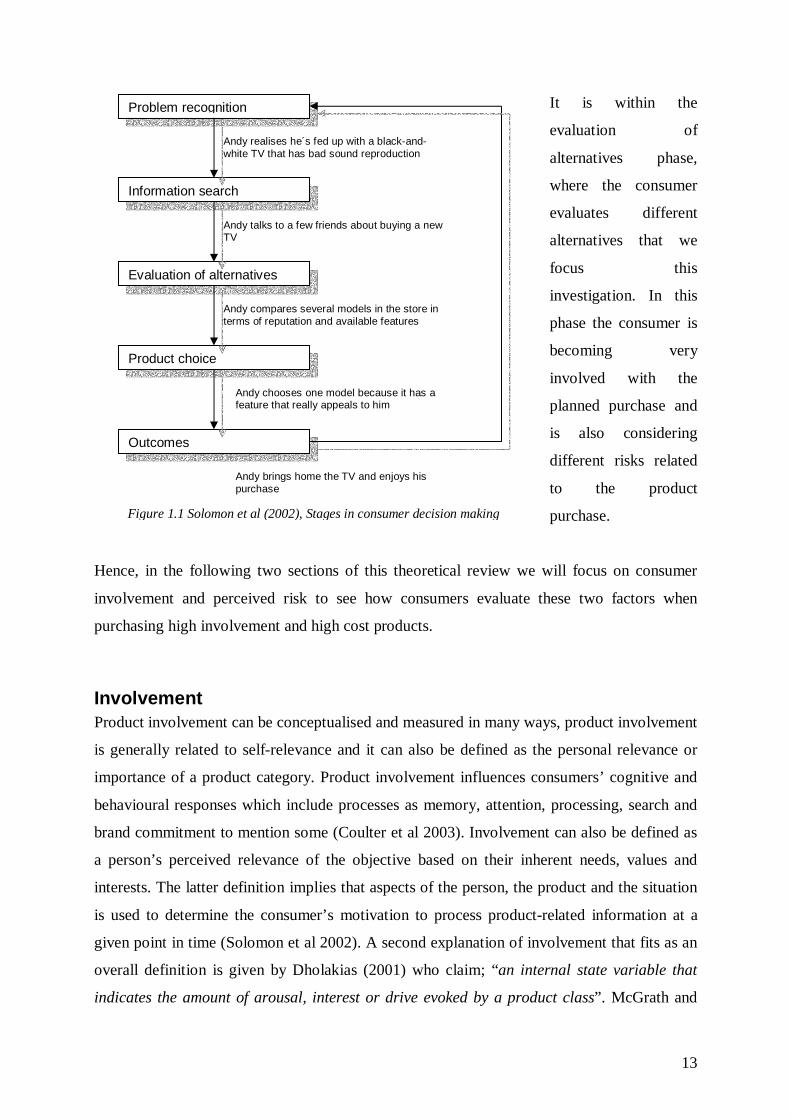
The decision making process The decision-making perspective within consumer behaviour implies that consumers go
through four different stages when making a purchase. The four stages consist of problem
recognition, information search, evaluation of alternatives and product choice (Solomon et al
2002). The decision making perspective implies that consumers engage in a problem solving
task when going through the four stages (Mowen 1988). When applying the decision making
perspective upon a consumer within consumer behaviour theories, decision making exists of
three related areas, environmental inputs, intervening response systems and behaviour.
Environmental inputs means that consumers use information inputs before making a decision,
this information can be verbal or written. It also includes tangible and economic benefits. The
intervening response system states that the consumers have a cognitive focus, process
information which could be either a high or a low involvement process. This behaviour is
often used when purchasing a utilitarian product or service (Mowen 1988).
The four stages within the decision making process described above by Solomon et al (2002)
are followed for some purchases, however the four stages are not applicable on all types of
decisions. If that was the case consumers would spend their whole life making up their mind
and not enjoying what they actually will buy or bought. However consumers tend to put a lot
of effort in the stage where they evaluate alternatives and when a choice must be made, the so
called evaluation of alternatives stage.
13
It is within the
evaluation of
alternatives phase,
where the consumer
evaluates different
alternatives that we
focus this
investigation. In this
phase the consumer is
becoming very
involved with the
planned purchase and
is also considering
different risks related
to the product
purchase.
Hence, in the following two sections of this theoretical review we will focus on consumer
involvement and perceived risk to see how consumers evaluate these two factors when
purchasing high involvement and high cost products.
Involvement Product involvement can be conceptualised and measured in many ways, product involvement
is generally related to self-relevance and it can also be defined as the personal relevance or
importance of a product category. Product involvement influences consumers’ cognitive and
behavioural responses which include processes as memory, attention, processing, search and
brand commitment to mention some (Coulter et al 2003). Involvement can also be defined as
a person’s perceived relevance of the objective based on their inherent needs, values and
interests. The latter definition implies that aspects of the person, the product and the situation
is used to determine the consumer’s motivation to process product-related information at a
given point in time (Solomon et al 2002). A second explanation of involvement that fits as an
overall definition is given by Dholakias (2001) who claim; “an internal state variable that
indicates the amount of arousal, interest or drive evoked by a product class”. McGrath and
Problem recognition
Information search
Evaluation of alternatives
Product choice
Outcomes
Andy realises he´s fed up with a black-and-white TV that has bad sound reproduction
Andy talks to a few friends about buying a new TV
Andy brings home the TV and enjoys his purchase
Andy compares several models in the store in terms of reputation and available features
Andy chooses one model because it has a feature that really appeals to him
Figure 1.1 Solomon et al (2002), Stages in consumer decision making

14
Mahood (2004) therefore discuss the relevance of involvement because it suggests that
consumers approach product purchase decisions very differently for different types of
products.
The type of information processing that will occur thus depends on the consumers’ level of
involvement. The level of involvement can range from simple processing, which means that
only basic features of a message are considered. On the contrary there is elaboration where
incoming information is linked to one’s pre-existing knowledge systems. When consumption
is made out of habit it is characterised by inertia, which means that the consumer lacks the
motivation to consider alternatives. Therefore the consumption is considered to be at the low
end of involvement. At the high end of involvement, consumers become almost passionate
about the product and look for objects that carry great meaning for the individual (Solomon et
al 2002). Dholakia (2001) uses two different perspectives to describe involvement, he
classifies them as:
1. Enduring involvement, which means that the consumer has an ongoing concern for
a product class, and has nothing to do with a specific purchase situation. Hence a
common/general interest for a product class, that has associations of a persons self
concept, values and ego.
2. Situational involvement refers to the raised level of involvement from a specific
purchase. Bloch and Richins (1983) as in Dholakia (2001) views it as “a temporary
perception of product importance based on the consumers desire to obtain
particular extrinsic goals, that may derive from the purchase or/and usage of the
product.
Previous research notes that the information processing procedures are likely to be different
depending upon the product type, and that there is a difference between consumers who have
a utilitarian need and consumers that have a hedonic need. For example, MacInnis and
Joworski (1989) point out that those consumers who have utilitarian needs about a particular
product type are more likely to pay more attention about the products attributes. On the
contrary a consumer with hedonic needs pays more attention to symbolic and experimental
value rather then the product attributes (Park and Moon 2003).

15
A product that is useful to solve a problem is attached to a high utilitarian value, hence
consumers who buy a product to satisfy a utilitarian need tend to behave in a cautious way
and are also characterised to be very efficiently oriented to the problem solving (Babin,
Darden & Griffin 1994; Engle, Blackwell & Miniard 1993 as in Park and Moon 2003). The
hedonic value of a product is decided based upon the ability to provide feelings, rather then to
solve a problem. Hence when buying a product to satisfy hedonic needs, consumers tend to be
more subjective (Babin et al 1994; Holbrook & Hirschman 1982 as in Park and Moon 2003).
However whether the product is utilitarian or hedonic is decided based upon the consumer’s
subjective judgement about the product and its intrinsic value. Since the consumer decides if a
product is of utilitarian or hedonic value, one sole product may include both characteristics
(Park and Moon 2003).
The conditions related to involvement generally involve perceived risk (financially, physically,
psycho-social or time-generated risk), the expression of one’s own personality or mood
(usually referred to as value-expressiveness or self concept), the perceived importance and the
hedonic value of the stimulus or object (McWilliam 1997). As a result involvement should be
evaluated as a multi-dimensional construct since a single dimension would appear inadequate
to capture the richness of the concept (Quester and Lim, 2003). Therefore Kapferer and
Laurent (1985b) claim that involvement should be analysed along five dimensions to get a
clear picture between a consumer and his or her relationship to a product category. The five
dimensions of involvement suggested by Kapferer and Laurent (1985b; 1993) are interest,
pleasure, sign, risk importance and risk probability. These five facets create the consumer
involvement profile (CIP). Interest within the CIP means the personal interest a person has in
a product category, its personal meaning or importance. Pleasure is the hedonic value of the
product, its ability to provide pleasure and enjoyment. Sign involves the sign value of the
product, the degree to which it expresses the person’s self. Risk importance consists of
importance of the potential negative consequences associated with a poor choice of the
product. The fifth and final facet is the Risk probability, which means the perceived
probability of making a poor choice. Depending on these five dimensions, consequences on
consumer behaviour, such as time spent on information search, the number of brands
examined and the attention paid on advertising messages, may differ between individuals with
respect to different product categories. By using the full profile of the dimensions one is able
to predict consequences of involvement. The profile may be used on any product class
(Kapferer and Laurent 1985b as in Quester and Lim 2003).
16
In the following theoretical chapter we will look closer at the subject of perceived risk. There
are different forms of perceived risk and we aim to find out what risks are being perceived
highest by consumers purchasing high involvement and high cost products.
Perceived risk Perceived risk receives attention from both practitioners and academics and has been applied
in a wide range of research areas, such as banking and dental services (Farquhar 1994, Grewal
et al 1994, Alden et al 1994, Coleman et al 1994, Ho and Viktor 1994 as in Mitchell 1999). It
has appealed to researchers and practitioners since it can be used to facilitate marketers to see
the world through the eyes of the consumer, it can also be universally applied (Mitchell 1999).
Perceived risk has been used to explain consumers’ behaviour, since consumers are often
more inclined to avoid mistakes and uncertainty than to secure a high utility when making a
purchase. It can also be used to analyse brand-image development, targeting, positioning and
segmentation (Mitchell 1999).
As a rule, purchase decisions that involve extensive information search also entail some kind
of perceived risk. The consumer may believe that the product in question can bring negative
consequences. The perceived risk is often higher when it concerns products that are expensive,
complex or difficult to understand (Solomon et al 2002). Solomon et al (2002) mentions five
different types of risk, both objective and subjective. These risks are monetary risk, functional
risk, physical risk, social risk and psychological risk. In general the higher value, more
complicated and more involving products are, the riskier they become in the eye of the
consumer. With durable experience goods that are normally expensive, financial risk is
considered to be highest, whereas in highly usable goods like clothes, the psychological risk
was considered to be highest (Mitchell 1999). Solomon et al (2002) claim that the monetary
risk involve purchases of high-price items that require substantial expenditures. When the
risk/uncertainty is high the consumer will always be inclined to reduce the risk involved with
the purchase. One way of reducing risk is to build on trust. This can be from high involvement
in a particular brand, more commonly known as brand loyalty, which has shown to be a risk
reducer (Roselius 1971 as in Mitchell 1999). Another aspect of trust that is more related to
relationship marketing is the trust that is found between two or more parties (Mitchell 1999),
for example a consumer and a salesperson or buyer and a seller at two companies. Solomon et

17
al (2002) also highlights the fact that the consumer will try to reduce risk in different ways
depending on if the purchase is of high cost and complex or if it is of low cost and something
that is bought relatively frequently. He mentions that since so many different criteria’s are
used, and a vast amount of information is processed actively to evaluate a product of high cost
and high involvement, the consumer tend to seek out sales personnel to get a second, expert
opinion to reduce the risk (Solomon et al 2002). Information becomes more important as the
financial risk of the purchase becomes higher (Hilton 1981, Gould 1974 as in Mehrez 1985).
However, Mitchell (1999) mentions that there is a problem in that previous studies on
perceived risk have mainly focused on low cost products where there is minimal risk involved.
He therefore suggests that future research should be aimed at high value products, such as
cars, jewellery and houses.

18
Research design In this chapter a presentation of the methods used to collect and analyse our data will be presented. Since our thesis, to a certain extent, uses the research design, created by previous researchers, this design will be presented simultaneously as the one used for this thesis.
Research Design and Stimuli In 2004 Voss and Gammoh conducted an investigation where they concluded that their
hypothesis, that a second brand would increase consumer perceived quality and attitude
towards a product, indeed was correct. This research was based on a low involvement and low
cost product where they chose to use a digital camera with a made up brand name. They then
used SONY and Hewlett Packard (HP) as ingredient brands to see if consumers would have a
more positive attitude and perceive the quality of the camera higher when these two brands
were included. To verify that Voss and Gammoh (2004) used highly recognisable brands as
ingredients they performed pre-tests. The pre-tests indicated that SONY and Hewlett Packard
were well known and highly respected brands.
This thesis will use a similar study design, but since ingredient branding has never been tested
before on products with high involvement that are sold at a high cost, products within this
category will be used. Hence, we conducted a quantitative study where the respondents were
individuals that we selected based on availability at both the University of Växjö and at a
shopping centre at the outskirts of Växjö. Hence we studied the decision making process
where the respondents were asked to evaluate different alternatives when they were put in the
situation that they were about to buy a house and a car. By doing this investigation we were
able to see what effects ingredient branding had within these product categories. However, we
also decided to conduct a follow-up survey in order to explain the findings in our first
pictorial survey (Appendix 3). As a result, our study design were composed of two parts that
where conducted at the same time with our respondents.
19
Data collection method The data collection was divided up in two different steps:
1. We begun by using the model designed by Vaidyanathan and Aggarwal (2000) and
choose participants at the University of Växjö and at a shopping centre at the outskirts of
Växjö and invited them to participate in a test. Our method for selection has been to first of all
divide the respondents in to two categories, students and non-students. Andersen (1998) and
Rosengren (2002) identify this as a stratified selection. In a stratified selection, when
respondents have been divided into different categories, the researcher can randomly select
respondents from each category. We chose to use an equal amount of respondents from each
category to secure that none of the categories would be underrepresented, a proportional
selection (Andersen 1998). We decided to conduct a survey since our study is quantitative and
we had standardised questions (Andersen 1998). According to Nachmias and Nachmias (1996)
there are three different survey methods, telephone, mail and the personal interview. We
decided to use the personal interview even though it generally demands more time. However
this method secures that the researcher can control the situation, get a high response rate and
collect detailed information (Nachmias and Nachmias 1996). In the survey we presented the
respondents to two different product categories, both with high cost and high involvement, by
showing them advertisements of two different products; 1. a house and; 2. a car. The house
advertisement was fake and the brand name Euro house AB was made up by our selves. The
car advertisement on the other hand was a real brand. But since we wanted the focus of this
investigation to be on the ingredient brand we chose a car brand that few people were familiar
with, prior to this study. The use of a fake brand and a brand that few people are familiar with
would secure that we collected non biased answers due to the brands position on the market.
In that way we argue that the risk that the respondents already have an attitude towards the
brand is minimal. However, in order to be sure, we conducted a pre-study to conclude that the
knowledge about the car brand was relatively low and found that only one out of ten
respondents had ever heard about the brand SsangYong earlier.
This first step of our research design was divided up into four different moments:
1.1 We started of by showing the respondents an advertisement for a house. The
respondents were told that this was a European house manufacturer looking to expand on the
Swedish market by offering quality houses at competitive prices. The upper right corner of the
20
advertisement introduced the brand name Euro House and at the left bottom of the
advertisement, product features were listed. The respondents viewed this picture for 15
seconds and were then asked to fill out a survey where they evaluated three different measures.
The first evaluation was related to the attitude the participants had towards the product and
was divided into two different categories. 1. the utilitarian attitude which refers to the
functions that are performed by the product and 2. hedonic attitude, which derives from the
sensation of using a product. Using these two measures can reveal differences/positions that
may not be apparent when a single dimension of attitude is used (Voss et al 2003). 3. The
third and last variable was related to the perceived quality that the respondents associated with
the product in the advertisement. In order to conduct this survey we used the research design
from Voss et al (2003) and Voss and Gammoh (2004) who conducted a survey where they
found a list of adjectives that described the variables utilitarian and hedonic attitudes. They
found twelve adjectives that described the two categories; hedonic and utilitarian attitudes. In
this thesis we have chosen to use only four of these to describe the respondents view on the
subject. This choice has been made partly because some of them referred to the same subject
or area of utilitarian and hedonic attitudes. It has also been made on the grounds that that we
intend to further our research by conducting a follow up survey with the respondents of the
first survey, in order to get more data for our analysis and also to be able to explain our
findings. The survey with the four different measures used to describe hedonic and utilitarian
attitudes and the perceived quality are found as an enclosure in appendix 1 and 2.
1.2 When the first category, houses, was finished we conducted a replica of the test on
our second product category, cars. First an advertisement of a car of unfamiliar brand was
shown and at the upper right hand of the picture, the brand was presented with product
specifications at the left bottom the advertisement. The respondents looked at the
advertisement for 15 seconds and then were asked to fill out the same survey that they had
done with previous product category.
1.3 This part of the survey was identical to parts 1.1 and 1.2 except that a new
advertisement of the house was shown with the differences that an ingredient brand, the
Swedish brand Marbodal kök (a kitchen manufacturer), had been added. The Marbodal kök
logo appeared in the right bottom of the page and the respondents were asked to complete the
same survey over again, evaluating the attitude and the quality of the ingredient branded
product advertisement.

21
1.4 As a final step of this survey a second advertisement of the car was shown, this time
with a logo of the ingredient brand, Good Year appearing at the bottom right and the
respondents, again, filled in the same survey.
For this survey we decided to use a semantic differential rating scale. This scale measures the
respondent’s reactions to an object or a concept by asking them to indicate a rating on a
bipolar scale, defined by contrasting adjectives at each end (Nachmias and Nachmias 1996).
This is a seven item scale which was suitable to get a detailed picture of how the respondents
evaluated their attitudes and perceptions of quality of the product.
We performed our survey on 100 respondents where 50 were students and 50 were non-
students. We choose to do this selection to be able to see if there were any differences
between the respondents that had little prior experience concerning the two product categories,
and those who had more experience. This specific selection became relevant to analyse in
order to see if there were any differences in their answers related to our consumer behaviour
theory concerning high and low involvement.
2. When the survey was completed we asked the respondents if we could conduct a
second survey with them based on a questionnaire (appendix 1 and 2). Theories on consumer
behaviour highlights the fact that a consumers buying process is different when purchasing
high cost, high involvement products compared to low cost, low involvement products. Hence,
we wanted to see if theories on consumer behaviour could explain the findings in the first
survey. In question three we used closed ended questions based on four levels for both houses
and cars to see the respondents’ basic knowledge about the products presented. This 1 - 4
ranking system is useful device since it provides a relative order among the objects (Nachmias
and Nachmias 1996) and it would also help us to deeply analyse the data collected. In
question four we once again used closed ended question to be able to investigate to what
degree the risks connected to the possible purchase affected the respondents; once again we
decided to use a seven point semantic deferential scale. By adding question five we wanted to
see how the respondents felt about extra expertise when considering the possible purchase of
each of the products. This question was once again closed ended with a simple yes or no
answer. In questions number six and seven we used closed ended questions with two different
response alternatives Question number eight is also a close ended question where we wanted

22
to observe how the knowledge about the ingredient brands affected the respondent’s answers
and how familiar they were with the brands.
We have decided to use closed ended questions since it easy to ask and quick to answer, it
also creates a straightforward analysis. These questions are suitable when the researcher’s
objective is to lead the respondents to express agreement or disagreement with an explicit
point of view (Nachmias and Nachmias 1996). Once the survey was explained, it was the
respondent’s job to fill in the questioner. If they had any questions regarding how to fill in the
survey we were always close at hand to help them with any enquiries they might have. We
also made sure that the respondents were aware of that questions 3-8 were follow up questions
and had nothing to do with the products they had just recently evaluated in the two different
advertisements.
Conducting a survey in this manner is referred to as a focused interview. It is characterised as;
taking place where the respondents have been involved in a particular experience, it proceeds
on the basis of an interview guide specifying topics related to the researcher’s hypothesis and
focuses on the subjects experience regarding the situation under study. By using the focused
interview the researcher has the possibility to explain and clarify major aspects of the study to
the respondent, even though the questions are highly structured (Nachmias and Nachmias
1996).
Data analysis Since this thesis uses two different approaches to collect data we also had to use two different
methods to analyse. In the first part, the survey with advertisements of non-ingredient and
ingredient branded products, we conducted a bivalent analysis in order to see correlations and
difference between the variables (Andersen 1998). The data was quantitative and was hence
analysed in the program SPSS. By running a one-way ANOVA analysis we could conclude
that there was no significant difference between the advertisement with and without the
ingredient brands. We ran the analysis on a significance level of 0.05 and since we were not
able to find any significant differences we decided to perform the test up to the significance
level of 0.2. However, we were still not able to find any significant differences high enough to
say that there could be any difference caused by the ingredient brands. The results are
therefore still presented on a significance level of 0.05. The cronbachs alphas were strong

23
enough to be considered reliable, pending between 0.85 and 0.88 (Appendix 6). By running a
correlation test of the variables in SPSS we were once again able to conclude that the
variables investigated were too closely related to each other to see any differences (Appendix
5).
According to Miller et al. (2002), deeper comparison between factors is unnecessary when the
one-way ANOVA analysis does not show any significant differences. We therefore moved on
to work with the follow up questions.
In the follow up questions we used SPSS to run cross tabulations in order to see how our
different variables were connected to each other. The method used was a multivalent analysis
in order to seek out causes to our results (Andersen 1998). The results is presented in figures
created in excel in order to more precise present our data. On the questions regarding different
risks connected to the purchase of houses and cars we run a reliability test in SPSS. The tests
resulted in a cronbachs alpha on 0.680 and 0.694 which are to be considered reliable.
Validity
In order to create validity the researcher has to make sure that the empirical findings are in
correlation to the theoretical topics chosen. A common definition is that the researcher
measures what he or she intends to measure (Rosengren 2002). Since our product category is
high involvement and high cost products, and we use the examples houses and cars in this
thesis, the first idea was to visit different house fairs and car retailers to collect our empirical
data. However we found that there were difficulties with this approach that would bring us out
of focus for this thesis, the ingredient brand. A car retailer normally only supply one or a few
brands of cars and the consumers that visit the retailer is there because they are interested in
these particular brands. Hence if we presented consumers of the retailer with advertisements
of a car of the brand SsangYong, they could be biased and have a negative attitude towards
this brand, the same line of argument goes for the house. Therefore we decided to conduct this
survey among people who were less likely to have any preconceived opinions about the
products and instead put them in the situation that they were about to buy the products. In
order to increase the research validity, we conducted the survey both at the University of
Växjö and at a shopping centre at the outskirts of Växjö that people travel to by car, and
where there is also a store that sells house and building supplies. Since people need to travel

24
to the shopping centre by car, we could ensure that they were familiar with this product and
hence had more experience concerning both of the involved product categories (house and
car). This way, we would not lose focus on our main area of research, the effect of the
ingredient brand. The prior discussion concerning respondents and where the survey was
conducted are very similar to the prior research conducted by Voss & Gammoh (2004) and
Vaidyanathan and Aggarwal (2000). Voss and Gammoh (2004) used only students as
respondents while Vaidyanathan and Aggarwal (2000) used both students and people at a
shopping centre. We therefore used their research design to a certain extent in order to see
similarities or differences concerning our results. However we also noticed their shortcomings,
which will have the effect that we are not able to make a broader generalisation concerning
our survey. Our conducted survey is nevertheless acceptable for preliminary theory testing. In
order to be able to make any broader generalisations we, just as Voss and Gammoh (2004)
and Vaidyanathan and Aggarwal (2000), need to use a truly random sample. Another
shortcoming noticed in Vaidyanathan and Aggarwal (2000) is that they used raisins as an
ingredient brand in a cereal that was the host brand. Since some respondents may not prefer
this product, they might be affected negatively by this ingredient, hence not be suitable for
this investigation. We therefore chose to use tires for the car and a kitchen for the house as
ingredients, since this equipment is a necessity in these products.
For the first part of the research design we have made sure to establish validity by using a
previously tested research design, created by Voss and Gammoh (2004). Therefore we trust
that the variables, attitudes and perceptions of quality are suitable in order to measure the
effects of ingredient branding. Nachmias and Nachmias (1996) claims that validity is created
by making sure that the questions used, have a clear connection to what the researcher intends
to investigate. Therefore we have made sure that each question, connected to our second part
of the research design, is deeply rooted in the theoretical topics chosen.
Reliability
Reliability is related to the degree of trustworthiness. If a researcher measures the same things,
using the same instrument, at different points in time and find different results, this indicates a
lack of reliability (Nachmias and Nachmias 1996). To avoid this we conducted five pre-tests
among students to establish if the layout of the survey would present us with any problems or
in any way confuse the respondents. After these tests, a few changes were made, the changes
25
resulted in clearer questions and we thereby made it easier for the respondents to answer. One
of these changes were that we added one additional question concerning if the respondents
recognised the two brands Marbodal and Goodyear that were used in the advertisements, this
way we had a greater chance of getting more reliable answers. In order to establish whether
these brands were well-known we once again followed Voss and Gammohs (2004) method
and performed a second pre-test. The second pre-test was conducted among 20 students who
were asked to fill in the questionnaire with the added question concerning whether they
recognised Marbodal and Goodyear. By performing the second pre-test we could conclude
that 85 % of the respondents recognised both Marbodal and Goodyear. By examining the
remaining 15 % we found that none of them recognised Marbodal but all of them recognised
Goodyear. The second pre-test indicated that the brands Marbodal and Goodyear were well-
known and suitable ingredients for our advertisements within the questionnaire.
By making the survey easier the answers will become more correct, with correct answers we
could more precisely measure what we intended to. The tool used for measuring has also been
used by previous researchers, which made us feel comfortable in getting reliable answers.
However, due to time limitations we needed to cut down on the number of adjectives used for
measuring hedonic and utilitarian attitudes. The previous study performed by Voss and
Gammoh (2003) used 12 adjectives to measure hedonic and utilitarian attitudes. We use four
of these since many of them were synonymous of one another. For example Voss and
Gammoh (2003) used the adjectives not fun/fun, not happy/happy and not funny/funny to
describe the hedonic attitude of the respondent. These three adjectives are to us synonymous
hence the sole use of not fun/fun. By conducting pre-studies we also made sure that we
always used the same approach to each and every respondent, so that different respondents
would not understand the survey differently.

26
Data collection
In the following chapter we will present the empirical findings from our data collection. Statistical data will be provided, making it easier for the reader to get an overview of the information that has been collected and processed.
The effects of ingredient branding An ANOVA test showed that there were no significant differences between the
advertisements with and without an ingredient brand. In the ANOVA test we added together
both advertisements that were without ingredient brand and ran them towards both
advertisements with an ingredient brand. The test did not flag for any significant differences
and the test is presented in table 4.1 below.
ANOVA
Sum of Squares df Mean Square F Sig.
Usefull Between Groups 0,303 1 0,303 0,164 0,685
Within Groups 732,675 398,000 1,841
Total 732,978 399,000
Functional Between Groups 0,090 1 0,090 0,058 0,810
Within Groups 619,820 398,000 1,557
Total 619,910 399,000
Practical Between Groups 0,062 1 0,062 0,031 0,861
Within Groups 812,635 398,000 2,042
Total 812,698 399,000
Riskfree Between Groups 2,250 1 2,250 1,016 0,314
Within Groups 881,790 398,000 2,216
Total 884,040 399,000
Fun Between Groups 2,402 1 2,402 1,100 0,295
Within Groups 868,995 398,000 2,183
Total 871,398 399,000
Thrilling Between Groups 1,440 1 1,440 0,568 0,452
Within Groups 1009,200 398,000 2,536
Total 1010,640 399,000
Happy Between Groups 0,360 1 0,360 0,186 0,666
Within Groups 769,950 398,000 1,935
Total 770,310 399,000
Positiveappeal Between Groups 0,722 1 0,722 0,318 0,573
Within Groups 904,775 398,000 2,273
Total 905,498 399,000
HighQuality Between Groups 0,490 1 0,490 0,275 0,600
Within Groups 709,070 398,000 1,782
Total 709,560 399,000
Table 4.1
Had there been a significant difference between the groups and the variables investigated, the
significance levels should have been close to 0.05. Since the significance is varying between

27
0.295 and 0.861, which gave us low F values, there are no differences between ingredient and
non-ingredient branded advertisements. The Cronbach alfa for each and every advertisement
and the answers from the respondents, related to them were between 0.85 and 0.88 which
shows a high internal reliability. However, since there are no significant differences in the
answers it is of no interest for us to further investigate differences in respondent groups.
Since we have chosen to describe the effects of ingredient branding using three different
aspects which are utilitarian and hedonic attitude and perceived quality, these aspects will be
presented in figure 4.1 below and discussed in the subsequent text.
1
2
3
4
5
6
7
Utilitarian Attitude Hedonic Attitude Perceived Quality
Mea
n
House withoutIngredient brand
House withingridient brand
Car WithoutIngredient brand
Car with Ingridientbrand
Figure 4.1
Utilitarian attitudes refer to the questions regarding usefulness, functionality, practicality and
risk and have been bundled together to describe utilitarian attitude. Hedonic attitudes refer to
the questions about how fun, thrilling, happy and positive appeal and these have been bundled
to describe hedonic attitude. Lastly, perceived quality is a single factor. Figure 4.1 above
presents an overview of how the respondents have answered. 1 being the highest, we can see
that the respondents had a better attitude and perception of quality towards the house than the
car. However, again we can see how similar the answers are and that there are no differences
when an ingredient is added and when it is not. Figure 4.1 is based on the findings presented
in table 4.2 below. HWO refers to all replies related to the picture of a house without an
ingredient brand. HW refers to all replies related to the picture of a house with an ingredient

28
brand. CWO refers to all replies related to the picture of the car without an ingredient brand.
CW refers to all replies related to the picture of a car with an ingredient brand.
Descriptive Statistics House
Advertisments
Mean Std. Deviation N
HWOUsefull 1,94 1,50 100
HWOFunctional 2,22 1,32 100
HWOPractical 2,46 1,37 100
HWORiskfree 3,41 1,46 100
HWOFun 3,29 1,69 100
HWOThrilling 3,52 1,79 100
HWOHappy 2,54 1,39 100
HWOPositiveappeal 2,52 1,62 100
HWOHighQuality 2,44 1,30 100
HWUsefull 1,95 1,27 100
HWFunctional 2,15 1,12 100
HWPractical 2,57 1,36 100
HWRiskfree 3,4 1,43 100
HWFun 3,07 1,44 100
HWThrilling 3,32 1,67 100
HWHappy 2,63 1,41 100
HWPositiveappeal 2,47 1,54 100
HWHighQuality 2,51 1,27 100 Table 4.2 When comparing HWO to HW and CWO to CW, it becomes obvious that there are no
significant differences in the respondents’ attitudes and perception of quality towards the
product if it includes an ingredient brand or not. The mean for all attributes describing HWO
is 2,70 and the mean for all attributes describing HW is 2,67. This implies that respondents
regard the product that has an ingredient added as somewhat higher but the difference is not
high enough to be considered significant. The same argument can be used when the product is
the car. The mean for all attributes describing CWO is 3,01 and the mean for all attributes
describing CW is 2,93. An alteration of figure 4.1 is presented below in figure 4.2. The
minimum and maximum mean has been changed to make it easier to see exactly how similar
the answers are and that there are minimal differences when an ingredient brand is added and
when it is not.
Descriptive Statistics Car Advertisments
Mean Std. Deviation N
CWOUsefull 2,02 1,44 100
CWOFunctional 2,28 1,30 100
CWOPractical 2,82 1,53 100
CWORiskfree 3,88 1,56 100
CWOFun 3,26 1,44 100
CWOThrilling 3,16 1,50 100
CWOHappy 3,39 1,35 100
CWOPositiveappeal 3,06 1,43 100
CWOHighquality 3,25 1,27 100
CWUseful 2,12 1,21 100
CWFunctional 2,41 1,24 100
CWPractical 2,76 1,44 100
CWRiskfree 3,59 1,48 100
CWFun 3,17 1,33 100
CWThrilling 3,12 1,37 100
CWHappy 3,18 1,23 100
CWPositiveappeal 2,94 1,36 100
CWHighquality 3,04 1,33 100

29
2,2
2,4
2,6
2,8
3
3,2
3,4
Utilitarian Attitude Hedonic Attitude Perceived Quality
Mea
nHouse withoutIngredient brand
House with ingridientbrand
Car Without Ingredientbrand
Car with Ingridientbrand
Figure 4.2
Figure 4.2 shows that the greatest difference can be seen in perceptions of quality between
CWO and CW. A second ANOVA test on the variables perceptions of quality between CWO
and CW showed that the significance level was between 0.65 and 0.69 and hence this is an
insignificant difference (Appendix 7).
The data presented above all refers to our first pictorial survey (appendixes 1, 2 and 3) In the
next chapters of the data collection we will make a presentation of how the respondents
perceived different kinds of risks derived from purchasing a house and a car and also their
level of involvement (follow up questions in appendixes 1 and 2).
Perceptions of risk We asked the respondents to make a risk assortment to get a view of what kind of risks and to
what degree they had an effect, when they were about to purchase either a house or a car. As
seen from figure 4.3 the respondents, in general, perceived a somewhat higher risk from
buying a house compared to buying a car.
Risk perception
1
2
3
4
5
6
7
Financial risk Functional risk Fysical risk Social risk Psychological
Mea
n
House
Car
Figure 4.3

30
The five different measures of risk do not differ significantly from buying a house or a car.
The financial risk is being perceived as the highest in both the case of buying a house or a car
and has a mean for houses of 5.05 and cars of 4.51.This combined with the psychological risk
is also were we see the biggest differences in risk perception between buying a house and a
car. Functional, physical and social risks are all very similar when it comes to purchasing
houses and cars. In all cases except one, the physical risk, the respondents perceive a higher
risk derived from buying a house than a car. Since the prior ANOVA test on attitudes and
perceptions of quality showed a non-significant difference in respondents’ replies, there is no
need to investigate if there are any correlations between these variables and the risk
perceptions. The risk perceptions of cars had a chronbachs alfa of 0.680 and risk perceptions
of houses had a chronbachs alfa of 0.694.
Involvement In both the case of buying a house and a car, the respondents at large agreed that the
salesperson was of great importance. Figure 4.4 below shows that 90 % of the respondents
would ask for or require the expertise of a salesperson before conducting a purchase of a
house, confirming the importance of a second expert opinion.
Houses / Salespersons importance
0102030405060708090
100
Yes
Sal
es p
erso
nsre
com
men
datio
ns
Wha
t I
first
had
inm
ind
No
Sal
es p
erso
nsre
com
men
datio
ns
Wha
t I
first
had
inm
ind
Per
cent
Figure 4.4
Those who answered yes and their answers related to the question are depicted in blue. Those
who answered no are depicted in red.
31
In the survey we followed this question up by asking the respondents if the salesperson could
change their mind. The question was formulated as follows:
Imagine that you are going to buy a house, where both the kitchen and the kitchen appliances are familiar to
you. However these products are sold as additional equipment at a higher price. But still you feel that the
additional equipment is worth the extra money. The salesperson claim that the kitchen and the kitchen
appliances already equipped is just a good and equal in quality, and that you save some money by choosing
that alternative. What do you choose?
1. The first alternative I had in mind 2. The salesperson’s recommendation
As seen from table 4.4 64 % still decide to go for the alternative they first had in mind
whereas 36 % trust the salespersons recommendation and go for the least, costly alternative.
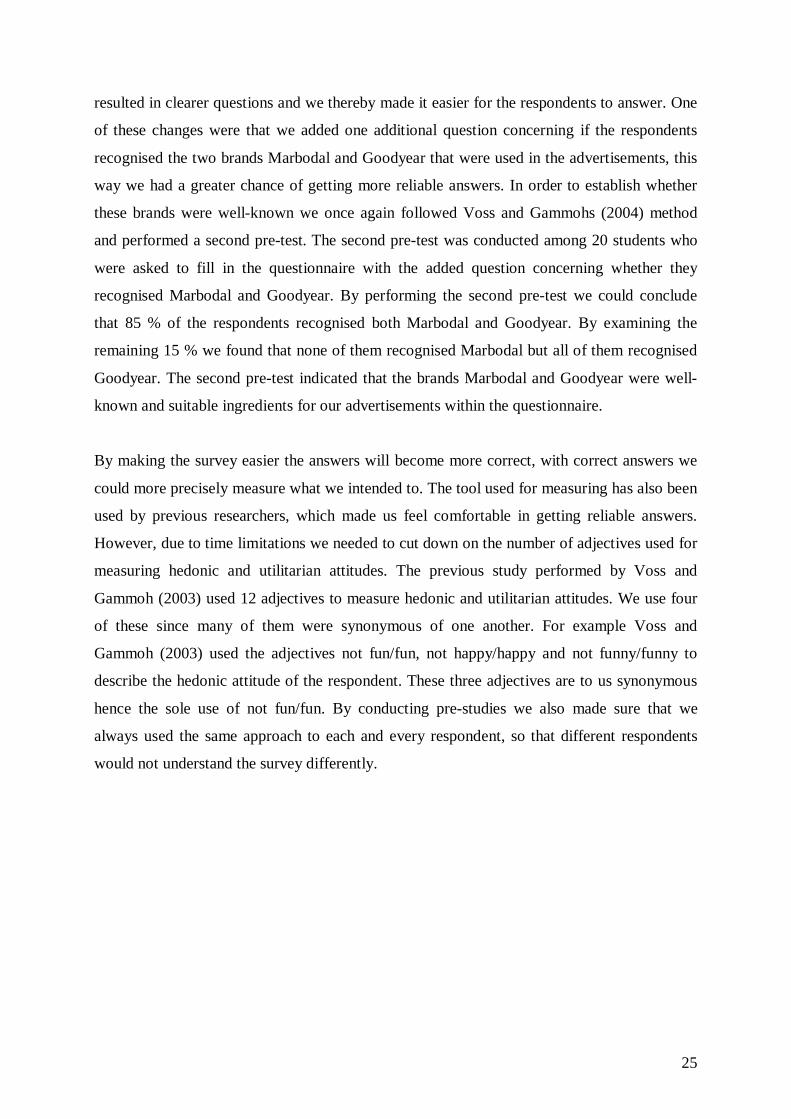
The same questions were used to describe the importance of a salesperson when purchasing a
car. Figure 4.5 below show that 89 % of the respondents would ask for, or require the
expertise of a salesperson before conducting a purchase of a car, confirming the importance of
a second expert opinion, even in car purchases.
Cars / Salespersons importance
0102030405060708090
100
Yes
Sal
es p
erso
nsre
com
men
datio
ns
Wha
t I
first
had
inm
ind
No
Sal
es p
erso
nsre
com
men
datio
ns
Wha
t I
first
had
inm
ind
Per
cent
Figure 4.5
Even in this case we had a follow up question where we asked if the salesperson could change
their minds. This question had a similar layout and was formulated as follows.
Imagine that you are going to buy a car, where both the tires and the audio system are familiar to
you. However these products are sold as additional equipment at a higher price. But still you feel that
the additional equipment is worth the extra money. The salesperson claim that the tires and the audio

32
system already equipped is just a good and equal in quality, and that you save some money by
choosing that alternative. What do you choose?
1. The first alternative I had in mind 2. The salesperson’s recommendation
As seen from table 4.5 above 56 % of the respondents would still go for the alternative they
first had in mind. However, this shows that even if the salesperson was slightly less, or
equally, important in the case of purchasing a car, compared to purchasing a house, more
people will decide for the alternative they first had in mind, in this case.
We also designed a question to investigate what kind of enduring involvement the
respondents had about the two product categories, houses and cars.
Figure 4.6 Figure 4.7
The question was originally divided up in to four different involvement levels (very low, low,
high, very high) but has been altered in the figures above to make them easier to asses.
Figures 4.6 and 4.7 present the two product categories when all, 100, respondents are included.
They tell us that the experiences of both products are relatively evenly dived between low and
high experience. However, if we make a comparison between the two respondent groups,
students and non-students, we can se that the experiences differ. As can be seen in appendix 4
there are differences in experience between our respondent groups. However, this has not
affected our main survey about attitudes and perceptions in ingredient branding and the risks
connected to these product categories, since chronbachs alpha has been very high (Appendix
6). Appendix 4 also presents evidence that enduring involvement (experience about the
product) does not affect the importance of a second opinion in the form of a sales person. No
matter if the respondents have high (which is the case among non-students) or low enduring
involvement (which is the case among students), they would still require the expertise of a
salesperson.
House Experiences
50%50%Low
High
Car Experiences
40%
60%
Low
High

33
The last question was designed to conclude that we had chosen two ingredient brands that
people were familiar with. The results are presented in tables 4.8 and 4.9 below.
Figure 4.8 Figure 4.9 Since the brand recognition was so high we have decided not to make a comparison among
the respondent groups, in order to conclude if non-students were more aware of the brands
than student, or vice versa.
Respondent recognition of the brand Marbodal
85
15
Yes
No
Respondent recognition of the brand Good Year
96
Yes
No
34
Analysis In this chapter we will analyse our empirical findings by making a comparison to the theoretical topics chosen. This section has the same layout as the previous chapters and will therefore be analysed topic by topic.
Ingredient Branding
As Vaidyanathan & Aggarwal (2000) argues, an additional brand, in this case an ingredient
brand should increase the value perceptions for the host brand. Our survey indicates that
ingredient branding does not modify the host brand to the better in the product class, high
involvement and high cost products. The consumers’ attitudes and perceptions of quality did
not change significantly when we presented them to advertisements of products that were
without an ingredient brands and advertisements that included ingredient branding. As can be
seen in the ANOVA test there is no significant change in perceptions and attitudes when
comparing our advertisements with and without the ingredient brands. Vaidyanathan &
Aggarwal (2000) claim that the result of ingredient branding is dependent on the importance
of the ingredient brand and the consumers associations to it. Our ingredient brands consisted
of logos from a well known kitchen manufacturer and a well known tyre manufacturer.
Kitchens and tyres are important parts of the products, houses and cars and should hence,
according to Desai and Keller (2002), be suitable ingredients for the survey.
The additional ingredient brand in the advertisements should have indicated for the
respondents that the value of the product had increased (Desai & Keller 2002). But it was only
in the car advertisement, that we found a small change when the perception of quality
increased marginally when adding the Goodyear brand. Important is to notice that the change
can not be used as evidence that the perceived quality increased, since the significance level is
too small (table 4.1). However, as Moore (2003) states, we can not be certain that the
consumer understood the value that the ingredient brand was supposed to contribute to the
products, and if they did not, the ingredient brand will not have been tangible to the
respondent. Further, the benefits of ingredient branding might not be tangible when the
ingredient is something that the consumer expects anyway, which are normally the cases of
kitchens and tyres, in houses and cars (Moore 2003). Since we have used kitchen and tires in
houses and cars the consumers might feel that there are other more crucial variables to
consider when buying a house or a car. Our investigation shows that the correlation between

35
every variable of attitudes and perceptions of quality has a strongly related significance value
that we can not say that the ingredient brand have increased the value for the host brand
(Appendix 5).
Vaidyanathan & Aggarwal (2000) found, in a similar study as the one we conducted, evidence
that, in low involvement and low cost product categories, an additional well known brand
should increase the value in quality perceptions and attitudes for the host brand. Even tough
we have evidence (figure 4.6 and 4.7) that both ingredient brands in our study are well known,
the results shows us that the conclusion made by Vaidyanathan & Aggarwal (2000) can not be
applicable in high involvement and high cost product categories.
To measure the effects of ingredient branding in high cost and high involvement products we
have used the research design, created by Voss and Gammoh (2004). Hence we used the three
variables, hedonic and utilitarian attitudes and also perceptions of quality and then had the
respondents relate these to products, with and without ingredient brands in an advertisement.
The findings show us that there are differences (see table 4.2 and figure 4.1), but that they are
too small to be considered significant.
Decision Making Process Regarding theory about consumer behaviour and the decision making process, Solomon et al
(2002) claim that consumers’ put a lot of effort into the process of evaluating alternatives in
high involvement purchases. This theory claims that consumers’ will scrutinise many
variables when purchasing a house or a car. Hence, this implies that ingredient branding will
be less effective during these purchases since there are so many variables that are considered.
This has also been proved in our research, by looking upon table 4.2, it shows that the
ingredient brand had no effect on the consumers’ attitudes and perception of quality about the
product.
Involvement According to Solomon et al (2002) the consumer tends to put a lot of efforts in the stage were
they have already made up their minds about conducting a purchase, and are evaluating
different alternatives. Therefore we decided to put the respondents in a similar situation so
that they would have to evaluate different risks related to the purchase and also, to raise their
level of situational involvement. Depending on how involved the consumer is, his or her

36
cognitive and behavioural responses might be different (Coulter et al 2003). Our survey
included a question about enduring involvement. However, the survey did not show that
consumers enduring product involvement had an effect on ingredient branding. This suggests
that enduring involvement does not change consumers attitudes and perceptions of quality
towards high involvement, high cost products. Nor could we find a correlation between
enduring involvement and the importance of the sales person. According to Solomon et al
(2002) this, however, is to be expected in the case in high risk and high involvement
purchases. It is however interesting to note that the respondents who answered that the
salesperson was important in a car purchase, 47 % of these would also follow his or her
recommendations. On the other hand, among the respondents who did not find the salesperson
important only 11,8 % would follow his or her recommendations. The same clear correlation
can not be found when the product is a house. Among the respondents who found that the
salesperson was important, 35,6 % would also follow his or her recommendations. Among the
respondents who did not find the salesperson important, 40 % would follow his or her
recommendations.
According MacInnis and Joworski (1989) information processing procedures are different
depending on the product type. Our survey shows that the respondents have paid more
attention to the utilitarian attributes of the products as they have a mean of 2.56 compared to
the hedonic attitudes, which have a mean of 3.04 (inverted scale) (figure 4.1). According to
MacInnis and Joworski (1989) this would indicate that consumers view the purchase of a
house and a car from a utilitarian perspective, simply to solve a problem. The fact that
hedonic attitudes are not viewed as equally high, would imply that feelings and symbolic
values are not equally important in this product category. Figure 4.1 and 4.2 shows that
utilitarian attitude scored high on our inverted semantic differential scale. However it
becomes interesting to compare these findings to our findings concerning the salesperson and
if his/her expertise is important. Even though figure 4.1 and 4.2 indicated that the utilitarian
attitude is important table 4.4 and 4.5 shows that consumers’ still chose to go for what they
first had in mind. This becomes somewhat of a contradiction since the salesperson might have
more expertise considering the house or the car he/she is selling. However since Park and
Moon (2003) claim that it is the consumer who decides whether a product is of a utilitarian or
hedonic value, we can confirm that a house and a car posses both utilitarian and hedonic
values.

37
Within the consumer involvement profile (CIP) (Kapferer and Laurent 1985b; 1993), our
survey has shown no indications that interest plays an important roll for how well ingredient
branding works within this products category. Pleasure, which is the hedonic aspect of CIP,
was less important than utilitarian aspects and hence consumers’ see the purchase of a house
and a car as practical and problem solving investments.
Perceived Risk Products that have a high utilitarian value, that are designed to solve a problem, would affect
consumers to behave in a cautious way (Babin, Darden & Griffin 1994; Engle, Blackwell &
Miniard 1993 as in Park and Moon 2003). In order to define our product categories as high
involvement, we used (Coulter et al 2003) theory about personal relevance. The theory
discussion concerning personal relevance can be linked to our question regarding social risk.
By looking upon fig 4.3 the social risk received a very low mean on our seven point bipolar
scale for both the house and the car. This indicates that the consumers’ look upon these
product categories as high involvement purchases, and that they do not consider the social risk
as high.
Risk importance and risk probability has been empirically tested by using Solomon et al
(2002) five dimensions of risk. Mitchell (1999) claims that when the purchase involves
durable experience goods, that are normally expensive, the financial risk will be considered
highest. As Figure 4.4 shows, this is supported by our survey in both the case of buying a
house and a car. Figure 4.4 shows that the respondents have rated the risks related to the
purchases relatively low. Social risk for both houses and cars for example has a mean of 2.42
and can be related to the sign value in Kapferer and Laurent’s (1985b; 1993) CIP model. This
implies that factors, such as the surroundings opinions and self expression are of little
importance within purchases in this product class. Roselius (1971), as in Mitchell (1999)
claims that the consumer will always be inclined to decrease risk when this is high. In the case
of buying a house or car the consumers’ main interest would hence be to minimize the
financial risk. As figures 4.4 and 4.5 shows one way of reducing this risk is by contacting the
salesperson. According to Solomon et al (2002) this is a common way of reducing risk since
information becomes more important as the risk of the purchase becomes higher.
We also found that there are a difference in risk perception between houses and cars. This
however is consistent to Mitchell’s (1999) theory about durable goods, since there are a large
38
difference in price between houses and cars. The remaining four risks, included in the study,
show that consumers do not consider that these risks are especially crucial when buying a
house or a car, neither do they differ particularly as can be seen in table 4.3. This overall low
risk perception can be explained by the degree of involvement that is considered to be of great
importance in high cost product categories (Solomon et al 2002). As Mehrez (1985) argues,
information becomes more and more important when the price of the intended purchase
increases. Therefore, the consumer will seek out as much information as possible in order to
decrease the amount of uncertainty and risk, connected to the purchase (Solomon et al 2002
and Mitchell 1999). Further, Mitchell (1999) argues that the seller in the form of expertise
should be important in order to sell high cost product. He claims that trust between seller and
buyer is one of the most important aspects in this product category. As can be seen in table
4.4 and 4.5 the seller is of great importance for the consumer when considering a purchase.
However when we investigated whether or not the seller could affect the consumer when
conducting the purchase we realized that this differs between houses and cars. When
purchasing a house the results show that the respondents, in the end phase of the purchase, do
not value the seller’s expertise in the same degree as when buying a car. Mitchell (1999) and
Solomon et al (2002) highlight the importance of trust between seller and buyer as well as the
consumers’ intentions to reduce the risks before making the purchase. Solomon et al (2002)
mentions that the level of involvement is dependent of the financial risk connected to the
purchase. Since houses are more expensive this can be a reason to why people treasure their
own opinion higher then the sellers expertise.
39
Conclusion Previous studies on ingredient branding, within low cost and low involvement products have
supported, that the effects of ingredient branding are positive, in the minds of the consumer.
Based on the data presented in the analysis we conclude that ingredient branding has very
limited effect on consumers attitudes and perceptions of quality towards products, classified
as high involvement and high cost. We have also tried to explain why we declare that
ingredient branding has less positive effects on consumers’ attitudes and perception of quality
in this product category. Consumers who, for example, purchase a Diet-Coke buy a Coca-
Cola with the ingredient NutraSweet. However, consumers who purchase a house do not only
buy a house with the ingredient Marbodal Kök. They also buy a house with floors, windows,
garden, different colours and many more products supporting the purchase. Hence in high cost,
high involvement products, there are several more attributes that need to be taken into
consideration and therefore, the ingredient will only receive limited attention. Hence we
conclude that ingredient branding has no significant effect and that previous studies on
ingredient branding are not applicable, within this product category. As the consumer gets
highly involved in the purchase they will evaluate many different aspects to make sure the
product fits their utilitarian and hedonic needs, and therefore the effects of the ingredient
brand becomes diluted.
40
Limitations There are several limitations to be noticed in this thesis. The way our survey was conducted
could have been done in a number of different ways. We could have let the logo of the
ingredient brand take up more space in the advertisements and also added a text next to the
logos that proclaimed: “Now with a kitchen from Marbodal” or “Now with tyres from
Goodyear”. This way the respondents could easier have detected the differences in the
advertisements and hence, we might have had come up with a different conclusion. Further
we have not tested the respondents’ perceptions of the ingredient brands. We only conclude
that they are familiar with them and therefore, if a respondent has a negative attitude towards
one of the chosen brands, this has likely affected his or her attitudes to the advertisements.
The fact that we conclude that ingredient branding has no effects within our chosen product
category might therefore be a result of the research design we used to conduct this thesis.
Should it be conducted in a different manner, with for example different products, different
research design, different respondents or maybe even by, in advance letting the respondents
know what the difference was between the advertisements, the results might have been
different.

41
Future Research We would like to point out that our study used a fictitious brand and an unknown brand and
that this might affected our results. A follow-up study would be appropriate, where the usage
of well-known host brands were to be used in order to be able to notice any differences.
Since consumers’ consider so many crucial variables when conducting a purchase within high
involvement and high cost product categories, our study indicates that is it not enough to only
use one ingredient brand. Perhaps a follow up study is appropriate here as well, to see if the
usages of multiple ingredient brands have any effect on the host brand.
Our findings prove that previous successful ingredient branding theories, on low involvement
and low cost product categories are not applicable within high involvement and high cost
product categories. Since we are not able to make any broader generalisations regarding our
findings because of our specific respondent groups, a further study of ingredient branding
within high involvement and high cost products should use a truly random sample of
respondents in order to guarantee and secure that the findings could be used to generalise the
theory.
Since our study indicates that our chosen product categories, houses and cars, are judged from
a utilitarian perspective. A follow-up study using ingredient brands that only promote the
utilitarian function of the ingredient would be very interesting, in order to verify if the effect
increases by doing so.

42
Reference list Articles :
� Coulter. R. et at. 2003. Rethinking the Origins of Involvement and Brand Commitment: Insights from Post socialist Central Europe. Journal of Consumer Research 30: 151-170
� Desai, K. & Keller, K. 2002. The Effects of Ingredient Branding Strategies on Host
Brand Extendibility. Journal of Marketing 66: 73-94 � McGrath. J. Mahood, C. 2004. The Impact of Arousing Programming and Product
Involvement on Advertising Effectiveness. Journal of Current Issues and Research in Advertising 26: 2
� McKenna, T. 2005. Brand management: Defining your brands position. National
petroleum news. 97: 14-15
� Moore, R.E. 2003. From genericide to viral marketing: on 'brand'. Language and Communication 23:331-357
� Motion et al. 2003. Equity in corporate co-branding: The case of Adidas and the All
Blacks. European Journal of Marketing 4: 1080-1094 � Mowen. John C, Beyond consumer behaviour, Journal of consumer marketing, 1988
5: 15-26 � Norris, D. 1992. Ingredient branding: a strategy option with multiple beneficiaries.
Journal of Consumer Marketing 9:19-32
� Park. C-W. Moon. B-J. 2003. The Relationship between Product Involvement and Product Knowledge: Moderating Roles of Product Type and Product Knowledge Type. Psychology and Marketing 20: 977-997
� Reed, G. et al. 2004. Information technology: changing the face of automotive
retailing? International journal of retailing & Distribution management. 32: 19-33
� Rodrigue, C. & Biswas, A. Brand alliance dependency and exclusivity: an empirical investigation. Journal of Product & Brand Management 13:447-488
� Rooney, D. A. 1995. Branding: A trend for today and tomorrow. Journal of Product &
Brand Management. 4: 48-56
� Uggla, H. 2004. The brand association base: A conceptual model for strategically leveraging partner brand equity. Journal of Brand Management 12:105-124
� Vaidyanathan, R. & Aggarwal, P. 2000. Strategic brand alliances: implications of
ingredient branding for national and private label brands. Journal of Product and Brand Management 9:214-228

43
� Vincent-Wayne. M. 1999. Consumer perceived risk: conceptualisations and models. European Journal of Marketing 33: 163-195.
� Voss, K. E., Gammoh, B. S. 2004. Building Brands through Brand Alliances: Does a
Second Ally Help? Marketing Letters 15: 147-160 � Voss, K. E., Spangenberg, E. R., Grohmann, B. 2003. Measuring the Hedonic and
Utilitarian Dimensions of Consumer Attitude. Journal of Marketing Research (JMR) 40: 310-321
� Wang, Cheng-Lu; Siu, Noel Y.M.; Hui, Alice S.Y. European Journal of Marketing,
2004, 38: 239-252 Literature :
� Albaum, G. 2002. International marketing and export management. Prentice Hall � Alter, C. 1993. Organizations working together, Calif: Newbury Park
� Andersen, Ib. 1998. Den uppenbara verkligheten: Val av samhällsvetenskaplig metod.
Studentlitteratur Lund � Blackett, B. and Boad, T. 1999. Co-branding: the science of alliance. St. Martin's
Press. New York
� Miller, R., Acton, C. Fullerton D. A., Maltby, J. 2002. SPSS: For Social Scientists. Palgrave McMillan, New York
� Nachmias, C. F., Nachmias, D.1996. Research methods in the social science. St.
Martin’s Press, Inc. London
� Rosengren K. E. 2002. Sociologisk Metod, Liber Ekonomi, Malmö
� Solomon, M., Bamossy, G., Askegaard, S. 2002. Consumer Behaviour. Prentice Hall. Edinburgh
Webpage’s :
� www.eirepreneur.com, Eirepreneur
� www.intangiblebusiness.com, Intangible Business Limited

44
Appendix 1 (English version) 1 What is your perception of the product you just saw? (House): Very Fairly Slightly Neither slightly Fairly Very Useful 1 2 3 4 5 6 7 Non-useful Functional 1 2 3 4 5 6 7 Not functional Practical 1 2 3 4 5 6 7 Impractical Safe 1 2 3 4 5 6 7 Not safe Fun 1 2 3 4 5 6 7 Not fun Thrilling 1 2 3 4 5 6 7 Not thrilling Happy 1 2 3 4 5 6 7 Not happy Appeals to me Appeals to me Positively 1 2 3 4 5 6 7 Negatively High quality 1 2 3 4 5 6 7 Low quality
What is your perception of the product you just saw? (Car): Very Fairly Slightly Neither slightly Fairly Very Useful 1 2 3 4 5 6 7 Non-useful Functional 1 2 3 4 5 6 7 Not functional Practical 1 2 3 4 5 6 7 Impractical Safe 1 2 3 4 5 6 7 Not safe Fun 1 2 3 4 5 6 7 Not fun Thrilling 1 2 3 4 5 6 7 Not thrilling Happy 1 2 3 4 5 6 7 Not happy Appeals to me Appeals to me Positively 1 2 3 4 5 6 7 Negatively High quality 1 2 3 4 5 6 7 Low quality

45
2 What is your perception of the product you just saw? (House): Very Fairly Slightly Neither slightly Fairly Very Useful 1 2 3 4 5 6 7 Non-useful Functional 1 2 3 4 5 6 7 Not functional Practical 1 2 3 4 5 6 7 Impractical Safe 1 2 3 4 5 6 7 Not safe Fun 1 2 3 4 5 6 7 Not fun Thrilling 1 2 3 4 5 6 7 Not thrilling Happy 1 2 3 4 5 6 7 Not happy Appeals to me Appeals to me Positively 1 2 3 4 5 6 7 Negatively High quality 1 2 3 4 5 6 7 Low quality
What is your perception of the product you just saw? (Car): Very Fairly Slightly Neither slightly Fairly Very Useful 1 2 3 4 5 6 7 Non-useful Functional 1 2 3 4 5 6 7 Not functional Practical 1 2 3 4 5 6 7 Impractical Safe 1 2 3 4 5 6 7 Not safe Fun 1 2 3 4 5 6 7 Not fun Thrilling 1 2 3 4 5 6 7 Not thrilling Happy 1 2 3 4 5 6 7 Not happy Appeals to me Appeals to me Positively 1 2 3 4 5 6 7 Negatively High quality 1 2 3 4 5 6 7 Low quality
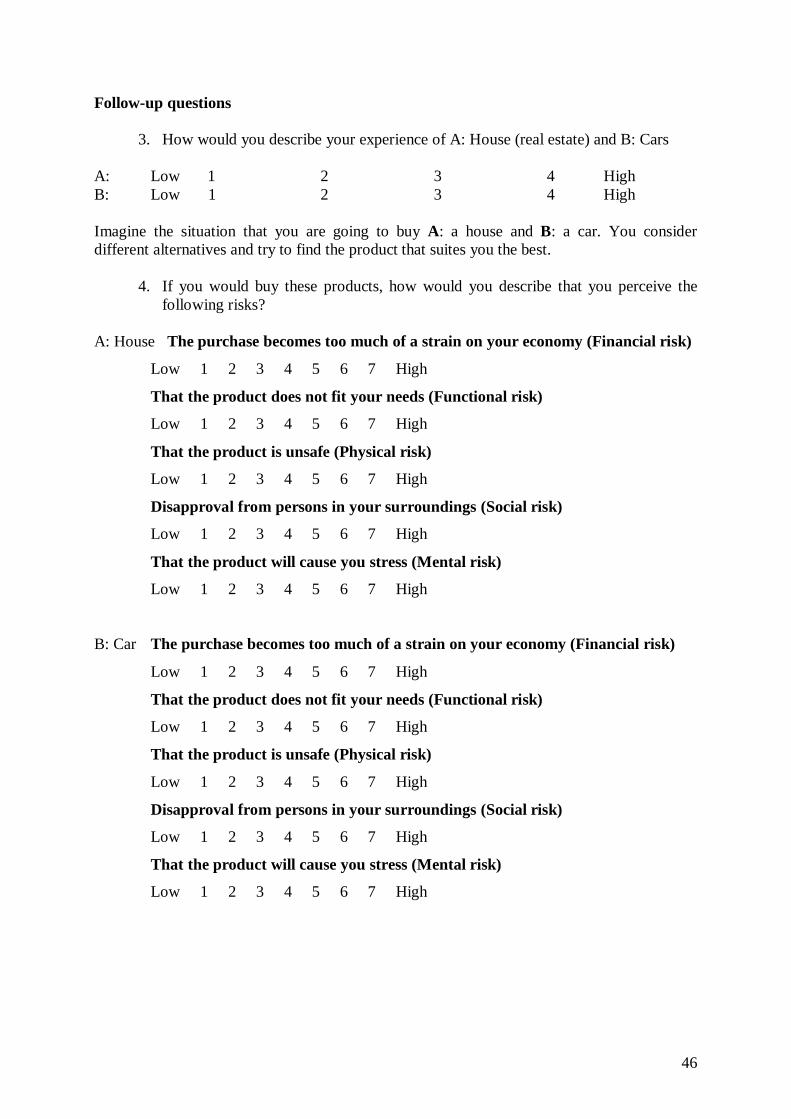
46
Follow-up questions
3. How would you describe your experience of A: House (real estate) and B: Cars
A: Low 1 2 3 4 High B: Low 1 2 3 4 High Imagine the situation that you are going to buy A: a house and B: a car. You consider different alternatives and try to find the product that suites you the best.
4. If you would buy these products, how would you describe that you perceive the following risks?
A: House The purchase becomes too much of a strain on your economy (Financial risk)
Low 1 2 3 4 5 6 7 High
That the product does not fit your needs (Functional risk)
Low 1 2 3 4 5 6 7 High
That the product is unsafe (Physical risk)
Low 1 2 3 4 5 6 7 High
Disapproval from persons in your surroundings (Social risk)
Low 1 2 3 4 5 6 7 High
That the product will cause you stress (Mental risk)
Low 1 2 3 4 5 6 7 High
B: Car The purchase becomes too much of a strain on your economy (Financial risk)
Low 1 2 3 4 5 6 7 High
That the product does not fit your needs (Functional risk)
Low 1 2 3 4 5 6 7 High
That the product is unsafe (Physical risk)
Low 1 2 3 4 5 6 7 High
Disapproval from persons in your surroundings (Social risk)
Low 1 2 3 4 5 6 7 High
That the product will cause you stress (Mental risk)
Low 1 2 3 4 5 6 7 High

47
5. Is the salesperson important for you when you are going to buy these products? (in the form of expertise, does he/she have knowledge that you do not posses)
House: YES NO Car: YES NO
6. Imagine that you are going to buy a car, where both the tires and the audio system are familiar to you. However these products are sold as additional equipment at a higher price. But still you feel that the additional equipment is worth the extra money. The salesperson claim that the tires and the audio system already equipped is just a good and equal in quality, and that you save some money by choosing that alternative. What do you choose?
The first alternative I had in mind The salesperson’s recommendation
7. Imagine that you are going to buy a house, where both the kitchen and the kitchen appliances are familiar to you. However these products are sold as additional equipment at a higher price. But still you feel that the additional equipment is worth the extra money. The salesperson claim that the kitchen and the kitchen appliances already equipped is just a good and equal in quality, and that you save some money by choosing that alternative. What do you choose?
The first alternative I had in mind The salesperson’s recommendation
8. Do you recognise the following brands?
YES NO YES NO
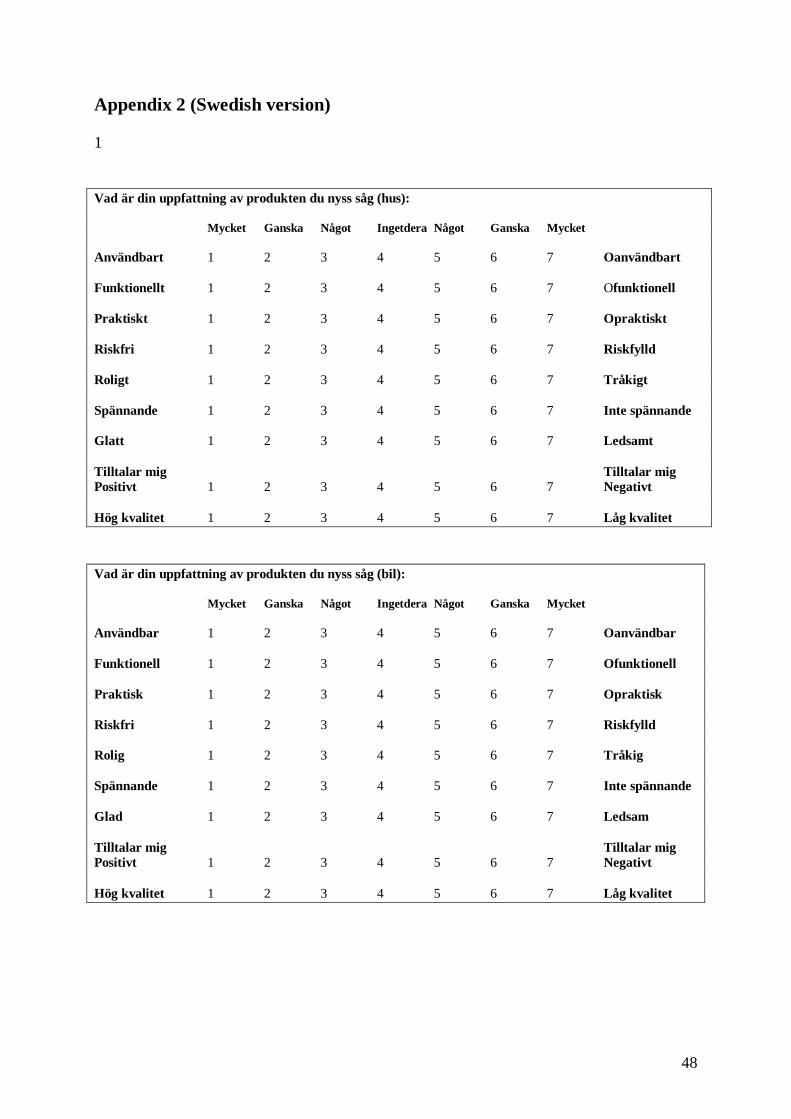
48
Appendix 2 (Swedish version) 1 Vad är din uppfattning av produkten du nyss såg (hus): Mycket Ganska Något Ingetdera Något Ganska Mycket Användbart 1 2 3 4 5 6 7 Oanvändbart Funktionellt 1 2 3 4 5 6 7 Ofunktionell Praktiskt 1 2 3 4 5 6 7 Opraktiskt Riskfri 1 2 3 4 5 6 7 Riskfylld Roligt 1 2 3 4 5 6 7 Tråkigt Spännande 1 2 3 4 5 6 7 Inte spännande Glatt 1 2 3 4 5 6 7 Ledsamt Tilltalar mig Tilltalar mig Positivt 1 2 3 4 5 6 7 Negativt Hög kvalitet 1 2 3 4 5 6 7 Låg kvalitet
Vad är din uppfattning av produkten du nyss såg (bil): Mycket Ganska Något Ingetdera Något Ganska Mycket Användbar 1 2 3 4 5 6 7 Oanvändbar Funktionell 1 2 3 4 5 6 7 Ofunktionell Praktisk 1 2 3 4 5 6 7 Opraktisk Riskfri 1 2 3 4 5 6 7 Riskfylld Rolig 1 2 3 4 5 6 7 Tråkig Spännande 1 2 3 4 5 6 7 Inte spännande Glad 1 2 3 4 5 6 7 Ledsam Tilltalar mig Tilltalar mig Positivt 1 2 3 4 5 6 7 Negativt Hög kvalitet 1 2 3 4 5 6 7 Låg kvalitet
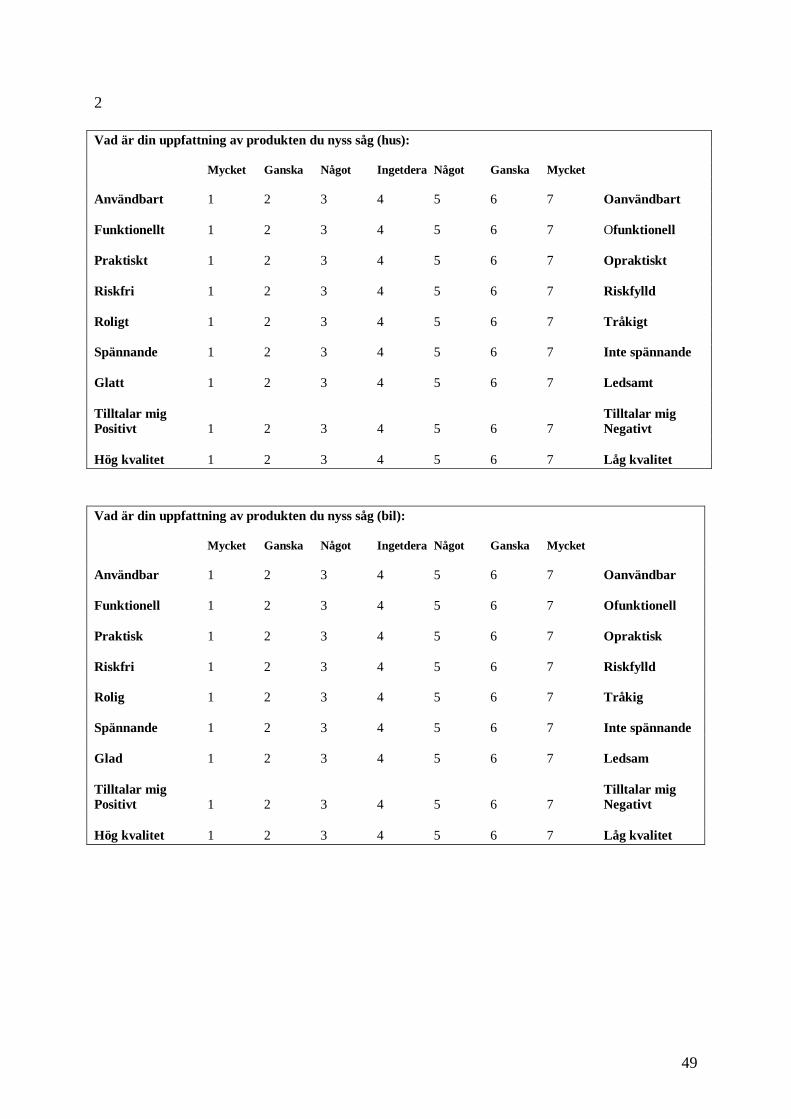
49
2 Vad är din uppfattning av produkten du nyss såg (hus): Mycket Ganska Något Ingetdera Något Ganska Mycket Användbart 1 2 3 4 5 6 7 Oanvändbart Funktionellt 1 2 3 4 5 6 7 Ofunktionell Praktiskt 1 2 3 4 5 6 7 Opraktiskt Riskfri 1 2 3 4 5 6 7 Riskfylld Roligt 1 2 3 4 5 6 7 Tråkigt Spännande 1 2 3 4 5 6 7 Inte spännande Glatt 1 2 3 4 5 6 7 Ledsamt Tilltalar mig Tilltalar mig Positivt 1 2 3 4 5 6 7 Negativt Hög kvalitet 1 2 3 4 5 6 7 Låg kvalitet
Vad är din uppfattning av produkten du nyss såg (bil): Mycket Ganska Något Ingetdera Något Ganska Mycket Användbar 1 2 3 4 5 6 7 Oanvändbar Funktionell 1 2 3 4 5 6 7 Ofunktionell Praktisk 1 2 3 4 5 6 7 Opraktisk Riskfri 1 2 3 4 5 6 7 Riskfylld Rolig 1 2 3 4 5 6 7 Tråkig Spännande 1 2 3 4 5 6 7 Inte spännande Glad 1 2 3 4 5 6 7 Ledsam Tilltalar mig Tilltalar mig Positivt 1 2 3 4 5 6 7 Negativt Hög kvalitet 1 2 3 4 5 6 7 Låg kvalitet

50
Uppföljningsfrågor
3. Hur skulle du beskriva din erfarenhet av A hus(fastigheter) och B bilar A: Låg 1 2 3 4 Hög B: Låg 1 2 3 4 Hög Tänk dig in i situationen att du ska köpa A ett hus och B en bil. Du överväger olika alternativ och försöker hitta den produkt som passar dig bäst.
4. Om du skulle köpa dessa produkter, hur skulle du beskriva att du upplever följande risker?
A: Hus Att köpet blir en för stor ansträngning för din ekonomi (Finansiella risken)
Låg 1 2 3 4 5 6 7 Hög
Att det visar sig att produkten inte passar dina behov (Funktionella risken)
Låg 1 2 3 4 5 6 7 Hög
Att produkten är osäker (Fysisk risk)
Låg 1 2 3 4 5 6 7 Hög
Ogillande från personer i din omgivning (Social risk)
Låg 1 2 3 4 5 6 7 Hög
Produkten kommer att orsaka dig stress (Psykologisk risk)
Låg 1 2 3 4 5 6 7 Hög
B: Bil Att köpet blir en för stor ansträngning för din ekonomi (Finansiella risken)
Låg 1 2 3 4 5 6 7 Hög
Att det visar sig att produkten inte passar dina behov (Funktionella risken)
Låg 1 2 3 4 5 6 7 Hög
Att produkten är osäker (Fysisk risk)
Låg 1 2 3 4 5 6 7 Hög
Ogillande från personer i din omgivning (Social risk)
Låg 1 2 3 4 5 6 7 Hög
Produkten kommer att orsaka dig stress (Psykologisk risk)
Låg 1 2 3 4 5 6 7 Hög
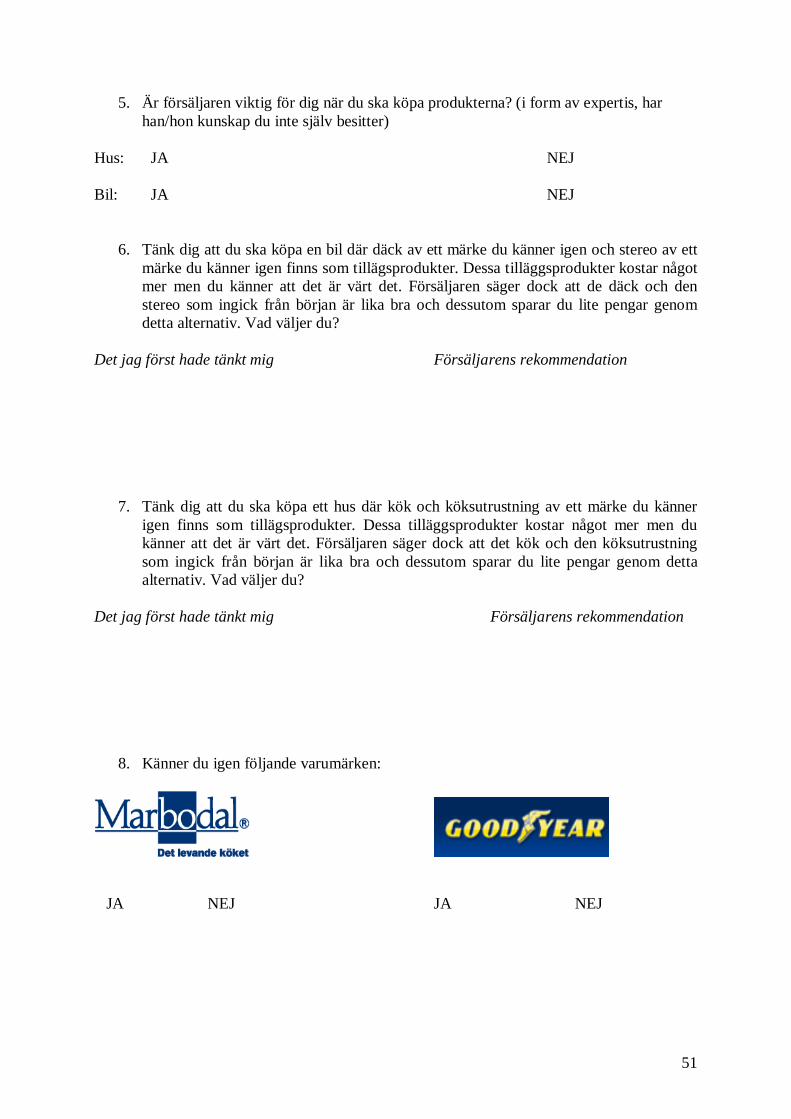
51
5. Är försäljaren viktig för dig när du ska köpa produkterna? (i form av expertis, har han/hon kunskap du inte själv besitter)
Hus: JA NEJ Bil: JA NEJ
6. Tänk dig att du ska köpa en bil där däck av ett märke du känner igen och stereo av ett märke du känner igen finns som tillägsprodukter. Dessa tilläggsprodukter kostar något mer men du känner att det är värt det. Försäljaren säger dock att de däck och den stereo som ingick från början är lika bra och dessutom sparar du lite pengar genom detta alternativ. Vad väljer du?
Det jag först hade tänkt mig Försäljarens rekommendation
7. Tänk dig att du ska köpa ett hus där kök och köksutrustning av ett märke du känner igen finns som tillägsprodukter. Dessa tilläggsprodukter kostar något mer men du känner att det är värt det. Försäljaren säger dock att det kök och den köksutrustning som ingick från början är lika bra och dessutom sparar du lite pengar genom detta alternativ. Vad väljer du?
Det jag först hade tänkt mig Försäljarens rekommendation
8. Känner du igen följande varumärken:
JA NEJ JA NEJ

52
Appendix 3

53

54
Appendix 4 House Experience * Respondent Cross tabulation
Respondent
Student Non-students Total
Lowest 14 4 18 Pretty Low 24 8 32 Pretty High 10 20 30
House Experience
Highest 2 18 20 Total 50 50 100
Car Experience * Respondent Cross tabulation
Respondent
Student Non-students Total
Lowest 10 4 14 Pretty Low 18 8 26 Pretty High 18 23 41
Car Experience
Highest 4 15 19 Total 50 50 100
Expert Importance House * Respondent Cross tabulation
Respondent
Student Non-students Total
Yes 47 43 90 Expert Importance House No 3 7 10 Total 50 50 100
Expert Importance Car * Respondent Cross tabulation
Respondent
Student Non-students Total
Yes 44 45 89 Expert Importance Car No 6 5 11 Total 50 50 100

55
App
endi
x 5
Co
rrel
atio
ns fo
r C
ar
Cor
rela
tions
CW
OU
sefu
ll C
WO
Fun
ctio
nal
CW
OP
ract
ical
C
WO
Ris
kfre
e C
WO
Use
full
Pea
rson
Cor
rela
tion
1 ,6
98(*
*)
,610
(**)
,4
80(*
*)
CW
OF
unct
iona
l P
ears
on C
orre
latio
n ,6
98(*
*)
1 ,6
39(*
*)
,462
(**)
C
WO
Pra
ctic
al
Pea
rson
Cor
rela
tion
,610
(**)
,6
39(*
*)
1 ,3
05(*
*)
CW
OR
iskf
ree
Pea
rson
Cor
rela
tion
,480
(**)
,4
62(*
*)
,305
(**)
1
CW
OF
un
Pea
rson
Cor
rela
tion
,300
(**)
,2
64(*
*)
,288
(**)
0,
19
CW
OT
hrill
ing
Pea
rson
Cor
rela
tion
,284
(**)
,2
36(*
) ,2
37(*
) ,2
20(*
) C
WO
Hap
py
Pea
rson
Cor
rela
tion
,309
(**)
,2
38(*
) ,2
46(*
) 0,
176
CW
OP
ositi
veap
peal
P
ears
on C
orre
latio
n ,5
32(*
*)
,417
(**)
,4
08(*
*)
,248
(*)
CW
OH
ighq
ualit
y P
ears
on C
orre
latio
n ,3
84(*
*)
,379
(**)
,2
93(*
*)
,509
(**)
C
WU
sefu
l P
ears
on C
orre
latio
n ,7
09(*
*)
,591
(**)
,4
77(*
*)
,303
(**)
C
WF
unct
iona
l P
ears
on C
orre
latio
n ,5
91(*
*)
,695
(**)
,5
25(*
*)
,376
(**)
C
WP
ract
ical
P
ears
on C
orre
latio
n ,6
64(*
*)
,601
(**)
,7
49(*
*)
,271
(**)
C
WR
iskf
ree
Pea
rson
Cor
rela
tion
,418
(**)
,4
25(*
*)
,276
(**)
,8
20(*
*)
CW
Fun
P
ears
on C
orre
latio
n ,3
06(*
*)
,248
(*)
,295
(**)
,2
10(*
) C
WT
hrill
ing
Pea
rson
Cor
rela
tion
,262
(**)
0,
192
,209
(*)
,220
(*)
CW
Hap
py
Pea
rson
Cor
rela
tion
,300
(**)
0,
183
,221
(*)
0,16
4 C
WP
ositi
veap
peal
P
ears
on C
orre
latio
n ,5
69(*
*)
,519
(**)
,4
76(*
*)
,325
(**)
C
WH
ighq
ualit
y P
ears
on C
orre
latio
n ,2
74(*
*)
,374
(**)
,2
87(*
*)
,411
(**)
**
Cor
rela
tion
is s
igni
fican
t at t
he 0
.01
leve
l (2-
taile
d).
* C
orre
latio
n is
sig
nific
ant a
t the
0.0
5 le
vel (
2-ta
iled)
.

56
CW
OF
un
CW
OT
hrill
ing
CW
OH
appy
C
WO
Pos
itive
appe
al
CW
OH
ighq
ualit
y C
WU
sefu
l C
WF
unct
iona
l C
WP
ract
ical
C
WR
iskf
ree
,300
(**)
,2
84(*
*)
,309
(**)
,5
32(*
*)
,384
(**)
,7
09(*
*)
,591
(**)
,6
64(*
*)
,418
(**)
,2
64(*
*)
,236
(*)
,238
(*)
,417
(**)
,3
79(*
*)
,591
(**)
,6
95(*
*)
,601
(**)
,4
25(*
*)
,288
(**)
,2
37(*
) ,2
46(*
) ,4
08(*
*)
,293
(**)
,4
77(*
*)
,525
(**)
,7
49(*
*)
,276
(**)
0,
19
,220
(*)
0,17
6 ,2
48(*
) ,5
09(*
*)
,303
(**)
,3
76(*
*)
,271
(**)
,8
20(*
*)
1 ,7
70(*
*)
,712
(**)
,6
71(*
*)
,300
(**)
,3
30(*
*)
,268
(**)
,4
60(*
*)
,236
(*)
,770
(**)
1
,682
(**)
,7
02(*
*)
,232
(*)
,301
(**)
,2
79(*
*)
,425
(**)
,3
03(*
*)
,712
(**)
,6
82(*
*)
1 ,6
39(*
*)
,219
(*)
,318
(**)
,2
36(*
) ,3
98(*
*)
,218
(*)
,671
(**)
,7
02(*
*)
,639
(**)
1
,347
(**)
,4
64(*
*)
,443
(**)
,5
79(*
*)
,333
(**)
,3
00(*
*)
,232
(*)
,219
(*)
,347
(**)
1
,354
(**)
,3
44(*
*)
,331
(**)
,5
16(*
*)
,330
(**)
,3
01(*
*)
,318
(**)
,4
64(*
*)
,354
(**)
1
,742
(**)
,6
39(*
*)
,362
(**)
,2
68(*
*)
,279
(**)
,2
36(*
) ,4
43(*
*)
,344
(**)
,7
42(*
*)
1 ,6
80(*
*)
,401
(**)
,4
60(*
*)
,425
(**)
,3
98(*
*)
,579
(**)
,3
31(*
*)
,639
(**)
,6
80(*
*)
1 ,3
34(*
*)
,236
(*)
,303
(**)
,2
18(*
) ,3
33(*
*)
,516
(**)
,3
62(*
*)
,401
(**)
,3
34(*
*)
1 ,7
65(*
*)
,686
(**)
,6
63(*
*)
,624
(**)
,2
02(*
) ,4
03(*
*)
,344
(**)
,4
62(*
*)
,252
(*)
,714
(**)
,8
47(*
*)
,644
(**)
,6
70(*
*)
,226
(*)
,334
(**)
,3
41(*
*)
,453
(**)
,3
20(*
*)
,678
(**)
,6
60(*
*)
,704
(**)
,5
56(*
*)
0,14
5 ,3
58(*
*)
,295
(**)
,3
84(*
*)
0,16
8 ,4
51(*
*)
,518
(**)
,4
04(*
*)
,750
(**)
,2
88(*
*)
,569
(**)
,6
01(*
*)
,679
(**)
,4
24(*
*)
,200
(*)
,224
(*)
0,12
1 ,2
86(*
*)
,702
(**)
,3
42(*
*)
,522
(**)
,3
96(*
*)
,511
(**)
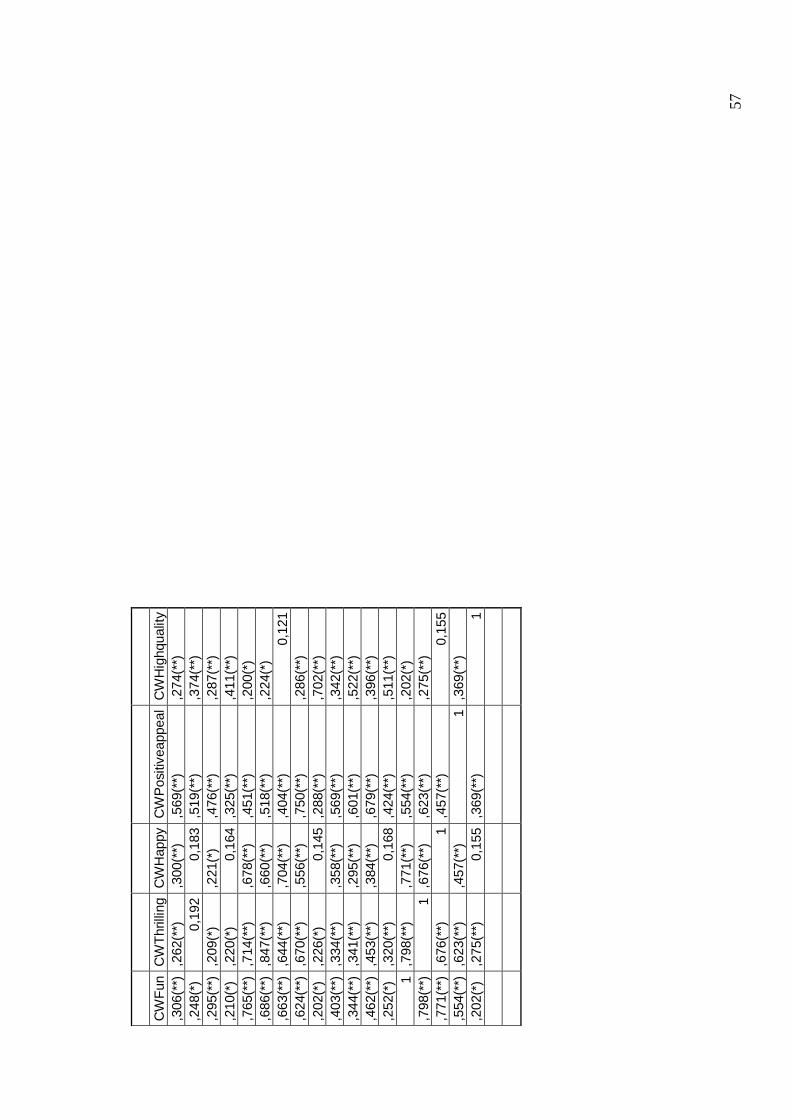
57
CW
Fun
C
WT
hrill
ing
CW
Hap
py
CW
Pos
itive
appe
al
CW
Hig
hqua
lity
,306
(**)
,2
62(*
*)
,300
(**)
,5
69(*
*)
,274
(**)
,2
48(*
) 0,
192
0,18
3 ,5
19(*
*)
,374
(**)
,2
95(*
*)
,209
(*)
,221
(*)
,476
(**)
,2
87(*
*)
,210
(*)
,220
(*)
0,16
4 ,3
25(*
*)
,411
(**)
,7
65(*
*)
,714
(**)
,6
78(*
*)
,451
(**)
,2
00(*
) ,6
86(*
*)
,847
(**)
,6
60(*
*)
,518
(**)
,2
24(*
) ,6
63(*
*)
,644
(**)
,7
04(*
*)
,404
(**)
0,
121
,624
(**)
,6
70(*
*)
,556
(**)
,7
50(*
*)
,286
(**)
,2
02(*
) ,2
26(*
) 0,
145
,288
(**)
,7
02(*
*)
,403
(**)
,3
34(*
*)
,358
(**)
,5
69(*
*)
,342
(**)
,3
44(*
*)
,341
(**)
,2
95(*
*)
,601
(**)
,5
22(*
*)
,462
(**)
,4
53(*
*)
,384
(**)
,6
79(*
*)
,396
(**)
,2
52(*
) ,3
20(*
*)
0,16
8 ,4
24(*
*)
,511
(**)
1
,798
(**)
,7
71(*
*)
,554
(**)
,2
02(*
) ,7
98(*
*)
1 ,6
76(*
*)
,623
(**)
,2
75(*
*)
,771
(**)
,6
76(*
*)
1 ,4
57(*
*)
0,15
5 ,5
54(*
*)
,623
(**)
,4
57(*
*)
1 ,3
69(*
*)
,202
(*)
,275
(**)
0,
155
,369
(**)
1
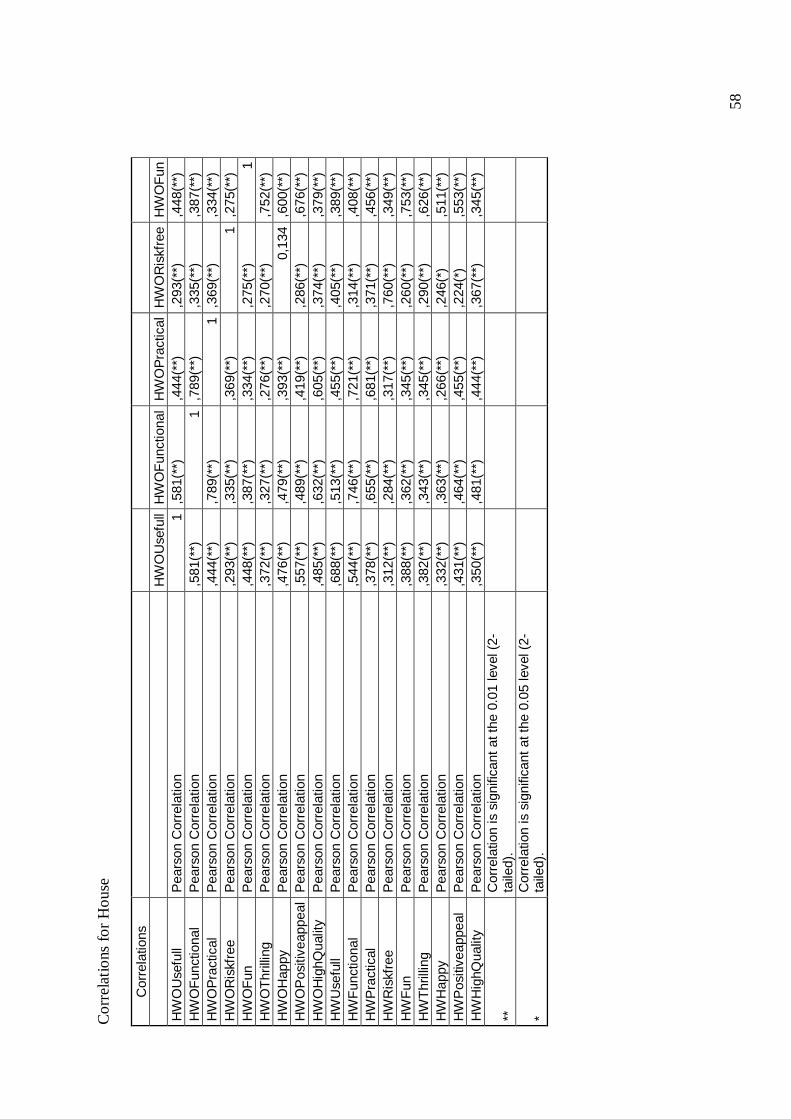
58
Co
rrel
atio
ns fo
r H
ous
e
Cor
rela
tions
H
WO
Use
full
HW
OF
unct
iona
l H
WO
Pra
ctic
al
HW
OR
iskf
ree
HW
OF
un
HW
OU
sefu
ll P
ears
on C
orre
latio
n 1
,581
(**)
,4
44(*
*)
,293
(**)
,4
48(*
*)
HW
OF
unct
iona
l P
ears
on C
orre
latio
n ,5
81(*
*)
1 ,7
89(*
*)
,335
(**)
,3
87(*
*)
HW
OP
ract
ical
P
ears
on C
orre
latio
n ,4
44(*
*)
,789
(**)
1
,369
(**)
,3
34(*
*)
HW
OR
iskf
ree
Pea
rson
Cor
rela
tion
,293
(**)
,3
35(*
*)
,369
(**)
1
,275
(**)
H
WO
Fun
P
ears
on C
orre
latio
n ,4
48(*
*)
,387
(**)
,3
34(*
*)
,275
(**)
1
HW
OT
hrill
ing
Pea
rson
Cor
rela
tion
,372
(**)
,3
27(*
*)
,276
(**)
,2
70(*
*)
,752
(**)
H
WO
Hap
py
Pea
rson
Cor
rela
tion
,476
(**)
,4
79(*
*)
,393
(**)
0,
134
,600
(**)
H
WO
Pos
itive
appe
al
Pea
rson
Cor
rela
tion
,557
(**)
,4
89(*
*)
,419
(**)
,2
86(*
*)
,676
(**)
H
WO
Hig
hQua
lity
Pea
rson
Cor
rela
tion
,485
(**)
,6
32(*
*)
,605
(**)
,3
74(*
*)
,379
(**)
H
WU
sefu
ll P
ears
on C
orre
latio
n ,6
88(*
*)
,513
(**)
,4
55(*
*)
,405
(**)
,3
89(*
*)
HW
Fun
ctio
nal
Pea
rson
Cor
rela
tion
,544
(**)
,7
46(*
*)
,721
(**)
,3
14(*
*)
,408
(**)
H
WP
ract
ical
P
ears
on C
orre
latio
n ,3
78(*
*)
,655
(**)
,6
81(*
*)
,371
(**)
,4
56(*
*)
HW
Ris
kfre
e P
ears
on C
orre
latio
n ,3
12(*
*)
,284
(**)
,3
17(*
*)
,760
(**)
,3
49(*
*)
HW
Fun
P
ears
on C
orre
latio
n ,3
88(*
*)
,362
(**)
,3
45(*
*)
,260
(**)
,7
53(*
*)
HW
Thr
illin
g P
ears
on C
orre
latio
n ,3
82(*
*)
,343
(**)
,3
45(*
*)
,290
(**)
,6
26(*
*)
HW
Hap
py
Pea
rson
Cor
rela
tion
,332
(**)
,3
63(*
*)
,266
(**)
,2
46(*
) ,5
11(*
*)
HW
Pos
itive
appe
al
Pea
rson
Cor
rela
tion
,431
(**)
,4
64(*
*)
,455
(**)
,2
24(*
) ,5
53(*
*)
HW
Hig
hQua
lity
Pea
rson
Cor
rela
tion
,350
(**)
,4
81(*
*)
,444
(**)
,3
67(*
*)
,345
(**)
**
Cor
rela
tion
is s
igni
fican
t at t
he 0
.01
leve
l (2-
taile
d).
* C
orre
latio
n is
sig
nific
ant a
t the
0.0
5 le
vel (
2-ta
iled)
.
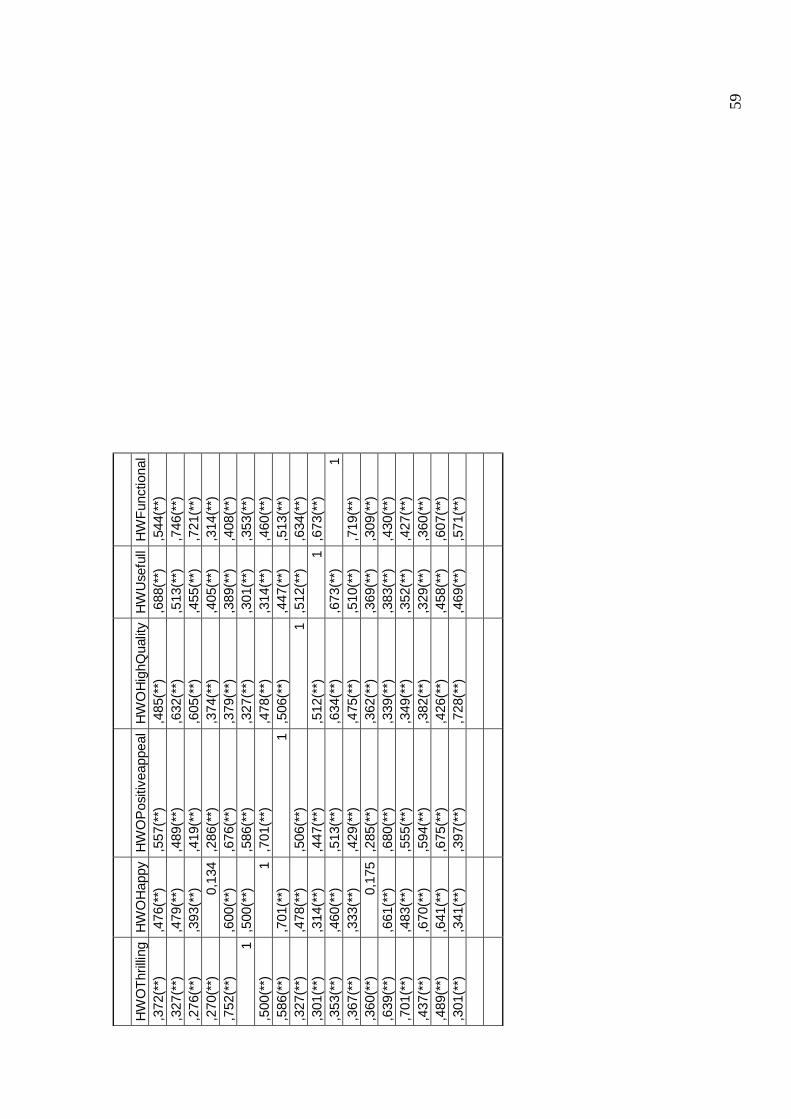
59
HW
OT
hrill
ing
HW
OH
appy
H
WO
Pos
itive
appe
al
HW
OH
ighQ
ualit
y H
WU
sefu
ll H
WF
unct
iona
l ,3
72(*
*)
,476
(**)
,5
57(*
*)
,485
(**)
,6
88(*
*)
,544
(**)
,3
27(*
*)
,479
(**)
,4
89(*
*)
,632
(**)
,5
13(*
*)
,746
(**)
,2
76(*
*)
,393
(**)
,4
19(*
*)
,605
(**)
,4
55(*
*)
,721
(**)
,2
70(*
*)
0,13
4 ,2
86(*
*)
,374
(**)
,4
05(*
*)
,314
(**)
,7
52(*
*)
,600
(**)
,6
76(*
*)
,379
(**)
,3
89(*
*)
,408
(**)
1
,500
(**)
,5
86(*
*)
,327
(**)
,3
01(*
*)
,353
(**)
,5
00(*
*)
1 ,7
01(*
*)
,478
(**)
,3
14(*
*)
,460
(**)
,5
86(*
*)
,701
(**)
1
,506
(**)
,4
47(*
*)
,513
(**)
,3
27(*
*)
,478
(**)
,5
06(*
*)
1 ,5
12(*
*)
,634
(**)
,3
01(*
*)
,314
(**)
,4
47(*
*)
,512
(**)
1
,673
(**)
,3
53(*
*)
,460
(**)
,5
13(*
*)
,634
(**)
,6
73(*
*)
1 ,3
67(*
*)
,333
(**)
,4
29(*
*)
,475
(**)
,5
10(*
*)
,719
(**)
,3
60(*
*)
0,17
5 ,2
85(*
*)
,362
(**)
,3
69(*
*)
,309
(**)
,6
39(*
*)
,661
(**)
,6
80(*
*)
,339
(**)
,3
83(*
*)
,430
(**)
,7
01(*
*)
,483
(**)
,5
55(*
*)
,349
(**)
,3
52(*
*)
,427
(**)
,4
37(*
*)
,670
(**)
,5
94(*
*)
,382
(**)
,3
29(*
*)
,360
(**)
,4
89(*
*)
,641
(**)
,6
75(*
*)
,426
(**)
,4
58(*
*)
,607
(**)
,3
01(*
*)
,341
(**)
,3
97(*
*)
,728
(**)
,4
69(*
*)
,571
(**)
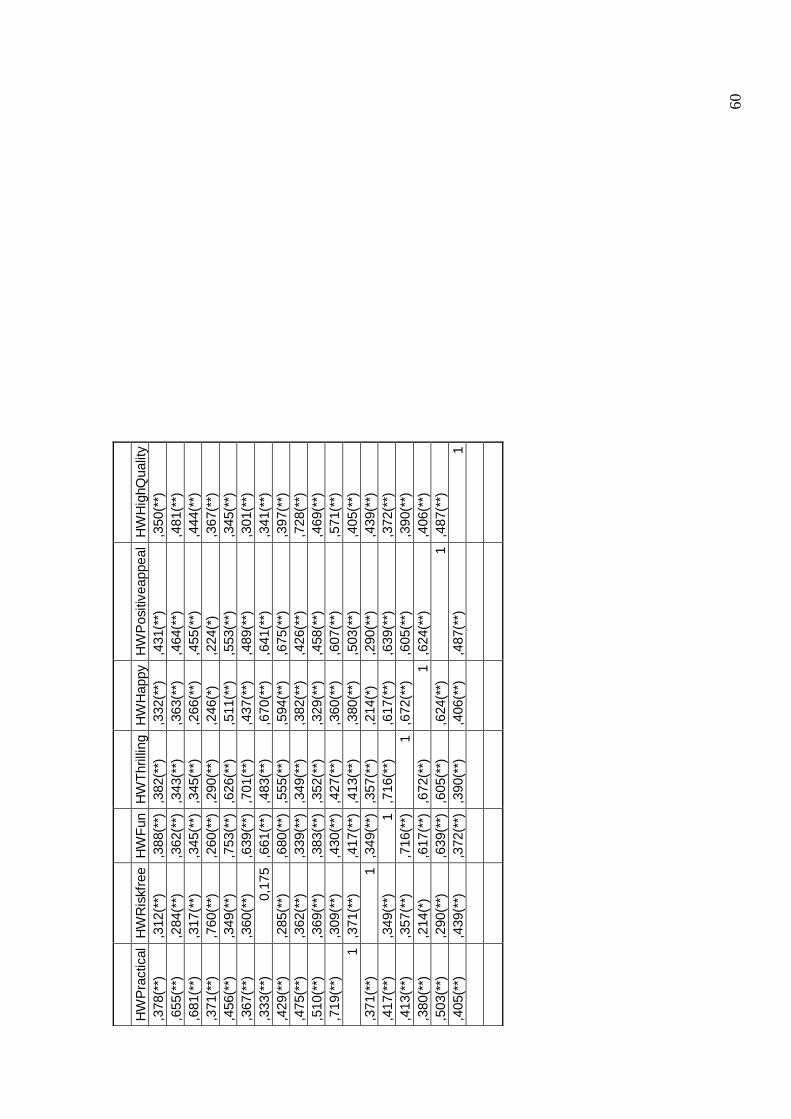
60
H
WP
ract
ical
H
WR
iskf
ree
HW
Fun
H
WT
hrill
ing
HW
Hap
py
HW
Pos
itive
appe
al
HW
Hig
hQua
lity
,378
(**)
,3
12(*
*)
,388
(**)
,3
82(*
*)
,332
(**)
,4
31(*
*)
,350
(**)
,6
55(*
*)
,284
(**)
,3
62(*
*)
,343
(**)
,3
63(*
*)
,464
(**)
,4
81(*
*)
,681
(**)
,3
17(*
*)
,345
(**)
,3
45(*
*)
,266
(**)
,4
55(*
*)
,444
(**)
,3
71(*
*)
,760
(**)
,2
60(*
*)
,290
(**)
,2
46(*
) ,2
24(*
) ,3
67(*
*)
,456
(**)
,3
49(*
*)
,753
(**)
,6
26(*
*)
,511
(**)
,5
53(*
*)
,345
(**)
,3
67(*
*)
,360
(**)
,6
39(*
*)
,701
(**)
,4
37(*
*)
,489
(**)
,3
01(*
*)
,333
(**)
0,
175
,661
(**)
,4
83(*
*)
,670
(**)
,6
41(*
*)
,341
(**)
,4
29(*
*)
,285
(**)
,6
80(*
*)
,555
(**)
,5
94(*
*)
,675
(**)
,3
97(*
*)
,475
(**)
,3
62(*
*)
,339
(**)
,3
49(*
*)
,382
(**)
,4
26(*
*)
,728
(**)
,5
10(*
*)
,369
(**)
,3
83(*
*)
,352
(**)
,3
29(*
*)
,458
(**)
,4
69(*
*)
,719
(**)
,3
09(*
*)
,430
(**)
,4
27(*
*)
,360
(**)
,6
07(*
*)
,571
(**)
1
,371
(**)
,4
17(*
*)
,413
(**)
,3
80(*
*)
,503
(**)
,4
05(*
*)
,371
(**)
1
,349
(**)
,3
57(*
*)
,214
(*)
,290
(**)
,4
39(*
*)
,417
(**)
,3
49(*
*)
1 ,7
16(*
*)
,617
(**)
,6
39(*
*)
,372
(**)
,4
13(*
*)
,357
(**)
,7
16(*
*)
1 ,6
72(*
*)
,605
(**)
,3
90(*
*)
,380
(**)
,2
14(*
) ,6
17(*
*)
,672
(**)
1
,624
(**)
,4
06(*
*)
,503
(**)
,2
90(*
*)
,639
(**)
,6
05(*
*)
,624
(**)
1
,487
(**)
,4
05(*
*)
,439
(**)
,3
72(*
*)
,390
(**)
,4
06(*
*)
,487
(**)
1
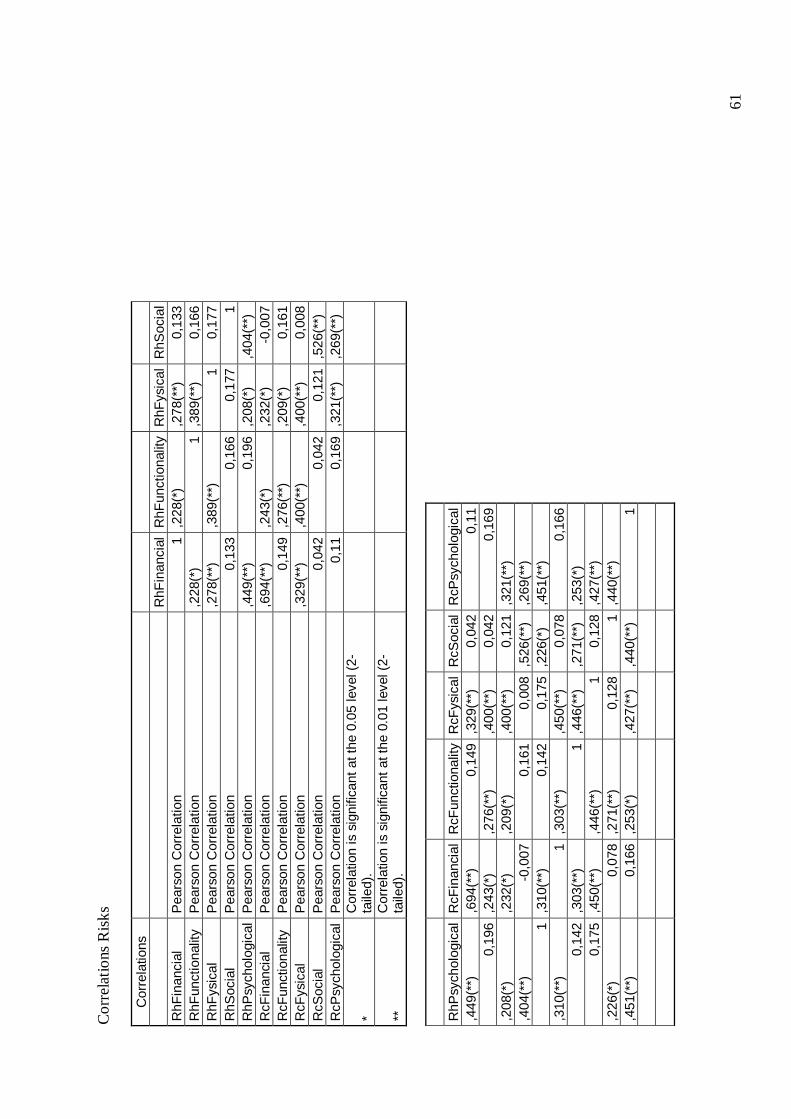
61
Co
rrel
atio
ns R
isks
Cor
rela
tions
RhF
inan
cial
R
hFun
ctio
nalit
y R
hFys
ical
R
hSoc
ial
RhF
inan
cial
P
ears
on C
orre
latio
n 1
,228
(*)
,278
(**)
0,
133
RhF
unct
iona
lity
Pea
rson
Cor
rela
tion
,228
(*)
1 ,3
89(*
*)
0,16
6 R
hFys
ical
P
ears
on C
orre
latio
n ,2
78(*
*)
,389
(**)
1
0,17
7 R
hSoc
ial
Pea
rson
Cor
rela
tion
0,13
3 0,
166
0,17
7 1
RhP
sych
olog
ical
P
ears
on C
orre
latio
n ,4
49(*
*)
0,19
6 ,2
08(*
) ,4
04(*
*)
RcF
inan
cial
P
ears
on C
orre
latio
n ,6
94(*
*)
,243
(*)
,232
(*)
-0,0
07
RcF
unct
iona
lity
Pea
rson
Cor
rela
tion
0,14
9 ,2
76(*
*)
,209
(*)
0,16
1 R
cFys
ical
P
ears
on C
orre
latio
n ,3
29(*
*)
,400
(**)
,4
00(*
*)
0,00
8 R
cSoc
ial
Pea
rson
Cor
rela
tion
0,04
2 0,
042
0,12
1 ,5
26(*
*)
RcP
sych
olog
ical
P
ears
on C
orre
latio
n 0,
11
0,16
9 ,3
21(*
*)
,269
(**)
* C
orre
latio
n is
sig
nific
ant a
t the
0.0
5 le
vel (
2-ta
iled)
.
**
Cor
rela
tion
is s
igni
fican
t at t
he 0
.01
leve
l (2-
taile
d).
RhP
sych
olog
ical
R
cFin
anci
al
RcF
unct
iona
lity
RcF
ysic
al
RcS
ocia
l R
cPsy
chol
ogic
al
,449
(**)
,6
94(*
*)
0,14
9 ,3
29(*
*)
0,04
2 0,
11
0,19
6 ,2
43(*
) ,2
76(*
*)
,400
(**)
0,
042
0,16
9 ,2
08(*
) ,2
32(*
) ,2
09(*
) ,4
00(*
*)
0,12
1 ,3
21(*
*)
,404
(**)
-0
,007
0,
161
0,00
8 ,5
26(*
*)
,269
(**)
1
,310
(**)
0,
142
0,17
5 ,2
26(*
) ,4
51(*
*)
,310
(**)
1
,303
(**)
,4
50(*
*)
0,07
8 0,
166
0,14
2 ,3
03(*
*)
1 ,4
46(*
*)
,271
(**)
,2
53(*
) 0,
175
,450
(**)
,4
46(*
*)
1 0,
128
,427
(**)
,2
26(*
) 0,
078
,271
(**)
0,
128
1 ,4
40(*
*)
,451
(**)
0,
166
,253
(*)
,427
(**)
,4
40(*
*)
1
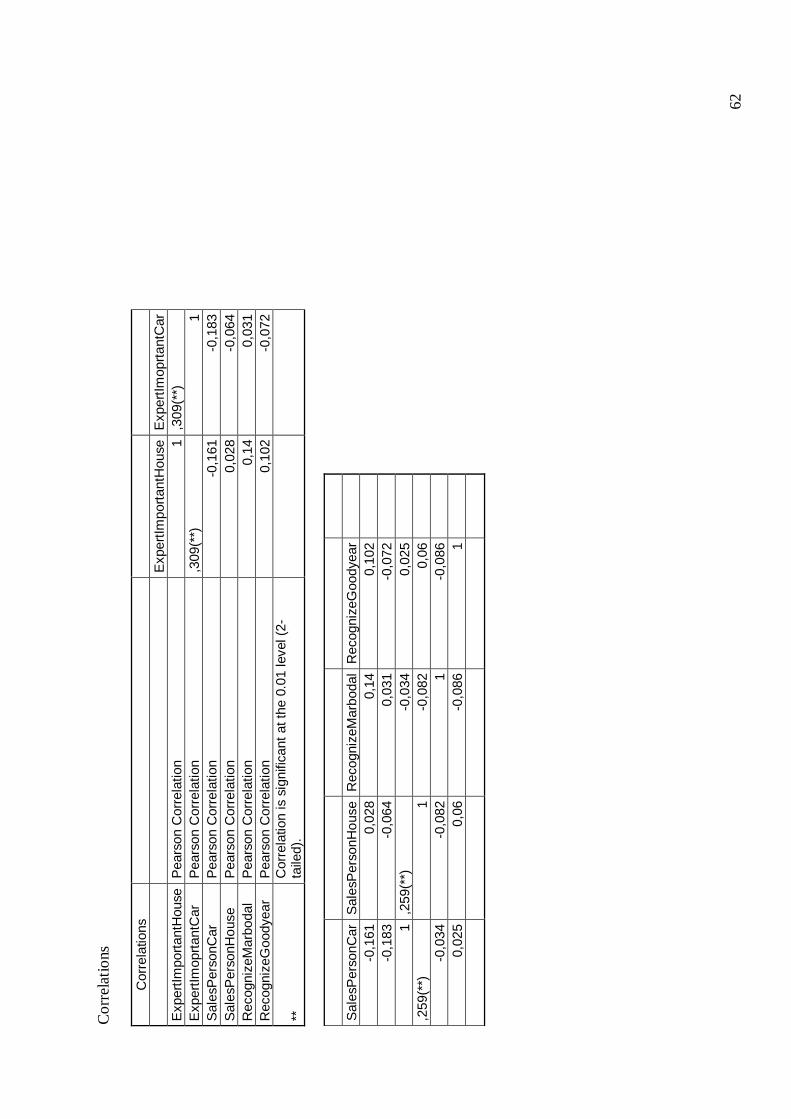
62
Co
rrel
atio
ns
C
orre
latio
ns
E
xper
tImpo
rtan
tHou
se
Exp
ertIm
oprt
antC
ar
Exp
ertIm
port
antH
ouse
P
ears
on C
orre
latio
n 1
,309
(**)
E
xper
tImop
rtan
tCar
P
ears
on C
orre
latio
n ,3
09(*
*)
1 S
ales
Per
sonC
ar
Pea
rson
Cor
rela
tion
-0,1
61
-0,1
83
Sal
esP
erso
nHou
se
Pea
rson
Cor
rela
tion
0,02
8 -0
,064
R
ecog
nize
Mar
boda
l P
ears
on C
orre
latio
n 0,
14
0,03
1 R
ecog
nize
Goo
dyea
r P
ears
on C
orre
latio
n 0,
102
-0,0
72
**
Cor
rela
tion
is s
igni
fican
t at t
he 0
.01
leve
l (2-
taile
d).
S
ales
Per
sonC
ar
Sal
esP
erso
nHou
se
Rec
ogni
zeM
arbo
dal
Rec
ogni
zeG
oody
ear
-0
,161
0,
028
0,14
0,
102
-0
,183
-0
,064
0,
031
-0,0
72
1
,259
(**)
-0
,034
0,
025
,2
59(*
*)
1 -0
,082
0,
06
-0
,034
-0
,082
1
-0,0
86
0,
025
0,06
-0
,086
1

63
Appendix 6 Reliability Statistics – House without Ingredient B rand
Cronbach's Alpha
Cronbach's Alpha Based
on Standardized
Items N of Items
,880 ,882 9
Reliability Statistics- House with Ingredient Brand
Cronbach's Alpha
Cronbach's Alpha Based
on Standardized
Items N of Items
,883 ,885 9
Reliability Statistics- Car without Ingredient Bran d
Cronbach's Alpha
Cronbach's Alpha Based
on Standardized
Items N of Items
,859 ,860 9
Reliability Statistics- Car with Ingredient Brand
Cronbach's Alpha
Cronbach's Alpha Based
on Standardized
Items N of Items
,879 ,880 9
Reliability Statistics- House Risks
Cronbach's Alpha
Cronbach's Alpha Based
on Standardized
Items N of Items
,694 ,693 6
Reliability Statistics – Car Risks
Cronbach's Alpha
Cronbach's Alpha Based
on Standardized
Items N of Items
,680 ,678 5
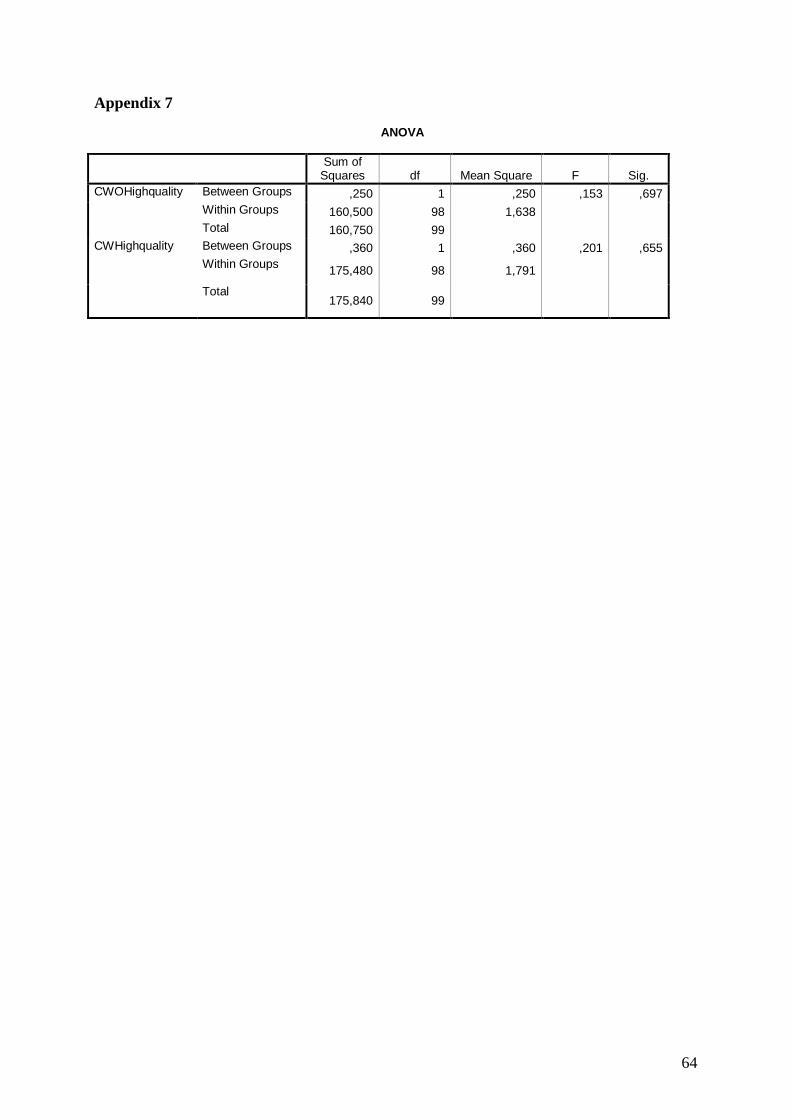
64
Appendix 7 ANOVA
Sum of
Squares df Mean Square F Sig. CWOHighquality Between Groups ,250 1 ,250 ,153 ,697 Within Groups 160,500 98 1,638 Total 160,750 99 CWHighquality Between Groups ,360 1 ,360 ,201 ,655 Within Groups 175,480 98 1,791
Total 175,840 99