inheritance, gender, and intergenerational evidence...
TRANSCRIPT
Institute for International Economic Policy Working Paper Series Elliott School of International Affairs The George Washington University
Cultural Inheritance, Gender, and Intergenerational Occupational Mobility: Evidence from a Developing
Economy
IIEPWP200812
M. Shahe Emran George Washington University
Forhad Shilpi
DECRG, World Bank
Institute for International Economic Policy 1957 E St. NW, Suite 501 Voice: (202) 994‐5320 Fax: (202) 994‐5477 Email: [email protected] Web: www.gwu.edu/~iiep
Cultural Inheritance, Gender, and Intergenerational Occupational
Mobility: Evidence from a Developing Economy
M. Shahe Emran1
George Washington University
and IPD, Columbia University
Forhad Shilpi
DECRG, World Bank
ABSTRACT
This paper presents evidence on intergenerational occupational mobility from agriculture to
the nonfarm sector using survey data from Nepal with a focus on the role played by cultural
inheritance and gender norms. In the absence of credible instruments, the degree of selection on
observables is used as a guide to the degree of selection on unobservables a la Altonji et. al. (2005)
to address the unobserved genetic correlations. The results show that cultural inheritance plays
a causal role in intergenerational occupational correlation between the mother and daughter. In
contrast, there is no robust evidence that cultural inheritance is important for sons’ occupation
choice. A moderate genetic correlation can easily explain away the estimated partial correlation
in non-farm participation between the father and a son.
Keywords: Intergenerational Occupational Correlations, Non-Farm Participation, Gender ef-
fect, Cultural Inheritance, Selection on Observables, Selection on Unobservables
JEL Codes: J62, O121We are grateful to Todd Elder and Chris Taber for very useful comments on an earlier draft, especially regarding
the econometric issues. We would also like to thank Paul Carrillo, Bob Goldfarb, Don Parsons, Dilip Mookherjee,Bhashkar Mazumder, David Ribar, and Stephen Smith for useful comments, and Todd Elder for sharing STATAand MATLAB routines for implementation of the econometric estimation. The standard disclaimers apply. Emailsfor correspondence: [email protected] (M. Shahe Emran), [email protected] (Forhad shilpi).
(1) Introduction
The evolution of income distribution, inequality and occupational structure across gen-
erations has attracted increasing attention in recent economic literature.1 This renewed
interest reflects a widely shared view that strong intergenerational linkages in socioeco-
nomic status may reflect inequality of opportunities and thus have profound implications
for poverty, inequality and (im)mobility in a society. A large body of econometric studies
focusing mainly on developed countries finds that intergenerational correlations in earn-
ings are positive and statistically significant, ranging between 0.14 to 0.50 (see Blanden
et. al. (2005) and Solon (1999, 2002)). There is a (relatively) small empirical literature
in economics, again mostly in the context of developed countries, that indicates significant
positive correlations between parents and their children in occupational choices (see, for
example, Lentz and Laband (1983), and Dunn and Holtz-Eakin (2000) on U.S and Sjogren
(2000) on Sweden). Economic analysis of intergenerational mobility in developing coun-
tries, however, remains a relatively unexplored terrain,2 even though the importance of such
analysis has been duly recognized in the recent literature.3 In this paper, we present evi-
dence on the intergenerational occupational linkages in the non-farm sector in a developing
1See, for example, Arrow et al. (2000), Dearden et. al. (1997), Mulligan (1999), Solon (1999, 2002),Birdsall and Graham (1999), Fields (2001), Fields et. al. (2005), Bowles et. al. (2005), Blanden et.al. (2005), WDR (2005), Mazumder (2005), Hertz (2005), Mookherjee and Ray (2006), Bjorklund et. al.(2006).
2This is exemplified by the fact that Solon (2002) refers to only two studies on developing countries in hissurvey of economic mobility (Lillard and Kilburn (1995) on Malaysia, and Hertz (2001) on South Africa).The recent analysis of economic mobility in the context of developing countries include Lam and Schoeni(1993), Behrman et. al. (2001), Fields et. al. (2005), Dunn (2004). There is, however, a substantialsociological literature that analyzes occupational mobility in both developed and developing countries (see,Ganzeboom et. al. (1991), Morgan, (2005)).
3For example, Bardhan (2005) identifies intergenerational economic mobility as one of the importantbut under-researched areas in development economics.
1
country, Nepal.4 Our focus in this paper is on two issues: (i) intergenerational occupa-
tional persistence beyond both the observed determinants like education and assets, and
the unobserved genetic correlations, and (ii) gender differences in occupational mobility.
As discussed in the theoretical literature on economic mobility, there are many causal pro-
cesses at work behind the observed intergenerational correlations in socio-economic status.
They include (i) conscious investments by parents like human capital investment, and (ii)
cultural inheritance that include role model effects and learning and reputation externali-
ties (Becker and Tomes, 1979, 1986, Solon, 2004, Bjorklund et. al. 2007).5 The role played
by cultural inheritance has, however, not received adequate attention in the economic liter-
ature on intergenerational mobility. We provide evidence that cultural inheritance might
play a causal role in occupational linkages across generations for daughters in Nepal, but
find little evidence of such effects in case of sons.
There might be important gender differences in the role cultural inheritance plays in
occupation choices, especially in developing countries where cultural norms usually con-
strain women’s social and economic interactions (Collier, 1988, World Bank, 2001). Since
the domain of social interaction for women in a traditional society is limited mostly within
and around the household, it is likely that the influence of parents, especially mothers, on
their choices will be much more pronounced. This might give rise to significant role model
4As emphasized by Goldberger (1989), there are some important advantages to focusing on occupationalmobility rather than income mobility. For example, the intergenerational linkages might be stronger foroccupation choice (relative to income), and focusing on income correlations “could lead an economist tounderstate the influence of family background on inequality” (P.513).
5The distinction related to whether parental investment is conscious or not may, however, be overdrawn.In the context of occupational choice one important part of cultural inheritance of children is the informalapprenticeship under the tutelage of the parents. The informal apprenticeship is a conscious investmentdecision by the parents in terms of their time allocation.
2
effects for daughters.6 In contrast, men in most of the developing countries have much
more freedom in social and economic interactions, and thus the set of role models is much
richer and also learning externalities may be more diffused. This is likely to weaken the
effects of the parents, especially fathers, on the choices of sons including their choice of
occupations. The empirical results reported in this paper provide evidence consistent with
such gender differences in cultural inheritance in a traditional rural society, Nepal. Nepal
is an interesting case study to understand the gender differences as there are strong social
and cultural norms regarding gender roles that work against women’s economic mobility
(for more details, please see P. 12).
The literature on the intergenerational economic mobility has been fraught with econo-
metric challenges that arise from the unobservability of the genetic characteristics (ability
and preference transmissions across generations), and the partial correlations observed in
the data (from multivariate regressions) might be driven largely by such unobserved ge-
netic correlations between parents and children.7 In the absence of experimental data,8
the standard approach to identification when facing unobserved heterogeneity like ability
correlations is to look for credible instrumental variables (IV). In the specific context of
6Bevan et. al. (1986) provide preliminary evidence that role model effects are important in the choiceof crops and occupation choice of women in rural Africa.
7Genetic transmissions relevant for occupational choice include both ability and preference (especiallythe degree of risk aversion). However, the focus of the literature has been on ability correlations. In whatfollows, we couch the discussion primarily in terms of ability correlations, following the literature.
We, however, note that one should not take the distinction between genetic transmissions and otherenvironmental factors too far. The evidence from Behavioral Genetics shows that there may be significantdynamic interactions between nature and nurture in determining human behavior (see, for example, Plominet. al. (2001), Boyd and Richerson, 1985).
8Designing and implementing a randomized experiment that can generate the data required for under-standing the intergenerational occupational persistence can be challenging on both ethical and feasibilitygrounds.
3
occupational mobility, the econometric challenge is to find exogenous variation that affects
parental occupation choice but does not have any independent effect on children’s occupa-
tion choice. However, most of the potential candidates for IV such as family background
variables that affect parent’s occupation choice tend to affect children’s choice also. Thus
it is difficult to defend the exclusion restriction. Moreover, the common practice of using
parental characteristics (like parental education) as IVs is also suspect, as they are likely
to be correlated with the unobserved common ability subsumed in the error term, and
thus likely to violate the exogeneity criterion. There is a small literature in economics
that uses adoption as a quasi-experimental design to isolate the effects of environmental
factors in intergenerational economic mobility (see, for example, Bjorklund et. al. (2006);
Plug (2004); Plug and Vijverberg (2003), Scaerdote (2002)). A third strategy is to use
twin samples to try to isolate the effects of nurture from that of nature (see, for example,
Behrman and Rosenzweig (2002)). However, these studies using adoption or twin sam-
ples are confined mostly in the developed countries where such data of reliable quality are
available. In the absence of quasi-experimental data on adoptions and twins or any cred-
ible identifying instruments, we exploit the econometric methodology recently developed
by Altonji, Elder and Taber (2005, 2000) (henceforth AET (2005, 2000)) which provides a
way to gauge the importance of unobserved genetic transmissions in explaining an observed
partial correlation. This helps to determine if at least part of the observed partial correla-
tion is causal due to environmental factors like cultural inheritance. We note that genetic
transmissions (ability and preference) influence both parents’ and children’s nonfarm par-
ticipation decisions and hence can be treated as an unobserved correlated determinant of
4
nonfarm employment choices of both generations. This allows us to utilize a battery of
recently developed econometric tests to ascertain whether the observed intergenerational
occupational correlations can be attributed solely to the unobserved ability correlations
between children and their parents.
The results from the econometric analysis are as follows. The univariate probit estima-
tion indicates the presence of strong and positive intergenerational occupational correlations
along gender lines (mother-daughter and father-son) even after controlling for a rich set of
regressors including education (own, parents’ and spouse’s), assets (inherited land), age and
ethnicity (caste/tribe). The estimated occupational linkages from univariate probit can,
however, at least in principle, be due entirely to genetic transmissions across generations
rather than cultural inheritance. The evidence from the econometric analysis using the
AET (2005) methodology shows that this might actually be the case for the observed occu-
pational correlation between the father and son; even a moderate correlation of unobserved
ability can explain away the estimated occupational linkage completely. The intergenera-
tional occupational correlation between mother and daughter, on the other hand, is very
strong and unlikely to be driven solely by unobserved genetic correlations. The evidence
thus suggests that at least part of the correlation between mother and daughter is likely
to be causal due to cultural inheritance that includes role model effects, apprenticeship
externalities and transfer of reputation and social capital from parents to children.
The substantive conclusions above are very robust, confirmed by alternative economet-
ric techniques as developed by AET (2005. 2000): (i) sensitivity analysis using a bivariate
probit model, and (ii) estimates of lower bounds on intergenerational occupational corre-
5
lations.9 In case of daughters, the lower bound estimate of intergenerational occupational
correlation with mother is 0.66 with an implied marginal effect of 0.14 and t-value of 4.8.
The 95 percent confidence interval for the marginal effect is [0.07 0.24], which does not in-
clude zero. These results suggest that the genetic correlations account for about half of the
partial correlation between the mother and a daughter given that the marginal effect in the
univariate probit model is 0.30. The other half of the intergenerational correlation can be
attributed to cultural inheritance by a daughter from her mother in the form of role model
effects, learning externalities and transfer of reputation and social capital.10 In the case of
sons, the lower bound estimate is negative and statistically insignificant which implies that
the observed partial correlation may be driven entirely by the unobserved factors common
to both generations. The results from the sensitivity analysis yield the same conclusions as
above.11
A better understanding of occupational mobility in a developing economy is important
for the design of appropriate poverty alleviation policies. Mobility from agriculture to non-
9The empirical methodology proposed by AET (2005, 2000) can be used to provide a lower bound onintergenerational occupational correlation under the assumption that the ‘selection on observables’ is atleast as large as the ‘selection on unobservables’. As we discuss in more detail later in the text, theassumption that the selection on observables dominates the selection on unobservables is a natural one foranalyzing the role of cultural inheritance in intergenerational occupational mobility which is the focus ofthis paper. The univariate probit model assumes “no selection on unobservables” and thus can be thoughtof as the upper bound estimate of the intergenerational correlation.
10Note that the environmental factors like role model effects and learning externalities only affect the oc-cupational choice of children and thus are NOT subsumed under the common intergenerational correlation.
11Following AET (2005, 2000) we also estimate the bias in the partial correlation estimates from uni-variate probit. The estimates of the bias might be useful as robustness check as they are not dependent ondistributional assumptions. However, as noted by AET (2005, 2000), the bias estimates are based on thestrong assumption that the bias in the linear projection is similar to the bias in the probit equation. Sincethis assumption is difficult to justify, we chose not to present the bias estimates (available upon request).We, however, note that the bias estimates also lend strong support to the central conclusions discussedabove.
6
farm is often an avenue to escape poverty trap (WDR (2005); Lanjouw and Feder (2001)).
In the presence of cultural inheritance effects, the standard cost-benefit analysis is likely to
under-estimate the long-run social returns to policy interventions that encourage non-farm
participation (like microcredit programs), as the intergenerational multiplier effect arising
from factors like role model effects is ignored. Moreover, non-farm participation often
leads to ‘visible’ income contribution by women and thus positively affects their bargaining
power.12
The rest of the paper is organized as follows. Section 2 provides a conceptual framework
that underpins the empirical work presented in the subsequent sections. The section 3
discusses the data and variables, while the next section presents some preliminary evidence.
Section 4, arranged in a number of subsections, presents the main empirical results that
focus on gauging the role played by unobserved common determinants of occupational
choice across generations following the approach due to AET (2005, 2000). Section 5
concludes the paper with a summary of the main findings.
(2) The Conceptual Framework
In this section, we outline a simple model of participation in nonfarm sector highlighting
different channels through which intergenerational linkages may operate. Our focus is on
the role cultural inheritance might play through factors like role model effects, learning
externalities and transfer of reputation and social capital from parents to children. The
model is based on the standard occupational choice model but is augmented to capture the
12Women’s work in agriculture is usually unpaid and remains invisible in a developing country like Nepal.
7
essentials of the intergenerational linkages.13
There are two sectors in the economy: agriculture (A) and non-farm sector (N). At
the beginning of the working life, every person in the economy decides which sector to
work for. Each individual is endowed with an innate ability θi ∈ [0, 1] that captures the
attributes that are relevant for non-farm sector. So the higher is θi the better suited an
individual is for non-farm employment. A fundamental source of intergenerational linkage
arises from the fact that the genetic endowments of a child ( θi) are likely to be correlated
with those of parents. The innate ability parameter θi is not known with certainty and
every individual has to form an estimate utilizing all the available information contained
in an appropriately defined information set.
In addition to ability, every individual is endowed with a vector of initial capital stock ki
comprised of human, financial, physical, and social capital. The higher is the level of ki the
higher is the probability of success in non-farm activities. Parents can influence this initial
capital stock ki through their investment in a child’s human capital (e.g. education) and
their transfer of financial and physical capital. In addition, parental occupation can also
influence their offsprings’ human capital as children can gain valuable skills and experience
by observing their parents at work, and by informal apprenticeship in parents’ work place,
especially when the nature of occupation is such that the workplace is in close proximity
to home.14 The parents, when successful in non-farm, often transfer significant reputation
13The model utilized here can be viewed as an extension of the celebrated contributions of Becker andTome (1979 and 1986) and the recent extensions proposed in Sjogren (2000).
14As noted by Lentz and Laband (1983), this proximity of work place to home is an important factorbehind the observed strong intergenerational following in occupations like agriculture. This proximity isalso important in case of the household based activities common in the microcredit programs because ofcultural inheritance.
8

capital and a rich social network (social capital) to their children.
At the beginning of the working life, individual i takes the endowment of capital and the
estimate of ability (ki, θi) as given, and optimally chooses the occupation di ∈ A,N. Let
the information set available to individual i choosing occupation is denoted as Ωi which
include ki and θi. Let F (Yi | A; Ωi) denote the conditional distribution of income (Yi)
when individual chooses agriculture and the information set is Ωi.The associated probability
density function is denoted as P (Yi | A; Ωi). The preference of an individual i is represented
by a concave utility function, Ui(.), that reflects, among other things, the risk preference 15
We define the expected utility from choosing agriculture as:
Vi(A, Ωi) ≡∫
Ui(Yi)P (Yi | A; Ωi)dYi
Analogously the expected utility from choosing non-farm sector is:
Vi(N, Ωi) ≡∫
Ui(Yi)P (Yi | N ; Ωi)dYi
The individual chooses non-farm employment iff the following holds:16
Vi(N, Ωi)− Vi(A, Ωi) ≥ 0 (1)
15The preferences of a child are likely to be correlated with those of her parents. In addition, parentscan also induce changes in children’s preferences by acting as their role models (Durlauf, 2000). Theintergenerational correlation in preferences implies, for example, that, on an average, the children of theparents more inclined to taking risk will themselves be risk takers, and thus are more likely to becomenon-farm entrepreneurs.
16Assuming that the tie is broken in favor of non-farm sector.
9
The probability that an arbitrary individual i drawn from the population will decide to
work in the non-farm sector is Pr(Vi(N, Ωi)−Vi(A, Ωi) ≥ 0). At the heart of the occupation
selection process is the formation of expectation about payoffs from different options using
the information set Ωi. A critical element of the information set is the occupational choices
of the parents as they reveal two types of relevant information: (i) information about ones
own genetic endowment (or innate ability), (ii) information about the characteristics of
a certain occupation. For example, if parents are successful (unsuccessful) non-farm en-
trepreneurs, the estimate of children’s ability to be successful in similar occupation will
be revised upward (downward). The parental success in non-farm may thus inspire the
children to follow in their footstep due to “success bias” emphasized in the literature on
cultural evolution (Boyd and Richerson, 1985, 2005, Henrich and McElreath, 2003). An-
other important channel is that revelation of information might reduce the uncertainty
about the parental occupation, and thus induce risk-averse children to prefer the parental
occupation to other alternatives. Thus, the information revealed by parental choices (and
their outcomes) can influence children’s occupation decision through their effects on the
conditional distribution function of income Yi giving rise to role model effects (Manski
1993; Streufert, 2000). For example, consider a child’s participation decision in non-farm
sector (di = N). The parental role model effects (more broadly cultural inheritance) imply
that the conditional distribution of income when parents are in non-farm F (Yi | N ; Np, Ωi)
is stochastically dominant over the conditional distribution of income with neither of the
parents is in non-farm F (Yi | N ; Ap, Ωi).17
17Note that given a concave utility function both first and second order stochastic dominance are suffi-cient.
10
The model presented above can also be used to explain intergenerational correlations
running along gender lines. First, the genetic transmissions might have a gender dimension.
For example, the preference of a daughter (son) is likely to be more aligned with that of
her (his) mother (father) compared to that of her (his) father (mother). Second, and
probably the most important factor behind gender effects in intergenerational linkages in
occupational choices, is the gender dimension in cultural inheritance due to role model
effects. The information revealed by the choices (and consequent outcomes) of an older
member of a society will be more informative for the choices of a given younger member
the closer he/she is to the younger person in an appropriately defined socioeconomic space.
The individuals can be grouped together by partitioning the socioeconomic space according
to different exogenous (like ethnicity, gender) or endogenous (like schooling) characteristics.
The finer the partitioning the more informative is the information revealed by the choices of
a member of a given group for the other members of that same group. It follows that, given
the membership in a family, gender creates a finer partitioning, and the mother becomes the
natural role model for the daughter, and the father for the son. This has also implications for
learning by doing and observing as the daughter (son) ‘sees’ and ‘hears’ primarily what her
(his) mother (father) does and says. Another potential channel for gender effects is that the
effects of parental social capital might run predominantly along gender lines; the mother’s
social network might be more easily accessible to a daughter. Moreover, social norms
regarding gender roles might also contribute to gender effects in occupation choice. The
existence of gender effects for a daughter means that the conditional distribution of income
from non-farm employment when mother is in non-farm F (Yi | N ; Nm, Ωi) stochastically
11
dominates the conditional distribution with father in non-farm F (Yi | N ; N f , Ωi). As
emphasized before, the strength of the role model effects is likely to differ across genders
depending on the gender norms regarding the social and economic interactions.
In a traditional patriarchal society like Nepal, we expect the cultural inheritance to
be stronger for daughters because of gender norms. The mother plays a dominant role in
a daughter’s life due to a combination of the gender effects discussed above and limited
social interactions. The women in Nepal face both explicit and implicit discriminations in
almost all spheres of social and economic interactions (Bennett, 2005, ADB, 1999). The
inheritance customs and practices are explicitly against women’s ownership of productive
resources like land.18 There is clear gender division of work, women’s economic activities
are concentrated in and around the household, while men participate more in the formal
labor market (Acharya and Bennett, 1983). The men also are more mobile geographically,
and are likely to embark on short-term migration for work in the cities (in addition to the
Nepalese cities, also the Indian cities closer to the Nepal border). The absence of the
father from the household due to migration or participation in the formal labor market
implies that the interaction between father and son may be less frequent which will tend
to weaken the role model effect of the father on the son.19 There is striking gender bias
in favor boys in parental investment in human capital. For example, in 1996, the literacy
18Although 1990 constitution enshrines equal rights irrespective of gender, the family laws that governproperty rights, inheritance, marriage and divorce reinforce the patriarchy and put severe constraints onwomen’s command over resources. For example, the national Code of Nepal (Mulki Ain) of 1963 thatcodifies the inheritance system derives from the Hindu custom of patrilineal descent and a patrifocalresidence system.
19This, however, does not mean that the total effect of a migrant father will be necessarily negative onthe non-farm participation of the son. A migrant father may facilitate non-farm occupation by relaxingthe credit constraint, for example.
12
rate for male was 57 percent and only 27 percent for female (ADB, 1999). The evidence
from the data set used in this paper also confirms a striking gap in the years of schooling
between the daughters and the sons (please, see appendix Table A.1). The fact that the
girls are less likely to go to school or more likely to drop out early from school implies that
their domain of interactions remains limited.
For the econometric estimation, we can now employ a standard probit model taking
inequality (1) as the basis for our empirical specification. Specifically, we consider the
binary response model (with slight abuse of notation):
Ni = 1 N∗i ≡ Vi(N, Ωi)− Vi(A, Ωi) ≥ 0 , (2)
For estimation we impose linearity and assume that the latent variable N∗i is generated
from a model of the form
N∗i = αpN
pi + X ′
iγ + εi (3)
Where Xi ⊆ Ωi is a vector of explanatory variables and εi is the idiosyncratic random
disturbance term. In the econometric analysis, the vector of explanatory variables Xi is
required to include regressors that can control for heterogeneity across individuals in terms
of preferences (Ui), and the productivity, and pay-off information contained in Ωi. Equation
(2) forms the basis of much of our empirical analysis. A complete list of explanatory
variables Xi is provided in appendix table A.1.
13
(3) The Data
The data for our analysis come from the Nepal Living Standard Survey (NLSS) 1995/96.
The NLSS consists of a nationally representative sample of 274 primary sampling unit
(PSUs) selected with probability proportionate to population size, covering 73 of the 75
districts in Nepal. In each of the PSUs, 12 households were also selected randomly (16
households in the Mountain regions) providing a total sample size of 3373 households.
From these households, about 8394 individuals in the age group 14 to 70 years participated
in the labor force. For these individuals, information from the survey can be used to identify
the parents. Some of the fathers did not report their labor force participation, reducing the
sample to 8048. Splitting the sample into male and female gives us a sample of 4025 males
and 4023 females. The sample size is further reduced because many of the villages did not
display any employment diversification. To avoid perfect fit due to lack of within village
employment variation, regressions automatically dropped about 1632 observations in the
case of female sample and 287 observations in the case of male sample. In addition, about
354 mothers in daughters’ sample and 819 mothers in sons’ sample did not report labor
force participation. The results presented in the paper are based on the samples which
dropped these observations. We conducted the same empirical analysis with out dropping
these observations while introducing a dummy to indicate lack of information on mothers’
employment status. The results are similar and are omitted for the sake of brevity.
The NLSS contains detail information on employment by sectors and by occupations at
individual levels. The survey is unique in the sense that it contained an entire section of
questionnaire on parental information, including level of education, sector of employment
14
and place of birth. From the occupation information, we define our dependent variable as
a binary variable taking the value of one if an individual is employed in nonfarm activities
and zero otherwise.20 Similarly we define separate indicator variables for mother and father
showing their employment in nonfarm sector.
Table 1 reports the basic statistics on employment status of daughters and sons. The
(unconditional) probability of being employed in nonfarm sector is estimated to be around
44 percent for a man and 16 percent for a woman. In our data set, average participation
rates of father and mother are around 20 percent and 8 percent respectively. A comparison
of sons and daughters’ employment status conditional on father’s and mother’s employment
status reveals that the probability of being employed in non-agriculture sector is markedly
higher for both sons and daughters if father or mother were employed in non-agriculture as
well. We also tested the significance of difference between probabilities of being employed in
nonfarm sector by parent’s employment status (farm vs nonfarm). The test results reported
in Table 1 indicate that in all cases, the null hypothesis of no difference can be rejected with
a P-value equal to 0.00. According to Table 1, mother’s participation in non-farm sector
appears to have a larger effect, compared with father’s non-farm participation, on both
sons’ and daughters’ probability of participation in non-farm sector. The intergenerational
occupational linkage appears to be much stronger for daughters relative to sons.
(4) Preliminary Evidence
With some indication of positive intergenerational correlations between parents’ and
20Non-farm is defined as non-agricultural, i.e., excludes SIC one digit code ‘0’. Non-farm thus includesindustries and services.
15
children’s occupational choices above, we turn to more formal regression analysis. Starting
from a simple Probit regression of son’s and daughter’s occupations on parental occupations,
we take a sequential approach in presenting the results, introducing an array of control
variables in subsequent steps. The upper panel in Table 2 reports the regression results for
daughters and lower panel for sons.
Column (1) in Table 2 reports the coefficients of N f (father in non-farm) and Nm
(mother in non-farm) in the regression for son’s and daughter’s participation in nonfarm
sector. The results from the probit regression without any controls show that mother’s
non-farm participation has a significant positive influence on daughter’s probability of par-
ticipation in the same sector. The marginal effect of a mother’s participation in nonfarm
sector (Nm) is estimated to be 0.43 which is large compared to the daughter’s average
probability of participation in non-agriculture of 0.16. In contrast, father’s participation
in nonfarm (N f ) appears to have no statistically significant effect on daughter’s likelihood
of being employed in the same sector. The results for sons reported in the lower panel of
Table 2 indicate significant positive correlation between father and son’s employment in
the nonfarm sector. The marginal effect of father’s employment in nonfarm sector (N f ) is
around 0.15 which is statistically significant at 1 percent significance level. Compared with
father, mother’s nonfarm participation (Nm) has a smaller marginal effect (0.10) which is
significant at 5 percent level.
The next set of results reported in column (2) of Table 2 includes a large number of
household and individual level characteristics as control variables. The access to non-farm
jobs may depend on the personal networks that often run along ethnic group/caste (see,
16
for example, Dreze, Lanjouw and Sharma, 1998). To capture the variations in access to
non-farm jobs, we include a set of dummies depicting the ethnicity (caste and tribe) of the
individual in the regression. We also include dummies showing if there is any short/long-
term migrant in the household, as migration frequently occurs on the basis of personal
networks. A set of household variables including household size and composition are also
added to the set of control variables. As discussed in the conceptual framework, human
and financial capital variables are important links in the intergenerational transmissions
of socioeconomic status. In addition to the level of education, we include the age of an
individual as a human capital variable representing the work experience.21 The education
levels of parents and spouse are also included as additional human capital controls. The
inherited land (as the most important form of collateral), remittances received, and travel
time to the nearest commercial bank are included as controls for access to capital22. We
include an individual’s marital status to account for taste and/or life-cycle related hetero-
geneity. The summary statistics for these explanatory variables are presented in appendix
Table A.1. A comparison of daughters’ and sons’ samples in Table A.1 shows that the
difference in the means of individual and family characteristics across parental occupation
is much more pronounced in case of sons sample. This indicates that selection might be
relatively more important for the sons’ sample.23
The results reported in column (2) in Table (2) show that the added set of regressors
are powerful determinants of nonfarm participation decision. With the inclusion of these
21In addition, age and its squared term capture any cohort effect.22The ethnicity dummy may also capture access to credit.23This implies that in our case the girls’ sample is more like the preferred C8 (catholic school 8th graders)
sample in AET (2005).
17
controls, the Pseudo R2 increases from 0.10 to 0.52 in daughter’s sample and from 0.03 to
0.23 in son’s sample. However, the addition of the powerful set of controls does not affect
the estimated intergenerational partial correlations in any significant way. The marginal
effect of Nm (mother in non-farm) is estimated to be 0.41 which is virtually identical to
the estimate from the regression with no controls (0.43). It is still highly statistically
significant (t = 8.04). In the sons sample, the marginal effect of father’s employment in
nonfarm sector (N f ) is estimated to be 0.16 which is also nearly identical to our earlier
estimate from regression with no controls (0.15).
Although the regressions in column (2) include a large set of individual and household
level controls, the intergenerational correlation in occupation may still result, spuriously,
from the fact that parents and children may face similar labor market opportunities. For
instance, if both parents and children live in an area with better non-farm opportunities
(say location of a textile mill), then intergenerational correlation in non-farm participation
may be an artefact of not adequately controlling for non-farm opportunities in the regres-
sion. To control for unobserved location specific heterogeneity in non-farm opportunities,
we included village level fixed effects in the estimation (151 and 241 village dummies in
daughter’s and son’s regressions respectively). The village fixed effects may also capture
other village specific determinants of occupational choice like peer effects and agglomera-
tion forces. In addition, we define the share of non-farm employment in total employment
of an individual’s age cohort in her district of birth as an additional control for labor market
opportunity and possible peer effects. This may capture the time varying part of labor
market opportunities in a village.
18
The results from regressions with village fixed effects are reported in column (3) of
Table 2. The addition of village level fixed effects as well as a measure of intertemporal
labor market opportunity leads to an increase in the explanatory power of the regressions
further. The Pseudo R2 of the regression is 0.62 in daughter’s sample and 0.53 in son’s
sample. Despite the inclusion of such a large number of controls (village plus household plus
individual level controls), the qualitative results regarding intergenerational occupational
correlations remain largely unchanged. Although the marginal effect of Nm (mother in
non-farm) on a daughter’s nonfarm participation declines, it is still large (0.30) and is
statistically highly significant with a t-value=6.33. The marginal effect of N f (father in
non-farm) on a son’s nonfarm participation is now 0.10 and is statistically significant at 1
percent level. Consistent with the available evidence in the literature on income mobility
(see, for example, Solon, 2002), the evidence also indicates that the cross gender effects are
not important as they are not statistically significant in column (3) of Table 2.
(5) Genetic Transmissions and Cultural Inheritance
The results discussed so far show that the intergenerational occupational correlations
between parents and children run along gender lines (father-son and mother-daughter).
The evidence indicates that the estimated partial correlations are not solely due to the
‘tangible’ determinants of occupational choice like education, assets, and ethnicity as they
are already controlled for in the regression. The results can not be driven by village
level factors like peer effects and geographic agglomeration as we include village fixed
effect. However, as discussed before, an important question from the policy perspective
19
is how much of the partial correlations uncovered in column 3 of table 2 is causal due to
environmental factors related to cultural inheritance like role model effects and learning
externalities as opposed to pure genetic correlations in occupational choice.
In the absence of credible identifying instruments, we utilize a number of ways to ascer-
tain whether the observed intergenerational correlations can be explained solely in terms
of unobserved ability correlations (and other unobserved common determinants). They
include (i) sensitivity analysis a la Rosenbaum and Rubin (1983), Rosenbaum(1995) and
AET (2005, 2000); (ii) estimation of lower bounds on the role played by cultural inheri-
tance in the intergenerational correlations using the technique developed by AET (2005,
2000).
(5.1) Sensitivity Analysis
The regression results presented in the previous section demonstrate that the inclu-
sion of a large and powerful set of controls does not lead to a substantial weakening of
intergenerational occupational correlations especially for the daughter. This suggests that
the selection on observables is dominant and a relatively small amount of selection is due
to unobservables. We now explore the question whether a small amount of selection on
unobservables can explain away the estimated partial correlations in intergenerational oc-
cupational choices in table 2.
20
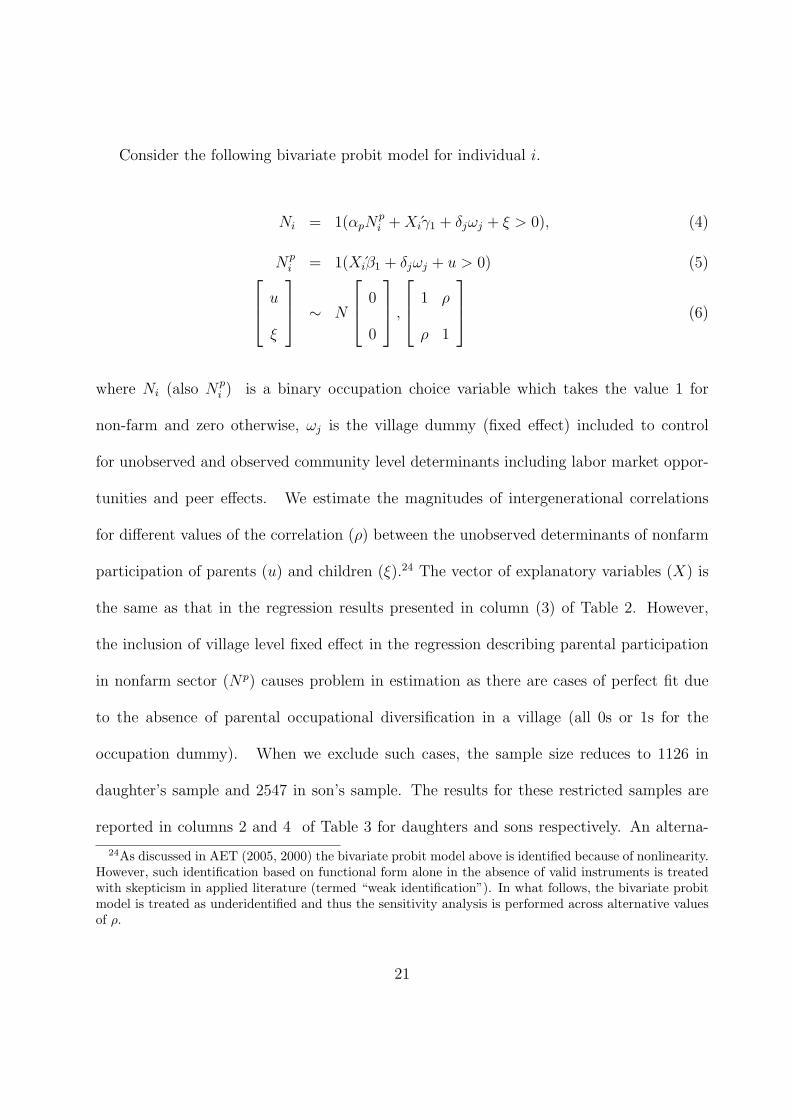
Consider the following bivariate probit model for individual i.
Ni = 1(αpNpi + Xiγ1 + δjωj + ξ > 0), (4)
Npi = 1(Xiβ1 + δjωj + u > 0) (5)
u
ξ
∼ N
0
0
,
1
ρ
ρ
1
(6)
where Ni (also Npi ) is a binary occupation choice variable which takes the value 1 for
non-farm and zero otherwise, ωj is the village dummy (fixed effect) included to control
for unobserved and observed community level determinants including labor market oppor-
tunities and peer effects. We estimate the magnitudes of intergenerational correlations
for different values of the correlation (ρ) between the unobserved determinants of nonfarm
participation of parents (u) and children (ξ).24 The vector of explanatory variables (X) is
the same as that in the regression results presented in column (3) of Table 2. However,
the inclusion of village level fixed effect in the regression describing parental participation
in nonfarm sector (Np) causes problem in estimation as there are cases of perfect fit due
to the absence of parental occupational diversification in a village (all 0s or 1s for the
occupation dummy). When we exclude such cases, the sample size reduces to 1126 in
daughter’s sample and 2547 in son’s sample. The results for these restricted samples are
reported in columns 2 and 4 of Table 3 for daughters and sons respectively. An alterna-
24As discussed in AET (2005, 2000) the bivariate probit model above is identified because of nonlinearity.However, such identification based on functional form alone in the absence of valid instruments is treatedwith skepticism in applied literature (termed “weak identification”). In what follows, the bivariate probitmodel is treated as underidentified and thus the sensitivity analysis is performed across alternative valuesof ρ.
21
tive approach that keeps the sample size same as in Table 2 relies on an index of village
fixed effects estimated from the simple probit regressions reported in column 3 of Table
2. The results for these unrestricted samples are presented in columns 1 and 3 of Table
3 for daughter’s and sons respectively. Following AET (2005), the sensitivity analysis is
performed for ρ = 0.1, 0.2, 0.3, 0.4, 0.5. Note that the correlation coefficient ρ represents
only that part of genetic correlation across generations which influence the occupational
choice.
For daughters, the results from the unrestricted sample show that the marginal effect
of the mother’s employment in nonfarm sector declines to 0.22 when ρ =0.10, and to 0.15
when ρ =0.20. The estimated marginal effect continues to decline with an increase in ρ
but is still positive though small in magnitude when ρ is as high as 0.50. Interestingly, all
the values of marginal effect are also statistically significant at 5 percent or less except for
the case when ρ =0.50. The conclusions derived from the restricted sample reported in
column 2 are similar to that of the unrestricted sample; the marginal effects are, however,
in general, larger in magnitude. These results suggest that barring sampling error, the
unobserved genetic correlations pertinent to occupation choice would have to be greater
than 0.50 to explain away the entire effect of Nm (mother in nonfarm) on a daughter’s
nonfarm participation.
In the case of sons, the marginal effect of father’s nonfarm participation becomes numer-
ically small (0.05) and statistically insignificant in the unrestricted sample when ρ = 0.10.
For values of ρ equal to or greater than 0.2, the marginal effect becomes negative. The re-
sults are again very similar in the case of the restricted sample. These results suggest that
22
the estimated effect of N f (father in nonfarm) on son’s nonfarm participation may be en-
tirely driven by common unobserved factors like genetic transmissions. As discussed before
this difference in the intergenerational occupational persistence across gender is consistent
with a model of cultural inheritance in a traditional patrilineal society where the domain
of social and economic interactions for women is restricted in and around the household
and also they have very little educational attainment or geographic mobility.
(5.2) Lower Bounds on the Effects of Cultural Inheritance
The sensitivity analysis above indicates that the value of ρ would have to be larger than
0.50 to completely explain the effect of mother’s nonfarm employment on that of daughters
found in Table 2. This can be interpreted as strong evidence in favor of a causal role
of cultural inheritance from mother to daughter in occupation choice. But there is no
estimate of ρ in the literature which we can use as a benchmark. The available evidence
from Behavioral Genetics shows that both the genetic transmissions and environmental
factors are important in the correlation between the parents and children, especially for
complex traits and behavior.25 The problems in pinning down a plausible range for ρ are
more daunting in our case as other explanatory variables like education (both children’s
and parents’), ethnicity (i.e., caste and tribe), and assets are likely to pick up a substantial
part of this correlation.26 In the absence of any plausible way of judging the magnitude of
the genetic correlations relevant for occupation choices in a rural economy as captured by
25For example, the correlation between IQ scores of parents and children is around 0.5 (Plomin et. al.,2001, Griffiths et. al. 1999). This correlation includes both the effects of nature (heritability) and nurture(familiality).
26This implies that the value of ρ relevant for our analysis should be smaller than otherwise.
23
ρ, we utilize an approach suggested by AET (2005). This allows us to estimate both the
magnitude of ρ and bounds for the intergenerational correlations.
To illustrate the basic insights behind AET (2005) approach, we consider equation
(3) (with village fixed effects added). It defines the latent variable N∗i that determines
children’s participation in nonfarm sector as:
N∗i = αpN
pi + X ′
iγ1 + δjωj + ε (7)
where Npi is the dummy variable for nonfarm participation by parents and ωj is the village
fixed effect for village j where individual i lives in. Let Np∗ is the latent variable such
that Np = 1 if Np∗ > 0 and zero otherwise. We can define the linear projection of Np∗ on
X ′γ, ω and ε as (for notational simplicity the subscript is dropped) :
Proj (Np∗|X ′γ1, ω, ε) = φ0 + φX′γ1X′γ1 + ω
′δ + φεε (8)
Following AET (2005), we can interpret φX′γ1 as the “selection on observables” and φε the
“selection on unobservable”. However, unlike AET (2005), we use a village level fixed effect
to sweep off the observed and unobserved village level determinants. This implies that the
selection on observables (φX′γ1) and unobservables (φε) both represent only the individual
characteristics. An advantage of this formulation is that it fits well with the notion that
the ‘unobservables’ are like ‘observables’. An alternative approach is to include the village
fixed effects as part of the observables. The argument is that the location of an individual
24
is an observable characteristic.27 The linear projection of Np∗ in this case becomes:
Proj (Np∗|Z ′γ2, ε) = φ0 + φZ′γ2Z′γ2 + φεε ; Z = (X,ω) and γ2 = (γ1, δ) (9)
The advantage of this formulation is that it is more likely to satisfy the condition that
selection on observables is dominant which helps in deriving the lower bound on intergen-
erational occupational linkage (see below).28 We perform the analysis under these alterna-
tive interpretations (equations (8) and (9)).29 Note that in the case of univariate probit
regressions, the maintained assumption is that there is no selection on unobservable, i. e,
φε = 0.
AET (2005, 2000) and Altonji, Conley, Elder, and Taber (2005) (henceforth ACET
(2005)) show that selection on observables can be used as a guide to selection on unob-
servables. They point out that in many applied economic applications, it is a natural
assumption that the selection on observables dominates the selection on unobservables
which leads to the following conditions in our case (analogous to condition (3) in AET
(2005)):
φX′γ1 ≥ φε ≥ 0 (10)
φZ′γ2 ≥ φε ≥ 0 (11)
27We thank Chris Taber for pointing out the alternative interpretations of the fixed effects.28Since location choice is endogeneous, the village fixed effects will capture some of the unobserved
individual characteristics which are common to the villagers.29 A third alternative is to exclude the fixed effects altogether and use village level observed controls
(share of non-farm). The conclusions of this paper remain unchanged in this formulation, although thelower bound estimates are larger than reported here.
25
Following AET (2005), we can implement the econometric estimation under the above re-
striction(s) and treat the estimate of αp (equation (7)) corresponding to the case of equality
of selection on observables and unobservables (i.e., for example, φX′γ1 = φε) as the lower
bound on the part of intergenerational occupational linkage that is not driven by genetic
transmissions and can be attributed to factors like role model effect and learning externali-
ties. The inequality conditions (10) and (11) above are eminently plausible in our case due
to the following considerations.30 First, as pointed out earlier, the addition of a set of rich
and powerful determinants of occupation choice affects the strength of intergenerational
linkages only marginally although the Pseudo R2 goes up dramatically. For example, in
daughter’s sample, the Pseudo R2 increases from 0.10 to 0.52 when we include a rich set
of determinants of occupational choice including education levels of children, parents and
spouse, inherited land, and ethnicity. The estimated partial correlation in non-farm partic-
ipation by mother and daughter is, however, barely affected (it declines from 0.43 to 0.41).
This indicates that (i) the observables explain a large part of the variations in non-farm
participation, and thus leave room for only a limited role for the unobserved individual
characteristics; (ii) the estimated partial correlation is robust to possible inclusion of addi-
tional controls (if such data were available). Second, the data for our analysis come from
a multipurpose household survey which was conducted primarily for poverty assessment.
Since the role of non-farm occupations as an avenue to escape poverty traps in a low income
agrarian economy is much discussed (Lanjouw and Feder, 2001), it is only natural that the
survey includes rich information on the determinants of non-farm participation identified
30We are grateful to Chris Taber and Todd Elder for clarifying the relevance of the conditions (10) and(11) in our analysis.
26
in the recent literature. This means that these observable characteristics are likely to pick
up a substantial part of the unobserved genetic correlations relevant for occupation choice,
a point mentioned earlier, but worth emphasizing again here. This also means that the
selection on unobservable genetic endowment captured in φε will be much smaller in our
analysis. Third, we can decompose the error term in the occupation choice by children
as in equation (4): ξ = ξ1 + ξ2 where ξ1 is the part of selection on unobservables that is
common to both generations but is determined at the time of parental occupation choice,
and ξ2 represents the unobserved shocks that occur during the children’s occupation choice.
As shown by AET (2005), this implies that selection on observables is greater providing
additional justifications for inequality conditions (10) and (11) above.
In the case of bivariate probit (equations 4-6), the lower bound estimate of αp can be
estimated by imposing the following conditions depending on the treatment of fixed effect:
ρ =Cov(Z ′β2, Z
′γ2)
V ar(Z ′γ2); β2 = (β1, δ) (12)
ρ =Cov(X ′β1, X
′γ1)
V ar(X ′γ1)(13)
Table 4 reports the estimates of the lower bounds on the intergenerational partial correlation
(i.e., lower bound estimates of αm and αf ) that can be attributed to cultural inheritance
from parents by the children. The inclusion of village dummies leads to computational
difficulties and convergence problems in the estimation of the bivariate probit model. The
results discussed earlier in Table 3 show that the index of village fixed effects estimated
from univariate probit model performs equally well as village level dummies in controlling
27
for spatial labor market opportunities and possible peer and agglomeration effects. To
avoid the non-convergence problems, we use this index in the regressions reported in Table
4. The first panel reports the results from bivariate probit model under the constraint
defined in equation (12) and the third panel shows the corresponding results under equation
(13). The central conclusions of this paper are, however, not sensitive to the treatment
of fixed effects and we focus our discussion on the case defined by equation (12) for the
sake brevity. The estimated magnitudes of correlations between unobserved determinants
of parent and children’s nonfarm participation are similar: 0.21 for daughters and 0.25 for
sons. The estimates show that the intergenerational correlation between mother’s and
daughter’s nonfarm participation is highly statistically significant (t-value=4.81). The
estimated coefficient αm is positive and large in magnitude (0.685) with a marginal effect of
0.146. In contrast, for sons, the estimated αf = −0.143 with a t-value of 1.74. The results
in panel 1 of Table 4 thus strengthen our central conclusion from the sensitivity analysis
in section (4.1) above that the estimated partial correlation in the nonfarm participation
of mother and daughter is not likely to be driven entirely by the genetic correlations; at
least part of the occupational linkage seems causal reflecting cultural inheritance through
role model effects, learning externalities and transfer of reputation and social capital from
mother to the daughter as discussed in the conceptual framework above. In contrast,
the lower bound estimate for the correlation in father’s and son’s nonfarm participation
is negative implying that the observed (positive) intergenerational correlation may be an
artefact of genetic transmissions across generations.31
31We caution here that the fact that the lower bound estimate is negative for the father and son should notbe taken as conclusive evidence for an absence of intergenerational linkage. As mentioned before the lower
28
To ensure robustness of our findings, we also check whether these results are driven
by the joint normality assumption underlying the bivariate probit model. Following AET
(2005), we utilize the following semi-parametric specification for the error terms:
u = θ + u∗
ξ = θ + ξ∗
Where u∗ and ξ∗ are independent standard normals and θ is unrestricted. Bivariate probit
model estimated earlier is thus a special case where θ is assumed to be distributed as nor-
mal. We estimated the model using nonparametric maximum likelihood method suggested
by Heckman and Singer (1984) and AET (2005). The estimation method treats the distri-
bution of θ as discrete; in practice, we obtain two points of support for θ. The estimated
ρ and αp are reported in the second and fourth panels of Table 4. Again, for the sake
of brevity, we focus on the case when the village fixed effects are treated as part of the
observables index (second panel in Table 4). The estimated magnitudes of ρ are smaller
compared with those from the bivariate probit model, but as before they are similar for
sons (0.178) and daughters (0.163). However, the overall results regarding the intergen-
erational effects remain unchanged. The effect of Nm (mother in nonfarm) on daughter’s
nonfarm participation is statistically highly significant, and positive (αm = 0.665). The
implied marginal effect is 0.135 which is virtually identical to that found in the bivariate
bound estimates are likely to underestimate the strength of occupational linkage given that the selectionon observables is likely to dominate. This also implies that the evidence from the bounds estimates infavor of a causal effect of mother’s non-farm participation arising from cultural inheritance is very strong.
29
probit model (0.146). For sons, the estimated lower bound on intergenerational correla-
tion is positive but much smaller in magnitude (marginal effect=0.086) and statistically
insignificant.
(6) Conclusions:
The economic literature on intergenerational mobility has witnessed a renewed interest
in recent years. However, most of the existing economic research focuses on the income
correlations between father and son(s) in the context of developed countries. Also, the
possible role played by cultural inheritance has received relatively less attention in economic
literature on intergenerationl mobility. Using data from a developing country, Nepal, we
present evidence on the intergenerational occupational mobility from agriculture to non-
farm sector with an emphasis on the gender differences in cultural inheritance arising from
gender norms regarding social and economic interactions. Since it is extremely difficult,
if not impossible, to find credible instrument(s) to address the genetic correlations (ability
and preference), we employ the recent econometric approach developed by Altonji, Elder
and Taber (2005, 2000) to ascertain if the estimated partial correlations in non-farm partic-
ipation can be attributed solely to genetic transmissions or at least part of the effect is likely
to be causal due to factors like role model effects (more broadly cultural inheritance). The
approach uses the degree of selection on observables as a guide to the degree of selection on
unobservables. It allows us to estimate lower bounds on the part of the intergenerational
occupational correlations that can be attributed to intergenerational cultural inheritance
due to factors like role model effects, informal apprenticeship, learning externalities, and
transfer of reputation and social capital. The results show that the observed partial corre-
30
lation between the father and a son can be easily explained away by a moderate correlation
in genetic endowments across generations. In contrast, for the mother and daughter(s), the
intergenerational occupational linkage is very strong, and it is unlikely that the estimated
partial correlation is driven solely by the unobserved genetic correlations. The evidence
points to a causal effect of mother’s occupation choice on that of the daughter beyond the
widely discussed channels like human capital, assets and ethnicity. The estimated lower
bound on the effects of cultural inheritance for mother-daughter intergenerational occupa-
tional correlation shows a marginal effect of 0.14. The gender differences in the role of
cultural inheritance in intergenerational occupational persistence indicate that the social
norms like gender based division of labor and restrictions on geographic and educational
mobility can make it extremely difficult for women to move out of traditional economic
activities like agriculture. This provides a link in the analysis of poverty trap in developing
countries, and brings into focus the intergenerational occupational linkage as an important
factor in understanding the gender bias in economic mobility against women in developing
countries.
References
(1) Acharya, M and L. Bennett (1983): Women and the Subsistence Sector, World Bank
Staff Working paper.
(2) ADB (1999): Women in Nepal, Asian development Bank, Manilla.
(3) Altonji, J, T.E. Elder and C.R. Taber (2005): “Selection on Observed and Un-
observed Variables: Assessing the Effectiveness of Catholic Schools”, Journal of Political
31
Economy, 2005, Vol.113(1): 151-184.
(4) Altonji, J, T. Conley, T. Elder, and C. Taber (2005): “Methods for Using Selection
on Observed Variables to Address Selection on Unobserved variables”, March, 2005.
(5) Altonji, J, T. Elder, and C. Taber (2000): “Selection on Observed and Unobserved
Variables: Assessing the Effectiveness of Catholic Schools”, NBER WP. 7831.
(6) Altonji, J.G. and T. Dunn (2000): An Intergenerational Model of Wages, Hours,
and Earnings, Journal of Human Resources, Vol. 35, n.2, 221-58.
(7) Arrow, K, S. Bowles, S. Durlauf (2000): Meritocracy and Economic Inequality,
Princeton University Press.
(8) Bardhan, P (2005): Theory or Empirics in Development Economics, Economic and
Political Weekly.
(9) Becker G. S. and N. Tomes (1979), “An Equilibrium Theory of the Distribution of
Income and Intergenerational Mobility,” Journal of Political Economy, vol. 87, no. 6.
(10) Becker G. S. and N. Tomes (1986), “Human Capital and the Rise and Fall of
Families,” Journal of Labor Economics, vol.4, no.3, pt.2, S1-S39.
(11) Behrman, J. A. and M. Rosenzweig (2002): “Does Increasing Women’s Schooling
Raise the Schooling of the Next Generation?”, American Economic Review, March, 2002.
(12) Behrman, J, A. Gaviria, M. Szekely (2001): Intergenerational Mobility in Latin
America, Working paper, IADB, Washington DC.
(13) Bennet, L (2005): Gender, Caste and Ethnic Exclusion in Nepal, World Bank.
(14) Bevan, D, et. al. (1986): Trade Shocks in Controlled Economies, OUP, Oxford.
(15) Bjorklund, A, M Jantti, and G. Solon (2007): Nature and Nurture in the Inter-
32
generational Transmission of Socioeconomic Status: Evidence from Swedish Children and
Their Biological and Rearing Parents, NBER Working paper 12985.
(16) Bjorklund, A, M. Lindahl, and E. Plug (2006): The Origins of Intergenerational
Associations: Lessons from Swedish Adoption Data, Quarterly Journal of Economics, 121.
(17) Blanden, J, P. Gregg, S. Machin (2005): Intergenrational Mobility in Europe and
North America, Center For Economic Performance Report, April, 2005.
(18) Boyd, R and P. J. Richerson (1985): Culture and the Evolutionary Process, Uni-
versity of Chicago Press.
(19) Bowles, S, H. Gintis, M. Osborne Groves (2005): Unequal Chances: Family Back-
ground and Economic Success, Priceton University Press.
(20) Birdsall, N and C. Graham (eds) (1999): New markets, New Opportunities? Eco-
nomic and Social Mobility in a Changing World, Brookings Institution.
(21) Chadwick L. and G. Solon (2002), “Intergenerational Income Mobility among
Daughters,” American Economic Review, vol. 92, no. 1, 335-44.
(22) Collier, P (1998): “Women in developing Countries”, World Bank Policy research
working paper # 129, December, 1988.
(23) Dearden, L and S. Machin, and H. Reed (1997): Intergenerational Mobility in
Britain, Economic Journal, January, pp.47-66.
(24) Dunn, C (2004): The Intergenerational Transmission of Lifetime Earnings, Unpub-
lished Ph.D. dissertation, University of Michigan,
(25) Dunn, T. and D. Holtz-Eakin (2000), “Financial Capital, Human Capital, and the
Transition to Self-Employment: Evidence from Intergenerational Links,” Journal of Labor
33
Economics, Vol. 18, no.2, 282-305.
(26) Fields, G (2001): Distribution and Development, MIT Press.
(27) Fields, G, D. Grusky, and S. Morgan (Eds) (2005): Mobility and Inequality: Fron-
tiers of Research from Sociology and Economics, Stanford University Press.
(28) Goldberger, A. (1989), “Economic and Mechanical Models of Intergenerational
Transmission,” American Economic Review, vol. 79, no.3, 504-513.
(29) Griffiths, A, W. Gelbart, J. Miller, and R. Lewontin (1999): Modern Genetic
Analysis, W. H. Freeman and Co., 1999.
(30) Hertz, T (2001): Education, Inequality and Economic Mobility in South Africa,Ph.D.
Dissertation, University of Massachusetts.
(31) Heckman J, and B. Singer (1984): A Method for Minimizing the Impact of Distri-
butional Assumptions in Econometric Models for Duration Data, Econometrica, 52(2).
(32) Lam, D, and R. F. Schoeni (1993), “Effects of Family Background on Earnings and
Returns to Schooling: Evidence from Brazil”, Journal of Political Economy, 101, 710-740.
(33) Lanjouw, P. and G. Feder (2001), “Rural Non-farm Activities and Rural Develop-
ment,” Rural Strategy Background Paper # 4, World Bank.
(34) Lentz, B.S., and D. N. Laband (1983), “Like Father, Like Son: Toward an Economic
Theory of Occupational Following.” Southern Economic Journal, vol. 50, no.2, 474-93.
(35) Lillard, L, and M. R. Kilburn (1995), “Intergenerational Earnings Links: Sons and
Daughters”, RAND, Labor and Population Program WP# 95-17.
(36) Mazumder, B (2005): Fortunate Sons: New Estimates of Intergenerational Mobility
in U.S. Using Social Security Earnings Data, Review of Economics and Statistics, May.
34
(37) Morgan, S (2005): Past Themes and Future Prospects for Research on Economic
and Social Mobility, in Fields, Gursky, and Morgan (eds) (2005).
(38) Mulligan, C. B. (1999), “Galton vs. the Human Capital Approach to Inheritance,”
Journal of Political Economy, vol. 107 (6 Part 2), S184-S224.
(39) Plomin, R, DeFries, J, P. McGuffin, G. McClearn, and (2001): Behavioral Genetics,
Worth Publishers, New York, 4th Edition.
(40) Rosenbaum, P.R., 1995, Observational Studies, New York: Springler-Verlag.
(41) Rosenbaum, P.R., and D. B. Rubin, 1983, “Assessing Sensitivity to an Unobserved
Binary Covariate in an Observational Study with Binary Outcome,” Journal of Royal Sta-
tistical Society, Vol. 45(2): 212-18.
(42) Solon, G (2002): “Cross-Country Differences in Intergenerational Earnings Mobil-
ity”, Journal of Economic Perspectives, Summer 2002.
(43) Solon, G (1999), “Intergenerational Mobility in the Labor Market,” in O. Ashen-
felter and D. Card eds Handbook of Labor Economics, Vol 3A, Elsevier Science, North-
Holland, Amsterdam.
(44) Streufert, P. (2000), “The Effect of Underclass Social Isolation on Schooling Choice,”
Journal of Public Economic Theory, vol. 2, no.4, 461-82.
(45) Thomas, D. (1994), “Like Father, Like Son; Like Mother, Like Daughter: Parental
Resources and Child Height,” Journal of Human Resources, vol. 29, no. 4, 950-88.
(46) World Development Report (WDR) (2005): Equity and Development, The World
bank.
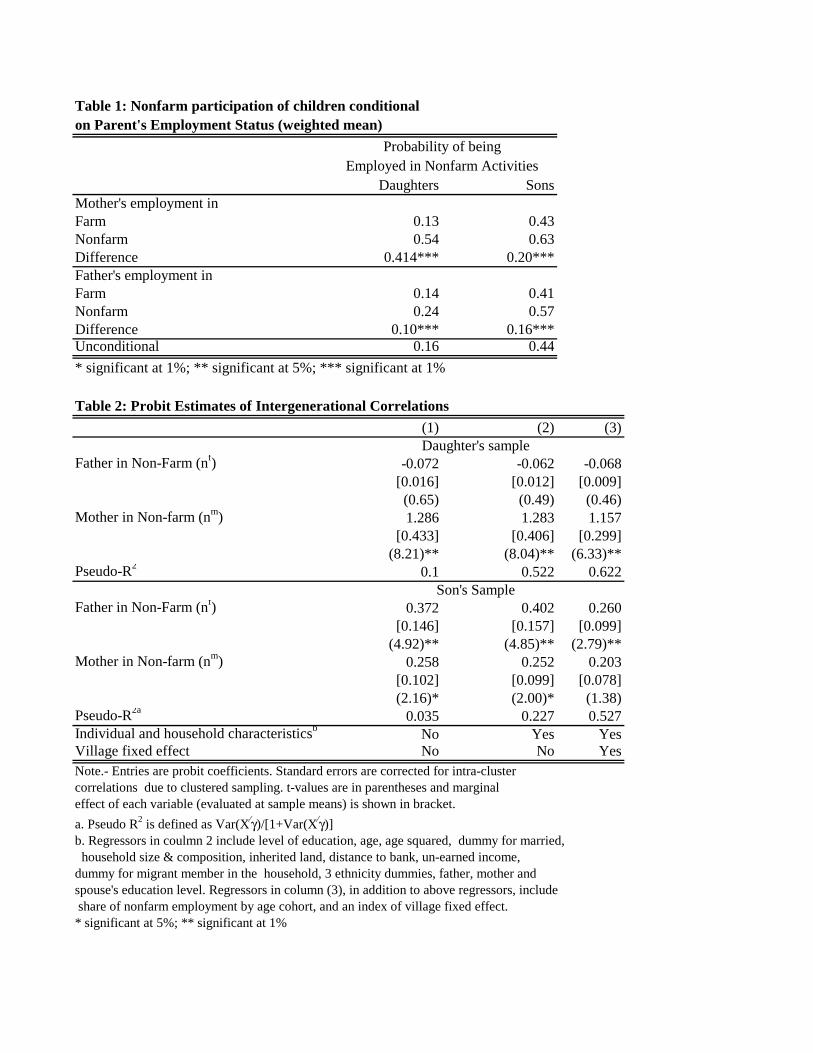
Table 1: Nonfarm participation of children conditionalon Parent's Employment Status (weighted mean)
Daughters SonsMother's employment inFarm 0.13 0.43Nonfarm 0.54 0.63Difference 0.414*** 0.20***Father's employment inFarm 0.14 0.41Nonfarm 0.24 0.57Difference 0.10*** 0.16***Unconditional 0.16 0.44
* significant at 1%; ** significant at 5%; *** significant at 1%
Table 2: Probit Estimates of Intergenerational Correlations
(1) (2) (3)
Father in Non-Farm (nf) -0.072 -0.062 -0.068[0.016] [0.012] [0.009]
(0.65) (0.49) (0.46)Mother in Non-farm (nm) 1.286 1.283 1.157
[0.433] [0.406] [0.299](8.21)** (8.04)** (6.33)**
Pseudo-R2 0.1 0.522 0.622
Father in Non-Farm (nf) 0.372 0.402 0.260[0.146] [0.157] [0.099]
(4.92)** (4.85)** (2.79)**Mother in Non-farm (nm) 0.258 0.252 0.203
[0.102] [0.099] [0.078](2.16)* (2.00)* (1.38)
Pseudo-R2a 0.035 0.227 0.527Individual and household characteristicsb No Yes YesVillage fixed effect No No YesNote.- Entries are probit coefficients. Standard errors are corrected for intra-cluster correlations due to clustered sampling. t-values are in parentheses and marginal effect of each variable (evaluated at sample means) is shown in bracket.
a. Pseudo R2 is defined as Var(X⁄γ)/[1+Var(X⁄γ)]b. Regressors in coulmn 2 include level of education, age, age squared, dummy for married, household size & composition, inherited land, distance to bank, un-earned income, dummy for migrant member in the household, 3 ethnicity dummies, father, mother and spouse's education level. Regressors in column (3), in addition to above regressors, include share of nonfarm employment by age cohort, and an index of village fixed effect.* significant at 5%; ** significant at 1%
Daughter's sample
Son's Sample
Probability of beingEmployed in Nonfarm Activities
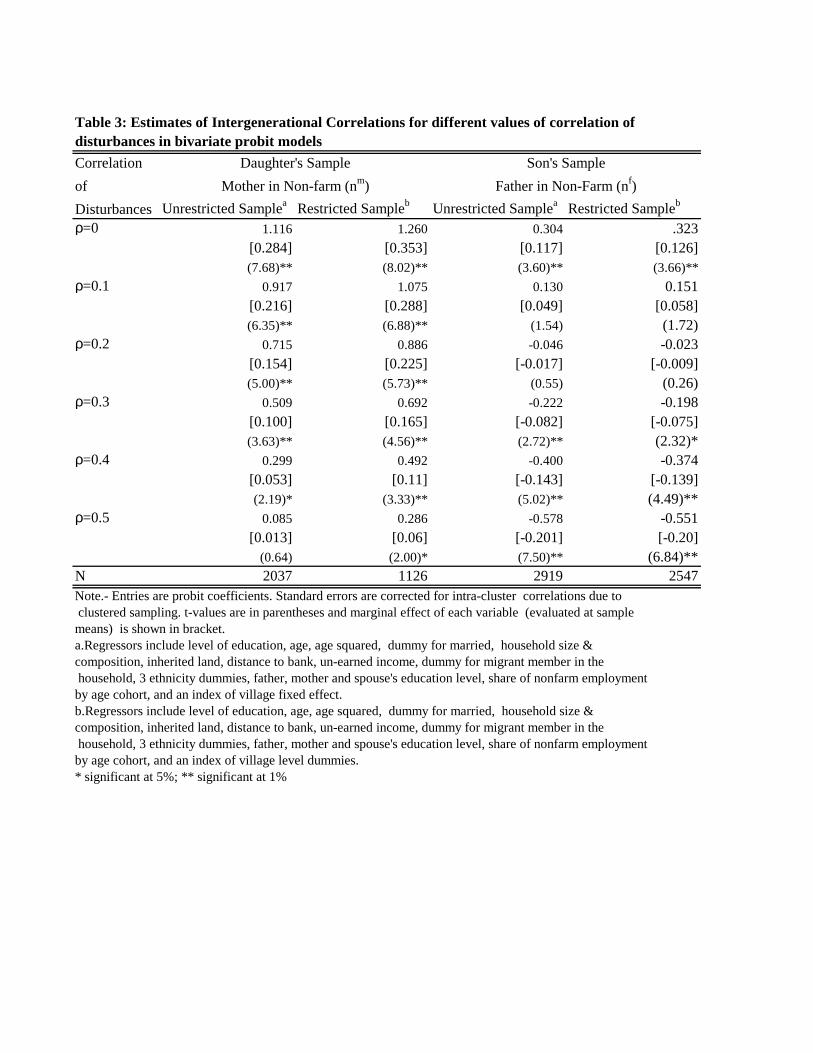
Table 3: Estimates of Intergenerational Correlations for different values of correlation of disturbances in bivariate probit models
Correlation
of
Disturbances Unrestricted Samplea Restricted Sampleb Unrestricted Samplea Restricted Sampleb
ρ=0 1.116 1.260 0.304 .323[0.284] [0.353] [0.117] [0.126](7.68)** (8.02)** (3.60)** (3.66)**
ρ=0.1 0.917 1.075 0.130 0.151 [0.216] [0.288] [0.049] [0.058] (6.35)** (6.88)** (1.54) (1.72)ρ=0.2 0.715 0.886 -0.046 -0.023 [0.154] [0.225] [-0.017] [-0.009]
(5.00)** (5.73)** (0.55) (0.26)ρ=0.3 0.509 0.692 -0.222 -0.198
[0.100] [0.165] [-0.082] [-0.075](3.63)** (4.56)** (2.72)** (2.32)*
ρ=0.4 0.299 0.492 -0.400 -0.374[0.053] [0.11] [-0.143] [-0.139](2.19)* (3.33)** (5.02)** (4.49)**
ρ=0.5 0.085 0.286 -0.578 -0.551[0.013] [0.06] [-0.201] [-0.20]
(0.64) (2.00)* (7.50)** (6.84)**N 2037 1126 2919 2547Note.- Entries are probit coefficients. Standard errors are corrected for intra-cluster correlations due to clustered sampling. t-values are in parentheses and marginal effect of each variable (evaluated at sample means) is shown in bracket.a.Regressors include level of education, age, age squared, dummy for married, household size & composition, inherited land, distance to bank, un-earned income, dummy for migrant member in the household, 3 ethnicity dummies, father, mother and spouse's education level, share of nonfarm employmentby age cohort, and an index of village fixed effect.b.Regressors include level of education, age, age squared, dummy for married, household size & composition, inherited land, distance to bank, un-earned income, dummy for migrant member in the household, 3 ethnicity dummies, father, mother and spouse's education level, share of nonfarm employmentby age cohort, and an index of village level dummies.* significant at 5%; ** significant at 1%
Daughter's Sample
Mother in Non-farm (nm)
Son's Sample
Father in Non-Farm (nf)
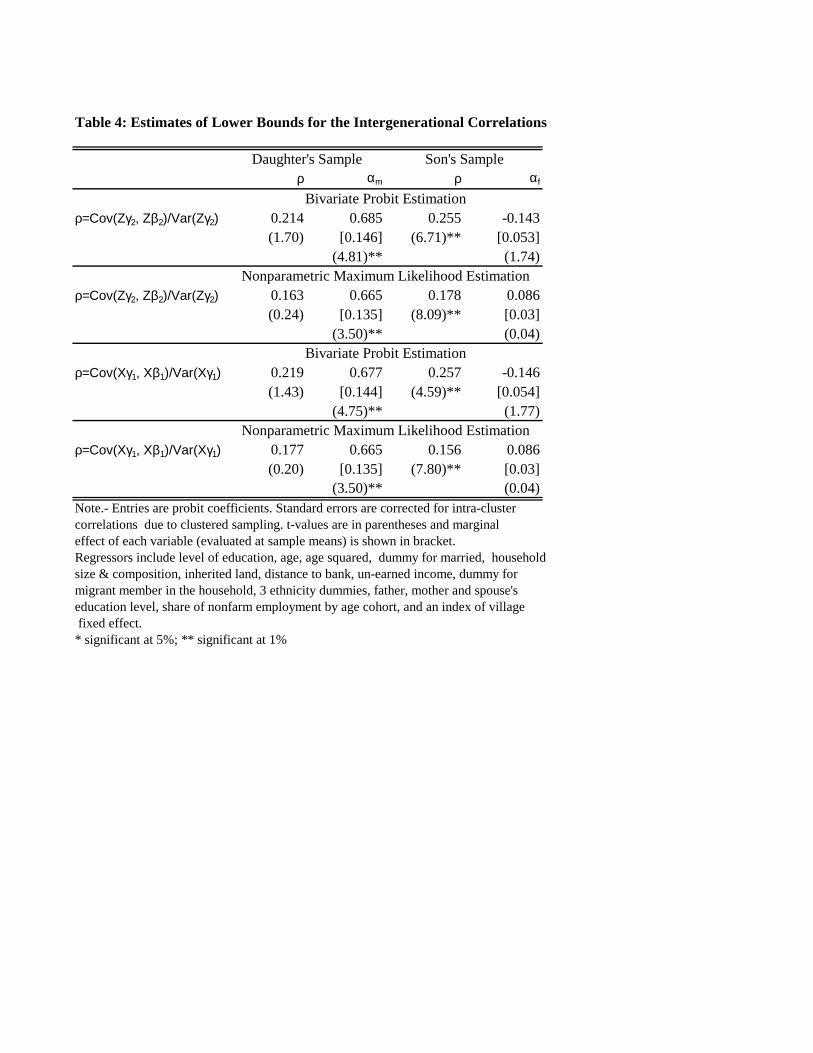
Table 4: Estimates of Lower Bounds for the Intergenerational Correlations
ρ αm ρ αf
ρ=Cov(Zγ2, Zβ2)/Var(Zγ2) 0.214 0.685 0.255 -0.143(1.70) [0.146] (6.71)** [0.053]
(4.81)** (1.74)
ρ=Cov(Zγ2, Zβ2)/Var(Zγ2) 0.163 0.665 0.178 0.086(0.24) [0.135] (8.09)** [0.03]
(3.50)** (0.04)
ρ=Cov(Xγ1, Xβ1)/Var(Xγ1) 0.219 0.677 0.257 -0.146(1.43) [0.144] (4.59)** [0.054]
(4.75)** (1.77)
ρ=Cov(Xγ1, Xβ1)/Var(Xγ1) 0.177 0.665 0.156 0.086(0.20) [0.135] (7.80)** [0.03]
(3.50)** (0.04)Note.- Entries are probit coefficients. Standard errors are corrected for intra-cluster correlations due to clustered sampling. t-values are in parentheses and marginal effect of each variable (evaluated at sample means) is shown in bracket.Regressors include level of education, age, age squared, dummy for married, household size & composition, inherited land, distance to bank, un-earned income, dummy for migrant member in the household, 3 ethnicity dummies, father, mother and spouse's education level, share of nonfarm employment by age cohort, and an index of village fixed effect.* significant at 5%; ** significant at 1%
Bivariate Probit Estimation
Nonparametric Maximum Likelihood Estimation
Nonparametric Maximum Likelihood Estimation
Daughter's Sample Son's Sample
Bivariate Probit Estimation
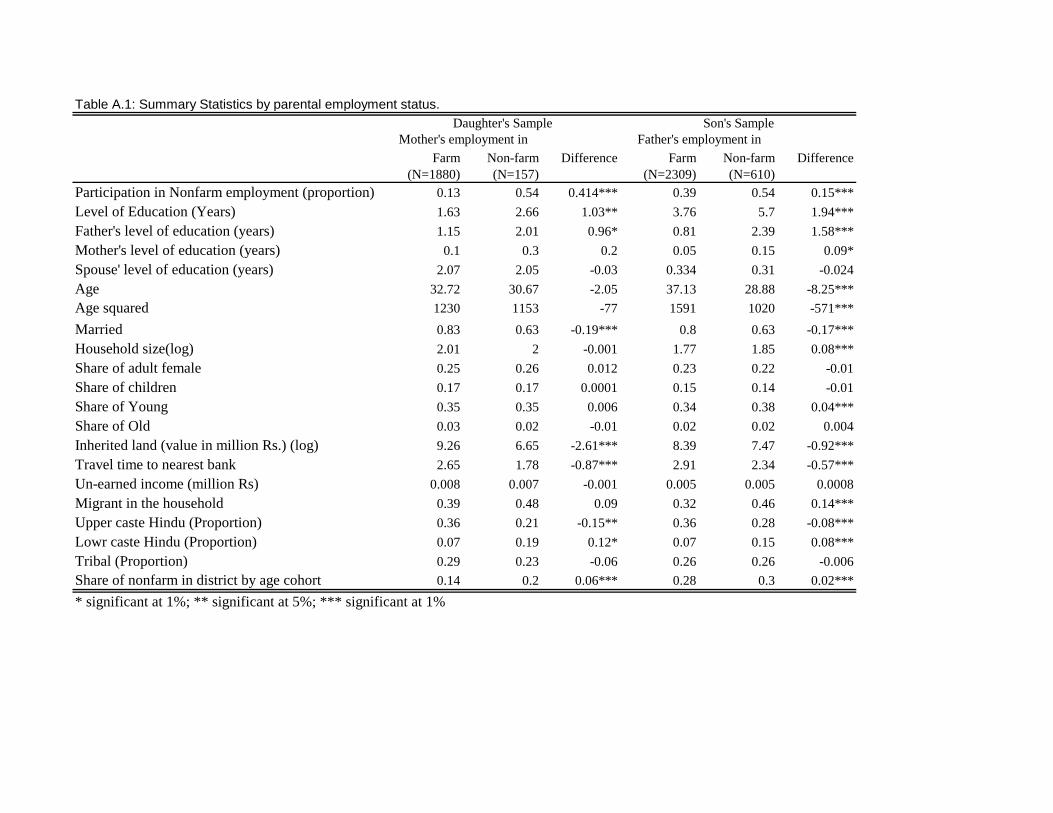
Table A.1: Summary Statistics by parental employment status.
Farm Non-farm Difference Farm Non-farm Difference(N=1880) (N=157) (N=2309) (N=610)
Participation in Nonfarm employment (proportion) 0.13 0.54 0.414*** 0.39 0.54 0.15***
Level of Education (Years) 1.63 2.66 1.03** 3.76 5.7 1.94***
Father's level of education (years) 1.15 2.01 0.96* 0.81 2.39 1.58***
Mother's level of education (years) 0.1 0.3 0.2 0.05 0.15 0.09*
Spouse' level of education (years) 2.07 2.05 -0.03 0.334 0.31 -0.024
Age 32.72 30.67 -2.05 37.13 28.88 -8.25***
Age squared 1230 1153 -77 1591 1020 -571***
Married 0.83 0.63 -0.19*** 0.8 0.63 -0.17***
Household size(log) 2.01 2 -0.001 1.77 1.85 0.08***
Share of adult female 0.25 0.26 0.012 0.23 0.22 -0.01
Share of children 0.17 0.17 0.0001 0.15 0.14 -0.01
Share of Young 0.35 0.35 0.006 0.34 0.38 0.04***
Share of Old 0.03 0.02 -0.01 0.02 0.02 0.004
Inherited land (value in million Rs.) (log) 9.26 6.65 -2.61*** 8.39 7.47 -0.92***
Travel time to nearest bank 2.65 1.78 -0.87*** 2.91 2.34 -0.57***
Un-earned income (million Rs) 0.008 0.007 -0.001 0.005 0.005 0.0008
Migrant in the household 0.39 0.48 0.09 0.32 0.46 0.14***
Upper caste Hindu (Proportion) 0.36 0.21 -0.15** 0.36 0.28 -0.08***
Lowr caste Hindu (Proportion) 0.07 0.19 0.12* 0.07 0.15 0.08***
Tribal (Proportion) 0.29 0.23 -0.06 0.26 0.26 -0.006
Share of nonfarm in district by age cohort 0.14 0.2 0.06*** 0.28 0.3 0.02***
* significant at 1%; ** significant at 5%; *** significant at 1%
Mother's employment inDaughter's Sample Son's Sample
Father's employment in
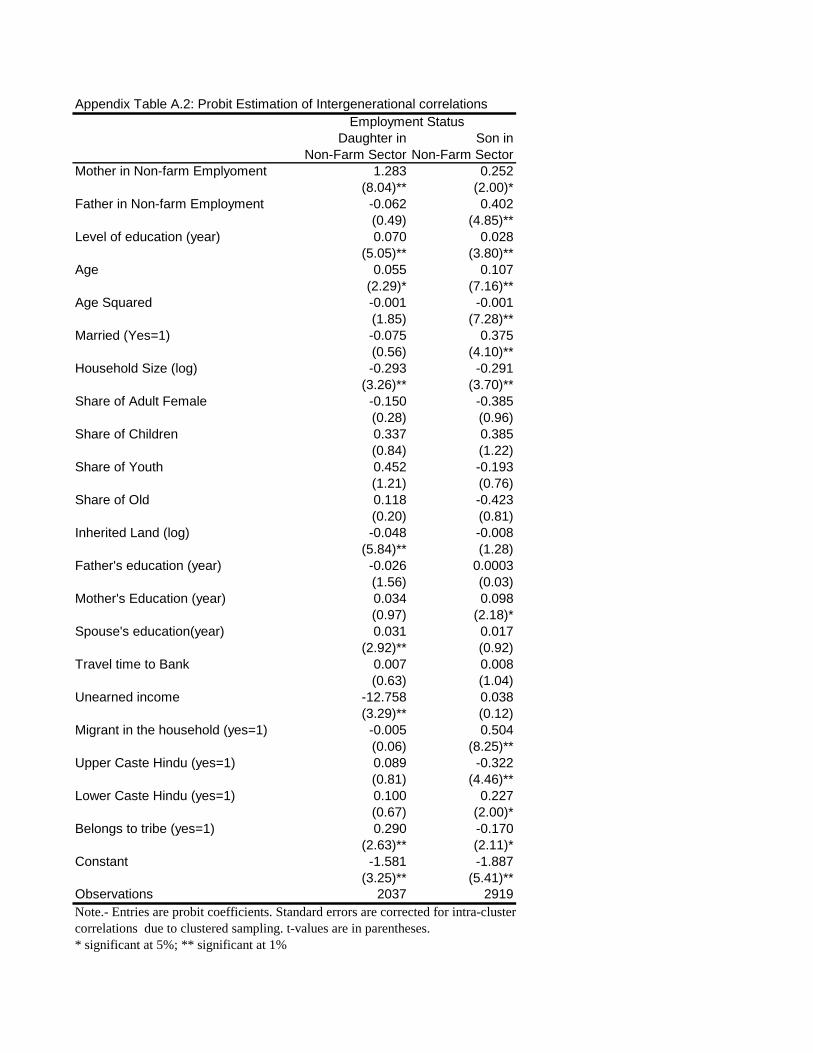
Appendix Table A.2: Probit Estimation of Intergenerational correlations
Daughter in Son inNon-Farm Sector Non-Farm Sector
Mother in Non-farm Emplyoment 1.283 0.252(8.04)** (2.00)*
Father in Non-farm Employment -0.062 0.402(0.49) (4.85)**
Level of education (year) 0.070 0.028(5.05)** (3.80)**
Age 0.055 0.107(2.29)* (7.16)**
Age Squared -0.001 -0.001(1.85) (7.28)**
Married (Yes=1) -0.075 0.375(0.56) (4.10)**
Household Size (log) -0.293 -0.291(3.26)** (3.70)**
Share of Adult Female -0.150 -0.385(0.28) (0.96)
Share of Children 0.337 0.385(0.84) (1.22)
Share of Youth 0.452 -0.193(1.21) (0.76)
Share of Old 0.118 -0.423(0.20) (0.81)
Inherited Land (log) -0.048 -0.008(5.84)** (1.28)
Father's education (year) -0.026 0.0003(1.56) (0.03)
Mother's Education (year) 0.034 0.098(0.97) (2.18)*
Spouse's education(year) 0.031 0.017(2.92)** (0.92)
Travel time to Bank 0.007 0.008(0.63) (1.04)
Unearned income -12.758 0.038(3.29)** (0.12)
Migrant in the household (yes=1) -0.005 0.504(0.06) (8.25)**
Upper Caste Hindu (yes=1) 0.089 -0.322(0.81) (4.46)**
Lower Caste Hindu (yes=1) 0.100 0.227(0.67) (2.00)*
Belongs to tribe (yes=1) 0.290 -0.170(2.63)** (2.11)*
Constant -1.581 -1.887(3.25)** (5.41)**
Observations 2037 2919Note.- Entries are probit coefficients. Standard errors are corrected for intra-cluster correlations due to clustered sampling. t-values are in parentheses.* significant at 5%; ** significant at 1%
Employment Status