initial public offeringinitial public offering€¦ · · 2012-03-09initial public...
TRANSCRIPT

Initial Public OfferingInitial Public Offering
February 2012February 2012
Forward Looking Statements
GSE Holding Inc has filed a registration statement (including a prospectus) with the SEC for the offering to which thisGSE Holding, Inc. has filed a registration statement (including a prospectus) with the SEC for the offering to which this communication relates. Before you invest, you should read the prospectus in that registration statement and other documents GSE Holding, Inc. has filed with the SEC for more complete information about GSE Holding, Inc. and this offering. You may get these documents for free by visiting EDGAR on the SEC Web site at www.sec.gov.
These slides and the accompanying oral presentation contain forward-looking statements and information. The use of words such “ ” “ i ht” “ ill” “ h ld” “ t” “ l ” “ ti i t ” “b li ” “ ti t ” “ j t” “i t d” “f t ” “ t ti l”as “may”, “might”, “will”, “should”, “expect”, “plan”, “anticipate”, “believe”, “estimate”, “project”, “intend”, “future”, “potential” or
“continued”, and other similar expressions are intended to identify forward-looking statements.
Certain statements in this presentation and responses to various questions may constitute forward-looking statements, including statements regarding the Company’s financial position, business strategy and plans and objectives of management for future operations. These statements, which contain words such as "believe,” “expect,” “anticipate,” “intends,” “estimate,” “forecast,”operations. These statements, which contain words such as believe, expect, anticipate, intends, estimate, forecast, “project,” “will,” “may,” “should” and similar expressions, reflect the beliefs and expectations of the Company and are subject to risks and uncertainties, including those described under “Risk Factors” in the registration statement, that may cause actual results to differ materially. These risks and uncertainties include, among other factors, the achievement of the anticipated levels of profitability, growth, the timely development and acceptance of new products, the impact of competitive pricing, the ability to obtain necessary regulatory approvals, and the impact of general business and global economic conditions. These and other factors could adverselyaffect the outcome and financial effects of the plans and events described herein.affect the outcome and financial effects of the plans and events described herein.
The trademarks included herein are the property of the owners thereof and are used for reference purposes only. Such use should not be construed as an endorsement of the products or services of GSE Holding, Inc. or this offering.
Neither the Company, nor any of its respective agents, employees or advisors intend or have any duty or obligation to supplement, p y, y p g , p y y y g pp ,amend, update or revise any of the forward-looking statements contained in this presentation.
The information and opinions contained in this document are provided as at the date of this presentation and are subject to change without notice. This document has not been approved by any competent regulatory or supervisory authority.
THE PIONEER OF GEOSYNTHETICS 1
This document will not be left behind after this presentation and by accepting this document and attending the presentation you agree to be bound by the foregoing limitations.
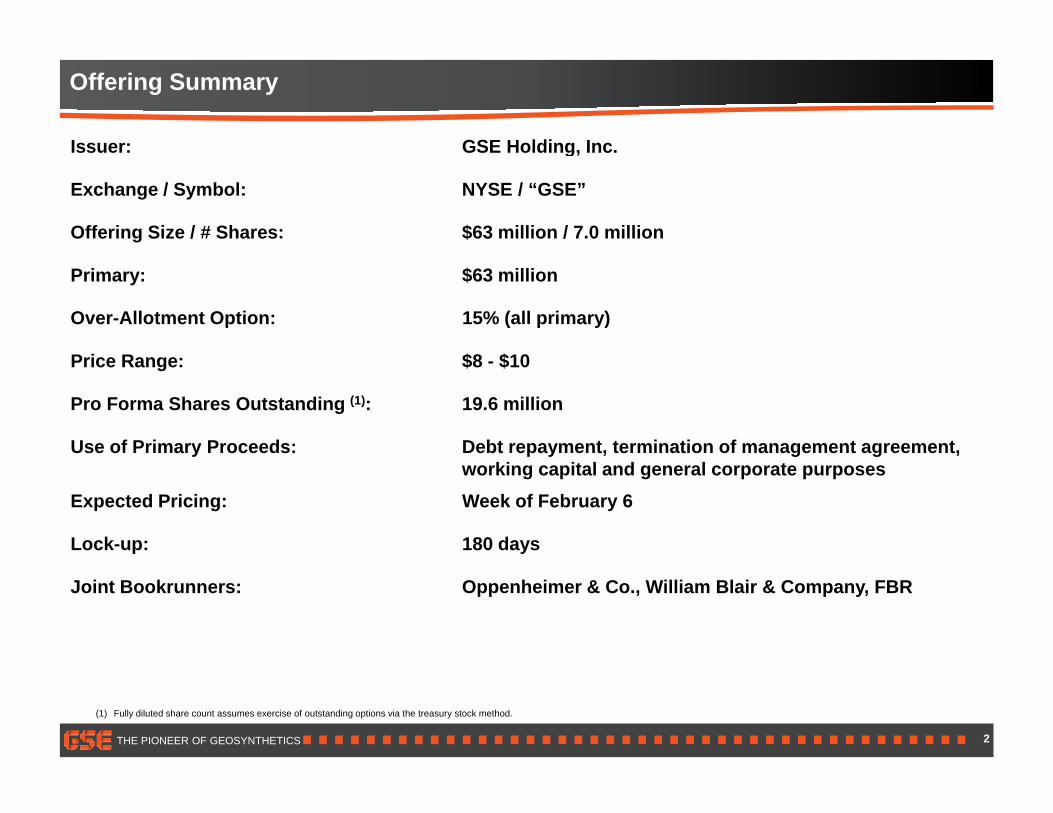
Offering Summary
Issuer: GSE Holding, Inc.Issuer: GSE Holding, Inc.
Exchange / Symbol: NYSE / “GSE”
Offering Size / # Shares: $63 million / 7.0 million
Primary: $63 million
Over-Allotment Option: 15% (all primary)
P i R $8 $10Price Range: $8 - $10
Pro Forma Shares Outstanding (1): 19.6 million
Use of Primary Proceeds: Debt repayment, termination of management agreement, working capital and general corporate purposes
Expected Pricing: Week of February 6
Lock-up: 180 days
Joint Bookrunners: Oppenheimer & Co., William Blair & Company, FBR
THE PIONEER OF GEOSYNTHETICS 2
(1) Fully diluted share count assumes exercise of outstanding options via the treasury stock method.

Presentation Team
C f OffMark Arnold, President and Chief Executive Officer
25+ years manufacturing industry experience
15+ years experience in the global infrastructure sector
P i i iti t L b i l Ad d D i S t d G l El t i
Bill Lacey, EVP and Chief Financial Officer
Previous senior positions at Lubrizol, Advanced Drainage Systems and General Electric (NYSE: GE)
acey, a d C e a c a O ce
30+ years of financial leadership experience within the manufacturing and distribution sectors
10 years of public company CFO experience at Animal Health International and Rawlings Sporting Goods
Gregg Taylor, VP and Chief Accounting Officer
25+ years of finance and accounting experience, including a business consultant role at Alvarez & Marsal Consulting and Senior Director and Partner positions at Accenture
Extensive financial systems experience
THE PIONEER OF GEOSYNTHETICS 3
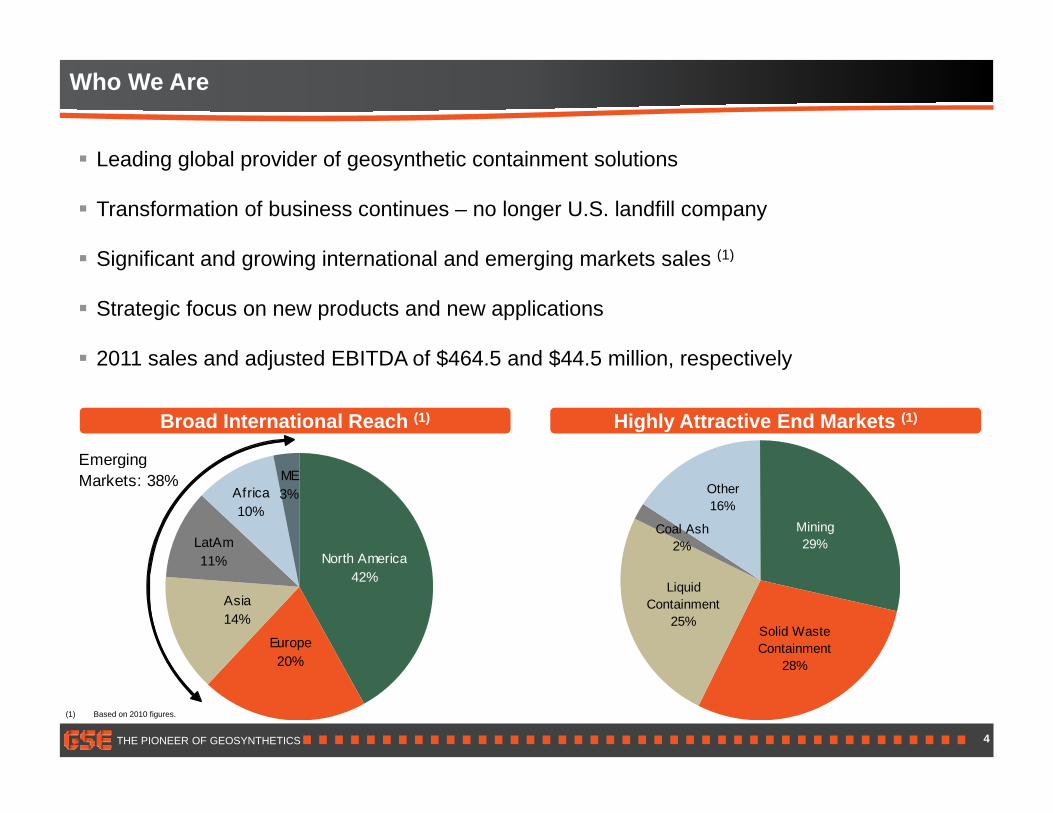
Who We Are
Leading global provider of geosynthetic containment solutions
Transformation of business continues – no longer U.S. landfill company
Si ifi t d i i t ti l d i k t l (1) Significant and growing international and emerging markets sales (1)
Strategic focus on new products and new applications
2011 sales and adjusted EBITDA of $464 5 and $44 5 million respectively 2011 sales and adjusted EBITDA of $464.5 and $44.5 million, respectively
Emerging
Broad International Reach (1) Highly Attractive End Markets (1)
Coal Ash2%
Other16%
Mining29%
ME3%Africa
10%
LatAm11% North America
EmergingMarkets: 38%
Solid Waste Containment
28%
Liquid Containment
25%
11%
Asia14%
Europe20%
North America42%
THE PIONEER OF GEOSYNTHETICS
28%20%
4
(1) Based on 2010 figures.
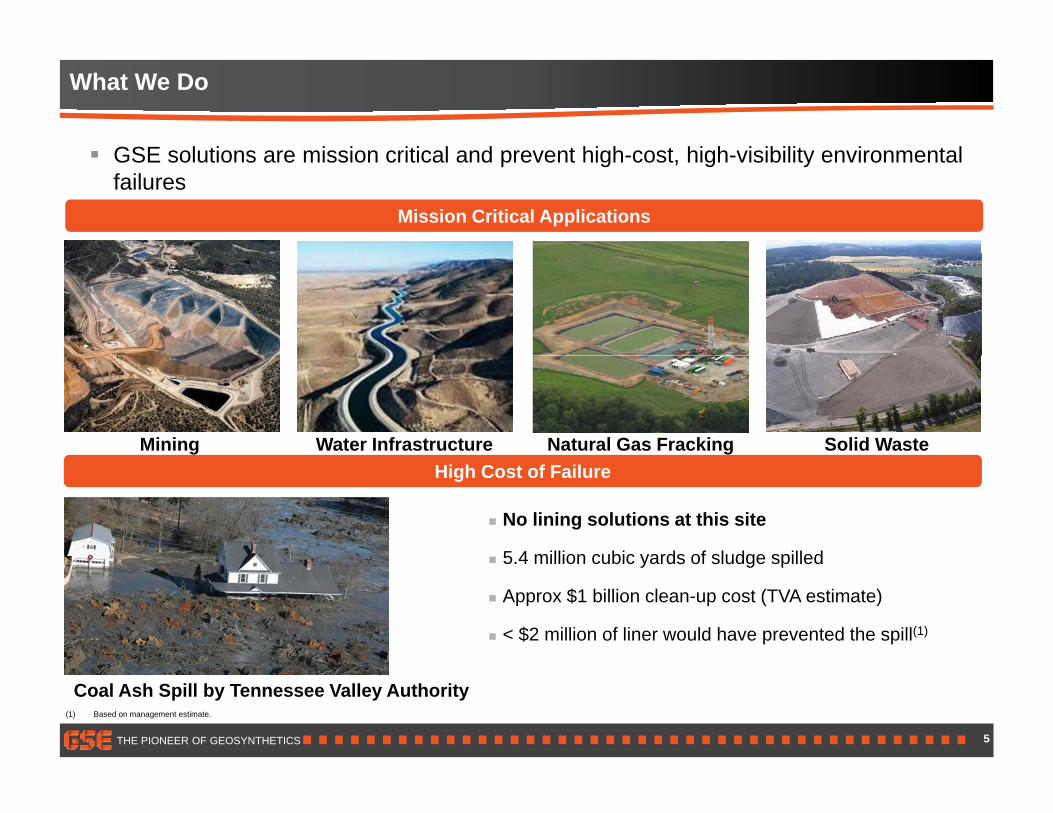
What We Do
GSE l ti i i iti l d t hi h t hi h i ibilit i t l
Mission Critical Applications
GSE solutions are mission critical and prevent high-cost, high-visibility environmental failures
Mining Water Infrastructure Natural Gas Fracking Solid Waste
No lining solutions at this site
5 4 million cubic yards of sludge spilled
High Cost of Failure
5.4 million cubic yards of sludge spilled
Approx $1 billion clean-up cost (TVA estimate)
< $2 million of liner would have prevented the spill(1)
THE PIONEER OF GEOSYNTHETICS
Coal Ash Spill by Tennessee Valley Authority(1) Based on management estimate.
5
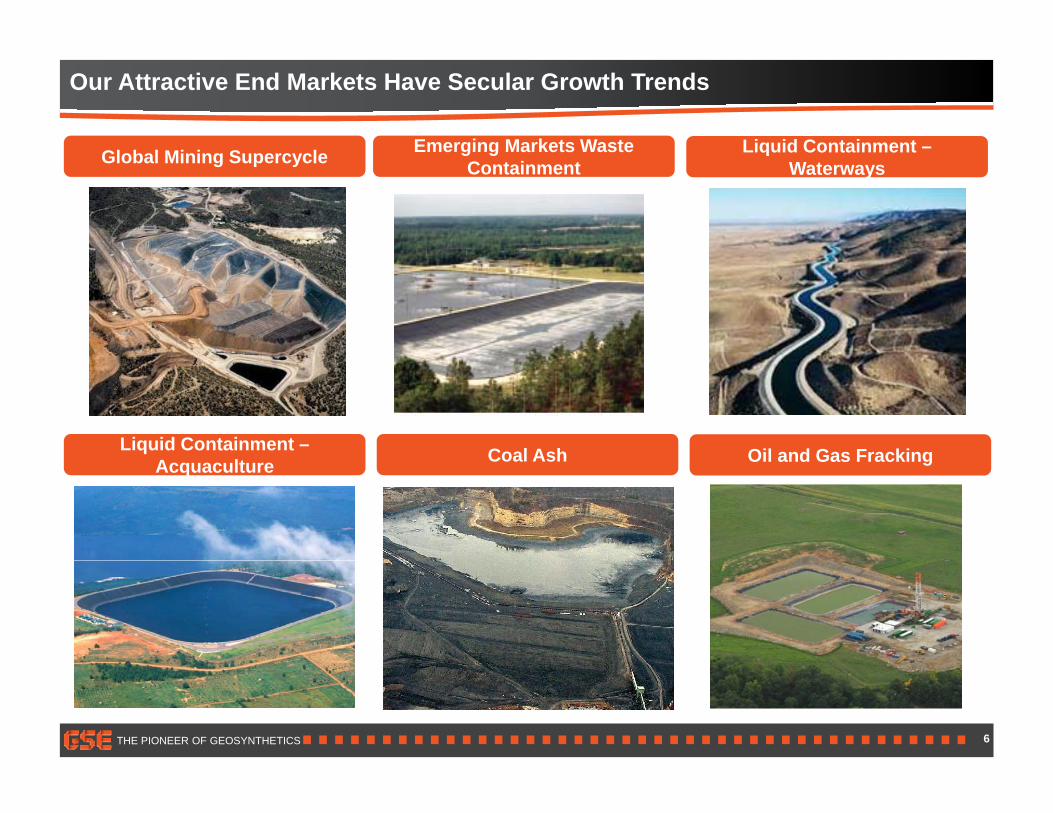
Our Attractive End Markets Have Secular Growth Trends
Gl b l Mi i S l Emerging Markets Waste Liquid Containment –Global Mining Supercycle Emerging Markets Waste Containment
Liquid Containment Waterways
Coal AshLiquid Containment – Oil and Gas FrackingCoal AshAcquaculture Oil and Gas Fracking
THE PIONEER OF GEOSYNTHETICS 6
Our Strategy
Leverage global infrastructure to expand our leading market share in high growth geographies and end markets
Focus sales on higher value proprietary products and continued operational improvement to significantly expand marginsp g y p g
Accelerate development of new proprietary products Accelerate development of new proprietary products
C ti t d l d k t d li ti f d t Continue to develop new end markets and new applications for our products
THE PIONEER OF GEOSYNTHETICS
Selectively pursue investment and acquisition opportunities
7
Recent Developments
2011 Fi i l P f 2011 Financial Performance Revenues – $465 mm; 36% YoY increase from 2010
Gross profit – $71 mm; 61% YoY increase from 2010
Gross margin – 15.9% in 4Q11 vs 15.3% in 4Q10
EBITDA – $44.5 mm; 58% YoY increase from 2010
N t bl Hi h M i P j t S D i J 2012 Notable High Margin Project Successes During January 2012 Mining – new orders in Middle East region
Coal Ash – new impoundment with proprietary products; $7 mm orders ($8 mm sales in all of 2011)
Shale – three new customers in U.S. generate > $6 mm orders ($11 mm sales in all of 2011)
China – multiple wins generate $8 mm orders ($27 mm orders in all of 2011)
THE PIONEER OF GEOSYNTHETICS 8
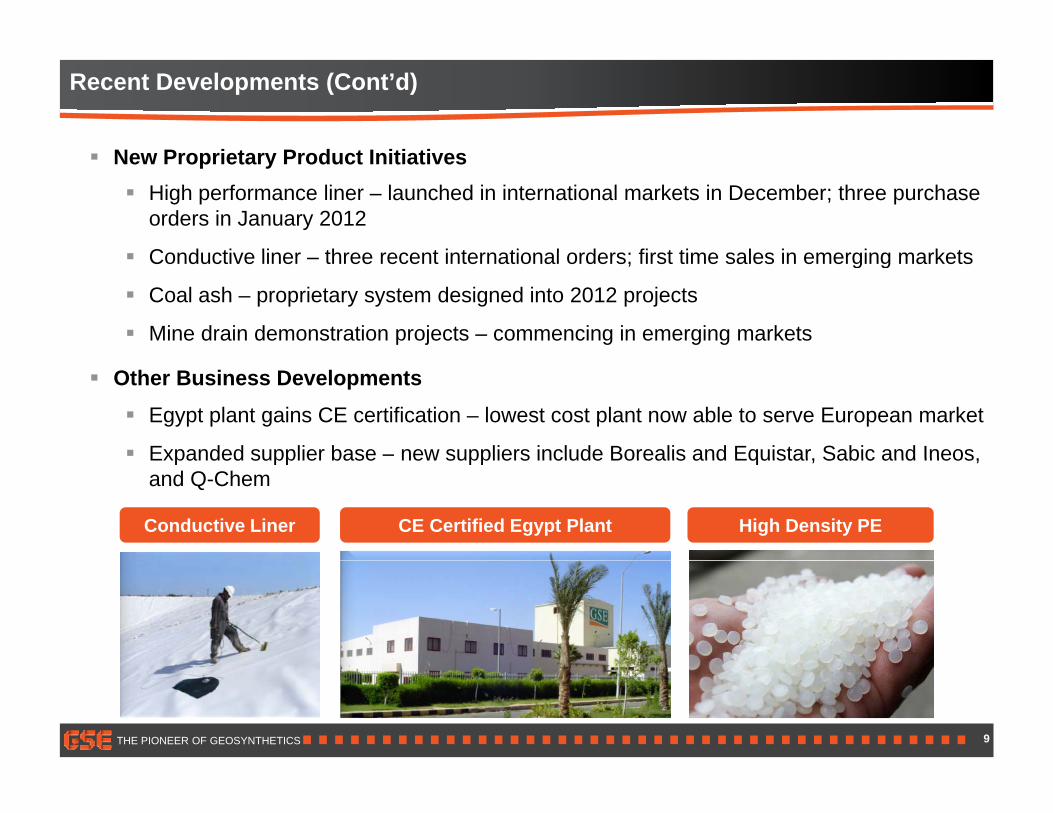
Recent Developments (Cont’d)
N P i t P d t I iti ti New Proprietary Product Initiatives High performance liner – launched in international markets in December; three purchase
orders in January 2012
Conductive liner three recent international orders; first time sales in emerging markets Conductive liner – three recent international orders; first time sales in emerging markets
Coal ash – proprietary system designed into 2012 projects
Mine drain demonstration projects – commencing in emerging markets
Other Business Developments Egypt plant gains CE certification – lowest cost plant now able to serve European market
Expanded supplier base – new suppliers include Borealis and Equistar Sabic and IneosExpanded supplier base new suppliers include Borealis and Equistar, Sabic and Ineos, and Q-Chem
Conductive Liner CE Certified Egypt Plant High Density PE
THE PIONEER OF GEOSYNTHETICS 9
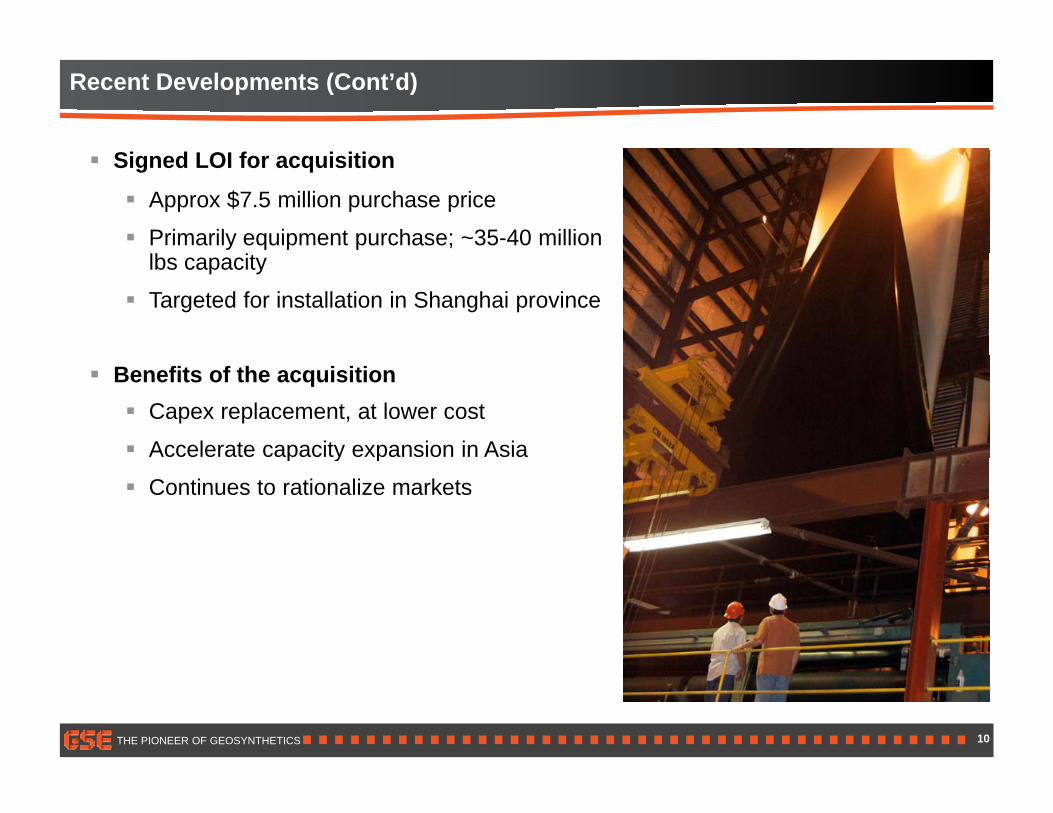
Recent Developments (Cont’d)
Signed LOI for acquisition Approx $7.5 million purchase price
Primarily equipment purchase; ~35-40 million lbs capacity
Targeted for installation in Shanghai province
Benefits of the acquisition Capex replacement, at lower cost
Accelerate capacity expansion in Asiap y p
Continues to rationalize markets
THE PIONEER OF GEOSYNTHETICS 10
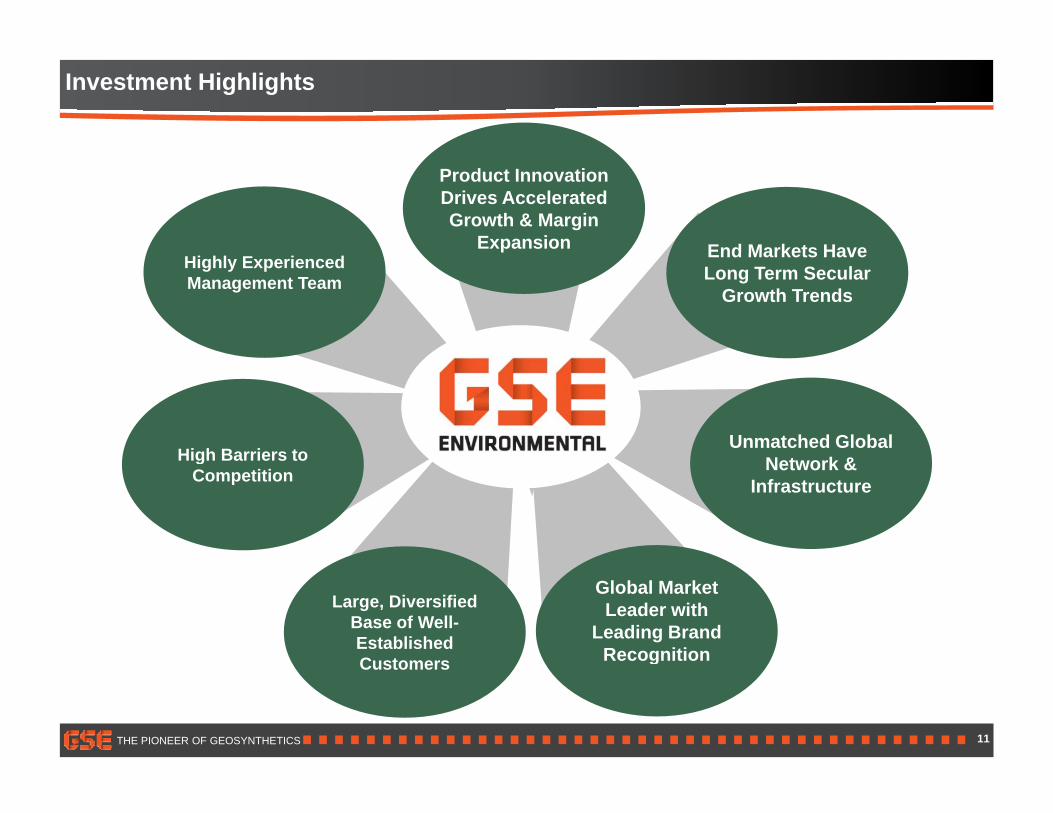
Investment Highlights
Product Innovation Drives Accelerated Growth & Margin
Expansion End Markets HaveEnd Markets Have Long Term Secular
Growth Trends
Highly Experienced Management Team
Unmatched Global N t k &High Barriers to Network &
InfrastructureHigh Barriers to
Competition
Global Market Leader with
Leading Brand Recognition
Large, Diversified Base of Well-Established Customers
THE PIONEER OF GEOSYNTHETICS 11
gCustomers

Product Innovation – Re-Engineered Core Products
Utili i l i t t 3 ti d t t t l h d d f
T t G M i2011
Utilizing polymer science to create 3-tier product strategy, launched end of 2011 and fully operational globally in mid-2012
High Performance
Target Gross Margins2011Gross Margin
EPA Spec Liner
gLiner
(“Best”)25 – 29%
~14%EPA Spec Liner(Impacting 70%
2011 Sales)
Re-EngineeredEPA Spec Liner
(“Better”)15 – 17%
300 – 400 bps gross margin improvement
Fit-For-Purpose Liner
(“Good”)17 – 21%
THE PIONEER OF GEOSYNTHETICS 12
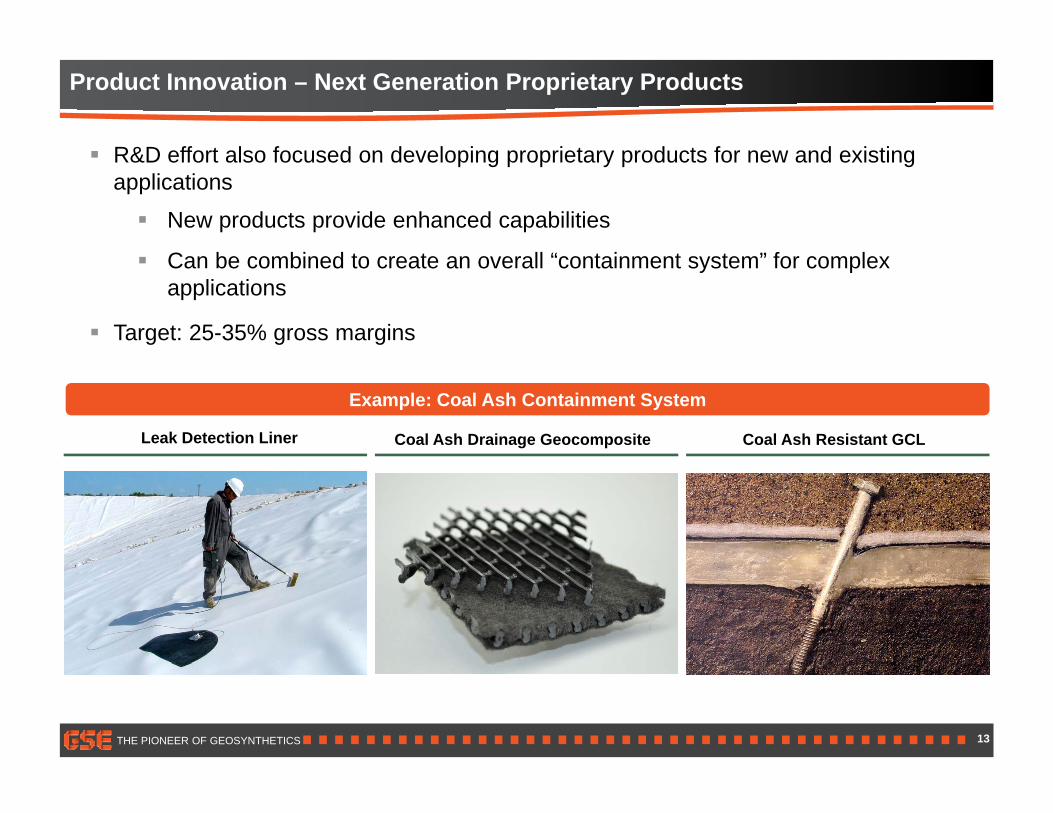
Product Innovation – Next Generation Proprietary Products
R&D ff t l f d d l i i t d t f d i ti R&D effort also focused on developing proprietary products for new and existing applications
New products provide enhanced capabilities
C b bi d t t ll “ t i t t ” f l Can be combined to create an overall “containment system” for complex applications
Target: 25-35% gross margins
Example: Coal Ash Containment System
Leak Detection Liner Coal Ash Drainage Geocomposite Coal Ash Resistant GCL
THE PIONEER OF GEOSYNTHETICS 13
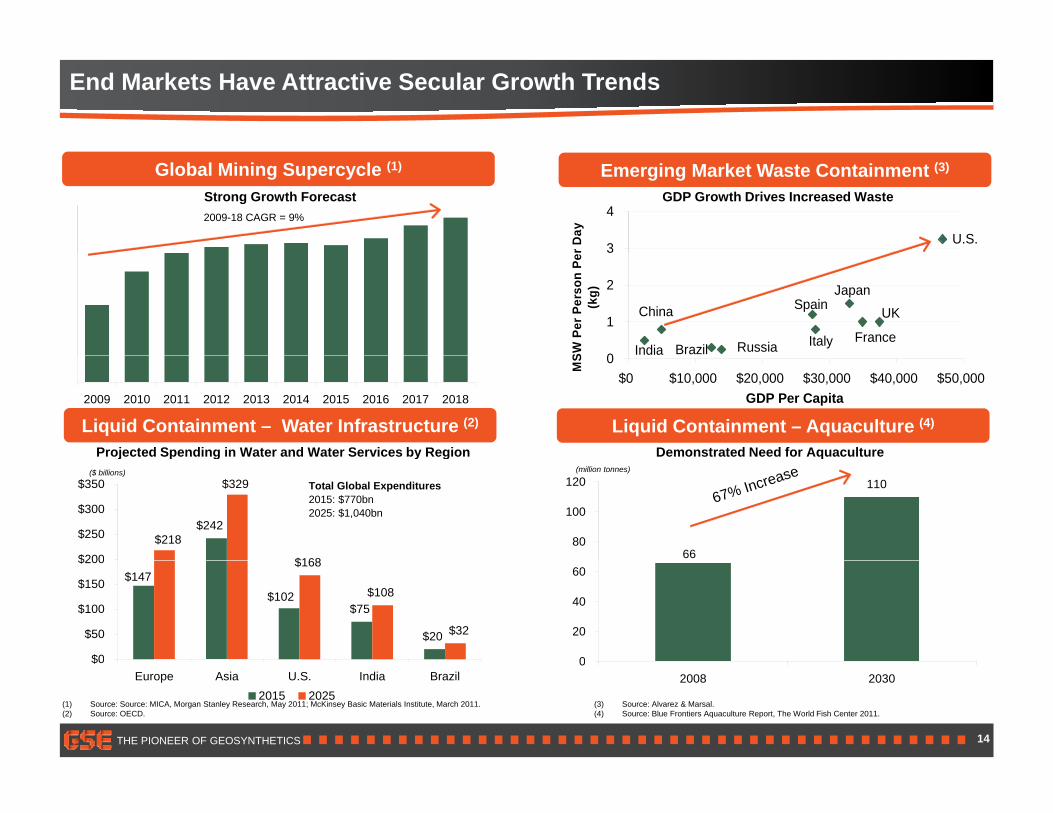
End Markets Have Attractive Secular Growth Trends
U.S.3
4
r Day
Global Mining Supercycle (1) Emerging Market Waste Containment (3)
GDP Growth Drives Increased Waste Strong Growth Forecast 2009-18 CAGR = 9%
India
China
Brazil Russia
Spain
Italy
Japan
France
UK
0
1
2
SW P
er P
erso
n Pe
(kg)
79113
132 138 141 142 140 147 160 168
0$0 $10,000 $20,000 $30,000 $40,000 $50,000
GDP Per Capita
MS
Demonstrated Need for Aquaculture
Liquid Containment – Aquaculture (4)Liquid Containment – Water Infrastructure (2)
Projected Spending in Water and Water Services by Region
2009 2010 2011 2012 2013 2014 2015 2016 2017 2018
67% Increase
66
110
80
100
120
q
$329
$168
$242$218
$200
$250
$300
$350 Total Global Expenditures2015: $770bn2025: $1,040bn
(million tonnes)($ billions)
j p g y g
0
20
40
60
$75
$20
$168
$108$147
$102
$32
$0
$50
$100
$150
$200
THE PIONEER OF GEOSYNTHETICS
02008 2030
$0Europe Asia U.S. India Brazil
2015 2025
14
(1) Source: Source: MICA, Morgan Stanley Research, May 2011; McKinsey Basic Materials Institute, March 2011. (2) Source: OECD.
(3) Source: Alvarez & Marsal.(4) Source: Blue Frontiers Aquaculture Report, The World Fish Center 2011.
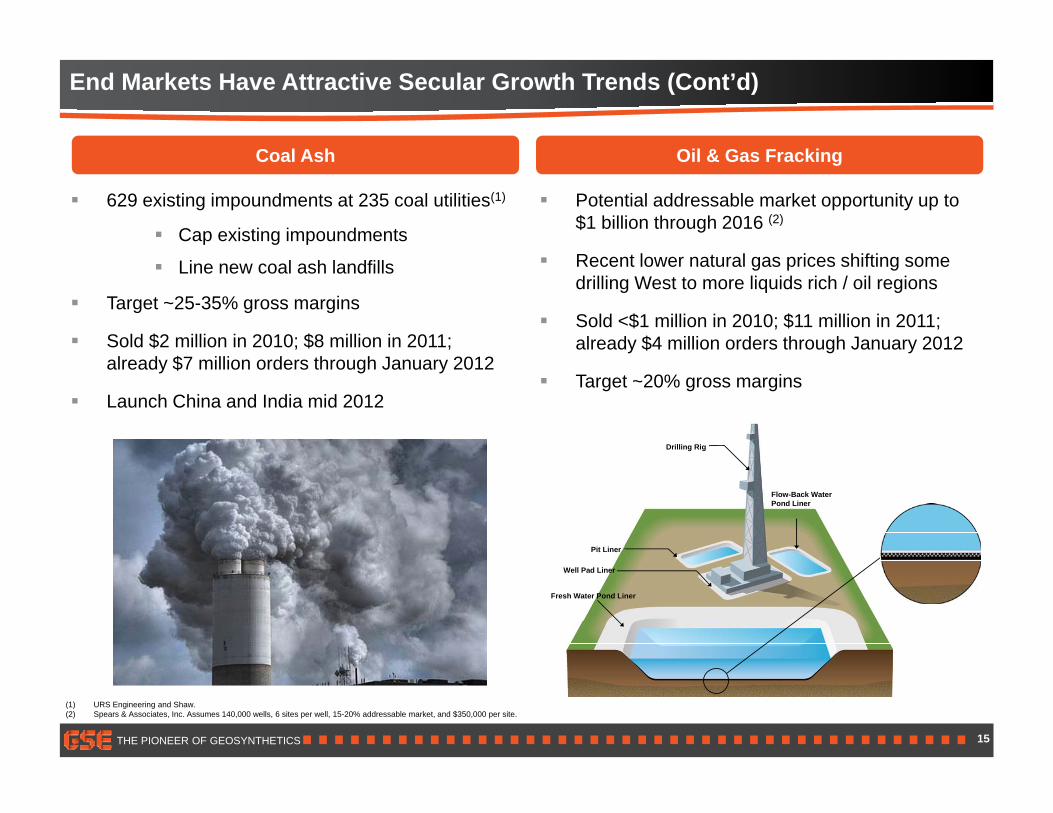
End Markets Have Attractive Secular Growth Trends (Cont’d)
Oil & G F kiC l A h Oil & Gas Fracking
629 existing impoundments at 235 coal utilities(1)
Cap existing impoundments
Potential addressable market opportunity up to $1 billion through 2016 (2)
Coal Ash
Line new coal ash landfills
Target ~25-35% gross margins
Sold $2 million in 2010; $8 million in 2011; $
Recent lower natural gas prices shifting some drilling West to more liquids rich / oil regions
Sold <$1 million in 2010; $11 million in 2011; already $4 million orders through January 2012
already $7 million orders through January 2012
Launch China and India mid 2012 Target ~20% gross margins
Drilling Rig
Flow-Back Water Pond Liner
Pit Liner
Fresh Water Pond Liner
Well Pad Liner
THE PIONEER OF GEOSYNTHETICS 15
(1) URS Engineering and Shaw.(2) Spears & Associates, Inc. Assumes 140,000 wells, 6 sites per well, 15-20% addressable market, and $350,000 per site.

Global Regulatory Climate Continues to Favor GSE Containment Solutions
United States China
Europe
Oil and gas fracking regulation – top priority among member states
Environmental protection –top priority
$28 billion for urban waste disposal (2011-2015)
Poland and UK –developing mandate of strict fracking controls
Increased regulation of groundwater activity
Coal ash management
Shale gas / fracking
Mine work tailings Middle East
Water contamination – strong regulatory framework
South America
Brazil – First national waste management law (2010)
Chil E i t l
India
Urbanization leads to increased solid waste generation
Africa Chile – Environmental
regulations and sustainability as priority
generation
Foreign investment driving increased environmental awareness
Ground water protection and consumption – top priority
Mining activities – increased environmental control
THE PIONEER OF GEOSYNTHETICS. 16
Solid waste – increased regulation
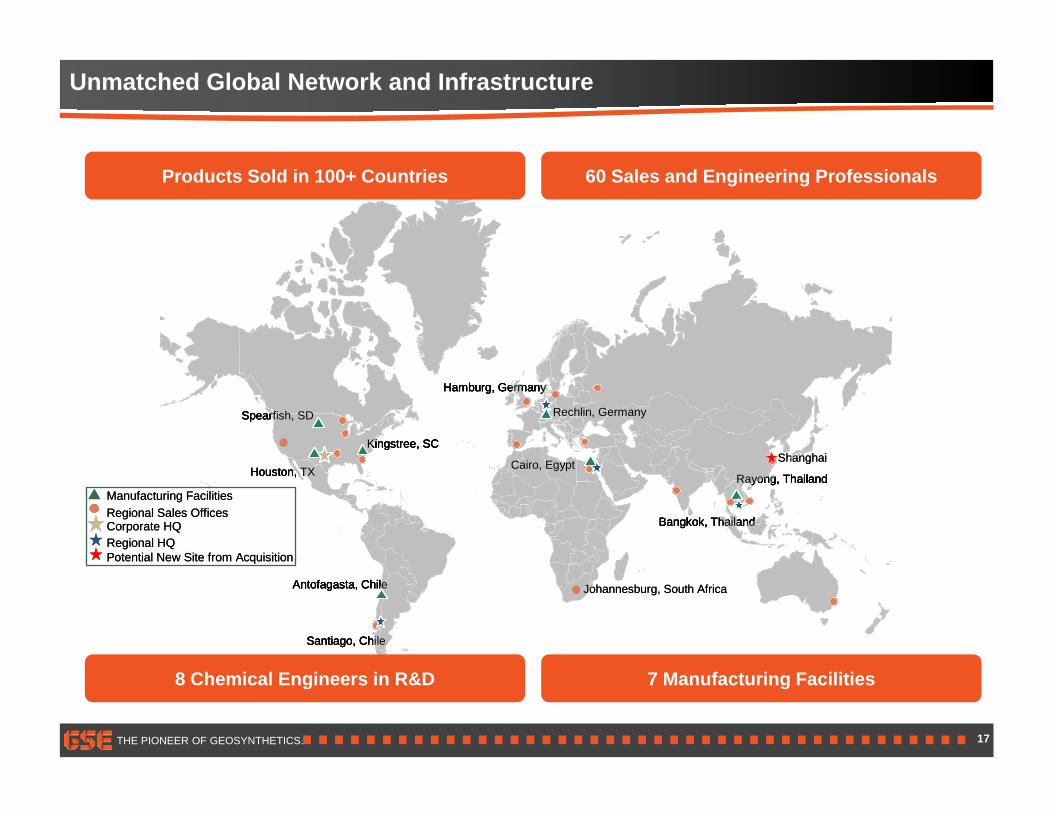
Unmatched Global Network and Infrastructure
60 Sales and Engineering ProfessionalsProducts Sold in 100+ Countries
Kingstree, SC
Spearfish, SD
Hamburg, Germany
Rechlin, Germany
Kingstree, SC
Spearfish, SD
Hamburg, Germany
Rechlin, Germany
ShanghaiKingstree, SC
Spearfish, SD
Hamburg, Germany
Rechlin, Germany
Kingstree, SC
Spearfish, SD
Hamburg, Germany
Rechlin, Germany
ShanghaiHouston, TX Cairo, Egypt
Bangkok, Thailand
Rayong, ThailandHouston, TX Cairo, Egypt
Bangkok, Thailand
Rayong, Thailand
ShanghaiHouston, TX Cairo, Egypt
Bangkok, Thailand
Rayong, ThailandHouston, TX Cairo, Egypt
Bangkok, Thailand
Rayong, Thailand
Shanghai
Corporate HQRegional HQ
Manufacturing FacilitiesRegional Sales Offices
Potential New Site from Acquisition
Corporate HQRegional HQ
Manufacturing FacilitiesRegional Sales Offices
Potential New Site from Acquisition
Antofagasta, Chile
Santiago, Chile
Antofagasta, Chile
Santiago, Chile
Johannesburg, South Africa Antofagasta, Chile
Santiago, Chile
Antofagasta, Chile
Santiago, Chile
Johannesburg, South Africa
Potential New Site from AcquisitionPotential New Site from Acquisition
THE PIONEER OF GEOSYNTHETICS.
7 Manufacturing Facilities8 Chemical Engineers in R&D
17
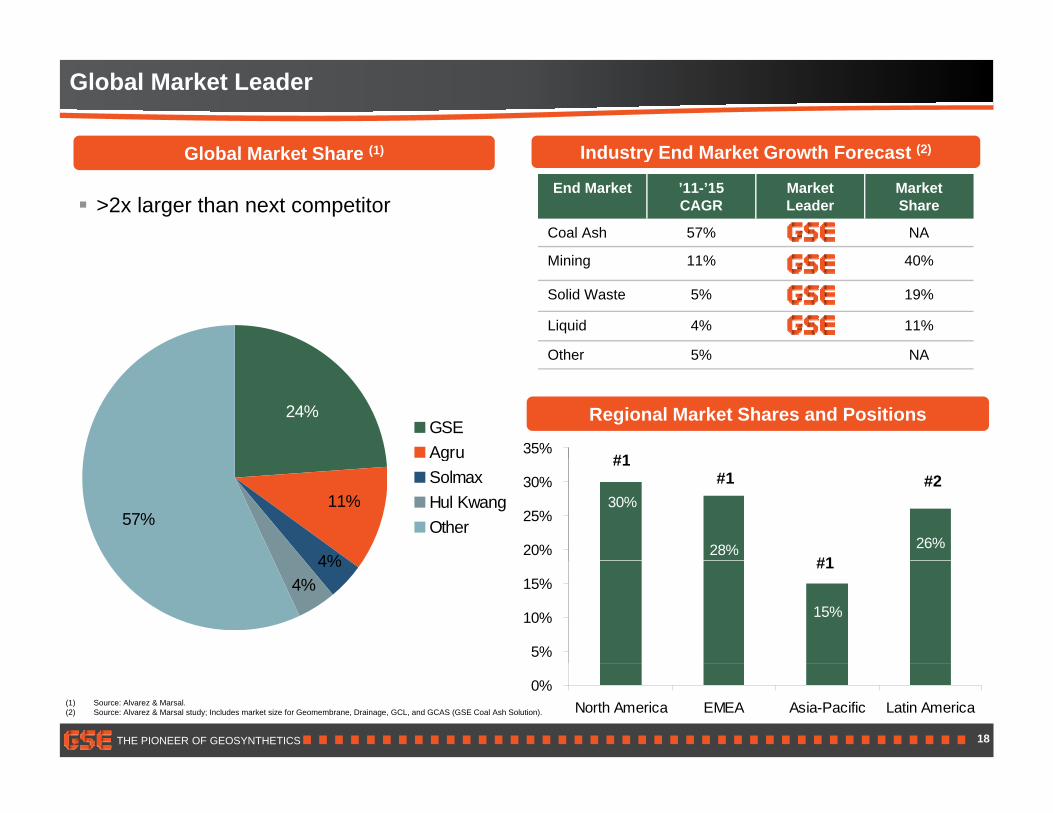
Global Market Leader
Global Market Share (1) Industry End Market Growth Forecast (2)Global Market Share (1)
>2x larger than next competitor
Industry End Market Growth Forecast (2)
End Market ’11-’15 CAGR
Market Leader
Market Share
Coal Ash 57% NA
Mining 11% 40%
Solid Waste 5% 19%
Liquid 4% 11%
Other 5% NA
Regional Market Shares and Positions24%GSEAgru 35%
#1
Other 5% NA
57%
4%
11%
g uSolmaxHul KwangOther
26%28%
30%
20%
25%
30%#1
#1
#1
#2
4%4%
15%
5%
10%
15%#1
THE PIONEER OF GEOSYNTHETICS 18
(1) Source: Alvarez & Marsal.(2) Source: Alvarez & Marsal study; Includes market size for Geomembrane, Drainage, GCL, and GCAS (GSE Coal Ash Solution).
0%North America EMEA Asia-Pacific Latin America
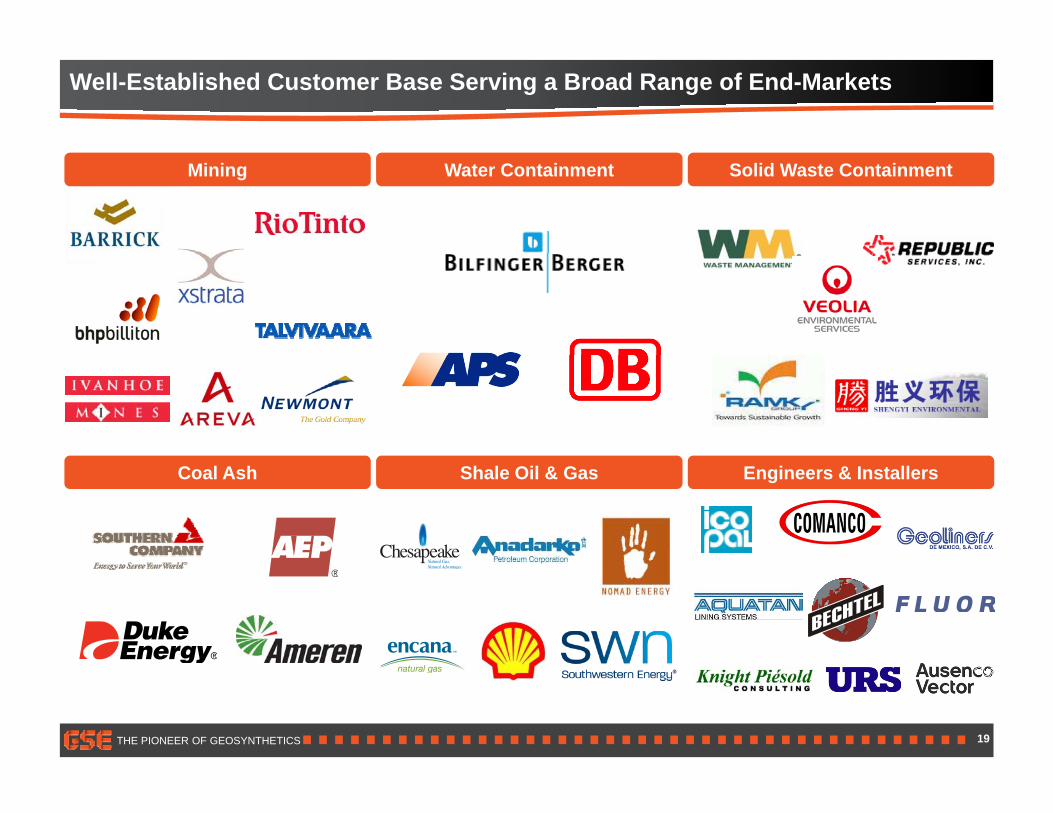
Well-Established Customer Base Serving a Broad Range of End-Markets
Mining Water Containment Solid Waste Containment
Coal Ash Shale Oil & Gas Engineers & Installers
THE PIONEER OF GEOSYNTHETICS 19
Financial Highlights
Revenue growth driven by attractive end markets, regions and regulatory mandates
High revenue visibility
Margin expansion driven by operational improvements and new products
Strong free cash flow generation
Financial flexibility to pursue growth opportunities and capacity expansion
THE PIONEER OF GEOSYNTHETICS 20
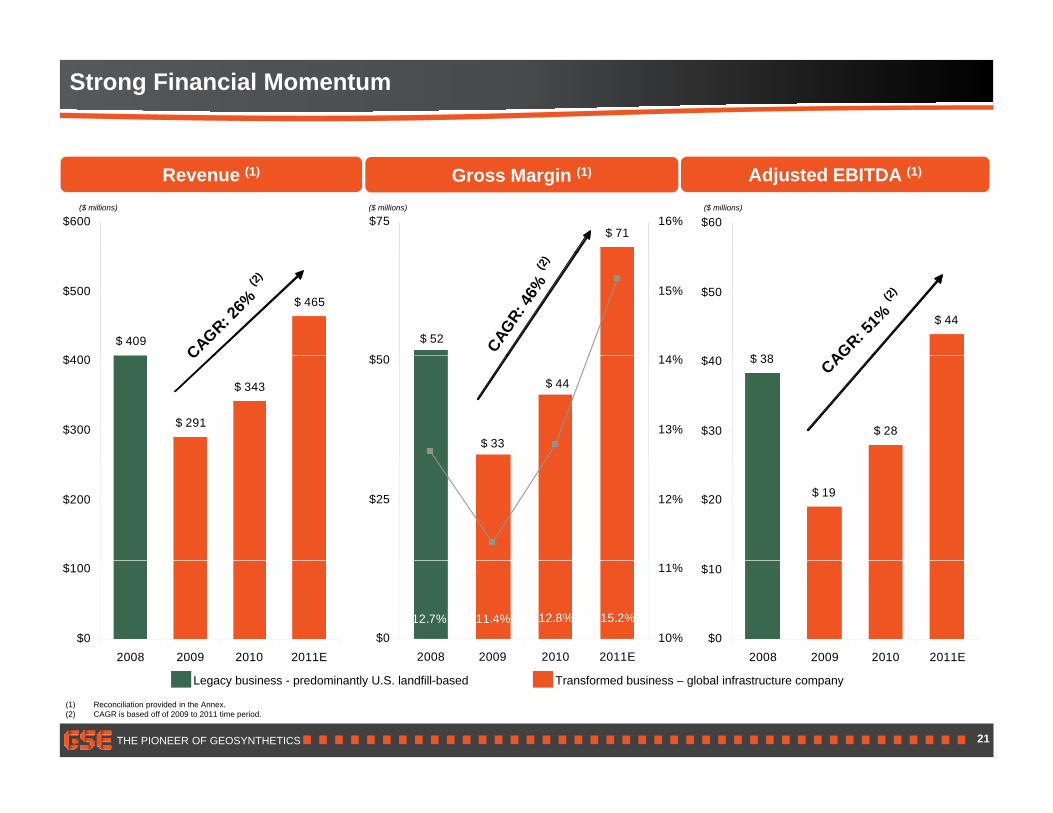
Strong Financial Momentum
Revenue (1) Adjusted EBITDA (1)Gross Margin (1)
($ millions) ($ millions) ($ millions)
$600$ 71
$75 16% $60
CAGR: 26%
(2)
$ 409
$ 465
$400
$500
CAGR:
46%
(2)
$ 52
$50 14%
15%
AGR: 51%
(2)
$ 38
$ 44
$
$50
C
$ 291
$ 343
$300
$400
$ 44
$ 33
$50
13%
14%
CAG$ 38
$ 28$30
$40
$200 $25 12% $ 19$20
$0
$100
2008 2009 2010 2011E
15.2%12.8%11.4%12.7%$0
2008 2009 2010 2011E10%
11%
$0
$10
2008 2009 2010 2011E
THE PIONEER OF GEOSYNTHETICS 21
(1) Reconciliation provided in the Annex.(2) CAGR is based off of 2009 to 2011 time period.
Legacy business - predominantly U.S. landfill-based Transformed business – global infrastructure company
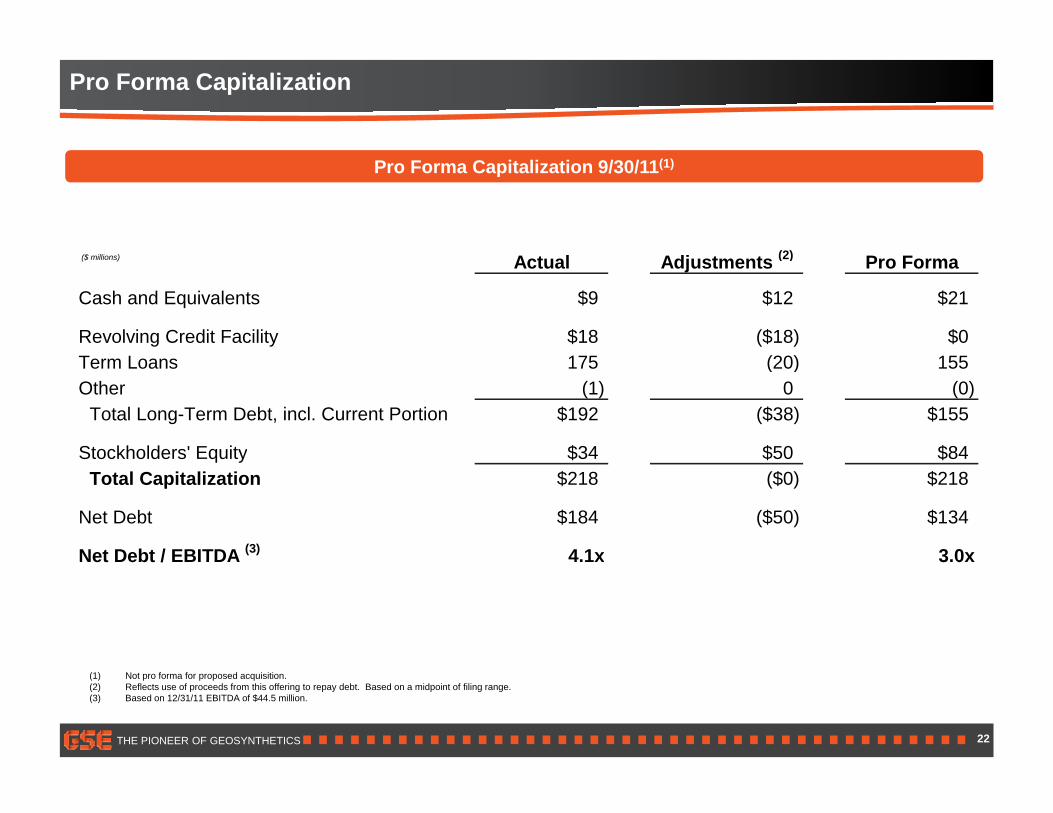
Pro Forma Capitalization
Pro Forma Capitalization 9/30/11(1)
(2)Actual Adjustments (2) Pro Forma
Cash and Equivalents $9 $12 $21
Revolving Credit Facility $18 ($18) $0T L 175 (20) 155
($ millions)
Term Loans 175 (20) 155Other (1) 0 (0)
Total Long-Term Debt, incl. Current Portion $192 ($38) $155
Stockholders' Equity $34 $50 $84Stockholders Equity $34 $50 $84Total Capitalization $218 ($0) $218
Net Debt $184 ($50) $134
Net Debt / EBITDA (3) 4.1x 3.0xNet Debt / EBITDA 4.1x 3.0x
THE PIONEER OF GEOSYNTHETICS 22
(1) Not pro forma for proposed acquisition.(2) Reflects use of proceeds from this offering to repay debt. Based on a midpoint of filing range.(3) Based on 12/31/11 EBITDA of $44.5 million.
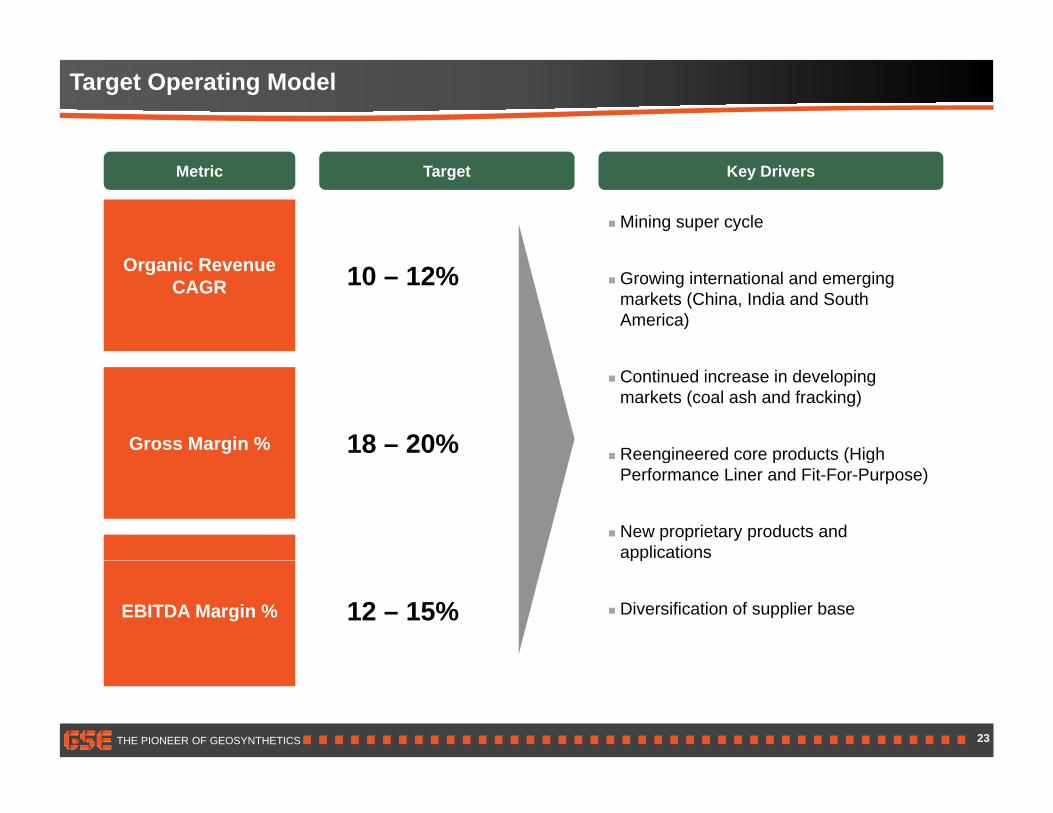
Target Operating Model
Key Drivers
Mining super cycle
Metric Target
Organic RevenueCAGR Growing international and emerging
markets (China, India and South America)
10 – 12%
Gross Margin %
Continued increase in developing markets (coal ash and fracking)
Reengineered core products (High18 – 20% Reengineered core products (High
Performance Liner and Fit-For-Purpose)
New proprietary products and applications
EBITDA Margin %
pp
Diversification of supplier base12 – 15%
THE PIONEER OF GEOSYNTHETICS 23
Y E d d D b 31Nine Months Ended
S t b 30
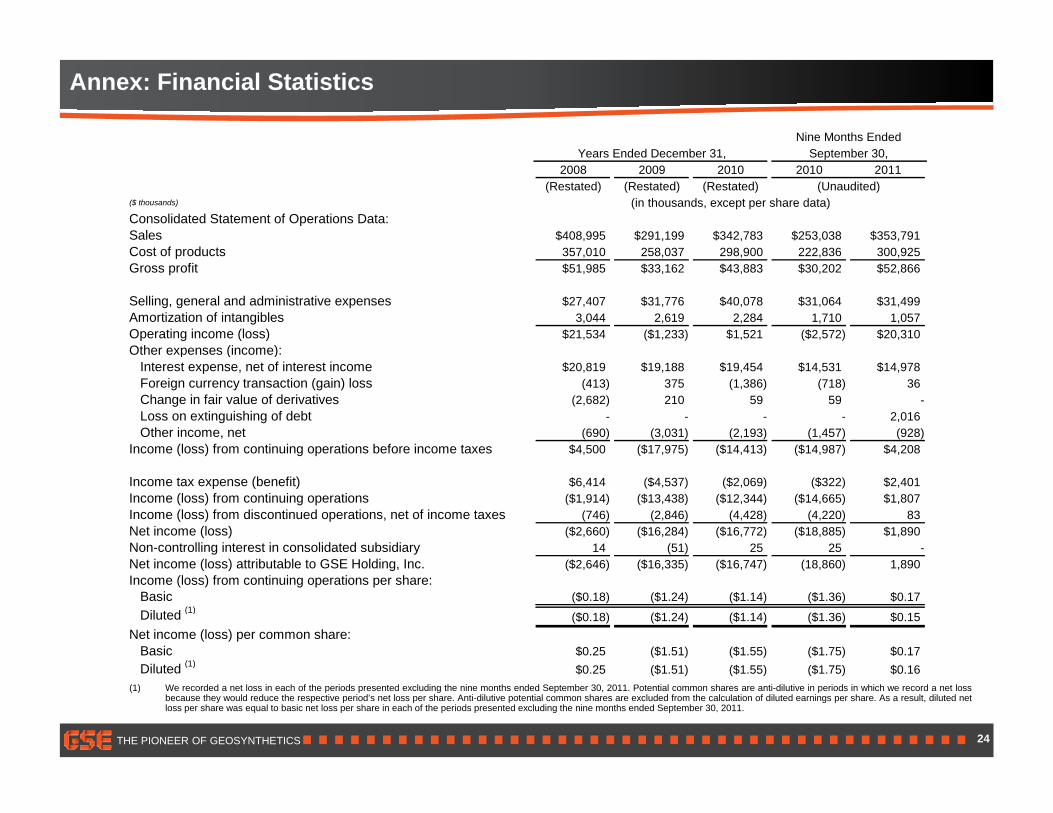
Annex: Financial Statistics
2008 2009 2010 2010 2011(Restated) (Restated) (Restated)
Consolidated Statement of Operations Data:Sales $408,995 $291,199 $342,783 $253,038 $353,791Cost of products 357 010 258 037 298 900 222 836 300 925
(in thousands, except per share data)(Unaudited)
Years Ended December 31, September 30,
($ thousands)
Cost of products 357,010 258,037 298,900 222,836 300,925Gross profit $51,985 $33,162 $43,883 $30,202 $52,866
Selling, general and administrative expenses $27,407 $31,776 $40,078 $31,064 $31,499Amortization of intangibles 3,044 2,619 2,284 1,710 1,057Operating income (loss) $21,534 ($1,233) $1,521 ($2,572) $20,310Other expenses (income):p ( )
Interest expense, net of interest income $20,819 $19,188 $19,454 $14,531 $14,978Foreign currency transaction (gain) loss (413) 375 (1,386) (718) 36Change in fair value of derivatives (2,682) 210 59 59 -Loss on extinguishing of debt - - - - 2,016Other income, net (690) (3,031) (2,193) (1,457) (928)
Income (loss) from continuing operations before income taxes $4,500 ($17,975) ($14,413) ($14,987) $4,208
Income tax expense (benefit) $6,414 ($4,537) ($2,069) ($322) $2,401Income (loss) from continuing operations ($1,914) ($13,438) ($12,344) ($14,665) $1,807Income (loss) from discontinued operations, net of income taxes (746) (2,846) (4,428) (4,220) 83Net income (loss) ($2,660) ($16,284) ($16,772) ($18,885) $1,890Non-controlling interest in consolidated subsidiary 14 (51) 25 25 -N t i (l ) tt ib t bl t GSE H ldi I ($2 646) ($16 335) ($16 747) (18 860) 1 890Net income (loss) attributable to GSE Holding, Inc. ($2,646) ($16,335) ($16,747) (18,860) 1,890Income (loss) from continuing operations per share:
Basic ($0.18) ($1.24) ($1.14) ($1.36) $0.17Diluted (1)
($0.18) ($1.24) ($1.14) ($1.36) $0.15Net income (loss) per common share:
Basic $0.25 ($1.51) ($1.55) ($1.75) $0.17(1)
THE PIONEER OF GEOSYNTHETICS
Diluted (1) $0.25 ($1.51) ($1.55) ($1.75) $0.16
24
(1) We recorded a net loss in each of the periods presented excluding the nine months ended September 30, 2011. Potential common shares are anti-dilutive in periods in which we record a net lossbecause they would reduce the respective period’s net loss per share. Anti-dilutive potential common shares are excluded from the calculation of diluted earnings per share. As a result, diluted netloss per share was equal to basic net loss per share in each of the periods presented excluding the nine months ended September 30, 2011.

Nine Months EndedY E d d D b 31 S t b 30
Annex: Financial Statistics (Cont’d)
Years Ended December 31, September 30,2008 2009 2010 2010 2011
(Restated) (Restated) (Restated)Net income (loss) attributable to GSE Holding, Inc. ($2,646) ($16,335) ($16,747) ($18,860) $1,890(Income) loss from discontinued operations, net of income taxes 746 2,846 4,428 4,220 (83)Interest expense, net of interest rate swap 20,398 18,005 18,935 14,025 14,983Income tax expense (benefit) 6 414 (4 537) (2 069) (322) 2 401
($ thousands)
Income tax expense (benefit) 6,414 (4,537) (2,069) (322) 2,401Depreciation and amortization expense 13,219 12,703 12,700 9,486 9,340Change in the fair value of derivatives (a) (2,682) 210 59 59 -Foreign currency transaction (gain) loss (b) (413) 375 (1,386) (718) 36Restructuring expense (c) - 1,444 1,096 1,183 381Professional fees (d) 262 1,436 8,904 8,462 3,143St k b d ti (e)Stock-based compensation expense (e) 450 28 67 14 75Management fees (f) 2,004 2,004 2,019 1,519 1,520Loss on extinguishment of debt (g) - - - - 2,016Other (h) 647 972 58 59 8Adjusted EBITDA $38,399 $19,151 $28,064 $19,127 $35,710
(a) Represents the mark-to-market change in the value of three interest rate swaps, including one entered into in July 2010 in connection with our German revolving credit facility, one entered into in January2005 and one in June 2009 each as a mechanism to convert $75 0 million of fixed rate debt to variable rate debt2005 and one in June 2009, each as a mechanism to convert $75.0 million of fixed rate debt to variable rate debt.
(b) Primarily related to gains and losses incurred on purchases, sales, intercompany loans and dividends denominated in non-functional currencies.
(c) Represents severance costs primarily related to the restructuring and productivity improvement programs we adopted during the fourth quarter of 2009.
(d) Represents consulting and other advisory fees related to recruiting a new chief executive officer in 2008 and 2009 and the restructuring and productivity improvement programs adopted by us during thefourth quarter of 2009, which primarily consists of fees related to the engagement of an independent consulting firm that specializes in performance improvements for portfolio companies of privateequity firms.
(e) Represents the compensation expense attributable to each respective period based on the calculated value of employee stock options.
(f) Represents management fees that will terminate in connection with this offering. See ‘‘Certain Relationships and Related Party Transactions – Management Agreement.’’
THE PIONEER OF GEOSYNTHETICS 25
(g) Represents the loss recognized in connection with the refinancing of our Senior Notes as described in ‘‘Management’s Discussion and Analysis of Financial Condition and Results of Operations – Liquidityand Capital Resources – The Refinancing Transactions; Description of Long Term Indebtedness.’’
(h) 2008 and 2009 include $0.6 million of disaster recovery expense associated with Hurricane Ike and $1.0 million of death benefits paid to the estate of our former President and Chief Executive Officer,respectively. Otherwise, relates to gains and losses on asset sales.
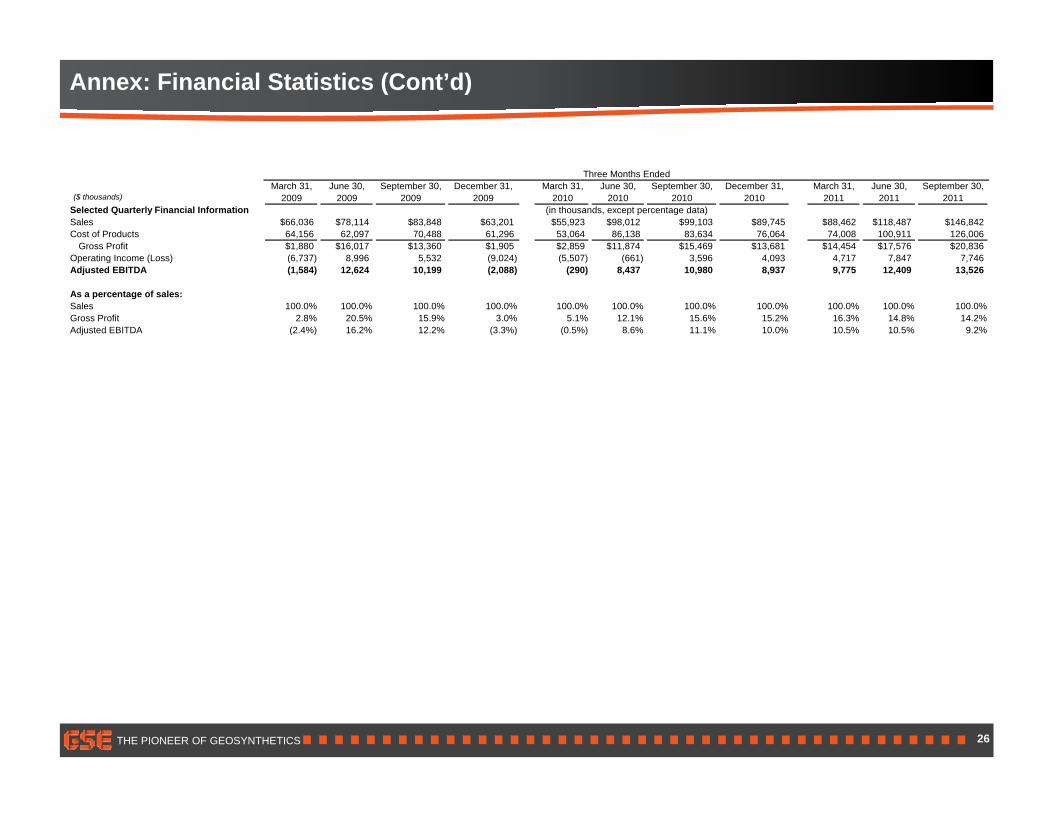
Annex: Financial Statistics (Cont’d)
($ thousands)
Three Months EndedMarch 31, June 30, September 30, December 31, March 31, June 30, September 30, December 31, March 31, June 30, September 30,
2009 2009 2009 2009 2010 2010 2010 2010 2011 2011 2011Selected Quarterly Financial Information (in thousands, except percentage data)Sales $66,036 $78,114 $83,848 $63,201 $55,923 $98,012 $99,103 $89,745 $88,462 $118,487 $146,842Cost of Products 64,156 62,097 70,488 61,296 53,064 86,138 83,634 76,064 74,008 100,911 126,006
Gross Profit $1,880 $16,017 $13,360 $1,905 $2,859 $11,874 $15,469 $13,681 $14,454 $17,576 $20,836Operating Income (Loss) (6,737) 8,996 5,532 (9,024) (5,507) (661) 3,596 4,093 4,717 7,847 7,746Adjusted EBITDA (1,584) 12,624 10,199 (2,088) (290) 8,437 10,980 8,937 9,775 12,409 13,526
As a percentage of sales:Sales 100.0% 100.0% 100.0% 100.0% 100.0% 100.0% 100.0% 100.0% 100.0% 100.0% 100.0%Gross Profit 2.8% 20.5% 15.9% 3.0% 5.1% 12.1% 15.6% 15.2% 16.3% 14.8% 14.2%Adjusted EBITDA (2.4%) 16.2% 12.2% (3.3%) (0.5%) 8.6% 11.1% 10.0% 10.5% 10.5% 9.2%
THE PIONEER OF GEOSYNTHETICS 26