innovate uk project final report - element energy · 1 uk renewable hydrogen hub (ukrhh)...
TRANSCRIPT
1
UK Renewable
Hydrogen
Hub (UKRHH)
Techno-economic and
environmental
assessment
for
Innovate UK project
FINAL REPORT
24.04.17
Element Energy Limited
Terrington House
13-15 Hills Road
Cambridge CB2 1NL
Tel: 01223 852499
Fax: 01223 353475
2
Contents
1 Executive summary ....................................................................................................... 4
2 Introduction .................................................................................................................... 6
2.1 Aberdeen Hydrogen Bus Project and Innovate-UK ................................................. 6
3 Bus and HRS performance assessment ....................................................................... 7
3.1 Background .............................................................................................................. 7
3.2 Project targets and success criteria ......................................................................... 8
3.3 FC bus performance ................................................................................................. 9
3.4 HRS Performance .................................................................................................. 13
3.5 Technical summary ................................................................................................ 19
3.6 Comparison with other European deployments ..................................................... 19
4 Bus and HRS economic assessment .......................................................................... 22
4.1 Methodology and assumptions............................................................................... 22
4.2 Current economics of overall bus project ............................................................... 23
4.3 Benefits of grid balancing ....................................................................................... 24
4.4 Sensitivity analysis ................................................................................................. 26
4.5 Future targets ......................................................................................................... 28
4.6 Comparison with battery electric bus technology ................................................... 29
5 Bus and HRS environmental assessment ................................................................... 31
5.1 Methodology and assumptions............................................................................... 31
6 Conclusions ................................................................................................................. 35
Authors
For comments or queries please contact:
0330 088 3916
or
01223 852498

3

4
1 Executive summary
The UK Renewable Hydrogen Hub (UKRHH) project has successfully demonstrated 10
state-of-the-art Van Hool A330 fuel cell buses (the largest FC bus deployment in Europe to
date) and a dedicated 300kg/day hydrogen refuelling station (HRS), operated by BOC to
dispense ‘green’ hydrogen to the buses on a daily basis. The HRS includes an array of three
grid connected alkaline water electrolysers to generate hydrogen fuel on-site – Europe’s
largest transport related electrolyser facility to date.
Technical assessment
In the first year of full operation (between June 2015 and May 2016), Stagecoach and First
Group operated the fuel cell buses on commercial routes in Aberdeen, exceeding the target
mileage by achieving 487,000 km. After a 3.5-month teething period, average bus availability
reached 75%. A number of component failure issues caused long periods of unavailability
due to lengthy diagnostics and spare part deliveries, both of which are common for emerging
technologies. Efforts to improve spare parts supply chain are in place with the recent
decision to house a larger spare part stock in Aberdeen. The fleet have shown an average
fuel consumption of 10.3 kg-H2/100km which is higher than the <10kg-H2/100km target but
Van Hool, the bus supplier, are in the process of implementing an improved strategy for
heating the cabin which is expected to improve fuel consumption.
The hydrogen refuelling station, with an installed capacity of 300 kg/day, achieved 99.9%
availability since 2015 with only very short periods of downtime caused by tripping
components. This is a significant improvement on existing European stations, e.g. in the
CHIC project average stations was 97%. The refuelling equipment enabled refills to be
completed in 12 minutes. Taking into account that buses in this project had to travel to the
HRS from their depots for refuelling, and therefore refuelled every other day, this refuelling
time is consistent with bus operators’ requirements for daily refills needing lasting under 10
minutes.
The hydrogen production system consistently met the required demand from the buses, with
over 74 tonnes of hydrogen produced between July 2015 and October 2016. The
electrolyser array was operated under a range of load factors, in part due to variable
hydrogen demand caused by periodic low bus availability but also due to the artificial grid
environments created to simulate participation in grid balancing services or connection to a
renewable generator. The impact of variable load factor on hydrogen production efficiency
has been difficult to measure due to unreliable data, which partners hope to rectify in the
remaining years of the demonstration activity. Importantly, the electrolysers responded
rapidly to ramp-up signals, illustrating the technology’s capability to act as a flexible load
and adsorb excess power to meet balancing market requirements or variable load from to
renewable generation.
Economic assessment
Contracts for the UKRHH project were established in 2013. The total cost of ownership
(TCO) for owning and operating the Van Hool A330 fuel cell buses in Aberdeen with
supporting infrastructure is £267,000 per year per bus (150% premium compared to the
incumbent diesel ICE technology) where bus capital costs make up the largest component,
representing 35% of the TCO.
Since 2013, standardisation and economies of scale have reduced bus capital costs by over
40%. Furthermore, infrastructure and electrolyser capital costs have decreased by 20% and
40% respectively by reducing the impact of redundancy and maximising equipment

5
utilisation. As a result, the TCO for operating a fuel cell bus procured in 2016 is around
£169,000 per year per bus, i.e. almost £100,000 saving compared to 2013 costs, making
fuel cell electric technology competitive with battery electric buses. There is still a premium
of £62,000 per year per bus compared to a diesel bus TCO.
Therefore there is large market potential for fuel cell electric buses in locations where zero
emission vehicles are a necessity, i.e. the where diesel cannot compete due to regulation
and policy intervention. However, to fully commercialise fuel cell electric bus technology,
further technical and economic improvements are needed. By the mid-2020s, industry
should aim to bring bus capital costs below £300,000 and infrastructure costs down by at
least 60% from 2013 costs. This, combined with lower fuel costs from fuel economy
improvements, electricity cost optimisation and grid balancing revenues, will yield a TCO of
£113,000 per year per bus which would only have a 6% premium compared to diesel buses.
Environmental assessment
Fuel cell electric buses have zero harmful tailpipe emissions making the technology
attractive for cities with air quality issues. Annual NOx savings from the 10 fuel cell buses,
compared to EURO VI diesel buses, are estimates to be approx. 400 kg of NOx suggesting
1.6 tonnes of NOx could be offset after the four-year trial. Replacing 10% of the Aberdeen
bus fleet with fuel cell electric buses would reduce overall NOx emissions by 4% across the
City.
CO2 savings from operating the fuel cell bus fleet are contingent on the carbon content of
the electricity used to produce electrolytic hydrogen at the refuelling station. Aberdeen City
Council have adopted a ‘green’ tariff from their electricity supplier to ensure carbon free
electricity is supplied to the facility. As a result, the CO2 savings, compared to an average
diesel bus, were 240 tonnes of CO2 in the first year of operation.
Concluding remarks
Whilst the UKRHH project ends in February 2017, Stagecoach and First Group will continue
to operate the fuel cell buses until at least 2019 and in 2017 BOC will upgrade the refuelling
facility to enable 700 bar hydrogen dispensing for passenger vehicles. Furthermore, the
success of this demonstration activity has proven the benefits of the technology to Aberdeen
City Council and has motivated the Council to introduce 10 more fuel cell buses to the
existing fleet as part of the JIVE project.1
1 https://fuelcellsworks.com/news/launch-of-european-collaborative-project-jive-to-deliver-zero-emission-fuel-cell-buses-across-eur/

6
2 Introduction
2.1 Aberdeen Hydrogen Bus Project and Innovate-UK
The UK Renewable Hydrogen Hub (UKRHH) project in Aberdeen aimed to demonstrate and
evaluate the real-world application of emerging technologies relating to hydrogen’s use as
a transport fuel, and to investigate the potential for rapid response electrolysers to aid
constrained distribution networks.
The three-year project involved the deployment of 10 state-of-the-art Van Hool A330 fuel
cell buses (the largest FC bus deployment in Europe) to be operated by Stagecoach and
First Group. A dedicated 300kg/day hydrogen refuelling station (HRS) was also constructed
and operated by BOC to dispense ‘green’ hydrogen to the buses on a daily basis. The HRS
included three grid connected alkaline water electrolysers to generate hydrogen fuel on-site
– Europe’s largest transport related electrolyser facility to date.
Since March 2015, the buses have been successfully operational on commercial routes in
Aberdeen and whilst the UKRHH project ends in February 2017, Aberdeen City Council are
pleased with the technology and will continue operating the buses until at least 2019.
Furthermore, the Council have announced that a further 10 fuel cell buses will be
introduced.2
This report describes the technical, economic and environmental performance of the
refuelling station, electrolyser and buses. A report describing Scottish and Southern
Electricity Network’s (SSEN) assessment of the electrolyser’s ability to act as a flexible load
and support the grid can be downloaded here:
https://www.ssen.co.uk/DistributionInnovation/ahp/
2 https://fuelcellsworks.com/news/launch-of-european-collaborative-project-jive-to-deliver-zero-emission-fuel-cell-buses-across-eur/

7
3 Bus and HRS performance assessment
3.1 Background
The Aberdeen Hydrogen Bus project is composed of a number of funded projects, of which
the UKRHH project is one. All of the partners involved in the Aberdeen Hydrogen Bus
project were keen to ensure consistent data collection and analysis, in line with
methodologies used by other alternative fuel bus deployments across Europe. The data
collection and analysis for the UKRHH project was conducted in line with these principles.
To monitor the equipment performance, state-of-the-art data collection devices were
integrated into the buses, HRS and electrolysers to automate data delivery to organisations
responsible for data analysis.3 The raw data was regularly converted into a series of KPIs
and compared against a series of project success criteria. Multiple organisations were
involved in the demonstration activities therefore a data specification document was
prepared by Element Energy at the start of the project to stipulate which organisations were
responsible for collecting and analysing the data that would be provided to the UKRHH
consortium. Figure 1 illustrates data flows captured by the data specification document.
Figure 1 Schematic of data flows from equipment to data analyser to evaluator
3 For the project duration, PLANET (www.planet-energie.de) was responsible for analysing raw operational datasets collected from the refuelling station and six Stagecoach fuel cell buses in Aberdeen as part of the FCH JU funded HyTransit project. To ensure consistency between HyTransit and UKRHH, the resulting KPIs from PLANET’s analysis were regularly submitted to Element Energy to support discussions at Innovate-UK quarterly meetings and to be included in this report. We are grateful to PLANET (and the HyTransit consortium) for providing this information. Data from the First Group buses was provided by ACC.

8
3.2 Project targets and success criteria
Project success criteria were defined in 2012 as follows:
At the time of definition, it was envisaged that there would be a full two years of operation of
the fuel cell buses before the end of the Innovate UK project at the end of January 2017,
4 Measured as the amount of time the station is available over the total amount of time excluding planned maintenance
Refuelling station
Dispensing rate Maximum continuous rate of 120g/s (at 350 bar)
Refuelling capacity 300kg/day maximum
Refuelling window All 10 buses able to refuel from empty within a 4-hour window
Availability4 99%
Bus operation
Total fleet distance travelled 1 million km during the first two years of bus operation
Fuel efficiency (bus) <10kg/100km
Total number of fuelling operations
Over 2,000 fuelling incidents will take place over the course of the first two years of operation.
Electrolyser
Operation at a range of daily load factors
50-100%
Hydrogen purity SAE 2719 specifications
Hydrogen production meets expected hydrogen demand
250kg/day
Efficiency (electrolyser system only)
>58% (LHV basis)
Response time (electrolyser) <5s
System production efficiency 52% (LHV basis)
Total hydrogen produced over 2
years
> 100,000 kg

9
and project success criteria were defined based on two years’ worth of operation. However,
delays5 to the start of the operational period for the buses means that there will only be 22
months of operation by the end of January 2017. In addition, the time taken for data
collection, processing and analysis means that only data up until the end of October 2016,
i.e. 19 months of data, will be available to be included in the final technical reports. In the
analysis below, the success criteria are converted to monthly targets, so that actual indicator
values can be related to the targets on a month-by-month basis.
3.3 FC bus performance
Before introducing the data for the fuel cell buses, there are two important issues to note
regarding the data collection for the buses:
1. There have been inconsistencies in some of the data between the bus operator
records for the daily operating status of the buses and the Van Hool records, leading
to different levels of availability. Van Hool and ACC are working on resolving these
differences, but as of the date of finalisation of this report the final data have not yet
been validated. As such, all bus availability data reported here should be
considered as draft as it has not yet been agreed by all relevant partners in the
Aberdeen Hydrogen Bus Project.
2. For limited periods, data from the buses’ on-board data acquisition systems that
records e.g. kilometres travelled, the number of operating hours of the drivetrain,
and the amount of hydrogen refuelled were lost. The extent varies from bus to bus.
The organisation responsible for processing the raw data and submitting evaluated
KPIs to the Innovate UK project, has agreed an approach to ‘mend the data’6 with
relevant partners. This mended data, provided by PLANET, has been used for the
six Stagecoach buses reported here.
5 Delays were unrelated to the fuel cell or electrolyser technology but were primarily caused by significant underestimation of the time needed to complete the civil works at Kittybrewster before the HRS could be built. 6 The data has been ‘mended’ by comparing the difference between the amount of hydrogen dispensed according to the refuelling station data, and the amount dispensed according to the FC bus data. The latter quantity is much smaller in time periods where there a data gaps. The difference can be used to adjust the other indicators affected by the partial loss of data.

10
3.3.1 Fuel cell bus distance travelled
Figure 2 Monthly distance travelled (km) of the fuel cell bus fleet in Aberdeen7
The project success criteria for distance travelled is that the buses will travel more than 1
million km over the first two years of operation. For distance travelled, the success criteria
is equivalent to a monthly target of c. 40,000 km per month. Figure 2 above shows that
since September 2015, the fleet have met this monthly target excluding the holiday period
in December 2015. If the initial two months of operation are excluded8, over the twelve
months ending at the end of May 2016, the buses have travelled 487,000 km.
3.3.2 Fuel consumption
Figure 3 Average fuel consumption (kg/100 km) for each month of the fuel cell bus fleet
Figure 3 shows that whilst the bus fleet on average meets the fuel consumption target of
<10 kg/100 km during the summer months, in the winter months’ consumption increases,
which is likely to be due to the extra energy required for cabin heating. The average between
April 2015 and May 2016 was 10.3 kg/100km. Van Hool are implementing an improved
strategy to manage the heating of the buses to reduce the winter increase in fuel
consumption, and this has so far been implemented in 8 out of the 10 buses. The
8 The initial operating months of the project are viewed as part of a “teething period”, where contractual penalties do not necessarily apply, and where the equipment is not necessarily being subject to typical daily operation as initial issues are ironed out.

11
effectiveness of the improved strategy will be evaluated after the end of the 2016/2017
winter.
3.3.3 Total number of refuelling operations
The success criterion was that over 2,000 fuelling incidents will take place over the course
of the first two years of operation. The project has already surpassed this, with over 2,600
refuelling incidents having taken place in the 17 months between April 2015 and August
2016. Figure 4 below shows the increase in the number of refuelling events over 2015 as
the bus availability improved.
Figure 4 Number of refuelling events per month for the Aberdeen fleet
3.3.4 Fuel cell bus availability
Figure 5 Average monthly availability of the fuel cell bus fleet in Aberdeen9
Figure 5 shows the monthly fuel cell bus availability for the entire bus fleet9. Fuel cell bus
availability has improved since the early months of the project, but there have been issues
affecting the buses which have taken some time to resolve
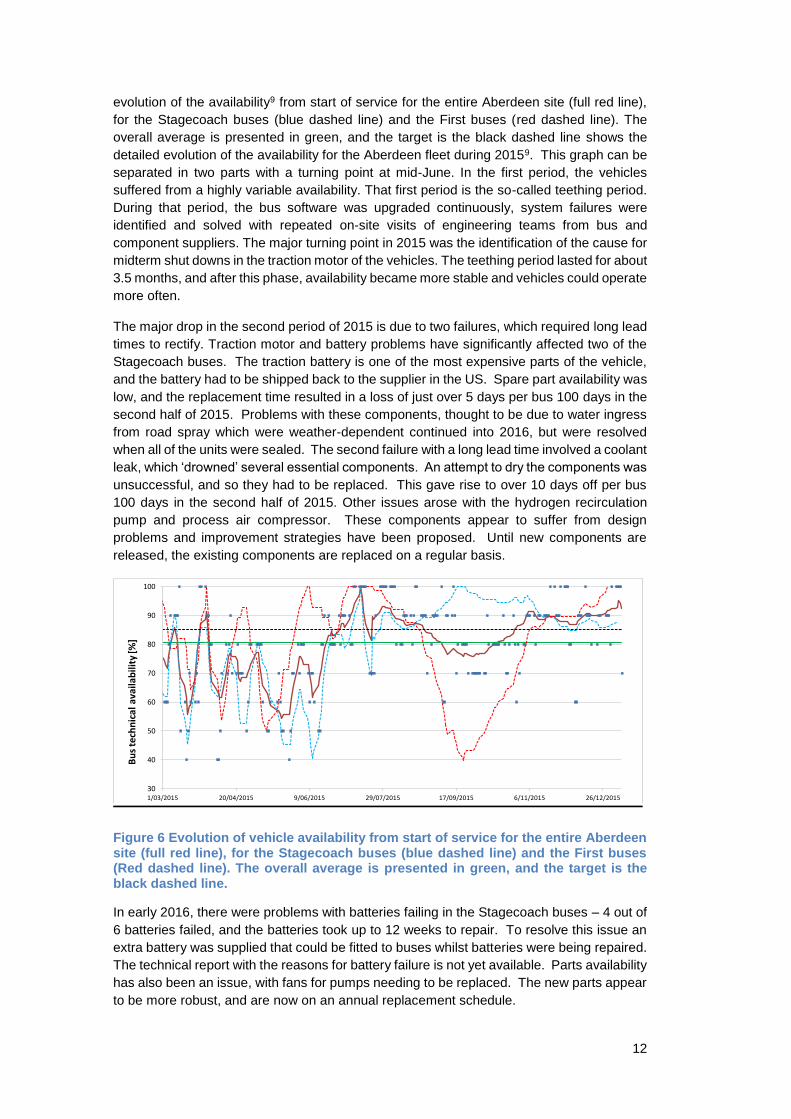
Figure 6 Evolution of vehicle availability from start of service for the entire Aberdeen site (full
red line), for the Stagecoach buses (blue dashed line) and the First buses (Red dashed line).
The overall average is presented in green, and the target is the black dashed line.shows the
9 The availability data for the buses for all months shown is under discussion and should be considered as draft at this stage.
158170
159
202189
227
197
177165
184167166
129
157
110
6868
Jul-15
Aug-15
Sep-15
Oct-15
Nov-15
Dec-15
Jan-16
Feb-16
Apr-15
May-15
Jun-15
No
of
fills
per
mo
nth
Mar-16
Apr-16
May-16
Jun-16
Jul-16
Aug-16
83
12
evolution of the availability9 from start of service for the entire Aberdeen site (full red line),
for the Stagecoach buses (blue dashed line) and the First buses (red dashed line). The
overall average is presented in green, and the target is the black dashed line shows the
detailed evolution of the availability for the Aberdeen fleet during 20159. This graph can be
separated in two parts with a turning point at mid-June. In the first period, the vehicles
suffered from a highly variable availability. That first period is the so-called teething period.
During that period, the bus software was upgraded continuously, system failures were
identified and solved with repeated on-site visits of engineering teams from bus and
component suppliers. The major turning point in 2015 was the identification of the cause for
midterm shut downs in the traction motor of the vehicles. The teething period lasted for about
3.5 months, and after this phase, availability became more stable and vehicles could operate
more often.
The major drop in the second period of 2015 is due to two failures, which required long lead
times to rectify. Traction motor and battery problems have significantly affected two of the
Stagecoach buses. The traction battery is one of the most expensive parts of the vehicle,
and the battery had to be shipped back to the supplier in the US. Spare part availability was
low, and the replacement time resulted in a loss of just over 5 days per bus 100 days in the
second half of 2015. Problems with these components, thought to be due to water ingress
from road spray which were weather-dependent continued into 2016, but were resolved
when all of the units were sealed. The second failure with a long lead time involved a coolant
leak, which ‘drowned’ several essential components. An attempt to dry the components was
unsuccessful, and so they had to be replaced. This gave rise to over 10 days off per bus
100 days in the second half of 2015. Other issues arose with the hydrogen recirculation
pump and process air compressor. These components appear to suffer from design
problems and improvement strategies have been proposed. Until new components are
released, the existing components are replaced on a regular basis.
Figure 6 Evolution of vehicle availability from start of service for the entire Aberdeen site (full red line), for the Stagecoach buses (blue dashed line) and the First buses (Red dashed line). The overall average is presented in green, and the target is the black dashed line.
In early 2016, there were problems with batteries failing in the Stagecoach buses – 4 out of
6 batteries failed, and the batteries took up to 12 weeks to repair. To resolve this issue an
extra battery was supplied that could be fitted to buses whilst batteries were being repaired.
The technical report with the reasons for battery failure is not yet available. Parts availability
has also been an issue, with fans for pumps needing to be replaced. The new parts appear
to be more robust, and are now on an annual replacement schedule.
30
40
50
60
70
80
90
100
1/03/2015 20/04/2015 9/06/2015 29/07/2015 17/09/2015 6/11/2015 26/12/2015
Bu
s te
chn
ical
ava
ilab
ility
[%]

13
During 2016, there have been a series of issues with the fuel cells which have affected the
availability of the buses. In Q3 of 2016, Stagecoach had one bus off the road for 69 days
with a coolant pipe leak in the fuel cell. The lengthy period for resolution is because the fuel
cell was sent back to Ballard and then returned to Aberdeen, but spent a number of weeks
in customs. Upon receiving the returned fuel cell it remained in diagnostics and testing for
some time. In the same quarter, First Group had one bus off the road for 21 days with a fuel
cell issue. There has also been an issue with a traction motor that kept one of the
Stagecoach buses off the road for 115 days, due to repeated phases of testing, repair, and
the repaired traction motor not working correcting.
There have been ongoing discussions between Aberdeen City Council, Van Hool, First and
Stagecoach to improve bus availabilities. A fundamental issue is the lack of maturity in the
supply chains, with some parts taking a number of weeks to be delivered. This has been
critical for the fuel cell components of the buses, but also important for conventional parts.
The partners have recently agreed that a wider store of Van Hool / Ballard parts will be
stored onsite at a local parts store in Dyce which the technicians can access same day. A
container with conventional spare parts for both operators to access is kept at the Tullos
depot.
The support from the bus and component suppliers was slow at the beginning of bus
operation. This has improved over time and, in particular, since the onsite technician began
work. More rapid communication between all parties involved in the issue and resolution of
the issue has helped to ensure issues are more quickly resolved. However, it remains the
case with this relatively novel technology that the time take to diagnosing and fully resolve
issues takes a significant period of time. These issues are likely to be improved as bus
manufacturers, component suppliers and maintenance technicians have more experience
which they can bring to solving issues and to design improvements. The bus operators in
this project have also noted that timescales for resolving issues would be improved if they
had a direct relationship with the bus supplier, i.e. if they were the owners of the buses rather
than the Aberdeen City Council.
A key area of learning also relates to fault information, which does not get stored by the
buses. This means that all of the actors are keeping their own separate information
regarding bus issues which do not always match up. To tackle this the project team are
implementing a new online system, which will be accessible to Aberdeen City Council, Van
Hool, Stagecoach and First Group. For future bus deployments it would be sensible to
include fault information logging on the buses as standard.
3.4 HRS Performance
3.4.1 Dispensing rate
The success criteria for this as originally designed was based on the maximum continuous
rate of 120g/s (at 350 bar). However, this rate is a maximum flow rate allowed by the
components, and the average flow rate over a complete filling is likely to be less than this.
The average flow rate affects the length of time it takes to refill the buses, and is important
in bringing the technology performance close to conventional technology, to minimise costs
to the operator. The average dispensing rate achieved in the project is around 40g/second.
BOC have investigated the reasons for this, and believe that the restriction is due to the
orifice in the bus. The dispenser can achieve rates up to 120g/s, but this leads to choked
flow within the bus and a build-up of pressure on the dispenser side which quickly reaches
a cut out point at 380 bar, even when the pressure inside the bus tank is only 50 bar. This
resulted in many partial fills during the commissioning phase, and as such BOC had to
reduce the flow rate to ensure the flow is at a level that the bus orifice can accept.

14
Diesel buses typically take 5-10 minutes to refuel10, depending on the size of the tank. In
typical operations most bus operators tend to refuel the bus whilst the bus is being cleaned
at the end of each duty cycle, and so the key thing is to ensure that both these processes
are optimised and that one does not take significantly longer than another. In November
2015, which had relatively high bus availability and high bus fuel consumption, the average
refuelling time for the hydrogen buses was 12 minutes, and typically, each bus refuels every
other day (in November 2015, on average, the buses refuel on 56% of days). For future
projects, if refuelling facilities are sited at the depot and therefore buses refuel every day, a
12-minute refuelling every two days delivers a similar amount of hydrogen to a c. 7-minute
refuelling each day. A c. 7-minute refuelling each day may be acceptable to the bus
operator, depending on their cleaning timings. Stagecoach have indicated that their
conventional buses take c. 8 minutes to be refuelled, and so if the refuelling was in the depot
and designed to fit in with normal process, a 7-minute refuelling for the hydrogen buses
would be acceptable.
3.4.2 Refuelling capacity
The project success criterion is a refuelling capacity of 300kg/day “maximum”, and the
electrolyser and refuelling station were designed such that this quantity could be produced
and dispensed each day. In reality, daily demand has most frequently been between 125-
225 kg/day (see Figure 7 below), well below the maximum capacity. However, the refuelling
station has met demands up to and above the 300 kg level, and in March 2016, 313 kg was
dispensed in a single day. Judged against the success criterion and the demands of the
buses so far, the refuelling station is meeting the success criterion.
Figure 7 Histogram showing the daily hydrogen dispensed between July 2015 - June 2016
3.4.3 Refuelling window
The original project success criteria was that all 10 buses would be able to refuel from empty
within a four-hour window. However, this was never tested as the actual operational profile
agreed was that the 4 First Group buses would refuel in a 2-hour slot early in the morning,
and the 6 Stagecoach buses would refuel in the a 4-hour slot in the late evening. The
refuelling station has, except for the periods of downtime discussed under availability below,
10 http://www.civitas.eu/sites/default/files/civitas_policy_note_clean_buses_for_your_city.pdf
15
always been able to meet the operating profile, and has therefore been able to meet a
revised project success criteria.
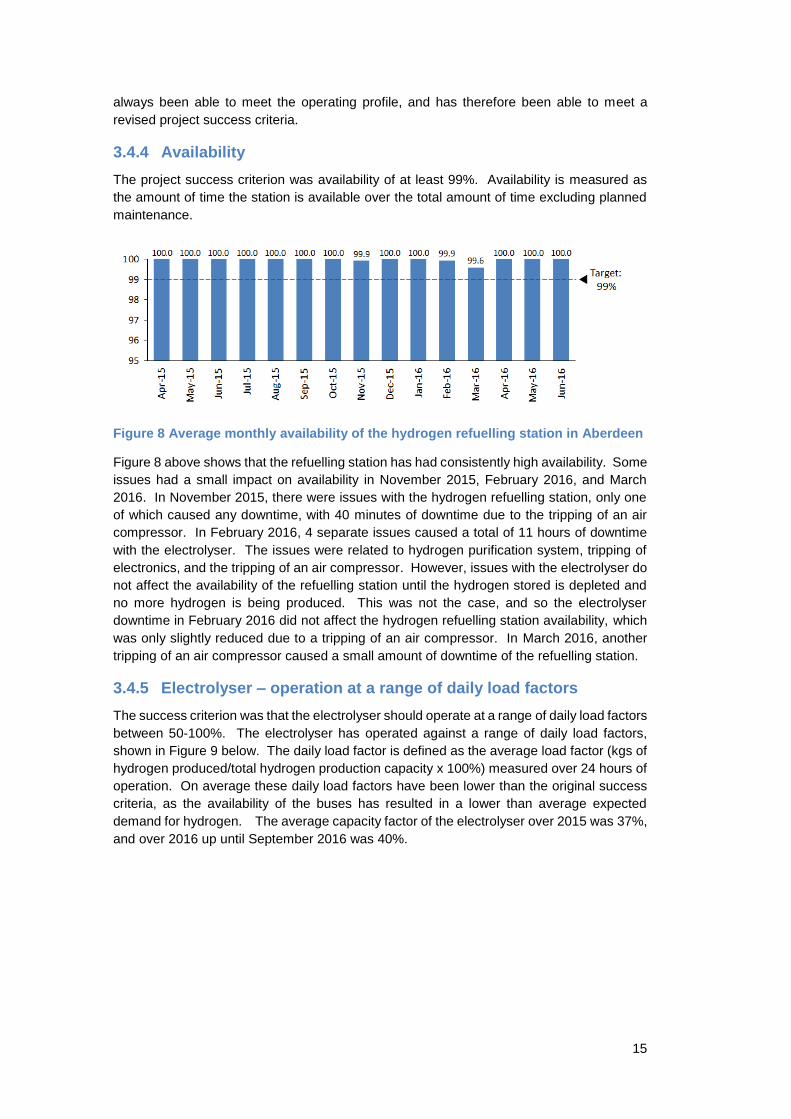
3.4.4 Availability
The project success criterion was availability of at least 99%. Availability is measured as
the amount of time the station is available over the total amount of time excluding planned
maintenance.
Figure 8 Average monthly availability of the hydrogen refuelling station in Aberdeen
Figure 8 above shows that the refuelling station has had consistently high availability. Some
issues had a small impact on availability in November 2015, February 2016, and March
2016. In November 2015, there were issues with the hydrogen refuelling station, only one
of which caused any downtime, with 40 minutes of downtime due to the tripping of an air
compressor. In February 2016, 4 separate issues caused a total of 11 hours of downtime
with the electrolyser. The issues were related to hydrogen purification system, tripping of
electronics, and the tripping of an air compressor. However, issues with the electrolyser do
not affect the availability of the refuelling station until the hydrogen stored is depleted and
no more hydrogen is being produced. This was not the case, and so the electrolyser
downtime in February 2016 did not affect the hydrogen refuelling station availability, which
was only slightly reduced due to a tripping of an air compressor. In March 2016, another
tripping of an air compressor caused a small amount of downtime of the refuelling station.
3.4.5 Electrolyser – operation at a range of daily load factors
The success criterion was that the electrolyser should operate at a range of daily load factors
between 50-100%. The electrolyser has operated against a range of daily load factors,
shown in Figure 9 below. The daily load factor is defined as the average load factor (kgs of
hydrogen produced/total hydrogen production capacity x 100%) measured over 24 hours of
operation. On average these daily load factors have been lower than the original success
criteria, as the availability of the buses has resulted in a lower than average expected
demand for hydrogen. The average capacity factor of the electrolyser over 2015 was 37%,
and over 2016 up until September 2016 was 40%.

16
Figure 9 Histogram showing the daily load factors of the electrolyser, July 2015 - June 2016
3.4.6 Electrolyser – hydrogen purity
The hydrogen purity specification given by BOC and based on the Hydrogenics specification is well within the SAE 2719 specifications:
Chemical constituent SAE 2719 specification Hydrogenics specification
H2 >99.97% >=99.999%
O2 < 5 ppm < 2 ppm
N2 < 100 ppm < 2 ppm
CO2 < 2 ppm < 70 ppb
CO < 0.2 ppm
However, the hydrogen purity of the hydrogen produced has not been tested as part of the
project. It is important to note here though that there have been no issues with the fuel cells
of the buses due to impure fuel, and so the hydrogen refuelling station is performing well
against this criterion.
3.4.7 Electrolyser – hydrogen production meets expected demand
The original success criterion was that hydrogen production would always meet expected
demand, which was expected to be 250kg/day based on mileage estimates by the operators
and high (95%) bus availability.
When the detailed algorithms controlling the system were designed, the priority was that the
system would always ensure that there would be hydrogen to refuel buses. Therefore, the
amount of hydrogen which is in the storage system is monitored, and if it goes below a pre-
defined lower level, the system switches to maximum hydrogen production. This production
is stopped when the amount of hydrogen in storage reaches a pre-defined upper level. The
only other impact on hydrogen production was from the trials conducted by SSEN. SSEN

17
had the ability to change the load factor on the electrolyser to simulate a variety of scenarios,
which involved varying the electrical input due to network capacity, intermittent renewable
generation, or time of use pricing, and varying the potential output such as adding in a gas
supply injection. During the trials, SSEN could control the electrolyser only up until the lower
level of storage was reached, at which point the BOC control system would take over and
the trial would be halted. Therefore, the system was designed to ensure that hydrogen
production met expected demand.
Aside from the short periods where there was unscheduled downtime, or when SSEN trials
were being undertaken, production always met expected demand, and hence the system
met the target.
3.4.8 Efficiency of electrolyser system
The project success criterion was that the efficiency of the electrolyser system should be
>58%. However, the technology chosen was the Hydrogenics HyStat electrolyser system,
which states a specific power consumption of 5.2 kWh/Nm3 at full capacity, which is
equivalent to 57.7% efficiency. Therefore the initial project success criterion could not be
met.
There have been problems with the data for the efficiency indicator, as in 2015 faulty
readings were collected by the partner responsible for analysing the raw data. Some
readings which were taken showed efficiency of <30% of >100%, which are likely to be
incorrect. Efficiency, in percentage terms, is calculated by taking the lower calorific heating
value of hydrogen (33.3 kWh/kg) and dividing by the kWh consumed by the electrolyser in
order to produce a kg of hydrogen. It appears that the hydrogen produced readings are
faulty, and Hydrogenics, the equipment supplier, are working to understand the cause of
this issue. The Hydrogenics HyStat electrolyser product range have been on the market for
many years and have been deployed at multiple refuelling stations across Europe (e.g.
Argau, Oslo and Bolzano bus refuelling stations have at least one HyStat 60 installed). Their
ability to produce hydrogen with an efficiency higher than 50% is proven.
In 2015, hydrogen production efficiency was not derived from measured data. Instead, an
assumed average power consumption per kilogram hydrogen produced was applied,
ranging from 60.1 to 60.3 kWh/kg (depending on the month). This corresponds to about 55%
efficiency.
Efficiency data for 2016 is being calculated on the basis of the amount of hydrogen produced
as determined by the computer and software that runs the electrolyser, and the amount of
power consumed.
3.4.9 Response time of electrolyser system
The original project success criterion was a response time of less than 5 seconds. The
response time is defined as the time taken for the electrolyser to begin to respond to an
instruction to change the load factor, rather than the time taken to complete the change (the
ramp rate). Both of these factors are important in order for electrolysers to take an active
role in energy management, by being directly connected to an intermittent renewable
source, or by participating in the balancing market.
As part of their trials, SSEN analysed the response time of the electrolyser, and found that
the electrolyser responds to such instructions on timescales on the order of several

18
seconds11. The measuring time step for their trials was 10 seconds, and they found that the
electrolyser could not only begin to react to new instructions in this time, but could also
compete the change, i.e. reach the target load factor. The report concludes that based on
this evidence, electrolysers show good potential to operate within networks by responding
rapidly to adsorb excess power, and to meet the requirements of most balancing markets
(see Section 4.3 for an estimation of potential revenues available from providing grid
balancing services to National Grid).
3.4.10 System production efficiency
As well as the electrolyser, other components of the hydrogen refuelling station use
electricity. It is important that the full electricity costs are taken into account when planning
projects, and that as far as possible these costs are minimised in order to reduce the cost
of hydrogen production.
The project success criteria is that the overall system production efficiency should be 52%
or greater. The system production includes both the electrolyser efficiency, where the data
is subject to errors as described above, and also the efficiency of the other parts of the
system, mainly compressors but also other components. The average specific power
consumption from the system components excluding the electrolyser is 7.5 kWh/kg, which
when taken together with the electrolyser efficiency equates to an overall system efficiency
of 48%. The specific power consumption is unusually high compared to other bus refuelling
stations in Europe potentially due to parasitic loads at the HRS site. Work is currently
underway to identify any parasitic loads at the facility which can then be excluded from the
HRS system production efficiency.
3.4.11 Total hydrogen produced over 2 years
The project success criterion was that the hydrogen produced over 2 years would be more
than 100,000 kg. Based on the monthly figures shown in Figure 10 below, the project is well
on track to meet this criteria once two years of hydrogen production have occurred.
Figure 10 Graph showing the hydrogen dispensed each month
These figures are the hydrogen dispensed by the HRS each month, rather than the
hydrogen produced figures. This is because there have been some issues with the
measurement of hydrogen produced from the electrolysers. Hydrogen produced can be
11 Impact of Electrolysers on the Distribution Network, Research Report, SSEN and the University of Strathclyde, 2016.

19
calculated based on measurements of voltage and current from the electrolyser, but there
were no measured figures of electrical consumption or flow meters for the hydrogen
produced. Whilst the electrolyser does show electrical consumption there is no data logging
on the panel. For future projects, energy meters/data loggers should be added to each
switch on the distribution/switch panel. These could be independent to the computer on the
electrolyser, or could be wired to supply the data to the computer. It would also be helpful to
have flow metering after the electrolysers.
3.5 Technical summary
Whilst there have been technical issues with the buses which have affected availability,
overall the performance of the fuel cell buses has been good. Following the initial teething
phase, the mileage and number of refuelling events is now meeting the project success
criteria. The fuel consumption is very close to the target success criteria, and measures are
being taken to further improve the fuel consumption.
The issues affecting availability should not be underestimated, as delays in accessing parts
or specialist knowledge of the component manufacturers have caused availability to be
below the target, as well as frustrations for the bus operators and maintenance staff. These
issues, on the whole, relate to immature supply chains and the project partners and bus
supplier have taken steps to remedy the issues. For future projects, and to accelerate the
commercialisation of the sector, it will be important to ensure that supply chains for parts
and clear, and timescales for replacing or repairing components are consistent with usual
operations. A direct relationship between the bus operator and bus supplier will help to
accelerate timescales for repairs.
The performance of the refuelling station has been excellent, with availability at >99.9% it
exceeds the stringent availability target of 98%.
Owing to the successful operational period under the Innovate UK project the demonstration
partners have will continue the operating the fuel cell buses for at least a further two years
after the UKRHH project ends.
3.6 Comparison with other European deployments
To date, there have been three generations of EU-funded fuel cell bus projects. The CHIC
project (2010-2016) has seen the deployment of 54 fuel cell buses in 9 cities across Europe
and Canada. The CHIC project builds on two previous projects (CUTE and HyFLEET
CUTE), which have seen the technology progress beyond pure demonstration and to move
towards regular public transport operation.
The CHIC project introduced next generation fuel cell buses with key technical
improvements over older models:
• Hybridisation of the fuel cell drivetrain, with the integration of batteries/super capacitors
allowing the bus to buffer peak loads, boost acceleration and allow energy recovery from
braking.
• Hybrid systems enable smaller and cheaper fuel cell systems, offering extended
lifetimes and better fuel efficiency, leading to the use of fewer storage tanks while
maintaining the range.
In the CHIC project, for the first time, operators could plan to have fuel cell buses provide
daily transit services that usually have been provided by a diesel or a Compressed Natural
Gas (CNG) bus. However, as is the case for all innovative technologies, one cannot expect
a fuel cell bus to be 100% reliable on day one. All CHIC cities faced a teething period where

20
bus availability was lower than expected due to component failures and long spare parts
delivery times.
Figure 11 Evolution of the availability of fuel cell buses in the CHIC project12
These teething periods are caused by unfamiliarity of the vehicles to maintenance staff and
issues with the build quality of vehicles coming out of the factory and the fact that the supply
chain was still immature. For the CHIC project, an availability upgrade programme was
implemented in 2014 with positive results: the availability in some cities exceeded 80%.
The bus operators involved in the CHIC project are agreed that there is no technological
reason why fuel cell buses cannot meet the level of availability expected for diesel buses.
Availability issues have primarily been caused by immature spare part supply chains,
lengthy problem diagnoses, and a scarcity of trained maintenance technicians available on-
site to carry out repairs. These issues are common even with more mature low emission
technologies (e.g. diesel hybrid buses) and will be resolved with increased scale in the
supply chain. Therefore, there is no obvious technical issue preventing a move to the next
stage of larger scale commercialization of the technology.
The issues with availability of the Aberdeen buses discussed in Section 3.3.4 above are very
like those experienced by the CHIC cities. This demonstrates that the immaturity of the
sector, which results in slow supply chains, and a short supply of experts in the area, needs
to be improved to further improve the availability of the buses. The current and next
generation of fuel cell bus projects will benefit from the improvements in expertise and
supply chains already made within the CHIC and Aberdeen projects, where the increased
scale in the supply chain will reduce waiting times for parts and ensure more trained
specialists are available to diagnose and fix problems. These improvements to create a
more mature and robust supply chain will be an essential part of commercialising the
technology.
In general, the availability figures for the Aberdeen project are comparable with availability
of other new low emission bus technologies. Bus operators do not measure availability
routinely, but expect very high levels, c. 95%. Data for the availability of diesel-electric
hybrids appears to vary dramatically, from 70%-95% reported13. This highlights that the fuel
cell bus technology is performing very well for such a new technology, showing similar
availability levels to diesel-hybrids which are powered by familiar diesel engines.
12 From public summary of “Report of Bus Operation – CHIC project” November 2016 13 – Clean Buses – Experiences with Fuel and Technology Options 2014
21
The availability of the refueling station in Aberdeen shows an improvement over the previous
demonstration projects – the Aberdeen refueling station had an availability above 99.9% up
until July 2016, whereas the CHIC average for all stations was 97%,14 which was a large
improvement over previous projects. The utilization of the station, at just under 40% in 2015,
is significantly higher than for most of the refueling stations in the CHIC project which were
designed with overcapacity due to a conservative estimate of daily fuel consumption and
high levels of equipment redundancy. This demonstrates that high availability levels can be
achieved under more demanding loads than have previously been demonstrated. The
improved availability and higher rate of utilization of this station under is a significant step
forwards for the hydrogen transport sector, as the market uptake of fuel cell cars will depend
on fleet managers and private buyers having high confidence that refueling stations will be
as reliable as conventional petrol and diesel refueling stations. The next challenge for
infrastructure providers will be to work to provide similar levels of reliability, with higher loads,
and with a focus on reducing costs.
14 One station CHIC did achieve overall availability of >99.8%.

22
4 Bus and HRS economic assessment
An economic assessment of the bus project has been developed to illustrate the true
ownership cost of all equipment deployed or modified for the project. Estimates have been
made to target ownership cost reductions in future, as efforts are made to drive fuel cell bus
technology towards commercialisation.
4.1 Methodology and assumptions
The economic assessment described in this section involves a total cost of ownership (TCO)
analysis using real-world costs derived from supply contracts between project partners.15
This analysis captures all costs for owning and operating a fuel cell bus as well as the
required hydrogen refuelling station and maintenance facilities. In the Aberdeen Hydrogen
Bus Project, the buses and infrastructure are owned by different parties (see Figure 12).
However, in future bus operators are expected own and operate all equipment including
infrastructure, as is the case for commercial operation of diesel bus fleets today.
Figure 12 Ownership arrangement for Aberdeen Hydrogen Bus Project
The financial information extracted from project contracts include a variety of different costs
including single upfront capital costs, annual fixed costs and variable operating costs (Figure
13). In order to create a representative and robust comparison between owning a diesel and
fuel cell bus, costs have been aggregated to create an annual TCO for both bus types over
a 12-year lifetime. Currently fuel cell technology has a shorter lifetime than diesel
technology. As a result, costs for two fuel cell stack replacements have been included in the
TCO for the fuel cell bus to reflect accurately the current technology status.
15 TCO inputs contain proprietary data to project partners and therefore cannot be stated in the final report but have been approved by all relevant partners

23
Figure 13 Overview of different components included in TCO
4.2 Current economics of overall bus project
The baseline analysis represents real-world costs from the start of the project in 2013. Fuel
cell bus technology has improved significantly both technically and economically making
these costs out-of-date, however, the purpose of this analysis is to accurately illustrate the
TCO in 2013 to establish a benchmark for comparing against current costs and future
targets.
The TCO for owning and operating a fuel cell bus with supporting infrastructure in 2013 is
£267,000 per year per bus for a 12-year operational lifetime (including stack replacements).
For comparison, owning and operating a diesel bus costs £107,000 per year per bus
therefore an annual premium of £160,000 is required to operate the fuel cell bus over the
incumbent technology (see Figure 14).

24
Figure 14 Total Cost of Ownership per bus with 2013 costs (£/year per bus)
High bus capital costs represent a significant proportion (35%) of the TCO and are almost
eight times greater than for the equivalent diesel vehicle. Furthermore, owning and operating
the hydrogen refuelling infrastructure, excluding fuel costs, represents 16% of the TCO.
Hydrogen fuel costs represent a further 16%, almost 65% greater than fuel costs for a diesel
bus.
The hydrogen refuelling station has been designed to dispense up to 300kg/day allowing
the buses to be tested on long distance routes (> 240km/day) and to account for redundancy
(two ionic compressors), which impacts HRS capex. Redundancy provision is expected to
affect overall capex to a lesser extent for future HRS designs once large-scale refuelling.
4.3 Benefits of grid balancing
Increasing penetration of intermittent renewable generation on the UK grid marks positive
change towards decarbonising the electricity network but complicates the balancing act of
managing supply and demand. Electrolysers are capable of being operated as flexible loads
which can help balance the grid and benefit a number of different stakeholders, including:
• Distribution network operators by providing grid balancing services to minimise
network reinforcement needs, and support supply and demand management,
• Renewable developers by connecting via private wire to avoid or reduce grid
connection costs and/or reduce curtailment,
• Bus operators by introducing new revenue streams to reduce net fuel costs whilst
maintaining a reliable fuel supply.
A key objective of the UKRHH project was to test and evaluate the electrolyser’s technical
ability to act as a flexible load. During the project, SSEN conducted an extensive series of
trials to simulate different power supply environments.
National Grid, the UK’s transmission system operator, has a variety of different grid
balancing services designed for ‘flexible loads’ (see Table 1). The services are tailored for

25
different network issues and suit flexible loads with a range of characteristics. Operators are
paid for providing capacity and utilisation.
Service Type Characteristics
Frequency
control by
demand
management
Primary
• Must be ≥ 3 MW
• Demand must switch off in < 2s
• Load interruptions responding to occasional sudden
dips in frequency.
• Contracts usually won by long-established large loads.
Even for units which meet the minimum size, chances
of success may be increased by using an aggregator.
Firm
Frequency
Response
Primary
• Load or generator is controlled in a frequency sensitive
mode so power changes automatically in response to
changes in frequency.
• Market is dominated by generation.
• Contracts procured through a monthly tender,
participants bid and get a fee for being available and
for being called upon.
Enhanced
Frequency
Response
Primary
• Must be > 1 MW and have >95% availability.
• Both high and low response required (0-100% or 100-
0%) in < 1s.
• New frequency regulation service in response to a
gradual decrease in system inertia of the UK grid due
to loss of coal and increase of non-synchronous
renewables.
• Payment is expected to be on the basis of availability
and quality of asset performance.
Demand
Turn-up Secondary
• Must be > 1 MW.
• Must achieve 0-100% in < 5 min.
• New service to reduce spending on curtailing wind and
solar generation.
• Trials between May 2016 and Sept 2016, expected to
be included in competitive tenders in 2017, depending
on the outcome of the initial trial.
Fast Reserve Secondary
• Must be ≥ 50 MW but can be aggregated.
• Must achieve 100-0% in 2 min.
• Long established service, dominated by generators but
also open to loads.
Table 1 Relevant grid balancing services offered by National Grid
In March 2016, National Grid awarded contracts for two new services, Enhanced Frequency
Response (EFR) and Demand Turn Up (DTU), to cope specifically with increased grid
connected renewable capacity in the UK. Rapid response electrolysers are well suited to
provide both EFR and DTU services and entering into contracts with National Grid for these
services would unlock new revenue streams for electrolyser owners, e.g. future bus
operators and/or infrastructure operators.
The benefits of providing grid balancing services have been quantified and discussed in the
next section, which involves a detailed sensitivity analysis of the TCO.

26
4.4 Sensitivity analysis
Figure 14 reflects the true costs of the Aberdeen Hydrogen Bus Project established in 2013.
However, a number of cost components have since been reduced to improve the overall
Total Cost of Ownership of a fuel cell bus today. The most notable cost improvements
include:
• Infrastructure capex and maintenance: design of the Aberdeen HRS involved
significant Non-Recurring Engineering (NRE) costs. Future costs are expected to
decrease once greater focus is placed on standardisation of design at larger scale
and with reduced redundancy. Furthermore, maximising equipment utilisation will
further reduce the capex contribution to the overall TCO.
• Bus capex and maintenance: significant cost reduction opportunities are being
evaluated in a number of multi-stakeholder commercialisation activities involving
joint procurement activities between clusters of bus operators to benefit from a
degree of standardisation and economies of scale.16
• Fuel costs: opportunities exist to achieve lower net electricity costs through price
optimisation strategies to avoid high cost distribution and transmission network
charges, and by accessing hour-hourly electricity spot prices. Electrolyser efficiency
reductions would further reduce fuel costs.
• Grid balancing revenues: the UK, with high renewable generation and poor
interconnection with its neighbours, has a mature grid balancing market (as
discussed in Section 4.3). Rapid response electrolysers could provide services to
the grid and local distribution networks to unlock new revenue streams to further
reduce overall financial impact of fuel costs.
The table below describes 2016 estimates of the main parameters governing the three main
cost components of the TCO.
Opportunity 2016 value Description
HRS
costs
Infrastructure
capex
£1,132,000 (per
MW electrolyser)
Reduced compressor redundancy, and
lower dispenser costs through
innovation and economies of scale.
Electrolyser
capex £800,000/MW17
Reduced part count, and lower cost
materials and methods of manufacture.
Equipment
utilisation 85%
From 60% to 85% utilisation by
enabling public passenger cars to
refuel.
Bus
costs
Bus capex £520,000/bus18 Innovation in manufacturing and
economies of scale resulting from
orders of many tens of buses. Stack capex £64,000/bus
16 3EMotion will deploy 23 fuel cell buses manufactured by Van Hool across Europe. JIVE will coordinate a large joint procurement of 142 fuel cell buses across nine European cities. 17 FCH JU Water Electrolyser Study (2014) 18 Current cost estimates for larger bus orders

27
Net
fuel
costs
Net
electricity
cost
£0.09/kWh
Actively purchase electricity to avoid
high network charges and purchase
electricity actively to benefit from
variations in spot price.
Electrolyser
system
efficiency
55.0 kWh/kg
Enhance electrolyser performance by
minimising load with smart control
auxiliaries and by enabling lower
current density.
National grid
balancing
services
£30,000/year
/MW19
Demand Turn Up (DTU) service outline
document NG, £1.5/MW/hr availability,
£60/MWh utilisation, 25% utilisation
Local grid
balancing
services
To be
investigated
Opportunities exist to provide services
to distribution network operators but
economics need to be further explored.
Table 2 Overview of opportunities to improve overall fuel cell bus TCO
Estimates set out in Table 2 have been individually introduced to the TCO to illustrate the
impact of each improvement, represented by a tornado diagram (see Figure 15).
Figure 15 Tornado chart illustrating a sensitivity analysis of the TCO
As outlined in Section 4.2, real-world 2013 costs give a £160,000 per year premium to own
and operate a fuel cell bus compared to an incumbent diesel vehicle (150%), where bus
capital costs are the largest cost component.
19 Element Energy analysis based on National Grid’s Heads of Terms for DTU service.

28
Sensitivity analysis shows technical and commercial improvements that have been achieved
by industry over the last three years to reach a £62,000 per year premium (58%) in 2016
making fuel cell bus technology more competitive with the incumbent diesel bus.
Reducing the bus capital cost to €650,000 per bus through innovation and incentivising joint
procurement activities (which is currently underway with a pan-European consortium) will
make the most significant impact to the overall TCO, indicating £237k/year to run and
operate an FC bus (11% reduction with respect to the baseline costs).
Whilst there is uncertainty around technical capability, accessing new revenues from
transmission and distribution network operators by using the electrolyser to provide grid
balancing services could also significantly improve the overall TCO.
The 58% premium on the incumbent diesel technology is achievable today and has is
sufficient to attract UK public transport operators with environmental issues to consider
larger vehicle procurement (e.g. 20-50 buses) in order to deploy a zero emission fleet.
4.5 Future targets
Previous sections have quantified fuel cell TCO with historic costs (from 2013) and current
state-of-the-art costs (from 2016). As discussed, significant progress has been made by the
public and private sector to drive fuel cell bus technology towards commercialisation but
further improvements are needed. In this section, we outline a series of cost reduction and
technology improvement targets based on industry consultation and literature trends. Table
3 below sets out realistic targets for 2020 and the mid-2020s.
Opportunity 2016 value 2020 Mid-2020s
HRS costs
Infrastructure capex £1,132,000 (per MW electrolyser)
£850,000 (per MW electrolyser)
£565,000 (per MW electrolyser)
Electrolyser capex £800,000/MW £680,000/MW £480,000/MW
Equipment utilisation
85% 90% 95%
Bus costs
Bus capex £520,000/bus £360,000/bus £272,000/bus
Stack capex £64,000/bus £56,000/bus £40,000/bus
Fuel costs
Net electricity cost £0.09/kWh £0.09/kWh £0.09/kWh
Electrolyser system efficiency
55.0 kWh/kg 52.0 kWh/kg 51.0 kWh/kg
National grid balancing services
£30,000/year /MW
£30,000/year /MW
£30,000/year /MW
Local grid balancing services
To be investigated
To be investigated
To be investigated

29
Table 3 Overview of targets in 2020 and mid-2020s to improve fuel cell bus TCO
Targets set out in Table 3 have been combined to give an estimation of the TCO in 2020
and the mid-2020s (see Figure 16).
Figure 16 Tornado chart illustrating fuel cell bus TCO improvements with achievable future targets
By 2020, industry will need to further reduce fuel cell bus and infrastructure capital costs if
large-scale procurements are to be considered. If a target TCO premium of 5% by the mid-
2020s is to be achieved, ambitious industry objectives should aim to bring fuel cell bus capex
below <£300k per bus (70% reduction on 2013 costs), and reduce infrastructure capex by
65% - both are achievable. Furthermore, if technical performance improvements are
achieved and rapid response electrolysers become well established providers of grid
balancing services, negative net fuel costs could be achieved by 2020.
The mid-2020 targets achieve a moderate £6k/year per bus premium, which could attract
significant attention from bus operators in the UK.
4.6 Comparison with battery electric bus technology
There are two major technologies capable of providing zero tailpipe emission bus transport:
fuel cell and battery electric. Whilst battery electric bus deployments are higher around the
world (driven largely by currently cheaper technology), the technical advantages of fuel cell
buses (equivalent refuelling speeds and range to diesel buses) are well understood by bus
operators. As a result, procurement officers have often stated that if both technologies had
similar costs that bus operators would take preference of fuel cell technology.
We have assessed the fuel cell bus TCO in detail but it is important to understand how the
technology compares economically to battery electric solutions. To establish an accurate
comparison, we have sourced state-of-the-art costs and performance data.20 We have also
20 Battery electric bus data are sourced from industry consultation.

30
developed two battery electric scenarios to account for the reduced range and slower
recharging time for battery electric vehicles compared to fuel cell buses:
• Battery electric – additional buses: involves a fleet size of 13 regular battery electric
buses to facilitate the same operation as 10 fuel cell or diesel buses. The TCO
methodology in this analysis represents £/year/bus for a bus fleet size of 10,
therefore capital costs, maintenance and driver costs have been scaled to take
account of the additional three buses in the fleet.
• Battery electric – long range: includes vehicle with larger battery than installed in
conventional battery electric buses to ensure equivalent range to fuel cell
technology. Thereby increasing capital costs compared to a regular battery electric
bus.
Figure 17 Tornado chart comparing TCO for fuel cell and battery electric buses
Of the two scenarios, the long-range vehicle option has the lowest TCO showing a
£49k/year/bus premium compared to diesel technology today. However, a more fair
comparison is the option with additional buses to ensure identical bus operating conditions.
This scenario shows a £68k/year/bus premium compared to a diesel bus today.
Comparison of the battery electric and fuel cell bus TCOs reveals that the economics of the
two technologies can be very similar under the right conditions. Fuel cell bus and
infrastructure ownership with grid balancing revenues is £6k/year cheaper than the battery
electric option with three additional buses but remains £13k/year/bus higher than the battery
electric option with long-range buses.

31
5 Bus and HRS environmental assessment
5.1 Methodology and assumptions
The only tailpipe emissions from a hydrogen fuel cell bus is water vapour. However, the
emissions produced in processing or producing fuel, and delivering fuel (known as “well-to-
tank” emissions) must be considered. This type of well-to-wheel assessment is made here.
The emissions associated with the manufacture of the buses and the refuelling station
equipment (a full life cycle analysis) is out of scope of this work.
5.1.1 GHG emissions
The greenhouse gas emissions (primarily CO2, but also others) associated with hydrogen
production depend on the method of production. Much industrial hydrogen is currently
produced by steam methane reforming (SMR), and CO2 is emitted during this process. The
CO2 equivalent emissions associated with hydrogen produced by electrolysis are those
associated with the electricity production, so that electrolysis powered by renewable energy
or nuclear power are zero carbon, whereas electrolysis powered by the UK grid standard
mix, or by fossil fuel power stations, can have significant CO2 emissions associated with it.
At the Kittybrewster hydrogen refuelling station, Aberdeen City Council purchase electricity
from EDF (via the framework agreement for Scottish public sector bodies). Between March
2014 and October 2015 EdF provided “green” electricity21. In October 2015, the tariff
reverted to EdF’s usual mix, with emissions of 229 gCO2/kWh. In April 2016, the tariff
changed again to being 100% REGO backed22.
5.1.2 Local air pollution
Local air quality is an increasing important issue for people living in congested cities, causing
serious levels of ill health and illness. City administrations and national governments are
introducing policy measures to reduce air pollution in cities, such as Air Quality Management
Zones, Clean Air Zones23, and Low Emissions Zones.
Air pollution is primarily caused by the combustion of fossil fuels, for example, in power
generation, industrial processes, domestic heating and road vehicles. These can give rise
to a number of pollutants including nitrogen oxides (NOx) sulphur dioxide and particulate
matter (PM). On average transport is responsible for 80% of NOx emissions at the roadside
in areas where air quality concerns are high. The largest source of emissions in the areas
of greatest concern are diesel vehicles. This is due to both the significant growth in vehicle
numbers over the last ten years, and the emissions standards not delivering the expected
reductions under real world driving conditions when compared to laboratory testing, even
before the revelations over the use of so called ‘defeat devices.’24
Hydrogen fuel cell buses produce no tailpipe emissions other than water vapour, and so can
be a key part of the measures used to reduce NOx emissions. In this assessment, we can
estimate the NOx savings resulting from the 10 hydrogen fuel cell buses deployed in
21 Renewable Energy Levy Exemption certificates (exempt from the Climate Change Levy) were purchased for the electricity used. 22 REGO is the Renewable Energy Guarantees Origin, scheme, and is used to prove to the final customer than a given share of electricity was produced from renewable sources 23 https://www.gov.uk/government/publications/air-quality-in-the-uk-plan-to-reduce-nitrogen-dioxide-emissions 24 For example, Euro 6 diesel cars were found to emit up to 7 times more NOx than the standard threshold, source: http://www.theicct.org/real-world-exhaust-emissions-modern-diesel-cars

32
Aberdeen by comparing them to the standards for current Euro VI buses, i.e. assume that if
the hydrogen fuel cell buses had not been deployed the operators would be deploying Euro
VI standard buses in their place. This gives a lower bound on the potential NOx savings, as
it may be that lower standard buses would have been operating instead.
Emissions standard
gNOx/km
Euro II 12.452
Euro III 11.284
Euro IV 6.773
Euro V EGR
4.044
Euro V SCR
9.431
Euro VI 0.800
Table 4 NOx emissions per km from the European standards, at 20 km/hour25
The current European air quality standard for particulate matter relates to PM10 and as a
consequence the monitoring of airborne particulate matter in European urban areas is
mainly based on the PM10 particle fraction. Road transport corresponded to 19% of PM10
emissions for the entire United Kingdom, but in cities can be significantly higher, and is
estimated as being up to 80% in London26. Particulate emissions from transport include
contributions from exhaust emissions (both fuel and lubricating oil combustion), emissions
from abrasion processes (tyre wear emissions, brake linings, catalyst deterioration etc.) and
road dust resuspension induced by the vehicle-generated turbulence.
We have also considered the potential for PM10 savings from the project, however these
are likely to be minimal and so are not reported. In a study27 commissioned by Aberdeen
City Council that aimed to identify measures which could improve air quality in Aberdeen
City Centre, it was concluded that the current Euro VI regulations reduced PM10 emissions
as far as possible from fuel sources, and replacing Euro VI diesel buses with hydrogen
buses would have no impact on PM10 levels, as the emissions from abrasion processes
and road dust resuspension persist.
5.1.3 Results - GHG emissions
The Euro standards for heavy goods vehicles relate to air pollution rather than greenhouse
gas emissions, and therefore there is no Euro VI standard for CO2 emissions for buses.
Instead, CO2 emissions from the project were compared to the CO2 emissions of an average
diesel buses, emitting 1220gCO2/km28.
Figure 18 shows the impact of the source of electricity on the project CO2 emissions. In the
period between October 2015 and March 2016, when EdF’s standard grid electricity mix
applied, the project emissions were c. 65 tCO2 per month, reducing the total emissions
saved as shown by the dip in the orange line in Figure 18. Indeed, if grid electricity is used
to generate hydrogen by electrolysis, the per km emissions of a hydrogen bus are greater
than the existing diesel fleet. If 10 diesel buses had replaced the 10 hydrogen fuel cell buses
25 http://naei.defra.gov.uk/data/ef-transport 26 UK emissions of air pollutants 1970 to 2001, Report www.naei.org.uk/reports.php 27 Aberdeen City Centre: Low Emission Study, AECOM for Aberdeen City Council, 2015 28 Commercialisation Strategy for Fuel Cell Buses in Europe, A Study for the Fuel Cells and Hydrogen Joint Undertaking by Roland Berger, 2015

33
in the six-month period where grid electricity was used, the CO2 emissions would have been
lower (320 tCO2 as opposed to 390 tCO2). This highlights the importance of the CO2 footprint
of the electricity used to produce hydrogen.
Figure 18 Graph to show CO2 emissions saved each month (blue line) and cumulatively (orange line)
5.1.4 Results - local air emissions
Figure 19 below shows the NOx savings achieved because of the project, estimated from
the NOx emissions shown in Table 4. We can use the modelling in a 2015 study27 for
Aberdeen City Council to give context to the NOx savings from the hydrogen buses.
The study concluded that increasing the Aberdeen fleet of hydrogen buses to replace the
oldest 10% of buses currently in service would result in a 4% NOx reduction in key City
Centre locations. It should be noted that the 2015 study does not account for the recent
scandal involving diesel passenger vehicles equipped with defeat devices.29 Furthermore,
studies monitoring demonstrations of EURO VI buses have found the vehicles to perform
consistently with NOx emission expectations even at low speeds.30 The impact of these
findings means that NOx emissions in the 2015 study are likely to have been underestimated
for diesel passenger vehicles and accurate for buses. Therefore, a 4% reduction in total
NOx emissions by replacing 10% of the oldest buses should be considered as an upper
bound estimate.
29 ICCT, In-use emissions testing of light-duty diesel vehicles in the U.S., 2014 30 TfL, In-service emissions performance of Euro 6/VI vehicles, 2015; ICCT, Comparison of real-world off-cycle NOx emissions control in Euro IV, V, and VI, 2015
-50
0
50
100
150
200
250
t C
O2
sav
ed
Project CO2 saved (t) Cumulative project CO2 saved (t)

34
Figure 19 NOx emissions saved each month (blue) and cumulatively (orange) compared to the Euro VI standard

35
6 Conclusions
The UKRHH consortium have successfully demonstrated the potential for fuel cell electric
bus technology to provide a zero tailpipe emission, like-for-like technical replacement to
diesel buses, i.e. equivalent driving range and refuelling time. Furthermore, the consortium,
through innovative research, have demonstrated the capability for electrolyser systems to
act as flexible loads that could provide benefits to constrained electricity distribution
networks.
From a technical perspective, targets have been set to further improve fuel cell bus
availability (>90%) and fuel consumption (<9kg/100km) in the next generation of
demonstration activities. The latest pan-European joint procurement initiative aims to
significantly reduce bus and infrastructure costs (<€650,000 per bus, <€9/kg-H2) to bridge
the gap to full commercialisation.31
The UKRHH project is part of a large portfolio of hydrogen transport related projects
currently underway or in development in Aberdeen. As a result, whilst the UKRHH project
ends in February 2017, Stagecoach and First Group will continue to operate the fuel cell
buses until at least 2019 and in 2017 BOC will upgrade the refuelling facility to enable 700
bar hydrogen dispensing for passenger vehicles. Furthermore, the success of this
demonstration activity has proven the benefits of the technology to Aberdeen City Council
and has motivated the Council to introduce 10 more fuel cell buses in 2019.
31 https://fuelcellsworks.com/news/launch-of-european-collaborative-project-jive-to-deliver-zero-emission-fuel-cell-buses-across-eur/