innovating today for tomorrow’s mail gary reblin · case study: us census bureau as a result, the...
TRANSCRIPT

1
INNOVATING TODAY FOR TOMORROW’S MAIL
Gary Reblin Vice President, Product Innovation
United States Postal Service

2
THE WORLD IS CHANGING
Our increasingly digital and mobile-first world is driving huge growth in the digital advertising market.
$90.39
$107.30
$125.75
$142.23
$156.43
$170.48
43.6%
48.6%
53.3%56.8%
59.6%62.1%
25.00%
35.00%
45.00%
55.00%
65.00%
75.00%
$0.00
$20.00
$40.00
$60.00
$80.00
$100.00
$120.00
$140.00
$160.00
$180.00
2017 2018 2019 2020 2021 2022
US Digital Ad Spending, 2017-20221
Billions ($)
Digital Ad Spending % of Total Media Ad Spending

3
COMPETITIVE DIGITAL LANDSCAPE
Mobile – occupying 66% of users digital media time2 – is driving the expansion of digital ads and is generating competition.
Digital ad platforms:
4
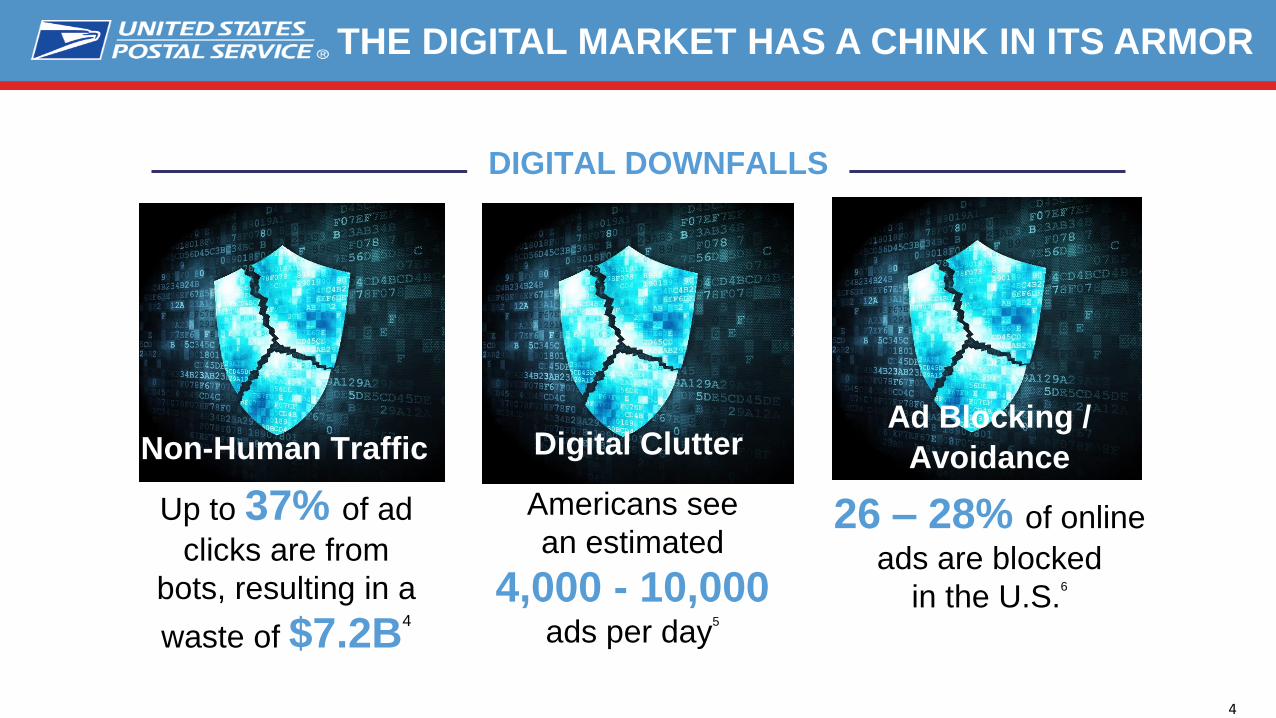
THE DIGITAL MARKET HAS A CHINK IN ITS ARMOR
Digital ClutterAd Blocking /
Avoidance
Up to 37% of ad
clicks are from
bots, resulting in a
waste of $7.2B4
Americans see
an estimated
4,000 - 10,000ads per day
5
26 – 28% of online
ads are blocked
in the U.S.6
DIGITAL DOWNFALLS
Non-Human Traffic Digital ClutterAd Blocking /
Avoidance

5
USPS STRATEGY PART 1: HARDCOPY MAIL
Image
PaperDigital
Engagement
6
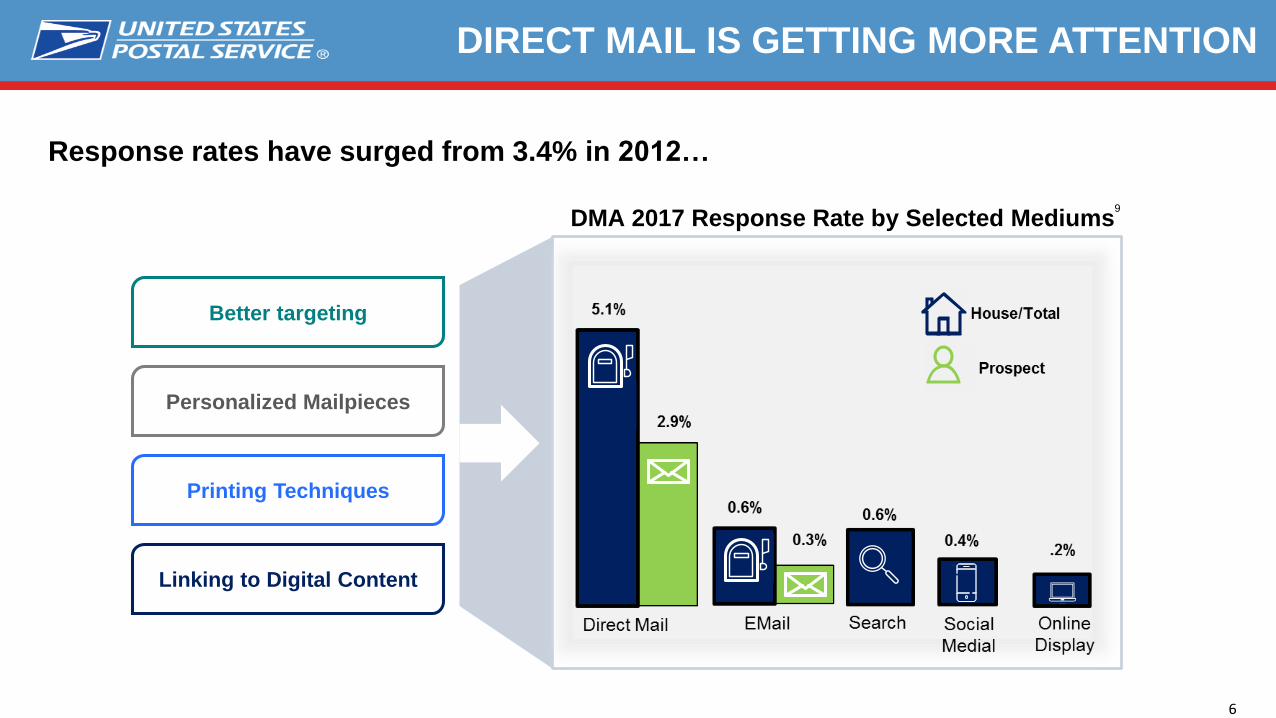
DIRECT MAIL IS GETTING MORE ATTENTION
Response rates have surged from 3.4% in 2012…
Better targeting
Personalized Mailpieces
Printing Techniques
Linking to Digital Content
DMA 2017 Response Rate by Selected Mediums9

7
MAIL CONTINUES TO EVOLVE
New technologies are enabling better engagement.
CREATING ENGAGING MAILPIECES
INKS SCENT TEXTURE FORMATS VIDEONFCAUGMENTED
REALITY
DRIVING A RESPONSE
SMS TEXTTYPED URLs
VOICEQR CODES

8
BARCODE USAGE CONTINUES TO RISE
QR CODES
56.7
63.868.6
72.074.7
30.8%
32.7%
33.7%34.2%
34.8%
30.00%
31.00%
32.00%
33.00%
34.00%
35.00%
36.00%
37.00%
38.00%
39.00%
40.00%
0
10
20
30
40
50
60
70
80
2016 2017 2018 2019 2020
Adult Smartphone Barcode ScannersUS, 2016-2020
Millions % of Smartphone Users
Source: eMarketer, April 2018.Note: ages 18+, smartphone users who scan a barcode or QR code at least once during calendar year. Includes in-store, print publication, or features like Snapchat’s Snapcode, Instagram’s Nametags, and Amazon SmileCodes.

9
INCREASING RESPONSE THROUGH MULTIPLE CHANNELS
USPS is exploring the impact of multiple calls to actions and multiple channels on response rates.
Baseline
53% Lift
58% Lift
70% Lift
Typed
URLs
SMS
Text
QR
Codes
Voice

10
FIRST-CLASS MAIL®
First-Class Mail also delivers results

11
FIRST-CLASS MAIL HITS HARDER THAN DIGITAL
How consumers engage with digital versus hardcopy billing statements:
Impact of ColorRecall Testing
First-Class MailEye Movement
Methodology Topics

12
THE BENTLEY STUDY
Did digital or hardcopy billing statements increase recall and
brand sentiment?

13
HEAT MAP RESULTS
DigitalHardcopy

14
WHAT DID WE DISCOVER?
*Print had a 10% Lift
• Brand sentiment and purchase probability
• Brand recall:
• Immediately after the eye tracking
• Survey given a week later
*45 sampled respondents

15
With Informed Delivery, the image of a mailpiece further enhances digital engagement.
Image
PaperDigital
Engagement
USPS STRATEGY PART 2: INFORMED DELIVERY

16
MAIL AS PART OF THE DAILY DIGITAL ROUTINE
Informed Delivery maintains the relevance of mail in an increasingly digital society.
User
Density
Consumer and
Mailer Data
Approximate user number as of July 30, 2018.
Number of participating brands and campaigns created as of July 30, 2018
User Density Map as of July 30, 2018
11.6M
Users
700+
Participating Brands
3,183
Campaigns Created

17
CASE STUDY: US CENSUS BUREAU
As a result, the U.S. Census Bureau achieved a high click-to-open rate and an increase
in their number of completed questionnaires.
The U.S. Census Bureau partnered with USPS to provide Providence County, R.I., with an easy, safe way to respond to the 2018 Census Test—anytime, anywhere.
7,445
Emails Sent
5,273
Emails Opened
317
Click-throughs
71%
Email Open Rate
Click-to-Open Rate
6%

18
INFORMED DELIVERY USER SURVEY RESULTS
“It lets me know when to expect
something and gives me peace of
mind that important mail
will be delivered.”10
95%
are satisfied or very
satisfied with
Informed Delivery.10
“Informed Delivery is essential – you
need to know what's arriving when
you are traveling.”10
would recommend
Informed Delivery to
friends, family, or
colleagues.10
90%
Consumer:

19
IMPRESSIONS IN THE DIGITAL AGE
Mailers conducting Informed Delivery interactive campaigns have experienced:
72.5%
Average
Email Open Rate
4.92%
Average Click-through Rate Potential
43% of users typically are not the ones who pick up the mail10
1111
Mailer:

20
Getting Started with
Informed Delivery®
Campaigns

21
A campaign is the combination of mailpiece image (or Representative Image) and Supplemental Content
INFORMED DELIVERY DEFINITIONS
The Informed Delivery for Business Mailers website is the one-stop-shop for information on interactive campaigns.
Resources on the website such as the Interactive Campaign Guide can help mailers get started.
Interactive Campaign AppliedNo Interactive Campaign
Well-designed
Physical Mailpiece
Supplemental
Content
Representative
Image

22
WHAT MAILPIECE TYPES ARE ELIGIBLE?
FLATSLarge Envelopes / Catalogs / Periodicals
LETTERS / POSTCARDS
“Automation compatible” letters and postcards
are eligible for Informed Delivery as they are
scanned through USPS equipment.
Images not captured on USPS automation
equipment. Interactive Campaign, featuring
Representative Image, is required.
23
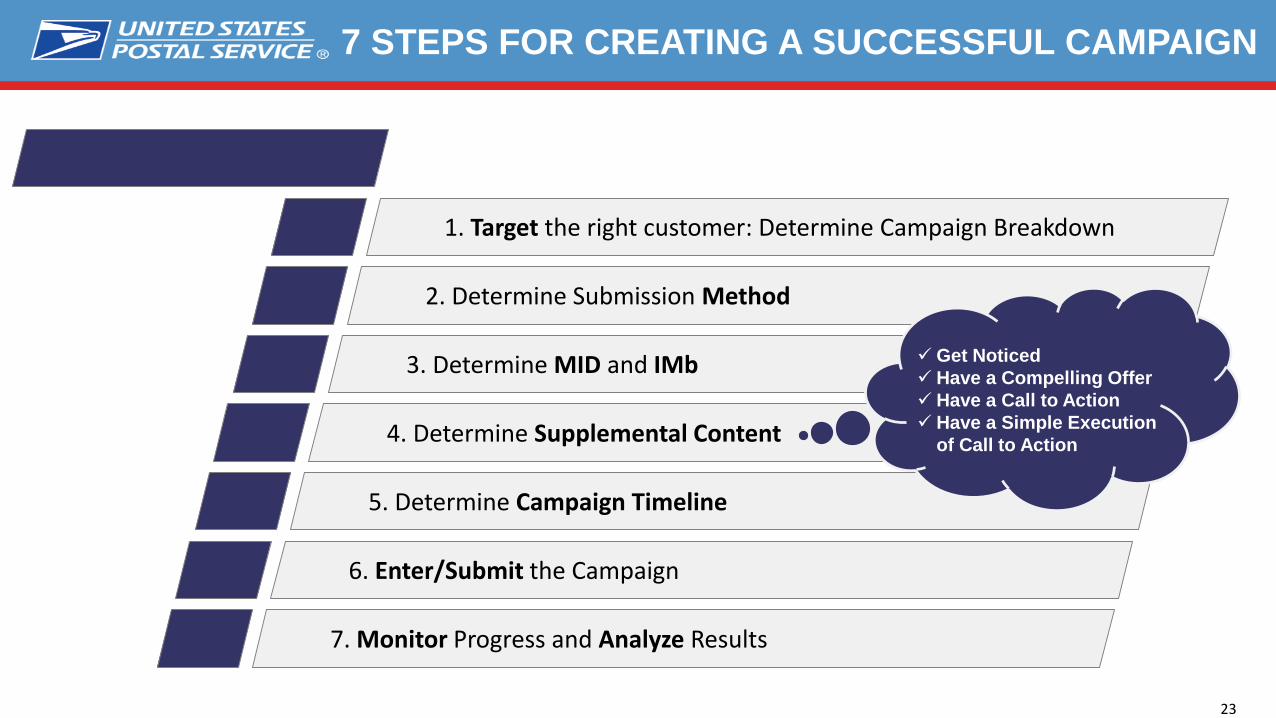
1. Target the right customer: Determine Campaign Breakdown
2. Determine Submission Method
3. Determine MID and IMb
4. Determine Supplemental Content
5. Determine Campaign Timeline
6. Enter/Submit the Campaign
7. Monitor Progress and Analyze Results
7 STEPS FOR CREATING A SUCCESSFUL CAMPAIGN
Get Noticed
Have a Compelling Offer
Have a Call to Action
Have a Simple Execution
of Call to Action

24
UPCOMING FEATURES
Notification
of Mail
Delivery
Pilot
Package
Campaigns
Personalized
Campaigns
Mobile
Wallet
Coupon
Saturation
and
Newspaper
Mailers
25
THANK YOU
THE FUTURE IS BRIGHT!!

26
A PPEN D IX

27
1. “US Ad Spending: eMarketer Forecast for 2017.” eMarketer, March 2017.
2. "The 2017 U.S. Mobile App Report." ComScore, Inc. https://www.comscore.com/Insights/Presentations-
and-Whitepapers/2017/The-2017-US-Mobile-App-Report.
3. “The State of the U.S. Mobile Market.” ComScore. 2016.
4. “How Much of your Audience is Fake?” Bloomberg Business. 2015.
5. “In the name of free speech, Adblock serves up ads, just for a day.” Arstechnica. 2016.
6. Email Marketing Reports, “How much email do people really get?”, 2011.
7. “US Social Trends for 2018.” eMarketer. January 2018.
8. Scott, Mark. "Use of Ad-Blocking Software Rises by 30% Worldwide." The New York Times. February 01,
2017. https://www.nytimes.com/2017/01/31/technology/ad-blocking-internet.html.
9. "Direct Media Response Rate, CPA & ROI Benchmarks in 2017." Marketing Charts. December 27, 2017.
Accessed April 16, 2018. https://www.marketingcharts.com/digital-78422.
10. “User Survey”, July 2017.
11. “USPS-generated reports”; 6-month average of aggregate email open rate as of December 2017.
CITATIONS