innovation in the public sector: a look at the ... - enapcerberus.enap.ca/cergo/docs/cahier de...
TRANSCRIPT
Cahier de recherche 2011-01
INNOVATION IN THE PUBLIC SECTOR: A LOOK AT THE INNOVATION AWARD OF THE INSTITUTE OF PUBLIC ADMINISTRATION OF CANADA APPLICATIONS AND WINNERS
De
Luc Bernier, ENAP
Taïeb Hafsi, HEC – Montréal
Carl Deschamps, ENAP
Version présentée au Congrès de l’association canadienne de science politique Waterloo, Ontario 18 mai 2011

© Luc Bernier, Taïeb Hafsi et Carl Deschamps, 2011
La série des Cahiers de recherche du Centre de recherche sur la gouvernance vise à diffuser des travaux empiriques ou théoriques sur la gouvernance sociopolitique, socioéconomique et organisationnelle.
Le Centre de recherche sur la gouvernance (Cergo) a été fondé en 2003 par l’ENAP et la Téluq. En 2004, il avait obtenu un financement majeur de la part d’Hydro-Québec pour réaliser un programme de recherche sur la gouvernance des entreprises publiques et l’intérêt général.
ISBN 978-2-923856-39-1 (version imprimée)
ISBN 978-2-923856-40-7 (PDF)
Dépôt légal – Bibliothèque et Archives nationales du Québec, 2011
Dépôt légal – Bibliothèque et Archives Canada, 2011
Cahier de recherche INNOVATION IN THE PUBLIC SECTOR: A LOOK AT THE INNOVATION AWARD OF THE INSTITUTE OF PUBLIC ADMINISTRATION OF CANADA APPLICATIONS AND WINNERS
1
Introduction
The past 20 years have seen a debate in Canada between the traditionalist camp in public
administration and proponents of the “new public management.” The pro-tradition side argues
that the overriding concern must be respect for the principles and values by which public servants
are supposed to be guided; for example, accountability and ministerial responsibility are regarded
as core principles. Advocates of this view criticize the new public management’s “client-centred
approach” on the grounds that the connection between citizens and the public service must be
mediated by the politicians who have been elected to govern, and that the relationship between
citizens and the State cannot be reduced to a client-supplier model (Savoie, 1995). They also have
reservations about the ideological connotations of the public management approach, which is
associated with politicians such as Margaret Thatcher, who considered the private sector to be
superior to the public sector (Metcalfe, 1993).
Leaving aside the ideological dimension, it can be said that the new public management has
sought to achieve greater efficiency in the public sector (Borins, 1995). Should operations be
divorced from policy-making in order to manage the former more effectively? Is it possible to
save money by implementing results-based management or process reengineering? Many
observers believe that the effort to improve efficiency, which is the leitmotif of the new public
management, has demonstrated its limitations (Dunleavy et al., 2006). Too many public-private
partnerships have yielded disappointing results because the contracts were unclear or because the
private sector had no useful experience to bring to the table. Special operating agencies have not
proven to be the panacea for the problems of bureaucracy that many had hoped. The limitations of
results-based management have also become evident (Bernier & Angers, 2011).
One benefit of the advent of the new public management, however, is that it has prompted debate
on possible innovations in the public sector. Reinventing Government, the movement’s seminal
text, argued that the State could be transformed by imagination and entrepreneurial spirit, and
held out hope that the State need not be rejected altogether. Today, in the wake of the economic

Cahier de recherche INNOVATION IN THE PUBLIC SECTOR : A LOOK AT THE INNOVATION AWARD OF THE INSTITUTE OF PUBLIC ADMINISTRATION OF CANADA APPLICATIONS AND WINNERS
2
crisis of 2008, the idea that the State has an important role to play has regained currency. Borins
(2008) has expanded on Reinventing Government’s proposition that, in view of the turbulence in
the public sector environment, innovation is necessary and the State must be reinvented. There are
many reasons for seeking ways to improve the operation of the State:
- To address the growing difficulty of recruiting public servants to replace the wave of
retirements;
- To relieve pressure on cash-strapped governments in a time of globalization which makes
it difficult to increase taxes;
- Because technology is making some types of progress possible;
- Because issues increasingly cut across different fields and administrative reorganization is
required in order to address them.
This list could be extended. The basic idea is that innovation is necessary if the public sector is to
continue playing its role. At a time when needs are growing in areas such as health care and we
are still saddled with 19th century institutions. The State must be reinvented. “An innovation is
about the introduction and adoption of new ideas that produce a change in the existing
relationships between an organization and its internal and external environments” (Osborne &
Brown, 2005:140). Innovation can be a structural change, or quality management or performance-
oriented measures (Seidle, 1995:14). These approaches are complementary, not mutually
exclusive. Changing an organization’s structures can hardly be expected to yield results if its
culture does not also change.
The Institute of Public Administration of Canada (IPAC) has followed the American example of
the program at Harvard University, now at its Ash Institute that hands out an annual, multi-
category award endowed by the Ford Foundation. In 1990, the Institute of Public Administration
of Canada created the IPAC Innovative Management Award, modelled after the Ford Foundation
awards. The concept was subsequently picked up by the Commonwealth Association for Public
Administration & Management. This study deals with the IPAC award. All public administrations
Cahier de recherche INNOVATION IN THE PUBLIC SECTOR: A LOOK AT THE INNOVATION AWARD OF THE INSTITUTE OF PUBLIC ADMINISTRATION OF CANADA APPLICATIONS AND WINNERS
3
in Canada are eligible: every year since 1990, between 60 and 100 municipalities, provinces and
the federal government have applied.
This research follows our previous work has been on public entrepreneurship in the Westminster
system (Bernier and Hafsi, 2007). Why do people innovate in the public sector where the rewards
could be limited? In the public sector, innovation has long been regarded as either non-existent or
aberrant, especially in the parliamentary system, where initiatives must officially come from
elected ministers. An organization with an intense, aggressive environment tends to generate
standardized, rigid behaviour, which in turn eliminates all entrepreneurship and innovation. In
their study of the public sector in South Africa, Morris & Jones (1999) note that the discouraging
factors most often mentioned seem to be, in order: (1) rules, procedures, policies and their
fastidious application, (2) restrictions in the area of human resources management (recruitment,
dismissal), (3) paltry rewards and internal rivalry and (4) lack of managerial autonomy. It is
generally acknowledged that these “discouraging” conditions are often present in the public
sector. As a result, the public sector has traditionally been thought to be incompatible with
innovation. Nevertheless, innovation occurs. Hundreds if not thousands of civil servants in small
groups apply every year to awards that would recognize that they innovate. Innovation is possible
and necessary considering the demographics of the public sector, the budgetary situation and
various pressures on the public sector.


Cahier de recherche INNOVATION IN THE PUBLIC SECTOR: A LOOK AT THE INNOVATION AWARD OF THE INSTITUTE OF PUBLIC ADMINISTRATION OF CANADA APPLICATIONS AND WINNERS
5
The Innovation Award in Canada
Specifically, this study will examine the applications for the IPAC Innovative Management
Award submitted by Canada’s federal and provincial governments. We have compiled a database
of all applications for the award since its inception in 1990. The database we develop can be
mined for information on who applied, when and why. It enables us to study all aspects of
innovation in the public sector: the choice of the instruments to be used for policy
implementation, the introduction of new technologies, new processes, restructuring, etc. As the
database covers a long period, we can also consider how efforts to effect changes in public
administrations have come in waves or cycles.
The database can be divided into three sections: the 1 865 applications for the award submitted
since 1990, the short-list of 6 to 10 applicants chosen every year to present their projects at the
annual conference, and the three winners each year. The applications, which must be approved by
the Deputy Minister or Agency Head, are only that: a claim by the applicants that they have done
something innovative. However, not only the three winners but all the short-listed finalists have
been deemed successful innovators by a jury of practitioners and academics. Whether differently
constituted juries would have chosen the same three winners is open to question.
This paper is based on a data bank we have begun to develop including all the applications to the
award since the beginning. The available data on the applications comes from the web site of the
institute and from the forms that have been sent to us by the institute. Electronic forms are
available for the last decade and paper ones for the previous one. Applications to the award are
voluntary. Applicants might be unlikely to win, most years, one chance out of one hundred, but
civil servants have applied year after year for two decades. They are looking for recognition for
their work. There is no money attached to the award as it is the case in the United States. Between
70 and 100 teams apply every year depending of the annual topic. Three preliminary juries then
read roughly a third of the applications that are classified in three categories A) A few strong
candidates that could win, B) potential winners but not as strong as the A category and rejected

Cahier de recherche INNOVATION IN THE PUBLIC SECTOR : A LOOK AT THE INNOVATION AWARD OF THE INSTITUTE OF PUBLIC ADMINISTRATION OF CANADA APPLICATIONS AND WINNERS
6
candidates that end up in the C) category. From these applicants, six to eight files will be
considered finalists and invited to present orally their innovation by the official jury usually four
civil servants and an academic. The previously A listed candidates are likely to be selected and
occasionally a B listed will discussed but not likely to end up among the finalists.
The president of the jury is a high ranking civil servant most likely to come from the province
where the annual conference will take place that year. One academic is the secretary of the
committee and will write the short article that will be published in the Institute’s magazine. IPAC
has also an academic journal, Canadian Public Administration. The other members of the jury are
higher civil servants representative of the membership of the Institute and of the bilingual nature
of Canada.
This choice of the chair was generally made by the late executive director of the institute, Joe
Galimberti, who held the position from 1974 until his death in 2006. He also suggested the topic
of the award to the board of directors who had to accept it. Galimberti was given the Vanier
Medal in 2008, the highest award in Canadian public administration, for his contribution to the
development of the institute and the discipline. It had been his idea to launch the award based on
the American model in 1990. The award is a glass trophy given to the bronze, silver and gold
recipients at the annual conference every year. The three finalists are invited to present at the
annual conference and are given the award at the closing session and lunch of the conference. The
three finalists are selected in June and they don’t know until the final day of the conference in
August who wins gold, silver and bronze. Who would win has never leaked. This is the only
secret attached to the competition. It has been presumed that applicants think they have a fair
chance of winning and they keep applying. Often the 17 regional groups that constitute IPAC
have regional awards and applicants to the national one have apply and won provincially or at
more specialized forums (technology or police associations for examples) before applying for the
national award.
Cahier de recherche INNOVATION IN THE PUBLIC SECTOR: A LOOK AT THE INNOVATION AWARD OF THE INSTITUTE OF PUBLIC ADMINISTRATION OF CANADA APPLICATIONS AND WINNERS
7
But the applications as a whole merit attention and are the focus of our proposed report. In the
1990s, when Ontario’s public service was dramatically shaken up (between 15 000 and 20 000
public servants left because of government belt-tightening), a systematic effort was made to
encourage government organizations to apply for the award as a way to recognize the work of
public servants.
What emerges from the data at first glance is that there are relatively few applications from
Quebec compared with Ontario, British Columbia and Alberta, the largest provinces. It may be, as
the report will discuss, that some themes of the annual competitions aroused more interest than
others, and it might be possible to increase the number of applications for the award, if desired,
particularly since the annual themes have now been abolished. In this study, we will begin by
identifying the observable trends in the applications:
- What economic variables have had an impact?
- Have changes of government had an impact?
- Have changes of first minister had an impact?
- Do governments innovate more before or after winning re-election to a second term?
- Are there cycles associated with government terms of office?
- More simply, are there cycles over time?
- Does the number of innovations per year vary with the government’s financial situation?
- Who is innovating in each sphere of government action?
- What comparisons can be drawn between the provinces?
Our database will also enable us to study which organizations have submitted applications and in
which fields, and potentially to study the applications themselves in greater detail. Our
quantitative study has its limitations. For example, the creation of the government of Nunavut,
which won gold (the top prize) in 2001, counted as one innovation, the same as much more
modest reforms. However, we believe that studying this database, the first of its kind in Canada,
can serve as the basis for a discussion of the usefulness of applying for these awards, and to
Cahier de recherche INNOVATION IN THE PUBLIC SECTOR : A LOOK AT THE INNOVATION AWARD OF THE INSTITUTE OF PUBLIC ADMINISTRATION OF CANADA APPLICATIONS AND WINNERS
8
determine whether it is possible for the government of Quebec to adopt a tailored approach and
decide whether it wants to recognize its public service by encouraging these applications. More
basically, this report could support a discussion of innovation in the public sector and its
usefulness to a government. We will begin by analyzing the applications for the award and then
provide a modest interpretation based on the relevant scientific literature.
The IPAC Innovative Management Award honours innovative organizations in Canada. We begin
by analyzing the applications. In a later stage, we may study the finalists and the winners of the
gold, silver and bronze prizes in the annual competitions. The following analysis has the
advantage of any quantitative study in that it covers a large set of cases, and the concomitant lack
of refinement. We would need to interview a sample of organizations that applied for the award to
find out what motivated them.
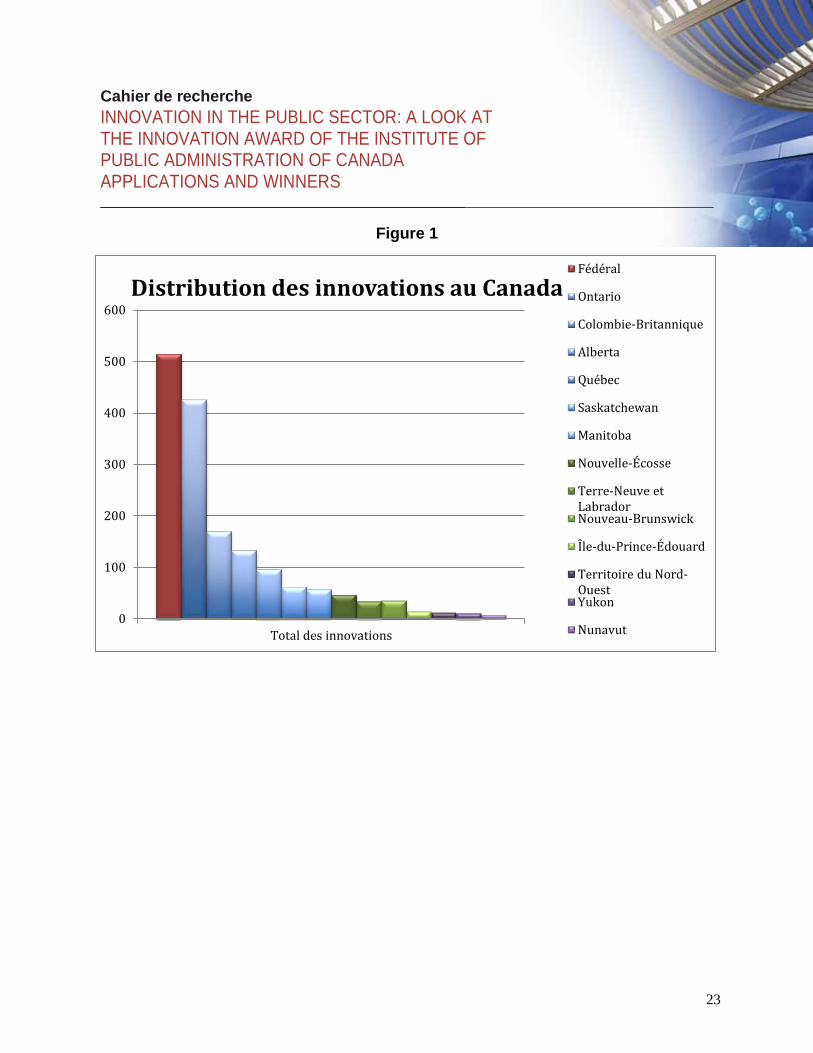
The numbers in the following text are based on the applications made by Canada’s provincial and
federal governments. Of the 1 865 applications submitted since the awards began in 1990,
365 were from Canadian municipalities; they are not considered here. We begin by looking at the
applications from Canadian governments overall and then we examine the most innovative
governments. The Maritime provinces have submitted too few applications over the years to
identify any trends. On the other hand, British Columbia appears to be an interesting case and, as
the charts below suggest, would deserve further study.
As the first chart (Figure 1) shows, applications for the innovation award come from governments
in Canada in unequal proportions. The largest number have been submitted by federal
government organizations, followed by, in order, Ontario, which has taken a strong interest in the
competition, British Columbia, Alberta and, in fifth place, Quebec. In the case of Quebec, we
might ask whether there is a language barrier, similar to the cultural barrier noted below that
reduces applications from organizations that work at the international level and identify less
strongly with the public administration community. Why is there an average of five applications
per year from Quebec and more than 20 from Ontario?

Cahier de recherche INNOVATION IN THE PUBLIC SECTOR: A LOOK AT THE INNOVATION AWARD OF THE INSTITUTE OF PUBLIC ADMINISTRATION OF CANADA APPLICATIONS AND WINNERS
9
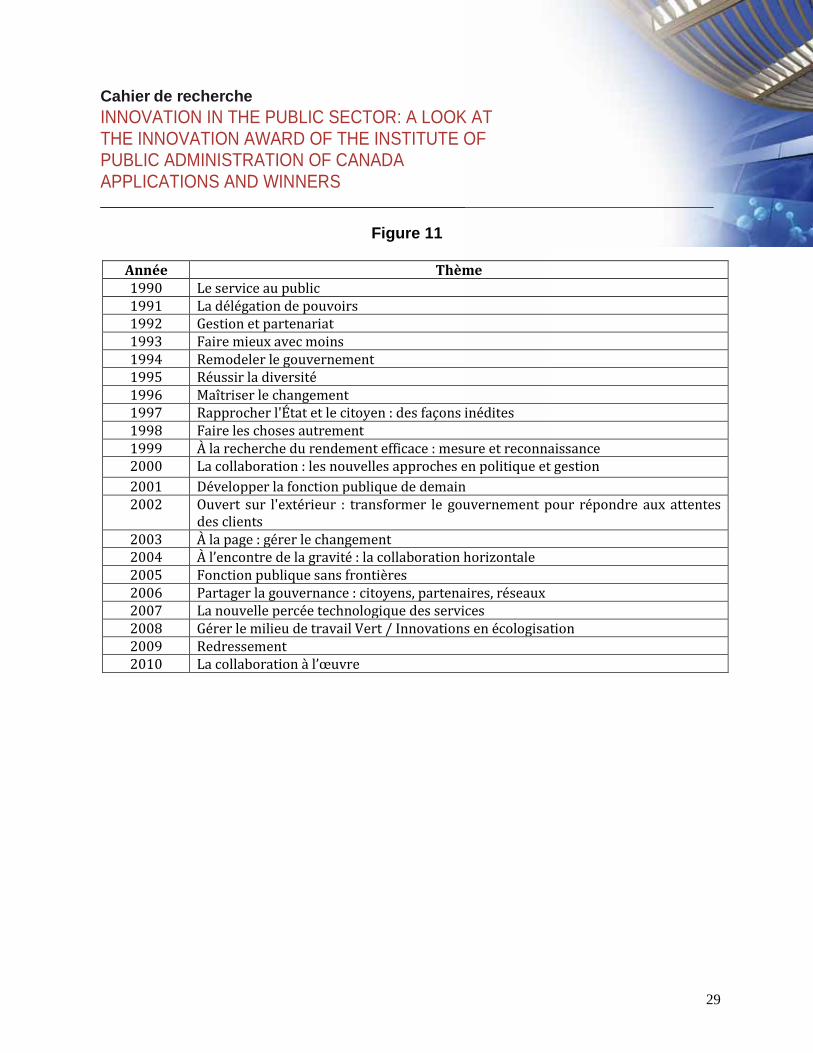
Each year, a relatively general theme has been chosen for the IPAC award. Some organizations
may have been more interested in some themes than in others. We make the assumption that the
projects were developed in the year prior to the year in which the organization applied for the
award. For example, we take the applications submitted in 2010 to cover innovations introduced
in 2009. We are using this system for lack of more detailed information about the applications. As
innovations can age quickly, it makes sense for organizations to apply for the award as soon as
possible. This interpretation is also supported by the lead author’s experience as a member of a
preliminary jury one year, at which time he read a third of the applications, and as a member of
the final jury the following year. The theme chosen in 2008 attracted few applications. As we
took the applications submitted in 2008 to be for innovations introduced in 2007, our numbers for
2007 are low, although it was in fact the theme for 2008 that was problematic.
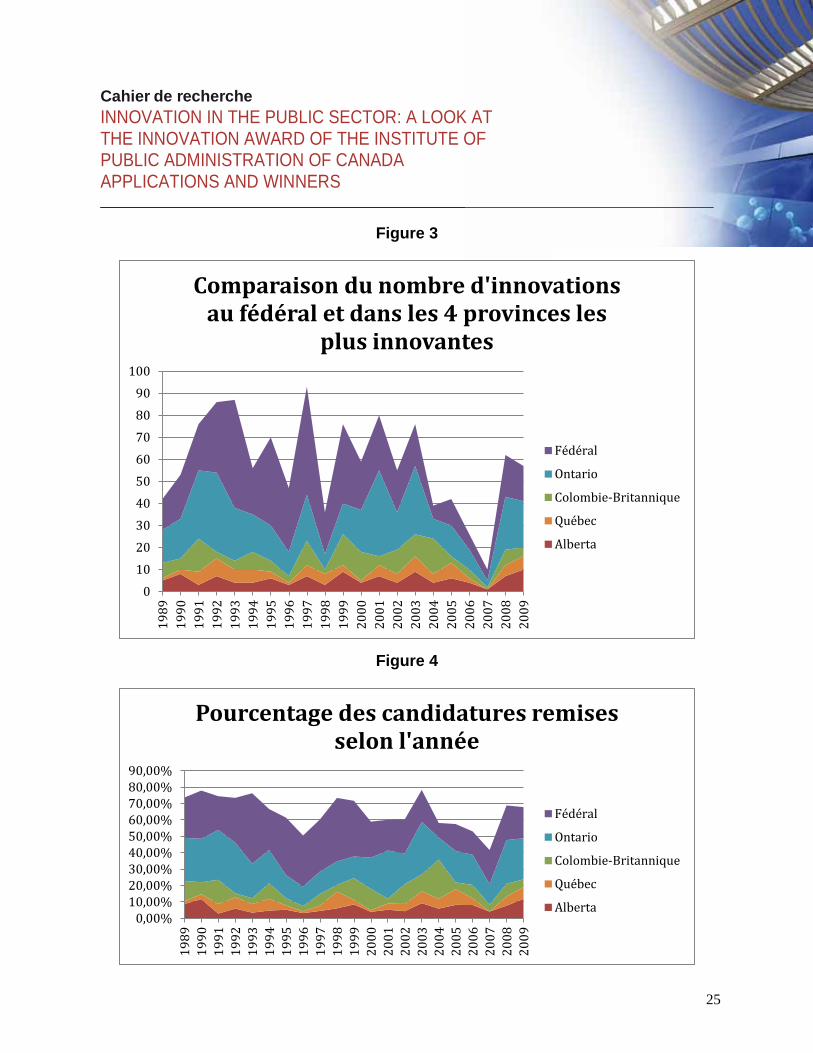
With respect to trends over time, the next chart (Figure 2) also shows that there were generally
fewer applications in the second half of the aughts decade. Is it because efforts connected to the
introduction of the new public management in the 1990s are losing steam or because minority
governments have been in office? It is possible that post-2000 innovations have been more
concentrated in the field of governance and therefore less likely to show up in the IPAC awards.
There is an observable relative decline in the second half of the aughts in terms of both absolute
numbers (Figure 3) and percentages (Figure 4). We will examine these issues in greater detail
further in the report. As can be seen from these historic charts, there were in fact two waves of
applications in Ontario, the first in the early 1990s and the second in the first years of the new
millennium. There was a wave of applications from British Columbia as well at the beginning of
the aughts while applications from Alberta and Quebec appear to have been relatively stable over
time.
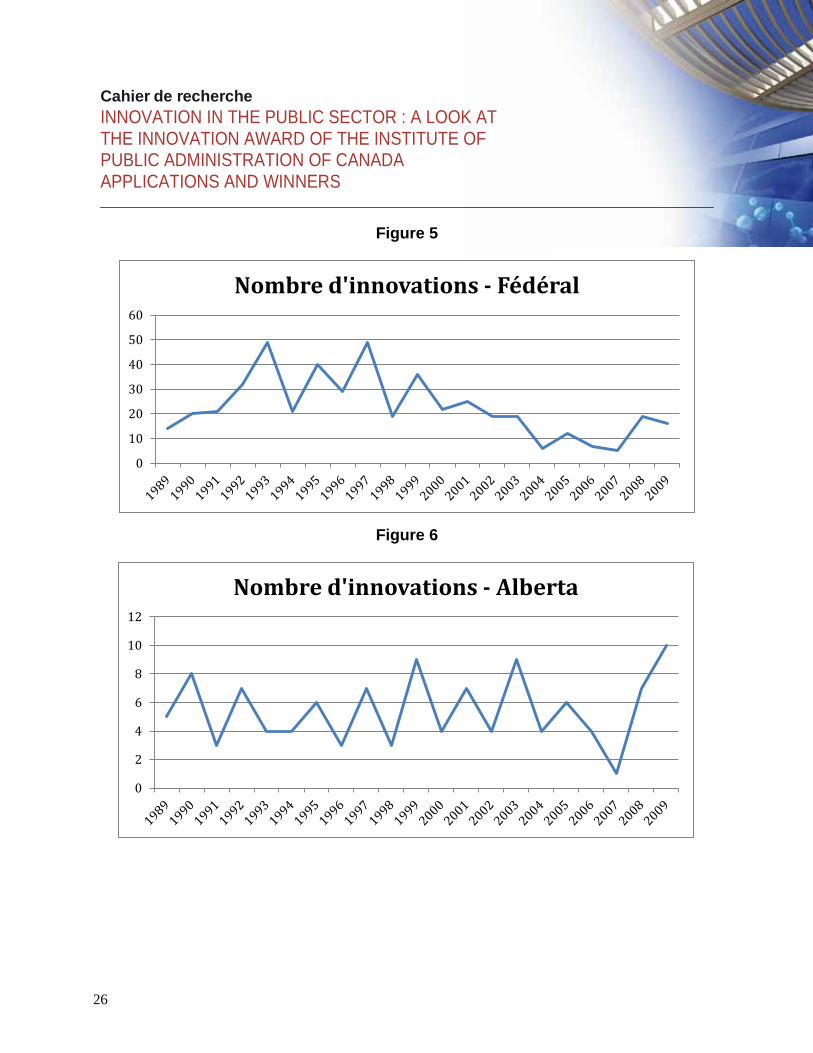
The relative decline after 2000 is quite pronounced on the chart showing the number of
applications per year from the federal government, which has seen minority governments since
2005 (Figure 5). There was a flurry of applications in the 1990s, followed by a decline. However,
we will need to qualify these general observations when we look at the next charts.
Cahier de recherche INNOVATION IN THE PUBLIC SECTOR : A LOOK AT THE INNOVATION AWARD OF THE INSTITUTE OF PUBLIC ADMINISTRATION OF CANADA APPLICATIONS AND WINNERS
10
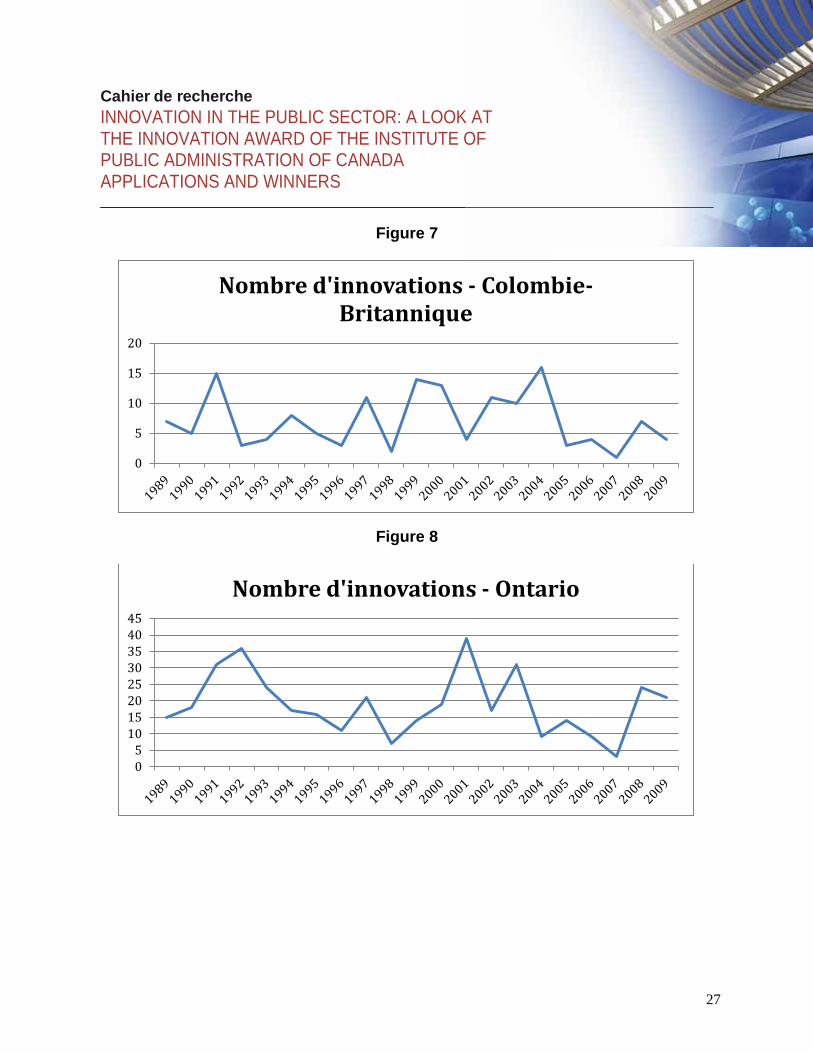
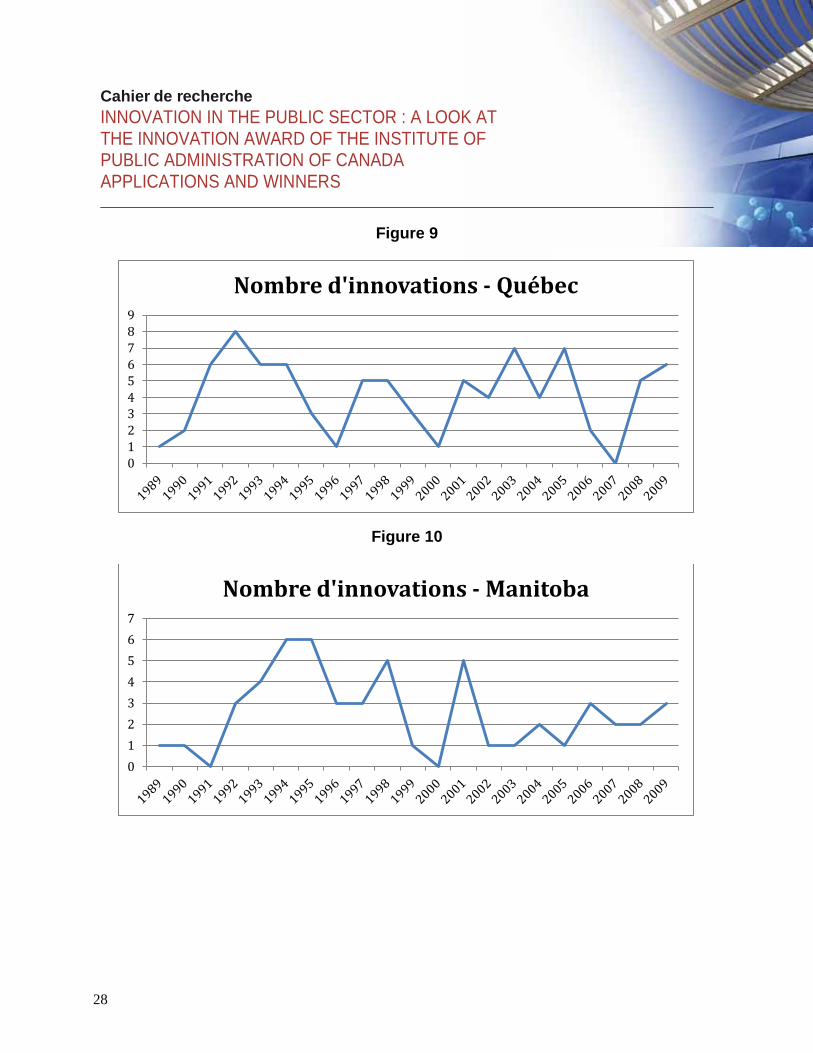
Aside from lows everywhere in 2007 (for the 2008 theme), there are interesting differences in the
provincial trends. In British Columbia and Ontario, there was a decline after higher numbers in
the first half of the aughts decade. In Quebec, there were two peaks, in the first half of the 1990s
and around 2003. In Alberta, there are no noteworthy trends. For this series, we also included
Manitoba (Figure 10), the province that worked hardest to create special operating agencies in the
1990s, and we note that it submitted more applications at that time. This is an interesting example
of a government with a strong period followed by a quieter period. As these examples illustrate, it
is possible to develop a good number of applications in a relatively brief span of time.
The themes were long chosen by the CEO of IPAC, who tried to find subjects related to the
evolution of public administrations, as he saw it, but broad enough to attract applications
(Figure 11). The CEO’s suggestions were submitted to the Board of Directors for approval. As
noted above, however, the themes have now been eliminated.
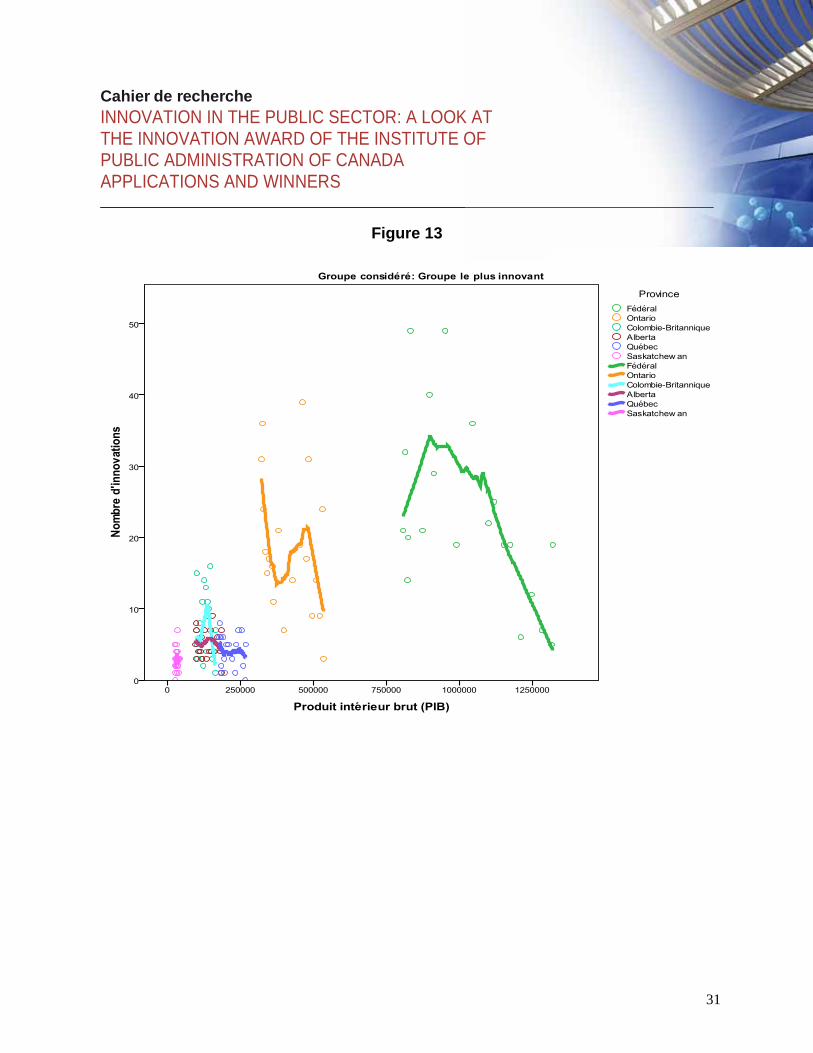
We wondered whether governments were more likely to try to innovate in times of budget cuts or
in periods of growth. The first test we applied was based on the unemployment rate (figures 12
and 13). While some provincial governments have faced unemployment rates of more than 15%,
we will confine our comments to cases where the unemployment rate was under 10%, which are
the majority. There is an increase in the number of innovations by provincial governments when
the unemployment rate climbs from 5% to about 8% but the correlation is weak. It is much clearer
for the federal government, which is more likely to innovate when the economy is doing poorly. It
would appear that at those times it seeks solutions in order to deal with its straitened
circumstances. This may also be seen as an effect of the differences between the roles of the
federal and provincial governments, as the provinces need to provide social services such as
health and education regardless of the economic situation, while the federal government is more
responsible for macro-economic policy. The next chart shows a similar pattern: increases in GDP
correlate to decreases in the innovation rate. We see the same inverted “V” trend line for the
Canadian provinces under consideration.
Cahier de recherche INNOVATION IN THE PUBLIC SECTOR: A LOOK AT THE INNOVATION AWARD OF THE INSTITUTE OF PUBLIC ADMINISTRATION OF CANADA APPLICATIONS AND WINNERS
11
Again, this chart shows regression curves broken down by province (Figure 14). It is somewhat
difficult to see on the chart, but the curve for Saskatchewan also forms a sort of upside-down V.
Quebec, which has a much larger public administration, submits fewer applications for the award
than some smaller provinces. The next chart, which compares the number of applications with
government spending, shows the same trend but with a still wider gap. The inverted V
relationship between government spending and applications is also clearer. After a certain point,
higher government spending no longer correlates with more innovation. While correlation
analyses have yet to be performed on the full model, we believe that these charts indicate that, up
to a certain point, increasing government spending leads to more innovation but the relationship is
not linear. Above a certain level of spending (and therefore capacity to spend), governments
innovate less. Our hypothesis based on these two charts is that governments innovate when they
are under budgetary stress and the relationship is then reversed. Some innovations are born of
necessity. For example, the federal government’s export support programs now operate as a
“virtual agency” because, after budget cuts, the various organizations involved no longer had
enough resources to operate separately (Bernier, 2002).
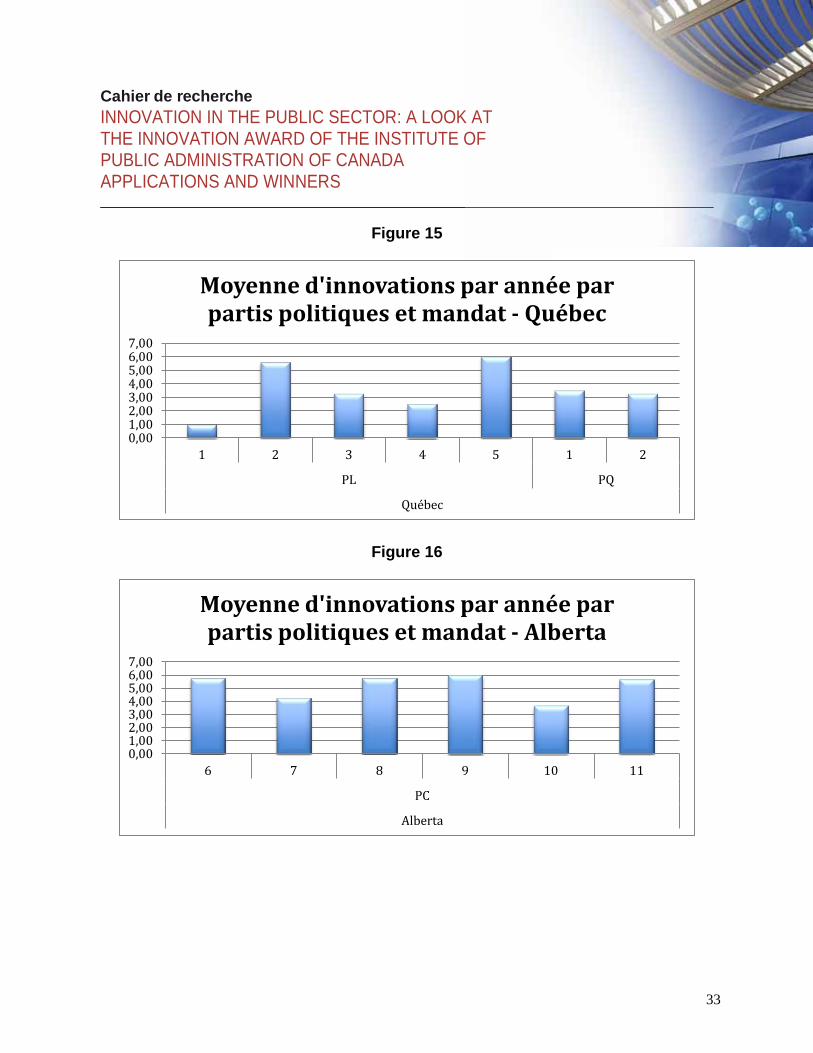
We then considered whether governments innovate more when they are first elected. The
following data suggests that, to the extent that it is possible to draw conclusions from such a small
sample, there does not appear to be any strong correlation during the 1990-2010 period. In
Quebec, there were more applications under the Liberals than under the PQ, but not necessarily in
their first term of office. This might be related to less interest in what is happening in the rest of
Canada under some governments. The long reign of the Conservatives in Alberta (Figure 16) is
interesting in this respect; the level of innovation varies little from one term of office to another.
On the other hand, in British Columbia (Figure 17), Gordon Campbell’s Liberal government
innovated mostly at the beginning while the NDP did so mostly after it was elected for the second
time. Our data covers only one year of Social Credit government. In Ontario (Figure 18), the
largest number of innovations was under the second Harris government. At the federal level, the
Liberals innovated the most in the 1990s, when they had majorities. Subsequently, under the Paul

Cahier de recherche INNOVATION IN THE PUBLIC SECTOR : A LOOK AT THE INNOVATION AWARD OF THE INSTITUTE OF PUBLIC ADMINISTRATION OF CANADA APPLICATIONS AND WINNERS
12
Martin minority government and then the Conservative minority, the number of innovations per
year decreased (Figure 19). Was it because of ideology or because they had to negotiate with the
opposition? The Bourassa and Johnson years are shown here as Liberal governments 1 and 2,
followed by Jean Charest’s three terms of office (Figure 15).
There have in fact been four Liberal governments in Quebec since 1990, but our data actually
goes back one year further, since we counted the 1990 applications as referring to innovations
introduced in 1989. Liberal government 1 is therefore the Bourassa government of 1985-1989. As
the 1989 election was held on September 25, 1989, and the first session of the National Assembly
opened on November 28, 1989, we counted the Bourassa government as the government for
1989. We have classified all election years similarly, according to the election date: if the election
was held on or after July 1, we count the new government’s term as beginning in the following
year, since our data is organized by year; if it was on or before June 30, we count the new
government’s term as covering the entire year. Data for election years was coded according to this
principle.
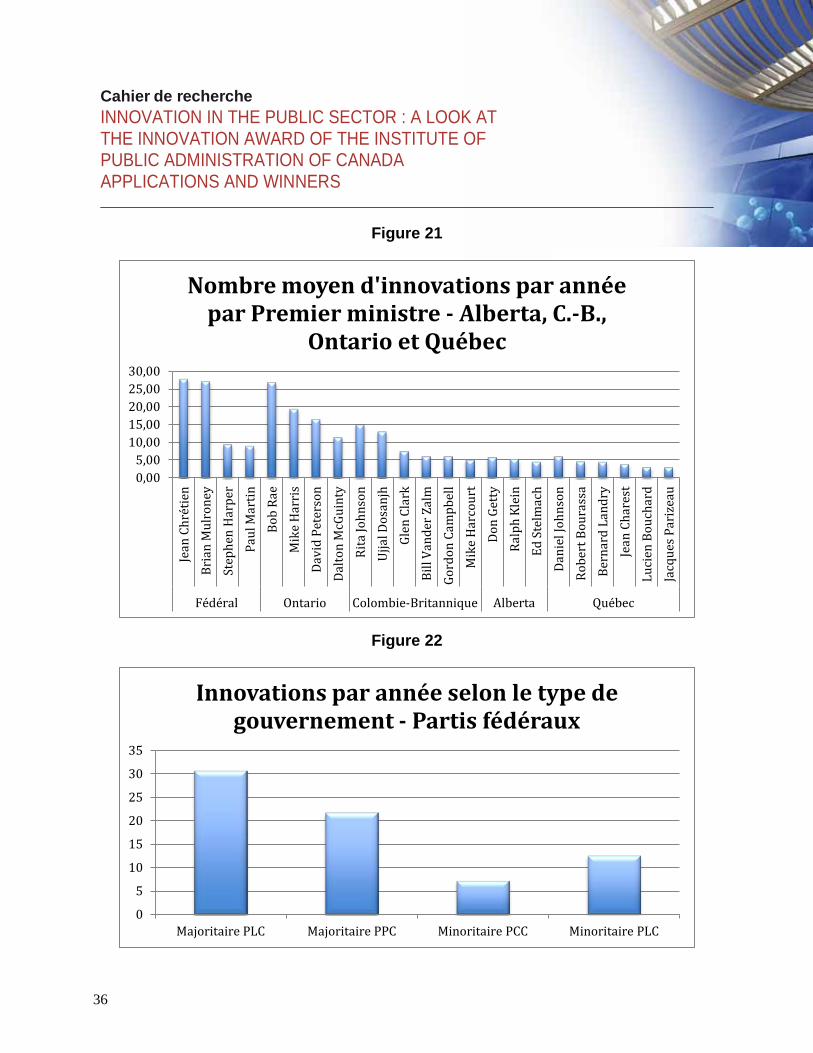
We then considered whether the number of innovations per year varied with different first
ministers. There does not appear to be any clear left-right split: for example, in post-Bob Rae
Ontario, it was Mike Harris, not the Liberals, who led an innovative administration. As in any
analysis of this type, it is difficult to say whether these first ministers and their governments were
responsible for the innovation or were just in the right place at the right time. In the case of other
innovative practices, such as the creation of crown corporations, partisan ideology seems to be
less significant than the fact of being in office during a given period (Bernier, 1998). In Quebec,
the brief premiership of Daniel Johnson Jr. occurred at a time when the role of the State was
being questioned; “Opération Réalignement” was, among other things, a reengineering effort in a
time of budget difficulties.
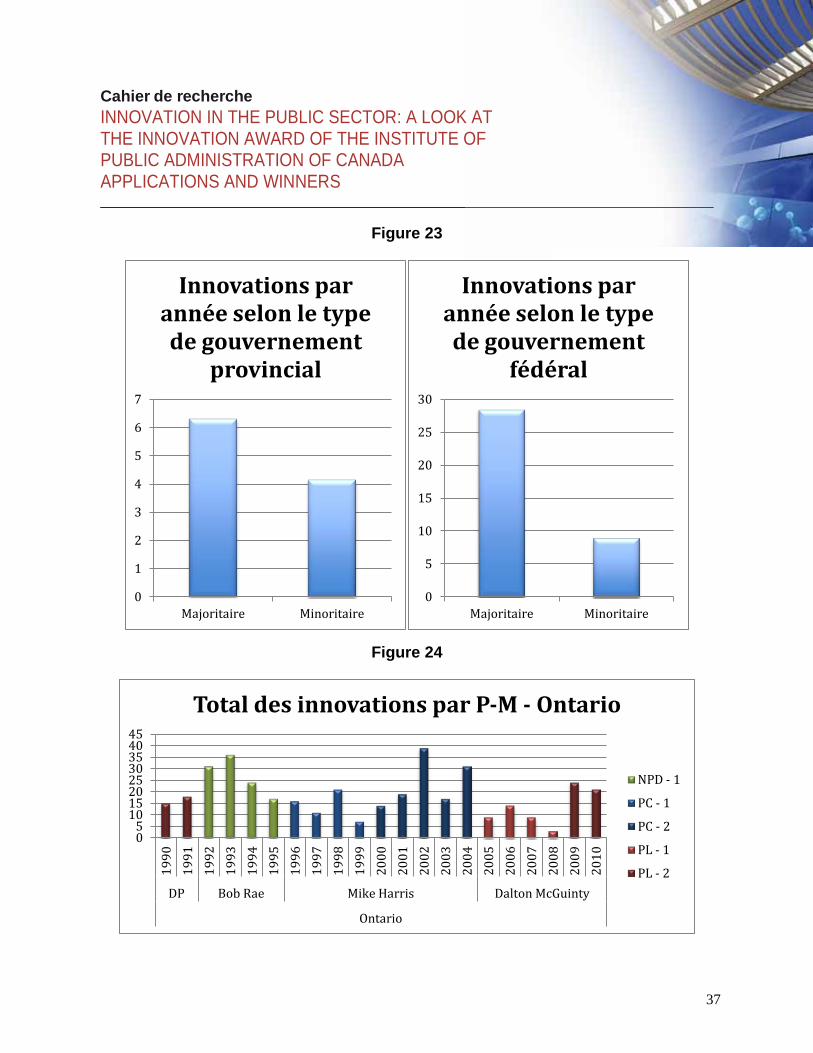
The next charts (figures 22 and 23) suggest that majority governments are more innovative. At the
federal level, this was true of both Liberal governments and the Progressive Conservative
Cahier de recherche INNOVATION IN THE PUBLIC SECTOR: A LOOK AT THE INNOVATION AWARD OF THE INSTITUTE OF PUBLIC ADMINISTRATION OF CANADA APPLICATIONS AND WINNERS
13
government of the early 1990s. The trend is also clear at the provincial level. For this variable, the
correlation appears to be quite strong.
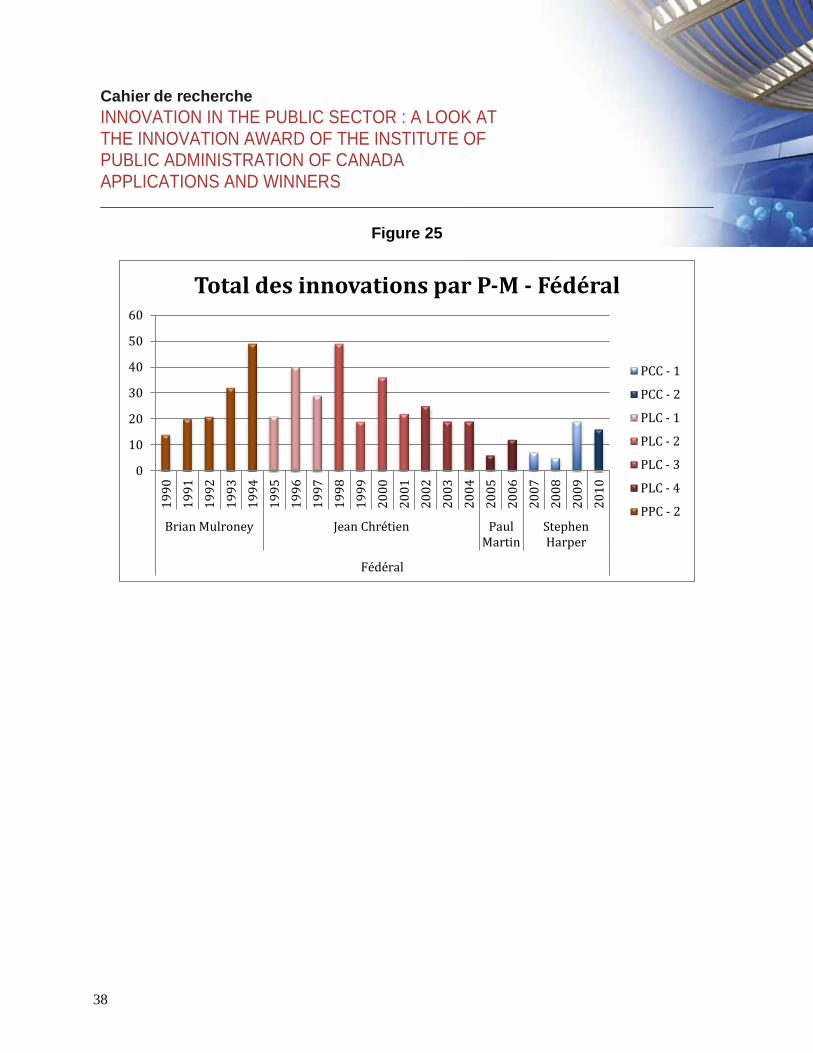
If we look at just Ontario (Figure 24), it is interesting to note that both the Harris and McGuinty
governments were most innovative in their second terms of office.
The pattern is different at the federal level. Under Mulroney, the pace picked up towards the end
of the government’s second term, while in the case of Jean Chrétien the number of applications
per year was higher in the government’s first term than the third (Figure 25).
Studies of government budgets have shown a link to the election cycle. Does the same apply to
innovation? The next chart (Figure 26) shows wide variation in this area, making it difficult to
draw any firm conclusions.
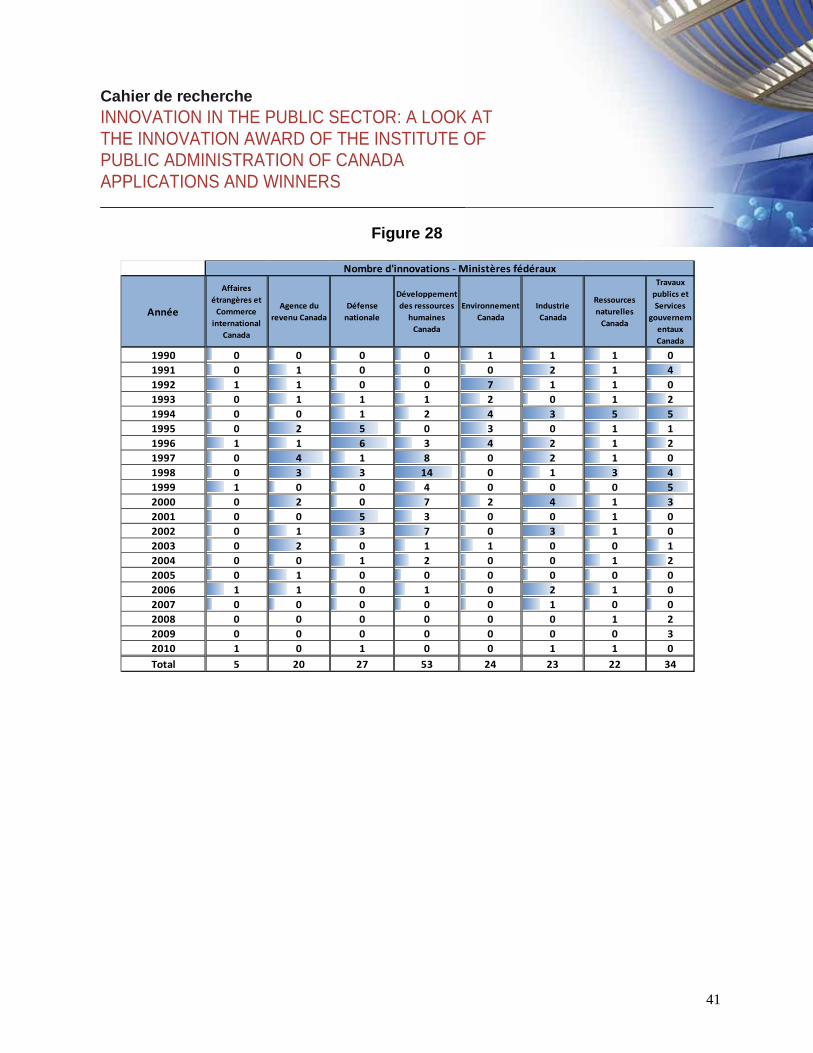
After examining economic and political factors, it is worth investigating the areas in which
governments innovate. Figures 27 and 28 below show variances between federal government
departments. Human Resources Development, which was created through the merger of four
departments in the 1990s and was often in the news, is the federal department that has submitted
the largest number of applications, followed by Public Works in second place. On the other hand,
the Department of Foreign Affairs and, to a lesser degree, CIDA have submitted few applications.
Does this mean that these organizations are less innovative or simply that they identify more with
their field of specialization? In all, seven departments have submitted 20 or more applications and
six others 10 or more applications. If we look at the number of applications submitted by the
departments over time, we can see they have gone through cycles. Human Resources
Development experienced a full cycle from 1996 to 2004. At Public Works, the applications were
more scattered but it also registered a decrease after 2004. If we then compare this with Ontario,
the province that has submitted the most applications, we find that the applications were in
slightly different fields. Natural resources stands out.

Cahier de recherche INNOVATION IN THE PUBLIC SECTOR : A LOOK AT THE INNOVATION AWARD OF THE INSTITUTE OF PUBLIC ADMINISTRATION OF CANADA APPLICATIONS AND WINNERS
14
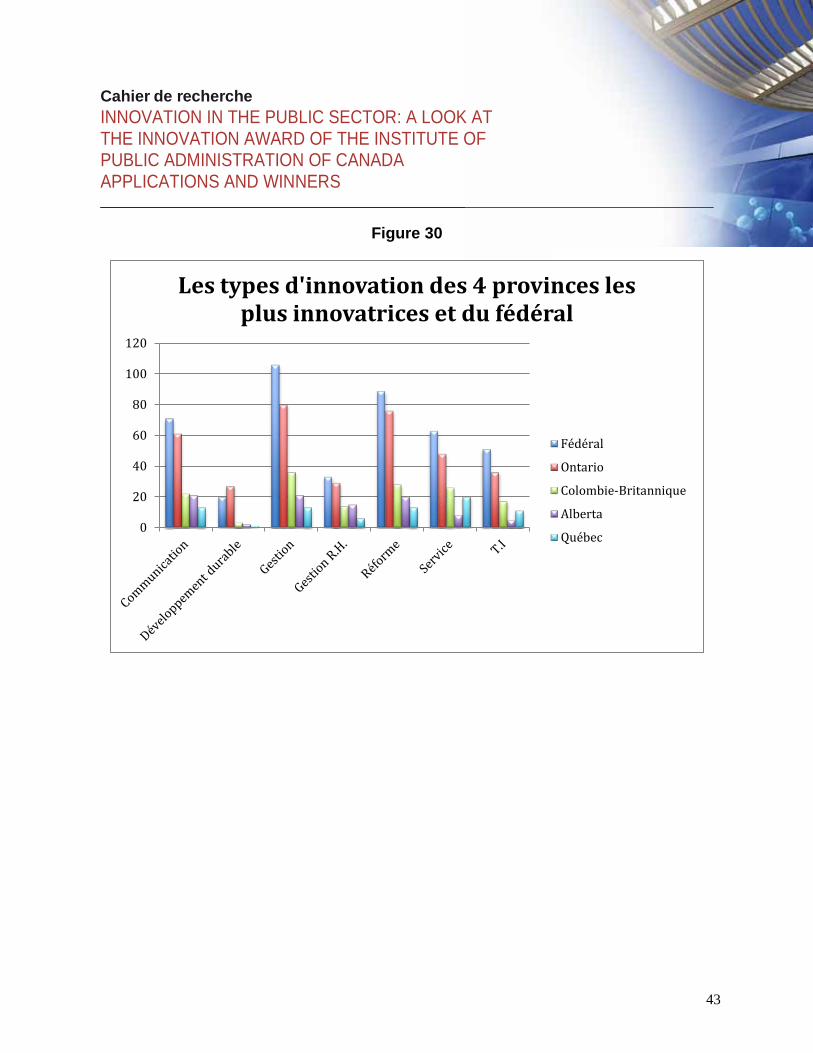
The next question is the type of innovation (Figure 30). An innovation may consist in offering the
public a new service, or using information technology, or developing a new training program for
the public service, or setting up a one-stop shop. In other cases, the innovations consisted in
regulatory changes. We have organized these changes into categories. The most strongly
represented categories are shown on the next chart. Changes in processes are classified under
“management,” changes in structures under “reforms.” Many changes related to communications
with the public. There were also many innovations in human resource management.
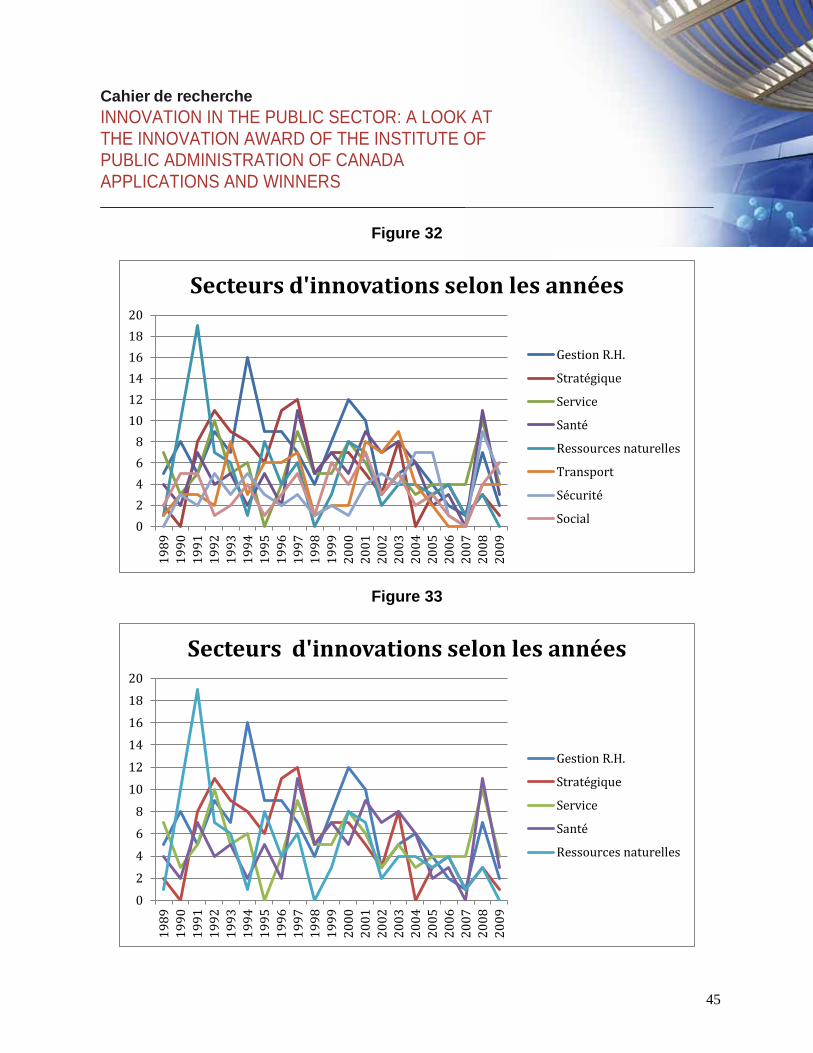
The next three figures (31, 32 and 33) show the same information organized according to the
fields in which the reforms were carried out. Unlike Figure 30, which shows the sector of the
public administration, these charts show the sphere of government activity. There has been a
decline in some areas, such as natural resources, compared with the early 1990s. Human
resources management figures prominently. The difference between figures 32 and 33 is that in
the second we have included only the most frequently occurring categories for better readability.
“Strategic” refers to all innovations in departmental affairs, planning, organizational
development, and so forth – anything related to the administrative apparatus of the State.

Cahier de recherche INNOVATION IN THE PUBLIC SECTOR: A LOOK AT THE INNOVATION AWARD OF THE INSTITUTE OF PUBLIC ADMINISTRATION OF CANADA APPLICATIONS AND WINNERS
15
And the Winners Are…
Applying to such an award is one thing, winning the award is another one. It is interesting to have
a look at who wins. Figure 34 offers a comparison of the number of applications versus the
number of finalists and winners. To use a baseball metaphor, Alberta has an impressive batting
average. By comparison with the other governments, their winning percentage is very high.
Alberta counts for little less than 20% of the winners for only 6 percent of the applications.
Similarly, when Quebec organizations apply, they end up among the finalists and then they win.
British Columbia is also more efficient than Ontario and the federal government. Ontario does not
seem to have a bad equilibrium. Ottawa has to apply for more than 25 percent of the total but
wins only about 15 percent of the time. We could see here a different way of looking at this award
from one government to the next. Is it important for governments to apply or to win? It could be
argued that organisations can only be convinced to apply if they have some chance of winning but
obviously.
Figure 35 offers another look at the same phenomenon. We look here at scores of finalists versus
applications and winners versus applications. If a province has the same percentage of winners
and applications, its score would be 1. Again, the Alberta case is peculiar. Alberta has a score of
3.15. They are not only among the finalists quite often but they are winners more often. Manitoba
where applications have not been very numerous has to the contrary a hard time. Manitoban
candidates become finalists but they do not win often. To the contrary, Saskatchewan has twice as
many winners for less finalists.
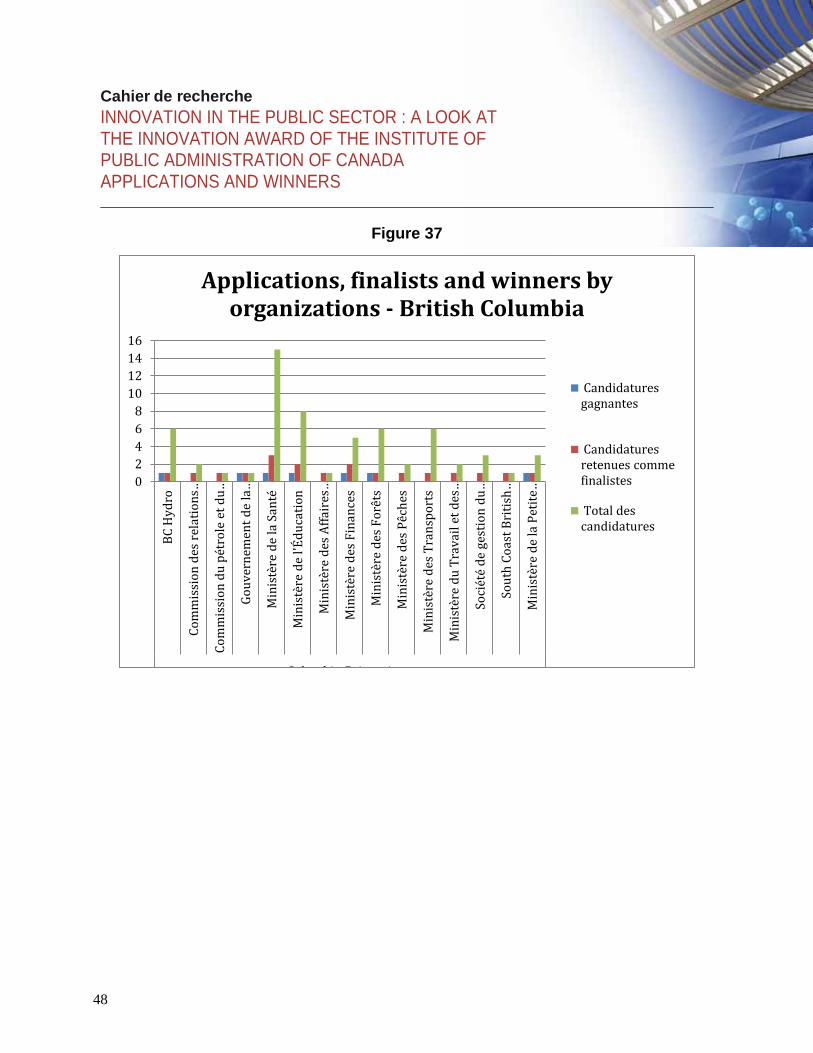
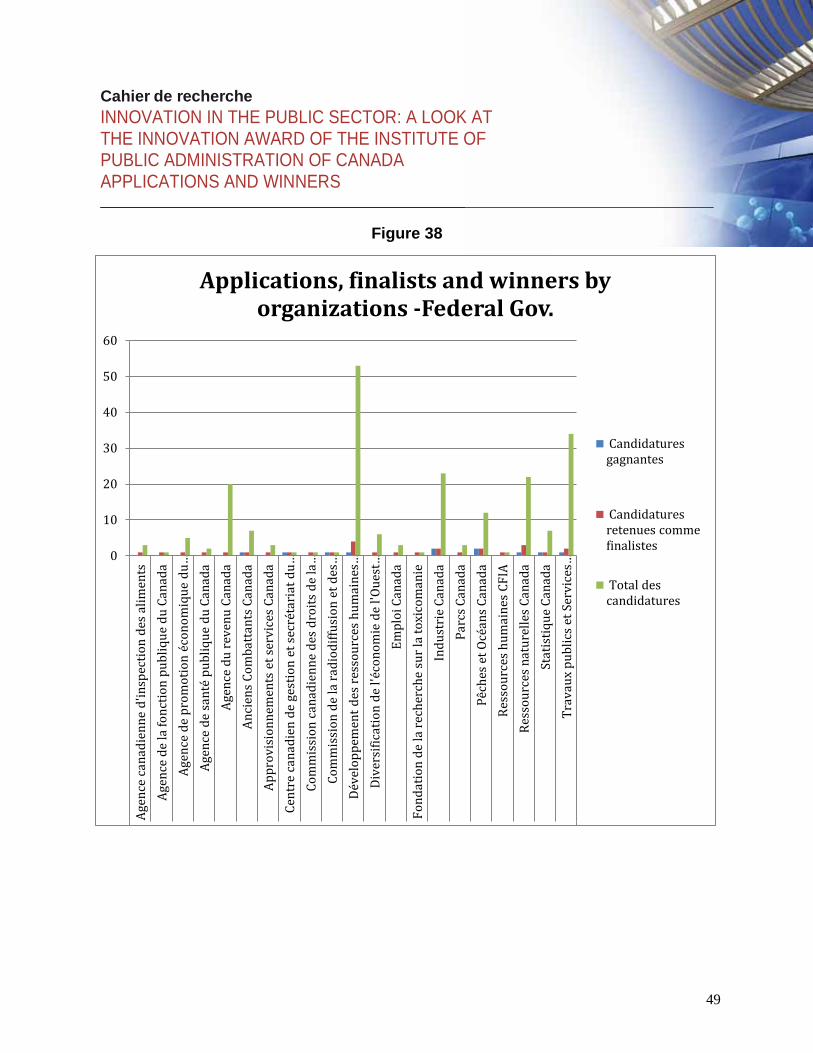
The next figures (36, 37 and 38) look at organizations from BC, the federal government and
Ontario. For the federal government, as mentioned previously in the paper, the Department of
Human Resources Development has applied quite often but have not won much. It would be
interesting to do a case study there to see why they consider themselves innovative while the
panel for the award does not seem to think so. In Ontario, the Ministry of Economic Development
appears at the fifth rank for the number of applications but has won more of the than the other
departments. They won four times with their last application in 2002. As the Natural Resources

Cahier de recherche INNOVATION IN THE PUBLIC SECTOR : A LOOK AT THE INNOVATION AWARD OF THE INSTITUTE OF PUBLIC ADMINISTRATION OF CANADA APPLICATIONS AND WINNERS
16
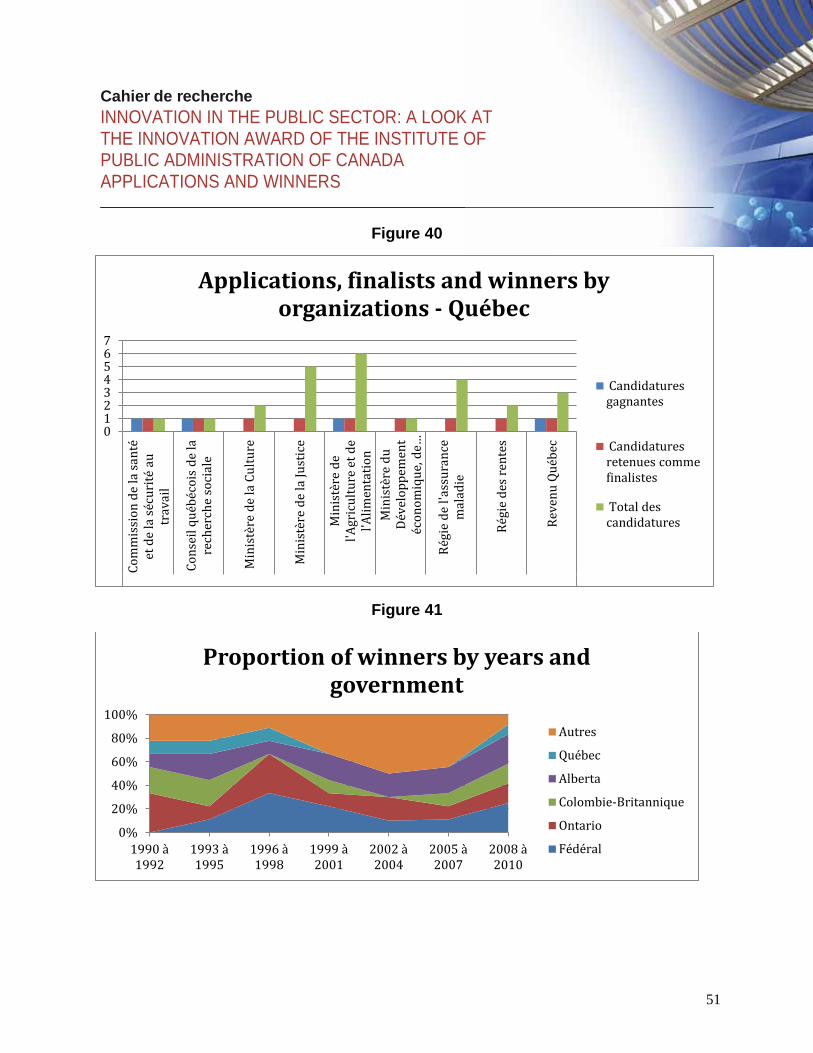
Dept case illustrates, it is not because you apply often than you win. Figure 39 for Quebec tells
the same story. Some organizations have applied once and won.
On Figure 40, if we look over the years at the winners, we get that Quebec has disappeared for
five years around 2000 while Alberta and Ontario have been more stable. It is interesting to note
that the best years both in Ottawa and Toronto where the second half of the 1990s. Alberta has
maintained its rate over both decades and appears the stable winner.

Cahier de recherche INNOVATION IN THE PUBLIC SECTOR: A LOOK AT THE INNOVATION AWARD OF THE INSTITUTE OF PUBLIC ADMINISTRATION OF CANADA APPLICATIONS AND WINNERS
17
Conclusion
As we have noted throughout this text, the data must be interpreted with caution. For example the
political evolution of most provinces can only be interpreted very carefully. We believe however
that there are some noteworthy points in the data we have presented. We also analyzed variables
that are not presented here because the results appeared inconclusive. For example, do
governments innovate more when the population is increasing and they have to cope with
growing needs? There was no observable relationship for any of the governments. It would
appear, however, that these applications move in cycles. Applications were received from all the
spheres in which the public administration is involved. Also, although we have correlation
analyses of the data, we have yet to develop a model of what explains applications and winners.
We believe the relationship between a government’s economic circumstances and its efforts to
innovate merits further attention. When we are in a position to make the database public, you may
find other points of interest and you will be able to add variables that you consider relevant. For
example, we have not yet looked at the link between government deficits and innovation, but we
plan to do so. Much more extensive statistical analyses will have to be performed in order to
investigate the impact of the various variables we have discussed.
We believe that applying for prizes such as the innovation award is a way to give credit to the
work of government organizations at a time of budget cutting, retirements and a certain cynicism
about the public sector: « to publicize examples of creative problem-solving and accomplishment
in the public service as a means of changing public attitudes towards the public service; and to
disseminate information about, and thus encourage replication of, the best practices in the public
service. » Borins (2000:326). Studies such as IPAC’s “Citizens First” survey show that the public
is satisfied with the work of the public sector, but the good news is not widely publicized. That
was done in Ontario, according to our interviews with Ontario public servants, including the
official who was responsible for administrative reform in the 1990s.
Cahier de recherche INNOVATION IN THE PUBLIC SECTOR : A LOOK AT THE INNOVATION AWARD OF THE INSTITUTE OF PUBLIC ADMINISTRATION OF CANADA APPLICATIONS AND WINNERS
18
While the main reason for applying for an award of this type may be to win recognition for a job
well done, it can also serve another purpose: publicizing innovations that deserve to be emulated
(Hartley & Downe, 2007). Knowing that an innovation has been successful in another branch of
the administration can spur public servants to follow suit. The applications for these awards are,
in and of themselves, a study of best practices in public administration (Borins, 2008).
Furthermore, that fact that applications must be authorized by a senior official constitutes a
certain institutionalization of the application process. The number of awards given to recognize
the work of civil servants has increased and also the organization of governments to apply and
hopefully win these awards. Over the 1990s in Canadian public administrations, secretariats have
been established to manage the activity and coordinators exist in some departments (Borins,
2000:322).
The purpose of this paper is to cast a first look at the applications for these awards. The awards
have come with the reforms of the new public management and could be seen as part of them
(Borins, 2000:322-323). Public administration used to suffer from theoretical malnutrition
(Denhardt, 1984; Savoie, 1999). Studies on innovation in the public sector are now proliferating.
A small portion of these publications deals with innovation awards that have been introduced to
recognize innovative administrations.
We suggest framing the future analysis of this databank in an institutionalist perspective. Such a
perspective would allow drawing generalizations that are not existent in the current literature on
the implications of innovation. An important element about research on innovation in the public
sector is how innovations become institutionalized. This will be an important addition to the
analysis of the winning cases that will follow this presentation of the applications. May be the
proper way to understand innovation in the public sector is to move back and forth from a data
bank to case studies. What do these innovations become five or ten years after receiving the
award? Little attention has been given to issues related to reconciling innovation and traditional
control concerns. The reminder of this paper is to suggest a theoretical argument on how
innovations are developed within the public sector by entrepreneurs and become institutionalized.

Cahier de recherche INNOVATION IN THE PUBLIC SECTOR: A LOOK AT THE INNOVATION AWARD OF THE INSTITUTE OF PUBLIC ADMINISTRATION OF CANADA APPLICATIONS AND WINNERS
19
In the contemporary public sector, innovations are introduced by entrepreneurs who are often far
removed from the top of the pyramid (Borins, 1998; Riccucci 1995; Bernier and Hafsi, 2007).
One of the elements in the process of the innovation award in Canada is to get the approval of the
deputy-minister in order to apply for the award. It is a first step toward institutionalisation. It is
also a judgement that an application is not an innovation only for the applicant but for the top of
his or her hierarchy. These, which are often designed to deliver better service to the public,
disturb the established system of governance. If the innovations eventually become entrenched, it
is because either they are embraced by citizens or have demonstrated their superiority over old
models. Governments must then legislate or change their policies to institutionalize the
innovations.
Institutional entrepreneurship “represents the activities of actors who have an interest in particular
institutional arrangements and who leverage resources to create new institutions or to transform
existing ones” (Maguire et al., 2004). Institutional entrepreneurs launch projects, develop new
organizational forms and institutionalize new fields by borrowing practices from other fields
(Mutch, 2007). In an already-built environment, they manage to create manoeuvring room from
themselves and to innovate (Leca and Naccache, 2006; Greenwood and Suddaby, 2006). For
innovations to become institutionalized, entrepreneurs must win acceptance for them in their
environment (Wijen and Ansari, 2007). If the innovations are in line with the government’s
general strategy, this should be relatively easy. On the other hand, if they go against the grain in
any way, more political capital will be required. It would be interesting to study the process by
which entrepreneurial innovations come to be accepted, become institutionalized and are
absorbed into the state fabric. And so far, the observed limited impact of the socio-economic and
political factors push to believe that the entrepreneurship of civil servants is behind the
application to these awards.

Cahier de recherche INNOVATION IN THE PUBLIC SECTOR: A LOOK AT THE INNOVATION AWARD OF THE INSTITUTE OF PUBLIC ADMINISTRATION OF CANADA APPLICATIONS AND WINNERS
21
References
BERNIER, Luc (1998). « L’impact des partis politiques sur la création d’entreprises publiques » dans Jean Crête et al., Politiques provinciales comparées, Québec: PUL, pages 315-333.
BERNIER, Luc (2002). « Équipe Canada Inc », dans Jacques Bourgault, directeur, Horizontalité et gestion publique, Québec: PUQ, pages 101-112.
BERNIER, Luc and Taïeb Hafsi (2007). « The Changing Nature of Public Entrepreneurship », Public Administation Review, vol. 67, no 3, pages 488-503.
BERNIER, Luc et Sébastien Angers (2010). « Le nouveau management public », dans Stéphane Paquin, Stéphane et al., L’analyse des politiques publiques, Montréal: PUM, pages 229-254.
BORINS, Sandford (1995). « The New Public Management is Here to Stay », Canadian Public Administration, vol. 38, no 1, pages 122-132.
BORINS, Sandford (1995). « A Last Word », Canadian Public Administration, Canada, vol. 38, no 1, pages 137-138.
BORINS, Sandford. (1998). Innovating with Integrity: How Local Heroes are Transforming American Government, Washington, D.C., Georgetown University Press.
BORINS, Sandford (2000). « Public-Service Awards Programs: An Exploratory Analysis, Canadian Public Administration, vol. 43, pages 321-342.
BORINS, Sandford, ed. (2008). Innovations in Government, Washington, DC: Brookings Institution.
DENHARDT, Robert B. (1984). Theories of Public Administration, Monterey: Brooks/Cole.
DUNLEAVY, Patrick, Helen Margetts, Simon Bastow and Jane Tinkler (2006). « New Public Management is Dead – Long Live Digital-Era Governance », Journal of Public Administration Research and Theory, Royaume-Uni, vol. 16, no 3, pages 467-494.
EPANECHNIKOV, V.A. “Nonparametric Estimation of a Multidimensional Probability Density”, Teor. Veroyatnost. i Primenen., 14:1 (1969), 156–161.
GREENWOOD, Royston and Roy Suddaby (2006). « Institutional Entrepreneurship in Mature Fields: The Big Five Accounting Firms », Academy of Management Journal, vol. 49, pages 27-48.
Cahier de recherche INNOVATION IN THE PUBLIC SECTOR : A LOOK AT THE INNOVATION AWARD OF THE INSTITUTE OF PUBLIC ADMINISTRATION OF CANADA APPLICATIONS AND WINNERS
22
HARTLEY, Jean and James Downe (2007), « The Shining Lights? Public Service Awards as an Approach to Service Improvement », Public Administration, vol. 85, no 2, pages 329-353.
LECA, Bernard and Philippe Naccache (2006). « A Critical Realist Approach to Institutional Entrepreneurship », Organization, vol. 13, p. 627-651.
MAGUIRE, Steve, Cynthia Hardy and Thomas B. Lawrence (2004). « Institutional Entrepreneurship in Emerging Fields: HIV/AIDS Treatment Advocacy in Canada », Academy of Management Journal, vol. 47, pages 657-679.
METCALFE, Les (1993). « Conviction Politics and Dynamic Conservatism: Mrs Thatcher’s Managerial Revolution », International Political Science Review, vol. 14, no 4, pages 351-371.
MORRIS, M.M. and F.F. Jones (1999). « Entrepreneurship in Established Organizations: The Case of the Public Sector », Entrepreneurship Theory and Practice, vol. 24, no 1, pages 71-91.
MUTCH, Alistair (2007). « Reflexivity and the Institutional Entrepreneur: A Historical Exploration », Organisation Studies, vol. 28, pages 1123-1140.
OSBORNE, David and Gaebler, Ted (1992). Reinventing Government: How the Entrepreneurial Spirit is Transforming the Public Sector From Schoolhouse to State House, Reading, Mass, Addison-Wesley.
OSBORNE, Stephen P. and Kerry Brown (2005). Managing Change and Innovation in Public Service Organization, Londres: Routledge.
RICCUCCI, Norma. M. (1995). Unsung Heroes: Federal Execucrats Making a Difference, Washington D.C., Georgetown University Press, 251 p.
SAVOIE, Donald J. (1995). « What is Wrong with the New Public Management? », Canadian Public Administration, vol. 38, no 1, pages 112-121.
SAVOIE, Donald J. (1995). « Just Another Voice from the Pulpit », Canadian Public Administration, vol. 38, no 1, pages 133-136.
SAVOIE, Donald (1999). Governing from the Center, University of Toronto Press.
SEIDLE, F. Leslie (1995). Rethinking the Delivery of Services to Citizens, Montréal: IRPP.
WIJEN, Frank and S. Ansari (2007). « Overcoming Inaction trough Collective Institutional Entrepreneurship: Insights from Regime Theory », Organisation Studies, vol. 28, pages 1079-1100.
Cahier de recherche INNOVATION IN THE PUBLIC SECTOR: A LOOK AT THE INNOVATION AWARD OF THE INSTITUTE OF PUBLIC ADMINISTRATION OF CANADA APPLICATIONS AND WINNERS
23
Figure 1
0
100
200
300
400
500
600
Total des innovations
Distribution des innovations au Canada Fédéral
Ontario
Colombie-Britannique
Alberta
Québec
Saskatchewan
Manitoba
Nouvelle-Écosse
Terre-Neuve et Labrador Nouveau-Brunswick
Île-du-Prince-Édouard
Territoire du Nord-Ouest Yukon
Nunavut

Cahier de recherche INNOVATION IN THE PUBLIC SECTOR : A LOOK AT THE INNOVATION AWARD OF THE INSTITUTE OF PUBLIC ADMINISTRATION OF CANADA APPLICATIONS AND WINNERS
24
Figure 2
0 20 40 60 80
100 120 140 160 180
1989
1990
1991
1992
1993
1994
1995
1996
1997
1998
1999
2000
2001
2002
2003
2004
2005
2006
2007
2008
2009
Évolution du total des innovations entre 1989-2009
Cahier de recherche INNOVATION IN THE PUBLIC SECTOR: A LOOK AT THE INNOVATION AWARD OF THE INSTITUTE OF PUBLIC ADMINISTRATION OF CANADA APPLICATIONS AND WINNERS
25
Figure 3
Figure 4
0 10 20 30 40 50 60 70 80 90
100
1989
19
90
1991
19
92
1993
19
94
1995
19
96
1997
19
98
1999
20
00
2001
20
02
2003
20
04
2005
20
06
2007
20
08
2009
Comparaison du nombre d'innovations au fédéral et dans les 4 provinces les
plus innovantes
Fédéral
Ontario
Colombie-Britannique
Québec
Alberta
0,00% 10,00% 20,00% 30,00% 40,00% 50,00% 60,00% 70,00% 80,00% 90,00%
1989
19
90
1991
19
92
1993
19
94
1995
19
96
1997
19
98
1999
20
00
2001
20
02
2003
20
04
2005
20
06
2007
20
08
2009
Pourcentage des candidatures remises selon l'année
Fédéral
Ontario
Colombie-Britannique
Québec
Alberta
Cahier de recherche INNOVATION IN THE PUBLIC SECTOR : A LOOK AT THE INNOVATION AWARD OF THE INSTITUTE OF PUBLIC ADMINISTRATION OF CANADA APPLICATIONS AND WINNERS
26
Figure 5
Figure 6
0
10
20
30
40
50
60
Nombre d'innovations - Fédéral
0
2
4
6
8
10
12
Nombre d'innovations - Alberta
Cahier de recherche INNOVATION IN THE PUBLIC SECTOR: A LOOK AT THE INNOVATION AWARD OF THE INSTITUTE OF PUBLIC ADMINISTRATION OF CANADA APPLICATIONS AND WINNERS
27
Figure 7
Figure 8
0
5
10
15
20
Nombre d'innovations - Colombie-Britannique
0 5
10 15 20 25 30 35 40 45
Nombre d'innovations - Ontario
Cahier de recherche INNOVATION IN THE PUBLIC SECTOR : A LOOK AT THE INNOVATION AWARD OF THE INSTITUTE OF PUBLIC ADMINISTRATION OF CANADA APPLICATIONS AND WINNERS
28
Figure 9
Figure 10
0 1 2 3 4 5 6 7 8 9
Nombre d'innovations - Québec
0 1 2 3 4 5 6 7
Nombre d'innovations - Manitoba
Cahier de recherche INNOVATION IN THE PUBLIC SECTOR: A LOOK AT THE INNOVATION AWARD OF THE INSTITUTE OF PUBLIC ADMINISTRATION OF CANADA APPLICATIONS AND WINNERS
29
Figure 11
Année Thème 1990 Le service au public 1991 La délégation de pouvoirs 1992 Gestion et partenariat 1993 Faire mieux avec moins 1994 Remodeler le gouvernement 1995 Réussir la diversité 1996 Maîtriser le changement 1997 Rapprocher l'État et le citoyen : des façons inédites 1998 Faire les choses autrement 1999 À la recherche du rendement efficace : mesure et reconnaissance 2000 La collaboration : les nouvelles approches en politique et gestion 2001 Développer la fonction publique de demain 2002 Ouvert sur l'extérieur : transformer le gouvernement pour répondre aux attentes
des clients 2003 À la page : gérer le changement 2004 À l’encontre de la gravité : la collaboration horizontale 2005 Fonction publique sans frontières 2006 Partager la gouvernance : citoyens, partenaires, réseaux 2007 La nouvelle percée technologique des services 2008 Gérer le milieu de travail Vert / Innovations en écologisation 2009 Redressement 2010 La collaboration à l’œuvre

Cahier de recherche INNOVATION IN THE PUBLIC SECTOR : A LOOK AT THE INNOVATION AWARD OF THE INSTITUTE OF PUBLIC ADMINISTRATION OF CANADA APPLICATIONS AND WINNERS
30
Figure 12
*Les courbes de tendance sont des courbes de régression locale utilisant la méthode d’Epanechnikov (1969).
Cahier de recherche INNOVATION IN THE PUBLIC SECTOR: A LOOK AT THE INNOVATION AWARD OF THE INSTITUTE OF PUBLIC ADMINISTRATION OF CANADA APPLICATIONS AND WINNERS
31
Figure 13

Cahier de recherche INNOVATION IN THE PUBLIC SECTOR : A LOOK AT THE INNOVATION AWARD OF THE INSTITUTE OF PUBLIC ADMINISTRATION OF CANADA APPLICATIONS AND WINNERS
32
Figure 14
Cahier de recherche INNOVATION IN THE PUBLIC SECTOR: A LOOK AT THE INNOVATION AWARD OF THE INSTITUTE OF PUBLIC ADMINISTRATION OF CANADA APPLICATIONS AND WINNERS
33
Figure 15
Figure 16
0,00 1,00 2,00 3,00 4,00 5,00 6,00 7,00
1 2 3 4 5 1 2
PL PQ
Québec
Moyenne d'innovations par année par partis politiques et mandat - Québec
0,00 1,00 2,00 3,00 4,00 5,00 6,00 7,00
6 7 8 9 10 11
PC
Alberta
Moyenne d'innovations par année par partis politiques et mandat - Alberta

Cahier de recherche INNOVATION IN THE PUBLIC SECTOR : A LOOK AT THE INNOVATION AWARD OF THE INSTITUTE OF PUBLIC ADMINISTRATION OF CANADA APPLICATIONS AND WINNERS
34
Figure 17
Figure 18
0,00 2,00 4,00 6,00 8,00
10,00 12,00
4 1 2 1 2 3
CS NPD PL
Colombie-Britannique
Moyenne d'innovations par année par partis politiques et mandat - Colombie-
Britannique
0,00 5,00
10,00 15,00 20,00 25,00 30,00
1 1 2 1 2
NPD PC PL
Ontario
Moyenne d'innovations par année par partis politiques et mandat - Ontario

Cahier de recherche INNOVATION IN THE PUBLIC SECTOR: A LOOK AT THE INNOVATION AWARD OF THE INSTITUTE OF PUBLIC ADMINISTRATION OF CANADA APPLICATIONS AND WINNERS
35
Figure 19
Figure 20
0,00 5,00
10,00 15,00 20,00 25,00 30,00 35,00
2 1 2 3 4 1 2
PPC PLC PCC
Fédéral
Moyenne d'innovations par année par partis politiques et mandat - Fédéral
0,00
5,00
10,00
15,00
20,00
25,00
30,00
PC CS NPD PL PCC PLC PPC NPD PC NPD PC PL PL PQ NPD PC SP
Alberta Colombie-Britannique Fédéral Manitoba Ontario Québec Saskatchewan
Moyenne d'innovations par année par parti politique par province
Cahier de recherche INNOVATION IN THE PUBLIC SECTOR : A LOOK AT THE INNOVATION AWARD OF THE INSTITUTE OF PUBLIC ADMINISTRATION OF CANADA APPLICATIONS AND WINNERS
36
Figure 21
Figure 22
0,00 5,00
10,00 15,00 20,00 25,00 30,00
Jean
Chr
étie
n Br
ian
Mul
rone
y St
ephe
n H
arpe
r Pa
ul M
artin
Bo
b Ra
e M
ike
Har
ris
Davi
d Pe
ters
on
Dalto
n M
cGui
nty
Rita
John
son
Ujja
l Dos
anjh
Gl
en C
lark
Bi
ll Va
nder
Zal
m
Gord
on C
ampb
ell
Mik
e H
arco
urt
Don
Gett
y Ra
lph
Klei
n Ed
Ste
lmac
h Da
niel
John
son
Robe
rt B
oura
ssa
Bern
ard
Land
ry
Jean
Cha
rest
Lu
cien
Bou
char
d Ja
cque
s Par
izea
u
Fédéral Ontario Colombie-Britannique Alberta Québec
Nombre moyen d'innovations par année par Premier ministre - Alberta, C.-B.,
Ontario et Québec
0
5
10
15
20
25
30
35
Majoritaire PLC Majoritaire PPC Minoritaire PCC Minoritaire PLC
Innovations par année selon le type de gouvernement - Partis fédéraux
Cahier de recherche INNOVATION IN THE PUBLIC SECTOR: A LOOK AT THE INNOVATION AWARD OF THE INSTITUTE OF PUBLIC ADMINISTRATION OF CANADA APPLICATIONS AND WINNERS
37
Figure 23
Figure 24
0
1
2
3
4
5
6
7
Majoritaire Minoritaire
Innovations par année selon le type de gouvernement
provincial
0
5
10
15
20
25
30
Majoritaire Minoritaire
Innovations par année selon le type de gouvernement
fédéral
0 5
10 15 20 25 30 35 40 45
1990
19
91
1992
19
93
1994
19
95
1996
19
97
1998
19
99
2000
20
01
2002
20
03
2004
20
05
2006
20
07
2008
20
09
2010
DP Bob Rae Mike Harris Dalton McGuinty
Ontario
Total des innovations par P-M - Ontario
NPD - 1
PC - 1
PC - 2
PL - 1
PL - 2
Cahier de recherche INNOVATION IN THE PUBLIC SECTOR : A LOOK AT THE INNOVATION AWARD OF THE INSTITUTE OF PUBLIC ADMINISTRATION OF CANADA APPLICATIONS AND WINNERS
38
Figure 25
0
10
20
30
40
50
60
1990
19
91
1992
19
93
1994
19
95
1996
19
97
1998
19
99
2000
20
01
2002
20
03
2004
20
05
2006
20
07
2008
20
09
2010
Brian Mulroney Jean Chrétien Paul Martin
Stephen Harper
Fédéral
Total des innovations par P-M - Fédéral
PCC - 1
PCC - 2
PLC - 1
PLC - 2
PLC - 3
PLC - 4
PPC - 2

Cahier de recherche INNOVATION IN THE PUBLIC SECTOR: A LOOK AT THE INNOVATION AWARD OF THE INSTITUTE OF PUBLIC ADMINISTRATION OF CANADA APPLICATIONS AND WINNERS
39
Figure 26
0,00
5,00
10,00
15,00
20,00
25,00
30,00
Innovations annuelles en relation avec les élections
Innovations les années précédant une élection Innovations les années suivant une élection Innovations les autres années

Cahier de recherche INNOVATION IN THE PUBLIC SECTOR : A LOOK AT THE INNOVATION AWARD OF THE INSTITUTE OF PUBLIC ADMINISTRATION OF CANADA APPLICATIONS AND WINNERS
40
Figure 27
20
4
13
7 11
27
53
24 23
5
11
22 17 15 13
34
0
10
20
30
40
50
60
Nom
bre
d'in
nov
atio
ns
Organisations fédérales
Organisations les plus innovantes du gouvernement fédéral
Cahier de recherche INNOVATION IN THE PUBLIC SECTOR: A LOOK AT THE INNOVATION AWARD OF THE INSTITUTE OF PUBLIC ADMINISTRATION OF CANADA APPLICATIONS AND WINNERS
41
Figure 28
Année
Affaires étrangères et
Commerce international
Canada
Agence du revenu Canada
Défense nationale
Développement des ressources
humaines Canada
Environnement Canada
Industrie Canada
Ressources naturelles
Canada
Travaux publics et Services
gouvernementaux Canada
1990 0 0 0 0 1 1 1 01991 0 1 0 0 0 2 1 41992 1 1 0 0 7 1 1 01993 0 1 1 1 2 0 1 21994 0 0 1 2 4 3 5 51995 0 2 5 0 3 0 1 11996 1 1 6 3 4 2 1 21997 0 4 1 8 0 2 1 01998 0 3 3 14 0 1 3 41999 1 0 0 4 0 0 0 52000 0 2 0 7 2 4 1 32001 0 0 5 3 0 0 1 02002 0 1 3 7 0 3 1 02003 0 2 0 1 1 0 0 12004 0 0 1 2 0 0 1 22005 0 1 0 0 0 0 0 02006 1 1 0 1 0 2 1 02007 0 0 0 0 0 1 0 02008 0 0 0 0 0 0 1 22009 0 0 0 0 0 0 0 32010 1 0 1 0 0 1 1 0Total 5 20 27 53 24 23 22 34
Nombre d'innovations - Ministères fédéraux

Cahier de recherche INNOVATION IN THE PUBLIC SECTOR : A LOOK AT THE INNOVATION AWARD OF THE INSTITUTE OF PUBLIC ADMINISTRATION OF CANADA APPLICATIONS AND WINNERS
42
Figure 29
AnnéeMinistère des
Ressources naturelles
Ministère des Transports
Secrétariat du conseil de
gestion
Ministère du Développement économique et du Commerce
Ministère de la Santé et des
soins de longues durées
Ministère de l'Agriculture et
de l'Alimentation
Ministère de la Sécurité
communautaire et des Services correctionnels
1990 0 0 0 2 1 0 01991 4 1 0 0 1 1 01992 16 0 1 2 0 2 01993 7 0 2 1 1 8 01994 1 1 1 5 0 5 01995 0 2 0 0 2 0 51996 2 0 1 3 2 0 11997 0 2 2 2 0 0 01998 2 2 4 3 1 1 01999 0 0 2 0 3 0 02000 0 0 4 1 0 0 02001 1 1 5 2 0 0 02002 1 8 3 3 1 1 12003 0 5 0 0 2 0 02004 0 5 3 0 1 0 22005 0 3 0 0 0 0 02006 2 2 0 0 0 0 42007 0 0 0 0 1 0 12008 0 0 0 0 0 0 02009 3 0 0 0 6 0 12010 0 0 0 0 1 0 2Total 39 32 28 24 23 18 17
Nombre d'innovations - Ministères de l'Ontario
Cahier de recherche INNOVATION IN THE PUBLIC SECTOR: A LOOK AT THE INNOVATION AWARD OF THE INSTITUTE OF PUBLIC ADMINISTRATION OF CANADA APPLICATIONS AND WINNERS
43
Figure 30
0
20
40
60
80
100
120
Les types d'innovation des 4 provinces les plus innovatrices et du fédéral
Fédéral
Ontario
Colombie-Britannique
Alberta
Québec

Cahier de recherche INNOVATION IN THE PUBLIC SECTOR : A LOOK AT THE INNOVATION AWARD OF THE INSTITUTE OF PUBLIC ADMINISTRATION OF CANADA APPLICATIONS AND WINNERS
44
Figure 31
Année Gestion R.H. Stratégique Service Santé Ressources naturelles Transport Sécurité Social
1989 5 2 7 4 1 1 0 21990 8 0 3 2 10 3 3 51991 5 8 5 7 19 3 2 51992 9 11 10 4 7 2 5 11993 7 9 5 5 6 8 3 21994 16 8 6 2 1 3 5 41995 9 6 0 5 8 6 3 11996 9 11 4 2 4 6 2 31997 7 12 9 11 6 7 3 51998 4 5 5 5 0 1 1 11999 8 7 5 7 3 2 2 62000 12 7 8 5 8 2 1 42001 10 5 6 9 7 8 4 72002 3 3 3 7 2 7 5 32003 5 8 5 8 4 9 4 52004 6 0 3 6 4 4 7 22005 4 3 4 2 3 2 7 32006 2 4 4 3 4 0 1 12007 1 1 4 0 1 0 0 02008 7 3 10 11 3 4 9 42009 2 1 4 3 0 4 5 6Total 139 114 110 108 101 82 72 70
Cahier de recherche INNOVATION IN THE PUBLIC SECTOR: A LOOK AT THE INNOVATION AWARD OF THE INSTITUTE OF PUBLIC ADMINISTRATION OF CANADA APPLICATIONS AND WINNERS
45
Figure 32
Figure 33
0 2 4 6 8
10 12 14 16 18 20
1989
19
90
1991
19
92
1993
19
94
1995
19
96
1997
19
98
1999
20
00
2001
20
02
2003
20
04
2005
20
06
2007
20
08
2009
Secteurs d'innovations selon les années
Gestion R.H.
Stratégique
Service
Santé
Ressources naturelles
Transport
Sécurité
Social
0
2
4
6
8
10
12
14
16
18
20
1989
19
90
1991
19
92
1993
19
94
1995
19
96
1997
19
98
1999
20
00
2001
20
02
2003
20
04
2005
20
06
2007
20
08
2009
Secteurs d'innovations selon les années
Gestion R.H.
Stratégique
Service
Santé
Ressources naturelles

Cahier de recherche INNOVATION IN THE PUBLIC SECTOR : A LOOK AT THE INNOVATION AWARD OF THE INSTITUTE OF PUBLIC ADMINISTRATION OF CANADA APPLICATIONS AND WINNERS
46
Figure 34
Figure 35
0,00% 10,00% 20,00% 30,00%
Fédéral
Ontario
Colombie-Britannique
Alberta
Québec
Distribution by province of applications, finalists and winners Pourcentage du
total des candidatures
Pourcentage des finalistes apartenant à chaque province
Pourcentage des gagnants apartenant à chaque province
0,00 1,00 2,00 3,00 4,00
Fédéral Ontario
Colombie-… Alberta Québec
Saskatchewan Manitoba
Efficacy by provinceprovince Efficacité pour les finalistes (% de finalistes / % des candidatures)
Efficacité (% de gagnants / % des candidatures)

Cahier de recherche INNOVATION IN THE PUBLIC SECTOR: A LOOK AT THE INNOVATION AWARD OF THE INSTITUTE OF PUBLIC ADMINISTRATION OF CANADA APPLICATIONS AND WINNERS
47
Figure 36
0 1 2 3 4 5 6 7 8 9
10
Bure
au d
e l'a
dmin
istr
atio
n …
Cons
eil d
es so
us-m
inis
tres
Cons
eil d
u tr
ésor
Déve
lopp
emen
t …
Min
istè
re d
e l'A
gric
ultu
re e
t …
Min
istè
re d
es re
latio
ns a
vec …
Min
istè
re d
es T
rans
port
s
Min
istè
re d
u lo
gem
ent e
t des
…
Ress
ourc
es h
umai
nes
et …
Syne
rgie
Alb
erta
Trav
aux
publ
ics
Com
mis
sion
…
Solli
cite
ur g
énér
al
Alberta
Applications, finalists and winners by organizations - Alberta
Candidatures gagnantes
Candidatures retenues comme finalistes
Total des candidatures
Cahier de recherche INNOVATION IN THE PUBLIC SECTOR : A LOOK AT THE INNOVATION AWARD OF THE INSTITUTE OF PUBLIC ADMINISTRATION OF CANADA APPLICATIONS AND WINNERS
48
Figure 37
0 2 4 6 8
10 12 14 16
BC H
ydro
Com
mis
sion
des
rela
tions
…
Com
mis
sion
du
pétr
ole
et d
u …
Gouv
erne
men
t de
la …
Min
istè
re d
e la
San
té
Min
istè
re d
e l'É
duca
tion
Min
istè
re d
es A
ffair
es …
Min
istè
re d
es F
inan
ces
Min
istè
re d
es F
orêt
s
Min
istè
re d
es P
êche
s
Min
istè
re d
es T
rans
port
s
Min
istè
re d
u Tr
avai
l et d
es …
Soci
été
de g
estio
n du
…
Sout
h Co
ast B
ritis
h …
Min
istè
re d
e la
Pet
ite …
C l bi B i i
Applications, finalists and winners by organizations - British Columbia
Candidatures gagnantes
Candidatures retenues comme finalistes
Total des candidatures
Cahier de recherche INNOVATION IN THE PUBLIC SECTOR: A LOOK AT THE INNOVATION AWARD OF THE INSTITUTE OF PUBLIC ADMINISTRATION OF CANADA APPLICATIONS AND WINNERS
49
Figure 38
0
10
20
30
40
50
60
Agen
ce c
anad
ienn
e d'
insp
ectio
n de
s alim
ents
Ag
ence
de
la fo
nctio
n pu
bliq
ue d
u Ca
nada
Ag
ence
de
prom
otio
n éc
onom
ique
du …
Ag
ence
de
sant
é pu
bliq
ue d
u Ca
nada
Ag
ence
du
reve
nu C
anad
a An
cien
s Com
batt
ants
Can
ada
Appr
ovis
ionn
emen
ts e
t ser
vice
s Ca
nada
Ce
ntre
can
adie
n de
ges
tion
et se
crét
aria
t du …
Co
mm
issi
on c
anad
ienn
e de
s dr
oits
de
la …
Co
mm
issi
on d
e la
radi
odiff
usio
n et
des
…
Déve
lopp
emen
t des
ress
ourc
es h
umai
nes …
Di
vers
ifica
tion
de l'
écon
omie
de
l'Oue
st …
Em
ploi
Can
ada
Fond
atio
n de
la re
cher
che
sur l
a to
xico
man
ie
Indu
stri
e Ca
nada
Pa
rcs C
anad
a Pê
ches
et O
céan
s Can
ada
Ress
ourc
es h
umai
nes
CFIA
Re
ssou
rces
nat
urel
les
Cana
da
Stat
istiq
ue C
anad
a Tr
avau
x pu
blic
s et S
ervi
ces …
Applications, finalists and winners by organizations -Federal Gov.
Candidatures gagnantes
Candidatures retenues comme finalistes
Total des candidatures

Cahier de recherche INNOVATION IN THE PUBLIC SECTOR : A LOOK AT THE INNOVATION AWARD OF THE INSTITUTE OF PUBLIC ADMINISTRATION OF CANADA APPLICATIONS AND WINNERS
50
Figure 39
0 5
10 15 20 25 30 35 40
Actio
n ca
ncer
Ont
ario
Fonc
tion
publ
ique
de
l'Ont
ario
Fond
atio
n de
la re
cher
che
sur …
Min
istè
re d
e la
San
té e
t des
…
Min
istè
re d
e la
Séc
urité
…
Min
istè
re d
e l'É
duca
tion
Min
istè
re d
e l'E
nvir
onne
men
t
Min
istè
re d
es A
ffair
es c
iviq
ues
Min
istè
re d
es A
ffair
es …
Min
istè
re d
es R
esso
urce
s …
Min
istè
re d
es S
ervi
ces
aux …
Min
istè
re d
es S
ervi
ces
soci
aux …
Min
istè
re d
es T
rans
port
s
Min
istè
re d
u Dé
velo
ppem
ent …
Min
istè
re d
u Re
venu
Offic
e de
s affa
ires
fran
coph
ones
Secr
étar
iat d
u co
nsei
l de
gest
ion
Min
istè
re d
e l'É
nerg
ie e
t des
…
Applications, finalists and winners by organizations - Ontario
Candidatures gagnantes
Candidatures retenues comme finalistes
Total des candidatures
Cahier de recherche INNOVATION IN THE PUBLIC SECTOR: A LOOK AT THE INNOVATION AWARD OF THE INSTITUTE OF PUBLIC ADMINISTRATION OF CANADA APPLICATIONS AND WINNERS
51
Figure 40
Figure 41
0 1 2 3 4 5 6 7
Com
mis
sion
de
la sa
nté
et d
e la
sécu
rité
au
trav
ail
Cons
eil q
uébé
cois
de
la
rech
erch
e so
cial
e
Min
istè
re d
e la
Cul
ture
Min
istè
re d
e la
Just
ice
Min
istè
re d
e l'A
gric
ultu
re e
t de
l'Alim
enta
tion
Min
istè
re d
u Dé
velo
ppem
ent
écon
omiq
ue, d
e …
Régi
e de
l'as
sura
nce
mal
adie
Régi
e de
s ren
tes
Reve
nu Q
uébe
c
Q éb
Applications, finalists and winners by organizations - Québec
Candidatures gagnantes
Candidatures retenues comme finalistes
Total des candidatures
0%
20%
40%
60%
80%
100%
1990 à 1992
1993 à 1995
1996 à 1998
1999 à 2001
2002 à 2004
2005 à 2007
2008 à 2010
Proportion of winners by years and government
Autres
Québec
Alberta
Colombie-Britannique
Ontario
Fédéral