innovations in mature adult learning imal · the ^innovations in mature adult learning imal...
TRANSCRIPT

1
F a c e b o o k I M A L - I n n o v a t i o n i n M a t u r e A d u l t L e a r n i n g
2015
Innovations in Mature
Adult Learning – IMAL
Report 1
MOTIVATING FOR ACTION:
WHAT MAKES MATURE ADULTS WANT TO LEARN?
Report 2
BOOK OF BEST PRACTICES:
THE BEST METHODS OF WORKING WITH MATURE ADULTS
IMAL PARTNERS
LIFELONG LEARNING: GRUNDTVIG LEARNING PARTNERSHIP

2
Information about this project is available at https://www.facebook.com/IMALproject?ref=hl
Disclaimer
This publication is a product of the ‘Innovations in Mature Adult Learning’ project - GRUNDTVIG
Lifelong Learning Programme, which is funded by the European Commission. The sole
responsibility for this publication lies with the authors. The Commission is not responsible for any
use that may be made for the information contained within.

3
Organisations participating in this partnership
Center for the Advancement of Women Foundation Poland
Randers Municipality Denmark
National Association of Social Workers Greece
Koçarli Halk Eğitimi Merkezi Turkey
Escuela De Turismo Universitaria De Zaragoza Spain
Associazione PER FORMARE Italy
Contributors and partner email contacts
Poland A. Jancewicz, D. Jaślan, A. Kostecka
email [email protected]
Denmark H. Bonde, L. Skjøtt, L. Pagter, T. Christensen
email [email protected]
Greece K. Koutra (PhD), E. Chronopoulou, I. Kirou, Ch. Katsapi
email [email protected]
Turkey E. Tunç, M. M. Soysal, B. Özsarıoğlu
email [email protected]
Spain T. Iniguez (PhD), C. Aznárez, L. Iñiguez (PhD), N. Guillén (PhD), A. Albesa, M.Pilar Latorre (PhD)
email [email protected]
Italy S.Rossi, M. Giampietro, A. Mittiga, F.Marcaletti (PhD).
email [email protected]

4
Executive summary
The “Innovations in Mature Adult Learning” IMAL Learning Partnership has focused on two objectives: (1) to find reasons behind low/relatively high participation of mature adults (MA, 45+) in the key domains of adult learning and education: literacy and basic skills; continuing training and professional development and (2) to identify the forms of education and learning – formal, non-formal and informal, alternative learning opportunities – that are most valued and meet the demands of individuals and communities. In order to achieve these objectives partners exchanged knowledge on learning patterns by agreeing on a set of aspects they wanted to investigate in each participating country and identified best practices in partner countries on engaging MAs in education and learning.
To grasp and specify reasons behind the MAs’ low/high level of interest and motivation toward learning partners explored a broad spectrum of country-specific factors: they conducted a DESK RESEARCH on data concerning life-long learning facts & figures, its' financing, pertinent legislation and macro-factors providing situational contexts for each of the participating countries. In addition, in reference to the desk research findings partners have run an extensive SURVEY (1026 respondents) based on issues arising from the collected information and discussions. REPORT I, “MOTIVATING FOR ACTION: WHAT MAKES THE MATURE ADULTS WANT TO LEARN?” presents that range of factors relevant for each partner country, that affect and condition older workers in their learning decisions, based both on the desk research results and the Survey.
REPORT II, “BOOK OF BEST PRACTICES: THE BEST METHODS OF WORKING WITH MATURE ADULTS” discusses methods and approaches that successfully motivate/ inspire/ invite Mature Adults to undertake the learning effort as identified by each partner in their own practice or as applied with success in their country. These methods present a set of approaches that can be used separately or in combination to achieve the motivational learning effect on MAs: by teaching (learners teach one another), by doing (immediate practical application in the learning setting), by experience (experiencing the effects of the learnt matter applicability by exposure to extramural setting) , by feeling (by recognizing the importance of feelings and emotion ),by self- reflection (empowerment by reference to ones’ own past experiences) and in the learning community (by creating a diverse/ multicultural/multi-age etc. learning environment). By drafting in broad lines these categories the IMAL project offers a systematization suggestion that requires further work and development. It’s main objective is to show the spectrum of the learner centered approaches as opposed to the standard class setting type of learning. Complementary to the above mentioned Best Practices the Report II describes two workshops that are meant to assist educators in (1) self-evaluation of their own teaching techniques and (2) in the innovative use of ICT in the teaching process. The descriptions of the above mentioned matter is collected in the Appendix.
In addition throughout the 2-year period partners have run a website constituting communication tool for the partnership and easily accessible source of information and knowledge for the public (www.seniorforce.eu). After completion of the project both Reports as well as the working materials that severed as a basis to prepare individual chapters have been made available on Facebook https://www.facebook.com/IMALproject, assuring access and created especially for extended dissemination purpose.

5
Contents
Report I Motivating for action: What makes mature adults want to learn?
Chapter 1 – The LLL of mature adults & their characteristics
1.1 Introduction 8
1.2 Define adult learning and lifelong learning settings 8
1.3 The lifelong learning and mature adults characteristics 9
1.4 Characteristics of mature Learners 9
1.5 Theories of adult learning 11
1.6 Barriers and motivations of mature adults learning 11
Chapter 2- Context based on countries’ macro factors
2.1 Denmark: macro factors of motivation on learning 15
2.2 Greece: macro factors of motivation on learning 17
2.3 Italy: macro factors of motivation on learning 20
2.4 Poland: economic macro factors VS adults’ learning motivations 22
2.5 Spain: macro factors of motivation on learning 29
2.6 Turkey: macro factors of motivation on learning 33
2.7 Macro factors: common traits and differences 35
Chapter 3- Facts & figures of partner countries LLL
3.1 Introduction 37
3.2 Educational status overview in partner countries 37
3.2.1. The level of education 37
3.2.2 Forms of learning 41
3.3 The educational offer for MAs in partner countries 42
3.4 The cost and financing MAs’ education. 44
3.4.1 Source of financing the training 44
3.4.2 Mean amount of money spent by participant on education and training
47
3.5 Factors motivating/conditioning MAs to undertake learning initiative 48

6
3.6 Factors for declining from /not undertaking continued education by MAs 51
Chapter 4 - Partnership research results on mature adults’ motivation to learn and training preferences
4.1 Aims of the survey 54
4.2 Methods and data collection 54
4.3 Data samples description 55
4.4 Descriptive analysis (mean scores) by country 58
4.5 Cluster analysis 67
4.6 National samples: descriptive analysis and cluster analysis results 75
Report II Book of best practices: the best methods of working with mature adults
Chapter 5 - Good practices and tools
5. 1. Introduction 84
5.2 The process of exchanging good practices and tools among partners 84
5.3 Positioning best practices collected by partners 88
5.4 Reusable methods and basic behaviours of facilitators learned from the Workshop ‘The impact of teacher’s personality on the effectiveness of education and students’ motivation to learn’
91
5.4.1 Introduction 91
5.4.2 Workshop 92
5.4.3 Quotes from the workshop evaluation sheet 93
5.5 Reusable methods and basic behaviours of facilitators learned from the
Workshop: ‘Learning through digital technologies’ 93
5.5.1 Introduction 93
5.5.2 Workshop 94
5.5.3 Quotes from partners 94
Chapter 6 - Conclusion
6. 1 Insights and suggested improvements for future actions 96
6.2 References 96
APPENDIX 104

7
F a c e b o o k I M A L - I n n o v a t i o n i n M a t u r e A d u l t L e a r n i n g
2015
Report 1
Motivating for action:
What makes the mature
adults want to learn?
IMAL PARTNERS
IMAL PARTNERS
LIFELONG LEARNING: GRUNDTVIG LEARNING PARTNERSHIP

8
Chapter 1: The lifelong learning of mature adults and their characteristics
1.1 Introduction
Europe is an ageing society. The aged population (50+) in Europe is increasing rapidly. Increased
life expectancy during the last half of the 20th century is believed to be higher than any increases
from recorded history until 1900 (Swain, 1995). These changing demographics have impacted on
continuous lifelong learning for adults as they imply that more men and women across Europe will
be asked to spend longer time at work.
Τhe situation becomes more complicated as the level and increasing participation of older
workers in education strongly differs among the EU member states. It is a significant concern for
all countries in the face of the need to extend working life in the context of the ageing workforce.
All member states of the European Union (EU) are currently involved in difficult decision-making
about the best way to deal with the fact that fewer people are active in work and there is a need
to support those in retirement. Governments, educational institutions and employers have
undertaken specific actions to encourage older workers to improve and update their education
levels in order to remain attractive to employers. This has met with varying levels of success. The
low interest in learning among older workers, especially those with a lower level of education, will
have negative consequences for their employment in the future. Thus, we need to strengthen
education and participation in learning that may prove crucial, especially for those older adults
who have low or no history engagement (Oliveira, 2013).
The notion of lifelong learning has to be a priority on the agenda of the EU as the experience and
data show that when all dimensions of the educational offer improves, it not only for benefits the
older workers but benefits countries as a whole. Chapter 1 of this section will briefly describe the
framework of mature adult learning and its characteristics, outlining the factors that affect success
and motivation.
1.2 Defining adult learning and lifelong learning settings
Learning is an act, a process, or an experience of gaining knowledge or skills. Lifelong learning is
the ‘ongoing, voluntary, and self-motivated’ pursuit of knowledge for either personal or
professional reasons. Therefore, it not only enhances social inclusion, active citizenship, and
personal development, but also self-sustainability, rather than competitiveness, and
employability. The mature learner is a social being who, in terms of learning, has to contend with
his/her own approach and also the social and societal environment to which he/she belongs
(Chao, 2009). Lifelong learning is seen as a holistic view of education and recognises learning from
different environments. It consists of two dimensions (Skolverket, 2000, p. 19):
1. Lifelong learning recognises that individuals learn throughout a lifetime, and
2. Life-wide learning is recognising the formal, non-formal and informal settings in which learning
takes place.

9
The Eurostat Classification of Learning Activities (CLA) defines formal education as ‘the education
provided in schools, colleges, universities and other formal educational institutions that normally
constitutes a continuous ‘ladder’ of full-time education for children and young people. In some
countries, the upper parts of this ‘ladder’ entail organised programmes of combined part-time
employment and part-time participation in the regular school and university system: such
programmes have come to be known as the ‘dual system’ or equivalent terms in these countries’
(Eurostat, 2006, p. 13). Non-formal education is defined as ‘any organised and sustained
educational activities that do not correspond exactly to the above definition of formal education.
Non-formal education may, therefore, take place both within and outside of educational
institutions and cater to persons of all ages. Non-formal education programmes do not necessarily
follow the ‘ladder’ system and may have a differing duration’ (ibid. p. 13). ‘Informal learning is
intentional but it is less organised and less structured … and may include, for example, learning
events (activities) that occur in the family, in the workplace, and in the daily life of every person,
on a self-directed, family-directed or socially directed basis’ (ibid. p. 13).
Clark and Caffarella (1999) explain that adult learning can be defined in numerous ways but that a
widely accepted definition refers to those learners who have completed mandatory public
schooling, usually around the age eighteen. Learning is an activity that people of all ages and
backgrounds engage in for a variety of reasons at different levels and for different lengths of time
throughout their lives in a range of formal and informal settings, including those provided by
voluntary activities, community groups and the workplace.. Consequently, the focus here is on the
adult that has had life experiences and is often referred to as a non-traditional student in the
higher education setting. The age range for this type of student is extremely broad. In order to
articulate the learning needs of mature adults, it is necessary to first clarify who is included in this
life stage. Various authors agree that reliance on a chronological age is an insufficient basis for
defining this stage of life that may lead to incorrect assumptions about older people (Bunyan &
Jordan, 2005). However, it is more common to consider mature learners to be those aged 45 or
older (Crawford, 2004).
1.3 Lifelong learning and mature adults characteristics
The challenges faced today by an ageing population, the skills and competencies deficit of the
workforce, and global competition are further exacerbated by the ongoing financial crisis and,
thus, highlight the crucial role of lifelong learning in addressing these issues. The concern about
mature/older adults is not a new topic for research and policy, nor is lifelong learning. The issue of
older adults and lifelong learning, however, is complex. It is not simply a question of looking at the
relationship between work, age and education, these fields also need to be addressed at three
levels: the individual, the organisation and society. Furthermore, the reason for older age adults’
negative attitude toward education needs to be addressed. Some of these reasons are connected
to external factors and others to internal ones. This matter requires a deeper analysis as
sociological, cultural, psychological, pedagogical, and even medical perspectives may be involved.
1.4 Characteristics of mature learners

10
Research on learners has shown that adults learn differently from younger students. Adult
learners have characteristics that set them apart from 'traditional' schooling. Adults approach
learning experiences with from a variety and range of experiences, both in terms of their working
lives and educational backgrounds. This impacts on how and why they participate in learning.
Although each adult has different individual learning needs, there are some characteristics that
are common to all (see Table 1.1).
Table 1.1 Common characteristic of adult learners
Adults have accumulated life experiences They tend to favour practical learning activities that enable them to draw on their prior skills and knowledge
Adults have established opinions, values and beliefs
These are built up over time and arrived at following experience of families, relationships, work, community, politics
Adults are intrinsically motivated Learners increase their effort when motivated by a need, an interest, or a desire to learn
Individual differences Teaching strategies must anticipate and accommodate differing comprehension rates of learners
Adults learn best in a democratic, participatory and collaborative environment
They need active, not passive, learning experiences
Adult students are mature people and prefer to treat as such
Adults are goal-oriented/relevancy oriented
Adults need to know why they are learning something
Adults are autonomous and self-directed Individuals learn best when they are ready to learn and when they have identified their learning needs
Adults are practical and problem-solvers They are less tolerant of work that does not have immediate and direct application for their objectives
Adults are sometimes tired when they attend classes
They appreciate varied teaching methods that add interest and a sense of liveliness to the class
Adults may have logistical considerations Family and caring responsibilities; careers; social commitments; time; money; schedules; transportation
Ageing concerns Adults frequently worry about being the oldest person in a class and are concerned about the impact this may have on their ability to participate with younger students
Adults may have insufficient confidence Some adults may have had poor prior experiences of education leading to feelings of inadequacy and fear of study and failure
11
1.5 Theories of adult learning
A number of theories related to a person’s life stage provide an understanding of the motivation
for learning; however this report will only briefly consider the works of Maslow and Knowles.
Maslow (1943), in his paper A Theory of Human Motivation, proposed a hierarchy of needs,
depicted as a pyramid with five levels. ‘The lower 4 levels physiological, security, love/belonging
and esteem (arranged from the lowest) are what he calls deficiency needs, while the highest level
is self-actualization’ (Chao, 2009, p. 907).
According to Knowles (1973, 1980, 1984), as learners, adults are distinct in terms of self‐direction,
experience, readiness to learn, problem-oriented and the motivation to learn. Knowles (1968)
proposed ‘a new label and a new technology’ of adult learning to distinguish it from pre-adult
schooling (p. 351). The term andragogy is based on the Greek work aner (with the stem andr-)
meaning ‘man not boy’ (Plato’s idea that adults continue to learn) and Knowles defines andragogy
as ‘the art and science of helping adults learn’. He contrasted this with pedagogy, the art and
science of helping children to learn (Knowles, 1980, p. 43).
In Pedagogy, learners are dependent; the teacher directs what, when, and how a subject is
learned. In andragogy the learner moves towards independence and learner is self-directed. The
teacher encourages and nurtures this independence. The didactic teaching method is standard in
pedagogy whereas discussion is a common teaching method in andragogy. In pedagogy, the
curriculum is standardised as the student learns what society expects them to. In andragogy,
students learn what they need to know so that learning programmes are organised around life
application (Knowles, 1968).
Other factors fostering the adult's learning processes are related to the type and nature of
learning tools and materials that support the learning process; the kind, quality and extent of
feedback provided to the trainees; the pace of the learning process; and the group dimension
(Callahan et al. 2003). Notably, the self-pacing option has been demonstrated to be one of the
most appreciated (and effective) factors in the adults’ learning process (Boehm et al., 2013).
1.6 Barriers and motivations for mature adult learning
Learning is at the core of human development, and it is part of human development. As a
consequence, education is continually evolving and constantly carrying out development tasks to
serve the various stages of the vital process set out in each. For this reason learning is understood
as a process of permanent change in a person's behaviour generated by the experience (Feldman,
2005). Thus, a number of different factors affect mature adult interest and participation in further
education activity, including the adult’s age, sex, race, past educational attainment, rural/urban
place of residence, health, financial status, self-concept, and other factors (Graney, 1980). For a
number of reasons mature adults may be disadvantaged or excluded simply because in the past
they had an unfulfilling, or even worse a traumatic, experience in education. This exclusion calls
for a special (such as a student-centered) approach to the learning needs of mature adults
(Oliveira, 2013, p.99).

12
The reasons for barriers to mature adult learning are complex. Some are connected with external
factors such as the absence of suitable training, while others are rooted in mature learners’
mindsets. Undoubtedly social stereotypes keep mature adults away from learning activities as
they are connected with development and growth that is associated with youth and proactivity.
Such stereotypes influence mature adults’ self-image and attitudes and, at the same time, affect
the decisions of employers who seldom appoint mature adults for further training. Mature adult
are considered less trainability, with no flexibility and not cost-effective when compared with
younger adults (van Vianen, 1997).
Mature adults may perceive learning as a tiresome and useless effort that leads nowhere. Many
people today believe that their age makes them hardly employable and as a result they feel
discriminated against. This is especially the case for people around the age of 50 who may feel
uneasy at the prospect that after completing a course they will have to go through a humiliating,
almost hopeless, experience of looking for a job again. Multi-level perceptions and attitudinal
change is crucial here.
Poor school experience may also listed among the principle reasons for resistance toward
learning. Mature adults with low education may recall learning as a passive, boring process with a
teacher giving grades and exams that they have to pass.
All these barriers that mature adults face need to be understood if there is to be change in the
motivation for learning. The development tasks each person requires at each life stage tend to
evolve and in that sense, it is commonly accepted that these requirements are entirely connected
to motivation and understood as the set of processes involved in activation and in the
maintenance of conduct (Beltrán, 1990). As such, motivation demands consideration of multiple
factors as it cannot be reduced to a single or a simple concept.
Houle (1974) points out that one of the most studied aspects of adults’ education has been the
motivational field. Perhaps when we speak of the participation of adults in education, we infer
that it is a voluntary activity. On the assumption of the importance of knowing the reasons or
causes that they follow in taking the decision, theoretical studies in this area have attempted to
identify and classify the reasons that adults undertake learning. The motivational dimension in
adults is an essential element for their learning which drives them to action and, at the same time,
orients their commitment. This complex construct that influences behaviour maintains a close
relationship with others concepts such as interests, needs, values and aspirations.
From an educational perspective, the classification motivational factors provided by Serrano
(2001), is interesting. His classification is divided into internal and external motivations (Table 1.2)
— both in the past and present — which are influenced by a range of psychosocial factors both
internal to the learner and present in the learner’s social and natural environment.
Table 1.2 Serrano internal and external motivations Internal motivation External motivation
Personal satisfaction Social promotion
Better adapt to social changes Vocational adjustment
Greater security in their environment
Resolution of specific problems

13
With this in mind, the need to create a tool to help trainers to understand mature learners’
motivation and the barriers to learning is of great importance and one of the reasons for this
project.
Mature learners’ motivation to learn differs based on their individual experience, competence,
and attitude. This includes the personal characteristics of the learner, the perceived value of the
learning task and how much experience the adult learner has had with the topic of education
(Thoms, 2001). It is also the case that the reasons why a mature adult learns vary at different
stages of learner’s life. Some learn in order to fill an educational gap, to develop personally, to
perform a better job, or to enhance employment opportunities. According to Ryan et al. (1985)
the motivation of mature learners is defined by the following characteristics:
- Motivation is fundamentally intrinsic. In older people, the personal satisfaction they acquire
from voluntarily participating in a process of learning (and completing it) is of particular relevance.
Similarly, the resolution of concrete and everyday problems plays an important role.
- The motivation to learn in adults is essentially interpersonal, created by previous and current
interpersonal influences that they have internalised through their relationships.
- Mature adults will be motivated to learn according to the meaning that activities and work
have for them, as well as from the context in which learning takes place and the objectives
established for this purpose.
Beyond these characteristics, a mature adult belongs to a number of different groups such as the
employed, unemployed and retired. In addition, these groups have more than one personal and
social diverse characteristic which adds to their complex nature. All these factors need to be taken
into account when considering participation and motivation in adult learning. Every individual in
every stage of life will have their reasons and aims for engaging in adult learning and it is almost
impossible to list them all. Chao (2009) has produced a categorical typology of motivation and
barriers that affect different dimensions for an adult learner. He introduced a model entitled ‘The
Decision Funnel’ to explain the dynamic interaction between the variables affecting participation
and which assists us to understand how adult learners’ motivation and barriers influence adult
learning.
The model takes as a starting point the adult learner’s experience including his/her value system,
cultural heritage, personal and social maturity and the skills and competencies of the individual
learner and represents one’s life needs. ‘Various motivational factors and barriers to participation
in adult learning (opposing forces) interacts with the different dimensions of a person (cognitive,
emotive and environment) adding power and load. The accumulation of power and weight within
the different dimensions are funneled based on the learner’s value placed on the various aspects
of his/her life namely personal, professional and social. This would result in a margin (or a
negative margin) which gives the learner the energy to pursue and participate in adult learning’
(Chao, 2009, p. 913).
In summary, the participation of mature adult in learning is affected by different categories of
barriers that vary according to the learner’s various life stages and needs. Further research is
needed to fully explain the complex nature of the mature learner. The adult learning funnel is a

14
start for the understanding of the dynamic interaction between the mature learner’s experience
(including life stage), motivational factors, and barriers to learning within the multi‐faceted life
(personal, professional and social) of a mature learner.

15
Chapter 2: Context based on countries’ macro factors
2.1 Denmark: Macro factors affecting the motivation for learning
Denmark has a long-standing tradition of lifelong learning and improving the competences of the workforce beyond compulsory stages of education. In fact, the notion is very much that learning is a lifelong occupation.
In 2011, nearly one in three of the population in the age bracket 25-64 years participated in educational activity, counting both publicly funded, workplace internal and private education programmes and courses in connection with employment or in some form of leisure-time education. Adult general education and vocational education and training range from non-formal education to qualifying general education and continuing vocational training.
Generally, the syllabus and examinations are adapted to the experience and interest of adults and in some cases they may obtain recognition for prior formal and non-formal learning. The programmes are structured in such a way that the level of qualification can be compared to levels in the mainstream education system.
2.1.1 Social bias in continuing education activities – OECD Report 2014
In total 66% of people aged 25–64 in Denmark participated in either formal education or non-
formal adult education and training activities. There is a direct correlation between
unemployment and the individual level of education. People who leave school without education
are also likely not to attend continuing education as adults.
Figure 2.1 Participation in either formal education or non-formal adult education and training
activities
0,00%
10,00%
20,00%
30,00%
40,00%
50,00%
60,00%
70,00%
80,00%
90,00%
Overall unemploymentUnemployment for school leaversTraining activity for higher educatedTraining activity for school leaversOECD figures training activity for higher educatedOECD figures training activity for school leavers

16
The percentage of the population age 15 and above who can, with understanding, read and write
a short, simple statement on their everyday life is 99% of the population. There is a significant
correlation between literacy and participation in adult education and training where only 42% of
the weakest literacy participated in training and 86% of the best literacy attended. Main factors
for adults participating in education are time, money, literacy and policy.
2.1.2 Motivation and barriers for continuing education – Danish Public investigation February 2006
There is a general correlation between educational background and motivation for participating in
adult education and training (AET). It is important for unskilled and skilled workers, that AET has a
direct benefit in relation to their jobs. Those with higher education look at AET in a wider
professional and personal perspective. The most important professional reasons is the desire to
be better for your daily work and the experience of that training is required in the job.
The main barrier in the company for participation in training is work pressure, busy and that there
is someone to take over the job during training. The participant fewer with reading difficulties
problems than non-reading difficulties in AET. But when reading difficulties involved, there are
only relatively small differences between their and the non-read weak learning outcome. Weaker
and some unskilled workers need special motivation, including the immediate supervisor and
management, to participate in adult education
2.1.3 Conclusion: Motivation and barriers for continuing education
There is a strong correlation between the length of a person’s previous education and their
participation in the AET. OECD report Attitudes to Life Long Learning (OECD, 2004) documented
this context. Interview study confirms that people with higher education have achieved a personal
learning culture which orients them toward lifelong education and learning. Elder’s continuing
education should have focus on their education level and reading level when motivating to adult
education.
Figure 2.2 Danish confidence in to public authorities
Source: Standard Eurobarometer May- June 2014
0%
10%
20%
30%
40%
50%
60%
70%
80%
Municipal andregional authorities
Danish parliament Danish government European Union Political parties

17
2.2 Greece: Macro factors affecting the motivation for learning
2.2.1 Socio-economic context
Greece has experienced an exceptionally deep recession since 2008. The country’s unemployment
rate has more than tripled since the beginning of the crisis reaching 25%, and even 55.6%, among
young people (under 25 years old — the highest in EU27) (Eurostat, 2012). Productivity growth is
far below the Eurozone average and the competitiveness of the Greek economy is weak. Greece
will need to focus on reforms aimed at enhancing competitiveness, boosting potential high growth
sectors, creating sustainable jobs and leveraging private resources. A key country-specific
challenge for Greece is growth enhancing public expenditure while disparities within and among
Greek regions remain pronounced.
The demographic trends illustrate a negative dynamic and according to forecasts, the country’s
demographic make-up will be quite different in the coming decades due to adverse demographic
pressures. These include a decreasing number of births, influx of migrants, and an expanding
ageing population projected to be 31.3% in 2060, almost 3 times more than in 1980 (13.1%). The
education and training system is still largely focused on the education and training of young
people and limited progress has been made in changing systems to mirror the need for learning
throughout the lifespan and especially the needs of mature learners (OECD, 2012). The facts
highlights that lifelong learning is not very well developed in Greece; there is no tradition in
vocational education and training and non-formal VET schemes in particular, remain very weak,
although some significant positive measures have been taken to improve this situation during
recent years (Ketsetzopoulou,2007). It is most important to understand that the Greek
educational system has undergone significant reform following recent legislation (Law 4186/2013)
but unfortunately, this reform is highly problematic in Greece. The changes that are taking place
refers primarily to the area of vocational education and training but elements of the general
education sector are also affected (Greece-EQF Referencing Report, 2014). The truth is that
lifelong learning in Greece has not always gained the recognition it deserves in terms of visibility,
policy prioritisation and resources. Greece is consistently at the bottom of the list of EU (27)
member states when it comes to the percentage of adult participation in education and training
(Eurobarometer 71.2 Survey, May –June 2009). Thus, there is a considerable amount of work that
needs to be done at central policy level to promote lifelong learning in Greece at a time when the
educational system is receiving a decreasing level of public expenditure (2.75% of GDP in 2011).
Managing human resources during a period of demographic decline, and improving lifelong
learning actions, especially for mature people, are among the main challenges that Greece faces
today but it is not the only one. Other challenges include:
An unsustainable economic model that lacks competitiveness as public R&D investment is very
low.
High unemployment rates, particular among young people and increasing social exclusion and
poverty. The overall population that is at risk of poverty in Greece is higher than the EU-27
18
average with particularly low social protection’s efficiency and effectiveness in reducing
poverty.
Insufficient key infrastructure networks to promote growth and jobs — key road, rail, port and
airport infrastructure networks are not yet completed, road safety is an alarming problem, and
Greece lacks adequate energy networks.
Inefficient use of natural resources/climate change — few renewable resources and serious
problems of air quality exist in large urban areas, etc.
Inefficient public administration hindering the development perspective of the country.
Implementation of policies and reforms is a major weakness, lack of coordination and
continuity in the public sector.
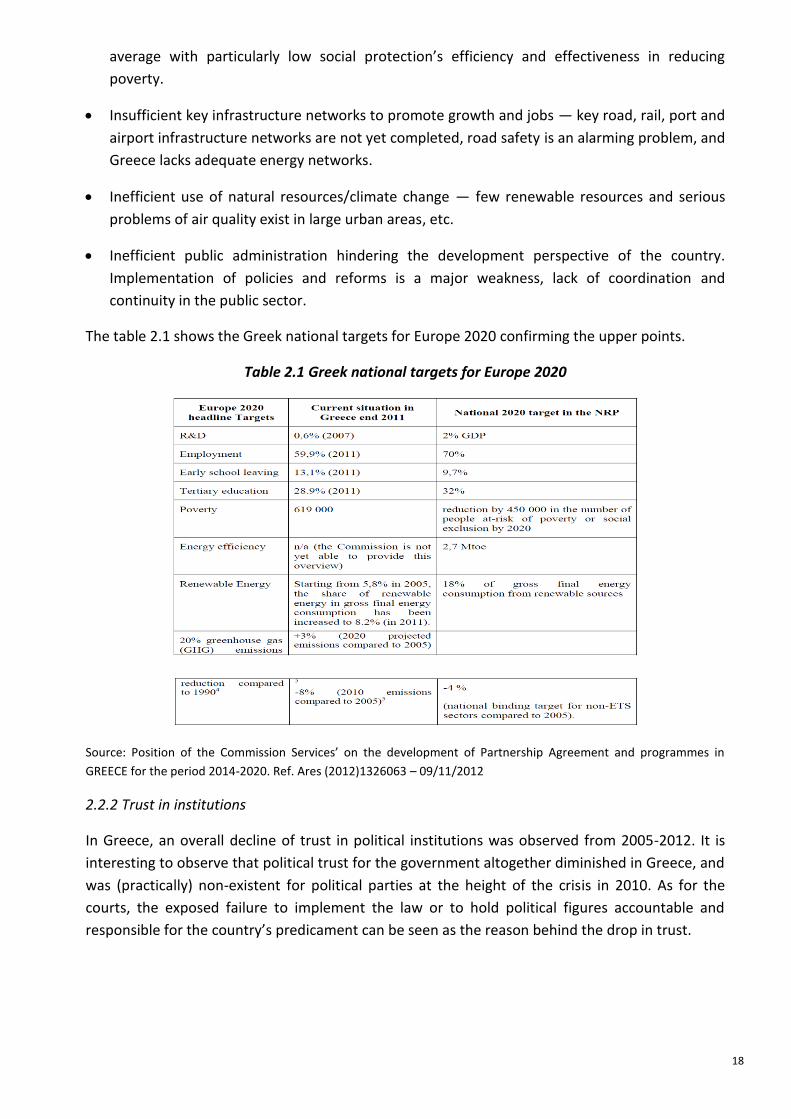
The table 2.1 shows the Greek national targets for Europe 2020 confirming the upper points.
Table 2.1 Greek national targets for Europe 2020
Source: Position of the Commission Services’ on the development of Partnership Agreement and programmes in
GREECE for the period 2014-2020. Ref. Ares (2012)1326063 – 09/11/2012
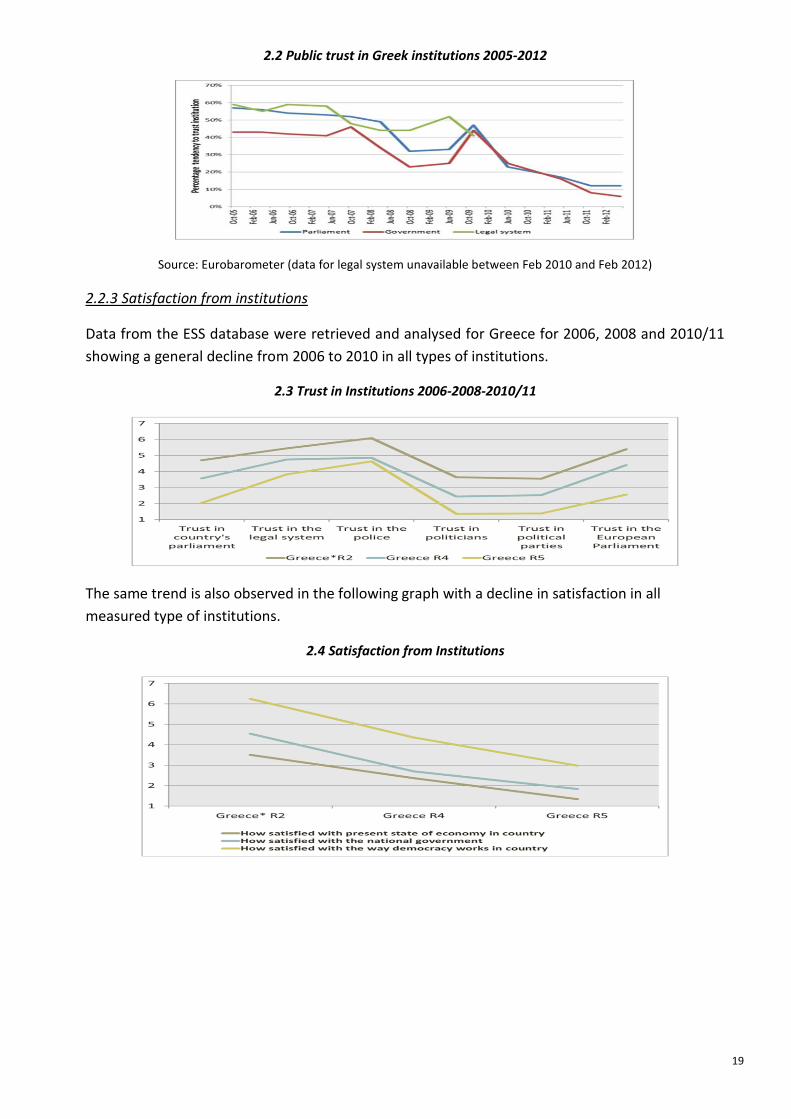
2.2.2 Trust in institutions
In Greece, an overall decline of trust in political institutions was observed from 2005-2012. It is
interesting to observe that political trust for the government altogether diminished in Greece, and
was (practically) non-existent for political parties at the height of the crisis in 2010. As for the
courts, the exposed failure to implement the law or to hold political figures accountable and
responsible for the country’s predicament can be seen as the reason behind the drop in trust.
19
2.2 Public trust in Greek institutions 2005-2012
Source: Eurobarometer (data for legal system unavailable between Feb 2010 and Feb 2012)
2.2.3 Satisfaction from institutions
Data from the ESS database were retrieved and analysed for Greece for 2006, 2008 and 2010/11
showing a general decline from 2006 to 2010 in all types of institutions.
2.3 Trust in Institutions 2006-2008-2010/11
The same trend is also observed in the following graph with a decline in satisfaction in all
measured type of institutions.
2.4 Satisfaction from Institutions

20
2.3 Italy: macro factors affecting motivation for learning
2.3.1 Italian socio-economic context
In Italy economic trends significantly affect the employment situation, with low and decreasing
employment rates (63% in 2008, 61.2% in 2011) and increased unemployment (6.7% in 2008, 8.4%
in 2011, forecast 10.6% by the end of 2012).
The gender gap is extremely relevant: the female employment rate is below 50%, which is the
lowest in Europe, and 22% below the employment rate of men in Italy. The gender/age gaps have
a strong regional dimension: in southern Italy only 20.7% of 18–29 year old women are employed,
as opposed to 45.7% in the centre-north. This confirms the persistent regional disparities in terms
of economic development between the centre-north and the south. In addition, over the last ten
years the regions in the centre-north of Italy (the most developed areas of the country) have lost
ground in terms of growth, productivity, innovation, competitiveness and employment. This is a
prime reason for the sluggish growth and low employment performance of Italy as a whole.
The country is also characterised by a very slow and cumbersome judiciary system and law
enforcement machinery, low transparency, inefficiency and increasing signs of corruption in public
administration, coupled with the penetration of crime in critical sectors of the economy.
The available infrastructure, services and public administration are struggling to keep up with the
needs of a modern, knowledge-based economy.
2.3.2 The most pressing challenges
Italy is engaged on trying to re-launch its path to sustainable growth and competitiveness overall,
to promote employment and to reduce its regional disparities. This general goal is achievable by
addressing some specific objectives such as: developing an innovation-friendly business
environment; increasing labour market participation, particularly among women and young
people; and ensuring the quality, effectiveness and efficiency of the public administration.
2.5 Europe 2020 targets, national targets and current situation
Europe 2020 headline targets Current situation in
Italy (2012)
National 2020 target in the NRP
3% of the EU’s GDP to be invested in research and development
1.26% (2010) 1.53%
75% of the population aged 20–64 should be employed
61.2% (2012) 67-69%
Reducing early school leaving to less than 10% 18.2% (2012) 15-16%
At least 40% of 30–34 year old completing tertiary or equivalent education
20.3% (2011) 26-27%
Reducing the number of people in, or at risk of poverty or exclusion by at least 20 million
14.5 million people (2010)
2.2 million people lifted out of poverty
Source: Position of the Commission Services’ on the development of Partnership Agreement and programmes in ITALY for the period 2014-2020. Ref. Ares(2012)1326063 – 09/11/2012

21
Due to high life expectancy and low birth rates, Italy records a relatively high percentage of elderly
population and a workforce that is increasingly aged. It is also among the EU countries with the
lowest employment rate for older workers, well below the EU average. One explanation lies in the
low participation of adults (compared to the EU average) in lifelong learning, particularly for low-
skilled workers, which would, however, yield the greatest benefits.
The propensity for private spending for training in Italy is modest, both in training for young
people and adults (OECD database).
Italy ranked 5th out of 34 member countries in terms of the tax to GDP ratio in 2012 (the latest
year for which tax revenue data is available for all OECD countries). In that year Italy had a tax to
GDP ratio of 42.7% compared with the OECD average of 33.7%.
In early December each year, almost simultaneous with the first Christmas decorations, in the
Italian media ranking of perceived corruption in the world appears for short time the Corruption
Perception Index. For the last 15 years, Transparency International – a nongovernmental
organization based in Germany — processes and disseminates information from the Corruption
Perception Index, thus certifying the opinions of investors, entrepreneurs and international
experts on the risk of running into bribes and other undue favouritism in the different countries
where they go to do business. New Zealand, Denmark and the Scandinavian countries are always
22
in the top ranking, whilst the black sheeps are the countries with endemic and widespread
corruption such as Somalia, Afghanistan, Sudan, and North Korea. In the 2013 edition Italy ranked
69th out of the 175 countries considered, third last among the European Union countries and
ahead of only Bulgaria and Greece.
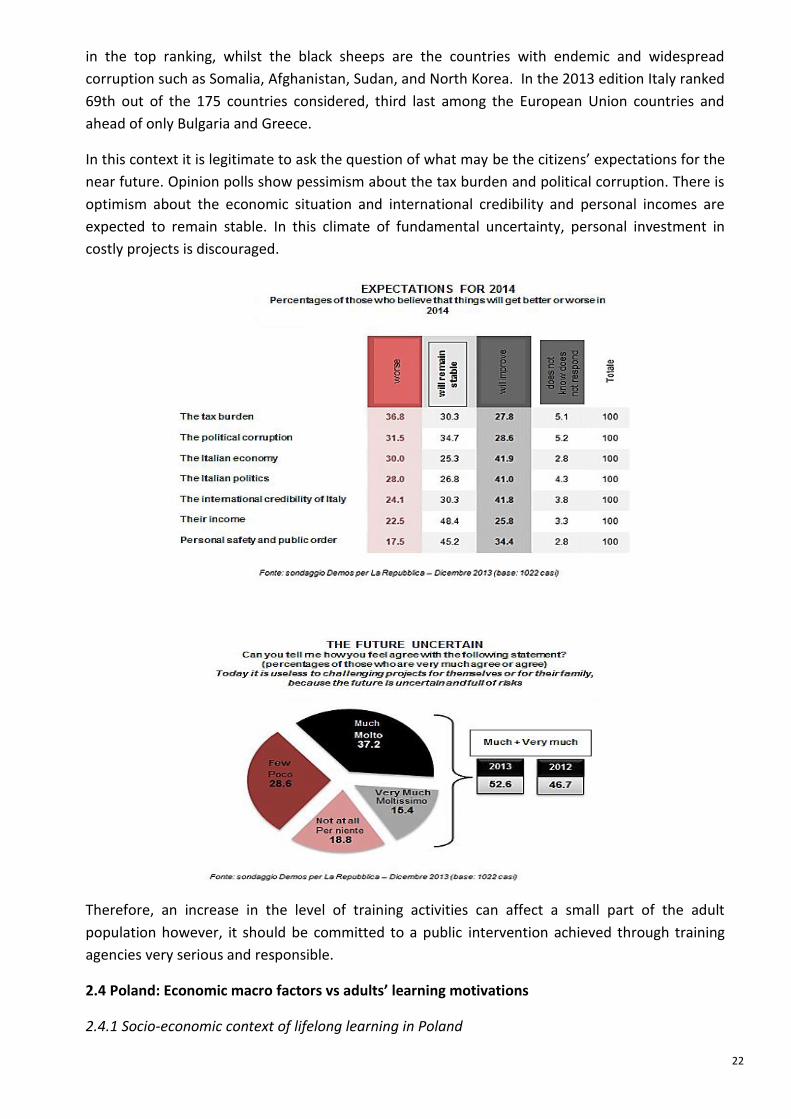
In this context it is legitimate to ask the question of what may be the citizens’ expectations for the
near future. Opinion polls show pessimism about the tax burden and political corruption. There is
optimism about the economic situation and international credibility and personal incomes are
expected to remain stable. In this climate of fundamental uncertainty, personal investment in
costly projects is discouraged.
Therefore, an increase in the level of training activities can affect a small part of the adult
population however, it should be committed to a public intervention achieved through training
agencies very serious and responsible.
2.4 Poland: Economic macro factors vs adults’ learning motivations
2.4.1 Socio-economic context of lifelong learning in Poland

23
Forty-four years of delay (1945-89)
Poland is in IMAL learning partner, the only country from the former Soviet bloc. The country paid
an exceptionally high price during WWII with over 6 million killed (17, 3% of the population, half of
them Polish Jews [see Table 2.6]) and another 5 million living outside of the country due to both
political emigration and the loss of one third of the territory. Following a delay of 44 years the
country began to catch up with EU market economies immediately after the overthrow (by the
Solidarity movement) of the communist regime in June 1989. The population loss amounted to
31.1% and the so called ‘centrally planned economy’ that affecting all spheres of life from industry
and science to art and education, contributed to a drastic delay in the country’s development.
Limited access to tertiary education (only 7% of the population in 1989 compared to 40.5% in
2013), science and research cut off from the world newest scientific findings and employment
stability with no urge to upgrade skills and competences (remembered by many with nostalgia),
left Poland technologically and economically far behind the ‘free world’. The bright positive factor
was that the workforce was skilled and open to learning, constituting a rich pool of resources for
future change.
Table 2.6. Loss of lives during WWII
Country Population
in 1938, in
millions
Killed during
WW II, in
millions
in %
Germany 78. 8 4, 280 11. 7%
Japan 71. 3 1, 972 8. 0%
Italy 43. 6 0, 395 0. 9%
USSR 175. 5 14, 500 8. 3%
Great
Britain
47. 3 0, 357 0. 8%
USA 129. 3 0, 298 0. 2%
France 42. 0 0, 563 1. 3%
Poland 34. 8 6, 030 17. 3%
Greece 7. 2 0, 311 4. 3%
Denmark 3. 8 0, 032 0. 08%
Spain 25.6 0, 005 0.02%
Source: Wikipedia1
2.4.2 Balcerowicz’s ‘shock therapy’ and consecutive state finance heeling plans (1990–2004)
1 https://pl.wikipedia.org/wiki/Ofiary_w_II_wojnie_%C5%9Bwiatowej
24
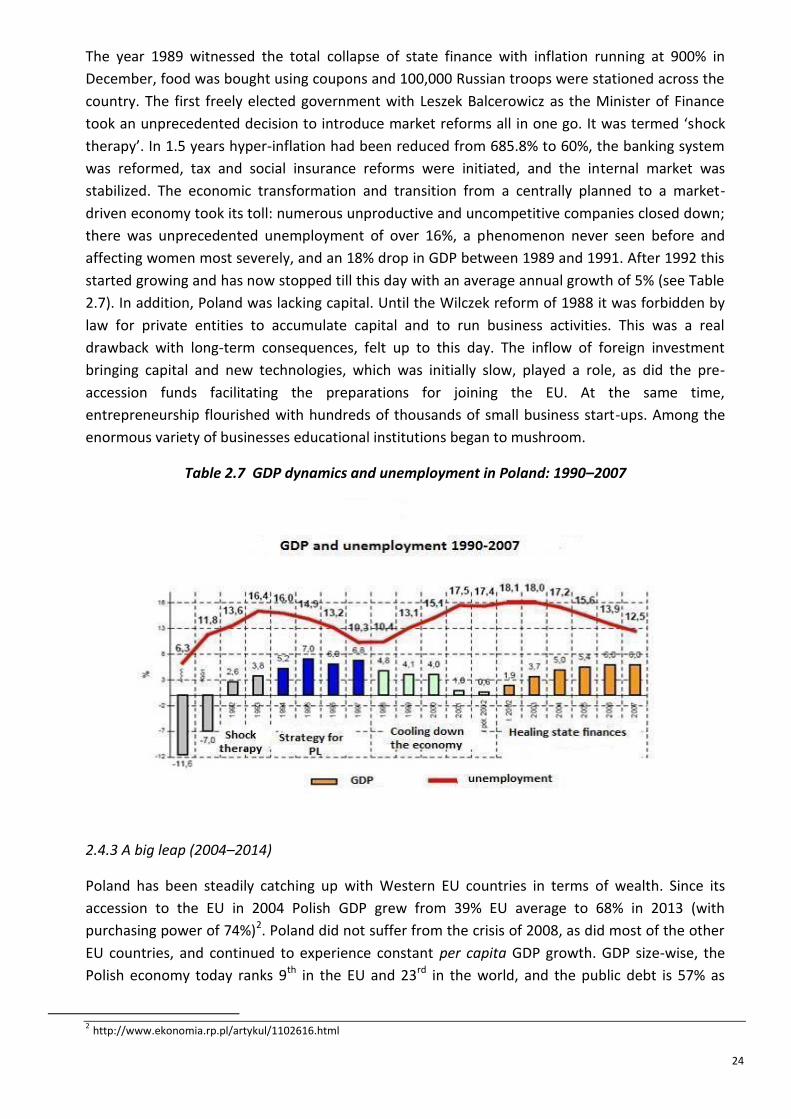
The year 1989 witnessed the total collapse of state finance with inflation running at 900% in
December, food was bought using coupons and 100,000 Russian troops were stationed across the
country. The first freely elected government with Leszek Balcerowicz as the Minister of Finance
took an unprecedented decision to introduce market reforms all in one go. It was termed ‘shock
therapy’. In 1.5 years hyper-inflation had been reduced from 685.8% to 60%, the banking system
was reformed, tax and social insurance reforms were initiated, and the internal market was
stabilized. The economic transformation and transition from a centrally planned to a market-
driven economy took its toll: numerous unproductive and uncompetitive companies closed down;
there was unprecedented unemployment of over 16%, a phenomenon never seen before and
affecting women most severely, and an 18% drop in GDP between 1989 and 1991. After 1992 this
started growing and has now stopped till this day with an average annual growth of 5% (see Table
2.7). In addition, Poland was lacking capital. Until the Wilczek reform of 1988 it was forbidden by
law for private entities to accumulate capital and to run business activities. This was a real
drawback with long-term consequences, felt up to this day. The inflow of foreign investment
bringing capital and new technologies, which was initially slow, played a role, as did the pre-
accession funds facilitating the preparations for joining the EU. At the same time,
entrepreneurship flourished with hundreds of thousands of small business start-ups. Among the
enormous variety of businesses educational institutions began to mushroom.
Table 2.7 GDP dynamics and unemployment in Poland: 1990–2007
2.4.3 A big leap (2004–2014)
Poland has been steadily catching up with Western EU countries in terms of wealth. Since its
accession to the EU in 2004 Polish GDP grew from 39% EU average to 68% in 2013 (with
purchasing power of 74%)2. Poland did not suffer from the crisis of 2008, as did most of the other
EU countries, and continued to experience constant per capita GDP growth. GDP size-wise, the
Polish economy today ranks 9th in the EU and 23rd in the world, and the public debt is 57% as
2 http://www.ekonomia.rp.pl/artykul/1102616.html

25
compared to 88% EU-28 average. To a large extent this result can be attributed to the great
entrepreneurial spirit represented by Polish SMEs which generate 47.3% of GDP (29.4% micro-
firms with statistically 2 employees, 7.8% small and 10.1% medium-sized enterprises), create jobs
for almost three-quarters of employees and represent 99.8% of all companies in Poland. They
mainly operate in the service and trade sector (76%) whereby 52% of employees work in micro
and small-sized companies (PARP, 2013).
A strong support for this process has, and continues to be provided by the inflow of structural
funds granted within the framework of the EU’s cohesion policy. In the EU’s 2007–2013 budget,
the subsidies for Poland amounted to almost EUR 68 billon, the highest sum among the EU
funding beneficiaries.
In the labour market, in September 2014 Poland recorded a relatively low unemployment rate of
8.7% according to seasonally adjusted Eurostat data (Polish Statistical Office GUS US, applying
different methodology reports 10% for the same period). The unemployment rate in Poland has
gradually declining across the years. It averaged 13.60% from 1990 until 2014, reaching an all-time
high of 20.70% in February 2003 and a record low of 0.30% in January 1990, i.e., before the
reforms began (see Tables 2.8 & 2.9).
Table 2.8 Unemployment rates
A positive phenomenon observed over the years is a continuous increase in Poles’ educational
attainment level. The percentage of Poles with education at the secondary or higher level
increased from 41.4% in 2002 to 48.6% in 2011. The most rapid growth was recorded in the group
of people with tertiary education whose share of the population increased from 9.9% in 2002 to
over 17.5% in 2011. The level of education strongly differentiates the younger and older
generations of Poles. For the age group 30–34 the share of the population with tertiary education
rose in 2013 to 40.5%, whereas for people aged 50+ only every 10th person is a university
graduate. Although there is almost no difference between women and men in post-secondary
and secondary vocational education (27% and 28% respectively) women dominate among
university graduates (almost 40% vs only 24% of men).3 These numbers are considerably higher in

26
the age group 30–34 (45.6% vs 31.9% men). As much as 34% of females graduate from technical
studies and constitute as much as 45% of the graduates in mathematics and other sciences
(Eurostat, 2013).
Table 2.9. Poland and the EU: % of population age 30–34 with tertiary education
In 2014 the labour market participation coefficient in Poland reached 74.1% rising from a low of
63.2% in 2007 (Table 2.10) and the employment rate was 67.2%. According to GUS (Polish
Statistical Office), over the recent years a lowering of the demographic dependency ratio has been
observed: in 2011 there were 55.3 people of non-productive age for every 100 people of
productive age, whereas in 2002 the ratio was 62:100. Nevertheless, boosting job prospects is
critical as the employment rates are low and the country is facing a strong demographic shrinkage
and persistent emigration risks. In the context of a rapidly ageing population, supporting lifelong
learning and improving the health-care system remains as priorities.
Table 2.10. Labour market participation UE 27 and Poland, age 15-64
GUS estimates that at the end of 2011 as many as 2.06 million Poles were emigrants, a number
significantly higher than the 786.1k recorded during the census in 2002. Emigrants remain an
3 ‘Sytuacja zawodowa kobiet - podstawowe wskaźniki’, Sedlak&Sedlak http://rynekpracy.pl/artykul.php/wpis.741

27
important element of the Polish economy. According to the Polish central bank (NBP), the value of
emigrants’ money transfers to Poland in 2011 amounted to some PLN 17 bln (around EUR 4.2 bln),
which accounted for 1.42% of Polish GDP. NBP’s data show that in the first three quarters of 2012
the respective value of transfers amounted to almost EUR 3.14 bln.
At the same time, Polish emigrants constitute roughly 10% of the country’s active population,
young and well educated. The data shows that the largest groups among them are people aged
28–39 with ISCED4–6 educational levels (post-secondary non-tertiary, first & second stage
tertiary). The motivations for emigrating boil down to factors such as the stability of work, easier
entry and career development, higher wages, easier living and working conditions (services, social
systems/welfare states, bureaucracy, legislation, courts, etc.).
2.4.5 The frustrating drawbacks
Parallel to the undeniable strengths of the Polish economy, it also has its weaknesses such as, on
the one hand, the low level of savings, low labour market participation, negative demographics,
education ill-suited to the modern economy, and low levels of innovation. On the other hand, it
also suffers from unfriendly economic regulations, inefficient judiciary and administration
systems, and procedures that are complicated and lack transparency giving grounds for officials’
discretion.
Restrictive product market regulations substantially hinder business activity. These take the form
of heavy barriers to entrepreneurship and the extensive involvement of the state.
Business registration procedures are cumbersome and bankruptcy procedures are lengthy and
expensive. Starting a business remains costly both in terms of time and money. In 2013 when the
novelty of on-line procedures to register a limited liability company was introduced, more than
20% of registrations were completed in this way.
Public procurement plays a key role (circa 20% of orders), but the criteria for awarding contracts
rely excessively on the lowest price instead of selecting contractors that offer the best value for
money. Judicial weaknesses are prevalent and inefficient courts take two to three times longer to
solving a case than the average in EU 15.
In Poland, an entrepreneur is overloaded with a multitude of bureaucratic burdens or
unproductive tasks required by law. In effect, a disproportionate amount of time is wasted on
paperwork. Extensive accounting, reporting and complex tax system regulations result in cost
increases and effectively depress productivity growth. The government has slightly reduced the
paperwork related to the collection of taxes and social security contributions but a great deal
remains to be done to address this problem.
2.4.6 The challenge: to avoid the ‘middle-income trap’
Alongside the undeniable successes, a great deal remains to be done. The growth model
underpinning Poland’s success relies heavily on the low-to-medium technology sectors with a
relatively high share of low-skilled labour. This exposes the country to the risk of the so-called
‘middle-income trap’, with the country’s productivity (and its standard of living) being trapped at a
medium level. The predominance of labour-intensive production automatically affects
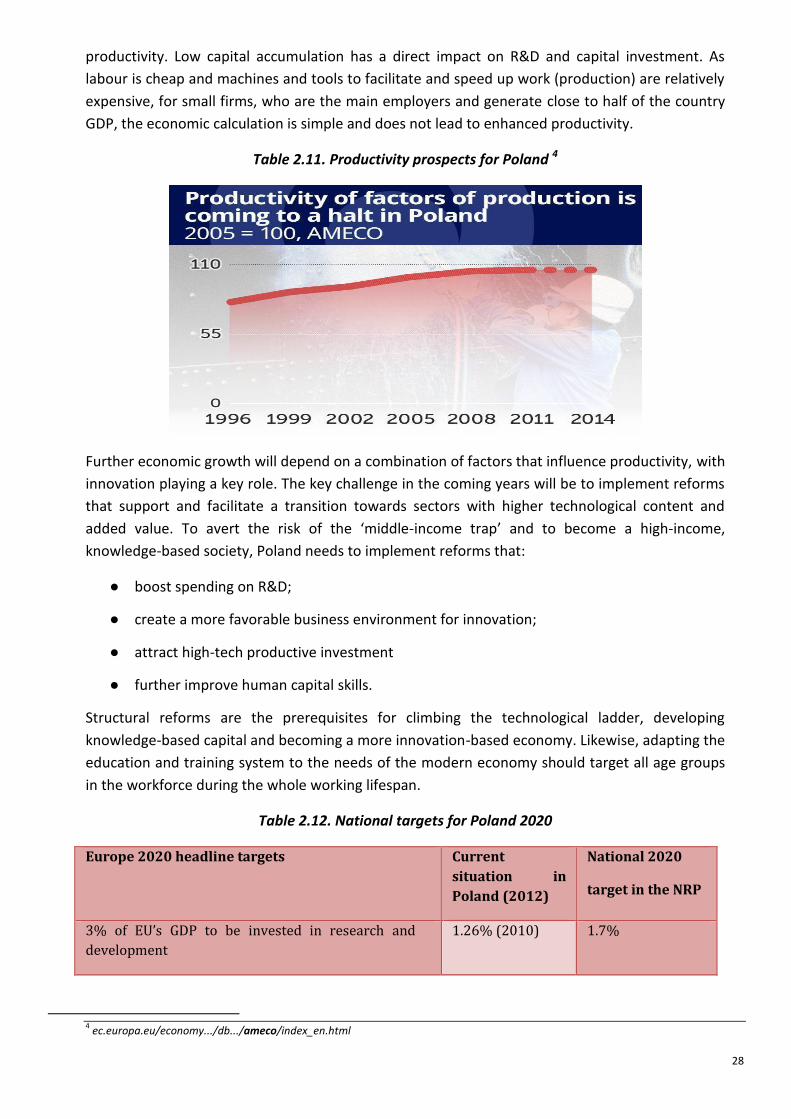
28
productivity. Low capital accumulation has a direct impact on R&D and capital investment. As
labour is cheap and machines and tools to facilitate and speed up work (production) are relatively
expensive, for small firms, who are the main employers and generate close to half of the country
GDP, the economic calculation is simple and does not lead to enhanced productivity.
Table 2.11. Productivity prospects for Poland 4
Further economic growth will depend on a combination of factors that influence productivity, with
innovation playing a key role. The key challenge in the coming years will be to implement reforms
that support and facilitate a transition towards sectors with higher technological content and
added value. To avert the risk of the ‘middle-income trap’ and to become a high-income,
knowledge-based society, Poland needs to implement reforms that:
● boost spending on R&D;
● create a more favorable business environment for innovation;
● attract high-tech productive investment
● further improve human capital skills.
Structural reforms are the prerequisites for climbing the technological ladder, developing
knowledge-based capital and becoming a more innovation-based economy. Likewise, adapting the
education and training system to the needs of the modern economy should target all age groups
in the workforce during the whole working lifespan.
Table 2.12. National targets for Poland 2020
Europe 2020 headline targets Current
situation in
Poland (2012)
National 2020
target in the NRP
3% of EU’s GDP to be invested in research and
development
1.26% (2010) 1.7%
4 ec.europa.eu/economy.../db.../ameco/index_en.html

29
75% of the population aged 20-64 should be
employed
64.8% (2012) 71%
Reducing early school leaving to less than 10% 5.4% (2012) 4.5%
At least 40% of 30-34 year old completing tertiary
or equivalent education
35.3% (2011) 45%
Reducing the number of people in or at risk of
poverty or exclusion by at least 20 million
10.4 million
people (2010)
1.5 million people
lifted out of
poverty
2.5 Spain: Macro factors affecting motivation for learning
2.5.1 Socio-economic context
Since 2008, Spain has been undergoing a deep crisis that has dramatically halted its convergence
process (it caught up with the EU-27 average — moving from 91.4% in 1995 to 104.7% in 2007 in
terms of GDP per capita). The percentages of unemployment and youth unemployment (25.1%
and 52.9% respectively) are now the highest among the EU countries (Eurostat, 2012). The main
reason is that the traditional Spanish growth model, based on construction, has come to an end
(European Commission, 2012). Other weakness of this country are the internal GDP disparities
between the regions of the north and south, the low competitiveness of SMEs, a weak research
and innovation system, insufficient private-sector participation and an inefficient use of natural
resources.
If we focus on demography, in 2014 Spain had a total population of 46,507,760 (a 0.5% decrease
since 2013), decreasing especially because of immigrants returning home due to the effects of the
economic crisis. The population of Spain is also undergoing an ageing process because of the
dramatic fall in the birth rate in the last quarter of the twentieth century and the high life
expectancy at birth (82 years, two years higher than the OECD average) (OECD, 2012).
With regard to education, about one in three adults in Spain has tertiary education, but nearly one
in two did not complete the fourth level of secondary education (45% of adults do not have upper
secondary education, 22% have this level of education and 32% have tertiary education). Of those
with upper secondary education, 14% have a general rather than a vocational diploma and only
9% have upper secondary VET education. On the other hand, too many students are leaving
school early and the vocational training system is insufficiently tailored to market needs. All these
issues contribute to low productivity growth and reduce the employability of the workforce.
However, a positive factor is that about 40% of adults in Spain have a higher educational level
than their parents, so the educational situation is improving in each generation. In terms of
lifelong learning, about one in two 25–64 year-olds participated in at least one learning activity
(42% in non-formal education; 13% in formal education) (OECD, 2012).
In light of this situation the main challenges for Spain are:
- Increasing productivity and competitiveness

30
- Fostering employment in a framework of fiscal consolidation and credit crunch.
- Establishing a strong link between productivity-enhancing measures,
- Leveraging private investment
- Boosting potential high growth sectors.
In this context, it is important to:
- Develop the human capital skills
- Improve the quality of education and vocational training
- Address the high level of early school leaving and the mismatch between the high
education attainment and the skills needs.
The table 2.13 below shows the Spanish national targets for Europe 2020 confirming the upper
points.
2.13 Spanish national targets for Europe 2020
Europe 2020 headline targets Current situation in
Spain
National 2020 target in
the NRP
3% of expenditure on research and
development
1.39% (2010) 3%
20% greenhouse gas (GHG) emissions
reduction compared to 1990
-3% (2010 emissions
compared to 2005)
-10% (2020 projections
compared to 2005)
-10%
(national binding target
for non-ETS sectors
compared to 2005)
20% of energy from renewables 13.8% (2010) 20%
20% increase in energy efficiency 7.7% (2010) 20.1% or 25.2 Mtoe
75% of the population aged 20-64
should be employed
61.6% (2011) 74% (68.5% for women)
66% by 2015
The share of early school leavers
should be under 10%
26.5% (2011) 15%
At least 40% of 30-34 years old
should have completed a tertiary or
equivalent education
40.6% (2010) 44%
Reducing the number of people at
risk of poverty or exclusion by 20
11.7 million (2010)
25.5% of population
-1.4/1.5 million
(over 2010 levels)

31
million in the EU
Source: Position of the Commission Services’ on the development of Partnership Agreement and programmes in
SPAIN for the period 2014-2020.
2.5.2 Trust in institutions
Trust in the political situation has decreased dramatically since 2004, and in 2013 it was hit a
historical low. This situation was provoked by the economic crisis and the numerous cases of
political corruption and fraud that have appeared in Spain over recent years
2.14 Public trust in political institutions in Spain 1996–2015
Source: CIS (2014)
2.15 Public trust in the economic situation in Spain 1996–2015
Source: CIS (2014)
32
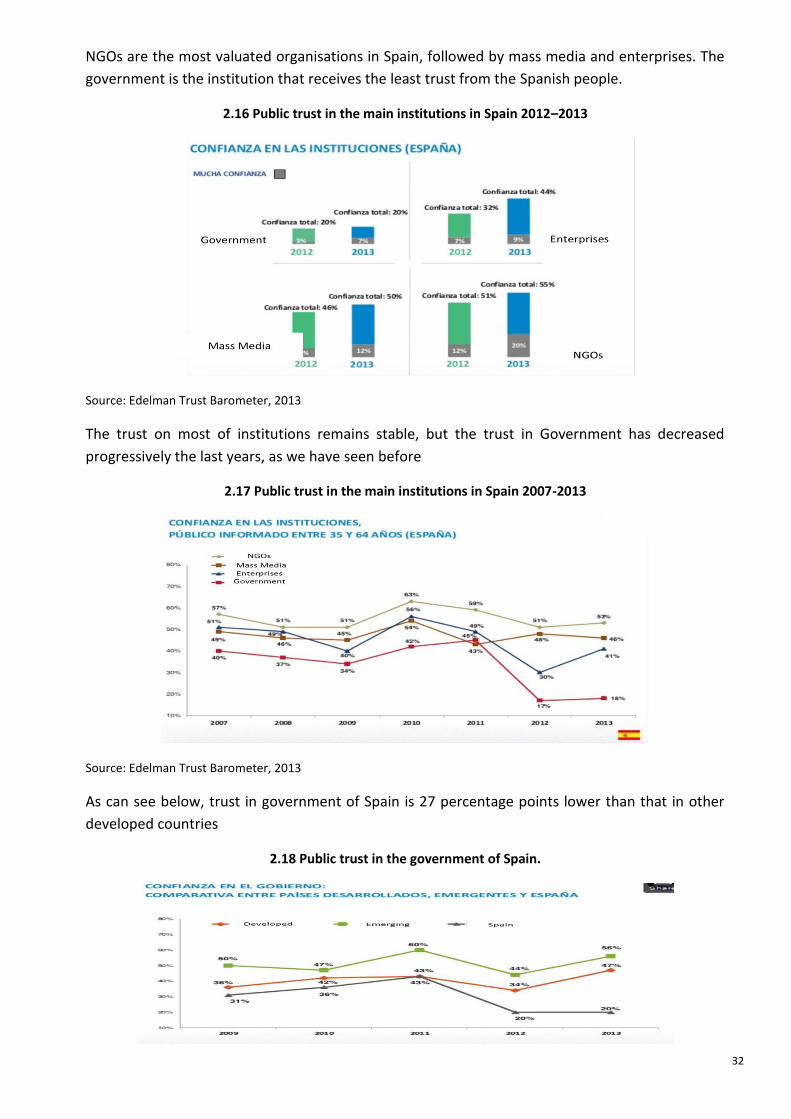
NGOs are the most valuated organisations in Spain, followed by mass media and enterprises. The
government is the institution that receives the least trust from the Spanish people.
2.16 Public trust in the main institutions in Spain 2012–2013
Source: Edelman Trust Barometer, 2013
The trust on most of institutions remains stable, but the trust in Government has decreased
progressively the last years, as we have seen before
2.17 Public trust in the main institutions in Spain 2007-2013
Source: Edelman Trust Barometer, 2013
As can see below, trust in government of Spain is 27 percentage points lower than that in other
developed countries
2.18 Public trust in the government of Spain.
33
Source: Edelman Trust Barometer, 2013
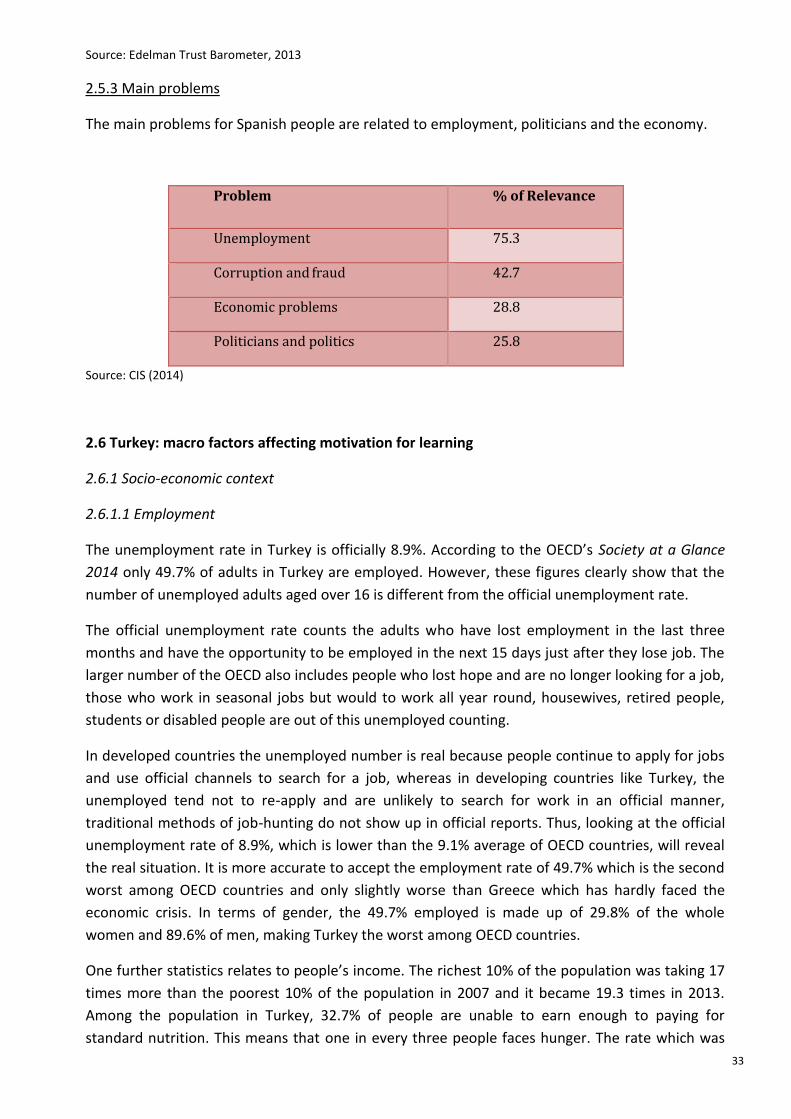
2.5.3 Main problems
The main problems for Spanish people are related to employment, politicians and the economy.
Problem % of Relevance
Unemployment 75.3
Corruption and fraud 42.7
Economic problems 28.8
Politicians and politics 25.8
Source: CIS (2014)
2.6 Turkey: macro factors affecting motivation for learning
2.6.1 Socio-economic context
2.6.1.1 Employment
The unemployment rate in Turkey is officially 8.9%. According to the OECD’s Society at a Glance
2014 only 49.7% of adults in Turkey are employed. However, these figures clearly show that the
number of unemployed adults aged over 16 is different from the official unemployment rate.
The official unemployment rate counts the adults who have lost employment in the last three
months and have the opportunity to be employed in the next 15 days just after they lose job. The
larger number of the OECD also includes people who lost hope and are no longer looking for a job,
those who work in seasonal jobs but would to work all year round, housewives, retired people,
students or disabled people are out of this unemployed counting.
In developed countries the unemployed number is real because people continue to apply for jobs
and use official channels to search for a job, whereas in developing countries like Turkey, the
unemployed tend not to re-apply and are unlikely to search for work in an official manner,
traditional methods of job-hunting do not show up in official reports. Thus, looking at the official
unemployment rate of 8.9%, which is lower than the 9.1% average of OECD countries, will reveal
the real situation. It is more accurate to accept the employment rate of 49.7% which is the second
worst among OECD countries and only slightly worse than Greece which has hardly faced the
economic crisis. In terms of gender, the 49.7% employed is made up of 29.8% of the whole
women and 89.6% of men, making Turkey the worst among OECD countries.
One further statistics relates to people’s income. The richest 10% of the population was taking 17
times more than the poorest 10% of the population in 2007 and it became 19.3 times in 2013.
Among the population in Turkey, 32.7% of people are unable to earn enough to paying for
standard nutrition. This means that one in every three people faces hunger. The rate which was

34
26.6% in 2007 in contrast to the average of OECD countries where it is 13%, and now it is 32.7%, it
is very high.
Public spending in Turkey is 12.8% of the Gross National Product whereas it is 21.8% across OECD
countries and 25.1% for countries in the European Union (OECD, 2014).
2.6.1.2 Internal migration
There are large inequalities between the areas in Turkey. The west part of the country is the most
productive and the best place according to living needs; this gets worse the farther east you
travel. This may be a result of the countries geography. The land becomes higher from the west to
the east and socio-economic development worsens in the same direction. This stimulates to move
from the east of the country to the west. In addition, people migrate to the large cities. In 1950
around 18% lived in the cities, whereas in 2013 it was 76.8%.
2.6.1.3 Terrorism
The human, social and economic cost of PKK (Kurdistan Workers’ Party) is terrorism. Turkey has
been suffering from separatist terrorism and the political conflict it implies since the mid-1980s,
both of which are believed to have a negative impact on economic welfare.
By 1984, PKK resumed its first terrorist activities in the eastern provinces of Hakkari and Siirt. It is
reported that between 1984 and 2008, 32,000 militants, about 6,500 security force members, and
about 5,700 civilians were killed in PKK terrorist activities
According to different sources the direct and indirect cost of terrorism to Turkey is between 65
and 350 million dollars direct and 900 million dollar indirect. Measured in comparison with
educational costs, the direct cost of terrorism would pay for the building of 52,500 schools.
Besides, in Istanbul the average number of students in a class is 45 and the average in Turkey
overall is 36 per class (Dinçer Minister of National Education Turkey, 2012).
2.6.2 Vision 2023 Turkey
Targets:
- 25,000 dollars national income per capita.
- 500 million dollars outward trade.
- 1 trillion dollars oversea commerce capacity.
- Reduce unemployment to 5%.
- To own high technology, produce own planes and satellites.
- To be the logistics center of three continents.
- To complete DAP (East Anatolien Project) GAP (Southwest Anatolien Project) and be the
granary of the world.
- To reach 2 trillion dollar Gross National Product.
-
2.6.3 Trust in institutions
According to the Social Political Survey conducted by Kadir Has University in Istanbul in 2013
(which also makes comparisons with 2012 and 2011) we can say that the trust in institutions is
35
decreasing. The trust in Institutions are as follows in 2011; to the Army 59.9%, to the Police 52.7%
were over 50% and to the President just below 48,3%. Compared with 2013 there is just the Army
left over 50% (51.7%). There is a dramatic drop in trust to the Police 35.3% and to the President
40.7%. Besides there has been an election for the President and Prime Minister Erdogan became
the President in August 2014. The results for some others are as follows: The trust to the
Government 33.5%, to the NGO’s 32.7%, to The Parliament 28.3%, to the Judiciary 26.5%, to The
Council of Higher Education 23.3%, to the Political Parties 21.7% and to the Media 19%.
The judiciary is very important and in the same survey respondents were asked if the judiciary is
independent: 59.7% said ‘no’ and 24.2% said ‘yes it is independent’; others made no comment,
whilst 58.4% said that the judiciary is politicised.
2.7 Macro factors: common traits and differences
This chapter on macro factors has highlighted some of the common factors among the partner
countries. These are briefly discussed in this paragraph starting from the problem of the
unemployment related to each partner country except Denmark.
A second trait, for some partner countries is the fight against corruption and the decrease in
institutional trust. All partners considered it important to address the problem of trust in
institutions. The most confident country among the partners is Denmark, where the confidence in
public authorities (both municipal and regional) is 73% compared with 34% in Poland, 31% in
Greece, 19% in Spain and 18% in Italy (EU average: 44%)5.
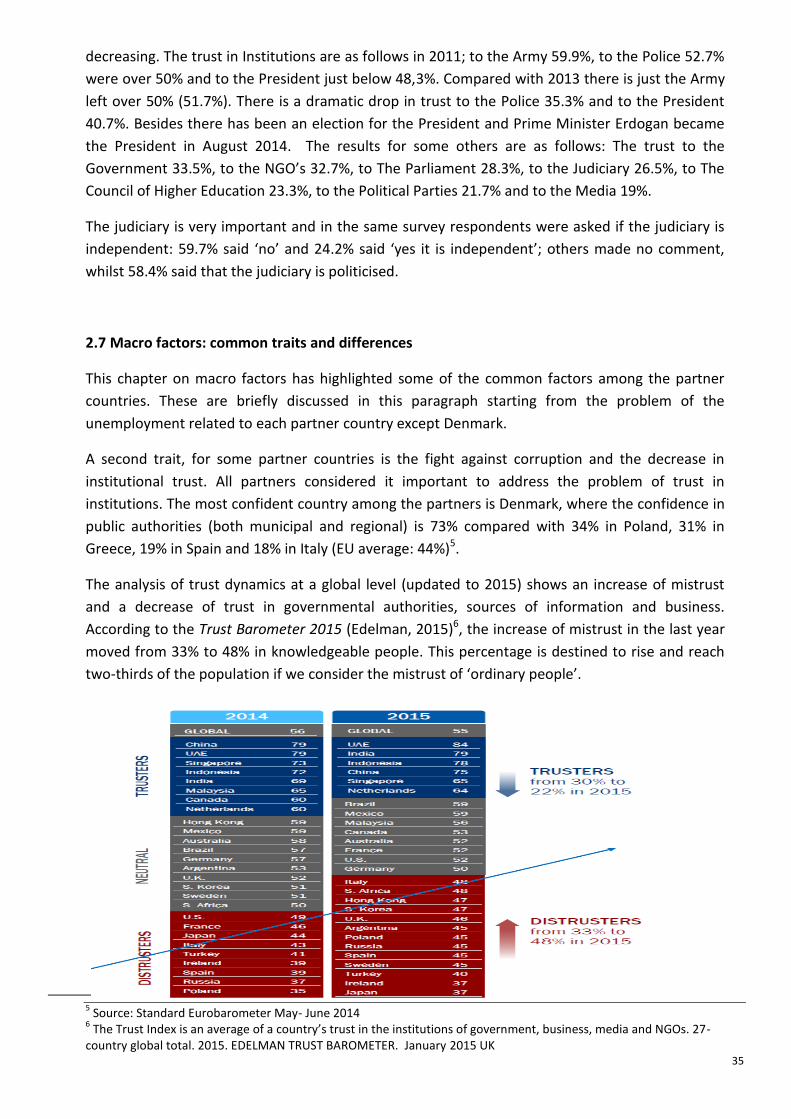
The analysis of trust dynamics at a global level (updated to 2015) shows an increase of mistrust
and a decrease of trust in governmental authorities, sources of information and business.
According to the Trust Barometer 2015 (Edelman, 2015)6, the increase of mistrust in the last year
moved from 33% to 48% in knowledgeable people. This percentage is destined to rise and reach
two-thirds of the population if we consider the mistrust of ‘ordinary people’.
5 Source: Standard Eurobarometer May- June 2014
6 The Trust Index is an average of a country’s trust in the institutions of government, business, media and NGOs. 27-
country global total. 2015. EDELMAN TRUST BAROMETER. January 2015 UK

36
In all countries, the relationship between skills proficiency and economic and social well‐being
shows that proficiency in literacy, numeracy and problem-solving in technology‐rich environments
is positively and independently associated with employment, and with higher wages. In all
countries, individuals who score at higher levels of proficiency in literacy are more likely to be
independently associated with the probability of participating in the labour market and being
employed, and earning higher wages. They also have a higher level of trust in others and believe
they can somehow impact on political processes (OECD, 2013).
In terms of the lack of basic skills, the need expressed by people to use ICTs for many everyday
tasks is around 23% (or higher) in Italy, Poland, and Spain. Even among adults with computer skills,
most scored at the lowest level of problem-solving on the technology‐rich environments scale
(OECD, 2013).
Referring to our research and in particular to Report 1 (chapter 4), the overview of educational
status in the partner countries highlighted that the country with the greatest number of MAs
involved in educational activities is Denmark, followed at a much lower level by Spain and Italy.
Greece, Poland and Turkey have very low educational participation of MAs in both formal and
non-formal education. At the same time, also in Report 1, it is noted that Denmark is the country
with the highest percentage of MAs with HE degrees.
An issue that is interesting to deepen is to what extent does institutional trust influence the
propensity of mature adults to learn and how it is possible strengthen the resilience of people and
promote the desire to learn, especially at a time of such great economic and social challenges.

37
Chapter 3: Facts and figures of partner countries lifelong learning
3.1 Introduction
An ageing population in most European societies has led to policies on extending the working age.
Today in the EU there are 85 million citizens over 65 and by 2060, this number will rise to 151
million. This increase of the population means men and women across Europe spending longer in
work. At the same time, the lifespan of companies is getting shorter as firms have to change to
survive. Individuals spending their entire working lives in one company, or even one industry, will
become a rarity. Workers have to follow these changes if they want to remain employed.
Education and qualification gained in youth have to adjust to the changing demands of the job
market. The necessity for lifelong learning (LLL) has been understood and accepted by all
European countries. Many of these countries have introduced special programmes to help older
workers maintain their attractiveness to employers and have succeeded in considerably increasing
employment levels among older workers (Denmark, Finland). In some countries, however, the
rate of employment for people over 50 years of age is improving very slowly (Poland, Turkey).
Studies have shown that the effort undertaken by the state must be consistent with people’s
willingness to learn. However, older workers often declare that they have a low level of interest in
continuing education and lack motivation to engage with it. Finding the reasons behind this
attitude and the ways to change it is the subject of the learning partnership.
For this Report of the GRUNDTVIG project, Innovations in Mature Adult Learning (IMAL), we have
considered it necessary to provide a general overview about Mature Adults —MAs — (defining
them as people aged over 45), including statistics on their educational status, their involvement in
educational actions (by type of education, place in which these activities occur and the area to
which they belong), the source of financing and the cost of MA education, the factors that
facilitate these people to undertake educational activities and the obstacles that they encounter.
To develop this statistical study we have collected data about the six participant countries
(Denmark, Greece, Spain, Italy, Poland and Turkey), using EUROSTAT as the primary source in
order to have the opportunity to compare the figures and data.
3.2 Educational status overview in partner countries
3.2.1. The level of education
First, we consider it important to provide a general overview of the MA’s profile in the six
participant countries. To do that, we have collected current statistical data broken down by:
Age group

38
o 45–54
o 55–65
o >65
Level and structure of education
o Primary (P)
o Secondary (S)
o Higher Education (HE)
Sex
o Female (F)
o Male (M)
Status of employment
o Working
o Non-working
As can be seen in Figure 3.1, in all the countries that have been analysed in this study the trend
toward achieving higher education is noticeable for both men and women in the younger group
(45–54). Thus, the first conclusion we can draw is that there is an increasing trend among adults
towards acquiring some form of qualification in higher education. However, with the exception of
Denmark (the country with the highest percentage of MAs with HE degrees), the usual situation is
that there is a much higher percentage of MAs between the primary and secondary levels than in
HE, this is especially true of Italy, Poland and Turkey, where the percentages of MA graduates in
HE does not exceed 20% in the case of Poland or 13% in Italy and Turkey.
In terms of age, in all countries, as already noted, the youngest MA group (45–54) has a higher
level of education than the 55–65 group. This difference is particularly significant among Spanish
women for whom the index of people with HE is more than double in the youngest age group
(27% MA aged from 45 to 54, compared to 12.7 % of MA between 55 and 65 years old).
Analysis of the data by sex reveals that, except for Denmark, we find more HE graduated men than
women, although the differences tend to be reduced if we consider the younger age group,
equalling the situation in some cases (such as Spain and Greece), or even with the proportion of
women in HE surpassing that of men (as in the case in Poland).

39
Figure 3.1. Level of education of MA (by sex and age)
Source. EUROSTAT, 2012 (Tables: Persons with lower secondary education attainment by age and sex (%) [edat_lfse_05]; Persons with upper secondary education attainment by age and sex (%) [edat_lfse_06]; Employees with a given education attainment level by sex, age groups and occupation (%) [edat_lfs_9905]
Statistics shows a positive correlation between the type of education and employment, especially
in the older age groups. Better educated people more often have full-time long-term job
contracts, earn more, more often postpone retirement and participate in formal and non-formal
education (OECD, 2005). They are also less threatened by layoffs and unemployment (OECD,
2011). The concept of the knowledge society has made its way to the public consciousness. There
are many visible signs of the rising value of education in the labour market and this trend will
continue.

40
On the other hand, we have collected data on the correlation between the level of education and
status of employment.7 From this data we find significant differences among the analyzed
countries. For example, in Greece there is a significant relationship between a higher educational
level and being in working (41% of workers between the ages of 55 and 74 have higher education),
a fact that is not repeated in countries such as Spain or Turkey where the majority of workers in
this age group have elementary education (49.6% and 63.6% respectively). In Denmark, Italy and
Poland, secondary education is the most common for workers aged between 55 and 74 (41.9%,
41.4% and 67.5% respectively).
Figure 3.2. Status of employment: people aged 55–74 (working)
Source. EUROSTAT, 2012 (Tables: Persons with lower secondary education attainment by age and sex (%) [edat_lfse_05]; Persons with upper secondary education attainment by age and sex (%) [edat_lfse_06]; Employees with a given education attainment level by sex, age groups and occupation (%) [edat_lfs_9905])
7 This is for people between 55 and 74 years old because those are the data provided by EUROSTAT.

41
3.2.2 Forms of learning
Turning now to the main object of our study, the education of MAs, we can see in Figure 3.3, that
the country with the greatest number of MAs involved in educational activities (both formal and
non-formal) is Denmark and this is true for two of the age groups considered (28.8 % of people
aged 45 to 54, and 22.9 of those between 55 and 74). At a much lower level, Denmark is followed
by Spain (8.1% and 4.8 % respectively) and Italy (4.8% and 2.3%). In Greece, Poland and Turkey the
index of MAs that undertake educational activities is between 0% and 2%, and those who
participate in formal education do not exceed 0.5%.
In terms of type of education, the majority of MAs in both age groups have no formal education in
all of the studied countries. For example, in Denmark formal education does not exceed 2.2% for
people aged 45 to 54, compared to 27.6% of non-formal education for the same age group in that
country. This primacy of non-formal education is even more evident for the oldest age group (55–
74 years) where formal education does not exceed 0.3% in Spain for the same age group.
Figure 3.3. Forms of learning by age group (45–54/55–74)
Source. EUROSTAT, 2012 (Table: Participation in education and training by type, sex and age groups - % [trng_lfs_09]

42
3.3 The educational offer for MAs in partner countries
Once we have seen the involvement of MA in relation to formal and non-formal education, we
must address the educational offer for this population group. However, when comparing data
from the countries studied, (for which we were obliged to use EUROSTAT as the primary source),
we found that with regard to educational provision this data is not disaggregated using the
variable ‘age’. Therefore, the conclusions presented here about the place and the areas of
educational courses for adults include the entire population over 18 years old. Moreover, we do
not have any data for Turkey on this heading (Eurostat, 2011a).
As shown in Figure 3.4, for the set of all five countries analysed, employers are the main providers
of educational activities for adults, ranking first for Denmark (33.3 %), Italy (31.7%) and Greece
(19.2%). This is followed by training institutions delivering various courses (e.g. ZDZ, Zakłady
Doskonalenia Zawodowego- The continuous vocational training Institutes), which are especially
relevant for Polish adults (53.6%). The formal education institutions rank third in the list of
providers in the five countries, and the participation of adults within them ranges from 8% to 14%.
In the case of Spain the main adult education providers, with 22.4 %, are non-commercial
institutions whose main activity is not training, followed by the commercial institutions whose
primary activity is not education (16.1%). Other institutions are important for Greece (19%), Italy
(13.3%) and Denmark 12.3%). Individuals are only relevant for the Greek case (13.1%), and
employers organizations and chambers of commerce, trade unions and non-profit organisations do
not represent important sources of adult learning in the 5 countries analysed.
Figure 3.4. Educational offer for MA (where?)
Source. EUROSTAT, 2011a (Table: Distribution of non-formal education and training activities by provider [trng_aes_170])
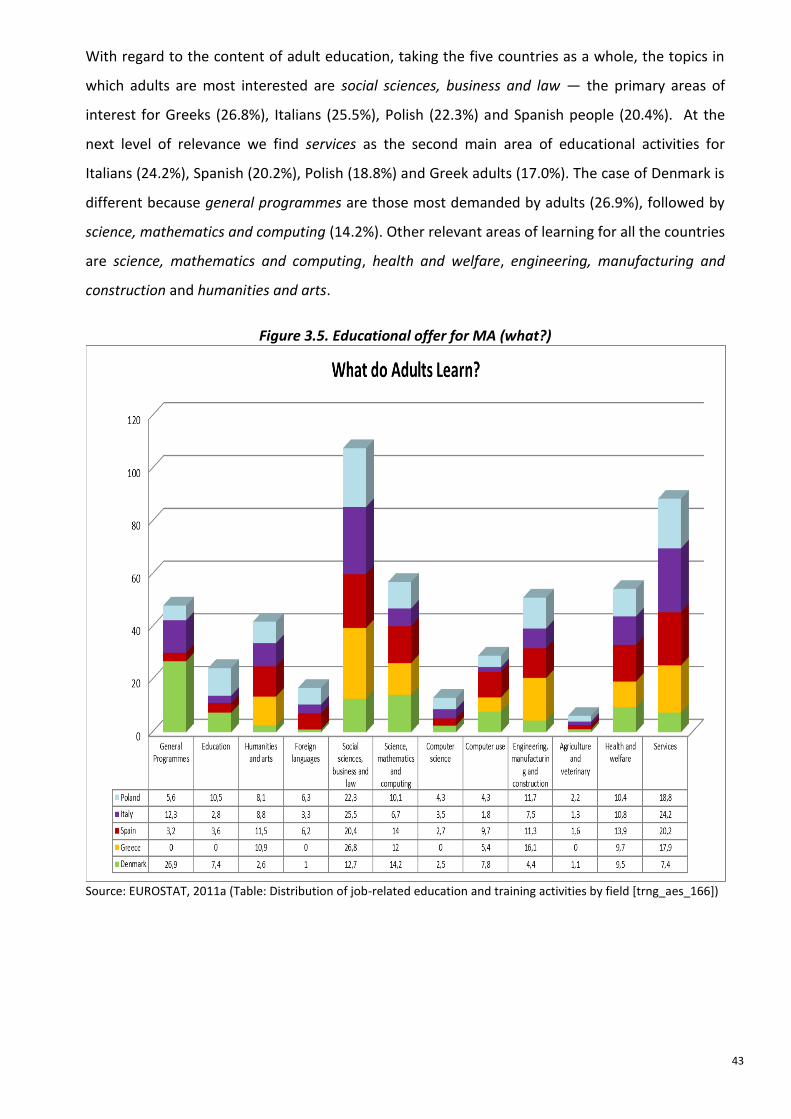
43
With regard to the content of adult education, taking the five countries as a whole, the topics in
which adults are most interested are social sciences, business and law — the primary areas of
interest for Greeks (26.8%), Italians (25.5%), Polish (22.3%) and Spanish people (20.4%). At the
next level of relevance we find services as the second main area of educational activities for
Italians (24.2%), Spanish (20.2%), Polish (18.8%) and Greek adults (17.0%). The case of Denmark is
different because general programmes are those most demanded by adults (26.9%), followed by
science, mathematics and computing (14.2%). Other relevant areas of learning for all the countries
are science, mathematics and computing, health and welfare, engineering, manufacturing and
construction and humanities and arts.
Figure 3.5. Educational offer for MA (what?)
Source: EUROSTAT, 2011a (Table: Distribution of job-related education and training activities by field [trng_aes_166])
44
3.4 The cost and financing MAs’ education. 3.4.1 Sources of finance for training
Due to the fact that each country has different methods and sources for financing training, we
focus here on each partner separately.
In Denmark as in any other country, finances do play a role. For the mature adult, it is possible to
receive the same student grant (SU) as younger students. It is also possible to receive a grant that
is specially designed for adults (SVU). It is higher than the SU. In addition, there is a job rotation
scheme which gives an employee the possibility of receiving extra training without having to pay
anything. There are also other forms of support and grants. Because of the plethora of ways in
which a potential student can receive financial aid, it is not possible to devise a list that contains all
the various financial contributions (such as the one that has been created for Spain).
In Greece, all financing solutions need to answer the question, ‘who pays’ or ‘who could pay’ for
adult education: there are four possible sources of money for learning:
The individuals, i.e., the participants or ‘customers’ of adult education or related
persons,
The total or groups of the workforce,
Private organisations (companies, unions, foundations, corporations, educational
institutions),
The state (comprising the different state levels).
The spending on human resources (public expenditure on education as a percentage of GDP) is
lower in Greece (4.2%) compared to the EU-25 average (5.1%, European Commission, 2007).
Public expenditure for Active Labour-Market Policy is among the lowest across the EU-27 (0.06%
for active expenditure against 0.52% in EU-27). The investment by enterprises in the training of
adults (direct cost and labour cost of participants divided by total labour cost) is also among the
lowest across the EU (0.9% comparing to 2.3% for EU-27). It must pointed out that 62.4% of the
total of employed people work in small enterprises (with fewer than ten people), where the
implementation of learning initiatives is rare.
In the National Reform Programme (2007–2013) specific emphasis is given on Active Labour-
Market Policies, especially on continuous vocational training. According to the National Reform
Programme, during the next programming period the participation of workers and self-employed
people in training is expected to increase from 0.9% in 2007 to 7% in 2015. The government has
also committed to increasing the spending on both formal education and active labour market
policies.
In Spain, according to INE (National Institute of Statistics, 2012) 35% of educational activities for
MAs are financed by the participants themselves, 31.5% by the public administrations, 26% by the
employer, and 5% by the employment office.
45
In this country, the adult basic education system is geared towards giving adults access to
education at all levels. It offers the possibility of pursuing basic literacy and primary education to
obtain the compulsory secondary education degree (educación secondaria obligatoria), and
secondary education to obtain the baccalaureate or secondary school diploma (Graduado en
Estudios secondaries, GES). There is exclusive access to university for adults aged 25 and over, to
Spanish for migrants, to other types of education such as languages or social guarantee
programmes (vocational training for people without qualifications) and also to help in the
preparation for exams for different levels of primary and secondary education. Adults can also
register for vocational training (formación profesional reglada) which is modular in nature but
access for adults is not easy, mainly because of scheduling. Opportunities for distance vocational
training are available, as are courses for taking exams to access vocational training.
Educational administrations cover adult basic education, and as there is a de-centralised
administrative model, responsibilities are distributed between the state, regional autonomies,
local administrations and education institutions. During the two decades the management of this
type of education has transferred to all local autonomies and, thus, there are different methods of
development. Some may be provided in adult education schools, others in regular schools during
evening courses, others may have rooms in select centres.
The labour administration covers employment-related matters and, therefore, is involved in the
promotion of adult vocational training. The Public Employment Service (Instituto Nacional de
Empleo, INEM) is a self-governing agency that organises vocational training for the unemployed,
although these activities have been transferred to most regional autonomies to manage active
labour policies in cooperation with the INEM. There are 28 National Vocational Centers spread
throughout Spain and there are a large number of centres that are also entitled to provide this
type of training: authorised private centres (centros colaboradores), social partner organisations,
and authorised public or private training agencies.
In Spain there is public support for workforce training and development through a training levy
scheme initiated in 1993. Under this levy scheme employers pay 0.7% of their payroll into a
training fund administered by the Tripartite Foundation for Training at Work (previously called
Fundación para la Formación Continua, FORCEM) composed of employers, trade unions and
government representatives. Companies with over 100 employees can submit individual plans
whilst small and medium-sized enterprises need to join forces and submit sectorial or territorial-
based group plans. Individuals may also request individual training grants.
Finally, there are the so-called socio-cultural activities oriented to the development of culture and
social participation. Socio-cultural learning is much more diversified than educational provisions
and is carefully regulated and financed by each Autonomous Community.

46
In Italy the main programmes that provide funding for lifelong learning are: Comenius (57.4%), FSE
(National Operational Programme — Pon and Regional Operational Programme —Por) (30.6%),
LLL Leonardo Da Vinci (22.3%); family contributions (17.2%); and other public financings (10.3%)
(Censis, 2012).
In terms of the cost of non-formal education, these were incurred as follows: Mas, 40.3%;
employers, 50.7%; public institutions, 3.6%; family, 8.5% (ISTAT, 2012)
In Poland the high cost of training and educational courses is often used as a reason for weak
participation in lifelong learning. For many decades supporting lifelong learning has been placed
very low on the list of Poland’s socio-economic priorities. However, as Poland began its
preparation to join the European Union, the situation started to change. Data show a significant
growth in the amount of funds devoted to lifelong learning after 2006 (from approximately PLN
400 million in 2001 and 2002 to about PLN 5 billion in 2007). It expected that in the near future
(approximately by 2015), a further round of EU funds will stabilise the amount of public
expenditure in this area at the level of PLN 2.5–3 billion annually. One fifth of this money comes
from the Labour Fund. For instance Denmark, the country with the highest participation level in
lifelong learning, in 2006 allocated the equivalent of around PLN 9 billion to this area (OECD,
2007); this is three times greater than in Poland (although Polish GDP adjusted for the purchasing
power standard (PPS) is three times higher than the Danish one).8
Table 3.1. The cost incurred for non-formal education by labour status
Category Employed Unemployed Economically inactive
Average
(%)
Employer 73.0 22.0 14.0 36.0
Own money 17.0 20.0 15.0 17.3
Other institution (EU)
10.0 27.0 15.0 17.3
Labour Office 2.0 22.0 2.0 8.7
Family/friends 1.0 11.0 14.0 8.7
Several sources 3.0 2.0 1.0 2.0
Source: BKL 2011
Employers spend money mainly on training their workers. Up to 90% of such funds may come
from EU funds designed to encourage companies to organise training. To a lesser degree, they also
finance the education of displaced workers and economically inactive people. The money for these
groups comes to firms from the Labour Office as a tool for the activation of the unemployed.
Unemployed people receive support from the Labour Office, but, in contrast with employed or
economically inactive people, unemployed people more commonly, they use their own money to
8 In 2006, Danish GDP reached approximately USD 191 billion, whereas Polish GDP equaled USD 561 billion. Facts and Figures,
(2007), OECD.

47
pay for courses and training. Detailed research confirms this tendency.9 Employers bear the
biggest cost of training. In the age group 50–59, employers finance a similar ratio of men to
women, but in the younger age group there is a 15% difference in favour of men. This can be
explained by the fact that men, more often than women, perform technical occupations that
demand more sophisticated skills.
Table 3.2. The source of financing non-formal education by sex, 2013
Category Women Men
45-49 50-59 45-49 50-59
Own money 53.5 31.5 41.2 35.5
Employers 34.9 54.2 50.0 53.1
EU 20.5 18.1 2.9 3.2
Labour Office 4.5 4.2 8.6 3.2
Other 6.8 5.6 2.9 9.4
This is a reason why women in this category are more likely than men to use their own money
(53.5% vs. 41.2% respectively), whereas in the older group, 50–59, men spend 4% more than
women. EU Funds seek to compensate for this difference and women benefit seven times more
often than men from its funding. This gender orientation is a result of projects that have been
devoted only to women aged 45+ during recent years. The Labour Office spends most on training
for men in the younger age category (BLK, 2010).
In conclusion, the types of funding depend on gender. Women, more often than men, use EU
funding, whereas men are more likely than women to receive finance from employers. There is
also a different pattern of education for women and men aged 45/50+. In all age groups, the rate
of learning is higher for women. Those women who, for various reasons, decide to continue
learning commit their money for this purpose more often than men. They may feel less secure at
work and try to strengthen their position. A similar determination may be observed among
unemployed and economically inactive people who are highly motivated to return to the job
market.
In Turkey the central government is responsible for all public educational expenses, about 10% of
the general budget is allocated for national education.
The Public Education Centres are under the control of the Ministry of National Education and
every citizen who demands any education is able to receive it; the only condition is that at least 12
people should demand the same education.
The number of attendances on courses in 2012 provides a context for the importance that the
central government places on public education by supporting free classes. The number of such
classes is 3, 299563.
9 Diagnoza obecnej sytuacji kobiet i mężczyzn 50+ na rynku pracy w Polsce (2012), Łódź, p. 146

48
There are also many profitable NGOs in the area of mature adults education because they offer
better conditions, places and materials for study.
3.4.2 Mean amount of money spent by participant on education and training From the Eurostat data (see Figure 3.7) we can see that the amount of money spent per MA
participant is much higher in formal education than in non-formal education in all countries,
despite the fact, as we have seen previously, that this is a type of education much less demanded
by the adult population education. Such formal education spending ranges from EUR 359 per
participant in Turkey to 1308 EUR in Greece. Greece is the country that spends the most money on
MA education, both in formal education (1308 euros per participant) and informal education (EUR
196 per participant), followed by Denmark (EUR 739 formal and EUR 80 non-formal), Spain (EUR
703 and EUR 140 ), and Poland (EUR 681 and EUR 39). In absolute terms, but with a higher volume
of spending on non-formal education (EUR 172) than Denmark, Spain and Greece, is Turkey, which
spends EUR 359 per participant on formal education and EUR 172 per participant on non-formal
education, making it the second ranking country that expends more money non-formal learning.
Eurostat data does not this provide information for Italy so we were unable to include it in our
comparison.
Figure 3.7. Mean amount of money spent by participant on education and training (45–65 years)
Source: EUROSTAT, 2007a. Mean amount of money spent by the participant on education and training by age groups [trng_aes_157]

49
3.5 Factors motivating/conditioning MAs to undertake learning
Learning is at the core of human development and it is part of the human development from birth
until death. In other words, learning is continually evolving and humans are constantly carrying
out development tasks to serve the various stages of the vital process at each stage of life. For this
reason, learning is understood as a process of permanent change in a person's behaviour
generated by their experience (Feldman, 2005). The mere fact of moving from one stage to
another within the life cycle is evidence of that change. The development tasks each person
requires at each life stage tends to evolve. In this sense, it is commonly accepted that these
requirements are connected to motivation, understood as the set of processes involved in
activation, address and maintenance of conduct (Beltrán, 1990).
Houle (1974), points out that one of the most studied aspect of adults’ education has been the
motivational field. Perhaps when we speak of the participation of adults in education, we infer
that it is a voluntary activity. Theoretical studies in this area have attempted to identify and
classify the reasons why adults enter learning, that is, on the assumption that it is possible to know
the reasons or causes that they are following when making the decision. The motivational
dimension in adults is an essential element for their learning, whilst it drives them to action, at the
same time, it orients and commits them. The complex construct that influences behaviour
maintains a close relationship with other concepts such as interests, needs, values and aspirations.
According to Eurostat statistics regarding the six participant countries in this project, the most
relevant reason for participation in non-formal education and training for MAs aged 45-54 and 55-
65 is to do job better and/or improve career prospects. If we focus on each country, the main
reason for all of them, with the exception of Polish people, is to increase knowledge/skills in an
exciting subject. The third main reason for all the countries is to acquire knowledge/skills that are
useful in everyday life. So, we can conclude that the primary motivations for MAs are both external
(promotion in their jobs, vocational adjustment) and internal (personal satisfaction acquiring new
knowledge), thus contributing to the idea that MA education is a multi-dimensional and complex
issue.

50
Figure 3.8. Distribution of reasons for participation in non-formal education and training (45–54 years)
Source: EUROSTAT, 2007b (Table: Distribution of reasons for participation in non-formal education and training, by age group (trng_aes_143)
Figure 3.9. Distribution of reasons for participation in non-formal education and training (55–65 years)
Source: EUROSTAT, 2007b (Table: Distribution of reasons for participation in non-formal education and training, by age group (trng_aes_143)

51
3.6 Factors for declining from/not undertaking continued education by MAs
The reasons behind a negative attitude toward education in older age are also complex. Some are
connected to external factors such as the absence of suitable training. Specialists observe that
even in countries where formal and organisational obstacles have been removed, older workers’
resistance towards education still exists. This matter requires deeper analysis from sociological,
cultural, psychological, pedagogical and even medical perspectives, and proposed solutions will be
of a multi-fold in character.
The learning partnership will capitalise on the knowledge and practice of specialists and
teacher/trainers working in their organisations and other players involved in organising and
conducting education for older workers in partner countries in order to (1) extract the most
practical approaches for motivating towards lifelong learning and to (2) specify the best pedagogy
for teaching older workers. It will also (3) look at stereotypes and analyse what steps and actions
can be undertaken to modify and change the social attitudes and perceptions, and consequently
the self-image, of older workers.
In the long-term the objective is to ensure that: (1) the group of older workers benefits from the
project by obtaining new insights into the issue of continuing education and breaking the
prevailing stereotypes that hinder the natural human drive towards development. They may
develop new attitudes toward ageing and learning in working life and society. (2) The project aims
to change social opinion on education among older people and to increase the involvement of
older workers in the process of lifelong learning. (3) The project will also provide new educational
tools for community specialists and teacher/trainers involved in organising and conducting
education for older workers. (4) The project will create a partnership between stakeholders in
society, addressing the demographic learning challenge.
Eurostat statistics can clarify the factors that may result in it being inconvenient for MAs to
participate in education. The most relevant stated obstacles for both age groups in Denmark,
Greece and Poland were that the course was not needed for the respondents’ job. For Greece,
Spain and Italy (and the second ranked reason for all of the other countries) the main obstacle was
family responsibilities, especially for people aged 45 to 54. If we focus on more elderly people (55–
65), personal reasons and health and age become relevant reasons for not undertaking continuous

52
education. We may thus conclude that the obstacles are more external for MAs aged 45–55 and
more internal for MAs aged 55–65.
Figure 3.10. Obstacles to participation in lifelong learning (45–54 years old)
Source: EUROSTAT, 2011b (Table: Obstacles to participation in lifelong learning by age group. trng_aes_177)

53
Figure 3.11. Obstacles to participation in lifelong learning (55–65 years old)
EUROSTAT, 2011b (Table: Obstacles to participation in lifelong learning by age group. trng_aes_177)
In sum, according to Eurostat database the access to education for mature adults is widening and
involving a greater breadth of profiles especially social groups traditionally excluded from
education (such as people over 65 and women). However, there are significant differences among
the countries analysed in terms of access to education, educational offer or sources of finance for
the training. This factor prevents us from being able to draw general conclusions as it is necessary
to understand the macro factors specific to each country that can explain the differences among
them (as can be seen in Chapter 2 of this report). However, from the official statistics we can
assume that motivational factors for accessing education are, in general, more external for MAs
aged 45–54 (such as promotion in their jobs, vocational adjustment, etc.) and more internal for
MAs aged 55–65 (personal satisfaction, acquiring new knowledge, etc.). Given these factors, a first

54
approach to understanding motivation as a complex and multi-dimensional issue is to examine it
empirically (see Chapter 4).

55
Chapter 4: Partnership research results on mature adults’ motivation to learn and
training preferences
4.1 Aims of the survey
On the basis of the theoretical framework arising from the literature review, the main objective of
the survey was to investigate the needs and motivations to learn of mature adults in the six
countries involved into the project. In particular, the questionnaire used in the survey aimed at
exploring the conditioning factors of mature adults’ learning choices and those that support
motivation.
Due to lack of resources the aim of the survey was not to produce representative data for each
country, , but to attempt to build an investigation tool that could be used in different national
contexts as a mechanism for collecting information about adults’ learning attitudes. However, the
methodological design of the survey and of data analysis has been conceived consistently with a
more general explorative aim that includes the collection of evidence-based data.
4.2 Methods and data collection
The main tool of the survey was an online questionnaire that was first created in English and
subsequently translated into the six languages of the Project partners.
The anonymous questionnaire covers several topics, starting from a general chapter devoted to
the collect personal data, i.e., nationality, age, sex, employment condition, educational
attainment. First thematic chapter of the tool was dedicated to past educational and learning
experiences using variables that explored the influences on the educational pathways followed
and their consistency with subsequent work pathways. Second thematic chapter asked questions
about learning needs, influences on the needs themselves, as well as interests and preferences.
The third chapter included variables related to concrete opportunities to learn and their
effectiveness in different life spheres. Final chapter covered different dimensions of the
motivation to learn, i.e., the easing, the hindering, and the commitment factors. What resulted
from this structure is a set of 111 variables, personal ones included.
According to the need for measuring behaviours, attitudes and opinions, all the variables
(excluded the personal ones) used evaluation scales in order to ease both exploratory multivariate
analysis (factor analysis, cluster analysis) and reliability tests (the variables measure exactly what
they have to).
The questionnaire was administered online (via Google and SurveyMonkey) in order to reduce
costs and to assist each partner country to better reach the target sample. Choices made by
partners differed according to the potential to reach (via email) groups of mature adult learners,
with a preference for those who had experienced any kind of learning activity during the last two
years. Thus, the two major constraints to sampling were the pre-selection of respondents
according to those who had an email address, and also the involvement of respondents concretely
reachable among people who attend the social environment of the partner organisations. These

56
two factors led, as it will be better explained in the following paragraph, to different sizes and
compositions of each country sample.
With the aim to collect as much data as possible, the duration of the questionnaire administration
was quite lengthy, extending between June 2014 and February 2015.
4.3 Data samples description
4.3.1 General sample and national samples
The administration of the questionnaire in the six languages of the different partners led to the
collection of a total of 1,066 completed or partially completed questionnaires. As shown in Table
4.1, the largest sample is the Italian one (n. = 460), representing 43.2% of the total sample. The
second national sample according to size is the Polish one (n. = 258), representing another quarter
(24,2%) of the total sample, although this is also the sample with the highest number of partially
filled questionnaires. The size of the Greek (n. = 111) and Spanish (n. = 106) samples are similar,
each representing about one tenth of the total sample. The smallest samples are the Turkish (n. =
83) and the Danish (n. = 48) ones, each representing less than one tenth of the total sample.
Table 4.1: Country samples
Country
Frequency Percentage Valid percentage
Cumulate percentage
Valid
Denmark 48 4.5 4.5 4.5
Spain 106 9.9 9.9 14.4
Greece 111 10.4 10.4 24.9
Italy 460 43.2 43.2 68.0
Poland 258 24.2 24.2 92.2
Turkey 83 7.8 7.8
Total 1066 100 100 100
4.3.2 Descriptive analysis
4.3.2.1 Personal characteristics
According to the differences in the composition of the samples and in their size, there is no
descriptive analysis (frequency distributions) with any statistical significance when applied to the
general sample. In the following paragraphs, as will be explained, multivariate analysis will be
introduced exactly in order to overcome the samples bias. In the present paragraph, and the
following one, the personal data of the respondents will be analysed always through contingency
tables by country, and mean scores of the thematic chapters will be analysed in the same way.
As reported in Table 4. 2, the Spanish sample is the one with the highest share of mature adults
aged 55 years or over (55.6%), whilst the Greek and Turkish samples are the ones with the lower
presence of mature adults (12.6% and 10.8% respectively) and in the latter case more than two
out of three Turkish respondents were younger than 45 years. Danish, Greek, and Italian samples
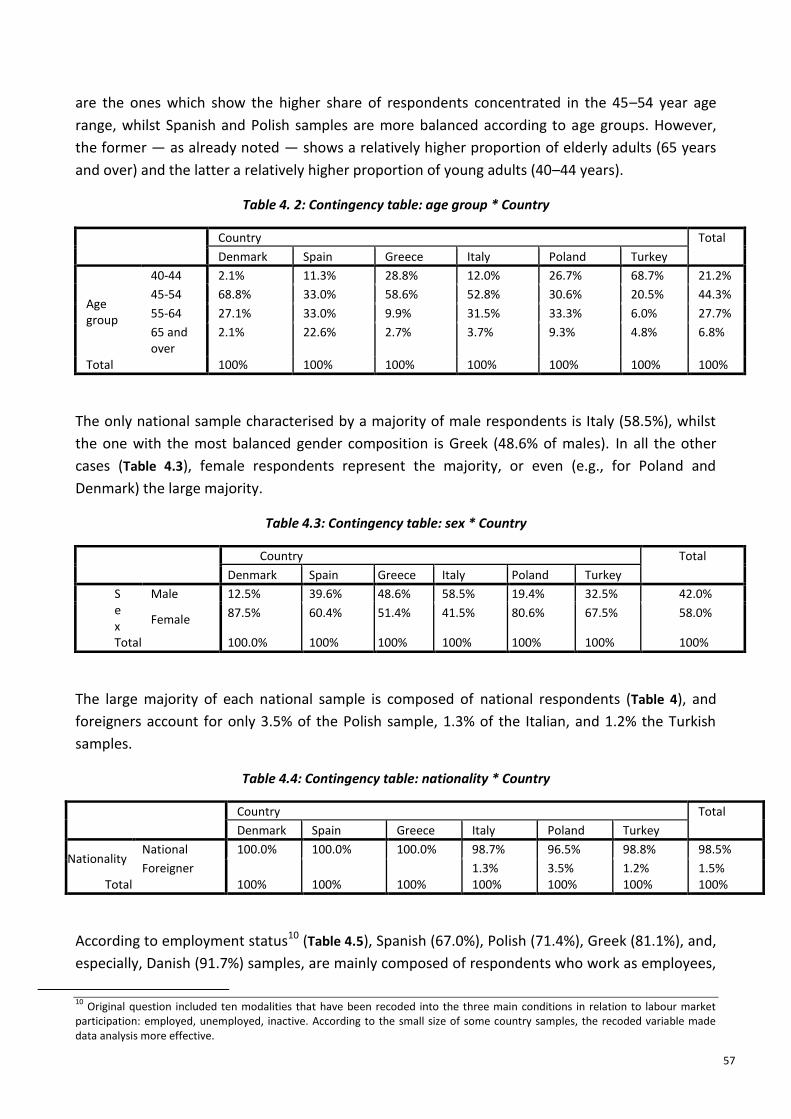
57
are the ones which show the higher share of respondents concentrated in the 45–54 year age
range, whilst Spanish and Polish samples are more balanced according to age groups. However,
the former — as already noted — shows a relatively higher proportion of elderly adults (65 years
and over) and the latter a relatively higher proportion of young adults (40–44 years).
Table 4. 2: Contingency table: age group * Country
Country Total
Denmark Spain Greece Italy Poland Turkey
Age group
40-44 2.1% 11.3% 28.8% 12.0% 26.7% 68.7% 21.2%
45-54 68.8% 33.0% 58.6% 52.8% 30.6% 20.5% 44.3%
55-64 27.1% 33.0% 9.9% 31.5% 33.3% 6.0% 27.7%
65 and over
2.1% 22.6% 2.7% 3.7% 9.3% 4.8% 6.8%
Total 100% 100% 100% 100% 100% 100% 100%
The only national sample characterised by a majority of male respondents is Italy (58.5%), whilst
the one with the most balanced gender composition is Greek (48.6% of males). In all the other
cases (Table 4.3), female respondents represent the majority, or even (e.g., for Poland and
Denmark) the large majority.
Table 4.3: Contingency table: sex * Country
Country Total
Denmark Spain Greece Italy Poland Turkey
Sex
Male 12.5% 39.6% 48.6% 58.5% 19.4% 32.5% 42.0%
Female 87.5% 60.4% 51.4% 41.5% 80.6% 67.5% 58.0%
Total 100.0% 100% 100% 100% 100% 100% 100%
The large majority of each national sample is composed of national respondents (Table 4), and
foreigners account for only 3.5% of the Polish sample, 1.3% of the Italian, and 1.2% the Turkish
samples.
Table 4.4: Contingency table: nationality * Country
Country Total
Denmark Spain Greece Italy Poland Turkey
Nationality National 100.0% 100.0% 100.0% 98.7% 96.5% 98.8% 98.5%
Foreigner 1.3% 3.5% 1.2% 1.5% Total 100% 100% 100% 100% 100% 100% 100%
According to employment status10 (Table 4.5), Spanish (67.0%), Polish (71.4%), Greek (81.1%), and,
especially, Danish (91.7%) samples, are mainly composed of respondents who work as employees,
10
Original question included ten modalities that have been recoded into the three main conditions in relation to labour market participation: employed, unemployed, inactive. According to the small size of some country samples, the recoded variable made data analysis more effective.
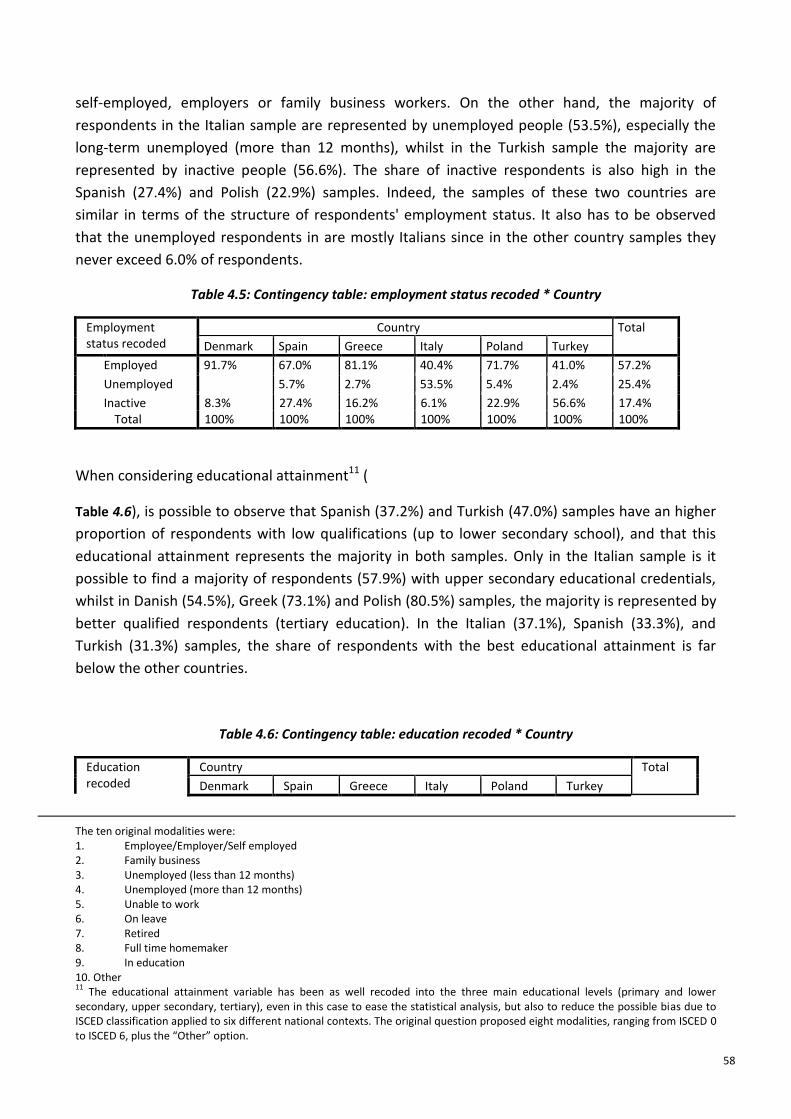
58
self-employed, employers or family business workers. On the other hand, the majority of
respondents in the Italian sample are represented by unemployed people (53.5%), especially the
long-term unemployed (more than 12 months), whilst in the Turkish sample the majority are
represented by inactive people (56.6%). The share of inactive respondents is also high in the
Spanish (27.4%) and Polish (22.9%) samples. Indeed, the samples of these two countries are
similar in terms of the structure of respondents' employment status. It also has to be observed
that the unemployed respondents in are mostly Italians since in the other country samples they
never exceed 6.0% of respondents.
Table 4.5: Contingency table: employment status recoded * Country
Employment status recoded
Country Total
Denmark Spain Greece Italy Poland Turkey
Employed 91.7% 67.0% 81.1% 40.4% 71.7% 41.0% 57.2%
Unemployed 5.7% 2.7% 53.5% 5.4% 2.4% 25.4%
Inactive 8.3% 27.4% 16.2% 6.1% 22.9% 56.6% 17.4% Total 100% 100% 100% 100% 100% 100% 100%
When considering educational attainment11 (
Table 4.6), is possible to observe that Spanish (37.2%) and Turkish (47.0%) samples have an higher
proportion of respondents with low qualifications (up to lower secondary school), and that this
educational attainment represents the majority in both samples. Only in the Italian sample is it
possible to find a majority of respondents (57.9%) with upper secondary educational credentials,
whilst in Danish (54.5%), Greek (73.1%) and Polish (80.5%) samples, the majority is represented by
better qualified respondents (tertiary education). In the Italian (37.1%), Spanish (33.3%), and
Turkish (31.3%) samples, the share of respondents with the best educational attainment is far
below the other countries.
Table 4.6: Contingency table: education recoded * Country
Education recoded
Country Total
Denmark Spain Greece Italy Poland Turkey
The ten original modalities were: 1. Employee/Employer/Self employed 2. Family business 3. Unemployed (less than 12 months) 4. Unemployed (more than 12 months) 5. Unable to work 6. On leave 7. Retired 8. Full time homemaker 9. In education 10. Other 11
The educational attainment variable has been as well recoded into the three main educational levels (primary and lower secondary, upper secondary, tertiary), even in this case to ease the statistical analysis, but also to reduce the possible bias due to ISCED classification applied to six different national contexts. The original question proposed eight modalities, ranging from ISCED 0 to ISCED 6, plus the “Other” option.

59
ISCED 0-2 37.1% 3.7% 5.0% 47.0% 10.0%
ISCED 3-4 45.5% 29.5% 23.1% 57.9% 19.5% 21.7% 38.8%
ISCED 5-6 54.5% 33.3% 73.1% 37.1% 80.5% 31.3% 51.2% Total 100% 100% 100% 100% 100% 100% 100%
4.4 Descriptive analysis (mean scores) by country
4.4.1 Thematic chapter CH: Looking at your main past educational and learning choices
As explained the first thematic section of the questionnaire was devoted to exploring the perceptions associated with the main past educational and learning choices of the respondents. This was addressed using three questions, all of which — as was the case in the rest of the questionnaire — were based on a scale with five modalities, ranging from Not at all/Never to Totally/Always. The first question in this section was composed of eight items, each of them thus representing a variable in the data matrix. The question explored the factors that represented the drivers in the choice of the highest level of education attended. As shown in
Figure 4.1 — and the same will be done for the rest of the questions –—is possible to identify the item that reached the highest mean score, in this case considering the total sample is CH1.5, ‘I followed my cleverness, talent, creativity’, and the lowest mean score, in this case CH1.6, ‘I was influenced by culture factors’. At the same time it is possible to appreciate — according to their different nature — the similarities and differences among country samples. For example, it is possible to consider how CH1.5, ‘I followed my cleverness, talent, creativity’, is much more important for the Danish sample than it is for all the other samples (where, in any case, the sample CH1.5 reaches always the highest score), and especially for the Turkish one. On the other side, for respondents of the Turkish sample almost all the other items of CH1 are a little more important than they are for respondents of the other country samples, and especially those related to family issues (CH1.7, ‘My choice was oriented to having enough family/personal time’, and CH1.4, ‘I followed my parents’ advice or family tradition’), and for the occupational choice (CH1.1, ‘I was influenced by those who offered the most employment opportunities or stability’).
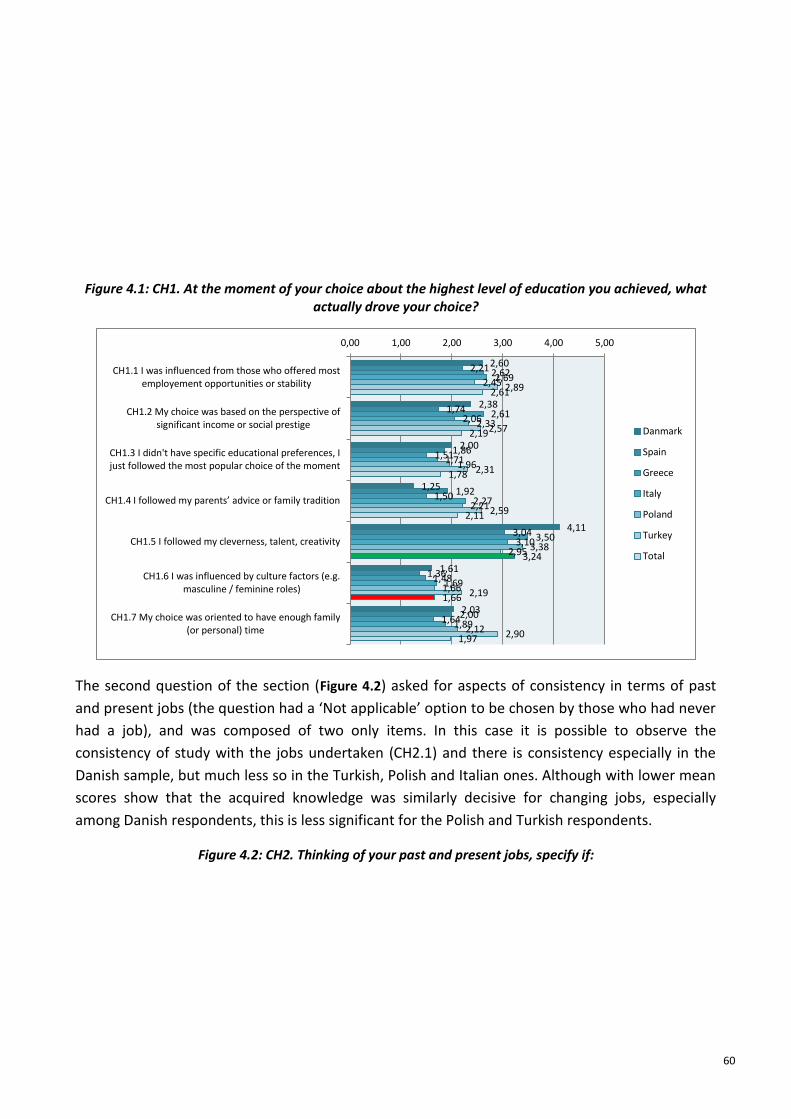
60
Figure 4.1: CH1. At the moment of your choice about the highest level of education you achieved, what actually drove your choice?
The second question of the section (Figure 4.2) asked for aspects of consistency in terms of past
and present jobs (the question had a ‘Not applicable’ option to be chosen by those who had never
had a job), and was composed of two only items. In this case it is possible to observe the
consistency of study with the jobs undertaken (CH2.1) and there is consistency especially in the
Danish sample, but much less so in the Turkish, Polish and Italian ones. Although with lower mean
scores show that the acquired knowledge was similarly decisive for changing jobs, especially
among Danish respondents, this is less significant for the Polish and Turkish respondents.
Figure 4.2: CH2. Thinking of your past and present jobs, specify if:
2,60
2,38
2,00
1,25
4,11
1,61
2,03
2,21
1,74
1,86
1,92
3,04
1,36
2,00
2,62
2,61
1,51
1,50
3,50
1,48
1,64
2,69
2,06
1,71
2,27
3,10
1,69
1,89
2,45
2,33
1,96
2,21
3,38
1,66
2,12
2,89
2,57
2,31
2,59
2,95
2,19
2,90
2,61
2,19
1,78
2,11
3,24
1,66
1,97
0,00 1,00 2,00 3,00 4,00 5,00
CH1.1 I was influenced from those who offered mostemployement opportunities or stability
CH1.2 My choice was based on the perspective ofsignificant income or social prestige
CH1.3 I didn't have specific educational preferences, Ijust followed the most popular choice of the moment
CH1.4 I followed my parents’ advice or family tradition
CH1.5 I followed my cleverness, talent, creativity
CH1.6 I was influenced by culture factors (e.g.masculine / feminine roles)
CH1.7 My choice was oriented to have enough family(or personal) time
Danmark
Spain
Greece
Italy
Poland
Turkey
Total

61
4.4.2. Thematic Chapter IL: Looking at your need
The second thematic chapter of the questionnaire was composed of four questions investigating respondents’ learning needs. The first question which was composed of six items (Figure 4.3) asked their opinion about the effectiveness of acquiring new knowledge and competencies (IL1.a/IL1.b) in different spheres of social and personal life. In general terms, it is possible to observe that differences in the mean scores are less evident, both when looking only at the total sample and also at differences among the country samples. Item IL1.b.5, ‘Improve my self-esteem/develop my identity’, marks as the highest mean score (especially appreciated by the Polish respondents), but the mean scores of the other three items are positioned not far behind, i.e., IL1.a.1, ‘Help make my work situation more stable’, IL1.a.2, ‘Open me up new career prospects’, and IL1.b.6, ‘Make me more effective, safe, protected, or independent in everyday life’. Is worth underlining in this case that, with the exception of just one item (IL.1.b.3, ‘Improve my relational or family life’), Polish respondents always scored the highest mean scores.
The questions in the second chapter also included six items that investigated the degree of interest in some categories of skills (
Figure 4.4). In this case differences, especially between the total sample results and the country sample ones, are more relevant. If the category of skills that are more appreciated in general, are IL2.6, ‘Topics related to my hobbies, personal interests, and general knowledge’, although this is less true for Danish respondents, among who IL2.3, ‘Soft and relational skills’, are much more appreciated. IL2.1, ‘Technical-professional skills’, are, in general, less valued, but not for the Italian and Greek respondents. In relation to other items Spanish respondents show lower mean scores, and that was particularly true considering IL2.1, ‘Technical-professional skills’, and IL2.5, ‘Advanced knowledge of foreign languages’. Greek respondents are particularly interested in IL2.2, ‘General skills’, and in IL2.6, ‘Topics related to my hobbies, personal interests, and general knowledge’. It is worth mentioning that, once again, all these differences reflect the different composition and nature of the country samples themselves.
Figure 4.3: IL1.a/ IL1.b In your opinion, acquiring new knowledge and competences can …
4,67
3,54
3,53
2,93
3,70
3,03
2,95
3,12
3,03
2,75
3,13
2,53
3,20
3,00
0,00 1,00 2,00 3,00 4,00 5,00
CH2.1 Your studies were consistent with your job (jobs)
CH2.2 Acquired knowledge was decisive for changingjob
Danmark
Spain
Greece
Italy
Poland
Turkey
Total

62
Figure 4.4: IL2. To what extent you would be interested in learning the following skills?
The third question in this chapter investigated the drivers and the influences in the choice of a
training activity to be attended (
3,90
3,64
2,62
2,86
3,88
3,77
3,18
3,17
2,59
2,69
3,81
3,22
3,48
3,50
2,94
2,94
3,69
3,41
3,30
3,53
2,87
3,19
3,59
3,44
3,90
3,86
3,01
3,53
3,94
3,88
3,47
3,26
3,08
3,48
3,54
3,61
3,50
3,56
2,89
3,19
3,72
3,55
0,00 1,00 2,00 3,00 4,00 5,00
IL1a.1 Help make my work situation more stable
IL1a.2 Open me up new career prospects(opportunities) and/or increase my income
IL1b.3 Improve my relational or family life
IL1b.4 Improve my social status and life
IL1b.5 Improve my self-esteem / develop my identity
IL1b.6 Make me more effective, safe, protected orindipendent in everyday life
Danmark
Spain
Greece
Italy
Poland
Turkey
Total
2,81
3,23
4,17
3,83
3,27
2,67
3,13
3,09
2,79
3,48
3,51
3,82
3,85
3,64
3,98
3,83
3,71
3,65
3,78
3,50
2,97
3,43
3,30
3,44
3,79
2,86
2,83
3,16
3,27
3,46
3,37
3,51
3,53
3,55
3,59
0,00 1,00 2,00 3,00 4,00 5,00
IL2.1 Technical-professional skills
IL2.2 General skills (e.g. basic knowledge of: computer,foreign language, economics, organization theory, law
and employment law, etc.)
IL2.3 Soft and relational skills (interpersonalcommunication, group work, etc.).
IL2.5 Advanced knowledge of foreign languages
IL2.6 Topics related to my hobbies, personal interestsand general knowledge
Danmark
Spain
Greece
Italy
Poland
Turkey
Total

63
Figure 4.5). The question was composed of thirteen items. Interest in learning, according to the
total sample results, is especially fostered by two factors, at almost the same level: IL3.2, ‘The
usability of knowledge and skills at the end of the course’, and IL3.5, ‘Quality of teacher(s)/training
institutions’). With reference to the former, this is particularly true for Danish, Polish, and Greek
respondents, but less so for Spanish ones. With reference to the latter item, once again Greek and
Polish respondents are particularly influenced by the quality of teachers or of the training
institutions. IL3.6, ‘The number of participants’, is the item which scored the lowest mean scores,
even if this was not true for the Polish sample. The cost of the course or workshop (IL3.4) is an
issue especially for Greek, Italian, and Polish respondents, but less so for the other country
samples.
Figure 4.5: IL3. In choosing a course or a workshop, what does/would influence your choice?

64
Validation of the acquired competences and certification are two topics that in general, are
particular appreciated by Greek and Italian respondents.
The last question of this chapter (Figure 4.6) was composed of five items exploring the relational
dimensions that influence the interest in learning. The item IL4.5, ‘Myself’, is beyond doubt the
strongest factor, but it is nonetheless possible to observe the generally higher scores of Turkish
respondents on all the items in comparison with the other country samples. This is true except in
the cases of IL4.5 and IL4.2, ‘My manager’, where Danish respondents scored this more highly. The
family emerges as being particularly important (IL4.4) for Turkish respondents, as well as that of
friends and colleague (IL4.3), or the employer (IL4.2). Although, once again the mean scores are
3,92
4,40
3,23
2,88
3,92
2,10
3,21
3,61
3,34
3,07
3,55
2,54
3,92
4,24
3,81
4,23
4,48
2,74
3,93
3,96
3,59
3,98
3,97
2,77
3,98
4,34
3,91
4,14
4,29
3,52
3,43
3,82
3,70
3,10
3,81
2,71
3,82
4,04
3,64
3,82
4,03
2,85
0,00 1,00 2,00 3,00 4,00 5,00
IL3.1 Clarity of the stated objectives
IL3.2 Usability of knowledge and skills at the end of thecourse
IL3.3 Compatibility spatio-temporal (location, schedule,duration)
IL3.4 Cost of the course or workshop
IL3.5 Quality of the teacher(s) / training institution
IL3.6 Number of participants
Danmark
Spain
Greece
Italy
Poland
Turkey
Total
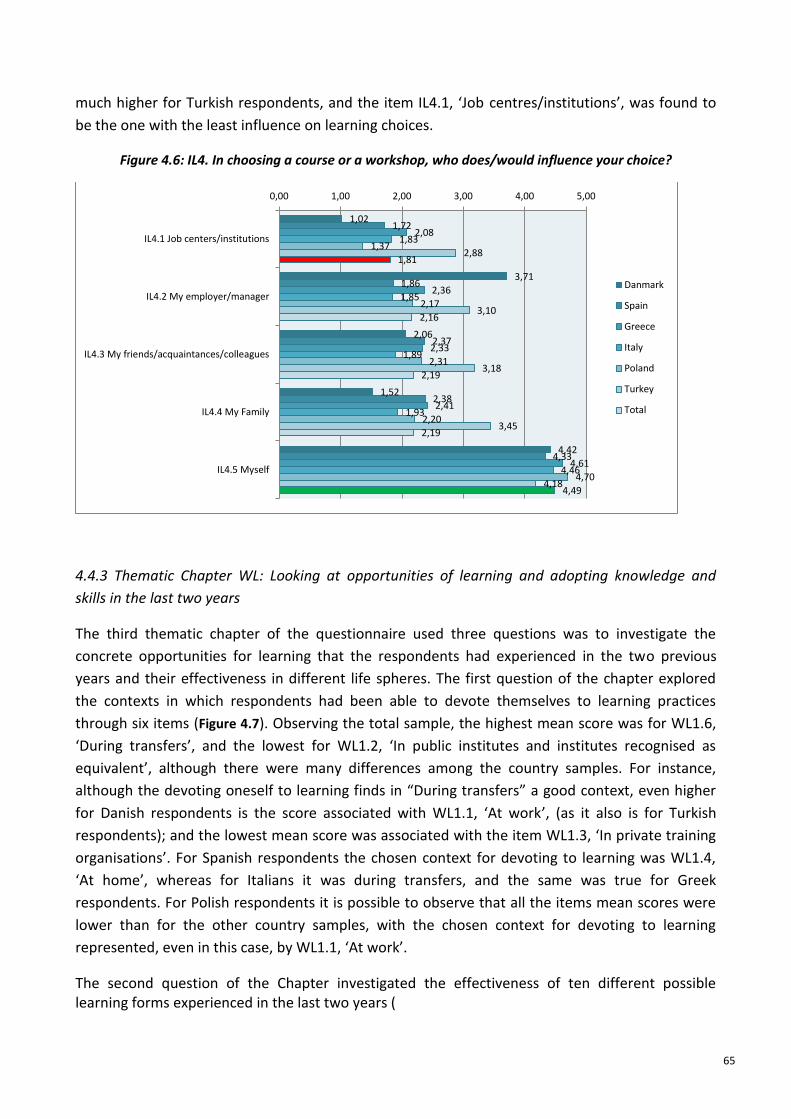
65
much higher for Turkish respondents, and the item IL4.1, ‘Job centres/institutions’, was found to
be the one with the least influence on learning choices.
Figure 4.6: IL4. In choosing a course or a workshop, who does/would influence your choice?
4.4.3 Thematic Chapter WL: Looking at opportunities of learning and adopting knowledge and
skills in the last two years
The third thematic chapter of the questionnaire used three questions was to investigate the
concrete opportunities for learning that the respondents had experienced in the two previous
years and their effectiveness in different life spheres. The first question of the chapter explored
the contexts in which respondents had been able to devote themselves to learning practices
through six items (Figure 4.7). Observing the total sample, the highest mean score was for WL1.6,
‘During transfers’, and the lowest for WL1.2, ‘In public institutes and institutes recognised as
equivalent’, although there were many differences among the country samples. For instance,
although the devoting oneself to learning finds in “During transfers” a good context, even higher
for Danish respondents is the score associated with WL1.1, ‘At work’, (as it also is for Turkish
respondents); and the lowest mean score was associated with the item WL1.3, ‘In private training
organisations’. For Spanish respondents the chosen context for devoting to learning was WL1.4,
‘At home’, whereas for Italians it was during transfers, and the same was true for Greek
respondents. For Polish respondents it is possible to observe that all the items mean scores were
lower than for the other country samples, with the chosen context for devoting to learning
represented, even in this case, by WL1.1, ‘At work’.
The second question of the Chapter investigated the effectiveness of ten different possible learning forms experienced in the last two years (
1,02
3,71
2,06
1,52
4,42
1,72
1,86
2,37
2,38
4,33
2,08
2,36
2,33
2,41
4,61
1,83
1,85
1,89
1,93
4,46
1,37
2,17
2,31
2,20
4,70
2,88
3,10
3,18
3,45
4,18
1,81
2,16
2,19
2,19
4,49
0,00 1,00 2,00 3,00 4,00 5,00
IL4.1 Job centers/institutions
IL4.2 My employer/manager
IL4.3 My friends/acquaintances/colleagues
IL4.4 My Family
IL4.5 Myself
Danmark
Spain
Greece
Italy
Poland
Turkey
Total

66
Figure 4.8). Once again the results differ significantly according to the different country samples. The learning form evaluated as the most effective was WL2.7, ‘Intentional research of specific contents on the internet’, but not for all the country samples: for Turkish and for Greek respondents the most effective form was represented by WL2.4, ‘Learning by doing (in extra work environment)’; for Polish respondents WL2.3, ‘Learning on the job (work environment)’; and for Spanish respondents WL2.1, ‘Lessons in the classroom’. Even in terms of the effectiveness of the learning forms, it has to be noticed that Polish respondents always score lower than any other country sample. As the least effective form of learning, WL2.9, ‘TV shows’, collects the lowest scores in all the countries cases except for Turkey, where respondents judge this form much more effective than WL2.6, ‘Tutoring/Coaching’.
Figure 4.7: WL1. In the last two years, in which context have you been able to devote yourself to learning?
3,83
3,26
2,42
2,79
2,75
3,32
2,92
2,48
1,95
2,64
2,21
2,37
2,75
2,43
2,10
2,75
2,19
3,25
2,63
1,77
2,65
2,99
2,42
3,05
2,48
2,21
1,62
1,99
1,78
1,93
3,19
2,91
2,36
2,92
2,95
2,79
2,79
2,27
2,34
2,76
2,34
2,85
0,00 1,00 2,00 3,00 4,00 5,00
WL1.1 At work
WL1.2 In public institutes and insitutes recognised asequivalent to the public ones
WL1.3 In private training organizations
WL1.4 At home
WL1.5 In other private and social contexts
WL1.6 During transfers (reading books and e-books,Internet access via tablets, smartphones, etc.)
Danmark
Spain
Greece
Italy
Poland
Turkey
Total

67
Figure 4.8: WL2. In the last two years, to what extent have the learning forms listed below, been effective (useful) for you?
The last chapter’s question explored the extent of the opportunity to use the acquired knowledge
in three different contexts (
Figure 4. 9). In all cases the possibilities of making use of the acquired skills at work (WL3.1) was
greater than the possibilities for using them in private/social life (WL3.2) or in the family (WL3.3).
This was not true for the Turkish case, however, with the opposite order of factors than that of all
the other country samples. Once again, even in terms of judgement about the real opportunities
for using the knowledge acquired in the last two years, Polish respondents demonstrated that they
were always the most pessimistic.
3,15
1,97
2,59
3,40
1,85
2,57
3,35
2,30
1,45
3,24
3,24
2,33
2,38
2,60
1,81
2,07
2,93
2,10
1,81
3,03
2,77
2,62
2,98
3,04
2,47
2,65
3,32
2,83
2,01
3,38
3,13
2,66
2,95
2,83
2,13
2,39
3,49
2,89
2,09
3,26
1,80
1,71
2,13
1,91
1,91
1,80
1,99
1,96
1,39
2,18
3,14
3,29
3,31
3,63
3,20
2,04
3,44
3,06
2,92
3,55
2,98
2,52
2,72
2,80
2,23
2,29
3,19
2,63
2,05
3,08
0,00 1,00 2,00 3,00 4,00
WL2.1 Lessons in the classroom
WL2.2 E-learning
WL2.3 Training on the job (work enviroment)
WL2.4 Learning by doing (extra work enviroment)
WL2.5 Mentoring
WL2.6 Tutoring/Coaching
WL2.7 Intentional research of specific contents on theInternet
WL2.8 Random acquisition of specific contents on theInternet
WL2.9 TV shows
WL2.10 Reading books, magazines, multimediamaterials, etc..
Danmark
Spain
Greece
Italy
Poland
Turkey
Total

68
Figure 4. 9: WL3. How many real opportunities did you have to employ acquired knowledge and skills in the last two years?
4.4. 4 Thematic Chapter ML: Looking at your motivation to learn
The last thematic chapter of the questionnaire was dedicated to the core topic of motivation to
learn using three questions. The first factor investigated consisted of a list of eight items
representing motivators that can foster the commitment to acquire new knowledge (
Figure 4.10). What has to be noted above all, is that the strongest motivator, in almost all the
country cases (and with minimal deviations in the mean scores), was represented by ML1.6, ‘The
pleasure of learning itself’. The exception was the Danish sample, for whom ML1.1, ‘Being able to
spend at work’, was a stronger motivation, and the Polish one, for whom ML1.7, ‘Realising myself
as a person’ scored more highly. The three factors already cited, together with ML1.5, ‘Keeping in
touch with the times’, generally scored very highly. On the opposite side, the factor with the
lowest scores was ML1.3, ‘Completing a learning path’.
3,92
3,13
2,71
3,14
2,56
2,17
2,98
2,95
2,32
3,00
2,74
2,42
2,16
1,98
1,77
3,16
3,29
3,57
2,91
2,66
2,40
0,00 1,00 2,00 3,00 4,00 5,00
WL3.1 At work
WL3.2 In private/social life/community
WL3.3 Family
Danmark
Spain
Greece
Italy
Poland
Turkey
Total

69
Among the dimensions representing possible factors hindering the commitment to learn, within a list of eleven items (as investigated through the second question of the last thematic chapter) (Figure 4.11), the most influential are ML2.8, ‘The lack of time’, and ML2.10, ‘The cost of education’. These two factors are both the most important, especially for Greek and Polish respondents, whereas for the Italians, it is the second and not the first that prevails. All other hindering factors are less remarkable, especially in the case of ML2.7, ‘The risk of disfiguring (show up) in comparison with other learners’, a fear felt especially by Spanish and Turkish respondents.
Figure 4.10: ML1. What motivates you to commit yourself to learning new knowledge and skills?
Figure 4.11: ML2. What hinders you from committing to learn new knowledge and skills?
The final question of the questionnaire investigated the most encouraging forms of learning,
according to a list of ten items (
4,31
3,15
3,50
3,63
3,98
4,00
4,21
3,19
2,90
2,84
2,70
2,70
3,32
3,74
3,43
2,75
3,90
2,74
3,15
3,63
3,97
3,96
3,76
3,41
3,88
3,45
3,28
3,63
3,86
3,92
3,78
3,28
3,92
3,55
2,77
3,60
3,87
3,78
3,92
3,64
3,31
3,05
2,92
3,14
3,36
3,67
3,60
3,49
3,76
3,28
3,09
3,49
3,78
3,86
3,78
3,32
0,00 1,00 2,00 3,00 4,00 5,00
ML1.1 Being able to spend at work (or in prospect ofwork) knowledge and skills acquired
ML1.2 Bridging some basic cultural gaps
ML1.3 Completing a training path
ML1.4 Making me more autonomous
ML1.5 Keeping in touch with the times
ML1.6 The pleasure of learning itself
ML1.7 Realizing myself as a person
ML1.8 Knowing other people and establish relationships
Danmark
Spain
Greece
Italy
Poland
Turkey
Total
1,40
1,40
1,42
1,52
1,42
1,48
1,35
2,56
1,38
2,40
1,56
1,61
2,27
2,37
1,98
2,19
2,15
1,83
2,96
2,16
2,55
1,83
1,33
1,63
1,55
1,23
1,49
1,63
1,30
3,43
2,15
3,54
1,70
1,86
1,81
1,70
1,57
1,75
1,68
1,43
2,26
2,24
3,55
2,42
1,69
1,94
1,90
1,69
1,57
1,49
1,50
2,99
2,23
3,30
2,31
2,19
2,12
2,45
2,24
2,13
2,35
1,98
2,53
1,83
2,18
2,14
1,75
1,87
1,84
1,65
1,75
1,73
1,51
2,65
2,15
3,22
2,19
0,00 1,00 2,00 3,00 4,00
ML2.1 Previous negative experiences
ML2.2 Not being accustomed to study anymore
ML2.3 Not having the age to learn
ML2.4 The lack of confidence in my own abilities as astudent
ML2.5 The lack of my own learning methodology
ML2.6 The lack of basis that would facilitate learning
ML2.7 The risk of disfiguring in comparison with otherlearners
ML2.8 The lack of time
ML2.9 Not seeing a real advantage
ML2.10 The cost of education
ML2.11 The difficulty to orient myself among thecourses offered in the market
Danmark
Spain
Greece
Italy
Poland
Turkey
Total
70
Figure 4.12). The most encouraging form according to respondents is ML3.2, ‘Experimental
courses/seminars (I learn while I practice)’, even if for single country samples the ranking of
factors may vary. This is the case, for instance, for the Polish respondents who much prefer ML3.6,
‘Learning by carrying out a new task’, ML3.9, ‘Reading a book or an essay’, and ML3.10, ‘The
research of specific contents on the internet’. Furthermore, for Spanish respondents the most
encouraging form is ML3.1, ‘Traditional lectures (teachers-learners)’.
On the other side, the least encouraging learning form is represented by ML3.5, ‘Group lessons or
seminars remotely via computer’. This is especially true for Danish and Spanish respondents, and
with mean scores not much higher, it is also the case for ML3.4, ‘Individual courses or seminars
remotely via computer’.
Figure 4.12: ML3. Which forms of learning encourage you more?

71
4.5 Cluster analysis
4.5.1 Introduction
Cluster analysis allows us to work on the general sample, despite differences between the national
samples. Indeed, the K-Means method aggregates cases on the basis of their similarities to a single
case representing the ‘centre’ of the cluster (see
2,79
3,69
3,29
2,31
2,23
3,38
2,21
2,40
2,65
3,00
3,08
2,93
2,47
2,21
2,06
2,79
2,26
2,33
2,92
2,88
2,68
3,39
3,05
2,88
2,72
3,41
2,89
2,95
3,12
3,34
3,30
3,52
2,88
2,65
2,49
3,45
2,56
2,68
2,93
3,34
3,57
3,63
3,30
2,82
2,63
3,80
3,05
3,16
3,89
3,85
2,82
3,13
3,00
2,87
2,71
3,24
3,17
2,48
3,01
3,31
3,20
3,44
2,97
2,66
2,50
3,43
2,69
2,73
3,13
3,37
0,00 1,00 2,00 3,00 4,00 5,00
ML3.1 Traditional lectures (teacher-learners)
ML3.2 Experiential courses/seminars (I learn while Ipractise with a group of people in cooperative /
collaborative way)
ML3.3 Paths of personal development (narrativeorientation, autobiography, skills assessment, etc.)
ML3.4 Individual courses or seminars remotely viacomputer (e-learning)
ML3.5 Group lessons or seminars remotely viacomputer (eg. webinar)
ML3.6 Learning by carrying out a new task (learning bydoing, on the job training)
ML3.7 Mentoring
ML3.8 Tutoring/Coaching
ML3.9 Reading a book or an essay
ML3.10 The research of specific contents on theInternet
Danmark
Spain
Greece
Italy
Poland
Turkey
Total

72
Figure 4.13 for a graphical exemplification of the model). This method allows also us to decide the
number of clusters in which the sample has to be split, thus representing a good exploratory tool
for a better interpretation of the features of a heterogeneous sample.
In this way, despite respondents’ heterogeneity in terms of personal characteristics (e.g., age,
employment status, country), they can, nonetheless, be aggregated on the basis of the similarities
in their responses to specific questions (single items/variables) selected in order to develop the
interpretative model.
Thus, the cluster analysis has been carried out using 16 variables concerning different factors
related to ‘needs’ (n. = 6 variables), ‘opportunities’ (n. = 1 variable), and ‘motivation’ (n. = 9
variables) to learning; the ones which are demonstrated to be the most significant (in terms of
high mean scores) or critical (low mean scores) for the general respondents. As specified in the
previous paragraphs, the 16 variables are homogeneous as they adopt the same evaluation
scale.12 They are listed in Table 4. 7, showing the results of the ANOVA test that can be used only
for descriptive aims and indicating that the variables with the stronger influence for the
composition of the clusters are IL2.1, technical-professional skills, ML2.1, being able to spend at
work, ML1.7, realising myself as a person, and ML1.5, keeping in touch with the times.
Table 4. 7: Results of the ANOVA test on the sixteen selected variables
ANOVA Cluster Error F Sig.
Mean of squares
df Mean of squares
df
IL2.1 Technical-professional skills 174.480 3 .769 842 226.937 .000
IL2.3 Soft and relational skills (interpersonal communication, group work, etc.). 55.564 3 .925 842 60.098 .000
IL2.6 Topics related to my hobbies, personal interests and general knowledge 45.863 3 .945 842 48.537 .000
IL3.2 Usability of knowledge and skills at the end of the course 44.625 3 .548 842 81.417 .000
IL3.5 Quality of the teacher(s) / training institution 34.277 3 .542 842 63.262 .000
IL3.12 Validation of acquired competences 67.364 3 .774 842 87.012 .000
WL2.10 Reading books, magazines, multimedia materials, etc.. 68.252 3 1.000 842 68.276 .000
ML1.1 Being able to spend at work (or in prospect of 112.240 3 .810 842 138.611 .000
12
Reliability test of the scale adopting the 16 variables indicates that the model can be implemented. In particular, 2 out of the 16 variables measure the degree of accordance on the basis of reverse scores (ML2.8 The lack of time; ML2.10 The cost of education), thus presenting inter-item correlations negative values and corrected item-total correlation with values below .3 (the critical threshold, according to literature). The only variable chosen from the “Opportunity” section of the questionnaire, WL2.10, shows as well corrected item-total correlation value below .3 and should be excluded from the scale. Nevertheless, even keeping them within the model, the Cronbach alpha coefficient of this exploratory study is .76, thus not very good but nonetheless acceptable.

73
work) knowledge and skills acquired
ML1.5 Keeping in touch with the times 79.052 3 .620 842 127.556 .000
ML1.6 The pleasure of learning itself 71.635 3 .642 842 111.564 .000
ML1.7 Realising myself as a person 91.379 3 .683 842 133.885 .000
ML2.8 The lack of time 57.241 3 1.349 842 42.435 .000
ML2.10 The cost of education 32.330 3 1.504 842 21.491 .000
ML3.2 Experiential courses/seminars (I learn while I practise with a group of people in cooperative/ collaborative ways) 69.124 3 .751 842 92.076 .000
ML3.6 Learning by carrying out a new task (learning by doing, on the job training) 75.385 3 .831 842 90.763 .000
ML3.10 The research of specific contents on the internet 64.735 3 .791 842 81.832 .000 IL: NEEDS (Interests to learn + influences), WL: OPPORTUNITIES (Effectiveness), ML: MOTIVATION TO LEARN (What motivates + what hinders + which forms)
The 16 variables have also been chosen in order to optimise the number of missing cases. This
leads to work on n. = 846 valid cases (missing n. = 220), aggregated into four clusters. The number
of cases within each cluster is shown in Table 4.8. Cluster n. 1 is the smallest (n. = 114), the other
clusters are numerically more than two times larger (n. = 237; 244; 251 respectively). The distance
between the centres of the clusters is high, especially between the first and the last one, as Table
4.9 indicates. In any case, the distances between the second, the third, and the fourth are smaller.
Table 4.8: Number of cases in each cluster
Number of cases in each cluster
Cluster
1 114
2 237
3 244
4 251
Valid 846
Missing 220
Table 4.9: Distances between the centres of the final clusters
Distances between the centres of the final clusters
Cluster 1 2 3 4
1 3,417 3,408 5,557
2 3,417 2,366 2,972
3 3,408 2,366 2,945
4 5,557 2,972 2,945
Figure 4.13: The K-Means cluster analysis model

74
Table 4.10 to
Table 4.14 show the distribution of cases within each cluster according to the main descriptive characteristics of the sample (country, age groups, sex, employment status, educational attainment), and represent the basis for identifying the specific features of the clusters. Clusters are listed at the head of the columns and the percentage distribution has to be read by column.
Table 4.15 shows the mean scale scores for each of the 16 variables chosen in order to
define the four clusters that represent the descriptive core of the cluster analysis results,
allowing us to distinguish the features of each cluster not only on the basis of personal
characteristics, but also according to attitudes concerning needs, opportunities and motivation
to learn.
Since the mean values tends to flatten the results and cannot provide evidence of
dispersion, the frequency distribution of the cases in the four clusters according to a scale
recoded into three new levels (low, medium, high13) for each of the 16 variables. Data are not
presented in this report.
Table 4.10: Contingency table: country * cluster number of the case
Country Cluster number of the case Total
1 2 3 4
Denmark Count 1 22 8 14 45
% in Cluster number of the case 0.9% 9.3% 3.3% 5.6% 5.3%
Spain Count 37 37 4 13 91
% in Cluster number of the case 32.5% 15.6% 1.6% 5.2% 10.8%
Greece Count 10 30 21 40 101
% in Cluster number of the case 8.8% 12.7% 8.6% 15.9% 11.9%
Italy Count 48 51 188 132 419
% in Cluster number of the case 42.1% 21.5% 77.0% 52.6% 49.5%
Poland Count 8 76 16 28 128
% in Cluster number of the case 7.0% 32.1% 6.6% 11.2% 15.1%
Turkey Count 10 21 7 24 62
13
Low = score 1 or 2 in the scale; Medium = score 3 in the scale; High = score 4 or 5 in the scale.

75
% in Cluster number of the case 8.8% 8.9% 2.9% 9.6% 7.3%
Total Count 114 237 244 251 846
% in Cluster number of the case 100% 100% 100% 100% 100%
Table 4. 11: Contingency table: age groups * cluster number of the case
Age classes Cluster number of the case Total
1 2 3 4
40–44 Count 15 67 39 57 178
% in Cluster number of the case 13.2% 28.3% 16.0% 22.7% 21.0%
45–54 Count 33 100 134 125 392
% in Cluster number of the case 28.9% 42.2% 54.9% 49.8% 46.3%
55–64 Count 45 57 68 60 230
% in Cluster number of the case 39.5% 24.1% 27.9% 23.9% 27.2%
65 and over Count 21 13 3 9 46
% in Cluster number of the case 18.4% 5.5% 1.2% 3.6% 5.4%
Total Count 114 237 244 251 846
% in Cluster number of the case 100% 100% 100% 100% 100%
Table 4.12: Contingency table: sex * cluster number of the case
Sex Cluster number of the case Total
1 2 3 4
Male
Count 58 70 138 107 373
% in Cluster number of the case 50.9% 29.5% 56.6% 42.6% 44.1
%
Female
Count 56 167 106 144 473
% in Cluster number of the case 49.1% 70.5% 43.4% 57.4% 55.9
%
Total Count 114 237 244 251 846
% in Cluster number of the case 100% 100% 100% 100% 100%
Table 4.13: Contingency table: employment status * cluster number of the case
Employment status Cluster number of the case Total
1 2 3 4
Employed
Count 55 181 115 144 495
% in Cluster number of the case
48.2% 76.4% 47.1% 57.4% 58.5%
Un-employed
Count 22 20 113 70 225
% in Cluster number of the case
19.3% 8.4% 46.3% 27.9% 26.6%
Inactive
Count 37 36 16 37 126
% in Cluster number of the case
32.5% 15.2% 6.6% 14.7% 14.9%
Total
Count 114 237 244 251 846
% in Cluster number of the case
100% 100% 100% 100% 100%

76
Table 4.14: Contingency table: education * cluster number of the case
Education Cluster number of the case Total
1 2 3 4
ISCED 0-2 Count 32 22 12 13 79
% in Cluster number of the case 28.1% 9.3% 4.9% 5.4% 9.5%
ISCED 3-4 Count 41 64 125 101 331
% in Cluster number of the case 36.0% 27.1% 51.4% 41.7% 39.6%
ISCED 5-6 Count 41 150 106 128 425
% in Cluster number of the case 36.0% 63.6% 43.6% 52.9% 50.9%
Total Count 114 236 243 242 835
% in Cluster number of the case 100% 100% 100% 100% 100%
Table 4.15: Mean scores of the sixteen selected variables by cluster
Cluster number pf the case
1 2 3 4 Total
Mean Mean Mean Mean
IL2.1 Technical-professional skills 2.44 2.53 3.96 4.20 3.43
IL2.3 Soft and relational skills (interpersonal communication, group work, etc.). 2.72 3.45 3.60 4.14 3.60
IL2.6 Topics related to my hobbies, personal interests and general knowledge 3.13 3.60 3.28 4.19 3.62
IL3.2 Usability of knowledge and skills at the end of the course 3.15 4.19 4.05 4.44 4.08
IL3.5 Quality of the teacher(s) / training institution 3.35 4.25 3.92 4.42 4.08
IL3.12 Validation of acquired competences 2.70 3.39 3.89 4.18 3.67
WL2.10 Reading books, magazines, multiMean materials, etc.. 2.60 2.83 2.83 3.85 3.10
ML1.1 Being able to spend at work (or in prospect of work) knowledge and skills acquired 2.42 3.72 4.03 4.45 3.85
ML1.5 Keeping in touch with the times 2.99 3.75 3.61 4.59 3.86
ML1.6 The pleasure of learning itself 3.34 4.05 3.47 4.63 3.96
ML1.7 Realising myself as a person 2.92 4.04 3.37 4.52 3.84
ML2.8 The lack of time 2.45 3.37 2.30 2.41 2.65
ML2.10 The cost of education 2.89 2.91 3.72 3.18 3.22
ML3.2 Experiential courses/seminars (I learn while I practise with a group of people in cooperative / collaborative way) 2.38 3.67 3.37 3.96 3.50
ML3.6 Learning by carrying out a new task (learning by doing, on the job training) 2.40 3.56 3.36 4.08 3.50
ML3.10 The research of specific contents on the internet 2.75 3.54 3.08 4.09 3.46
4.5.2 Clusters description
According to the cluster analysis results, one useful exercise is the attempt to summarise the
characteristics of each cluster through a descriptive label, to be used as effective shortcut to
indicate the specific features of the respondents belonging to it.
Therefore, the clusters can be named as follows.

77
Cluster 1: ‘Filling the gaps’
Cluster 2: ‘Completing the picture/Widening own horizons’
Cluster 3: ‘Pragmatically recovering’
Cluster 4: ‘Lifelong learning oriented’.
Below, the salient characteristics of each cluster are summarising according to the results
displayed in the above tables.
4.5.2.1 Filling the gaps
The keywords that can be used to depict the first cluster, the numerically least large one, are:
elderly, inactive, low qualified. Three quarters of this cluster are Italian and Spanish respondents
(74.6%) compared with the frequency distribution by country of the general sample. Within this
first cluster the Spanish respondents (32.5%) are particularly over-represented; whereas Polish
(7.0%) and Danish (0.9%) respondents are under-represented. The cluster can be described as the
elderly one because it shows the highest share of 55+ respondents, reaching 57.9%, and the sole
share of 65+ at 18.4%, which means that almost one in five respondents belong to this cluster.
Genders are almost perfectly balanced with 50.9% males. According to employment status, one
third of the respondents are inactive (32.5%), that means the double of respondents compared
with the general sample (14,9%); thus, low qualified respondents (28.1%) are also over-
represented with almost three times as many compared with the general sample (9.5%). Of
course, in respect of the data, within the cluster the employed (48.2%) and the highly qualified
(36.0%) represent the larger share of respondents belonging to it. Nonetheless, the prevalence of
elderly, inactive and low qualified men and women is higher than in the other clusters.
The cluster can be named filling the gaps because, in comparison with the other clusters, the
respondents belonging to it show lower mean scores according to all the variables considered in
the analysis, except for the one regarding the ‘lack of time. This means that they have also have
fewer problems in finding time to devote to learning. Nonetheless, the needs, the interests and
the motivation are on the lower levels, so they express a general interest in activities that lead to
acquiring new knowledge or interesting information simply for the pleasure of doing it, in a
particularly passive way (indeed higher scores are associated with ‘quality of teachers’ and ‘the
pleasure of learning itself’). This picture is confirmed by the frequency distributions according to
the three levels: low, medium, and high, with regard to the selected variables. For most of the
variables the filling the gaps respondents present the highest share of low levels compared to the
other three clusters, except for ‘topics related to my hobbies etc.’, ‘lack of time’, as already
mentioned, and the ‘cost of education’. Interest in active and collaborative learning is particularly
poor within this group (low interest at 54.4% compared to the total of 15.1%; high interest at 7.0%
compared to total of 54.4%).
4.5.2.2. Completing the picture/widening own horizons
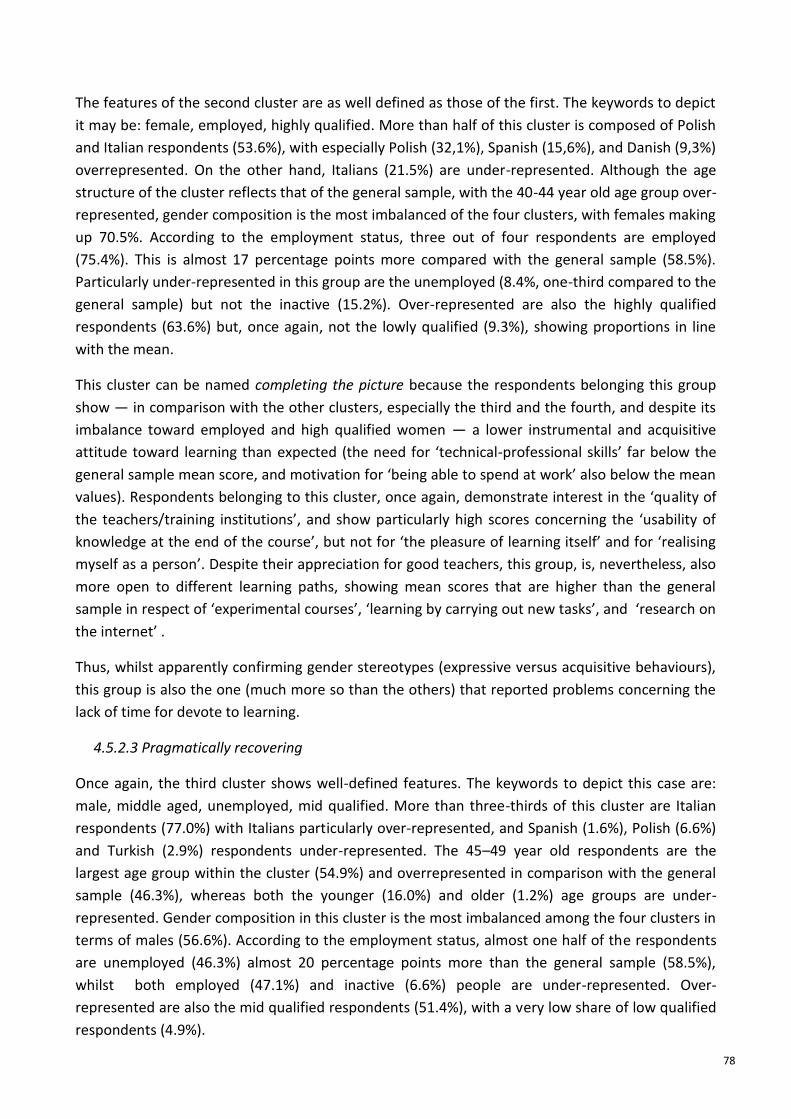
78
The features of the second cluster are as well defined as those of the first. The keywords to depict
it may be: female, employed, highly qualified. More than half of this cluster is composed of Polish
and Italian respondents (53.6%), with especially Polish (32,1%), Spanish (15,6%), and Danish (9,3%)
overrepresented. On the other hand, Italians (21.5%) are under-represented. Although the age
structure of the cluster reflects that of the general sample, with the 40-44 year old age group over-
represented, gender composition is the most imbalanced of the four clusters, with females making
up 70.5%. According to the employment status, three out of four respondents are employed
(75.4%). This is almost 17 percentage points more compared with the general sample (58.5%).
Particularly under-represented in this group are the unemployed (8.4%, one-third compared to the
general sample) but not the inactive (15.2%). Over-represented are also the highly qualified
respondents (63.6%) but, once again, not the lowly qualified (9.3%), showing proportions in line
with the mean.
This cluster can be named completing the picture because the respondents belonging this group
show — in comparison with the other clusters, especially the third and the fourth, and despite its
imbalance toward employed and high qualified women — a lower instrumental and acquisitive
attitude toward learning than expected (the need for ‘technical-professional skills’ far below the
general sample mean score, and motivation for ‘being able to spend at work’ also below the mean
values). Respondents belonging to this cluster, once again, demonstrate interest in the ‘quality of
the teachers/training institutions’, and show particularly high scores concerning the ‘usability of
knowledge at the end of the course’, but not for ‘the pleasure of learning itself’ and for ‘realising
myself as a person’. Despite their appreciation for good teachers, this group, is, nevertheless, also
more open to different learning paths, showing mean scores that are higher than the general
sample in respect of ‘experimental courses’, ‘learning by carrying out new tasks’, and ‘research on
the internet’ .
Thus, whilst apparently confirming gender stereotypes (expressive versus acquisitive behaviours),
this group is also the one (much more so than the others) that reported problems concerning the
lack of time for devote to learning.
4.5.2.3 Pragmatically recovering
Once again, the third cluster shows well-defined features. The keywords to depict this case are:
male, middle aged, unemployed, mid qualified. More than three-thirds of this cluster are Italian
respondents (77.0%) with Italians particularly over-represented, and Spanish (1.6%), Polish (6.6%)
and Turkish (2.9%) respondents under-represented. The 45–49 year old respondents are the
largest age group within the cluster (54.9%) and overrepresented in comparison with the general
sample (46.3%), whereas both the younger (16.0%) and older (1.2%) age groups are under-
represented. Gender composition in this cluster is the most imbalanced among the four clusters in
terms of males (56.6%). According to the employment status, almost one half of the respondents
are unemployed (46.3%) almost 20 percentage points more than the general sample (58.5%),
whilst both employed (47.1%) and inactive (6.6%) people are under-represented. Over-
represented are also the mid qualified respondents (51.4%), with a very low share of low qualified
respondents (4.9%).

79
The cluster can be named pragmatically recovering because the respondents belonging this group
show relatively high scores in respect of the ‘usability of knowledge’, the interest for ‘being able to
spend (the knowledge) at work’, the acquiring of ‘technical-professional skills’, and the problem of
the ‘cost of education’. Due to the unemployed nature of the majority of the respondents
belonging to this cluster, this evidence supports the interest expressed by this group for learning
opportunities that are strongly work-related, as well as for content that is immediately useable in
the work environment, or at least in job seeking.
For those belonging to this third cluster, the cost of learning is, nonetheless, a problem to be taken
into account before committing to such kind of activities. Nevertheless, their investment choices
focus on cheap ways to acquire new knowledge or information (e.g., reading books or researching
on the internet) which appear to be limited.
4.5.2.4 Lifelong learning oriented
There are only two keywords that can be used to depict the fourth cluster, the numerically largest
one: mean distributions, highest scores. Two-thirds of this cluster is composed of Italian and Greek
respondents (68.5%), with Greek (15.9%) and Turkish respondents (9.6%) over-represented, whilst
Spanish (5.2%) and Polish (11.2%) respondents are under-represented. The main feature of
cluster, however, except for the national composition, is that it perfectly overlaps with the
characteristics of the general sample under all the descriptive personal dimensions considered:
age (a slightly higher share of those aged less than 55, at 72.5%), sex, employment status and
educational attainment (ISCED 0-2 slightly under-represented).
The cluster can be named lifelong oriented because the respondents belonging to it show — in
comparison with the other clusters — the higher mean scores according to all the variables
considered in the analysis, except for the ones regarding ‘lacking of time’ and ‘the cost of
education’. This means that they have fewer problems than respondents belonging to other
groups in finding time and money to devote to learning. All the other dimensions related to needs,
opportunities and motivation to learn present mean scores higher than those in the other clusters.
In 6 out of 16 variables included in the analysis, the share of high scores exceeds 90%, in a further
4 they exceed 80%, and in another 3 they exceed 70%. The only exceptions are those already
reported, i.e., ‘lack of time’ (21.5%), ‘the cost of education’ (48.2%), and also ‘reading books etc.’
(66.1%, but this is, nonetheless, a share that is almost double in comparison with the general
sample).
This cluster aggregates the more motivated and learning oriented adults of the general sample,
reflecting attitudes and interest for all relevant dimensions associated with the experience of
learning in adulthood.
4.6 National samples: descriptive analysis and cluster analysis results
4.6.1 Denmark

80
The Danish sample (n=48) is very small, and it was not randomly collected. It was collected
amongst employees older than 45 years in the Randers Municipality. The respondents either
participated in an internal mandatory course or were amongst employee in the human resource
department who were aged over 45. These choices explain the high share of employed persons in
the sample.
With regard to the results of the cluster analysis, due to the size of the sample, only one Danish
respondent belongs to cluster 1, ‘Filling the gaps’, and eight belong to the cluster 3, ‘Pragmatically
recovering’. Any comments regarding the results of the first cluster is, therefore, not possible.
Table 4.16 shows the mean scores of the sixteen selected variables according to the four clusters
for respondents. The outcome is in keeping with that which emerged from the general sample
analysis. Respondents belonging to cluster 2, ‘Completing the picture’, confirm the importance of
the ‘quality of teachers’ above all, and of the ‘usability of knowledge’, for ‘the pleasure of learning
itself’, and to ‘realise oneself as a person’; ‘lack of time’ was, nevertheless, an issue. Respondents
belonging to cluster 4, ‘Lifelong learning oriented’, on the other hand, underline the need for
‘being able to spend at work the knowledge acquired’, especially in respect of ‘soft and relational
skills’, for reasons associated with the need for ‘keeping in touch with the times’, but also because
of the interest in the ‘usability of knowledge’. Less consistent with the features arising from the
same cluster according to the analysis of the general sample, the respondents belonging to cluster
3, ‘Pragmatically recovering’, show scores that exceed the 4.0 points threshold with reference to
more dimensions — the ‘usability of knowledge’ and ‘being able to spend at work the knowledge
acquired’ — than is the case in the general cluster, and also in terms of the interest in ‘soft and
relational skills’, and the motivation to learn for ‘realising oneself as a person’; in this case, the
cost of education is the issue.
Table 4.16: Mean scores of the sixteen selected variables by cluster, Denmark
Cluster number pf the case
1 2 3 4 Total
Mean Mean Mean Mean Mean
IL2.1 Technical-professional skills 2.00 2.14 3.63 3.57 2.84
IL2.3 Soft and relational skills (interpersonal communication, group work, etc.). 4.00 3.86 4.25 4.71 4.20
IL2.6 Topics related to my hobbies, personal interests and general knowledge 3.00 3.18 2.63 4.07 3.36
IL3.2 Usability of knowledge and skills at the end of the course 4.00 4.36 4.38 4.57 4.42
IL3.5 Quality of the teacher(s) / training institution 4.00 4.00 3.50 4.00 3.91
IL3.12 Validation of acquired competences 3.00 3.68 3.38 4.07 3.73
WL2.10 Reading books, magazines, multimedia materials, etc.. 2.00 3.00 3.13 3.79 3.24
ML1.1 Being able to spend at work (or in prospect of work) knowledge and skills acquired 3.00 4.05 4.38 4.79 4.31
ML1.5 Keeping in touch with the times 3.00 3.77 3.63 4.64 4.00
ML1.6 The pleasure of learning itself 3.00 4.09 3.50 4.36 4.04
ML1.7 Realizing myself as a person 3.00 4.18 4.13 4.50 4.24
ML2.8 The lack of time 2.00 2.95 2.25 2.14 2.56

81
ML2.10 The cost of education 2.00 1.91 3.13 2.50 2.31
ML3.2 Experiential courses/seminars (I learn while I practise with a group of people in cooperative / collaborative way) 3.00 3.68 3.88 3.71 3.71
ML3.6 Learning by carrying out a new task (learning by doing, on the job training) 3.00 3.23 3.50 3.64 3.40
ML3.10 The research of specific contents on the Internet 2.00 2.86 2.88 3.64 3.09
4.6.2 Spain
The respondents (n = 106) to the questionnaire in Spain included more than 50% of people who
regularly attend the University of Experience at the University of Zaragoza. This implies that they
are mostly people aged over 55, many of them retired and with a medium-high educational level.
This affects several of the results as the variables of influence or obstacles in their educational
activities, such as the relevance acquired by internal motivational aspects. For all the foregoing,
the main features of the Spanish sample, as well of the results scored by the Spanish respondents,
can be summarised as follows: the influence of the characteristics of the sample in results
(primacy of: oldest group [+55], high educational level, retired people); great relevance of internal
factors in motivations and obstacles for learning; choices for learning come from the decisions of
the learner (external factors of influence show little significance); personal development and the
pleasure of learning appear to be important motivational factors; obstacles are related to age and
lack of time due to family structure and the economic crisis in Spain, where most grandparents
(70%) have to take care of grandchildren; traditional lectures teacher-students are still the most
valuated form of learning.
With regard to the results of the cluster analysis, due to the size of the Spanish sample, it is not
possible to make comments about results concerning cluster 3, ‘Pragmatically recovering’.
Table 4.17 shows the mean scores of the sixteen selected variables according to the four clusters.
Even for Spain, the picture arising is in keeping with what emerged from the general sample
analysis. Respondents belonging to cluster 1, ‘Filling the gaps’, show means scores that are
consistently lower than the scores of all the other clusters (cluster 3 excluded). The most relevant
aspect for the respondents belonging to this group is ‘the pleasure of learning itself’, especially on
‘topics related to my hobbies and personal interests’.
Additionally, respondents belonging to cluster 2, ‘Completing the picture’, are motivated to learn
by ‘the pleasure of learning itself’, and notably interested in the ‘usability of knowledge’. Members
of Cluster 4, ‘Lifelong learning oriented’, consistently scores higher than all the other clusters, as is
the case in the general cluster analysis, assigning primacy, once again, to the ‘pleasure of learning
itself’ (and ‘keeping in touch with the times’) as motivators, and the ‘usability of knowledge’ (and
‘the quality of teachers’) as main interests.
Table 4.17: Mean scores of the sixteen selected variables by cluster, Spain
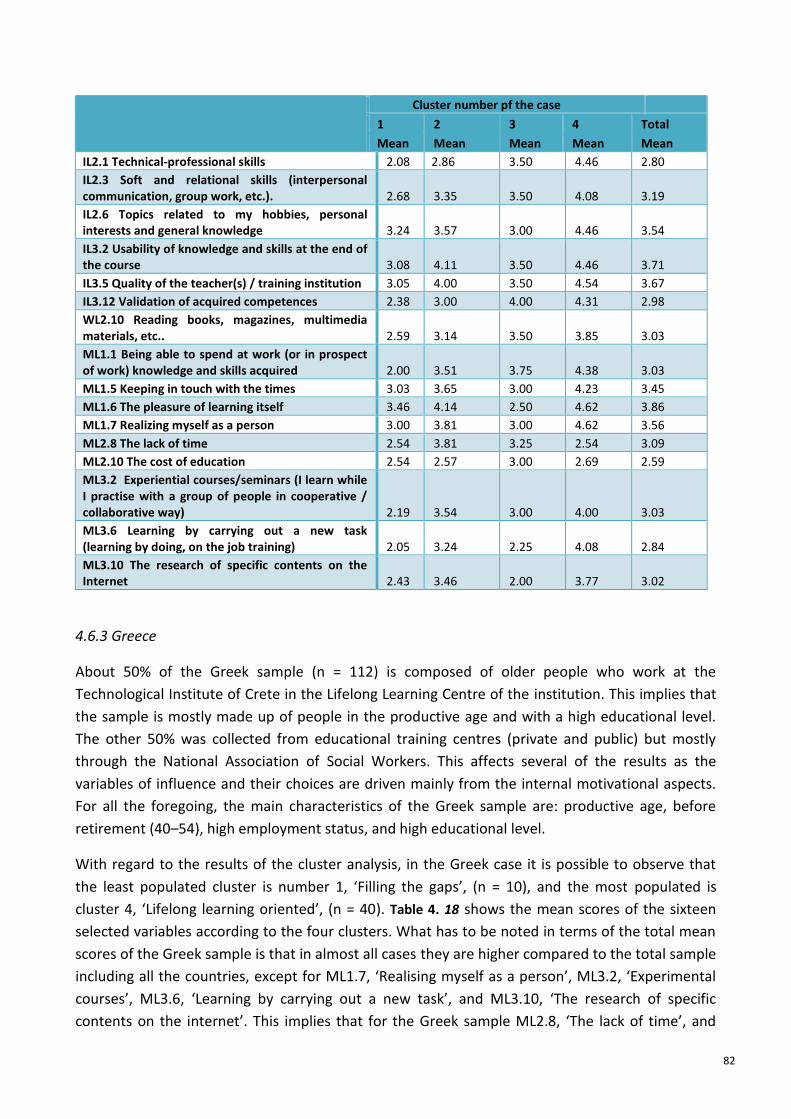
82
Cluster number pf the case
1 2 3 4 Total
Mean Mean Mean Mean Mean
IL2.1 Technical-professional skills 2.08 2.86 3.50 4.46 2.80
IL2.3 Soft and relational skills (interpersonal communication, group work, etc.). 2.68 3.35 3.50 4.08 3.19
IL2.6 Topics related to my hobbies, personal interests and general knowledge 3.24 3.57 3.00 4.46 3.54
IL3.2 Usability of knowledge and skills at the end of the course 3.08 4.11 3.50 4.46 3.71
IL3.5 Quality of the teacher(s) / training institution 3.05 4.00 3.50 4.54 3.67
IL3.12 Validation of acquired competences 2.38 3.00 4.00 4.31 2.98
WL2.10 Reading books, magazines, multimedia materials, etc.. 2.59 3.14 3.50 3.85 3.03
ML1.1 Being able to spend at work (or in prospect of work) knowledge and skills acquired 2.00 3.51 3.75 4.38 3.03
ML1.5 Keeping in touch with the times 3.03 3.65 3.00 4.23 3.45
ML1.6 The pleasure of learning itself 3.46 4.14 2.50 4.62 3.86
ML1.7 Realizing myself as a person 3.00 3.81 3.00 4.62 3.56
ML2.8 The lack of time 2.54 3.81 3.25 2.54 3.09
ML2.10 The cost of education 2.54 2.57 3.00 2.69 2.59
ML3.2 Experiential courses/seminars (I learn while I practise with a group of people in cooperative / collaborative way) 2.19 3.54 3.00 4.00 3.03
ML3.6 Learning by carrying out a new task (learning by doing, on the job training) 2.05 3.24 2.25 4.08 2.84
ML3.10 The research of specific contents on the Internet 2.43 3.46 2.00 3.77 3.02
4.6.3 Greece
About 50% of the Greek sample (n = 112) is composed of older people who work at the
Technological Institute of Crete in the Lifelong Learning Centre of the institution. This implies that
the sample is mostly made up of people in the productive age and with a high educational level.
The other 50% was collected from educational training centres (private and public) but mostly
through the National Association of Social Workers. This affects several of the results as the
variables of influence and their choices are driven mainly from the internal motivational aspects.
For all the foregoing, the main characteristics of the Greek sample are: productive age, before
retirement (40–54), high employment status, and high educational level.
With regard to the results of the cluster analysis, in the Greek case it is possible to observe that
the least populated cluster is number 1, ‘Filling the gaps’, (n = 10), and the most populated is
cluster 4, ‘Lifelong learning oriented’, (n = 40). Table 4. 18 shows the mean scores of the sixteen
selected variables according to the four clusters. What has to be noted in terms of the total mean
scores of the Greek sample is that in almost all cases they are higher compared to the total sample
including all the countries, except for ML1.7, ‘Realising myself as a person’, ML3.2, ‘Experimental
courses’, ML3.6, ‘Learning by carrying out a new task’, and ML3.10, ‘The research of specific
contents on the internet’. This implies that for the Greek sample ML2.8, ‘The lack of time’, and

83
ML2.10, ‘The cost of education’, represents a problem much more so than the mean respondent
to the survey, and this applies to all four clusters. The ‘quality of teachers/training institutions’
(IL3.5) is by far the most important factor influencing the choice of a learning experience, with
scores particularly high amongst respondents of cluster 2, ‘Completing the picture’, and cluster 4,
‘Lifelong learning oriented’. In general, all the other parameters are in line with what emerges
from the general sample analysis.
Table 4. 18: Mean scores of the sixteen selected variables by cluster, Greece
Cluster number pf the case
1 2 3 4 Total
Mean Mean Mean Mean Mean
IL2.1 Technical-professional skills 2.00 2.37 4.38 4.28 3.50
IL2.3 Soft and relational skills (interpersonal communication, group work, etc.). 2.60 3.80 3.62 4.30 3.84
IL2.6 Topics related to my hobbies, personal interests and general knowledge 3.30 3.73 3.86 4.50 4.02
IL3.2 Usability of knowledge and skills at the end of the course 3.70 4.17 4.19 4.53 4.27
IL3.5 Quality of the teacher(s) / training institution 4.00 4.70 4.10 4.68 4.50
IL3.12 Validation of acquired competences 2.30 3.67 4.48 4.18 3.90
WL2.10 Reading books, magazines, multimedia materials, etc.. 2.50 3.27 2.67 4.05 3.38
ML1.1 Being able to spend at work (or in prospect of work) knowledge and skills acquired 2.90 3.53 4.00 4.50 3.95
ML1.5 Keeping in touch with the times 2.80 3.83 3.62 4.63 4.00
ML1.6 The pleasure of learning itself 3.40 4.10 3.10 4.68 4.05
ML1.7 Realizing myself as a person 3.10 3.77 3.00 4.40 3.79
ML2.8 The lack of time 2.90 3.83 3.38 3.10 3.36
ML2.10 The cost of education 3.30 3.30 4.14 3.43 3.52
ML3.2 Experiential courses/seminars (I learn while I practise with a group of people in cooperative / collaborative way) 1.90 3.57 2.95 4.05 3.47
ML3.6 Learning by carrying out a new task (learning by doing, on the job training) 2.80 3.13 3.05 4.00 3.43
ML3.10 The research of specific contents on the Internet 2.90 3.47 2.71 3.83 3.40
4.6.4 Italy
A population of 460 people of which 58.5% are men and 41.5% women represents the Italian
sample. Employed respondents make up 40.4% as against 53.5% who are unemployed, three-
quarters of whom for more than two years. Retired people make up 3.9% of the population and
0.7% is unable to work. The people dedicated exclusively to domestic work, 0.9% and 0.7% are
distinct from those included in the above mentioned categories. The unemployed are over-
represented since the recruitment technique adopted for the questionnaire was a snowball
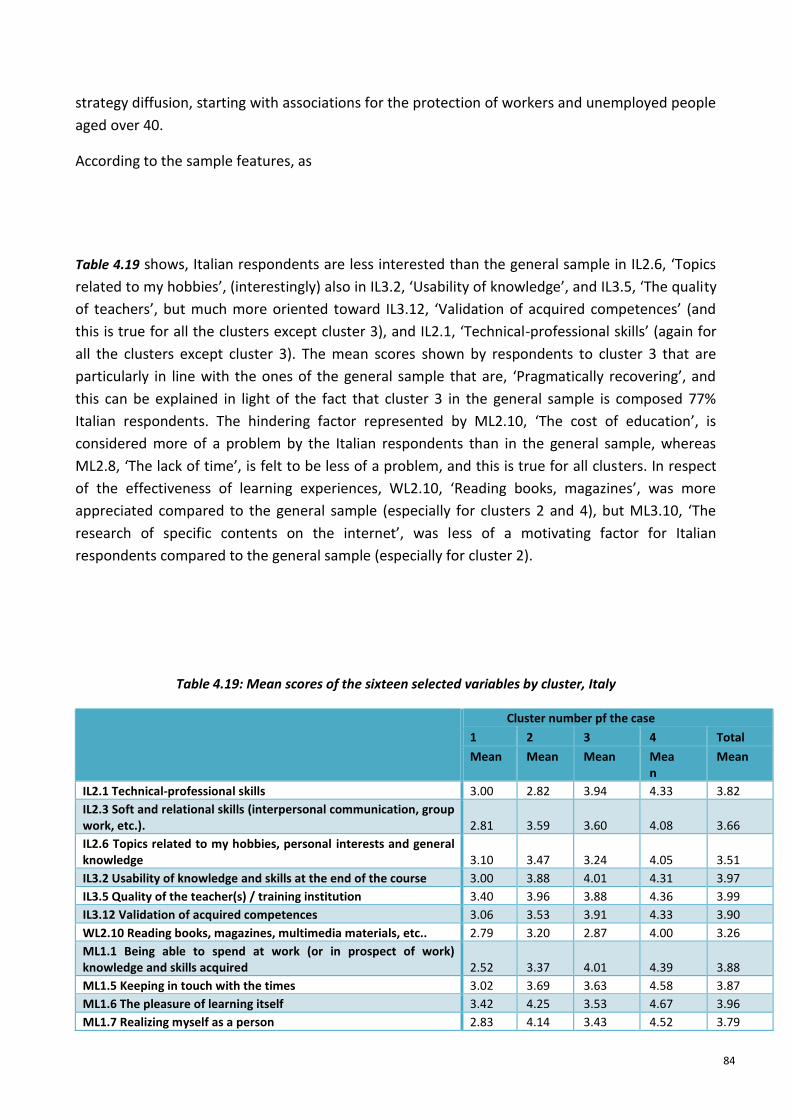
84
strategy diffusion, starting with associations for the protection of workers and unemployed people
aged over 40.
According to the sample features, as
Table 4.19 shows, Italian respondents are less interested than the general sample in IL2.6, ‘Topics
related to my hobbies’, (interestingly) also in IL3.2, ‘Usability of knowledge’, and IL3.5, ‘The quality
of teachers’, but much more oriented toward IL3.12, ‘Validation of acquired competences’ (and
this is true for all the clusters except cluster 3), and IL2.1, ‘Technical-professional skills’ (again for
all the clusters except cluster 3). The mean scores shown by respondents to cluster 3 that are
particularly in line with the ones of the general sample that are, ‘Pragmatically recovering’, and
this can be explained in light of the fact that cluster 3 in the general sample is composed 77%
Italian respondents. The hindering factor represented by ML2.10, ‘The cost of education’, is
considered more of a problem by the Italian respondents than in the general sample, whereas
ML2.8, ‘The lack of time’, is felt to be less of a problem, and this is true for all clusters. In respect
of the effectiveness of learning experiences, WL2.10, ‘Reading books, magazines’, was more
appreciated compared to the general sample (especially for clusters 2 and 4), but ML3.10, ‘The
research of specific contents on the internet’, was less of a motivating factor for Italian
respondents compared to the general sample (especially for cluster 2).
Table 4.19: Mean scores of the sixteen selected variables by cluster, Italy
Cluster number pf the case
1 2 3 4 Total
Mean Mean Mean Mean
Mean
IL2.1 Technical-professional skills 3.00 2.82 3.94 4.33 3.82
IL2.3 Soft and relational skills (interpersonal communication, group work, etc.). 2.81 3.59 3.60 4.08 3.66
IL2.6 Topics related to my hobbies, personal interests and general knowledge 3.10 3.47 3.24 4.05 3.51
IL3.2 Usability of knowledge and skills at the end of the course 3.00 3.88 4.01 4.31 3.97
IL3.5 Quality of the teacher(s) / training institution 3.40 3.96 3.88 4.36 3.99
IL3.12 Validation of acquired competences 3.06 3.53 3.91 4.33 3.90
WL2.10 Reading books, magazines, multimedia materials, etc.. 2.79 3.20 2.87 4.00 3.26
ML1.1 Being able to spend at work (or in prospect of work) knowledge and skills acquired 2.52 3.37 4.01 4.39 3.88
ML1.5 Keeping in touch with the times 3.02 3.69 3.63 4.58 3.87
ML1.6 The pleasure of learning itself 3.42 4.25 3.53 4.67 3.96
ML1.7 Realizing myself as a person 2.83 4.14 3.43 4.52 3.79

85
ML2.8 The lack of time 2.31 3.31 2.14 2.18 2.32
ML2.10 The cost of education 3.17 3.14 3.71 3.50 3.51
ML3.2 Experiential courses/seminars (I learn while I practise with a group of people in cooperative / collaborative way) 2.54 3.73 3.39 3.98 3.52
ML3.6 Learning by carrying out a new task (learning by doing, on the job training) 2.38 3.49 3.40 4.07 3.50
ML3.10 The research of specific contents on the Internet 2.81 3.27 3.08 4.11 3.40
4.6.5 Poland
The research sample of the Poland survey includes 258 respondents; mainly well educated,
occupationally active women aged 45–64. The respondents are 80.6% female due to the fact that
the main clientele of the Centre for the Advancement of Women Foundation are women; 64% are
aged 45–64, 9.3% retired, and the remaining 26.7% are age 40–44. The occupationally active
account for 71.7%, 9.7% are retired, and 3.1% are unemployed with an additional 2.3% long-term
unemployed. Respondents with post-secondary or higher education accounted for 79.9% of the
sample (ISCED levels 4 and 5).
According to the cluster analysis results displayed in Table 4.20, the particularity of the Polish
respondents is that they are less interested in IL2.1, ‘Technical-professional skills’ (especially
cluster 1), in IL2.3, ‘Soft and relational skills’ (especially clusters 2 and 3), in IL3.12, ‘Validation of
acquired competences’ (especially clusters 1, 3 and 4), generally express a poor effectiveness of
WL2.10, ‘Reading books, magazines’. They are, however, much more attracted, compared to the
general sample, by IL2.6, ‘Topics related to my hobbies’, (especially clusters 1 and 4), by IL3.2,
‘Usability of knowledge’ (all the clusters), and IL3.5, ‘Quality of teachers’ (all the clusters).
Furthermore, compared to the general sample, Polish respondents are also the ones most
attracted and open to both innovative learning experiences (i.e., ML3.2, ‘Experimental courses’
(especially clusters 1 and 3), ML3.6, ‘Learning by carrying out a new task’ (especially clusters 2 and
4) and new technologies (i.e., ML3.10, ‘The research of specific contents on the internet’ (all the
clusters).
Table 4.20: Mean scores of the sixteen selected variables by cluster, Poland
Cluster number pf the case
1 2 3 4 Total
Mean Mean Mean Mean Mean
IL2.1 Technical-professional skills 1.88 2.33 4.00 4.14 2.91
IL2.3 Soft and relational skills (interpersonal communication, group work, etc.). 2.88 3.16 3.31 3.96 3.34
IL2.6 Topics related to my hobbies, personal interests and general knowledge 3.50 3.71 3.06 4.43 3.77
IL3.2 Usability of knowledge and skills at the end of the course 3.63 4.45 4.31 4.71 4.44
IL3.5 Quality of the teacher(s) / training institution 3.63 4.45 4.19 4.50 4.38
IL3.12 Validation of acquired competences 2.00 3.20 2.94 3.54 3.16
WL2.10 Reading books, magazines, multimedia materials, etc.. 1.88 2.05 2.06 2.57 2.16
ML1.1 Being able to spend at work (or in prospect of work) knowledge and skills acquired 3.50 4.08 4.31 4.54 4.17
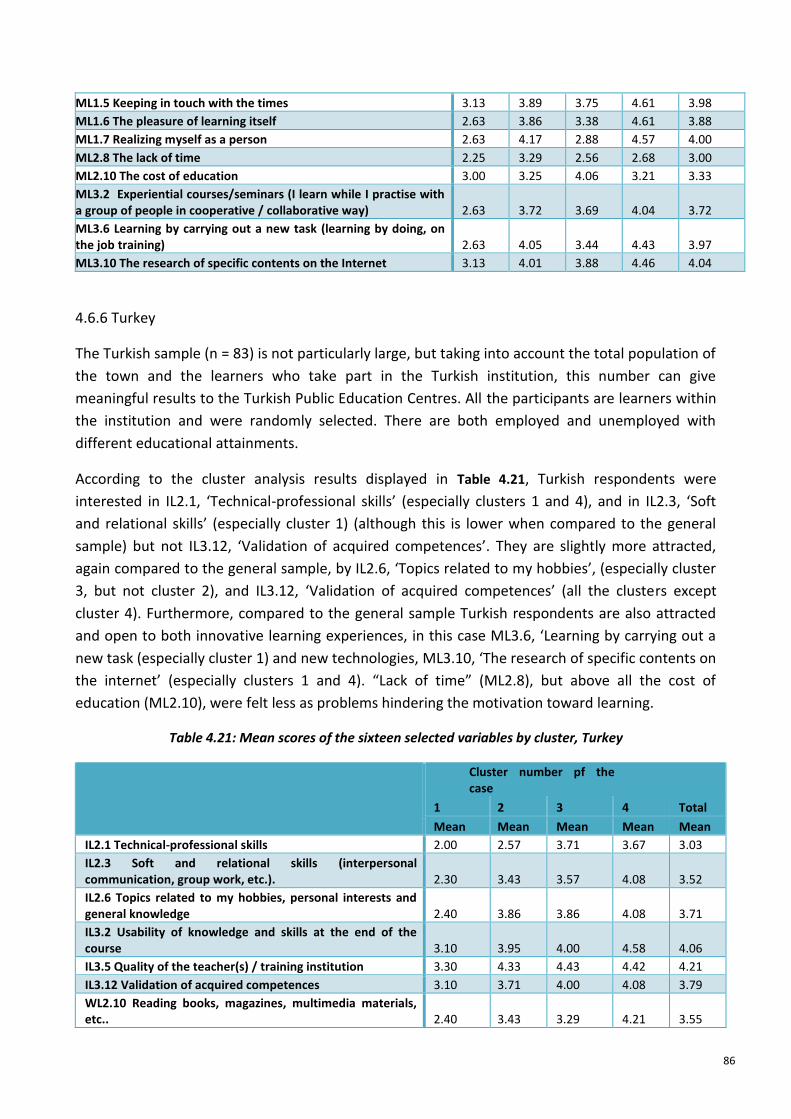
86
ML1.5 Keeping in touch with the times 3.13 3.89 3.75 4.61 3.98
ML1.6 The pleasure of learning itself 2.63 3.86 3.38 4.61 3.88
ML1.7 Realizing myself as a person 2.63 4.17 2.88 4.57 4.00
ML2.8 The lack of time 2.25 3.29 2.56 2.68 3.00
ML2.10 The cost of education 3.00 3.25 4.06 3.21 3.33
ML3.2 Experiential courses/seminars (I learn while I practise with a group of people in cooperative / collaborative way) 2.63 3.72 3.69 4.04 3.72
ML3.6 Learning by carrying out a new task (learning by doing, on the job training) 2.63 4.05 3.44 4.43 3.97
ML3.10 The research of specific contents on the Internet 3.13 4.01 3.88 4.46 4.04
4.6.6 Turkey
The Turkish sample (n = 83) is not particularly large, but taking into account the total population of
the town and the learners who take part in the Turkish institution, this number can give
meaningful results to the Turkish Public Education Centres. All the participants are learners within
the institution and were randomly selected. There are both employed and unemployed with
different educational attainments.
According to the cluster analysis results displayed in Table 4.21, Turkish respondents were
interested in IL2.1, ‘Technical-professional skills’ (especially clusters 1 and 4), and in IL2.3, ‘Soft
and relational skills’ (especially cluster 1) (although this is lower when compared to the general
sample) but not IL3.12, ‘Validation of acquired competences’. They are slightly more attracted,
again compared to the general sample, by IL2.6, ‘Topics related to my hobbies’, (especially cluster
3, but not cluster 2), and IL3.12, ‘Validation of acquired competences’ (all the clusters except
cluster 4). Furthermore, compared to the general sample Turkish respondents are also attracted
and open to both innovative learning experiences, in this case ML3.6, ‘Learning by carrying out a
new task (especially cluster 1) and new technologies, ML3.10, ‘The research of specific contents on
the internet’ (especially clusters 1 and 4). “Lack of time” (ML2.8), but above all the cost of
education (ML2.10), were felt less as problems hindering the motivation toward learning.
Table 4.21: Mean scores of the sixteen selected variables by cluster, Turkey
Cluster number pf the case
1 2 3 4 Total
Mean Mean Mean Mean Mean
IL2.1 Technical-professional skills 2.00 2.57 3.71 3.67 3.03
IL2.3 Soft and relational skills (interpersonal communication, group work, etc.). 2.30 3.43 3.57 4.08 3.52
IL2.6 Topics related to my hobbies, personal interests and general knowledge 2.40 3.86 3.86 4.08 3.71
IL3.2 Usability of knowledge and skills at the end of the course 3.10 3.95 4.00 4.58 4.06
IL3.5 Quality of the teacher(s) / training institution 3.30 4.33 4.43 4.42 4.21
IL3.12 Validation of acquired competences 3.10 3.71 4.00 4.08 3.79
WL2.10 Reading books, magazines, multimedia materials, etc.. 2.40 3.43 3.29 4.21 3.55
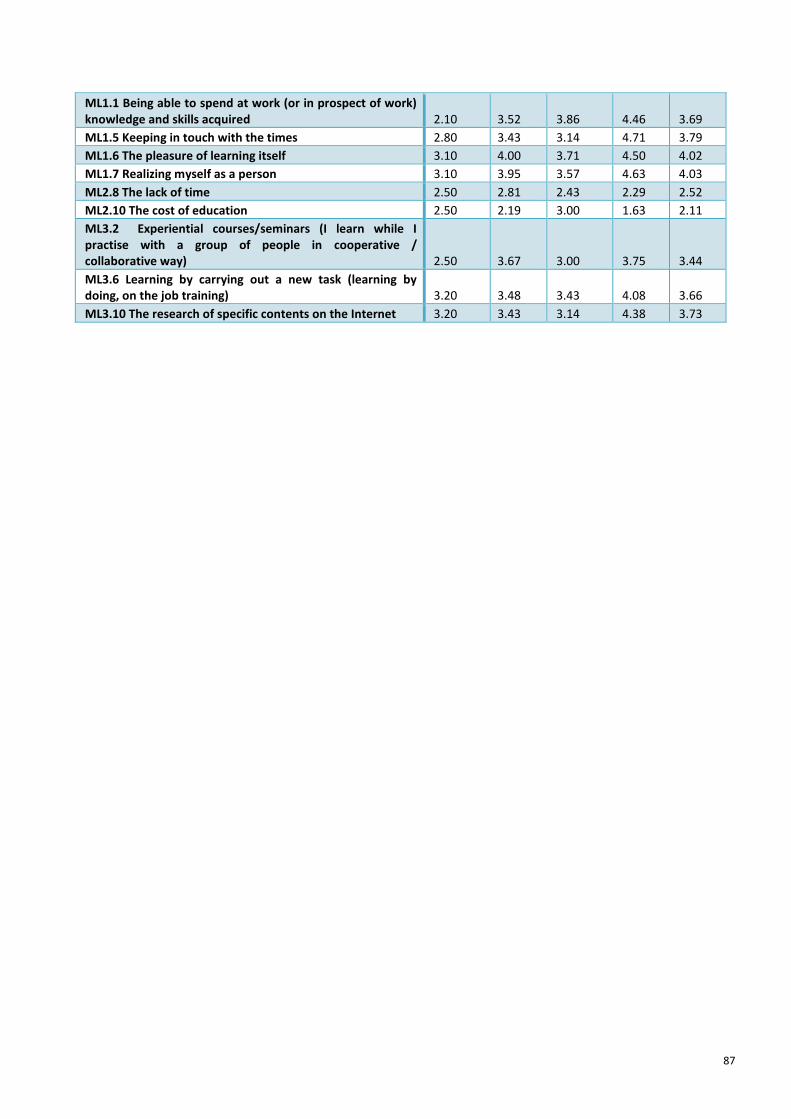
87
ML1.1 Being able to spend at work (or in prospect of work) knowledge and skills acquired 2.10 3.52 3.86 4.46 3.69
ML1.5 Keeping in touch with the times 2.80 3.43 3.14 4.71 3.79
ML1.6 The pleasure of learning itself 3.10 4.00 3.71 4.50 4.02
ML1.7 Realizing myself as a person 3.10 3.95 3.57 4.63 4.03
ML2.8 The lack of time 2.50 2.81 2.43 2.29 2.52
ML2.10 The cost of education 2.50 2.19 3.00 1.63 2.11
ML3.2 Experiential courses/seminars (I learn while I practise with a group of people in cooperative / collaborative way) 2.50 3.67 3.00 3.75 3.44
ML3.6 Learning by carrying out a new task (learning by doing, on the job training) 3.20 3.48 3.43 4.08 3.66
ML3.10 The research of specific contents on the Internet 3.20 3.43 3.14 4.38 3.73
88
6.2 REFERENCES
Beltrán, J. (1990). Psicología de la Educación. Madrid: EUDEMA.
Boehm, S., Schröder, H. & Kunze, F. (2013). Comparative age management: Theoretical
perspectives and practical implications. In J. Field, R. Burke & C. Cooper (Eds.), The SAGE handbook
of aging, work and society. (pp. 211–238). London: SAGE Publications Ltd.
Bunyan, K. & Jordan, A. (2005). Too late for the learning: Lessons from older learners. Research in
Post-Compulsory Education, 10(2), 267–281.
Callahan J.S. et al. (2003). Does method matter? A meta-analysis of the effects of training method
on older learner training performance. Journal of Management, 29(5), 663–680.
Censis (2012). 46° Rapporto sulla situazione sociale del Paese 2012, Francoangeli, Roma.
Chao, R. (2009). Understanding the adult learners’ motivation and barriers to learning. Inaugural
Conference Proceedings: Educating the Adult Educator: Quality provision and assessment in
Europe. University of Macedonia, Greece.
CIS (Centro de Investigaciones Sociológicas) (2014). Main Problems for Spanish population.
Available at: http://www.cis.es/opencms/-Archivos/Indicadores/documentos_html/
TresProblemas.html
Clark, M.C. & Caffarella, R.S. (Eds.) (1999). An Update on Adult Development Theory: New ways of
thinking about the life course. San Francisco: Jossey-Bass.
Crawford, D.L. (2004). The Role of Aging in Adult Learning: Implications for instructors in higher
education, Hopkins University, School of Education. Available at:
http://education.jhu.edu/PD/newhorizons /lifelonglearning/ higher-education/implications/
Edelman Trust Barometer (2013). Trust in Institutions. Results for Spain. Available at:
http://www.edelman.com/insights/intellectual-property/trust-2013/
Edelman Trust Barometer (2015). The Trust Index is an average of a country’s trust in the
institutions of government, business, media and NGOs. 27-country global total. Available at:
http://www.edelman.com.au/wp-content/uploads/2015/02/2015-Edelman-Trust-Australia-
Results.pdf
European Commission (2012). Position of the Commission Services’ on the Development of
Partnership Agreement and Programmes in SPAIN for the Period 2014–2020. Available at:
http://ec.europa.eu/regional_policy/archive/what/future/pdf/partnership/es_position_paper.pdf
European Commission (2013). Position of the Commission Services’ on the development of
Partnership Agreement and programmes in GREECE for the period 2014-2020. Avaliable at:
http://www.mou.gr/en/pages/eLibraryFS.aspx?item=2041

89
Eurostat (2007a). Mean amount of money spent by the participant on education and training by
age groups. Available at: https://open-data.europa.eu/es/data/dataset/cMSr3b6yxbHL4mkiLJaRQ
Eurostat (2007b). Distribution of reasons for participation in non-formal education and training.
Available at: http://open-data.europa.eu/data/dataset/BhBpa3vPwzW23QBcXIRNpQ
Eurostat (2011a). Distribution of non-formal education and training activities. Available at:
http://open-data.europa.eu/data/dataset/pjTE42j35nuLTd0tCI8R0A
Eurostat (2011b). Obstacles to participation in lifelong learning. Available at: http://ec.europa.eu/
eurostat/en/web/products-datasets/-/TRNG_AES_177
Eurostat (2012). Educational attainment statistics. Available at: http://ec.europa.eu/eurostat/
statistics-explained/index.php/Educational_attainment_statistics
Eurostat, (2006). Classification of Learning Activities — Manual. Luxembourg: Office for Official
Publications of the European Communities.
Feldman, R. (2005). Respecting the evidence. Philosophical Perspectives, 19, 95–119.
Graney, M. J. (1980). Participation in education among older people. Alternative Higher Education,
5(1), 71–86.
Greece- EQF Referencing report (2014). Eoppep, Ministry Of Education & Religious Affairs.
Available at: http://www.esos.gr/uploads/kcfinder/file/ GREECE% 20REFERENCING %20REPORT
_January% 202014.pdf
Houle, C. (1974). The Provision of Cost-Compulsory: The relationship between motivation and
participation, with special reference to non-traditional forms of study. Prepared for the
Organization for Economic Cooperation and Development, Paris.
ISTAT (2012). Rapporto annuale 2012 – La situazione del Paese. Available at: http://www.istat.it/
it/files/2012/05/Rapporto-annuale-2012.pdf
Ketsetzopoulou, M. (2007). Greece, Increasing Employment of Older Workers through Lifelong
Learning Statements and comments, Peer Review Increasing Employment of Older Workers
through Lifelong Learning, Iceland
Knowles, M. S. (1968). Andragogy, not pedagogy. Adult Leadership, 16(10), 350–352.
Knowles, M. S. (1973). The Adult Learner: A neglected species. Houston, Gulf.
Knowles, M. S. (1980). The Modern Practice of Adult Education: From pedagogy to andragogy (2nd
Edition). New York: Cambridge Books.
Knowles, M. S. (1984). The Adult Learner: A neglected species (3rd Edition). Houston, Gulf.
Maslow, A. H. (1943). A theory of human motivation. Psychological Review, 50, 370–396.

90
OECD (2005).Education at a Glance 2005: OECD Indicators, OECD Publishing. Available at:
http://www.oecd.org/education/skills-beyond-school/35317197.pdf
OECD (2011). Education at a Glance 2011: OECD Indicators, OECD Publishing. Available at:
http://www.oecd.org/education/skills-beyond-school/48631582.pdf
OECD (2007). Facts & Figures. Available at: http://www.oecd-ilibrary.org/economics/oecd-in-
figures-2007_oif-2007-en
OECD (2012). Education at a Glance 2012: OECD Indicators, OECD Publishing. Available at:
http://dx.doi.org/10.1787/eag-2012-en
OECD (2013). Skills Outlook 2013. First Results from the Survey of Adult Skills.
OECD (2014). Society at a Glance 2014. Available at: http://www.keepeek.com/Digital-Asset-
Management/oecd/social-issues-migration-health/society-at-a-glance-2014_soc_glance-2014-
en#page1
Oliveira, A.L. (2013). Promoting Conscious and Active Learning and Aging. How to face current and
future challenges? Imprensa da Universidade de Coimbra, Spain Available at: http://www.uc.pt/
imprensa_uc. ISBN DIGITAL 978-989-26-0732-0
PARP (2011). Bilans Kapitału Ludzkiego” Available at: http://bkl.parp.gov.pl/dane-bkl-2011
PARP (2013). Raport o stanie sektora małych i średnich przedsiębiorst w Polsce a latach 2011-
2012.
Pérez S. (2001) Aprender a lo largo de la vida. Desafío de la sociedad actual, Ágora Digital, 1.
Position of the Commission Services’ on the development of Partnership Agreement and
programmes in GREECE for the period 2014-2020. Ref. Ares (2012)1326063 – 09/11/2012
Position of the Commission Services’ on the development of Partnership Agreement and
programmes in ITALY for the period 2014-2020. Ref. Ares (2012)1326063 – 09/11/2012
Ryan, R. M., Cornell, J. P. & Deci, E. L. (1985). A motivational analysis of self-determination and
regulation in education. In Ames, L. & Ames, R. (Eds.) Research on motivation in education. Nueva
York, McGraw-Hill.
Dinçer, Minister of National Education Turkey, on Kanal 24 on the 8th of September 2012.
Skolverket (2000). Lifelong Learning and Life wide Learning. Stockholm, The National Agency for
Education.
Swain, L. (1995). Aging and the aged. Encyclopedia of nursing and allied health. Avaliable at:
http://education.jhu.edu/PD/newhorizons/lifelonglearning/higher-education/implications/