innovative tools driving research and discovery in cancer
TRANSCRIPT
Envisioning the Future of MultiomicsInnovative Tools Driving Research and Discovery
in Cancer and ImmunologyArticle Collection
Sponsored by:
Fundamentally alter your understanding of cancer and accelerate translational research with flexible and innovative solutions for single cell sequencing and spatially-resolved transcriptional profiling from 10x Genomics.
• Unravel the complexities of heterogeneous cancer samples to detect tumor clones and unique cellular states that drive malignancy
• Resolve the tumor microenvironment and explore the influence of cancer on its resident tissue
• Advance immunotherapies by characterizing the tumor immune response and the molecular mechanisms underlying therapeutic response and resistance
Resolve cancer
Chromium Single Cell Solutions
Single Cell Gene ExpressionSingle Cell Immune ProfilingSingle Cell Epigenomic ProfilingSingle Cell Protein ExpressionTargeted Gene Expression
Visium Spatial Solutions
Spatial Gene ExpressionSpatial Protein ExpressionTargeted Gene Expression
Learn more at 10xgenomics.com/cancer
with single cell and spatial multiomics
Contents4
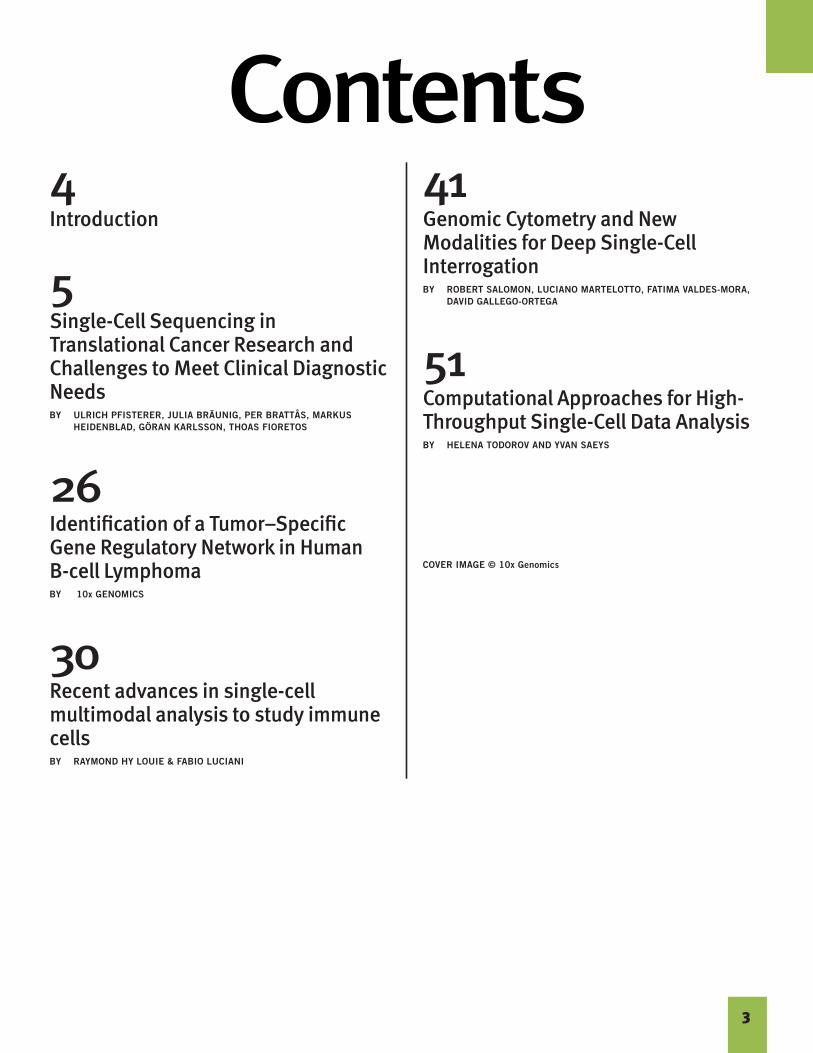
Introduction
5
Single-Cell Sequencing in Translational Cancer Research and Challenges to Meet Clinical Diagnostic Needs BY ULRICH PFISTERER, JULIA BRÄUNIG, PER BRATTÅS, MARKUS
HEIDENBLAD, GÖRAN KARLSSON, THOAS FIORETOS
26 Identification of a Tumor–Specific Gene Regulatory Network in Human B-cell Lymphoma BY 10x GENOMICS
30Recent advances in single-cell multimodal analysis to study immune cells BY RAYMOND HY LOUIE & FABIO LUCIANI
41Genomic Cytometry and New Modalities for Deep Single-Cell InterrogationBY ROBERT SALOMON, LUCIANO MARTELOTTO, FATIMA VALDES-MORA,
DAVID GALLEGO-ORTEGA
51Computational Approaches for High-Throughput Single-Cell Data AnalysisBY HELENA TODOROV AND YVAN SAEYS
COVER IMAGE © 10x Genomics
3
Introduction
From cancer to immunology, single cell RNA-sequencing (RNA-seq) has dramatically changed how researchers approach biology. Single cell resolution
has progressed the concept of inherent heterogeneity of biological systems and led to novel advances in how we understand developmental processes, treat disease, and develop therapeutics. Now, biologists can further increase the breadth of their understanding with multiomic single cell analysis. In addition to a readout of mRNA abundance from single cell RNA-seq, single cell techniques can now be applied to profile DNA, chromatin state, and the proteome. To take it one step further, some methods enable next generation multiomics—the ability to capture multiple measurements simultaneously from the same single cell, rather than examining one readout at a time. This abundant data can provide novel insights, but it also presents new challenges, including how to collect, store, and manage data; integrate different modalities; and properly interpret findings.
This collection of articles provides an overview of the exciting innovations occurring at the forefront of multiomics. The first two articles focus on oncology. Cancer research is dedicated to improving cancer diagnostics, patient stratification, treatment monitoring, and therapeutic development. Single cell multiomics has provided increasingly detailed cell atlases that let researchers gain a better picture of tumor heterogeneity and investigate how that heterogeneity impacts disease progression and treatment response. Pfisterer et al. (2020) describes how the latest single cell multiomic techniques can be applied to cancer research, reviews the methods available for single cell isolation, and highlights recent multiomic single cell oncology studies. In our Data Spotlight from 10x Genomics, the simultaneous readout of epigenomic and transcriptomic data from the same cells enables the direct reconstruction of cell type–specific gene regulatory networks for B-cell lymphoma. This study highlights the power of using Chromium Single Cell Multiome ATAC + Gene Expression, the first commercial solution for paired ATAC-seq and RNA-seq analysis of single cells. The data from this study is available for download so you can continue to explore the possibilities yourself.
In Louie and Luciani (2021) our attention shifts to the immune system, another heterogeneous system that benefits from single cell investigation. Analysis of multiple modalities, including chromatin state, transcription status, and protein
expression, can provide greater stratification of immune cell states, including a cell’s ability to bind antigens, attack invading cells, and follow a path of differentiation. Cell states can change over time and across space, and multiomic technologies have been developed to evaluate each of these variables. This article discusses recent single cell multiomic applications to immunology, focusing on next generation multiomic techniques that enable simultaneous measurement of at least two distinct modalities from the same single cell. Of particular relevance for immunologists is the ability to track clonal differentiation of T or B cells using receptor sequencing in the context of CAR-T therapy, autoimmune disease, and lineage tracing of hematopoietic progenitor cells.
The proliferation of multiomic single cell approaches has been made possible by the confluence of several disparate technologies, including genomics, microfluidics, cytometry, and informatics. Genomic Cytometry, described by Salomon et al. (2020), is any technique that provides cell-by-cell measurement of multiple modalities, including protein, mRNA, DNA, and epigenetic states, through a sequencing-based readout, therefore overcoming the limitations of fluorescence and mass cytometry by opening up unlimited analytic space to quantify hundreds of thousands of different molecular species at once. Multiple methods exist to perform Genomic Cytometry, including plate-based, droplet-based microfluidics, solid microfluidics, in situ combinatorial indexing, image-based approaches, and spatial transcriptomics.
Gathering data is only the beginning, however. In Todorov and Saeys (2019), we examine the process underlying analyzing a single cell experiment, including power calculations performed during experimental design, inclusion of controls during data generation, pre-processing, checking for batch effects during data visualization, cell type identification, differential analysis, and more. This article reviews methods for dimensionality reduction and cell clustering, compares approaches for trajectory analysis, and provides an introduction to single cell multiomic data integration.
These articles are designed to provide a comprehensive understanding of the technical innovations happening right now in single cell multiomics, and highlight how these advances are fueling the future of biological research and medicine.
4

R E V I EW AR T I C L E
Single-cell sequencing in translational cancer research andchallenges to meet clinical diagnostic needs
Ulrich Pfisterer1,2 | Julia Bräunig1,2 | Per Brattås1,2 | Markus Heidenblad1,2 |
Göran Karlsson3 | Thoas Fioretos1,2,4
1Center for Translational Genomics, Lund
University, Lund, Sweden
2Clinical Genomics Lund, Science for Life
Laboratory, Lund University, Lund, Sweden
3Division of Molecular Hematology, Lund
Stem Cell Center, Lund University, Lund,
Sweden
4Division of Clinical Genetics, Department of
Laboratory Medicine, Lund University, Lund,
Sweden
Correspondence
Ulrich Pfisterer, Department of Laboratory
Medicine, Center for Translational Genomics,
Lund University, Lund, Sweden.
Email: [email protected]
Thoas Fioretos, Division of Clinical Genetics,
Department of Laboratory Medicine, Lund
University, Lund, Sweden.
Email: [email protected]
Funding information
Governmental ALF grants; Lund University
Cancer Center (LUCC); Medical Faculty Lund
University; SciLifeLab Stockholm;
StemTherapy Lund University
Abstract
The ability to capture alterations in the genome or transcriptome by next-generation
sequencing has provided critical insight into molecular changes and programs under-
lying cancer biology. With the rapid technological development in single-cell
sequencing, it has become possible to study individual cells at the transcriptional,
genetic, epigenetic, and protein level. Using single-cell analysis, an increased resolu-
tion of fundamental processes underlying cancer development is obtained, providing
comprehensive insights otherwise lost by sequencing of entire (bulk) samples, in
which molecular signatures of individual cells are averaged across the entire cell pop-
ulation. Here, we provide a concise overview on the application of single-cell analysis
of different modalities within cancer research by highlighting key articles of their
respective fields. We furthermore examine the potential of existing technologies to
meet clinical diagnostic needs and discuss current challenges associated with this
translation.
K E YWORD S
cancer research, clinical diagnostics, clinical utility, single-cell sequencing
1 | INTRODUCTION
Cancer represents highly complex and diverse pathological conditions,
characterized by aberrant genomic, epigenomic and transcriptomic
features, such as structural alterations, single nucleotide and copy
number variations (SNVs, CNVs),1 and altered epigenetic and tran-
scriptional signatures.2,3 Both intra- and intertumoral heterogeneity
contribute to the complexity of cancer with mutations in driver genes
adding on to clonal evolution4 and consequently to dynamic clonal
architecture throughout disease progression.5 Recent years have
witnessed a dramatic progress in studying the genetic and molecular
basis of human cancer, enabled, in part, by the rapid technological
developments in next-generation sequencing.6,7 Clinical applications
for these platforms span the areas of diagnostics, prognostics and
therapeutics using massively parallel sequencing for whole-genome
(WGS) or targeted DNA-sequencing (eg, whole-exome sequencing
WES), RNA-sequencing, chromatin immunoprecipitation (ChIP)-
sequencing, and DNA methylation assays for epigenetic mapping.
In order to further improve clinical application of sequencing-
based technology and to ultimately provide better cancer diagnosis,
patient stratification, treatment monitoring, and personalized therapy,
the recent initiative of the human tumor atlas network aims at the
generation of longitudinal cell atlases of various tumor types
employing single-cell and spatially resolved technologies.8
This is an open access article under the terms of the Creative Commons Attribution-NonCommercial-NoDerivs License, which permits use and distribution in any
medium, provided the original work is properly cited, the use is non-commercial and no modifications or adaptations are made.
© 2021 The Authors. Genes, Chromosomes and Cancer published by Wiley Periodicals LLC.
5
The considerable cellular heterogeneity present in most tumors is
likely to contribute to the currently ineffective and highly individual
responses of patients to therapeutic approaches. While bulk analyses
of tumor tissues have provided important insight into for example, the
transcriptional signature or overall genetic variability of a given
tissue,9-12 it does not resolve the cellular composition of malignant
and normal cells. Hence, resolving tumor composition at single-cell
resolution offers great potential not only to provide critical insights
into tumor biology per se, but also to shed light on other therapeuti-
cally relevant issues related to heterogeneity such as tumor microen-
vironment, cell-of-origin, and cancer stem cells. Thus, the advent of
single-cell analyses promises to improve diagnosis, facilitate monitor-
ing of both disease progression and treatment response and will,
hopefully, pave the way to more personalized therapeutic approaches
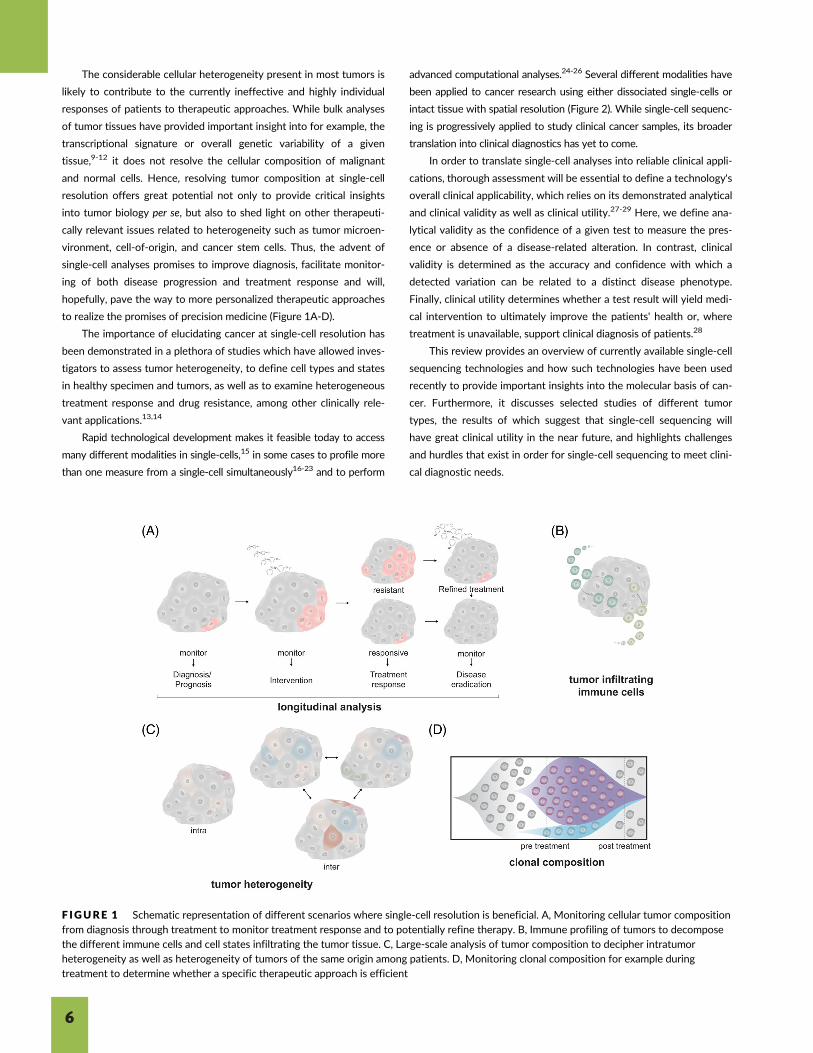
to realize the promises of precision medicine (Figure 1A-D).
The importance of elucidating cancer at single-cell resolution has
been demonstrated in a plethora of studies which have allowed inves-
tigators to assess tumor heterogeneity, to define cell types and states
in healthy specimen and tumors, as well as to examine heterogeneous
treatment response and drug resistance, among other clinically rele-
vant applications.13,14
Rapid technological development makes it feasible today to access
many different modalities in single-cells,15 in some cases to profile more
than one measure from a single-cell simultaneously16-23 and to perform
advanced computational analyses.24-26 Several different modalities have
been applied to cancer research using either dissociated single-cells or
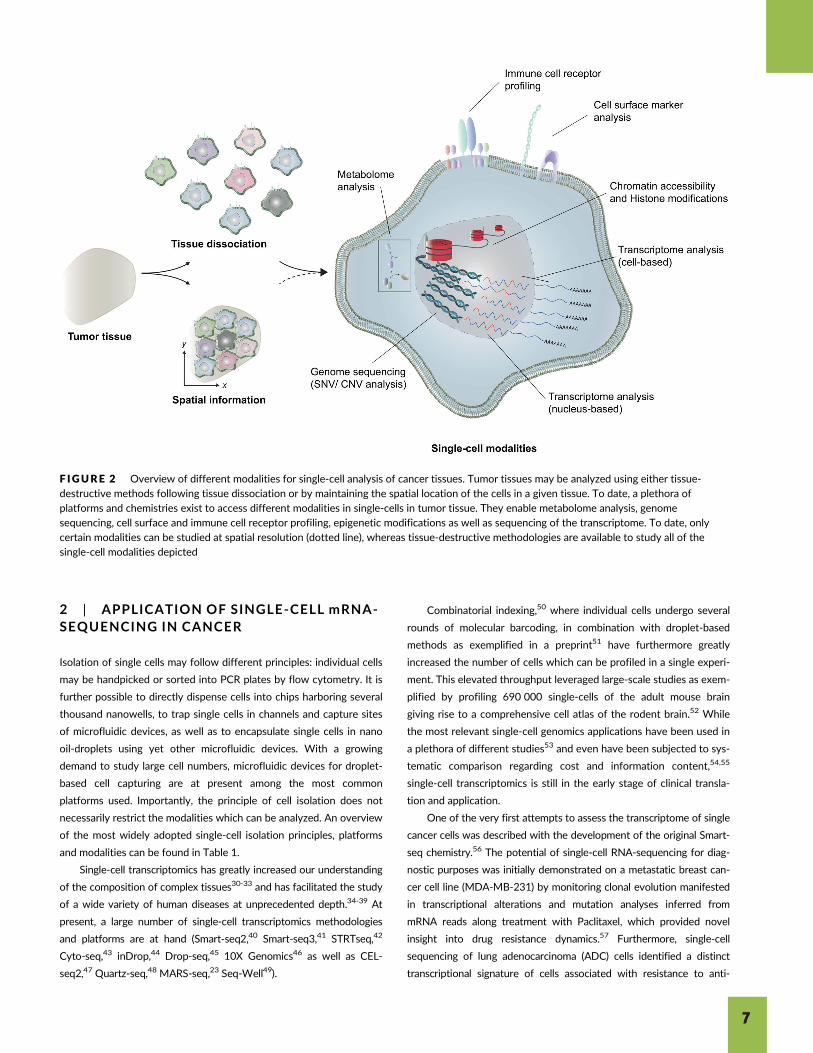
intact tissue with spatial resolution (Figure 2). While single-cell sequenc-
ing is progressively applied to study clinical cancer samples, its broader
translation into clinical diagnostics has yet to come.
In order to translate single-cell analyses into reliable clinical appli-
cations, thorough assessment will be essential to define a technology's
overall clinical applicability, which relies on its demonstrated analytical
and clinical validity as well as clinical utility.27-29 Here, we define ana-
lytical validity as the confidence of a given test to measure the pres-
ence or absence of a disease-related alteration. In contrast, clinical
validity is determined as the accuracy and confidence with which a
detected variation can be related to a distinct disease phenotype.
Finally, clinical utility determines whether a test result will yield medi-
cal intervention to ultimately improve the patients' health or, where
treatment is unavailable, support clinical diagnosis of patients.28
This review provides an overview of currently available single-cell
sequencing technologies and how such technologies have been used
recently to provide important insights into the molecular basis of can-
cer. Furthermore, it discusses selected studies of different tumor
types, the results of which suggest that single-cell sequencing will
have great clinical utility in the near future, and highlights challenges
and hurdles that exist in order for single-cell sequencing to meet clini-
cal diagnostic needs.
F IGURE 1 Schematic representation of different scenarios where single-cell resolution is beneficial. A, Monitoring cellular tumor compositionfrom diagnosis through treatment to monitor treatment response and to potentially refine therapy. B, Immune profiling of tumors to decomposethe different immune cells and cell states infiltrating the tumor tissue. C, Large-scale analysis of tumor composition to decipher intratumorheterogeneity as well as heterogeneity of tumors of the same origin among patients. D, Monitoring clonal composition for example duringtreatment to determine whether a specific therapeutic approach is efficient
6
2 | APPLICATION OF SINGLE-CELL mRNA-SEQUENCING IN CANCER
Isolation of single cells may follow different principles: individual cells
may be handpicked or sorted into PCR plates by flow cytometry. It is
further possible to directly dispense cells into chips harboring several
thousand nanowells, to trap single cells in channels and capture sites
of microfluidic devices, as well as to encapsulate single cells in nano
oil-droplets using yet other microfluidic devices. With a growing
demand to study large cell numbers, microfluidic devices for droplet-
based cell capturing are at present among the most common
platforms used. Importantly, the principle of cell isolation does not
necessarily restrict the modalities which can be analyzed. An overview
of the most widely adopted single-cell isolation principles, platforms
and modalities can be found in Table 1.
Single-cell transcriptomics has greatly increased our understanding
of the composition of complex tissues30-33 and has facilitated the study
of a wide variety of human diseases at unprecedented depth.34-39 At
present, a large number of single-cell transcriptomics methodologies
and platforms are at hand (Smart-seq2,40 Smart-seq3,41 STRTseq,42
Cyto-seq,43 inDrop,44 Drop-seq,45 10X Genomics46 as well as CEL-
seq2,47 Quartz-seq,48 MARS-seq,23 Seq-Well49).
Combinatorial indexing,50 where individual cells undergo several
rounds of molecular barcoding, in combination with droplet-based
methods as exemplified in a preprint51 have furthermore greatly
increased the number of cells which can be profiled in a single experi-
ment. This elevated throughput leveraged large-scale studies as exem-
plified by profiling 690 000 single-cells of the adult mouse brain
giving rise to a comprehensive cell atlas of the rodent brain.52 While
the most relevant single-cell genomics applications have been used in
a plethora of different studies53 and even have been subjected to sys-
tematic comparison regarding cost and information content,54,55
single-cell transcriptomics is still in the early stage of clinical transla-
tion and application.
One of the very first attempts to assess the transcriptome of single
cancer cells was described with the development of the original Smart-
seq chemistry.56 The potential of single-cell RNA-sequencing for diag-
nostic purposes was initially demonstrated on a metastatic breast can-
cer cell line (MDA-MB-231) by monitoring clonal evolution manifested
in transcriptional alterations and mutation analyses inferred from
mRNA reads along treatment with Paclitaxel, which provided novel
insight into drug resistance dynamics.57 Furthermore, single-cell
sequencing of lung adenocarcinoma (ADC) cells identified a distinct
transcriptional signature of cells associated with resistance to anti-
F IGURE 2 Overview of different modalities for single-cell analysis of cancer tissues. Tumor tissues may be analyzed using either tissue-destructive methods following tissue dissociation or by maintaining the spatial location of the cells in a given tissue. To date, a plethora ofplatforms and chemistries exist to access different modalities in single-cells in tumor tissue. They enable metabolome analysis, genomesequencing, cell surface and immune cell receptor profiling, epigenetic modifications as well as sequencing of the transcriptome. To date, onlycertain modalities can be studied at spatial resolution (dotted line), whereas tissue-destructive methodologies are available to study all of thesingle-cell modalities depicted
7
cancer drugs.58 Similarly, single-cell resolution of the transcriptome in
renal cell carcinoma has shed new light on intratumor heterogeneity
and led to the derivation of a new, combinatorial therapeutic strategy.59
Moreover, two single-cell studies assessed the transcriptome of circu-
lating tumor cells (CTCs) in prostate cancer (PC)60 and breast cancer.61
This led to the identification of two distinct phenotypes of breast can-
cer CTCs with the capacity to interconvert and potentially contribute
to treatment resistance.61 Single-cell analysis further revealed great
diversity of PC CTCs among treated patients and identified splice vari-
ants and mutations in the androgen receptor (AR) gene, associating
failed AR inhibitor treatment to noncanonical Wnt signaling.60 Overall,
analysis of single CTCs may open up for exciting possibilities for future
non-invasive, single-cell diagnostics.
Tumor heterogeneity has been elucidated in glioblastomas,38
breast cancer,62 and large-scale tumor cell atlases have been gener-
ated in lung,63,64 renal,65 and pediatric brain tumors66 at single-cell
resolution. Interestingly, validating single-cell transcriptomics data
with bulk RNA-sequencing, proteomics and functional studies con-
firmed novel phenotypes of endothelial cells which in turn potentially
opens up for new therapeutic target points blocking tumor angiogene-
sis in lung cancer.64 Further technological advancement leveraging
increased cellular throughput, led to the identification of discrete tran-
scriptional programs and cellular compositions in relation to increasing
clinical grade tumors of glioma,37 distinct transcriptional programs of
tumor-associated macrophages in glioma67 and to the determination
of varying gene signatures in malignant cells in head and neck squa-
mous cell carcinoma.68 Unbiased clustering of single-cells obtained
from colorectal cancer not only discovered novel cancer-associated
fibroblast types and unmasked tumor heterogeneity, but importantly
also demonstrated that single-cell transcriptomics provides prognostic
insight previously hidden in bulk sequencing data.69 Furthermore, dec-
iphering of cellular composition of breast cancer patient-derived
xenografts (PDX) identified a stem-like cell type with high epidermal
growth factor receptor (EGFR) gene expression levels and further
linked high EGFR expression to an elevated mesenchymal gene
signature,70 similar to another study identifying elevated expression
of epithelial-to-mesenchymal (EMT) - associated genes in breast can-
cer cells.71 Following breast cancer samples along the treatment
course of several years, integrated single-cell genome and trans-
criptome analyses identified discrete phenotypes associated with
chemoresistance, with the most prominent upregulation being an
EMT gene signature.72
While combined analysis of DNA and RNA in individual cells is
feasible,22 current protocols are not amendable for high cellular
throughput and have therefore not frequently been used. Comple-
mentation of gene expression with inferred CNV from full-length
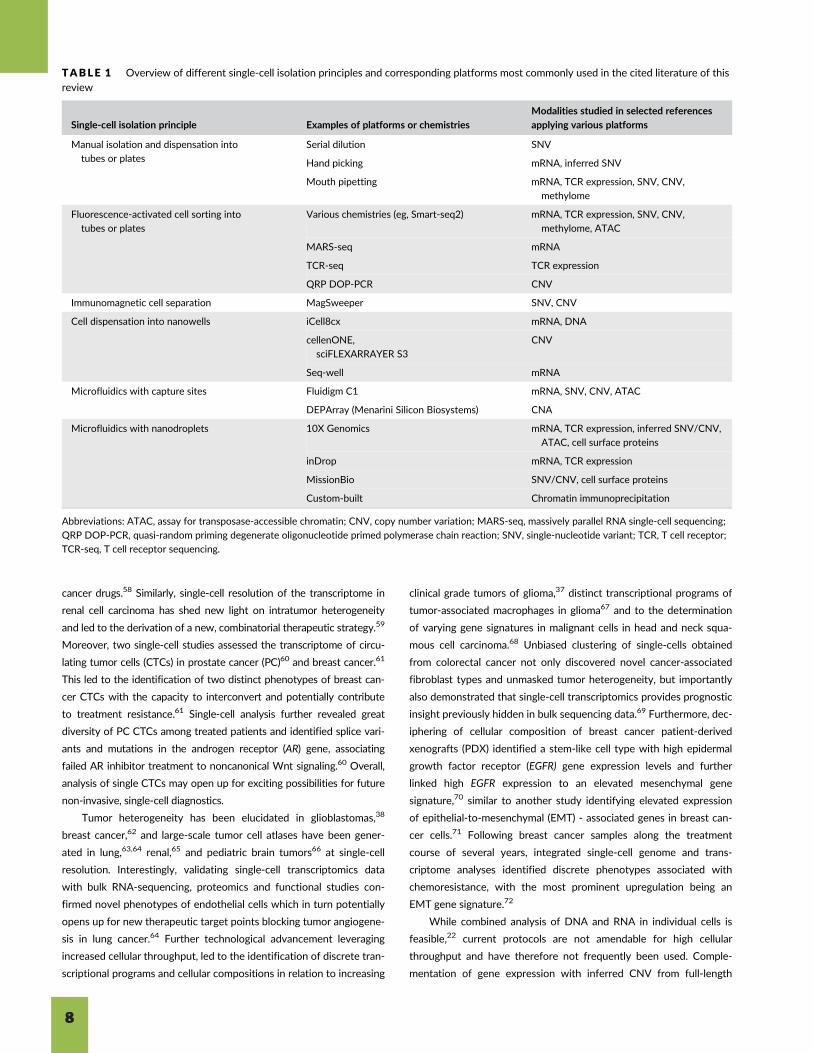
TABLE 1 Overview of different single-cell isolation principles and corresponding platforms most commonly used in the cited literature of thisreview
Single-cell isolation principle Examples of platforms or chemistries
Modalities studied in selected references
applying various platforms
Manual isolation and dispensation into
tubes or plates
Serial dilution SNV
Hand picking mRNA, inferred SNV
Mouth pipetting mRNA, TCR expression, SNV, CNV,
methylome
Fluorescence-activated cell sorting into
tubes or plates
Various chemistries (eg, Smart-seq2) mRNA, TCR expression, SNV, CNV,
methylome, ATAC
MARS-seq mRNA
TCR-seq TCR expression
QRP DOP-PCR CNV
Immunomagnetic cell separation MagSweeper SNV, CNV
Cell dispensation into nanowells iCell8cx mRNA, DNA
cellenONE,
sciFLEXARRAYER S3
CNV
Seq-well mRNA
Microfluidics with capture sites Fluidigm C1 mRNA, SNV, CNV, ATAC
DEPArray (Menarini Silicon Biosystems) CNA
Microfluidics with nanodroplets 10X Genomics mRNA, TCR expression, inferred SNV/CNV,
ATAC, cell surface proteins
inDrop mRNA, TCR expression
MissionBio SNV/CNV, cell surface proteins
Custom-built Chromatin immunoprecipitation
Abbreviations: ATAC, assay for transposase-accessible chromatin; CNV, copy number variation; MARS-seq, massively parallel RNA single-cell sequencing;
QRP DOP-PCR, quasi-random priming degenerate oligonucleotide primed polymerase chain reaction; SNV, single-nucleotide variant; TCR, T cell receptor;
TCR-seq, T cell receptor sequencing.
8
single-cell mRNA to distinguish malignant cells37,38,71,73,74 or targeted
genotyping35 present attractive alternatives to comprehensively study
human malignancies. Accordingly, chromosomal aberrations charac-
teristic for glioblastoma were inferred onto tumor cells38 and classifi-
cation of malignant cells in glioma were corroborated.37 In line with
this, cancer-specific genomic aberrations could be inferred from
single-cell transcriptomics data and were restricted to malignant gli-
oma cells. Haplotype inference additionally revealed heterozygous
loss of chromosome 14 alleles in glioma tumors.74 Interestingly, RNA-
inferred CNV information clearly distinguished immune from carci-
noma cells in breast cancer,71 opening up for the possibility for unre-
strained profiling of both cell types without usage of cell surface
markers. Deducting genomic alterations such as CNV from mRNA-
sequencing also aided the delineation of cellular hierarchies in
oligodendroglioma.75
More recently, high throughput single-cell mRNA approaches
such as Seq-well49 combined with targeted genotyping were used to
elucidate molecular hierarchies in acute myeloid leukemia (AML) and
confidently identified six malignant AML cell types with mutations
being absent in healthy donor samples.76 This study furthermore
combined both short- and long-read sequencing technologies to
determine genetic aberrations such as insertions, deletions and gene-
fusions in individual cells. It additionally employed a large cohort of
longitudinally collected AML samples (diagnosis, treatment,
remission),76 thereby suggesting that single-cell transcriptome analy-
sis may be applied to monitor treatment response and putatively aid
clinical decision making. However, in order for this approach to pro-
vide analytical and ultimately clinical validity, it needs to possess
greater detection sensitivity of mutation signatures. Hence, while this
work leveraged large-scale analysis, about 40% of the targeted sites
were not detected and mutations located in proximity to either the
30end of the mRNA or to an internal polyadenylation site were cap-
tured more efficiently. This is directly linked to the design of the
sequencing library preparation in Seq-well49 which preferentially
yields sequences toward the 30end of mRNA transcripts via polyT-
capture sequences. In line with this, Petti and co-workers utilized a
droplet-based platform to infer genomic information from single-cell
transcriptomes and were able to deduce SNV information in 23% of
the cells analyzed.77 In addition, the authors confidently distinguished
normal from tumor cells and successfully identified a cell-surface
marker (CD99) from the single-cell transcriptomics data, enabling for
the precise isolation of distinct clonal cells.77 While this study fell
short in identifying novel cell-surface markers, it nicely demonstrated
the possibility for precise isolation of malignant cells for refined
downstream analyses. Recently, uveal melanoma (UM) was studied
by integrated mRNA and B and T cell receptor (BCR and TCR)
expression.78 Inferring genomic aberrations present in the single-cell
transcriptomics data using the software inferCNV, both canonical
and non-canonical CNVs were identified across all samples, delineat-
ing clonal structures in the tumor tissue.78 This furthermore demon-
strates the applicability of single-cell transcriptome analysis to
deduce genomic variation in cancer.
Single-cell transcriptomics is a rapidly evolving technology which
already has yielded critical insight into cellular diversity of complex tis-
sues.31 The highlighted research in this section provided first insights
into pathological transcriptional changes underlying cancer develop-
ment and progression as well as response to therapy. These studies
clearly demonstrate a great potential for single-cell mRNA-sequencing
to become a clinical diagnostic tool in the near future. Most likely, the
first clinical applicability will be as a prognostic tool in the diagnostic
setting, for example in hematologic malignancies, to decipher the cel-
lular composition of normal and malignant tissue based on their tran-
scriptional signatures. However, this will require several large-scale
studies to demonstrate that cellular composition correlates with
important clinical parameters. Along with increased sensitivity and
reproducibility, single-cell mRNA-sequencing, in combination with
other modalities (see below) is likely to become increasingly important
in monitoring treatment response.
3 | SINGLE-CELL IMMUNE PROFILING INCANCER
In the thymus, lymphoid progenitors are molded into committed T
cells which in turn play an important role in shaping the adaptive
immune system. Besides the acquisition of somatic mutations
throughout life in normal cells of different tissues, contributing to
cancerogenesis, progressive decline in T cell production in the thymus
has been associated with an increased incidence of age-relate dis-
eases, including cancer.79 Moreover, the type of immune cells and
their location and density in a given tumor were postulated to possess
prognostic value, and suggested that high frequency of cytotoxic
memory T cells in a tumor tissue was indicative of disease relapse post
treatment.80 These results exemplified the potential clinical benefit of
comprehensive immune cell profiling of tumors and strengthened the
ultimate necessity to retain spatial information within the tumor
tissue.
Since the development of T cells involves both the differentiation
of T lymphocytes and the generation and maintenance of a diverse
TCR repertoire, precise comprehension of developmental processes
underlying T cell specification are of significant importance to under-
stand disease progression in cancer. While targeted TCR analysis via
nested PCR has allowed analysis of several hundreds of single-cells,81
recent developments have made it possible to probe even larger num-
bers of T cells in an unbiased fashion,73,82,83 as well as in combination
with targeted TCR analysis.84 In addition, simultaneous profiling of
both transcriptomic and TCR signatures from thousands of individual
cells has been reported.85-87
A recent study revealed bias in VDJ gene usage during recombi-
nation of TCRβ throughout differentiation toward mature T cells by
integrating transcriptional signatures of cell states with the expression
data on TCR chains α and β.88 This observed bias in TCR recombina-
tion might impact the adaptive immune response and consequently an
individual's response to antigenic stimuli.
9
In the attempt to elucidate the tumor microenvironment, single-
cell analysis enabled the identification of molecular signatures of
exhaustion programs in T cells, their associated markers, and linked
dysfunctional signatures to tumor reactivity in human mela-
noma.73,84,85 It further led to the determination of a transcriptional sig-
nature of specific immune cells which could in turn be linked to patient
survival and improved existing prognostication of breast cancer
patients.89 Moreover, integrated mRNA- and targeted TCR-sequencing
revealed that dysfunctional T cells exhibited prominent clonal expan-
sion with continuous proliferation in metastatic melanoma.84
Single-cell analysis further defined clonotypes of T cells while
suggesting their activation status in the human hepatocarcinoma
(HCC) microenvironment,90 and identified a distinct dendritic cell type
capable of migrating from the tumor tissue to the hepatic lymph
node.91 Furthermore, valuable insight into transcriptional signatures
of tumor-infiltrating myeloid cells in lung ADC has been obtained
using high throughput single-cell mRNA-sequencing.92
A recent study utilized single-cell technology to elucidate the
composition of immune cells in the tumor microenvironment of breast
cancer.86 High-throughput integrated mRNA- and TCR-sequencing rev-
ealed an increased phenotypic diversity of both lymphoid and myeloid
cells in tumorous tissue, as opposed to normal breast tissue, and
exhibited inter-patient variation in metabolic signatures.86 Corroborating
their findings using two different platforms (inDrop and 10X Genomics),
the authors identified continuous T cell activation, which in part could
be explained by broad stimuli activating TCR repertoire, and showed
that tumor residing T cells were comprised of different clonotype clus-
ters with varying activation states.86 Overall, distinct phenotypes are
shaped by the TCR repertoire in response to antigenic stimuli but diver-
sity is also mediated by environmental stimuli such as hypoxia.86
More recently, integrated analysis of mRNA and TCR repertoires
in 141 623 T cells was performed in four different types of cancers
(non-small-cell lung ADC, endometrial ADC, colorectal ADC and renal
clear cell carcinoma) as well as in histologically normal adjacent tissue
(NAT) and peripheral blood.87 This study led to the discovery that
diverse clonal expansion patterns across patients with clonotypes being
either expanded similarly in the tumor and NAT or following differing
patterns.87 Moreover, this work shed light on the existence of a strong
correlation between peripheral and intratumoral clone size, a finding
which was substantiated by re-analyzing data of related studies investi-
gating T cells in non-small-lung cancer93 and colorectal cancer cells.94
In addition, non-exhausted T cell clones were more likely to be blood-
associated as opposed to exhausted clones and different clonal expan-
sion patterns were correlated with the clinical response of patients.87
These findings suggest that the detection of clones in blood may
serve a useful proxy to determine the presence of clinically relevant,
expanded clones in the tumor, opening up for the possibility of “liquidbiopsies” for monitoring treatment response following therapy with
Atezolizumab, Sunitinib, or IMmotion150 using single-cell technology.
Utilizing the same combined mRNA- and TCR-sequencing
approach on basal and squamous cell carcinoma samples before and
after immune checkpoint blockade (ICB) treatment suggested that
novel T cells exert treatment response rather than T cell clones
pre-existing in the tumor.95 Analysis of patients with metastatic mela-
noma responsive to ICB treatment displayed a greater fraction of
large T cell clones as opposed to non-responsive patients.85 Interest-
ingly, transcriptional alterations and gene modules induced by ICB
treatment did not correlate with the clinical outcome observed in
patients,85 rendering simultaneous profiling of TCR clonality a neces-
sity to deduct clinically relevant information.
Despite the correlation of therapy response to clone size, T cell
clonal specificity to distinct tumor antigens yet needs to be deter-
mined and integrated to define lasting predictive markers for the out-
come of different ICB therapies. Interestingly, TCR repertoire
analysis of CD8+ T cells in UM revealed that these cells strongly
expressed the checkpoint marker gene LAG3, whereas, unexpectedly,
expression of PD1 was minimal.78 This may in part explain the lack
of responsiveness of UM to checkpoint immunotherapy targeting
PD1. Moreover, single-cell analysis of immune cells from glioblas-
toma combined with murine models identified a distinct macrophage
type which in turn appeared to be a potential target for combinato-
rial immune therapy.96
Very recently, the development of single-cell metabolic regulome
profiling (scMEP) made it possible to study the highly dynamic func-
tions exerted by immune cells manifested in metabolomic alterations
at spatial resolution, deciphering metabolic profiles of CD8+ T cells in
the tumor microenvironment.97 The ability to analyze immune cell
migration into diseased tissue, which is tightly regulated by the cells'
metabolism, holds great promise to understand immune cell-mediated
processes in the tumor following treatment. In addition to study
tumor immune cells based on mRNA and TCR expression or metabo-
lites, recent technological advances made it possible to generate cell
atlases of human tumors based on the expression of cell surface
markers complemented with single-cell transcriptome sequencing,
exemplified by the analysis of lung ADC.98
Taken together, single-cell immune profiling holds great potential
to refine existing therapies (Figure 1A) and has greatly increased our
understanding how clonal composition of immune cells, both within
the tumor and adjacent tissue, is encoded in the transcriptome and
receptor repertoire (Figure 1B). Single-cell resolution has further
offered insight into intra-tumoral heterogeneity of immune cells and
potential bias in responsiveness to treatment, how regulation of meta-
bolic pathways underlies immune cell function, and how these path-
ways may be exploited to device novel therapeutic strategies
enhancing the overall immune cell response. Given the dramatic
impact of ICB in cancer treatment during recent years and the realiza-
tion that the immune system plays a critical role in cancer develop-
ment and progression, single-cell immune profiling is most likely to
become one of the first strategies reaching clinical diagnostics.
4 | EPIGENETIC ANALYSES OF CANCER ATSINGLE-CELL RESOLUTION
Besides immune infiltration, transcriptomic and genomic alterations,
epigenetic changes underlie cancer development and evolution, but
10
also disease prognosis and treatment outcome.99,100 Epigenetics con-
stitute inheritable cellular regulation of gene expression, which occur
independently of the genetic information. Chromatin status, accessi-
bility and conformation are highly regulated by histone and genome
modifications, and by interactions between DNA and protein struc-
tures. DNA methylation and histone acetylation have been the subject
to intensive research. Hypermethylation of promoter regions, a gen-
eral reduction in genomic 5-methylcytosine levels as well as the loss
of histone acetylation are commonly observed in cancer cells101,102
and ultimately contribute to altered gene expression regulation. In
contrast to genomic mutations and aberrations, epigenetic marks and
their deregulation are often reversible.
To date, several DNA methyltransferase inhibitors (DMTIs)
and histone deacetylase inhibitors have been investigated as anti-
cancer drugs and are approved by the FDA for several cancers.103
First trials with DMTIs yielded promising treatment results, but they
also evoked severe side effects.104,105 Lower treatment dosages
of DMTIs were similarly successful, but no major demethylation
effect was observed in bulk sequencing experiments in contrast
to higher treatment concentrations.106,107 Analysis of monoclonal
populations of the human colon carcinoma cell line HCT116 showed
that every clone has a distinct partial demethylation pattern and
that the resulting changes in epigenetic regulation are sufficient to
slow cancer cell proliferation.107 This monoclonal analysis exempli-
fied the necessity for single-cell resolution in cancer epigenetics
in order to unravel cellular heterogeneity, to device novel therapies
and to monitor treatment. Today, several single-cell methods for
DNA methylation and chromatin accessibility are available to
study cancer (scATAC-seq, sciATAC-seq, scRRBS-seq, scChip-seq,
scTrio-seq).108-112
Single-cell reduced-representation bisulfite sequencing (scRRBS-
seq) was used to trace cancer evolution by measuring alterations in
the methylome in both healthy individuals and patients with chronic
lymphocytic leukemia (CLL) before and after treatment.113 Overall,
this study revealed impaired B cell development in diseased individ-
uals and increased cell-to-cell heterogeneity of B cells in CLL as
opposed to healthy controls and normal B cells.113,114
The application of single-cell assay for transposase-accessible
chromatin sequencing (scATAC-seq) showed that breast cancer cell
lines clustered separately before and after JQ1-treatment based on
their epigenetic state.115 Furthermore, scATAC-seq identified a sub-
population of a PD-1 immunotherapy responsive T cell population
and its underlying regulatory mechanism in basal cell carcinoma,116
and has pinpointed distinct transcription factor motifs which drive
cancer heterogeneity in leukemic cells.117
Unlike scATAC-seq, single-cell chromatin immunoprecipitation
(scChip-seq) also captures repressed regions of the chromatin in addi-
tion to accessible sites.110 Using this approach, a recent study con-
cluded that tumor cells resistant to the cytostatic drug Capecitabine
can be discriminated from non-resistant tumor cells based on their
chromatin status in a triple-negative breast cancer model, and that
distinct repressed H3K27me3 regions were associated with genes
responsible for therapy resistance.118
Besides monomodal single-cell approaches, multimodal methods
offer the possibility to assign an epigenome to a transcriptome,
genome, or proteome revealing the regulatory correlations between
them. Several scATAC-seq and single-cell bisulfite sequencing proto-
cols provided enough genome coverage to analyze CNVs.112,116 One
of the earliest single-cell study in cancer epigenetics utilized bisulfite
sequencing, CNV and transcriptome analysis (scTrio-seq) to investi-
gate hepatocellular carcinoma (HCC).112 The authors found that the
event of a CNV did not alter the methylation pattern of the affected
DNA region and that aberrantly methylated regions did not overlap
with the presence of CNVs, but that both influenced transcriptional
levels. These results additionally confirmed that DNA methylation in
promoter regions correlates negatively with gene expression, whereas
DNA methylation in the gene body correlates positively with tran-
scription as demonstrated in HepG2 and HCC cells. However, only
26 single HCC cells from one patient were investigated, thus limiting
the general conclusions possible to be drawn for HCC from this
study.112
ScRRBS-seq and Smart-seq2 data were obtained from the same
cell by separating mRNA and DNA, revealing an Ibrutinib sensitive B
cell subpopulation in CLL patients, which is expelled from the lymph
node upon treatment.113
Combining CITE-seq, Smart-seq2, and scATAC-seq to investi-
gate mixed-phenotype acute leukemia (MPAL) revealed that ana-
lyses based on either surface-protein expression, chromatin
accessibility or mRNA expression yielded reproducible and compa-
rable cell clusters.108 While MPAL is a rare disease displaying char-
acteristics of both AML and acute lymphoblastic leukemia (ALL),
MPAL patients are more responsive to ALL treatment compared to
AML therapies.119 Single-cell ATAC-seq and Smart-seq2 data pro-
vided the necessary resolution to show that distinct genes are uni-
versally upregulated in either MPAL or AML cancer cells,108
possibly explaining why AML treatments often fail in MPAL
patients. In addition, RUNX1 was associated with transcription fac-
tor binding motifs in MPAL cancer cells.108 Using single-cell combi-
natorial indexing ATAC-seq (sciATAC-seq), the potential regulatory
role of RUNX transcription factor motifs was investigated in a
murine lung ADC model, revealing that accessible RUNX transcrip-
tion factor motifs were mainly present during the metastatic stage.
Additionally, transcription factor scores were matched with differ-
ent tumor stages, as well as RUNX and NKX2.1 transcription factors,
which correlated with patient prognosis.109 Interestingly, while the
transcription factor NKX2.1 is used as a diagnostic marker in clinical
lung ADC,120 the metastatic sciATAC-seq cluster correlated better
with overall patient survival than the NKX2.1 cluster,109 suggesting
that the accessible chromatin status could be used as an improved
diagnostic marker.
Besides genomic DNA, mitochondrial DNA (mtDNA) is subjected
to epigenetic alterations, SNVs and CNVs, which play a role in tumori-
genesis, cancer progression and drug resistance.121 Modification of a
droplet-based scATAC-seq protocol facilitated capturing of mtDNA
(scmtATAC-seq) and demonstrated that a 50x coverage of the mito-
chondria genome can yield robust CNV and even SNV data in addition
11
to accessible chromatin information.122 This revealed mutations and
CNVs related to disease progression and drug resistance in CLL
patients, with individual subpopulations showing impaired methyla-
tion patterns in genes related to drug resistance such as TIAM1 and
ZNF257. Interestingly, the small size of the mitochondrial genome
with only 16 kb in size strongly reduces sequencing costs, potentially
facilitating broader application areas.
At present, published single-cell studies in the field of cancer epi-
genetics have demonstrated that available methods and protocols are
sufficient to distinguish between healthy and diseased cell types, and
to enlighten cancer heterogeneity, progression, and treatment effects.
Identified subpopulations, transcription factor motifs, and regulatory
mechanism could potentially predict patient outcome and drug resis-
tance suggesting sufficient analytical and potentially even clinical
validity. However, as this is a relatively young field, modalities need
further refinement to accomplish analytical validity. ScRRBS-seq
covers less CG islands than bulk bisulfite sequencing110 and in com-
parison with single-cell bisulfite sequencing methods, scChip-seq has
an overall lower genome coverage and a higher ratio of background
noise.123
Some methods, like scTrio-seq, offer a lower throughput
impeding the possibility to access cancer heterogeneity in its
entirety. In the recently developed method Cleavage Under Targets
and Tagmentation (Cut&Tag), antibodies target defined histone
modifications and conjugated Tn5 cuts accessible DNA, which
reduces unspecific signals. Overall, analytical validity of novel
methods such as Cut&Tag124 remains to be demonstrated in cancer
research.
Finally, integration of epigenetic modifications with other modali-
ties such as mRNA or cell surface protein expression will be of impor-
tance to gain more complete insight on how the disease is manifested
and regulated, as well as to explain the effect of cancer-induced epi-
genetic changes.
5 | ASSESSMENT OF CLONALHETEROGENEITY IN CANCER BYSINGLE-CELL DNA-SEQUENCING
Continuous gain of genetic variation in individual cells underlie tumor
initiation, maintenance and evolution. In particular, ongoing cell divi-
sion within tumor tissue fosters genetic mosaicism manifested in
CNVs, SNVs and gene breakpoints.1 While bulk DNA-sequencing has
demonstrated substantial genetic heterogeneity in cancers, such as
AML125 or primary renal carcinomas,126 determination of clonal struc-
ture of cancer types necessitates single-cell resolution.
Among the first methods to be used to interrogate clonal diversity
at single-cell resolution were PCR-based methods such as degenerate
oligonucleotide primed PCR (DOP-PCR),127 isothermal multiple dis-
placement amplification (MDA)128-130 as well as PicoPlex131 and mul-
tiple annealing and looping-based amplification cycles.132 Increased
cellular throughput was achieved by employing microfluidic devices130
and single-cell combinatorial indexed sequencing (sci-seq),133 with
microfluidics enabling stringent quality control via cell imaging, while
simultaneously reducing contaminating ambient DNA interfering with
genomic analyses.
Further optimization in part addressed the shortcomings of exis-
ting approaches with regard to low genomic coverage and allelic drop-
out rates, lack of uniformity, and polymerase-induced errors.134 As
such, recent methods have utilized DNA transposition in combination
with linear amplification135 or direct construction of sequencing-ready
libraries.136,137
Existing technologies facilitate the investigation of CNVs and
SNVs, however, other structural variations such as translocations and
inversions - relevant measures of disease prognosis - are more chal-
lenging to identify at single-cell resolution. Strand-seq enables the
generation of directional sequencing libraries and strand-specific
sequencing reads, yielding homolog resolution in single cells.138 This
was recently utilized to investigate evolutionary differences between
human and macaque based on genetic inversions139 and to develop
the analytical tool single-cell tri-channel processing (scTRIP)140
extracting and utilizing additional information from Strand-seq data.
While this approach enables for more comprehensive analysis of
genomic complexity, it relies on the possibility to label nascent DNA
during replication, which excludes its application to clinical samples
containing non-dividing cells or nuclei.
Single-cell DNA-sequencing has been used intensively to deci-
pher clonal structures in different cancer types and to augment our
knowledge on tumor clonal evolution. An early study applied DOP-
PCR on 100 single nuclei isolated from two human breast cancer
cases and demonstrated that clonal evolution patterns can be inferred
from shallow single-cell WGS.127 While this study did not provide suf-
ficient coverage to resolve SNVs in a genome-wide manner, subse-
quent utilization of G2/M nuclei yielded comparably higher genome
coverage and improved both allelic dropout and false positive rate in
breast cancer samples.141 In this study, the authors indicated that
structural genomic alterations occur early during breast cancer evolu-
tion, while SNVs are acquired progressively and gradually contribute
to clonal diversity.141 The finding, that the majority of single-cell
CNVs were clonal and stable during tumor growth of breast
cancer,142 additionally strengthened the notion that copy number
aneuploidy is acquired early during tumor evolution. Single-cell analy-
sis of breast cancer xenografts moreover corroborated that clonal
expansion dynamics represent reproducible trajectories, indicating
that clonal selection follows a non-random process with distinct muta-
tion genotypes defining clonal fitness and therefore clonal expansion
processes.143
In longitudinal breast cancer samples, bulk exome sequencing
integrated with single-cell DNA and RNA analyses provided insight
into clonal extinction in response to treatment and identified resistant
clones selectively expanded as a result to chemotherapy.144 Single-
cell analysis furthermore enabled the identification of patient-
individual clonal seeding patterns in colorectal cancer leading to the
metastatic tumor.145
Highly relevant with regard to clinical application was the dis-
covery that a large fraction of both trunk and metastatic mutations
12
could be recapitulated in CTCs from PC146 and that CNV pattern
on a whole-genome scale of CTCs was not altered during the treat-
ment course of lung cancer.147 Furthermore, CNVs detected in
CTCs of ADC and small-cell lung cancer (SCLC) were reproducible
between cells and individuals.147 In line with this, copy number
aberrations in CTCs of SCLC were used to determine classifiers
supporting categorization of chemosensitive or chemorefractory
SCLCs.148 Single-cell WGS of 88 CTCs generated classifiers with
sufficient power to assign the vast majority (>80%) of CTC test
samples to either a chemosensitive or chemorefractory treatment
response.148 This suggests an exciting possibility for single-cell
analysis to provide analytical validity for future diagnostic purposes
similar to single-cell transcriptome studies targeting CTCs,60,61
especially in the absence of primary tumor tissue. However, in
order to reach closer to clinical validity and utility, the persistence
of CNV patterns in lung cancer CTCs needs to be corroborated in
larger patient cohorts. In addition, molecular classifiers capable of
predicting treatment response of SCLCs will require a larger
starting number of cells covering a more complete space of geno-
mic alterations.
Single-cell sequencing of hematologic malignancies such as AML
gained insight into the clonal architecture underlying this heteroge-
nous disease entity, although in limited sample numbers.131 In con-
trast, droplet-based cell capturing and barcoding opened up for the
possibility to profile known genomic loci in AML at unprecedented
throughput.149,150 More recently, a similar approach leveraged analy-
sis of 735 483 single-cells obtained from 123 AML patients, unveiling
clonal evolution patterns and correlation of AML driver mutations.151
In total, a selection of 530 validated mutations were included in the
analysis, which in the case of a subset of longitudinal AML samples,
provided additional insight into the clonal evolution processes during
treatment.151 Furthermore, a very recent study utilized droplet-based,
targeted single-cell DNA-sequencing in AML on a large cohort of sam-
ples, providing insight into clonal complexity and co-occurring muta-
tions in epigenetic modifiers in AML along with changes in cell surface
protein expression underlying the pathogenesis of clonal
hematopoiesis.152
Integration of bulk exome and whole-genome sequencing on
51 cases of childhood ALL identified aberrant RAG recombinase activ-
ity as critical driving force for genomic aberrations underlying leuke-
mic transformation.153 Targeted genotyping of mutations and
structural variants derived from bulk exome sequencing allowed the
construction of phylogenetic trees. This confirmed that the fusion
gene ETV6-RUNX1, which is considered one of the initiating genomic
lesions in this form of ALL, was found in the root of both trees.153
Indication for RAG-mediated deletions in cells spanning the entire
phylogenetic tree further suggested that the genomic aberrations
observed were formed through a continuous process in these two
cases.153 Shortcomings of this study comprised the limited number of
single-cells processed; a relatively small number of genomic lesions
were analyzed and the dropout rates of mutant alleles were not thor-
oughly assessed. In contrast, microfluidic MDA targeted genome
sequencing of six patients of ALL provided higher cellular throughput
(1479 single-cells) and combined different computational approaches
for the identification of clonal structures and the removal of low qual-
ity cells due to WGA-induced noise.154 This allowed the authors to
identify clones co-occurring in most patients and to suggest a more
precise hierarchical clonal structure for ALL where the majority of
structural aberrations preceded point mutation acquisition and VDJ
recombination.154
The literature summarized above clearly demonstrates that
single-cell DNA-sequencing is capable to provide analytical validity,
for example, in elucidating tumor heterogeneity, and to monitor
clonal evolution in response to treatment (Figure 1A,C,D), features
of importance in personalized medicine. Particularly, in cases with a
high prevalence of genomic lesions specific for a given cancer type,
targeted genomic approaches hold great potential to become rou-
tine diagnostic application in the near future. Finally, it will be of
essence to understand how different clones and their respective
expansion patterns influence tumor evolution and treatment
response.
6 | SPATIAL RESOLUTION TO AID CANCERTISSUE ANALYSES AND DIAGNOSTICS
In order to truly understand tumor behavior, particularly in solid can-
cers, both disease-related transcriptional and genomic alterations
need to be related to the cells' phenotypes in the spatial context of
the tumor microenvironment. Retaining information of type, density
and location of immune cells in colorectal cancer tissue demonstrated
an association of spatial immune cell composition with clinical out-
come.80 It was suggested that such immunological criteria could be
relevant for a clinical application in cancers where the density of
tumor-infiltrating T cells is linked to favorable prognosis. Current tech-
nologies for massively parallel processing of mRNA or genomic alter-
ations lack spatial resolution as a consequence of tissue dissociation,
which in addition has been shown to potentially induce misleading
transcriptional signatures.155
Different approaches have evolved to profile mRNA or protein
expression with spatial resolution while either preserving the tissue
structure156-159 or destructing it by usage of molecular tags providing
spatial information,160 imaging mass cytometry (IMC),161 or laser cata-
pulting.162,163 Co-detection by indexing (CODEX) allows for highly
multiplexed profiling of protein markers and has been used to deci-
pher differences in tissue composition in murine normal and diseased
spleen at single-cell resolution.159 Its applicability to clinical human
samples, however, still needs to be shown in large-scale studies.
Moreover, multiplex immunohistochemistry has enabled parallel visu-
alization of distinct immune checkpoint molecules at single-cell
resolution.164
The GeoMx/DSP platform has been applied to identify protein
markers associated with treatment outcome in melanoma,156 to evalu-
ate the PC micro-environment,158 and to assess B and T cell pheno-
types in melanoma tumors.165 Furthermore, this platform has been
used to study B cell localization in tertiary lymphoid structures using
13
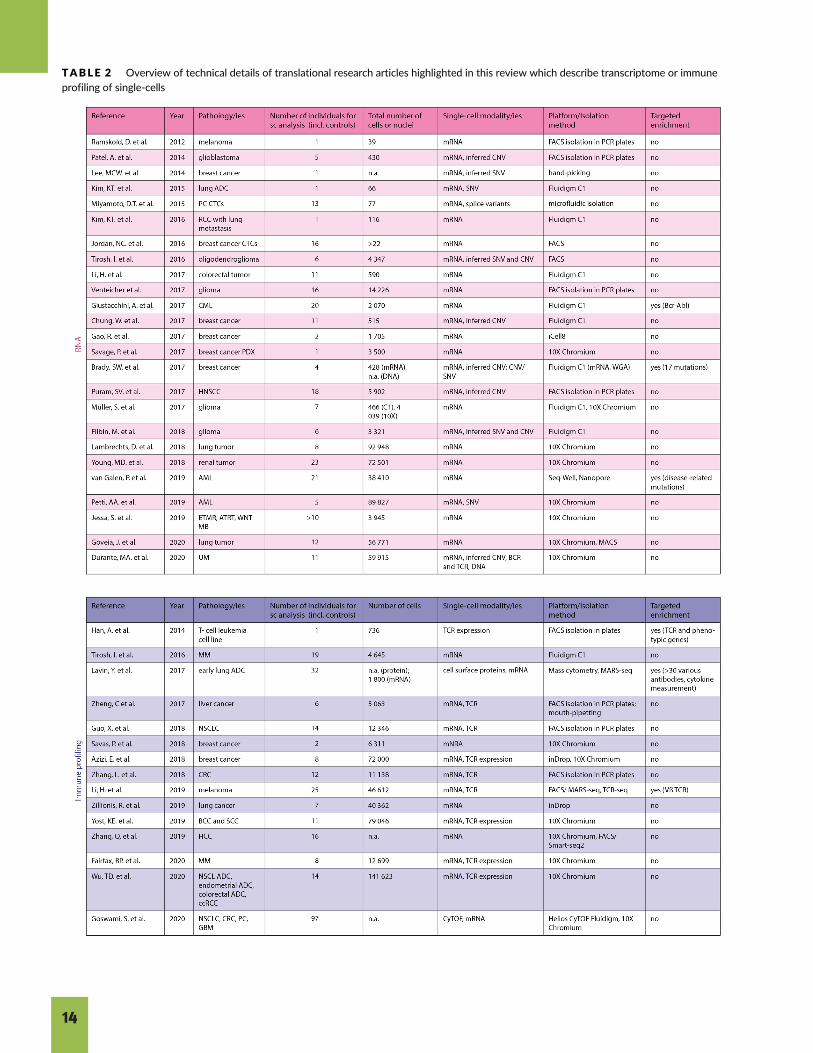
TABLE 2 Overview of technical details of translational research articles highlighted in this review which describe transcriptome or immuneprofiling of single-cells
14
multiplex protein analysis,166 and to profile mRNA and protein simul-
taneously in colorectal tumor tissue.167 While this approach allows for
combined multiplex mRNA and protein analysis, the GeoMx/DSP plat-
form lacks single-cell resolution and requires a priori knowledge of
target protein markers or mRNAs together with reliable markers to
visualize tissue structure. Interestingly, GeoMx-based analysis of B
cells was complemented by technologies assessing mRNA and surface
proteins at single-cell resolution.166
In contrast, high-definition spatial transcriptomics (HDST) enables
unbiased mRNA profiling with 49% of the spatial barcodes being
assigned to a single-cell type and was successfully used to distinguish
cell types in breast cancer,160 while offering greater spatial resolution
compared to similar approaches.168,169 Combining spatial trans-
criptomics with conventional high throughput single-cell sequencing
enabled more refined spatial cell type annotations in pancreatic ductal
ADC.170 Despite these promises in spatial transcriptomics, future
developments need to improve the current sparsity of HDST and to
demonstrate compatibility of this method with Formalin-Fixed
Paraffin-Embedded (FFPE) sections, which represent the dominant
form in which solid tumor specimen are preserved to date. Interest-
ingly, the commercially available Visium chemistry (10X Genomics)
has recently been applied successfully to FFPE sections of the mouse
brain and ovarian carcinosarcoma as exemplified by a study currently
available as a preprint,171 opening up for the possibility to perform
spatial transcriptome analysis on clinical FFPE samples.
Alternatively, highly specific in-situ hybridization (RNAscope)
enables detection of mRNA molecules in FFPE tissue157 and was used
successfully for automated, quantitative profiling of HER2 status in
breast carcinoma.172 While providing cellular and subcellular resolu-
tion, a priori knowledge of targets is necessary and highly multiplexed
tissue analysis is currently not possible. However, a higher degree of
multiplexed targeted gene mRNA detection in breast cancer has been
achieved using padlock sequencing.173 Expansion of RNAscope by the
usage of oligonucleotides conjugated to metal-chelated reporters to
bind RNA-probes during the final hybridization step facilitates simul-
taneous labeling of protein structures using metal-conjugated anti-
bodies. This in turn enables simultaneous profiling of mRNA and
proteins from the same section using IMC and was shown to success-
fully correlate with mRNA and protein expression levels in a large
cohort of samples providing architectural maps of breast cancer tissue
at spatial single-cell resolution.161
In addition to spatially resolved mRNA and protein expression,
recent technological advances linked the genomic profile of a single-
cell to its position in a given tissue.162,163 Similar to both approaches
is that the tumor tissue is subjected to hematoxylin & eosin (H&E)
staining to visualize structural elements, followed by subsequent isola-
tion of single-cells using UV laser162 or isolation of groups of cells
down to single-cells using single infra-red (IR) pulses.163 This made it
possible to spatially resolve genomic aberrations occurring during an
early stage tumor such as ductal breast carcinoma,162 and holds great
potential to increase our understanding of how tumor infiltration and
invasion processes occur at the single-cell level in the context of the
tumor microenvironment.
Taken together, a broad variety of technologies allowing single-
cell readouts in a spatial context are available, which have offered
highly relevant insights by integrating different modalities, such as
mRNA and protein expression or genomic aberrations within the
tissue context. These approaches differ in their capacity of cellular
throughput, compatibility with clinical samples, single-cell resolu-
tion, preservation of tissue integrity for downstream analyses, the
degree of multiplexed detection, and the necessity of a priori
knowledge on tissue-specific targets. Therefore, selection of a
methodology for spatial tissue analysis often necessitates a
compromise with regard to several aspects. For example, FFPE-
compatible mRNA analysis at single-cell analysis requires a trade-
off in the number of transcripts, which can be processed at the
same time.
Overall, spatial tissue analysis at single-cell resolution still needs
to overcome several limitations in order to become a widely used clin-
ical diagnostic technology but given the rapid development and dem-
onstrated high promise of this technology it is likely that we will
witness significant advancement toward clinical applicability in the
near future.
7 | CHALLENGES FOR CLINICALTRANSLATION OF SINGLE-CELLSEQUENCING
As described in previous sections, not only rapid technological pro-
gress but also the potential of analyzing tumor tissue routinely at
single-cell resolution has now become feasible in a research setting.
Single-cell analyses in cancer has opened up for the possibility to
putatively aid diagnostics,148,172 to monitor treatment
response72,76,85,87,149 or to refine treatment processes59-61,72 toward
personalized therapies and has thus spurred great interest to translate
such technologies into routine clinical applications.
Single-cell analyses regardless of modality or spatial resolution,
currently requires cost intensive, large-scale sequencing reactions in
order to process a clinically informative cohort of patient samples and
Abbreviations: ADC, lung adenocarcinoma; AML, acute myeloid leukemia; ATRT, atypical teratoid/rhabdoid tumors; BCC, basal cell carcinoma; BCR, B cell
receptor; ccRCC, clear cell renal carcinoma; CML, chronic myeloid leukemia; CNV, copy number variation; CRC, colorectal cancer; CTC, circulating tumor
cells; CyTOF, cytometry by time of flight; ETMR, embryonal tumors with multilayered rosettes; FACS, fluorescence-activated cell sorting; GBM,
glioblastoma multiforme; HCC, hepatocellular carcinoma; HNSCC, head and neck squamous cacrinoma; MACS, magnetic-activated cell sorting; MARS-seq,
massively parallel RNA single-cell sequencing; MM, metastatic melanoma; NSCLC, non-small cell lung cancer; NSCL ADC, non-small-cell lung
adenocarcinoma; PC, prostate cancer; PDX, patient-derived xenograft; RCC, renal cell carcinoma; SCC, squamous cell carcinoma; SNV, single-nucleotide
variant; TCR, T cell receptor; TCR-seq, T cell receptor sequencing; UM, uveal melanoma; WGA, Whole-genome amplification; WNT MB, WNT-subtype
medulloblastoma.
15
to extract sufficient numbers of single-cells to guarantee statistically
valid analyses to infer reliable diagnostic information. Novel strategies
for multiplexing single-cell transcriptomes50,51 or single-cell
genomes133 have greatly increased the possible cellular throughput
per sample. However, in particular WES and WGS of single-cells for
de novo SNV calling necessitate high sequencing depths, rendering
these approaches currently economically challenging for large-scale
studies. Additionally, increasing single-cell throughput together with
multiomic readouts and higher-dimensional data require sophisticated
expertise for data analysis in addition to large computational infra-
structure. Approaches of combined low and high coverage
analyses,130,141,147 targeted qPCR-based analyses153,174 and more
recently microfluidic droplet-based analysis149,175 present more cost
effective alternatives to assess genomic aberration in cancer.
Alternatively, inference of genomic alterations from less cost
intensive mRNA-sequencing strategies may provide an attractive
strategy to facilitate introduction of single-cell sequencing in a clinical
diagnostic setting.35,37,38,71,73,74,76 However, such approaches provide
only indirect genomic information, which is furthermore limited due
to the necessity that a genomic lesion needs to be manifested on the
mRNA level which on top of that can be captured by the chosen
single-cell chemistry. Also, most solid tumor samples are stored as
FFPE tissue blocks which often yield low quality mRNA thus render-
ing single-cell transcriptomics challenging.
While Smart-seq2-based full-length mRNA-sequencing at single-
cell resolution generates more transcriptional information which can
be used to infer genomic aberrations, its analysis cost per cell on
sorted plates amounts to approximately 30 USD as opposed to 4 USD
on commercial platforms such as the iCell8cx. In contrast, droplet-
based mRNA-sequencing on the 10X Chromium provides a more cost
effective alternative and processing cost of 0.5USD per cell. For fur-
ther comparison of different platforms, methodologies, cohort size in
selected reference literature see Tables 2 and 3.
Initially, single-cell studies focused on manual isolation of indi-
vidual cells,128,129 an approach that does not meet the required cellu-
lar throughput for clinical applications. Technological advancements
such as the use of microwells43,49 and nanodroplets44-46 have greatly
increased the cellular throughput, however, such methods require
rather large amounts of starting cell numbers and provide compara-
bly low capturing rates,45,46 thereby rendering these technologies
less favorable in a clinical setting when sample size may be small and
limiting. The necessity to enrich for distinct cell populations via anti-
body staining and flow cytometry provides another example of sam-
ple loss, which becomes particularly unfavorable when analyzing
low input samples and rare cell types such as CTCs.60,61,146-148 In
order to generate clinically valuable results, capturing of extremely
rare clones in a tumor sample must be guaranteed which in turn
requires processing of patient-derived samples in their entirety
agnostic of sample size. Platforms to isolate scarce clinical samples
for high throughput analysis, for example, the sciFLEXARRAYER S3
or cellenONE systems, are becoming available and have recently
been used successfully for low-coverage CNV profiling of human
breast cancer samples.137
Another important obstacle in order to achieve clinical translation
of single-cell technologies is sample comparability with regards to sam-
ple isolation, molecular characterization and downstream computational
analyses. It is known, that cell dissociation strategies can alter transcrip-
tional signatures155 and that cell isolation needs to be evaluated care-
fully prior to starting an experiment.176 Furthermore, it has been shown
that gene expression patterns are induced which are distinct for
biopsy- and autopsy-derived brain samples177 and which biases down-
stream analyses. Thus, the effect of sample isolation, storage and sam-
ple type on the modality analyzed (mRNA, DNA, protein) needs to be
systematically assessed in order to define common classifiers to facili-
tate comparability of results between different research centers and
across a large space of clinical samples. Integration of heterogeneous
data sets obtained at different research centers using different method-
ologies will require advanced batch correction24 and computational
tools to combine these data sets in a meaningful way while minimizing
overcorrection and maintaining relevant biological differences.178
Extensive benchmarking of single-cell technologies179 together
with interrogation of sampling artefacts180 are pivotal in order to
achieve overall comparability of test results. A recent study has carried
out a systematic comparison of different cell and nuclei isolation strate-
gies on a diverse range of clinical cancer samples. Testing several isola-
tion protocols per sample type, the authors based their evaluation
among other metrics on the cellular diversity a given protocol would
reproduce. Taken together, this study provides an extensive resource
suggesting highly specified isolation protocols for various cancer tissues
with the overarching goal to provide standardizable, robust and compa-
rable single-cell workflows for the use in a clinical setting.181
The results of an interrogation of clinical samples by single-cell
analysis may vary depending on the platform used. It is therefore cru-
cial to systematically assess existing platforms for single-cell genome
and spatial tissue analysis, similarly to single-cell transcriptome
chemistries,54,55 to determine most suitable applications and experi-
mental conditions for defined clinical questions.
With regards to mRNA analysis, definition of a statistically critical
number of cells for computational analyses, optimal sequencing depth in
addition to the minimum number of cells necessary to define a cell type
or state, among others, will be crucial for improved comparability. In order
to provide sequencing data, which allow for comparable mutation analysis
and variant calling, a unified way to define clonal structures will need to
be established.134 Novel computational tools are required to manage data
analysis in increasingly large data sets, as has been demonstrated previ-
ously.52,178 Computational challenges associated with the analysis of can-
cer samples by single-cell transcriptomics are reviewed elsewhere.26 In
addition, analysis of longitudinal clinical samples is likely to provide insight
into disease progression and treatment response.175 In order to relate lon-
gitudinal samples, existing trajectory inference methods182,183 need to be
developed further to integrate different modalities of the same sample
along a pseudo-time axis, to resolve multiple clonal subtypes and to per-
form high-dimensional comparative analyses against large patient cohorts
while maintaining the longitudinal order of cell states and clones.
Moreover, to reach clinical validity, existing single-cell methodolo-
gies need to possess optimal detection sensitivity and specificity. The
16
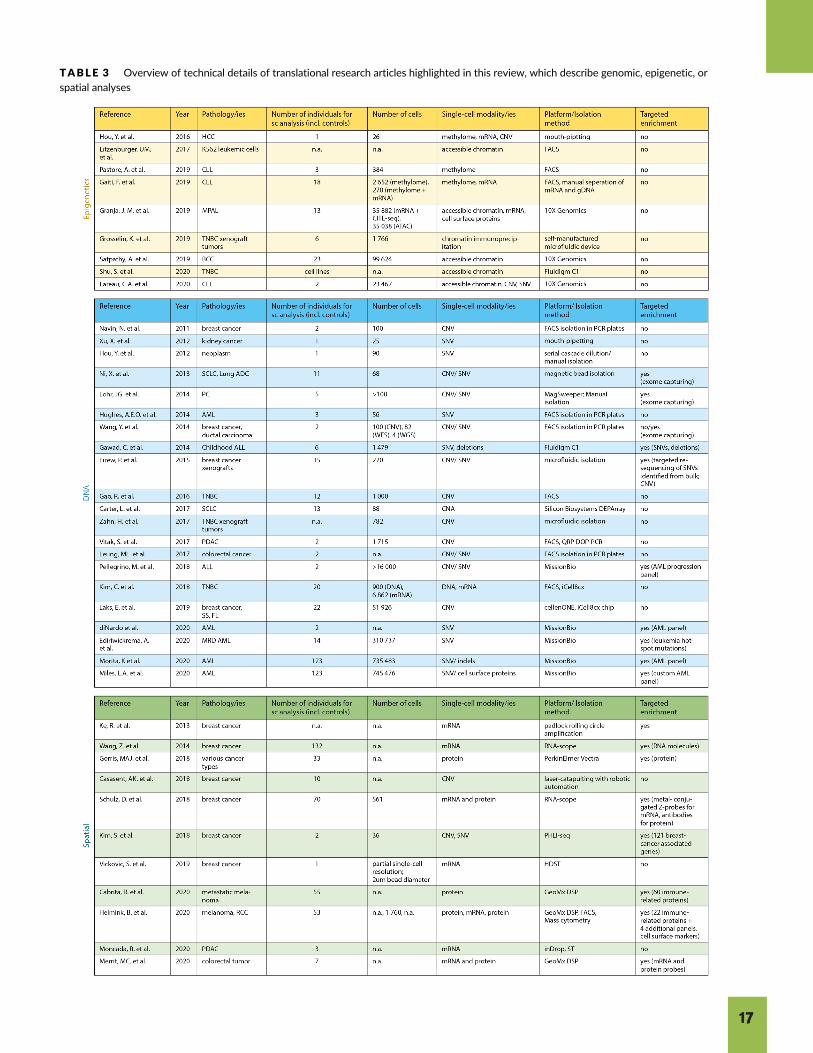
TABLE 3 Overview of technical details of translational research articles highlighted in this review, which describe genomic, epigenetic, orspatial analyses
17
Abbreviations: ADC, adenocarcinoma; AML, acute myeloid leukemia; ALL, acute lymphoblastic leukaemia; ATAC, assay for transposase-accessible
chromatin; BCC, basal cell carcinoma; CITEseq, cellular indexing of transcriptomes and epitopes by sequencing; CLL, chronic lymphocytic leukemia; CNA,
copy number alteration; CNV, copy number variation; DSP, digital spatial profiler; FACS, fluorescence-activated cell sorting; FL, follicular lymphoma; HDST,
high density spatial transcriptomics; HCC, hepatocellular carcinoma; MPAL, mixed-phenotype acute leukemia; MRD AML, minimal residual disease acute
myeloid leukemia; PC, protstate cancer; PDAC, pancreatic ductal adenocarcinoma; PHLI-seq, phenotype-based high-throughput laser-aided isolation and
sequencing; QRP DOP-PCR, quasi-random priming degenerate oligonucleotide primed polymerase chain reaction; RCC, renal cell carcinoma; SNV, single-
nucleotide variant; SCLC, small cell lung cancer; SS, synovial sacroma; ST, spatial transcriptomics; TNBC, triple-negative breast cancer; WES, whole-exome
sequencing; WGS, whole-genome sequencing.
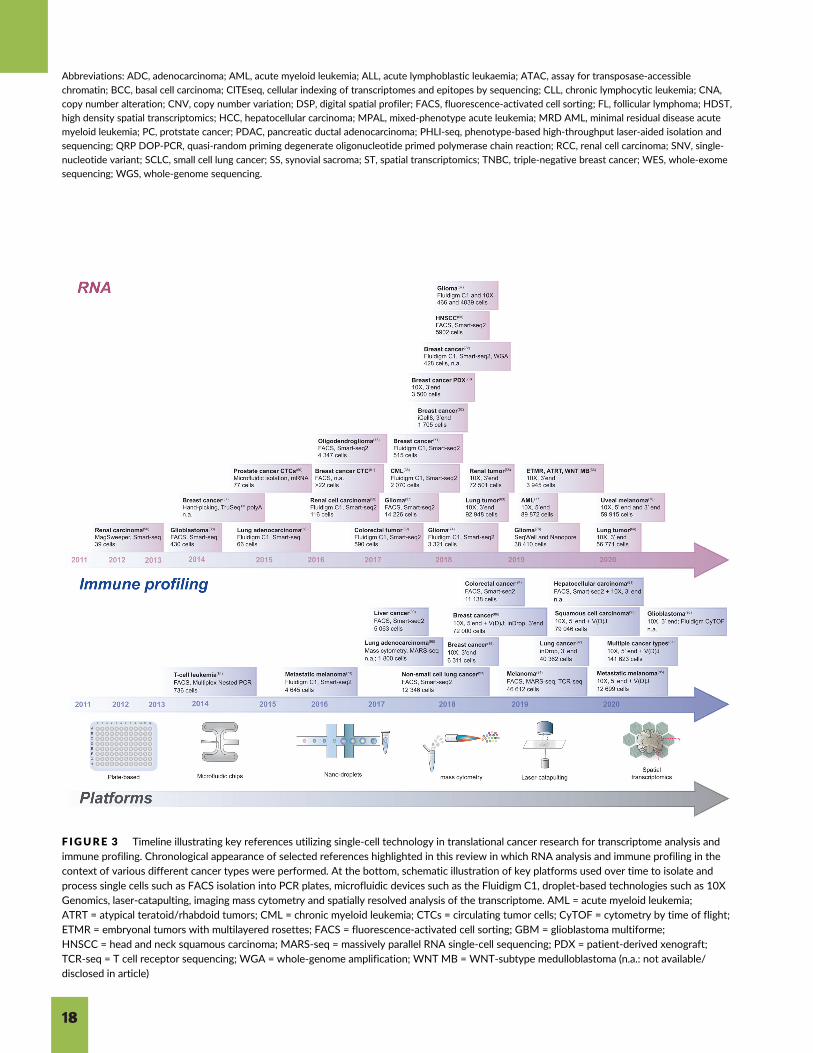
F IGURE 3 Timeline illustrating key references utilizing single-cell technology in translational cancer research for transcriptome analysis andimmune profiling. Chronological appearance of selected references highlighted in this review in which RNA analysis and immune profiling in thecontext of various different cancer types were performed. At the bottom, schematic illustration of key platforms used over time to isolate and
process single cells such as FACS isolation into PCR plates, microfluidic devices such as the Fluidigm C1, droplet-based technologies such as 10XGenomics, laser-catapulting, imaging mass cytometry and spatially resolved analysis of the transcriptome. AML = acute myeloid leukemia;ATRT = atypical teratoid/rhabdoid tumors; CML = chronic myeloid leukemia; CTCs = circulating tumor cells; CyTOF = cytometry by time of flight;ETMR = embryonal tumors with multilayered rosettes; FACS = fluorescence-activated cell sorting; GBM = glioblastoma multiforme;HNSCC = head and neck squamous carcinoma; MARS-seq = massively parallel RNA single-cell sequencing; PDX = patient-derived xenograft;TCR-seq = T cell receptor sequencing; WGA = whole-genome amplification; WNT MB = WNT-subtype medulloblastoma (n.a.: not available/disclosed in article)
18
minute starting amounts of mRNA or DNA in single-cells often require
extensive amplification prior to sequencing which introduces technical
noise such as allelic dropouts or polymerase-induced errors,134 as well
as dropout events resulting from transcripts which were not captured
during reverse transcription.184 Such noise impairs overall detection
confidence. Both continuous improvement of sample preparation and
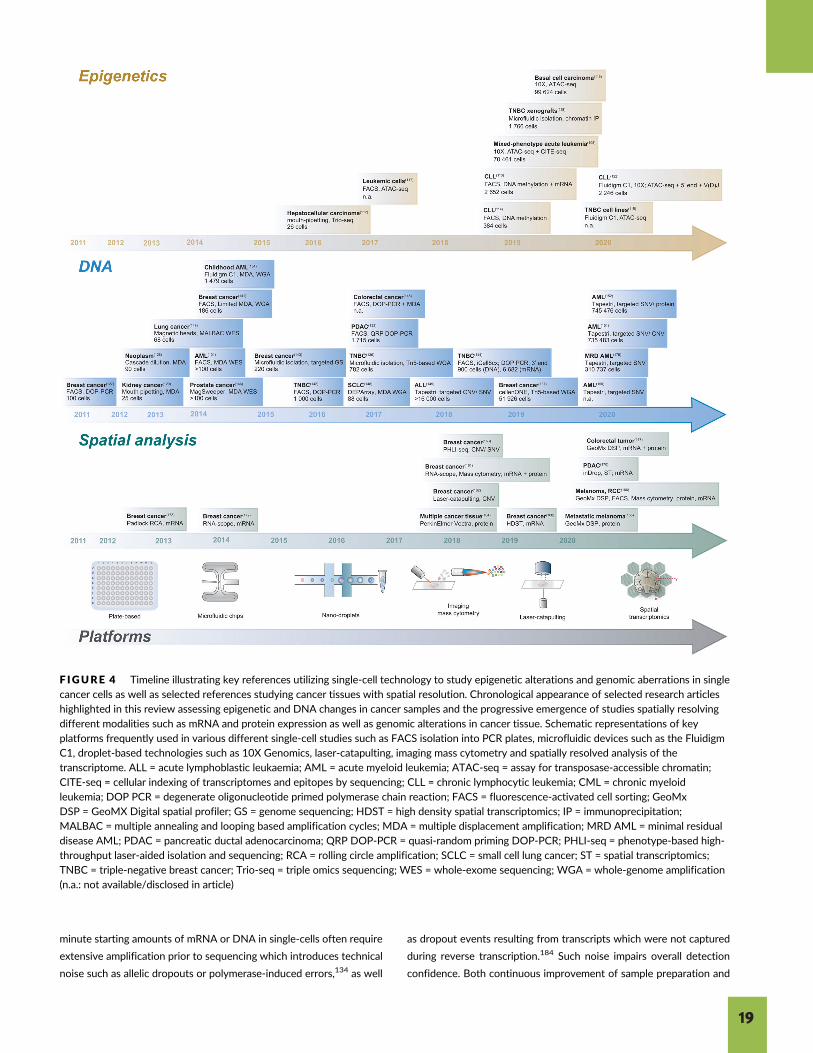
F IGURE 4 Timeline illustrating key references utilizing single-cell technology to study epigenetic alterations and genomic aberrations in singlecancer cells as well as selected references studying cancer tissues with spatial resolution. Chronological appearance of selected research articleshighlighted in this review assessing epigenetic and DNA changes in cancer samples and the progressive emergence of studies spatially resolving
different modalities such as mRNA and protein expression as well as genomic alterations in cancer tissue. Schematic representations of keyplatforms frequently used in various different single-cell studies such as FACS isolation into PCR plates, microfluidic devices such as the FluidigmC1, droplet-based technologies such as 10X Genomics, laser-catapulting, imaging mass cytometry and spatially resolved analysis of thetranscriptome. ALL = acute lymphoblastic leukaemia; AML = acute myeloid leukemia; ATAC-seq = assay for transposase-accessible chromatin;CITE-seq = cellular indexing of transcriptomes and epitopes by sequencing; CLL = chronic lymphocytic leukemia; CML = chronic myeloidleukemia; DOP PCR = degenerate oligonucleotide primed polymerase chain reaction; FACS = fluorescence-activated cell sorting; GeoMxDSP = GeoMX Digital spatial profiler; GS = genome sequencing; HDST = high density spatial transcriptomics; IP = immunoprecipitation;MALBAC = multiple annealing and looping based amplification cycles; MDA = multiple displacement amplification; MRD AML = minimal residualdisease AML; PDAC = pancreatic ductal adenocarcinoma; QRP DOP-PCR = quasi-random priming DOP-PCR; PHLI-seq = phenotype-based high-throughput laser-aided isolation and sequencing; RCA = rolling circle amplification; SCLC = small cell lung cancer; ST = spatial transcriptomics;TNBC = triple-negative breast cancer; Trio-seq = triple omics sequencing; WES = whole-exome sequencing; WGA = whole-genome amplification(n.a.: not available/disclosed in article)
19
computational models are required to correct for such errors for any
platform and chemistry which is intended to be used in a clinical set-
ting, as exemplified here for single-cell mRNA-sequencing.184,185
Advances in this field will facilitate not only the cellular
deconvolution of cancer tissues but also to build cancer-specific clas-
sifiers based on several modalities, thereby refining current cancer
classification and treatment of cancer. Ultimately, single-cell data of
distinct modalities will need to be put into the context of the tumor
tissue, where transcriptomic and genomic signatures are translated
into altered functionality of cells in the diseased state.
8 | CONCLUSIONS
The tremendous technological development in single-cell sequencing of
the past decade has yielded a broad toolbox to study many modalities in
cancer, such as mRNA,37,38,57,59 DNA alterations,141,144,146-149,154,175
immune cell composition of tumors,85-87,90,92,95 chromatin
changes116-118,122 and metabolic effectors97 in dissociated single-cells or
nuclei as well as within the context of diseased tissue156-164,167,172
(Figures 3 and 4). Mono-, bi-, or even-multimodal approaches have
within short time facilitated cancer research at unprecedented depth and
gained invaluable information on tumor composition and classification,
clonal evolution in cancer, disease progression and treatment response.
Nevertheless, many methods fall short in providing information
on tissue context, which can provide further information of prognostic
value.80,186 The achievement of clinical translation of spatially
resolved methodologies depends, among others, on the ability to com-
prehensively analyse high dimensional data comprised of information
on cell type and state, cell boundaries to adjacent cells together with
the cells location within the tissue. This in turn requires the develop-
ment of computational tools which allow for robust identification of
given patterns of cells in a tissue or tissue motifs,187 which then may
enable for in silico construction of tissue network structures and to
ultimately infer pathological processes, necessary to classify patients
and to aid diagnosis.
While current technical limitations prevent broad clinical application
of the aforementioned methodologies, it seems clear that single-cell ana-
lyses will become an integral part in clinical diagnostics, prognostication,
disease follow-up, and treatment selection in the next coming years. This
is strongly emphasized by the large number of studies and their diverse
scope employing transcriptome-sequencing of single cells (Figure 3). In
addition, existing single-cell DNA applications often present sufficient
analytical validity and additional refinement regarding detection sensitivity
and specificity of those methods may ultimately render bulk WGS/WES
obsolete, which are currently often used to either substantiate findings
obtained via single-cell sequencing144 or to nominate genomic lesions for
targeted single-cell analysis.149,154,175 Further, each existing technology
possesses specific opportunities but also technical shortcomings, which
will affect their analytical validity and which will therefore lead to varying
time frames for clinical translation. Nevertheless, the literature highlighted
in this review clearly demonstrates the applicability and usefulness of
single-cell analysis in cancer research and diagnostics.
CONFLICT OF INTEREST
The authors declare no potential conflict of interest.
DATA AVAILABILITY STATEMENT
Data sharing not applicable to this article as no datasets were gener-
ated or analysed during the current study.
ORCID
Ulrich Pfisterer https://orcid.org/0000-0002-4613-6427
REFERENCES
1. Burrell RA, Mcgranahan N, Bartek J, Swanton C. The causes and
consequences of genetic heterogeneity in cancer evolution. Nature.
2013;501:338-345. https://doi.org/10.1038/nature12625.
2. Jones PA, Issa JPJ, Baylin S. Targeting the cancer epigenome for
therapy. Nat Rev Genet. 2016;17:630-641. https://doi.org/10.1038/
nrg.2016.93.
3. Wouters BJ, Delwel R. Epigenetics and approaches to targeted epi-
genetic therapy in acute myeloid leukemia. Blood. 2016;127:42-52.
https://doi.org/10.1182/blood-2015-07-604512.
4. Landau DA, Carter SL, Stojanov P, et al. Evolution and impact of sub-
clonal mutations in chronic lymphocytic leukemia. Cell. 2013;152(4):
714-726. https://doi.org/10.1016/j.cell.2013.01.019.
5. Anderson K, Lutz C, Van Delft FW, et al. Genetic variegation of
clonal architecture and propagating cells in leukaemia. Nature. 2011;
469(7330):356-361. https://doi.org/10.1038/nature09650.
6. Metzker ML. Sequencing technologies the next generation. Nat Rev
Genet. 2010;11(1):31-46. https://doi.org/10.1038/nrg2626.
7. Shendure J, Ji H. Next-generation DNA sequencing. Nat Biotechnol.
2008;26(10):1135-1145. https://doi.org/10.1038/nbt1486.
8. Rozenblatt-Rosen O, Regev A, Oberdoerffer P, et al. The human
tumor atlas network: charting tumor transitions across space and
time at single-cell resolution. Cell. 2020;181(2):236-249. https://doi.
org/10.1016/j.cell.2020.03.053.
9. Ley TJ, Miller C, Ding L, et al. Genomic and epigenomic landscapes
of adult de novo acute myeloid leukemia. N Engl J Med. 2013;368
(22):2059-2074. https://doi.org/10.1056/NEJMoa1301689.
10. Abeshouse A, Adebamowo C, Adebamowo SN, et al. Comprehensive
and integrated genomic characterization of adult soft tissue sarco-
mas. Cell. 2017;171(4):950-965.e28. https://doi.org/10.1016/j.cell.
2017.10.014.
11. Koboldt DC, Fulton RS, McLellan MD, et al. Comprehensive molecu-
lar portraits of human breast tumours. Nature. 2012;490(7418):61-
70. https://doi.org/10.1038/nature11412.
12. Ciriello G, Gatza ML, Beck AH, et al. Comprehensive molecular por-
traits of invasive lobular breast Cancer. Cell. 2015;163(2):506-519.
https://doi.org/10.1016/j.cell.2015.09.033.
13. Tirosh I, Suvà ML. Deciphering human tumor biology by single-cell
expression profiling. Annu Rev Cancer Biol. 2019;3(1):151-166.
https://doi.org/10.1146/annurev-cancerbio-030518-055609.
14. Lawson DA, Kessenbrock K, Davis RT, Pervolarakis N, Werb Z.
Tumour heterogeneity and metastasis at single-cell resolution. Nat
Cell Biol. 2018;20(12):1349-1360. https://doi.org/10.1038/s41556-
018-0236-7.
15. Stuart T, Satija R. Integrative single-cell analysis. Nat Rev Genet.
2019;1:257-272. https://doi.org/10.1038/s41576-019-0093-7.
16. Fuzik J, Zeisel A, Mate Z, et al. Integration of electrophysiological
recordings with single-cell RNA-seq data identifies neuronal subtypes.
Nat Biotechnol. 2016;34:175-183. https://doi.org/10.1038/nbt.3443.
17. Cadwell CR, Palasantza A, Jiang X, et al. Electrophysiological, trans-
criptomic and morphologic profiling of single neurons using patch-seq.
Nat Biotechnol. 2015;34:199-203. https://doi.org/10.1038/nbt.3445.
20

18. Chen S, Lake BB, Zhang K. High-throughput sequencing of the
transcriptome and chromatin accessibility in the same cell. Nat Bio-
technol. 2019;37:1452-1457. https://doi.org/10.1038/s41587-019-
0290-0.
19. Stoeckius M, Hafemeister C, Stephenson W, et al. Simultaneous epi-
tope and transcriptome measurement in single cells. Nat Methods.
2017;14:865-868. https://doi.org/10.1038/nmeth.4380.
20. Peterson VM, Zhang KX, Kumar N, et al. Multiplexed quantification
of proteins and transcripts in single cells. Nat Biotechnol. 2017;35
(10):936-939. https://doi.org/10.1038/nbt.3973.
21. Macaulay IC, Ponting CP, Voet T. Single-cell Multiomics: multiple
measurements from single cells. Trends Genet. 2017;33:155-168.
https://doi.org/10.1016/j.tig.2016.12.003.
22. Macaulay IC, Haerty W, Kumar P, et al. G&T-seq: parallel sequencing
of single-cell genomes and transcriptomes. Nat Methods. 2015;12:
519-522. https://doi.org/10.1038/nmeth.3370.
23. Jaitin DA, Kenigsberg E, Keren-Shaul H, et al. Massively parallel
single-cell RNA-seq for marker-free decomposition of tissues into
cell types. Science. 2014;343:776-779. https://doi.org/10.1126/
science.1247651.
24. Luecken MD, Theis FJ. Current best practices in single-cell RNA-seq
analysis: a tutorial. Mol Syst Biol. 2019;15(6):e8746. https://doi.org/
10.15252/msb.20188746.
25. La Manno G, Soldatov R, Zeisel A, et al. RNA velocity of single cells.
Nature. 2018;560(7719):494-498. https://doi.org/10.1038/s41586-
018-0414-6.
26. Fan J, Slowikowski K, Zhang F. Single-cell transcriptomics in
cancer: computational challenges and opportunities. Exp Mol
Med. 2020;52(9):1452-1465. https://doi.org/10.1038/s12276-
020-0422-0.
27. Burke W. Clinical validity and clinical utility of genetic tests. Curr
Protoc Hum Genet. 2004;42:15.1-15.6. https://doi.org/10.1002/
0471142905.hg0915s42 Chap. 9.
28. Burke W. Genetic tests: clinical validity and clinical utility. Curr Pro-
toc Hum Genet. 2014;81:1-14. https://doi.org/10.1002/
0471142905.hg0915s81.
29. Katsanis SH, Katsanis N. Molecular genetic testing and the future of
clinical genomics. Nat Rev Genet. 2013;14(6):415-426. https://doi.
org/10.1038/nrg3493.
30. Han X, Wang R, Zhou Y, et al. Mapping the mouse cell atlas by
microwell-Seq. Cell. 2018;172(5):1091-1097.e17. https://doi.org/
10.1016/j.cell.2018.02.001.
31. Regev A, Teichmann SA, Lander ES, et al. The human cell atlas. Elife.
2017;6:e27041. https://doi.org/10.7554/eLife.27041.
32. Schaum N, Karkanias J, Neff NF, et al. Single-cell transcriptomics of
20 mouse organs creates a tabula Muris. Nature. 2018;562:367-372.
https://doi.org/10.1038/s41586-018-0590-4.
33. Rozenblatt-Rosen O, Stubbington MJT, Regev A, Teichmann SA.
The human cell atlas: from vision to reality. Nature. 2017;550:451-
453. https://doi.org/10.1038/550451a.
34. Velmeshev D, Schirmer L, Jung D, et al. Single-cell genomics iden-
tifies cell type–specific molecular changes in autism. Science. 2019;
364:685-689. https://doi.org/10.1126/science.aav8130.
35. Giustacchini A, Thongjuea S, Barkas N, et al. Single-cell trans-
criptomics uncovers distinct molecular signatures of stem cells in
chronic myeloid leukemia. Nat Med. 2017;23(6):692-702. https://
doi.org/10.1038/nm.4336.
36. Zhang F, Wei K, Slowikowski K, et al. Defining inflammatory cell
states in rheumatoid arthritis joint synovial tissues by integrating
single-cell transcriptomics and mass cytometry. Nat Immunol. 2019;
20:928-942. https://doi.org/10.1038/s41590-019-0378-1.
37. Venteicher AS, Tirosh I, Hebert C, et al. Decoupling genetics, line-
ages, and microenvironment in IDH-mutant gliomas by single-cell
RNA-seq. Science. 2017;355:eaai8478. https://doi.org/10.1126/
science.aai8478.
38. Patel AP, Tirosh I, Trombetta JJ, et al. Single-cell RNA-seq highlights
intratumoral heterogeneity in primary glioblastoma. Science. 2014;
344:1396-1401. https://doi.org/10.1126/science.1254257.
39. Skene NG, Bryois J, Bakken TE, et al. Genetic identification of brain
cell types underlying schizophrenia. Nat Genet. 2018;50:825-833.
https://doi.org/10.1038/s41588-018-0129-5.
40. Picelli S, Faridani OR, Bjorklund AK, Winberg G, Sagasser S,
Sandberg R. Full-length RNA-seq from single cells using smart-seq2.
Nat Protoc. 2014;9(1):171-181. https://doi.org/10.1038/nprot.
2014.006.
41. Hagemann-Jensen M, Ziegenhain C, Chen P, et al. Single-cell RNA
counting at allele- and isoform-resolution using smart-seq3. Nat Bio-
technol. 2020;38:708-714. https://doi.org/10.1038/s41587-020-
0497-0.
42. Islam S, Kjällquist U, Moliner A, et al. Highly multiplexed and strand-
specific single-cell RNA 50 end sequencing. Nat Protoc. 2012;7:813-
828. https://doi.org/10.1038/nprot.2012.022.
43. Fan HC, Fu GK, Fodor SP. Expression profiling. Combinatorial labeling
of single cells for gene expression cytometry. Science. 2015;347
(6222):1258367. https://doi.org/10.1126/science.1258367.
44. Klein AM, Mazutis L, Akartuna I, et al. Droplet barcoding for single-
cell transcriptomics applied to embryonic stem cells. Cell. 2015;161
(5):1187-1201. https://doi.org/10.1016/j.cell.2015.04.044.
45. Macosko EZ, Basu A, Satija R, et al. Highly parallel genome-wide
expression profiling of individual cells using nanoliter droplets. Cell.
2015;161:1202-1214. https://doi.org/10.1016/j.cell.2015.05.002.
46. Zheng GXY, Terry JM, Belgrader P, et al. Massively parallel digital
transcriptional profiling of single cells. Nat Commun. 2017;8:14049.
https://doi.org/10.1038/ncomms14049.
47. Hashimshony T, Senderovich N, Avital G, et al. CEL-Seq2: sensitive
highly-multiplexed single-cell RNA-Seq. Genome Biol. 2016;17(1):1-
7. https://doi.org/10.1186/s13059-016-0938-8.
48. Sasagawa Y, Danno H, Takada H, et al. Quartz-Seq2: a high-
throughput single-cell RNA-sequencing method that effectively uses
limited sequence reads. Genome Biol. 2018;19(1):29. https://doi.org/
10.1186/s13059-018-1407-3.
49. Gierahn TM, Wadsworth MH, Hughes TK, et al. Seq-well: portable,
low-cost rna sequencing of single cells at high throughput. Nat
Methods. 2017;14(4):395-398. https://doi.org/10.1038/nmeth.4179.
50. Rosenberg AB, Roco CM, Muscat RA, et al. Single-cell profiling of
the developing mouse brain and spinal cord with split-pool
barcoding. Science. 2018;360:176-182. https://doi.org/10.1126/
science.aam8999.
51. Datlinger P, Rendeiro AF, Boenke T, Krausgruber T, Barreca D,
Bock C. Ultra-high throughput single-cell RNA sequencing by combi-
natorial fluidic indexing. bioRxiv. 2019;1-27. https://doi.org/10.
1101/2019.12.17.879304.
52. Saunders A, Macosko EZ, Wysoker A, et al. Molecular diversity and
specializations among the cells of the adult mouse brain. Cell. 2018;
174:1015-1030.e16. https://doi.org/10.1016/j.cell.2018.07.028.
53. Svensson V, Vento-Tormo R, Teichmann SA. Exponential scaling of
single-cell RNA-seq in the past decade. Nat Protoc. 2018;13(4):599-
604. https://doi.org/10.1038/nprot.2017.149.
54. Ziegenhain C, Vieth B, Parekh S, et al. Comparative analysis of
single-cell RNA sequencing methods. Mol Cell. 2017;65(4):631-643.
e4. https://doi.org/10.1016/j.molcel.2017.01.023.
55. Zhang X, Li T, Liu F, et al. Comparative analysis of droplet-based
ultra-high-throughput single-cell RNA-Seq systems. Mol Cell.
2019;73(1):130-142.e5. https://doi.org/10.1016/j.molcel.2018.
10.020.
56. Ramskold D, Luo S, Wang YC, et al. Full-length mRNA-Seq from
single-cell levels of RNA and individual circulating tumor cells. Nat
Biotechnol. 2012;30(8):777-782. https://doi.org/10.1038/nbt.2282.
57. Lee MCW, Lopez-Diaz FJ, Khan SY, et al. Single-cell analyses of
transcriptional heterogeneity during drug tolerance transition in
21

cancer cells by RNA sequencing. Proc Natl Acad Sci U S A. 2014;111
(44):E4726-E4735. https://doi.org/10.1073/pnas.1404656111.
58. Kim KT, Lee HW, Lee HO, et al. Single-cell mRNA sequencing iden-
tifies subclonal heterogeneity in anti-cancer drug responses of lung
adenocarcinoma cells. Genome Biol. 2015;16(1):1-15. https://doi.
org/10.1186/s13059-015-0692-3.
59. Kim KT, Lee HW, Lee HO, et al. Application of single-cell RNA
sequencing in optimizing a combinatorial therapeutic strategy in
metastatic renal cell carcinoma. Genome Biol. 2016;17:80. https://
doi.org/10.1186/s13059-016-0945-9.
60. Miyamoto DT, Zheng Y, Wittner BS, et al. RNA-Seq of single pros-
tate CTCs implicates noncanonical Wnt signaling in antiandrogen
resistance. Science. 2015;349(6254):1351-1356. https://doi.org/10.
1126/science.aab0917.
61. Jordan NV, Bardia A, Wittner BS, et al. HER2 expression identifies
dynamic functional states within circulating breast cancer cells. Nature.
2016;537(7618):102-106. https://doi.org/10.1038/nature19328.
62. Gao R, Kim C, Sei E, et al. Nanogrid single-nucleus RNA sequencing
reveals phenotypic diversity in breast cancer. Nat Commun. 2017;8
(1):228. https://doi.org/10.1038/s41467-017-00244-w.
63. Lambrechts D, Wauters E, Boeckx B, et al. Phenotype molding of
stromal cells in the lung tumor microenvironment. Nat Med. 2018;24
(8):1277-1289. https://doi.org/10.1038/s41591-018-0096-5.
64. Goveia J, Rohlenova K, Taverna F, et al. An integrated gene expres-
sion landscape profiling approach to identify lung tumor endothelial
cell heterogeneity and Angiogenic candidates. Cancer Cell. 2020;37
(1):21-36.e13. https://doi.org/10.1016/j.ccell.2019.12.001.
65. Young MD, Mitchell TJ, Vieira Braga FA, et al. Single-cell trans-
criptomes from human kidneys reveal the cellular identity of renal
tumors. Science. 2018;361(6402):594-599. https://doi.org/10.1126/
science.aat1699.
66. Jessa S, Blanchet-Cohen A, Krug B, et al. Stalled developmental programs
at the root of pediatric brain tumors. Nat Genet. 2019;51:1702-1713.
https://doi.org/10.1038/s41588-019-0531-7.
67. Müller S, Kohanbash G, Liu SJ, et al. Single-cell profiling of human gli-
omas reveals macrophage ontogeny as a basis for regional differences
in macrophage activation in the tumor microenvironment. Genome
Biol. 2017;18(1):1-14. https://doi.org/10.1186/s13059-017-1362-4.
68. Puram SV, Tirosh I, Parikh AS, et al. Single-cell Transcriptomic analy-
sis of primary and metastatic tumor ecosystems in head and neck
Cancer. Cell. 2017;171(7):1611-1624.e24. https://doi.org/10.1016/
j.cell.2017.10.044.
69. Li H, Courtois ET, Sengupta D, et al. Reference component analysis
of single-cell transcriptomes elucidates cellular heterogeneity in
human colorectal tumors. Nat Genet. 2017;49(5):708-718. https://
doi.org/10.1038/ng.3818.
70. Savage P, Blanchet-Cohen A, Revil T, et al. A targetable EGFR-
dependent tumor-initiating program in breast Cancer. Cell Rep. 2017;
21(5):1140-1149. https://doi.org/10.1016/j.celrep.2017.10.015.
71. Chung W, Eum HH, Lee HO, et al. Single-cell RNA-seq enables com-
prehensive tumour and immune cell profiling in primary breast can-
cer. Nat Commun. 2017;8(May):1-12. https://doi.org/10.1038/
ncomms15081.
72. Brady SW, McQuerry JA, Qiao Y, et al. Combating subclonal evolu-
tion of resistant cancer phenotypes. Nat Commun. 2017;8(1):1231.
https://doi.org/10.1038/s41467-017-01174-3.
73. Tirosh I, Izar B, Prakadan SM, et al. Dissecting the multicellular eco-
system of metastatic melanoma by single-cell RNA-seq. Science.
2016;352(6282):189-196. https://doi.org/10.1126/science.aad0501.
74. Filbin MG, Tirosh I, Hovestadt V, et al. Developmental and oncogenic
programs in H3K27M gliomas dissected by single-cell RNA-seq. Science.
2018;360(6386):331-335. https://doi.org/10.1126/science.aao4750.
75. Tirosh I, Venteicher AS, Hebert C, et al. Single-cell RNA-seq supports
a developmental hierarchy in human oligodendroglioma. Nature.
2016;539(7628):309-313. https://doi.org/10.1038/nature20123.
76. Van Galen P, Hovestadt V, Ii MHW, et al. Single-cell RNA-Seq
reveals AML hierarchies relevant to disease progression and immu-
nity article single-cell RNA-Seq reveals AML hierarchies relevant to
disease progression and immunity. Cell. 2019;176:1-17. https://doi.
org/10.1016/j.cell.2019.01.031.
77. Petti AA, Williams SR, Miller CA, et al. A general approach for
detecting expressed mutations in AML cells using single cell RNA-
sequencing. Nat Commun. 2019;10(1):3660. https://doi.org/10.
1038/s41467-019-11591-1.
78. Durante MA, Rodriguez DA, Kurtenbach S, et al. Single-cell analysis
reveals new evolutionary complexity in uveal melanoma. Nat
Commun. 2020;11(1):496. https://doi.org/10.1038/s41467-019-
14256-1.
79. Palmer S, Albergante L, Blackburn CC, Newman TJ. Thymic involution
and rising disease incidence with age. Proc Natl Acad Sci U S A. 2018;
115(8):1883-1888. https://doi.org/10.1073/pnas.1714478115.
80. Pagès F, Galon J, Dieu-Nosjean MC, Tartour E, Sautès-Fridman C,
Fridman WH. Immune infiltration in human tumors: a prognostic fac-
tor that should not be ignored. Oncogene. 2010;29(8):1093-1102.
https://doi.org/10.1038/onc.2009.416.
81. Han A, Glanville J, Hansmann L, Davis MM. Linking T-cell receptor
sequence to functional phenotype at the single-cell level. Nat Bio-
technol. 2014;32(7):684-692. https://doi.org/10.1038/nbt.2938.
82. Zemmour D, Zilionis R, Kiner E, Klein AM, Mathis D, Benoist C.
Single-cell gene expression reveals a landscape of regulatory T cell
phenotypes shaped by the TCR article. Nat Immunol. 2018;19(3):
291-301. https://doi.org/10.1038/s41590-018-0051-0.
83. Moral JA, Leung J, Rojas LA, et al. ILC2s amplify PD-1 blockade by
activating tissue-specific cancer immunity. Nature. 2020;579(7797):
130-135. https://doi.org/10.1038/s41586-020-2015-4.
84. Li H, van der Leun AM, Yofe I, et al. Dysfunctional CD8 T cells form
a proliferative, dynamically regulated compartment within human
melanoma. Cell. 2019;176(4):775-789.e18. https://doi.org/10.1016/
j.cell.2018.11.043.
85. Fairfax BP, Taylor CA, Watson RA, et al. Peripheral CD8+ T cell char-
acteristics associated with durable responses to immune checkpoint
blockade in patients with metastatic melanoma. Nat Med. 2020;26
(2):193-199. https://doi.org/10.1038/s41591-019-0734-6.
86. Azizi E, Carr AJ, Plitas G, et al. Single-cell map of diverse immune
phenotypes in the breast tumor microenvironment. Cell. 2018;174
(5):1293-1308.e36. https://doi.org/10.1016/j.cell.2018.05.060.
87. Wu TD, Madireddi S, de Almeida PE, et al. Peripheral T cell
expansion predicts tumour infiltration and clinical response. Nature.
2020;579(7798):274-278. https://doi.org/10.1038/s41586-020-
2056-8.
88. Park JE, Botting RA, Conde CD, et al. A cell atlas of human thymic
development defines T cell repertoire formation. Science. 2020;367
(6480):eaay3224. https://doi.org/10.1126/science.aay3224.
89. Savas P, Virassamy B, Ye C, et al. Single-cell profiling of breast can-
cer T cells reveals a tissue-resident memory subset associated with
improved prognosis. Nat Med. 2018;24(7):986-993. https://doi.org/
10.1038/s41591-018-0078-7.
90. Zheng C, Zheng L, Yoo JK, et al. Landscape of infiltrating T cells in
liver Cancer revealed by single-cell sequencing. Cell. 2017;169(7):
1342-1356.e16. https://doi.org/10.1016/j.cell.2017.05.035.
91. Zhang Q, He Y, Luo N, et al. Landscape and dynamics of single
immune cells in hepatocellular carcinoma. Cell. 2019;179(4):
829-845.e20. https://doi.org/10.1016/j.cell.2019.10.003.
92. Zilionis R, Engblom C, Pfirschke C, et al. Single-cell Transcriptomics
of human and mouse lung cancers reveals conserved myeloid
populations across individuals and species. Immunity. 2019;50(5):
1317-1334.e10. https://doi.org/10.1016/j.immuni.2019.03.009.
93. Guo X, Zhang Y, Zheng L, et al. Global characterization of T cells in
non-small-cell lung cancer by single-cell sequencing. Nat Med. 2018;
24(7):978-985. https://doi.org/10.1038/s41591-018-0045-3.
22
94. Zhang L, Yu X, Zheng L, et al. Lineage tracking reveals dynamic rela-
tionships of T cells in colorectal cancer. Nature. 2018;564(7735):
268-272. https://doi.org/10.1038/s41586-018-0694-x.
95. Yost KE, Satpathy AT, Wells DK, et al. Clonal replacement of tumor-
specific T cells following PD-1 blockade. Nat Med. 2019;25(8):1251-
1259. https://doi.org/10.1038/s41591-019-0522-3.
96. Goswami S, Walle T, Cornish AE, et al. Immune profiling of human
tumors identifies CD73 as a combinatorial target in glioblastoma. Nat
Med. 2020;26(1):39-46. https://doi.org/10.1038/s41591-019-0694-x.
97. Hartmann FJ, Mrdjen D, McCaffrey E, et al. Single-cell metabolic
profiling of human cytotoxic T cells. Nat Biotechnol. 2020;39:
186–197. https://doi.org/10.1101/2020.01.17.909796.98. Lavin Y, Kobayashi S, Leader A, et al. Innate immune landscape in
early lung adenocarcinoma by paired single-cell analyses. Cell. 2017;
169(4):750-765.e17. https://doi.org/10.1016/j.cell.2017.04.014.
99. Wilting RH, Dannenberg JH. Epigenetic mechanisms in tumorigene-
sis, tumor cell heterogeneity and drug resistance. Drug Resist Updat.
2012;15(1-2):21-38. https://doi.org/10.1016/j.drup.2012.01.008.
100. Darwiche N. Epigenetic mechanisms and the hallmarks of cancer: an
intimate affair. Am J Cancer Res. 2020;10(7):1954-1978.
101. Ehrlich M. DNA methylation in cancer: too much, but also too little.
Oncogene. 2002;21(35):5400-5413. https://doi.org/10.1038/sj.onc.
1205651.
102. Audia JE, Campbell RM. Histone modifications and Cancer. Cold
Spring Harb Perspect Biol. 2016;8(4):a019521. https://doi.org/10.
1101/cshperspect.a019521.
103. Cheng Y, He C, Wang M, et al. Targeting epigenetic regulators for
cancer therapy: mechanisms and advances in clinical trials. Signal
Transduct Target Ther. 2019;4(1):62. https://doi.org/10.1038/
s41392-019-0095-0.
104. Issa JP, Garcia-Manero G, Giles FJ, et al. Phase 1 study of low-dose
prolonged exposure schedules of the hypomethylating agent 5-aza-
20-deoxycytidine (decitabine) in hematopoietic malignancies. Blood.
2004;103(5):1635-1640. https://doi.org/10.1182/blood-2003-03-
0687.
105. Kantarjian H, Oki Y, Garcia-Manero G, et al. Results of a randomized
study of 3 schedules of low-dose decitabine in higher-risk
myelodysplastic syndrome and chronic myelomonocytic leukemia.
Blood. 2007;109(1):52-57. https://doi.org/10.1182/blood-2006-05-
021162.
106. Issa JP, Kantarjian HM. Targeting DNA methylation. Clin Cancer Res.
2009;15(12):3938-3946. https://doi.org/10.1158/1078-0432.CCR-
08-2783.
107. Takeshima H, Yoda Y, Wakabayashi M, Hattori N, Yamashita S,
Ushijima T. Low-dose DNA demethylating therapy induces repro-
gramming of diverse cancer-related pathways at the single-cell level.
Clin Epigenetics. 2020;12(1):142. https://doi.org/10.1186/s13148-
020-00937-y.
108. Granja JM, Klemm S, McGinnis LM, et al. Single-cell multiomic analy-
sis identifies regulatory programs in mixed-phenotype acute leuke-
mia. Nat Biotechnol. 2019;37(12):1458-1465. https://doi.org/10.
1038/s41587-019-0332-7.
109. LaFave LM, Kartha VK, Ma S, et al. Epigenomic state transitions
characterize tumor progression in mouse lung adenocarcinoma. Can-
cer Cell. 2020;38(2):212-228 e13. https://doi.org/10.1016/j.ccell.
2020.06.006.
110. Guo H, Zhu P, Guo F, et al. Profiling DNA methylome landscapes of
mammalian cells with single-cell reduced-representation bisulfite
sequencing. Nat Protoc. 2015;10(5):645-659. https://doi.org/10.
1038/nprot.2015.039.
111. Rotem A, Ram O, Shoresh N, et al. Single-cell ChIP-seq reveals cell
subpopulations defined by chromatin state. Nat Biotechnol. 2015;33
(11):1165-1172. https://doi.org/10.1038/nbt.3383.
112. Hou Y, Guo H, Cao C, et al. Single-cell triple omics sequencing
reveals genetic, epigenetic, and transcriptomic heterogeneity in
hepatocellular carcinomas. Cell Res. 2016;26(3):304-319. https://
doi.org/10.1038/cr.2016.23.
113. Gaiti F, Chaligne R, Gu H, et al. Epigenetic evolution and lineage his-
tories of chronic lymphocytic leukaemia. Nature. 2019;569(7757):
576-580. https://doi.org/10.1038/s41586-019-1198-z.
114. Pastore A, Gaiti F, Lu SX, et al. Corrupted coordination of epigenetic
modifications leads to diverging chromatin states and transcriptional
heterogeneity in CLL. Nat Commun. 2019;10(1):1874. https://doi.
org/10.1038/s41467-019-09645-5.
115. Shu S, Wu HJ, Ge JY, et al. Synthetic lethal and resistance interac-
tions with BET Bromodomain inhibitors in triple-negative breast
Cancer. Mol Cell. 2020;78(6):1096–1113 e8. https://doi.org/10.
1016/j.molcel.2020.04.027.
116. Satpathy AT, Granja JM, Yost KE, et al. Massively parallel single-cell
chromatin landscapes of human immune cell development and
intratumoral T cell exhaustion. Nat Biotechnol. 2019;37(8):925-936.
https://doi.org/10.1038/s41587-019-0206-z.
117. Litzenburger UM, Buenrostro JD, Wu B, et al. Single-cell epigenomic
variability reveals functional cancer heterogeneity. Genome Biol.
2017;18(1):1-12. https://doi.org/10.1186/s13059-016-1133-7.
118. Grosselin K, Durand A, Marsolier J, et al. High-throughput single-cell
ChIP-seq identifies heterogeneity of chromatin states in breast can-
cer. Nat Genet. 2019;51(6):1060-1066. https://doi.org/10.1038/
s41588-019-0424-9.
119. Maruffi M, Sposto R, Oberley MJ, Kysh L, Orgel E. Therapy for chil-
dren and adults with mixed phenotype acute leukemia: a systematic
review and meta-analysis. Leukemia. 2018;32(7):1515-1528.
https://doi.org/10.1038/s41375-018-0058-4.
120. Stenhouse G, Fyfe N, King G, Chapman A, Kerr KM. Thyroid tran-
scription factor 1 in pulmonary adenocarcinoma. J Clin Pathol. 2004;
57(4):383-387. https://doi.org/10.1136/jcp.2003.007138.
121. Kim HK, Noh YH, Nilius B, et al. Current and upcoming mitochon-
drial targets for cancer therapy. Semin Cancer Biol. 2017;47:154-
167. https://doi.org/10.1016/j.semcancer.2017.06.006.
122. Lareau CA, Ludwig LS, Muus C, et al. Massively parallel single-cell
mitochondrial DNA genotyping and chromatin profiling. Nat Bio-
technol. 2020. https://doi.org/10.1038/s41587-020-0645-6.
123. Lo PK, Zhou Q. Emerging techniques in single-cell epigenomics and
their applications to cancer research. J Clin Genomics. 2018;1(1).
https://doi.org/10.4172/JCG.1000103.
124. Kaya-Okur HS, Wu SJ, Codomo CA, et al. CUT&tag for efficient epi-
genomic profiling of small samples and single cells. Nat Commun.
2019;10(1):1930. https://doi.org/10.1038/s41467-019-09982-5.
125. Ding L, Ley TJ, Larson DE, et al. HHS public. Access. 2012;481
(7382):506-510. https://doi.org/10.1038/nature10738.Clonal.
126. Gerlinger M, Rowan AJ, Sc B, et al. Intratumor heterogeneity and branched
evolution revealed by multiregion sequencing. N Engl J Med. 2012;366(10):
883-892. https://doi.org/10.1056/NEJMoa1113205.Intratumor.
127. Navin N, Kendall J, Troge J, et al. Tumour evolution inferred by
single-cell sequencing. Nature. 2011;472:90-94. https://doi.org/10.
1038/nature09807.
128. Hou Y, Song L, Zhu P, et al. Single-cell exome sequencing and mono-
clonal evolution of a JAK2-negative myeloproliferative neoplasm.
Cell. 2012;148:873-885. https://doi.org/10.1016/j.cell.2012.02.028.
129. Xu X, Hou Y, Yin X, et al. Single-cell exome sequencing reveals
single-nucleotide mutation characteristics of a kidney tumor. Cell.
2012;148(5):886-895. https://doi.org/10.1016/j.cell.2012.02.025.
130. Wang J, Fan HC, Behr B, Quake SR. Genome-wide single-cell analy-
sis of recombination activity and de novo mutation rates in human
sperm. Cell. 2012;150(2):402-412. https://doi.org/10.1016/j.cell.
2012.06.030.
131. Hughes AEO, Magrini V, Demeter R, et al. Clonal architecture of
secondary acute myeloid leukemia defined by single-cell sequencing.
PLoS Genet. 2014;10(7):e1004462. https://doi.org/10.1371/journal.
pgen.1004462.
23
132. Zong C, Lu S, Chapman AR, Xie XS. Genome-wide detection of
single-nucleotide and copy-number variations of a single human cell.
Science. 2012;338(6114):1622-1626. https://doi.org/10.1126/
science.1229164.
133. Vitak SA, Torkenczy KA, Rosenkrantz JL, et al. Sequencing thousands
of single-cell genomes with combinatorial indexing. Nat Methods.
2017;14:302-308. https://doi.org/10.1038/nmeth.4154.
134. Gawad C, Koh W, Quake SR. Single-cell genome sequencing: current
state of the science. Nat Rev Genet. 2016;17(3):175-188. https://
doi.org/10.1038/nrg.2015.16.
135. Chen C, Xing D, Tan L, et al. Single-cell whole-genome analyses
by linear amplification via transposon insertion (LIANTI). Science.
2017;356(6334):189-194. https://doi.org/10.1126/science.aak9787.
136. Zahn H, Steif A, Laks E, et al. Scalable whole-genome single-cell
library preparation without preamplification. Nat Methods. 2017;14
(2):167-173. https://doi.org/10.1038/nmeth.4140.
137. Laks E, McPherson A, Zahn H, et al. Clonal decomposition and DNA repli-
cation states defined by scaled single-cell genome sequencing. Cell. 2019;
179(5):1207-1221.e22. https://doi.org/10.1016/j.cell.2019.10.026.
138. Falconer E, Hills M, Naumann U, et al. DNA template strand
sequencing of single-cells maps genomic rearrangements at high res-
olution. Nat Methods. 2012;9(11):1107-1112. https://doi.org/10.
1038/nmeth.2206.
139. Maria Maggiolini FA, Sanders AD, Shew CJ, et al. Single-cell strand
sequencing of a macaque genome reveals multiple nested inversions
and breakpoint reuse during primate evolution. Genome Res. 2020;
30(11):1680-1693. https://doi.org/10.1101/gr.265322.120.
140. Sanders AD, Meiers S, Ghareghani M, et al. Single-cell analysis of
structural variations and complex rearrangements with tri-channel
processing. Nat Biotechnol. 2020;38(3):343-354. https://doi.org/10.
1038/s41587-019-0366-x.
141. Wang Y, Waters J, Leung ML, et al. Clonal evolution in breast cancer
revealed by single nucleus genome sequencing. Nature. 2014;512
(7513):155-160. https://doi.org/10.1038/nature13600.
142. Gao R, Davis A, McDonald TO, et al. Punctuated copy number evo-
lution and clonal stasis in triple-negative breast cancer. Nat Genet.
2016;48(10):1119-1130. https://doi.org/10.1038/ng.3641.
143. Eirew P, Steif A, Khattra J, et al. Dynamics of genomic clones in
breast cancer patient xenografts at single-cell resolution. Nature.
2015;518(7539):422-426. https://doi.org/10.1038/nature13952.
144. Kim C, Gao R, Sei E, et al. Chemoresistance evolution in triple-negative
breast Cancer delineated by single-cell sequencing. Cell. 2018;173(4):
879-893.e13. https://doi.org/10.1016/j.cell.2018.03.041.
145. Leung ML, Davis A, Gao R, et al. Single-cell DNA sequencing reveals
a latedissemination model in metastatic colorectal cancer. Genome
Res. 2017;27(8):1287-1299. https://doi.org/10.1101/gr.209973.116.
146. Lohr JG, Adalsteinsson VA, Cibulskis K, et al. Whole-exome
sequencing of circulating tumor cells provides a window into meta-
static prostate cancer. Nat Biotechnol. 2014;32(5):479-484. https://
doi.org/10.1038/nbt.2892.
147. Ni X, Zhuo M, Su Z, et al. Reproducible copy number variation pat-
terns among single circulating tumor cells of lung cancer patients.
Proc Natl Acad Sci U S A. 2013;110:21083-21088. https://doi.org/
10.1073/pnas.1320659110.
148. Carter L, Rothwell DG, Mesquita B, et al. Molecular analysis of
circulating tumor cells identifies distinct copy-number profiles in
patients with chemosensitive and chemorefractory small-cell lung
cancer. Nat Med. 2017;23(1):114-119. https://doi.org/10.1038/nm.
4239.
149. Pellegrino M, Sciambi A, Treusch S, et al. High-throughput single-cell
DNA sequencing of acute myeloid leukemia tumors with droplet
microfluidics. Genome Res. 2018;28(9):1345-1352. https://doi.org/
10.1101/gr.232272.117.
150. DiNardo CD, Tiong IS, Quaglieri A, et al. Molecular patterns of
response and treatment failure after frontline venetoclax combinations
in older patients with AML. Blood. 2020;135(11):791-803. https://doi.
org/10.1182/blood.2019003988.
151. Morita K, Wang F, Jahn K, et al. Clonal evolution of acute myeloid
leukemia revealed by high-throughput single-cell genomics. Nat
Commun. 2020;11(1):5327. https://doi.org/10.1038/s41467-020-
19119-8.
152. Miles LA, Bowman RL, Merlinsky TR, et al. Single-cell mutation anal-
ysis of clonal evolution in myeloid malignancies. Nature. 2020;587:
477-482. https://doi.org/10.1038/s41586-020-2864-x.
153. Papaemmanuil E, Rapado I, Li Y, et al. RAG-mediated recombination
is the predominant driver of oncogenic rearrangement in
ETV6-RUNX1 acute lymphoblastic leukemia. Nat Genet. 2014;46(2):
116-125. https://doi.org/10.1038/ng.2874.
154. Gawad C, Koh W, Quake SR. Dissecting the clonal origins of child-
hood acute lymphoblastic leukemia by single-cell genomics. Proc
Natl Acad Sci U S A. 2014;111(50):17947-17952. https://doi.org/10.
1073/pnas.1420822111.
155. Van Den Brink SC, Sage F, Vértesy �A, et al. Single-cell sequencing
reveals dissociation-induced gene expression in tissue subpopula-
tions. Nat Methods. 2017;14(10):935-936. https://doi.org/10.1038/
nmeth.4437.
156. Toki MI, Merritt CR, Wong PF, et al. High-Plex predictive marker
discovery for melanoma immunotherapy–treated patients using digi-
tal spatial profiling. Clin Cancer Res. 2019;25(18):5503-5512.
https://doi.org/10.1158/1078-0432.ccr-19-0104.
157. Wang F, Flanagan J, Su N, et al. RNAscope: a novel in situ RNA analy-
sis platform for formalin-fixed, paraffin-embedded tissues. J Mol Diagn.
2012;14(1):22-29. https://doi.org/10.1016/j.jmoldx.2011.08.002.
158. Ihle CL, Provera MD, Straign DM, et al. Distinct tumor microenviron-
ments of lytic and blastic bone metastases in prostate cancer
patients. J Immunother Cancer. 2019;7(1):1-9. https://doi.org/10.
1186/s40425-019-0753-3.
159. Goltsev Y, Samusik N, Kennedy-Darling J, et al. Deep profiling of
mouse splenic architecture with CODEX multiplexed imaging. Cell.
2018;174(4):968-981.e15. https://doi.org/10.1016/j.cell.2018.07.010.
160. Vickovic S, Eraslan G, Salmén F, et al. High-definition spatial trans-
criptomics for in situ tissue profiling. Nat Methods. 2019;16(10):987-
990. https://doi.org/10.1038/s41592-019-0548-y.
161. Schulz D, Zanotelli VRT, Fischer JR, et al. Simultaneous multiplexed
imaging of mRNA and proteins with subcellular resolution in breast
cancer tissue samples by mass cytometry. Cell Syst. 2018;6(1):25-36.
e5. https://doi.org/10.1016/j.cels.2017.12.001.
162. Casasent AK, Schalck A, Gao R, et al. Multiclonal invasion in breast
tumors identified by topographic single cell sequencing. Cell. 2018;
172(1-2):205-217.e12. https://doi.org/10.1016/j.cell.2017.12.007.
163. Kim S, Lee AC, Lee HB, et al. PHLI-seq: constructing and visualizing
cancer genomic maps in 3D by phenotype-based high-throughput
laser-aided isolation and sequencing. Genome Biol. 2018;19:158.
https://doi.org/10.1186/s13059-018-1543-9.
164. Gorris MAJ, Halilovic A, Rabold K, et al. Eight-color multiplex immu-
nohistochemistry for simultaneous detection of multiple immune
checkpoint molecules within the tumor microenvironment. J Immunol.
2018;200(1):347-354. https://doi.org/10.4049/jimmunol.1701262.
165. Cabrita R, Lauss M, Sanna A, et al. Tertiary lymphoid structures
improve immunotherapy and survival in melanoma. Nature.
2020;577(7791):561-565. https://doi.org/10.1038/s41586-019-
1914-8.
166. Helmink BA, Reddy SM, Gao J, et al. B cells and tertiary lymphoid
structures promote immunotherapy response. Nature. 2020;577
(7791):549-555. https://doi.org/10.1038/s41586-019-1922-8.
167. Merritt CR, Ong GT, Church SE, et al. Multiplex digital spatial profil-
ing of proteins and RNA in fixed tissue. Nat Biotechnol. 2020;38(5):
586-599. https://doi.org/10.1038/s41587-020-0472-9.
168. Rodriques SG, Stickels RR, Goeva A, et al. Slide-seq: a scalable tech-
nology for measuring genome-wide expression at high spatial
24

resolution. Science. 2019;363(6434):1463-1467. https://doi.org/10.
1126/science.aaw1219.
169. Stahl PL, Salmen F, Vickovic S, et al. Visualization and analysis of
gene expression in tissue sections by spatial transcriptomics. Science.
2016;353(6294):78-82. https://doi.org/10.1126/science.aaf2403.
170. Moncada R, Barkley D, Wagner F, et al. Integrating microarray-
based spatial transcriptomics and single-cell RNA-seq reveals tissue
architecture in pancreatic ductal adenocarcinomas. Nat Biotechnol.
2020;38(3):333-342. https://doi.org/10.1038/s41587-019-0392-8.
171. Villacampa EG, Larsson L, Kvastad L, Andersson A, Carlson J,
Lundeberg J. Genome-wide spatial expression profiling in FFPE tis-
sues. bioRxiv. 2020. https://doi.org/10.1101/2020.07.24.219758
172. Wang Z, Portier BP, Gruver AM, et al. Automated quantitative RNA
in situ hybridization for resolution of equivocal and heterogeneous
ERBB2 (HER2) status in invasive breast carcinoma. J Mol Diagn. 2013;
15(2):210-219. https://doi.org/10.1016/j.jmoldx.2012.10.003.
173. Ke R, Mignardi M, Pacureanu A, et al. In situ sequencing for RNA
analysis in preserved tissue and cells. Nat Methods. 2013;10(9):857-
860. https://doi.org/10.1038/nmeth.2563.
174. Potter N, Ermini L, Papaemmanuil E, et al. Single-cell mutational pro-
filing and clonal phylogeny in cancer. Genome Res. 2013;23:2115-
2125. https://doi.org/10.1101/gr.159913.113.23.
175. Ediriwickrema A, Aleshin A, Reiter JG, et al. Single-cell mutational profil-
ing enhances the clinical evaluation of AML MRD. Blood Adv. 2020;
4(5):943-952. https://doi.org/10.1182/bloodadvances.2019001181.
176. Nguyen QH, Pervolarakis N, Nee K, Kessenbrock K. Experimental
considerations for single-cell RNA sequencing approaches. Front Cell
Dev Biol. 2018;6:108. https://doi.org/10.3389/fcell.2018.00108.
177. Hodge RD, Bakken TE, Miller JA, et al. Conserved cell types with
divergent features in human versus mouse cortex. Nature. 2019;
573:61-68. https://doi.org/10.1038/s41586-019-1506-7.
178. Barkas N, Petukhov V, Nikolaeva D, et al. Joint analysis of heteroge-
neous single-cell RNA-seq dataset collections. Nat Methods. 2019;
16:695-698. https://doi.org/10.1038/s41592-019-0466-z.
179. Mereu E, Lafzi A, Moutinho C, et al. Benchmarking single-cell RNA-
sequencing protocols for cell atlas projects. Nat Biotechnol. 2020;38
(6):747-755. https://doi.org/10.1038/s41587-020-0469-4.
180. Massoni-Badosa R, Iacono G, Moutinho C, et al. Sampling
time-dependent artifacts in single-cell genomics studies.
Genome Biol. 2020;21(1):1-16. https://doi.org/10.1186/s13059-
020-02032-0.
181. Slyper M, Porter CBM, Ashenberg O, et al. A single-cell and single-
nucleus RNA-Seq toolbox for fresh and frozen human tumors. Nat
Med. 2020;26(5):792-802. https://doi.org/10.1038/s41591-020-
0844-1.
182. Bendall SC, Davis KL, Amir EAD, et al. Single-cell trajectory detec-
tion uncovers progression and regulatory coordination in human b
cell development. Cell. 2014;157:714-725. https://doi.org/10.
1016/j.cell.2014.04.005.
183. Trapnell C, Cacchiarelli D, Grimsby J, et al. The dynamics and regula-
tors of cell fate decisions are revealed by pseudotemporal ordering
of single cells. Nat Biotechnol. 2014;32:381-386. https://doi.org/10.
1038/nbt.2859.
184. Kharchenko PV, Silberstein L, Scadden DT. Bayesian approach to
single-cell differential expression analysis. Nat Methods. 2014;11(7):
740-742. https://doi.org/10.1038/nmeth.2967.
185. Grün D, Kester L, Van Oudenaarden A. Validation of noise models
for single-cell transcriptomics. Nat Methods. 2014;11(6):637-640.
https://doi.org/10.1038/nmeth.2930.
186. Pagès F, Mlecnik B, Marliot F, et al. International validation of the
consensus Immunoscore for the classification of colon cancer: a
prognostic and accuracy study. Lancet. 2018;391(10135):2128-
2139. https://doi.org/10.1016/S0140-6736(18)30789-X.
187. Bodenmiller B. Multiplexed epitope-based tissue imaging for discov-
ery and healthcare applications. Cell Syst. 2016;2(4):225-238.
https://doi.org/10.1016/j.cels.2016.03.008.
25
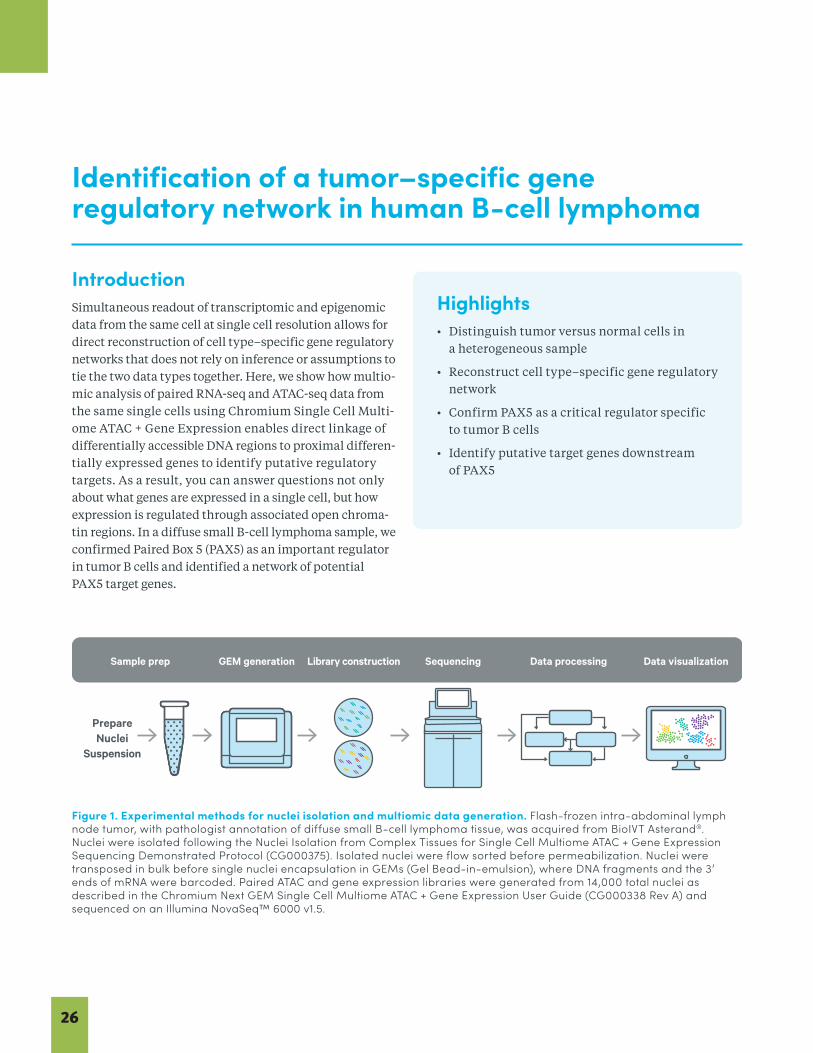
Sample prep GEM generation Sequencing Data processing Data visualization
PrepareNuclei
Suspension
Library construction
Identification of a tumor–specific gene regulatory network in human B-cell lymphoma
IntroductionSimultaneous readout of transcriptomic and epigenomic data from the same cell at single cell resolution allows for direct reconstruction of cell type–specific gene regulatory networks that does not rely on inference or assumptions to tie the two data types together. Here, we show how multio-mic analysis of paired RNA-seq and ATAC-seq data from the same single cells using Chromium Single Cell Multi-ome ATAC + Gene Expression enables direct linkage of differentially accessible DNA regions to proximal differen-tially expressed genes to identify putative regulatory targets. As a result, you can answer questions not only about what genes are expressed in a single cell, but how expression is regulated through associated open chroma-tin regions. In a diffuse small B-cell lymphoma sample, we confirmed Paired Box 5 (PAX5) as an important regulator in tumor B cells and identified a network of potential PAX5 target genes.
Figure 1. Experimental methods for nuclei isolation and multiomic data generation. Flash-frozen intra-abdominal lymph node tumor, with pathologist annotation of diffuse small B-cell lymphoma tissue, was acquired from BioIVT Asterand®. Nuclei were isolated following the Nuclei Isolation from Complex Tissues for Single Cell Multiome ATAC + Gene Expression Sequencing Demonstrated Protocol (CG000375). Isolated nuclei were flow sorted before permeabilization. Nuclei were transposed in bulk before single nuclei encapsulation in GEMs (Gel Bead-in-emulsion), where DNA fragments and the 3’ ends of mRNA were barcoded. Paired ATAC and gene expression libraries were generated from 14,000 total nuclei as described in the Chromium Next GEM Single Cell Multiome ATAC + Gene Expression User Guide (CG000338 Rev A) and sequenced on an Illumina NovaSeq™ 6000 v1.5.
Highlights • Distinguish tumor versus normal cells in
a heterogeneous sample
• Reconstruct cell type–specific gene regulatorynetwork
• Confirm PAX5 as a critical regulator specificto tumor B cells
• Identify putative target genes downstreamof PAX5
26
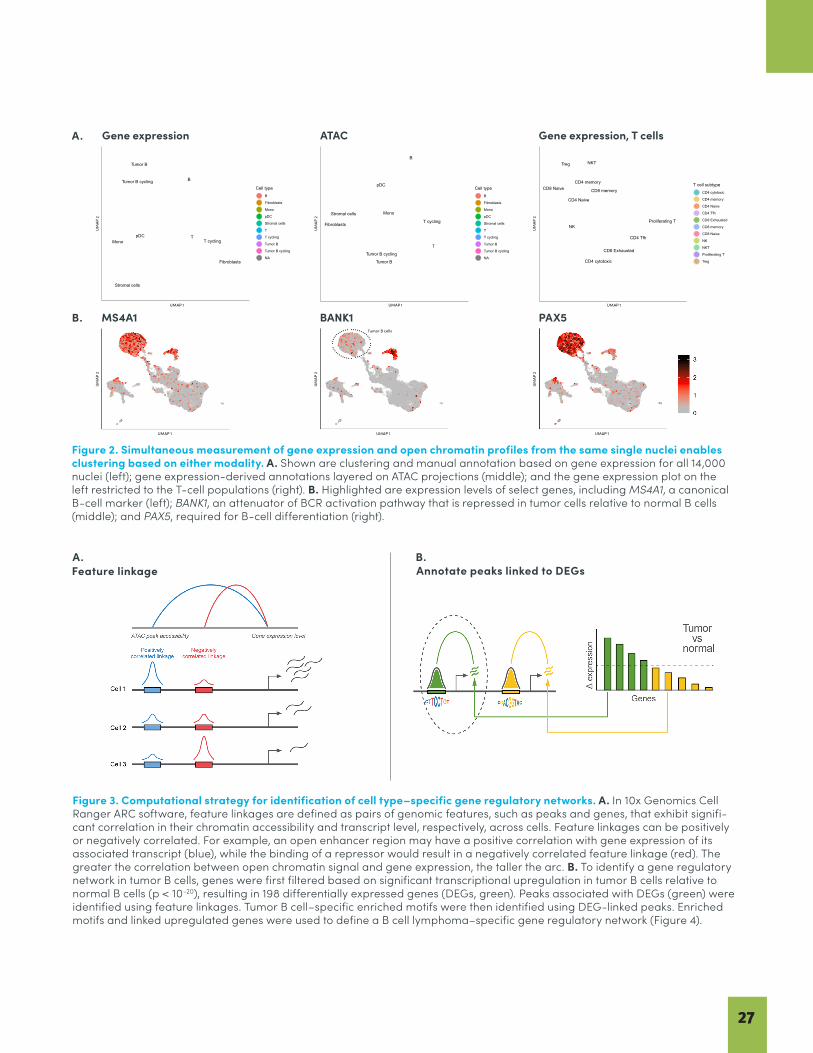
Annotate peaks linked to DEGsFeature linkage
Figure 2. Simultaneous measurement of gene expression and open chromatin profiles from the same single nuclei enables clustering based on either modality. A. Shown are clustering and manual annotation based on gene expression for all 14,000 nuclei (left); gene expression-derived annotations layered on ATAC projections (middle); and the gene expression plot on the left restricted to the T-cell populations (right). B. Highlighted are expression levels of select genes, including MS4A1, a canonical B-cell marker (left); BANK1, an attenuator of BCR activation pathway that is repressed in tumor cells relative to normal B cells(middle); and PAX5, required for B-cell differentiation (right).
Figure 3. Computational strategy for identification of cell type–specific gene regulatory networks. A. In 10x Genomics Cell Ranger ARC software, feature linkages are defined as pairs of genomic features, such as peaks and genes, that exhibit signifi-cant correlation in their chromatin accessibility and transcript level, respectively, across cells. Feature linkages can be positively or negatively correlated. For example, an open enhancer region may have a positive correlation with gene expression of its associated transcript (blue), while the binding of a repressor would result in a negatively correlated feature linkage (red). The greater the correlation between open chromatin signal and gene expression, the taller the arc. B. To identify a gene regulatory network in tumor B cells, genes were first filtered based on significant transcriptional upregulation in tumor B cells relative to normal B cells (p < 10-20), resulting in 198 differentially expressed genes (DEGs, green). Peaks associated with DEGs (green) were identified using feature linkages. Tumor B cell–specific enriched motifs were then identified using DEG-linked peaks. Enriched motifs and linked upregulated genes were used to define a B cell lymphoma–specific gene regulatory network (Figure 4).
A. B.
B
Fibroblasts
MonopDC
Stromal cells
TT cycling
Tumor B
Tumor B cycling
umap1
umap
2
Cell typeB
Fibroblasts
Mono
pDC
Stromal cells
T
T cycling
Tumor B
Tumor B cycling
NA
Gene Expression
B
Fibroblasts
Mono
pDC
Stromal cells
T
T cycling
Tumor B
Tumor B cycling
umap1um
ap2
Cell typeB
Fibroblasts
Mono
pDC
Stromal cells
T
T cycling
Tumor B
Tumor B cycling
NA
ATAC
CD4 cytotoxic
CD4 memory
CD4 Naive
CD4 Tfh
CD8 Exhausted
CD8 memoryCD8 Naive
NK
NKT
Proliferating T
Treg
umap1
umap
2
T cell subtypeCD4 cytotoxic
CD4 memory
CD4 Naive
CD4 Tfh
CD8 Exhausted
CD8 memory
CD8 Naive
NK
NKT
Proliferating T
Treg
Gene Expression, T cells
CD4 cytotoxic
CD4 memory CD4 Naive
CD4 TfhCD8 Exhausted
CD8 memory
CD8 Naive
NKNKT
Proliferating T
Treg
umap1
umap
2
T cell subtypeCD4 cytotoxic
CD4 memory
CD4 Naive
CD4 Tfh
CD8 Exhausted
CD8 memory
CD8 Naive
NK
NKT
Proliferating T
Treg
ATAC, T cells
B
Fibroblasts
MonopDC
Stromal cells
TT cycling
Tumor B
Tumor B cycling
umap1
umap
2
Cell typeB
Fibroblasts
Mono
pDC
Stromal cells
T
T cycling
Tumor B
Tumor B cycling
NA
Gene Expression
B
Fibroblasts
Mono
pDC
Stromal cells
T
T cycling
Tumor B
Tumor B cycling
umap1
umap
2
Cell typeB
Fibroblasts
Mono
pDC
Stromal cells
T
T cycling
Tumor B
Tumor B cycling
NA
ATAC
CD4 cytotoxic
CD4 memory
CD4 Naive
CD4 Tfh
CD8 Exhausted
CD8 memoryCD8 Naive
NK
NKT
Proliferating T
Treg
umap1
umap
2
T cell subtypeCD4 cytotoxic
CD4 memory
CD4 Naive
CD4 Tfh
CD8 Exhausted
CD8 memory
CD8 Naive
NK
NKT
Proliferating T
Treg
Gene Expression, T cells
CD4 cytotoxic
CD4 memory CD4 Naive
CD4 TfhCD8 Exhausted
CD8 memory
CD8 Naive
NKNKT
Proliferating T
Treg
umap1
umap
2
T cell subtypeCD4 cytotoxic
CD4 memory
CD4 Naive
CD4 Tfh
CD8 Exhausted
CD8 memory
CD8 Naive
NK
NKT
Proliferating T
Treg
ATAC, T cellsA. Gene expression
UMAP 1 UMAP 1 UMAP 1
UM
AP 2
UM
AP 2
UM
AP 2
UM
AP 2
UM
AP 2
Tumor B cells
UM
AP 2
MS4A1
ATAC
BANK1
Gene expression, T cells
PAX5B.
UMAP 1 UMAP 1 UMAP 1
27
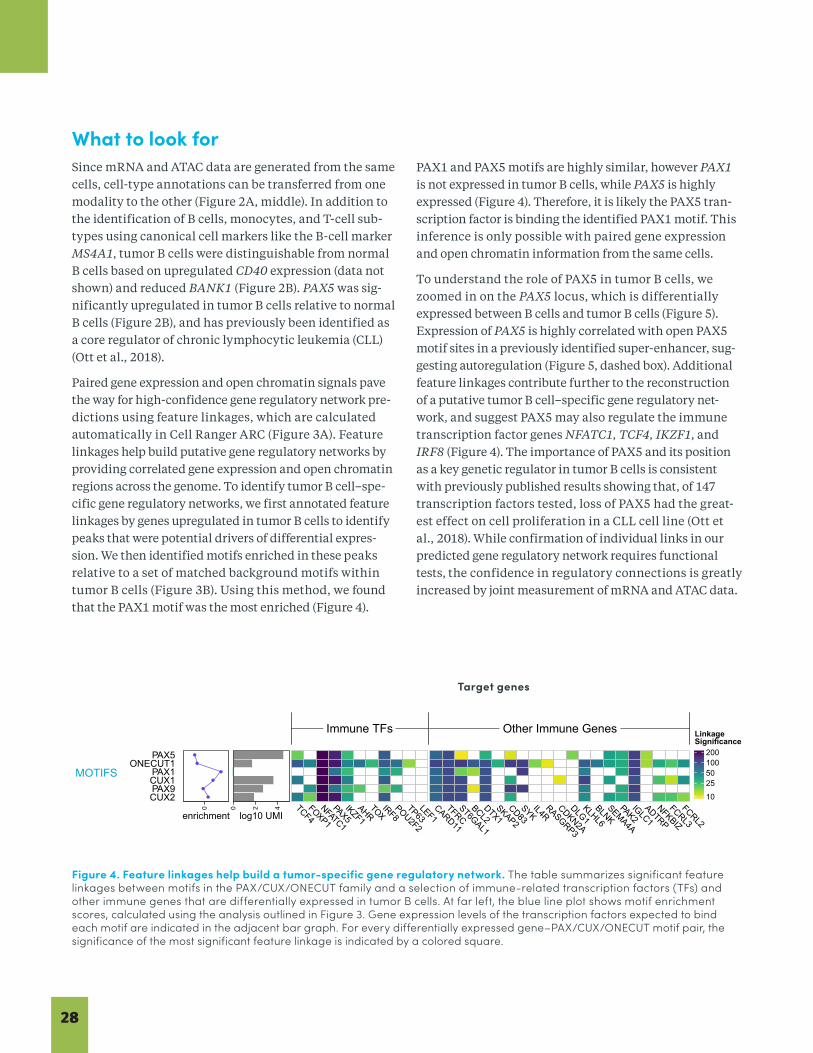
What to look forSince mRNA and ATAC data are generated from the same cells, cell-type annotations can be transferred from one modality to the other (Figure 2A, middle). In addition to the identification of B cells, monocytes, and T-cell sub-types using canonical cell markers like the B-cell marker MS4A1, tumor B cells were distinguishable from normal B cells based on upregulated CD40 expression (data not shown) and reduced BANK1 (Figure 2B). PAX5 was sig-nificantly upregulated in tumor B cells relative to normal B cells (Figure 2B), and has previously been identified as a core regulator of chronic lymphocytic leukemia (CLL) (Ott et al., 2018).
Paired gene expression and open chromatin signals pave the way for high-confidence gene regulatory network pre-dictions using feature linkages, which are calculated automatically in Cell Ranger ARC (Figure 3A). Feature linkages help build putative gene regulatory networks by providing correlated gene expression and open chromatin regions across the genome. To identify tumor B cell–spe-cific gene regulatory networks, we first annotated feature linkages by genes upregulated in tumor B cells to identify peaks that were potential drivers of differential expres-sion. We then identified motifs enriched in these peaks relative to a set of matched background motifs within tumor B cells (Figure 3B). Using this method, we found that the PAX1 motif was the most enriched (Figure 4).
PAX1 and PAX5 motifs are highly similar, however PAX1 is not expressed in tumor B cells, while PAX5 is highly expressed (Figure 4). Therefore, it is likely the PAX5 tran-scription factor is binding the identified PAX1 motif. This inference is only possible with paired gene expression and open chromatin information from the same cells.
To understand the role of PAX5 in tumor B cells, we zoomed in on the PAX5 locus, which is differentially expressed between B cells and tumor B cells (Figure 5). Expression of PAX5 is highly correlated with open PAX5 motif sites in a previously identified super-enhancer, sug-gesting autoregulation (Figure 5, dashed box). Additional feature linkages contribute further to the reconstruction of a putative tumor B cell–specific gene regulatory net-work, and suggest PAX5 may also regulate the immune transcription factor genes NFATC1, TCF4, IKZF1, and IRF8 (Figure 4). The importance of PAX5 and its position as a key genetic regulator in tumor B cells is consistent with previously published results showing that, of 147 transcription factors tested, loss of PAX5 had the great-est effect on cell proliferation in a CLL cell line (Ott et al., 2018). While confirmation of individual links in our predicted gene regulatory network requires functional tests, the confidence in regulatory connections is greatly increased by joint measurement of mRNA and ATAC data.
MOTIFSPAX5
ONECUT1PAX1CUX1PAX9CUX2
TCF4FOXP1
NFATC1
PAX5IKZF1
AHRTOX
IRF8POU2F2
TP63LEF1
CARD11
TFRCST6GAL1
BCL2DTX1
SKAP2
CD83SYK
IL4RRASGRP3
CDKN2A
DLG1KLHL6
BLNKSEMA4A
PAK2IGLC1
ADTRP
NFKBIZ
FCRL3
FCRL2
0
enrichment
0 2 4
log10 UMI
LinkageSignificance
10
2550100200
Immune TFs Other Immune Genes
Target genes
Figure 4. Feature linkages help build a tumor-specific gene regulatory network. The table summarizes significant feature linkages between motifs in the PAX/CUX/ONECUT family and a selection of immune-related transcription factors (TFs) and other immune genes that are differentially expressed in tumor B cells. At far left, the blue line plot shows motif enrichment scores, calculated using the analysis outlined in Figure 3. Gene expression levels of the transcription factors expected to bind each motif are indicated in the adjacent bar graph. For every differentially expressed gene–PAX/CUX/ONECUT motif pair, the significance of the most significant feature linkage is indicated by a colored square.
28
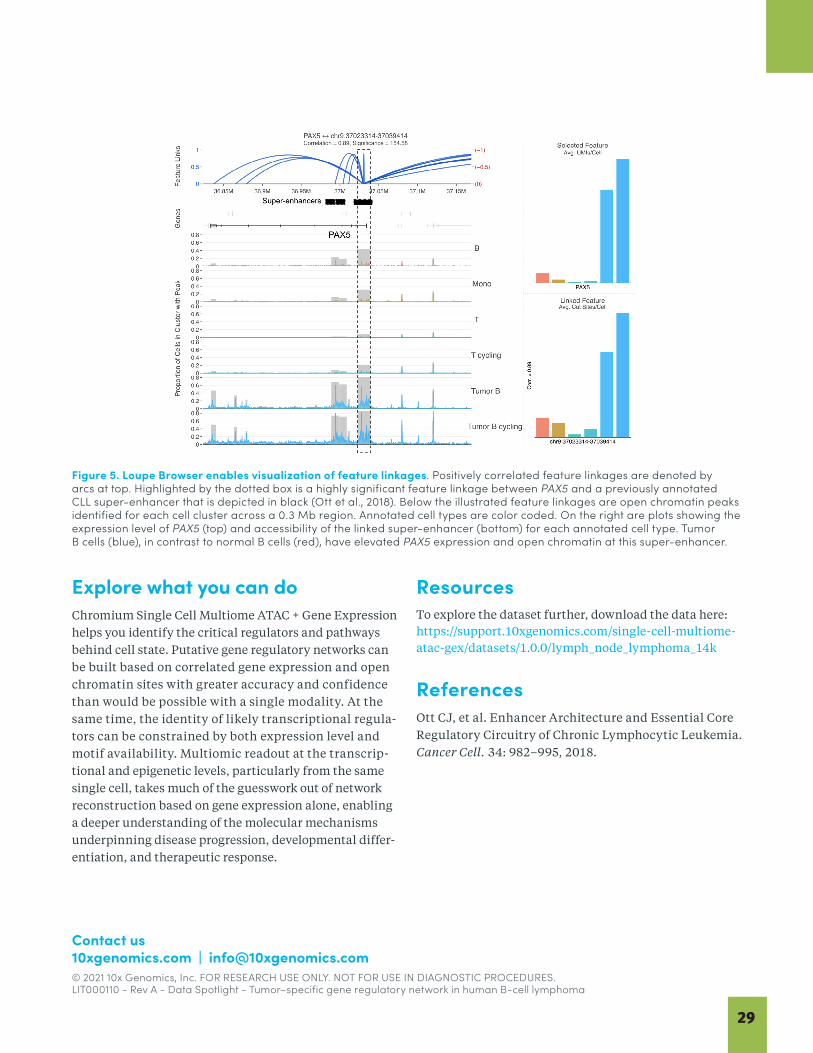
Figure 5. Loupe Browser enables visualization of feature linkages. Positively correlated feature linkages are denoted by arcs at top. Highlighted by the dotted box is a highly significant feature linkage between PAX5 and a previously annotated CLL super-enhancer that is depicted in black (Ott et al., 2018). Below the illustrated feature linkages are open chromatin peaks identified for each cell cluster across a 0.3 Mb region. Annotated cell types are color coded. On the right are plots showing the expression level of PAX5 (top) and accessibility of the linked super-enhancer (bottom) for each annotated cell type. Tumor B cells (blue), in contrast to normal B cells (red), have elevated PAX5 expression and open chromatin at this super-enhancer.
Contact us 10xgenomics.com | [email protected] © 2021 10x Genomics, Inc. FOR RESEARCH USE ONLY. NOT FOR USE IN DIAGNOSTIC PROCEDURES.LIT000110 - Rev A - Data Spotlight - Tumor–specific gene regulatory network in human B-cell lymphoma
Explore what you can doChromium Single Cell Multiome ATAC + Gene Expression helps you identify the critical regulators and pathways behind cell state. Putative gene regulatory networks can be built based on correlated gene expression and open chromatin sites with greater accuracy and confidence than would be possible with a single modality. At the same time, the identity of likely transcriptional regula-tors can be constrained by both expression level and motif availability. Multiomic readout at the transcrip-tional and epigenetic levels, particularly from the same single cell, takes much of the guesswork out of network reconstruction based on gene expression alone, enabling a deeper understanding of the molecular mechanisms underpinning disease progression, developmental differ-entiation, and therapeutic response.
ResourcesTo explore the dataset further, download the data here: https://support.10xgenomics.com/single-cell-multiome-atac-gex/datasets/1.0.0/lymph_node_lymphoma_14k
ReferencesOtt CJ, et al. Enhancer Architecture and Essential Core Regulatory Circuitry of Chronic Lymphocytic Leukemia. Cancer Cell. 34: 982–995, 2018.
29
SPECIAL FEATURE REVIEW
Recent advances in single-cell multimodal analysis to studyimmune cellsRaymond HY Louie & Fabio Luciani
School of Medical Sciences, The Kirby Institute, University of New South Wales (UNSW), Sydney, NSW, Australia
Keywords
cell state, cell–cell interaction, clonal analysis,
immune cells, lineage, multimodal analysis,
pseudotime, single-cell technology, temporal
analysis
Correspondence
Fabio Luciani, School of Medical Sciences and
the Kirby Institute, University of New South
Wales (UNSW), Sydney, NSW 2052,
Australia.
E-mail: [email protected]
Received 5 September 2020; Revised 30
October, 24 November and 9 December
2020; Accepted 9 December 2020
doi: 10.1111/imcb.12432
Immunology & Cell Biology 2021; 99:
157–167
Abstract
Recent advances in single-cell technologies have enabled the profiling of the
genome, epigenome, transcriptome and proteome, along with temporal and
spatial information of individual cells. These technologies have provided
unique opportunities to understand mechanisms underpinning the immune
system, such as characterizations of the molecular cell state, how the cell state
evolves along its lineage and the impact of spatial location on cell state. In this
review, we discuss how these mechanisms have been studied through recent
advances in single-cell multimodal technologies.
INTRODUCTION
Recent advances in single-cell technology has made it
possible to simultaneously extract different types of
information, or “modalities,” from the same single cell.
These modalities can arise from the genome, epigenome,
transcriptome and proteome (Figure 1a). In each of these
ome-layers, different modalities exist, such as mutations
and copy number variations at the genome layer, DNA
methylation and chromatin accessibility at the epigenome
layer and unspliced and spliced messenger RNA (mRNA)
at the transcriptome layer. Single-cell multimodal analysis
has been used for different immunological applications.
For example, a common application is to characterize the
molecular cell state, which can be described by a single
modality, for example, the expression of certain genes, or
by a combination of modalities spanning across the
genome, epigenome, transcriptome and proteome
(Figure 1a).
Single-cell multimodal analysis can also be used to
describe how the molecular cell state evolves along
different stages of cellular differentiation. This can be
achieved through combining “ome-layers” and temporal
modalities, thus capturing the information related to the
ordering of cells at different stages of differentiation.
Combining ome-layer and temporal modalities can
characterize how the molecular state of an immune cell
evolves along its lineage, from hematopoietic stem cells
(HSCs) in the bone marrow to its cell fate. A cell’s
lineage is created by the developmental history of the cell,
with each cell belonging to the same or sister clones.
Single-cell multimodal analysis can also inform on how
molecular cell state is location dependent, which requires
spatial modalities. These modalities include the (1) spatial
location of the cell in the body or (2) which cells are
interacting with each other. Cell-to-cell interactions can
be determined by examining receptor–ligand pair
interactions and are important, as neighboring cells can
modulate cell function through these interactions.
Single-cell multiple modalities can be obtained either
experimentally or bioinformatically. Experimental
modalities can be obtained through gathering cytometric
30
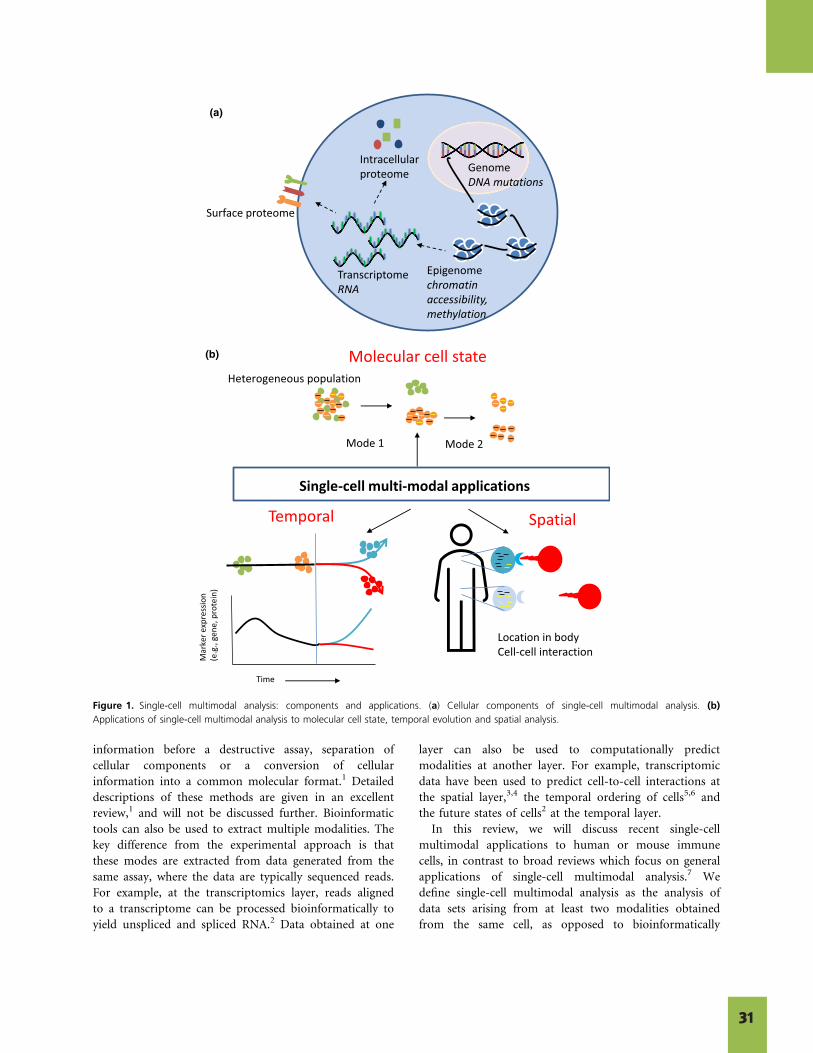
information before a destructive assay, separation of
cellular components or a conversion of cellular
information into a common molecular format.1 Detailed
descriptions of these methods are given in an excellent
review,1 and will not be discussed further. Bioinformatic
tools can also be used to extract multiple modalities. The
key difference from the experimental approach is that
these modes are extracted from data generated from the
same assay, where the data are typically sequenced reads.
For example, at the transcriptomics layer, reads aligned
to a transcriptome can be processed bioinformatically to
yield unspliced and spliced RNA.2 Data obtained at one
layer can also be used to computationally predict
modalities at another layer. For example, transcriptomic
data have been used to predict cell-to-cell interactions at
the spatial layer,3,4 the temporal ordering of cells5,6 and
the future states of cells2 at the temporal layer.
In this review, we will discuss recent single-cell
multimodal applications to human or mouse immune
cells, in contrast to broad reviews which focus on general
applications of single-cell multimodal analysis.7 We
define single-cell multimodal analysis as the analysis of
data sets arising from at least two modalities obtained
from the same cell, as opposed to bioinformatically
GenomeDNA mutations
Epigenomechromatinaccessibility,methylation
TranscriptomeRNA
Surface proteome
Intracellularproteome
Single-cell multi-modal applications
Molecular cell state
Temporal Spatial
Mode 1 Mode 2
Time
Location in bodyCell-cell interaction
(a)
(b)
Heterogeneous population
noisserpxe rekraM
)nietorp ,eneg ,.g.e(
Figure 1. Single-cell multimodal analysis: components and applications. (a) Cellular components of single-cell multimodal analysis. (b)
Applications of single-cell multimodal analysis to molecular cell state, temporal evolution and spatial analysis.
31
or similar protocols, as previously reviewed.9 However,
these methods are laborious and only applicable for small
cell number. New methods are available to isolate single
cells at high throughput, for instance, utilizing cellular
bar codes and unique molecular identifiers [e.g.
microfluidics technology (10x Chromium) or nano plates
(Rhapsody)].9 These methods require demultiplexing of
individual cells which is performed bioinformatically.
While these approaches were first developed to perform
single-cell RNA sequencing (scRNA-seq), more recently
these have been also developed to perform multimodal
analyses. For example, Cellular Indexing of
Transcriptomes and Epitopes by Sequencing (CITE-Seq)10
and AbSeq11 are two technologies which can
simultaneously extract intracellular (surface) protein and
gene expression in the same cell. These technologies have
been used to explore heterogeneous populations in both
healthy and disease samples.10–12 For example, CITE-
Seq10 was applied in combination with 10x Chromium to
identify cord blood mononuclear cells and successfully
identify natural killer cells based on the CD16 and CD56
surface markers, after which gene expression analysis
revealed differentially expressed signatures of natural
killer subtypes between healthy and disease samples,
including cytotoxic markers such as GZMB, GZMK and
PRF1.
Although technologies such as CITE-Seq and AbSeq
allow simultaneous measurements of the surface protein
and gene expression, extracting both the intracellular
protein and gene expression within the same single cell
remains largely unexplored. This is because these
measures require permeabilization of cell membrane
which may result in cell death, thus impairing the
possibility to utilize current approaches for combining
intracellular protein expression quantification with other
modalities, such as scRNA-seq. This roadblock has been
recently addressed by intracellular staining and
sequencing (INs-seq),13 which permits the measurement
of both intracellular protein and mRNA. INs-seq was
applied to several immune subsets, including dendritic
cells, myeloid cells and T cells. For the latter, intracellular
quantification of the transcription factors FOXP3, TCF7
and ID2 in combination with scRNA-seq data revealed
gene modules associated with these transcription factors,
for example, TCF7+ cells had gene modules associated
with na€ıve phenotype (CCR7, SELL and LEF1), whereas
ID2+ cells revealed genes related to cytotoxicity (GNLY,
GZMA/B, PRF1).
Identification of cell state in diseases
Identifying cell states using multimodal analysis can lead
to the discovery of novel correlates of disease, clinical
integrated data sets arising from different samples (addressed in previous reviews1). As summarized in Table 1, we will review recent advances demonstrating the impact of single-cell multimodal analysis in understanding molecular cell state, temporal and spatial location of immune cells (Figure 1b). Finally, we will discuss future research opportunities.
MOLECULAR CELL STATEThe molecular state of an immune cell can be characterized by a combination of modalities from the genome, epigenome, transcriptome and proteome (Figure 1a). A common application of multimodal information is to isolate cells with a certain state using one modality, and then examine the cell state of these isolated cells in another modality. This process is sometimes repeated multiple times at different modalities. For example, surface protein markers have been traditionally used to first isolate or sort cells by fluorescence-activated cell sorting, followed by analysis using gene expression, immune receptors, chromatin accessibility regions or combinations of these modalities. One of the key advantages of single-cell analysis is to dissect the cellular and molecular heterogeneity in a tissue or sample, and even to identify subsets within the same cell type. The identification of cell states using multimodal analysis has been applied to analyze immune cells in healthy and disease, pathogen infection, autoimmune and cancer samples.
Identification of cell state in healthy samples
Single-cell multimodal analysis can be used to isolate cell subsets and characterize their molecular signatures from healthy samples, which can then be used as a baseline reference when comparing with immune cells from disease samples. For example, a recent study explored T-cell composition in lymphoid and nonlymphoid tissues from both healthy humans and mice.8 By combining single-cell gene expression with T-cell receptor (TCR) sequences, this study showed distinctive signatures between regulatory and memory subsets across lymphoid and nonlymphoid tissues, and also similar subsets of regulatory T cells across humans and mice. Unexpectedly, this integrated analysis also revealed that the same T-cell clones (i.e. with identical TCR) could be identified in lymphoid and nonlymphoid samples, thus suggesting migration of regulatory cells between organs.
Single cells can be separated using high-purity fluorescence-activated cell sorting into wells, after which mRNA or DNA is extracted for single-cell analyses. This is the case for plate-based approaches such as Smart-seq2
32
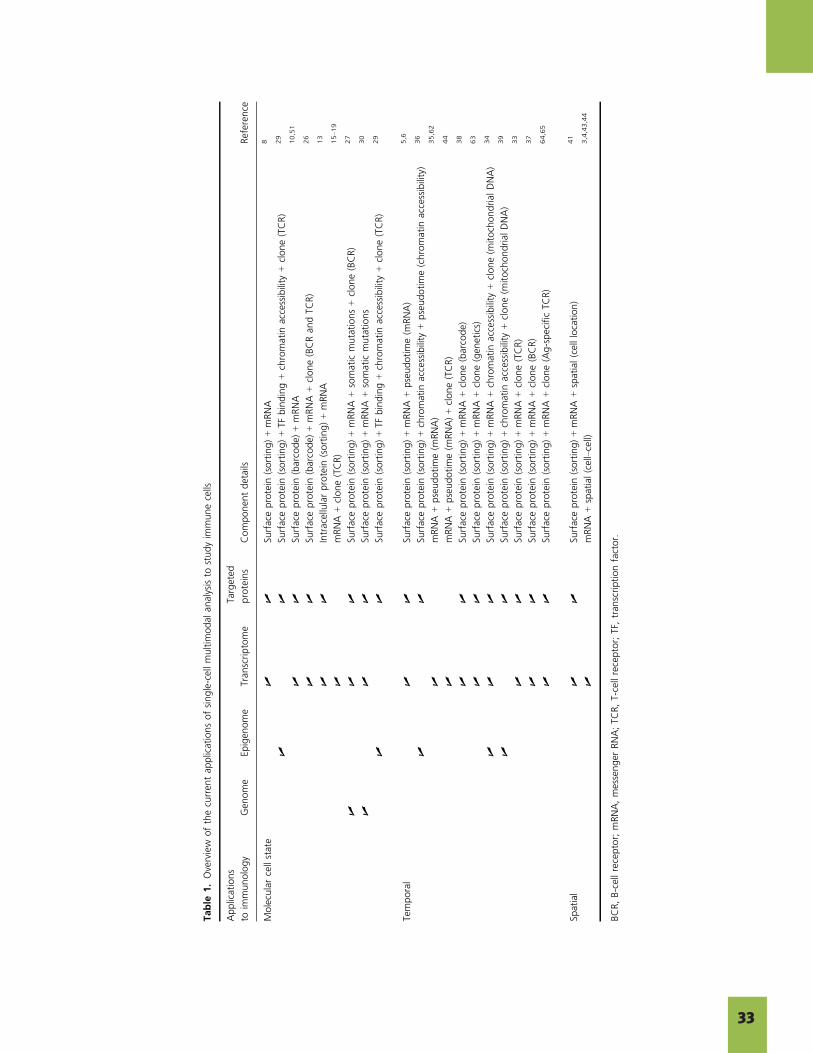
Table
1.Overview
ofthecurren
tap
plicationsofsingle-cellmultim
odal
analysisto
studyim
munecells
Applications
toim
munology
Gen
ome
Epigen
ome
Tran
scriptome
Targeted
proteins
Componen
tdetails
Referen
ce
Molecularcellstate
UU
Surfaceprotein
(sorting)+mRNA
8
UU
Surfaceprotein
(sorting)+TF
binding+chromatin
accessibility
+clone(TCR)
29
UU
Surfaceprotein
(barcode)
+mRNA
10,51
UU
Surfaceprotein
(barcode)
+mRNA
+clone(BCRan
dTC
R)
26
UU
Intracellularprotein
(sorting)+mRNA
13
UmRNA
+clone(TCR)
15–19
UU
USu
rfaceprotein
(sorting)+mRNA
+somatic
mutations+clone(BCR)
27
UU
USu
rfaceprotein
(sorting)+mRNA
+somatic
mutations
30
UU
Surfaceprotein
(sorting)+TF
binding+chromatin
accessibility
+clone(TCR)
29
Temporal
UU
Surfaceprotein
(sorting)+mRNA
+pseudotime(m
RNA)
5,6
UU
Surfaceprotein
(sorting)+chromatin
accessibility
+pseudotime(chromatin
accessibility)
36
UmRNA
+pseudotime(m
RNA)
35,62
UmRNA
+pseudotime(m
RNA)+clone(TCR)
44
UU
Surfaceprotein
(sorting)+mRNA
+clone(barcode)
38
UU
Surfaceprotein
(sorting)+mRNA
+clone(gen
etics)
63
UU
USu
rfaceprotein
(sorting)+mRNA
+chromatin
accessibility
+clone(m
itochondrial
DNA)
34
UU
Surfaceprotein
(sorting)+chromatin
accessibility
+clone(m
itochondrial
DNA)
39
UU
Surfaceprotein
(sorting)+mRNA
+clone(TCR)
33
UU
Surfaceprotein
(sorting)+mRNA
+clone(BCR)
37
UU
Surfaceprotein
(sorting)+mRNA
+clone(Ag-specificTC
R)
64,65
Spatial
UU
Surfaceprotein
(sorting)+mRNA
+spatial(celllocation)
41
UmRNA
+spatial(cell–cell)
3,4,43,44
BCR,B-cellreceptor;mRNA,messenger
RNA;TC
R,T-cellreceptor;TF,tran
scriptionfactor.
33
molecular signatures of influenza-specific CD8+ T cells
across different stages of infection.
The importance of single-cell multimodal analysis has
led to several recent studies of coronavirus disease 2019
(COVID-19). Single-cell analysis of both gene expression
profile and immune receptor sequencing has been also
performed on bronchoalveolar lavage fluids from patients
with mild or severe disease.25 This analysis revealed that
patients with mild COVID-19 disease were characterized
by highly clonally expanded CD8+ T cells, and that
proinflammatory monocyte-derived macrophages were
abundant in the bronchoalveolar lavage fluid from severe
COVID-19 cases. The use of proteomics, gene expression
and clonal information has also been investigated.26 Here,
surface protein using CITE-Seq, in addition to scRNA-seq
and B-cell receptor and TCR information, was used to
investigate the peripheral blood mononuclear cell of
COVID-19 patients. These authors showed that a pre-
exhaustion phenotype in HLA-DR+CD38+-activated T
cells and an anti-inflammatory signature in monocytes
are associated with progressive disease, whereas a TCR
and B-cell receptor analysis revealed a skewed clonal
distribution of CD8+ T- and primary B-cell response.
Single-cell multimodal analyses have been recently
applied for the first time in rare pathogenic B cells secreting
autoantibodies in the context of Sj€ogren syndrome.27 In this
study, B cells were first sorted as CD19+CD27+IgD�
memory cells from patients with Sj€ogren syndrome, to
isolate clonally related cells responsible for autoantibodies
associated with cryoglobulinemic vasculitis. By utilizing
single-cell genome and transcriptome sequencing,28 full-
length gene expression data from each cell were analyzed
with VDJPuzzle22 to reconstruct the full-length heavy and
light chains of immunoglobulin B cell secreting
autoantibodies, thus demonstrating the expansion of a
single “rogue” clone dominating the observed phenotype.
Single-cell DNA was then utilized to identify lymphoma
driver somatic mutations present only within the rogue
clone of autoantibody-forming B cells. This study provided
the first direct evidence that somatic mutations drive loss of
tolerance and disease pathogenesis.
Single-cell multimodal analysis has also been useful to
investigate the epigenetic profile of T-cell subsets and
their clonal expansion in the context of leukemia.29 By
combining assay for transposase-accessible chromatin
using sequencing with TCR sequencing, this study first
identified regulatory elements and transcription factors
associated with each canonical T-cell subset in healthy
donors. Surprisingly, this study found that the epigenetic
profiles of canonical T cell subsets form a continuum of
states, suggesting significant regulatory variability within
cell surface marker-defined subpopulations. By applying
this approach to T cells derived from leukemia patients
parameters and outcome. For example, a study performed proteomic and transcriptomic analysis using CITE-Seq and scRNA-seq from the peripheral blood mononuclear cells of healthy individuals vaccinated with influenza or yellow fever vaccine.14 This analysis revealed a distinctive baseline signature across low and high responders following vaccination. Within each cell type identified by CITE-Seq protein data, gene expression was used to identify significant differences between low and high responders within the plasmacytoid dendritic cell and lymphocyte clusters, suggesting that people who respond well to vaccines have a distinct activation status of cells at baseline (i.e. before vaccination).
Single-cell multimodal analysis has also been utilized to simultaneously study gene expression and clonal expansion of T cells and B cells. For instance, gene expression and immune receptor sequencing from both of these subsets were simultaneously measured from peripheral blood mononuclear cells of patients with metastatic melanoma treated with anti-CTLA-4 and anti-PD-1 immunocheckpoint blockade.15 By employing machine learning techniques, the authors of this study showed that clonally expanded subset of peripheral CD8+
T cells was associated with a long-term treatment response. Single-cell gene expression and immune receptor have also been applied to discover new cell states in cancer such as hepatocellular carcinoma, colorectal cancer and lung cancer,16–18 as well as in tumor infiltrating T cells in the context of novel immunocheckpoint blockade therapies (e.g. in melanoma).19
In the case of viral infections, single-cell multimodal analysis has proven extremely useful in the identification of viral-specific T cells and B cells. These cells are generally found in low numbers within the pool of circulating and resident cells, which pose challenges for their identification and separation for molecular and phenotypic analyses. Single-cell analysis has provided a means to accurately characterize rare cell populations.20 Several teams, including ours, have applied single-cell multimodal analyses to separate viral-specific CD8+ T cells using tetramers and then utilized index sorting and scRNA-seq (Smart-seq2) to simultaneously identify their gene expression and full-length TCR in individuals infected with hepatitis C virus.21,22 These analyses were then used to identify the active and resting subsets within these viral-specific responses, along with their clonal expansion. Similar applications have been also utilized to study chronic HIV infection, for instance, to demonstrate the existence of HIV-specific CD8+ T cells that recognize epitopes within the HLA-II instead of class I23 and influenza-specific CD8+ T cells,24 to reveal evolving
34
HSCs are stem cells derived from the bone marrow
which give rise to myeloid and lymphoid lineages and are
thus a natural starting point to study pseudotime using
single-cell multimodal analysis. Several works have
utilized the natural inherent relationship between HSCs
and differentiated immune cells, to infer the
differentiation trajectories using single-cell genomics. For
instance, differentiation trajectories were obtained from
scRNA-seq data of HSCs from the bone marrow of
mouse,5,6 which revealed three differentiation
trajectories,5 originating from sorted CD48�CD150+
CD45+EPCR+ HSCs, and ending with erythroid,
granulocytes–macrophage and lymphoid progenitors.
Another natural avenue for pseudotime analysis is the
study of T-cell selection in the thymus. In a recent
study,35 transcriptomic data were obtained from
developing and postnatal thymus and postnatal samples
covering the entire period of active thymic function.
Pseudotime values obtained from scRNA-seq revealed
developmental marker genes for different cell types
during T-cell development, such as ST18 for early double
negative, and AQP3 for double positive. The TCR was
also obtained, which revealed that the dependence of
nonproductive on productive recombination events was
associated with different cell types. For example, there
was a higher amount of fully recombined TCRbcompared with nonproductive chains in double-negative
stages that dropped to basal levels as cells entered double-
positive stages, thus demonstrating the impact of thymic
selection on the TCR repertoire.
Although pseudotime trajectories have been mostly
derived from scRNA-seq data, this metric can be also
obtained from other modalities, such as single-cell
chromatin accessibility data. For example, in a recent
study, cellular populations were sorted from CD34+
human bone marrow cells, including myeloid, erythroid
and lymphoid lineages.36 Pseudotime was then generated
from chromatin accessibility data, which showed motif
accessibility dynamics along myeloid cell differentiation.
For example, they showed that accessibility at
transcription factor motifs associated with HOXB8 and
GATA1 was high in HSC and decreased through
differentiation to common myeloid progenitors.
Clonal differentiation
Although trajectory analyses using pseudotime have
provided important insights into cell state differentiation,
these approaches have limitations in revealing the true
cell lineage endpoint. To achieve this goal, novel methods
have been developed which can identify clonal markers in
individual cells, in addition to also measuring “omes”
the authors identified the state of abnormal clones, hence determining the mechanisms driving disease. In a separate study,30 mutations from scRNA-seq data were used to identify and isolate three clones in a bone marrow sample from a patient with acute myeloid leukemia. Gene expression was then used to identify the cell-type compositions of these clones, determining that these clones belonged to progenitor-like, monocyte-like and dendritic cell-like cells.
TEMPORAL ANALYSESAs discussed, multimodal measurements of immune cells can lead to a deeper understanding of the heterogeneity inherent in these immune cells, and the changes that a disease can cause to cell state. However, the molecular state of an immune cell is a dynamic process, from HSC generation in the bone marrow to its differential fate. Single-cell measurements are crucial in obtaining an accurate estimation of this temporal differentiation. This is because bulk samples contain a mixture of cells at various differential stages, thus tracking the average bulk expression across time may not reflect the terminal differential trajectory.31 In order to study the evolving state along a cell lineage, the molecular-state modalities will need to be coupled with temporal modalities. We define temporal modalities as information related to the time ordering of cells during their differentiation process. The ideal scenario would be to obtain measurements of cell states belonging to the same clone at different time points. However, this information is not always available, for instance, from cross-sectional studies. Recent single-cell technologies have attempted to address these issues which have allowed for the study of cell state32 and clonal differentiation.33,34
Molecular cell state differentiation
Numerous algorithms have been proposed to estimate time information for each cell with a metric known as “pseudotime” using either gene expression or chromatin accessibility data.32 This metric describes how a modality changes in a continuous differentiation process along a trajectory. To obtain this trajectory, a dimension reduction step is first performed so that each cell is embedded in a lower dimensional space. A trajectory is then formed in this space, with cells positioned along this trajectory depending on their transcriptional or accessibility profiles.32 Despite pseudotime values being only an estimate of how cell state evolves over time, and clonal information is not known for each cell, numerous immunological discoveries have already been made using this metric, which we will now review.
35
transposase-accessible chromatin using sequencing) to
cultured CD34+ HSCs, collected over the course of
20 days. Mitochondrial DNA was extracted, which
incrementally accumulates genetic mutations passed onto
daughter cells, and subsequently used for lineage tracing.
Combining lineage tracing with chromatin profiles
revealed possible fates of HSPCs, in particular
distinguishing bipotent progenitors from those biased in
favor of an erythroid versus monocytic fate. Lineage
tracing using mitochondrial DNA has also been applied
to study acute myeloid leukemia.39 Clones were first
isolated based on mutations in the mitochondrial DNA
from assay for transposase-accessible chromatin using
sequencing data, taken from primary blood samples of a
patient with acute myeloid leukemia. This allowed new
insights into “preleukemic” HSCs, adding to the evidence
that this cell population is heterogeneous with multiple
clones, and that the lineage giving rise to acute myeloid
leukemia is not the lineage with the optimal potential
among pluripotent HSCs.
SPATIAL ANALYSES AND CELL–CELLCOMMUNICATION
Multimodal applications at the single-cell level have also
been applied to study how molecular-state modalities are
affected by spatial modalities, in particular a cell’s spatial
location within a tissue, and its location relative to other
cells. Technologies which measure spatial location are
becoming increasingly available,40,41 and some of these
have been already applied in immunology. For example,
single-cell spatially resolved transcriptomics was applied
to mice bone marrow niches using an improved version
of laser-capture microdissection coupled with
sequencing.41 This allowed the transcriptional profile of
major bone marrow cell types to be determined, and
their spatial location in distinct bone marrow niches.
This analysis also showed that Cxcl12-abundant-reticular
cell subsets differentially localize to sinusoidal and
arteriolar surfaces and act locally as “professional
cytokine-secreting-cells.”
Some studies have utilized single-cell multiomics to
investigate cell–cell interactions, and recently applied to
COVID-19. For example, cell–cell interaction was
estimated using CellPhoneDB,42 which was applied to
scRNA-seq data obtained from nasopharyngeal and
bronchial samples in patients with moderate or critical
disease.43 This analysis revealed a higher number of
epithelium–immune cell interactions in patients with
critical COVID-19, in particular for CD8+ T cells,
nonresident macrophages and monocyte-derived
macrophages, thus likely contributing to clinical
observations of heighted inflammatory tissue damage.
and temporal information in the same single cell. We will discuss several of these approaches.
The most natural way to track clones in T cells and B cells is by their unique cell receptor. In the context of cellular immunotherapies, such as chimeric antigen receptor (CAR) T cells, single-cell multimodal analysis have been recently applied to study clonality, gene signatures and kinetics. TCRs were used to track CAR-T cells in patients undergoing anti-CD19 CAR-T immunotherapy in leukemia, in order to understand characteristics of clonally expanded CAR-T cells.33 In this study, CAR-T cells were sorted from blood samples from patients with B-cell acute or chronic lymphoblastic leukemia to isolate CD8+ CAR-T cells using a truncated version of the epidermal growth factor receptor, which is coexpressed with the CAR on the T-cell surface. A decrease in TCR diversity was observed after CAR-T infusion, suggesting that CAR-T cells underwent clonal expansion. Gene expression analysis showed clones which increase in frequency after infusion displayed higher expression of cytotoxic genes. Gene expression analysis of the infusion product showed distinct clusters distinguished by expression of activation, cytotoxicity, mitochondrial and cell cycle-associated genes. Tracking clones via their immune receptor has been also applied to autoimmune diseases.37 Transitional IgDlow B cells were first sorted from peripheral blood mononuclear cell collected longitudinally from patients with myasthenia gravis who relapsed after treatment with rituximab, a B-cell-depleting drug. B-cell receptor clones were then isolated using the gene expression data, which were shown to be related to clones identified previously from untreated patients. This then allowed identification of persistent B cells. Clustering using gene expression revealed 820 persistent clones in both memory B-cell and antibody-secreting cell clusters.A recent approach has been to identify clones with
“barcodes,” which can be identified at the single-cell level. This approach has been applied to HSC using a lentiviral delivery system.38 Cells cultured in vitro and cells transplanted in vivo were collected over several days, and then sorted to isolate oligopotent and multipotent progenitor cells using flow cytometric markers. In this study, the early transcriptional signature of HSC was linked to the clonal fates via barcoding. This high-
throughput system allowed mapping of more than 300 000 cells and 10 968 distinct clones, and identified genes correlating with fate, revealing two routes of monocyte differentiation that give rise to distinct subsets in immune compartments.
Another promising approach to track clones is the use of mitochondrial DNA.34 This was performed by applying single-cell chromatin accessibility assay (assay for
36
to identify the target genes which are linked to a
transcription factor, as this can lead to a better
understanding of the molecular network modules that
drive immune-cell lineages and their differentiation. Two
multimodal technologies can potentially address this
issue. The first is thiol(SH)-linked alkylation of the
metabolic sequencing of RNA, which integrates scRNA-
seq with metabolic RNA labeling to provide two
modalities in the transcriptome: total RNA levels and
recently transcribed RNA.47 When combined with
perturbation methods, thiol(SH)-linked alkylation of the
metabolic sequencing of RNA can identify target genes of
transcriptional regulators, as has been shown in cancer
cells.48 Single-nucleus chromatin accessibility and mRNA
expression sequencing can also be used to understand
gene regulation, as this technology provides high-
throughput sequencing of the transcriptome and
chromatin accessibility in the same cell.49 Other advances
can be applied for a different problem of characterizing
molecular cell state, and include those utilizing
transcriptomics (mRNA) as one of its modalities, in
addition to either DNA,50 protein expression,10,51
chromatin accessibility52,53 or DNA methylation.54–57
Lineage tracing of immune cells that do not carry a
natural bar code, such as TCR or B-cell receptor, can also
benefit from recent technologies using synthetic barcodes,
such as CellTagging which uses a lentiviral approach.58
This approach offers advantages over alternate
approaches where gene editing is challenging.58
Despite the rapid increase of single-cell multimodal
approaches, several computational and technical caveats
still need to be addressed for optimal analysis of these
data. For example, the sequencing output maybe too
shallow to identify the immune receptor, and optimal
gene expression requires a deeper coverage to control for
technical noise and drop out of low-expressing genes.59
Similarly, better tools with deeper sequencing are
required for identification of more complex gene
expression quantities, such as isoforms. Multimodal
technologies also carry a substantial level of technical
noise which can blur the true biological variation that
exist,1 for instance, between gene and protein expression,
and are an important area for future work. Finally, a
significant challenge is the development of bioinformatics
tools to permit integration of these data, as recently
reviewed.1
The rapid growth of single-cell multimodal
technologies has also generated debate about the precise
definition of how a “mode” or an “omic” is defined. We
have opted for a broad definition, considering a mode as
any type of information from the same single cell, which
is consistent with a previous definition in a highly cited
review.1 We have thus included temporal and spatial
Both spatial and temporal single-cell multimodal analysis have also been also performed on bronchoalveolar lavage fluid from mild and critical patients.44 TCR clonal information, gene expression and pseudotime analysis revealed that patients with mild COVID-19 were characterized by fully differentiated resident memory T cells undergoing active clonal expansion, whereas in critical COVID-19 patients, these resident memory T cells fail to differentiate or expand. In the same study, the authors also applied CellPhoneDB to show differences in immune cell-type interactions between mild and severe COVID-19. For example, they showed that interactions between monocytes/macrophages and neutrophils almost always involve promigratory interactions in critical COVID-19, but interleukin signaling in mild COVID-19. Other non-COVID applications include those which studied cellular interactions between melanoma and head and neck cancer cells and various immune cells, including T cells and macrophages3 and isolated T-cell subsets from transcriptomics data.4
CONCLUSIONS AND FUTURE DIRECTIONSSingle-cell multimodal technologies have led to exciting discoveries on the mechanisms underpinning the immune system. We have highlighted some of these discoveries, which have provided insight into the molecular state of immune cells, how these states evolve over time and the impact of spatial location. These technologies are becoming increasingly available and easy to apply, as exemplified by the recent publications in the field of COVID-19 research in the last few months.25,26,43,44
These technologies can also be used to answer more general questions, such as quantifying the relationship between transcripts and proteins, or dissecting the landscape of post-translational modifications. In this area, there remains more work to be done, as shown by recent studies investigating promoter accessibility–gene expression45 and gene expression–protein46 correlation. In immunology, there have already been significant advances in the last decade using single-cell multimodal analysis, as we have reviewed. However, despite these achievements, there remains promising avenues to be explored. For example, it is conceivable that with the development of new multimodal technologies, further cellular states which comprise of a combination of modalities across different “omes” will be discovered. Combined with spatial modalities, these cellular states may also be spatially dependent. Other promising avenues will now be discussed.
Novel multimodal technologies are being proposed every year, with some yet to be applied to immune cells. For example, an important and yet unresolved problem is
37

1. Stuart T, Satija R. Integrative single-cell analysis. Nat RevGenet 2019; 20: 257–272.
2. Manno GL, Soldatov R, Zeisel A, et al. RNA velocity ofsingle cells. Nature 2018; 560: 494–498.
3. Ren X, Zhong G, Zhang Q, Zhang L, Sun Y, Zhang Z.Reconstruction of cell spatial organization from single-cellRNA sequencing data based on ligand-receptor mediated.Cell Res 2020; 30: 763–778.
4. Braga FV, Kar G, Berg M, Carpaij O, Polanski K. Acellular census of healthy lung and asthmatic airway wallidentifies novel cell states in health and disease. Nat Med2019; 25: 1153–1163.
5. Nestorowa S, Hamey FK, Pijuan Sala B, et al. A single-cellresolution map of mouse hematopoietic stem andprogenitor cell differentiation. Blood 2016; 128: 20–32.
6. Tikhonova AN, Dolgalev I, Hu H, et al. The bone marrowmicroenvironment at single-cell resolution. Nature 2019;569: 222–228.
7. Macaulay IC, Ponting CP, Voet T. Single-cell multiomics:multiple measurements from single cells. Trends Genet2017; 33: 155–168.
8. Miragaia RJ, Gomes T, Chomka A, et al. Single-celltranscriptomics of regulatory T cells reveals trajectories oftissue adaptation. Immunity 2019; 50: 493–504.
9. Hwang B, Lee JH, Bang D. Single-cell RNA sequencingtechnologies and bioinformatics pipelines. Exp Mol Med2018; 50: 1–14.
10. Stoeckius M, Hafemeister C, Stephenson W, et al.Simultaneous epitope and transcriptome measurement insingle cells. Nat Methods 2017; 14: 865–868.
11. Mair F, Erickson JR, Voillet V, et al. A targeted multi-omic analysis approach measures protein expression andlow-abundance transcripts on the single-cell level. Cell Rep2020; 31: 1–13.
12. Granja JM, Klemm S, McGinnis LM, et al. Single-cellmultiomic analysis identifies regulatory programs in mixed-phenotype acute leukemia. Nat Biotechnol 2019; 37: 1458–1465.
13. Katzenelenbogen Y, Sheban F, Katzenelenbogen Y, et al.Coupled scRNA-Seq and intracellular protein activityreveal an immunosuppressive role of TREM2 in cancer.Cell 2020; 182: 1–14.
14. Kotliarov Y, Sparks R, Martins AJ, et al. Broad immuneactivation underlies shared set point signatures for vaccineresponsiveness in healthy individuals and disease activityin patients with lupus. Nat Med 2020; 26: 618–629.
15. Fairfax BP, Taylor CA, Watson RA, et al. Peripheral CD8+
T cell characteristics associated with durable responses toimmune checkpoint blockade in patients with metastaticmelanoma. Nat Med 2020; 26: 193–199.
16. Zhang Q, He Y, Luo N, et al. Landscape and dynamics ofsingle immune cells in hepatocellular carcinoma. Cell2019; 179: 829–845.
17. Wu TD, Madireddi S, de Almeida PE, et al. Peripheral Tcell expansion predicts tumour infiltration and clinicalresponse. Nature 2020; 579: 274–278.
18. Guo X, Zhang Y, Zheng L, et al. Global characterizationof T cells in non-small-cell lung cancer by single-cellsequencing. Nat Med 2018; 24: 978–985.
19. Sade-Feldman M, Yizhak K, Bjorgaard SL, et al. DefiningT cell states associated with response to checkpointimmunotherapy in melanoma. Cell 2018; 175: 998–1013.
20. Nguyen A, Phan TG. Single cell RNA sequencing of rareimmune cell populations. Front Immunol 2018; 9: 1–11.
information as separate modalities, in addition to different information obtained from the same data set. Temporal and spatial information has also been considered by other authors as its own separate omic or modality.60,61 We envisage that future research in this field will lead to more advanced approaches and methods to better quantify the temporal and spatial modalities of immune cells and converge in adopting a less confusing language, thus increasing the involvement of immunologists in the field of single cell.Single-cell data sets are growing remarkably fast. For
instance, the Human Cell Atlas (https://data.humancellatlas. org), which comprises already approximately 2.7 million cells, and 19.68 TB of data across multiple tissues in both healthy and human diseases. This initiative has already significantly contributed to immunology by providing novel data sets across thymus, spleen and other organs, as well as characterizing novel subsets of lymphocytes and monocytes through development and into adulthood. A major aim of data-gathering initiatives such as the Human Cell Atlas is to increase sample size and permit interrogation of single-cell multimodal data for more complex questions, such as identifying the entire cell composition of the human body, or to predict with machine learning algorithms the clinical outcome in disease. We envisage that single-cell multimodal technologies will pervade basic and translational immunology research and will become a tool to discover mechanisms and new cell states, as well as to mold novel immune therapies to effectively target specific molecular pathways in disease and allow the identification of target cells.
ACKNOWLEDGMENTS
This research was supported by a NHMRC Project grant (APP1121643 to FL). FL is funded by an NHMRC CDA fellowship (APP1128416).
AUTHOR CONTRIBUTIONS
Raymond HY Louie: Conceptualization; Investigation; Writing-original draft; Writing-review & editing. Fabio Luciani: Conceptualization; Investigation; Supervision; Writing-review & editing.
CONFLICT OF INTERESTThe authors declare no conflicts of interest.
REFERENCES
38

21. Eltahla AA, Rizzetto S, Pirozyan MR, et al. Linking the Tcell receptor to the single cell transcriptome in antigen-specific human T cells. Immunol Cell Biol 2016; 94: 604–611.
22. Rizzetto S, Koppstein DNP, Samir J, et al. B-cell receptorreconstruction from single-cell RNA-seq with VDJPuzzle.Bioinformatics 2018; 16: 2846–2847.
23. Ranasinghe S, Lamothe PA, Soghoian DZ, et al. AntiviralCD8+ T Cells restricted by human leukocyte antigen classII exist during natural HIV infection and exhibit clonalexpansion. Immunity 2016; 45: 917–930.
24. Wang Z, Zhu L, Nguyen THO, et al. Clonally diverseCD38+HLA-DR+CD8+ T cells persist during fatal H7N9disease. Nat Commun 2018; 9: 1–12.
25. Liao M, Liu Y, Yuan J, et al. Single-cell landscape ofbronchoalveolar immune cells in patients with COVID-19.Nat Med 2020; 26: 842–844.
26. Unterman A, Sumida TS, Nouri N, et al. Single-cell omicsreveals dyssynchrony of the innate and adaptive immunesystem in progressive COVID-19. medRxiv 2020. https://doi.org/10.1101/2020.07.16.20153437. [Epub ahead ofprint].
27. Singh M, Jackson KJL, Wang JJ, et al. Lymphoma drivermutations in the pathogenic evolution of an iconic humanautoantibody. Cell 2020; 180: 878–894.
28. Macaulay IC, Haerty W, Kumar P, et al. G&T-seq: parallelsequencing of single-cell genomes and transcriptomes. NatMethods 2015; 12: 519–522.
29. Satpathy AT, Saligrama N, Buenrostro JD, et al.Transcript-indexed ATAC-seq for precision immuneprofiling. Nat Med 2018; 24: 580–590.
30. van Galen P, Hovestadt V, Wadsworth MH, et al. Single-cell RNA-Seq reveals AML hierarchies relevant to diseaseprogression and immunity. Cell 2019; 176: 1265–1281.
31. Trapnell C. Defining cell types and states with single-cellgenomics. Genome Res 2015; 25: 1491–1498.
32. Saelens W, Cannoodt R, Todorov H, Saeys Y. Acomparison of single-cell trajectory inference methods.Nat Biotechnol 2019; 37: 547–554.
33. Sheih A, Voillet V, Hana L, et al. Clonal kinetics andsingle-cell transcriptional profiling of CAR-T cells inpatients undergoing CD19 CAR-T immunotherapy. NatCommun 2020; 11: 219.
34. Lareau CA, Ludwig LS, Muus C, et al. Massively parallelsingle-cell mitochondrial DNA genotyping and chromatinprofiling. Nat Biotechnol 2020; https://doi.org/10.1038/s41587-020-0645-6
35. Park JE, Botting RA, Conde CD, et al. A cell atlas ofhuman thymic development defines T cell repertoireformation. Science 2020; 367: eaay3224.
36. Buenrostro JD, Corces MR, Lareau CA, et al. Integratedsingle-cell analysis maps the continuous regulatorylandscape of human hematopoietic differentiation. Cell2018; 173: 1535–1548.
37. Jiang R, Fichtner ML, Hoehn KB, et al. Single-cellrepertoire tracing identifies rituximab-resistant B cellsduring myasthenia gravis relapses. JCI insight 2020; 5:1–18.
38. Weinreb Caleb, Rodriguez-Fraticelli Alejo, CamargoFernando D, Klein AM. Lineage tracing on transcriptionallandscapes links state to fate during differentiation. Science2020; 367: eaaw3381.
39. Xu J, Nuno K, Litzenburger UM, et al. Single-cell lineagetracing by endogenous mutations enriched in transposaseaccessible mitochondrial DNA. Elife 2019; 8: 1–14.
40. Codeluppi S, Borm LE, Zeisel A, et al. Spatial organizationof the somatosensory cortex revealed by osmFISH. NatMethods 2018; 15: 932–935.
41. Baccin C, Al-Sabah J, Velten L, et al. Combined single-celland spatial transcriptomics reveal the molecular, cellularand spatial bone marrow niche organization. Nat Cell Biol2020; 22: 38–48.
42. Efremova M, Vento-Tormo M, Teichmann SA, Vento-Tormo R. Cell PhoneDB: inferring cell–cellcommunication from combined expression of multi-subunit ligand–receptor complexes. Nat Protoc 2020; 15:1484–1506.
43. Chua RL, Lukassen S, Trump S, et al. COVID-19 severitycorrelates with airway epithelium–immune cellinteractions identified by single-cell analysis. NatBiotechnol 2020; 38: 970–979.
44. Wauters E, Van Mol P, Garg A, et al. Discriminating mildfrom critical COVID-19 by innate and adaptive immunesingle-cell profiling of bronchoalveolar lavages. bioRxiv2020. https://doi.org/10.1101/2020.07.09.196519. [Epubahead of print].
45. Starks RR, Biswas A, Jain A, Tuteja G. Combined analysis ofdissimilar promoter accessibility and gene expression profilesidentifies tissue-specific genes and actively repressednetworks. Epigenetics and Chromatin 2019; 12: 1–16.
46. Liu Y, Beyer A, Aebersold R. On the dependency ofcellular protein levels on mRNA abundance. Cell 2016;165: 535–550.
47. Herzog VA, Reichholf B, Neumann T, et al. Thiol-linkedalkylation of RNA to assess expression dynamics. NatMethods 2017; 14: 1198–1204.
48. Muhar M, Ebert A, Neumann T, et al. SLAM-seq definesdirect gene-regulatory functions of the BRD4- MYC axis.Science 2018; 360: 800–805.
49. Chen S, Lake BB, Zhang K. High-throughput sequencingof the transcriptome and chromatin accessibility in thesame cell. Nat Biotechnol 2019; 37: 1452–1457.
50. Dey SS, Kester L, Spanjaard B, Bienko M, VanOudenaarden A. Integrated genome and transcriptomesequencing of the same cell. Nat Biotechnol 2015; 33: 285–289.
51. Shahi P, Kim SC, Haliburton JR, Gartner ZJ, Abate AR.Abseq: Ultrahigh-throughput single cell protein profilingwith droplet microfluidic barcoding. Sci Rep 2017; 7: 1–12.
52. Liu L, Liu C, Quintero A, et al. Deconvolution of single-cell multi-omics layers reveals regulatory heterogeneity.Nat Commun 2019; 10: 1–10.
53. Cao J, Cusanovich DA, Ramani V, et al. Joint profiling ofchromatin accessibility and gene expression in thousandsof single cells. Science 2018; 361: 1380–1385.
39

54. Hu Y, Huang K, An Q, et al. Simultaneous profiling oftranscriptome and DNA methylome from a single cell.Genome Biol 2016; 17: 1–11.
55. Angermueller C, Clark SJ, Lee HJ, et al. Parallel single-cellsequencing links transcriptional and epigeneticheterogeneity. Nat Methods 2016; 13: 229–232.
56. Clark SJ, Argelaguet R, Kapourani CA, et al. ScNMT-seqenables joint profiling of chromatin accessibility DNAmethylation and transcription in single cells. Nat Commun2018; 9: 1–9.
57. Wang Y, Yuan P, Yan Z, et al. Single-cell multiomicssequencing reveals the functional regulatory landscape ofearly embryos. bioRxiv 2019. https://doi.org/10.1101/803890. [Epub ahead of print].
58. Kong W, Biddy BA, Kamimoto K, Amrute JM, Butka EG,Morris SA. Cell Tagging: combinatorial indexing tosimultaneously map lineage and identity at single-cellresolution. Nat Protoc 2020; 15: 750–772.
59. Rizzetto S, Eltahla AA, Lin P, et al. Impact of sequencingdepth and read length on single cell RNA sequencing dataof T cells. Sci Rep 2017; 7: 1–11.
60. Lederer AR, La Manno G. The emergence and promise ofsingle-cell temporal-omics approaches. Curr OpinBiotechnol 2020; 63: 70–78.
61. Bingham GC, Lee F, Naba A, Barker TH. Spatial-omics:Novel approaches to probe cell heterogeneity and extracellularmatrix biology.Matrix Biol 2020; 91–92: 152–166.
62. Schulte-Schrepping J, Reusch N, Paclik D, et al. SevereCOVID-19 is marked by a dysregulated myeloid cellcompartment. Cell 2020; 182: 1–22.
63. Upadhaya S, Sawai CM, Papalexi E, et al. Kinetics of adulthematopoietic stem cell differentiation in vivo. J Exp Med2018; 215: 2815–2832.
64. Yao C, Sun HW, Lacey NE, et al. Single-cell RNA-seqreveals TOX as a key regulator of CD8+ T cell persistencein chronic infection. Nat Immunol 2019; 20: 890–901.
65. Koutsakos M, Illing PT, Nguyen THO, et al. HumanCD8+ T cell cross-reactivity across influenza A, B and Cviruses. Nat Immunol 2019; 20: 613–625.
ª 2021 Australian and New Zealand Society for Immunology, Inc.
40
Genomic Cytometry and New Modalities for DeepSingle-Cell Interrogation
Robert Salomon,1,2* Luciano Martelotto,3 Fatima Valdes-Mora,4,5 David Gallego-Ortega1,4,6
� AbstractIn the past few years, the rapid development of single-cell analysis techniques hasallowed for increasingly in-depth analysis of DNA, RNA, protein, and epigenetic states,at the level of the individual cell. This unprecedented characterization ability has beenenabled through the combination of cytometry, microfluidics, genomics, and informat-ics. Although traditionally discrete, when properly integrated, these fields create thesynergistic field of Genomic Cytometry. In this review, we look at the individualmethods that together gave rise to the broad field of Genomic Cytometry. We furtheroutline the basic concepts that drive the field and provide a framework to understandthis increasingly complex, technology-intensive space. Thus, we introduce GenomicCytometry as an emerging field and propose that synergistic rationalization of dispa-rate modalities of cytometry, microfluidics, genomics, and informatics under onebanner will enable massive leaps forward in the understanding of complex biology.© 2020 International Society for Advancement of Cytometry
� Key termsgenomic cytometry; technology; cytometry; genomicsmicrofluidics; single-cell
THE cell is the basic unit of life and is capable of a vast array of biological complex-ity. In order to understand how different populations of cells can functionally coexistto form organs, organisms, and indeed disease, it is critical to profile all aspects ofthe individual cells. The capability to perform in-depth single-cell analysis has pro-vided us with a more complete understanding of disease, development, and normalfunction. Moreover, the application of single-cell genomic technologies has alreadyidentified many of the molecular features of cell populations within tissues, organs,and diseases.
Techniques that together comprise the field of Genomic Cytometry havealready been used to reveal a fundamental aspect of biology. Most notably, that cellpopulations are more heterogeneous than ever imagined. Each individual cell isunique in terms of space (e.g., physical position in tissues and/or organs), time(e.g., phases of cell cycle, activation or developmental state), and molecular profile.This uniqueness makes understanding the underlying biology a significant challenge.
While in the past, scientists could interrogate, enumerate, and classify cell typesaccording to their appearance under the microscope, this analysis is limited in thenumber of characteristics that can be simultaneously probed, the rate at whichobservations can be made has relied heavily on the individual interpreting the data.Modern flow cytometry emerged to give an additional level of detail to the classifica-tion process. By making use of multi-parameter, multi-laser instruments, flow cyto-metry has redefined cell classification at the molecular level, aided the discovery anddefinition of major and minor cell subsets, and has quickly become an essential toolfor dissecting the functional complexity of cell populations. In general, however, it isprimarily used to identify cellular protein expression profiles and despite being able
1Institute for Biomedical Materials andDevices, The University of TechnologySydney, Ultimo, New South Wales, 2006,Australia2ACRF Child Cancer Liquid Biopsy Program,Children’s Cancer Institute. Lowy CancerResearch Centre, University of New SouthWales (UNSW) Sydney, Randwick, NewSouth Wales, 2031, Australia3Centre for Cancer Research, University ofMelbourne, Parkville, Victoria, Australia4St Vincent’s Clinical School, Faculty ofMedicine, University of New South Wales(UNSW) Sydney, Darlinghurst, New SouthWales, 2010, Australia5Cancer Epigenetic Biology and Therapeutics.Personalised Medicine Theme. Children’sCancer Institute. Lowy Cancer ResearchCentre, University of New South Wales(UNSW) Sydney, Randwick, New SouthWales, 2031, Australia6Tumour Development Lab, The KinghornCancer Centre, Garvan Institute of MedicalResearch, Darlinghurst, New South Wales,2010, Australia
Received 6 November 2019; Revised 28June 2020; Accepted 7 August 2020*Correspondence to: Robert Salomon,Institute for Biomedical Materials andDevices, The University of TechnologySydney, Ultimo New South Wales 2006,Australia Email: [email protected] [email protected]
Published online 5 September 2020 inWiley Online Library(wileyonlinelibrary.com)
DOI: 10.1002/cyto.a.24209
© 2020 International Society forAdvancement of Cytometry
REVIEW ARTICLE
41
to process many millions of cells in a rapid manner, it is alsohampered by limited dimensionality and the inherent loss ofanatomical context.
Limits around fluorochrome uniqueness and detectornumbers result in characterization ability topping out aroundthe 30-parameter mark. In line with advances in fluorescentcytometry and the development of spectral cytometers (1),instruments such as the CYTOF (2) have matured and arenow capable of 40+ parameters (3, 4). While there is somedebate around the benefits and trade-offs associated with theuse of mass cytometry (5), the advent of scanning ablationand ion beam systems (6–8) has helped to bridge the gapbetween imaging and flow cytometry. In doing so, they haveprovided tools that allow 2D reconstruction of tissue sectionssuch that anatomical location of protein expression can beperformed down to the micrometer range. A recent study byKeren et al. has improved this resolution down to 260 nm(9). These imaging systems, however, tend to be much slowerthan traditional cytometry and have their own uniquechallenges.
Given that even the most advanced methods in fluores-cence and mass cytometry are still limited, it is clear that newmethods must emerge to allow deep single-cell characteriza-tion. In order to be widely applicable in biological studies,these systems should provide throughputs similar to currentfluorescent flow cytometric techniques while also providingimproved dimensionality (hundreds to thousands of parame-ters simultaneously). By combining advances in cytometrywith the tools emerging from the field of single-cell genomics,we are entering a new era of Genomic Cytometry. With thetools and workflows being created by today’s emerging geno-mic cytometrists, we now can understand, in a concertedmanner, many aspects of individual cells.
Genomic Cytometry techniques, while focused on thesingle cell, allow us to identify and characterize a group ofsingle cells that share a similar function. The characteristicsable to be probed are no longer limited to protein expressionprofiles, but now include aspects such as DNA, RNA, pro-teins, metabolites, and even epigenetic modifications. Thisunprecedented ability to sensitively interrogate large numbersof individual cells at a reduced cost is accelerating discoveryand challenging existing paradigms in cytometry. Perhapsmore importantly, this technological leap is transforming howwe understand basic and translational biology.
The single-cell multi-omics revolution has fostered a par-allel development of computational approaches, necessary tointegrate and understand the data generated from single-cellgenomic techniques. These methodologies and approacheshave been described elsewhere (10–14). In this review, weanalyze the factors and motivations that have given rise to thefield of Genomic Cytometry. We also provide an overview ofthe tools currently available in this space.
UNRAVELING CELLULAR COMPLEXITY
Cells are complex assemblies of macromolecules andchemicals that function as a single unit during homeostasis,
development, and disease. Currently, there are a multitude ofdifferent tools and methodologies that can be used to charac-terize a cell. These tools can measure the physical characteris-tics of a cell (such as size, deformability, electrical impedance,and density) as well as biochemical aspects such as DNA,RNA, and protein (concentration, monomer composition,and chemical status including mutation, acetylation, phos-phorylation, methylation, etc.). Importantly, emerging toolsare increasingly allowing the simultaneous characterization ofthese parameters. This is known as multi-omics.
Although many aspects of a cell are able to be assessedby traditional cytometry, it has primarily been leveraged tocharacterize protein expression profiles at the level of theindividual cell. From the early advent of fluorescence cyto-metry in the late 1960s (15) and cell sorting in 1965 (16), theunderlying technology has remained relatively static. Instru-ment manufacturers have added additional laser lines andincreased detector numbers in order to improve multiplexedsingle-cell characterization; however, flow cytometry is stillhampered by a lack of spectrally unique fluorochromes.Recent developments in dye technology, particularly aroundtunable polymer-based dyes (17), have allowed flow cyto-metry assays to reach into the 28 color range (18–22). How-ever, if we look at the total cellular complexity, it is clear thateven high dimensional fluorescent flow cytometry is incapableof completely characterizing the full range of cellular identi-ties and cellular states.
To understand the challenge of fully characterizing a sin-gle cell, we must look at the complexity within cells (Table 1).The human genome is composed of 3 billion nitrogenousbases. These are structurally organized into regions that canbe transcribed to RNA and subsequently translated to protein.These regions are known as genes. Although there is still con-jecture around the number of genes (24, 25), studies suggestthat the number of human genes sits somewhere in excess of19,000 (26–29). Of the estimated 19,000 protein-coding genes,it is possible to make many different proteins, some authorssuggest as many as 100 different proteins can be made from
Table 1. Potential complexity of the individual human cell
MEASURABLE CHARACTERISTIC
ESTIMATED OBSERVABLE
NUMBERS
DNA 3,000,000,000 (bases)Epigenetic states
Open chromatin regions(enhancers andpromoters)
100,000–150,000 (peaks)
DNA methylation 25,000 (CpG islands)Three-dimensional genomearchitecture
�7,000,000 (long-rangecontacts) (23)
RNA 19,000 (coding genes)–100,000 (noncodingRNAs)
Proteins >19,000CD markers >400
REVIEW ARTICLE
42

each gene (30). To date, the Human Cell Differentiation Mol-ecule (HCDM) group has defined over 400 cluster of differen-tiation markers (31).
In addition to regions that code for proteins, noncodingregions of the DNA also exist. These regions includeenhancers, insulators, and promoters, which are key for geneexpression regulation and thus important markers of cell-type. Epigenetic mechanisms like DNA methylation, histonepost-translational modifications, expression of noncodingRNAs, three-dimensional, structure and nucleosome position-ing all shape the conformation of the chromatin to regulategene transcription adding an additional layer of complexity tothe characteristics of the cell (32).
COMMON GENOMIC CYTOMETRY APPROACHES
Broadly speaking, it is possible to arrange Genomic Cyto-metry techniques into five main methodology categories.These categories are shown in Figure 1, they are:
1. Plate-based approaches (making use of traditional Fluo-rescent Activated Cell Sorting [FACS]).
2. Microfluidics: (1) Droplet-based microfluidics (aqueousreaction chambers created within an oil-in-water droplet);and (2) solid microfluidics (miniaturized single-cell han-dling tools with associated molecular workflows fordownstream characterization).
3. In situ combinatorial indexing (using the cell as the reac-tion chamber itself).
4. Image-based approaches (making use of direct imagingor spatially traceable barcodes to create high dimensional,anatomically relevant images).
5. Spatial transcriptomics (combining basic imaging withnovel positionally traceable cellular barcodes).
Plate-Based ApproachesPlate-based assays are the most familiar to the traditionalcytometrist and are one of the few high throughput GenomicCytometry methods that currently allow active single-celldeposition. Active cell deposition is usually achieved usingFACS, which allows selective deposition of cells based oncharacteristics measurable by traditional flow cytometrytechniques.
Mechanically, plate sorting is most commonly achievedthrough the use of electrostatic droplet-based cell sorting. Inthese systems, single cells are sequentially flown through aninterrogation point, characterized and deflected into the wellof a microtiter plate. By incorporating a system capable ofmoving the microtiter plate with repeated micron-level accu-racy, it is possible to target individual wells sequentially. Cellsare deposited into 96- or 384-well microtiter plates; however,in some cases higher density plates can be used. In additionto ensuring the target cell is deposited into the correct well,most instruments will allow the operator to control the likeli-hood that (1) a cell is in the deflected drop, (2) more thanone target cell is not deposited, and (3) the nontarget cellcontamination is minimized. For traditional FACS, these arecontrolled through the application of a sort mask and allowthe operator to balance cellular throughput and deflectionaccuracy with the requirements of high-speed cell sorting.
As current cytometers have not yet overcome therandomness of cell arrival times, many cells that meet theselection criteria are not deposited into the sort well. Single-cell masks look at the predicted position of the cell in theindividual drop and will abort the sort if the cell is located ineither the leading or trailing edge of the drop. This meansthat single cells on the periphery of the drop are not deflectedand adds to the cell losses associated with the requirement toabort sort packets that contain coincident events. The abilityto deterministically control cell location with relation to timeand space will remove inefficiencies associated with the Poissondistribution of cells in drops and will result in higher through-put, lower loss single-cell approaches, while still retaining thecharacterization complexity afforded by traditional FACS.
While electrostatic droplet-based FACS is by far themost common method for depositing cells into microtiterplates, emerging technologies such as the CellenONE and theWOLF cell sorters are providing alternatives. Both of thesesystems use a low-pressure microfluidics-based approach andcan thus be used on highly friable cell types that may be sen-sitive to the stresses of traditional FACS. The CellenONE sys-tem is a unique ultra-low volume liquid handler that utilizesan active image-based cell sorting approach to improve celldeposition accuracy while simultaneously minimizing cell loss(sort aborts are simply collected without dilution for subse-quent reanalysis and deposition). Both the WOLF and theCellenONE systems are slow when compared to FACS, andcan only handle limited cell numbers, for this reason, they
Plate based
Dropletmicrofluidic
microfluidicSpatial
Imaging
Solid
In situ
Genomiccytometry
methodologycategories
Figure 1. The main methodology categories that comprise the field of Genomic Cytometry. [Color figure can be viewed at wileyonlinelibrary.com]
REVIEW ARTICLE
43
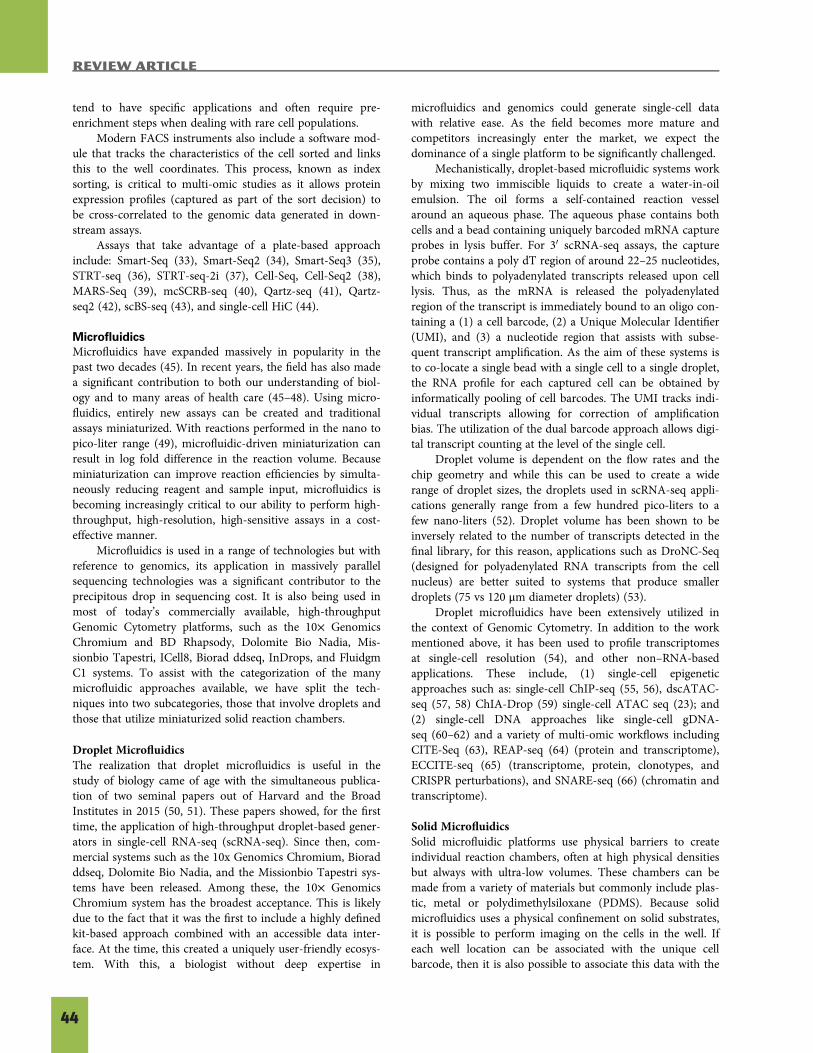
tend to have specific applications and often require pre-enrichment steps when dealing with rare cell populations.
Modern FACS instruments also include a software mod-ule that tracks the characteristics of the cell sorted and linksthis to the well coordinates. This process, known as indexsorting, is critical to multi-omic studies as it allows proteinexpression profiles (captured as part of the sort decision) tobe cross-correlated to the genomic data generated in down-stream assays.
Assays that take advantage of a plate-based approachinclude: Smart-Seq (33), Smart-Seq2 (34), Smart-Seq3 (35),STRT-seq (36), STRT-seq-2i (37), Cell-Seq, Cell-Seq2 (38),MARS-Seq (39), mcSCRB-seq (40), Qartz-seq (41), Qartz-seq2 (42), scBS-seq (43), and single-cell HiC (44).
MicrofluidicsMicrofluidics have expanded massively in popularity in thepast two decades (45). In recent years, the field has also madea significant contribution to both our understanding of biol-ogy and to many areas of health care (45–48). Using micro-fluidics, entirely new assays can be created and traditionalassays miniaturized. With reactions performed in the nano topico-liter range (49), microfluidic-driven miniaturization canresult in log fold difference in the reaction volume. Becauseminiaturization can improve reaction efficiencies by simulta-neously reducing reagent and sample input, microfluidics isbecoming increasingly critical to our ability to perform high-throughput, high-resolution, high-sensitive assays in a cost-effective manner.
Microfluidics is used in a range of technologies but withreference to genomics, its application in massively parallelsequencing technologies was a significant contributor to theprecipitous drop in sequencing cost. It is also being used inmost of today’s commercially available, high-throughputGenomic Cytometry platforms, such as the 10× GenomicsChromium and BD Rhapsody, Dolomite Bio Nadia, Mis-sionbio Tapestri, ICell8, Biorad ddseq, InDrops, and FluidgmC1 systems. To assist with the categorization of the manymicrofluidic approaches available, we have split the tech-niques into two subcategories, those that involve droplets andthose that utilize miniaturized solid reaction chambers.
Droplet MicrofluidicsThe realization that droplet microfluidics is useful in thestudy of biology came of age with the simultaneous publica-tion of two seminal papers out of Harvard and the BroadInstitutes in 2015 (50, 51). These papers showed, for the firsttime, the application of high-throughput droplet-based gener-ators in single-cell RNA-seq (scRNA-seq). Since then, com-mercial systems such as the 10x Genomics Chromium, Bioradddseq, Dolomite Bio Nadia, and the Missionbio Tapestri sys-tems have been released. Among these, the 10× GenomicsChromium system has the broadest acceptance. This is likelydue to the fact that it was the first to include a highly definedkit-based approach combined with an accessible data inter-face. At the time, this created a uniquely user-friendly ecosys-tem. With this, a biologist without deep expertise in
microfluidics and genomics could generate single-cell datawith relative ease. As the field becomes more mature andcompetitors increasingly enter the market, we expect thedominance of a single platform to be significantly challenged.
Mechanistically, droplet-based microfluidic systems workby mixing two immiscible liquids to create a water-in-oilemulsion. The oil forms a self-contained reaction vesselaround an aqueous phase. The aqueous phase contains bothcells and a bead containing uniquely barcoded mRNA captureprobes in lysis buffer. For 30 scRNA-seq assays, the captureprobe contains a poly dT region of around 22–25 nucleotides,which binds to polyadenylated transcripts released upon celllysis. Thus, as the mRNA is released the polyadenylatedregion of the transcript is immediately bound to an oligo con-taining a (1) a cell barcode, (2) a Unique Molecular Identifier(UMI), and (3) a nucleotide region that assists with subse-quent transcript amplification. As the aim of these systems isto co-locate a single bead with a single cell to a single droplet,the RNA profile for each captured cell can be obtained byinformatically pooling of cell barcodes. The UMI tracks indi-vidual transcripts allowing for correction of amplificationbias. The utilization of the dual barcode approach allows digi-tal transcript counting at the level of the single cell.
Droplet volume is dependent on the flow rates and thechip geometry and while this can be used to create a widerange of droplet sizes, the droplets used in scRNA-seq appli-cations generally range from a few hundred pico-liters to afew nano-liters (52). Droplet volume has been shown to beinversely related to the number of transcripts detected in thefinal library, for this reason, applications such as DroNC-Seq(designed for polyadenylated RNA transcripts from the cellnucleus) are better suited to systems that produce smallerdroplets (75 vs 120 μm diameter droplets) (53).
Droplet microfluidics have been extensively utilized inthe context of Genomic Cytometry. In addition to the workmentioned above, it has been used to profile transcriptomesat single-cell resolution (54), and other non–RNA-basedapplications. These include, (1) single-cell epigeneticapproaches such as: single-cell ChIP-seq (55, 56), dscATAC-seq (57, 58) ChIA-Drop (59) single-cell ATAC seq (23); and(2) single-cell DNA approaches like single-cell gDNA-seq (60–62) and a variety of multi-omic workflows includingCITE-Seq (63), REAP-seq (64) (protein and transcriptome),ECCITE-seq (65) (transcriptome, protein, clonotypes, andCRISPR perturbations), and SNARE-seq (66) (chromatin andtranscriptome).
Solid MicrofluidicsSolid microfluidic platforms use physical barriers to createindividual reaction chambers, often at high physical densitiesbut always with ultra-low volumes. These chambers can bemade from a variety of materials but commonly include plas-tic, metal or polydimethylsiloxane (PDMS). Because solidmicrofluidics uses a physical confinement on solid substrates,it is possible to perform imaging on the cells in the well. Ifeach well location can be associated with the unique cellbarcode, then it is also possible to associate this data with the
REVIEW ARTICLE
44

indexing ATAC seq (74), sci-RNA-seq (single-cell combinato-rial indexing RNA sequencing) (75), split-pool ligation-basedtranscriptome sequencing (SPLiT-seq) (76), single-cell combi-natorial indexed sequencing (SCI-seq) (77), sci-CAR (78)single-cell transposome hypersensitive sites sequencing (THS-seq) (79), single-cell DNA methylation (sci-MET) (80),droplet-based sci-ATAC (57), and single-cell Hi-C (Sci-Hi-C)(81). Recently, SplitBio announced commercial release of asingle-cell RNA sequencing kit utilizing in situ combinatorialindexing.
Image-Based ApproachesIn contrast to spatial transcriptomic systems that rely primar-ily on spatially attributable cell barcodes, image-based Geno-mic Cytometry techniques rely on in situ imaging of cells.These systems have been used to directly image the locationof both RNA and protein in tissue sections. Because samplehandling is reduced and solid tissue does not require diges-tion, such systems may provide the most representativemethod to study cellular composition in solid tissues. Exam-ple systems include the Codex and a number of highly multi-plexed fluorescent in situ hybridization (FISH)-basedapproaches.
Highly multiplexed FISH approaches take advantage ofspecially designed probes combined with multiple rounds ofhybridization and imagining to build anatomically localizedtranscript maps on tissue sections. Examples of suchapproaches include MERFISH (82), STAR-map (83), Seq-Fish+ (84), or DNA microscopy (84).
The Codex system (85) can perform high-dimensionalimage-based protein detection with the use of oligo-conjugated antibodies. The system has been adapted for bothslide imaging, super-resolution imaging, and has also beenshown to work with volumetric imaging. By using a series offluorescently labeled bases and relying on the specificity ofcomplementary binding of fluorescently labeled base pairsequence to the oligo attached to the antibody, it is possibleto perform highly multiplexed protein detection in tissue.Codex has been validated in both FFPE and frozen samplesand can detect more than 40 proteins from the sameindividual cell.
Spatial TranscriptomicsSpatial transcriptomic workflows are complicated and requirecomplex bioinformatics pathways. However, they can be sim-plified to a number of key steps, (1) a tissue section is cut,(2) section is laid on a solid imageable surface containingimmobilized region-specific capture probes (these are akin tothe cellular barcode used in other methods), (3) the section isimaged, (4) the sample is then permeabilized, and finally(5) the polyadenylated mRNA is captured by spatial probes.Following this, cDNA is synthesized, libraries are created, andthen sequenced. As the location of the unique oligo sequencefor the capture probe can be traced back to a discrete physicallocation, it is possible to create a single-cell transcriptomiclibrary that retains anatomical information. The resolution ofthe system is governed by both the spot size of the deposited
downstream genomic characterization. Systems that allow this tend to have lower throughput and include the Fluidgm C1™ and ICell8™ systems.
The Fluidgm C1™ system is perhaps the best know solid microfluidics platform. The C1 utilizes an intricate micro-fluidics architecture to provide high-level control of the com-plex molecular reactions required for single-cell analysis. The C1 system has been used in a number of studies characteriz-ing single cells at the level of RNA, DNA, and epigenetic changes (67–69). Despite the systems advanced approach, problems have been identified and care should be taken with its use (70). The ICell8™ system is a commercially miniatur-
ized plate-based system that allows high-density fluid han-dling to achieve microfluidic scale single-cell genomics.
Recently, Becton Dickinson has released a high through-put scRNA-seq system, the BD Rhapsody. It uses a similar approach to the CytoSeq (71) and Seqwell protocols (72). By using a microwell approach, the Rhapsody system can place a single bead in virtually every well and does not expose the cells to the same pressures associated with droplet generation. This may be an important consideration when working with cells highly sensitive to pressure-related stress.
In addition to high recovery rates, Rhapsody workflows also allow both a whole transcriptome as well as a targeted transcriptomics approach. While commercial modifications have occurred, the molecular workflow is similar to that used in many droplet-based scRNA-seq techniques. The targeted scRNA-seq approach, however, is currently unique to the Rhapsody and while it requires a priori knowledge of the sys-tem being interrogated, it allows transcripts of interest to be deeply probed without incurring the high sequencing cost associated with reading common housekeeping and lowly informative transcripts. Depending on the panel, it is possible to obtain the same sequencing saturation, with up to 10 times less sequencing reads than that obtained when using a WTA approach (73).
In Situ Combinatorial IndexingIn situ single-cell methods provide an ingenious way to use the inherent structure of the cell or nuclei as the reaction chamber itself. This is achieved by first fixing the cell using methanol, or beginning with an intact nucleus, and subjecting these to multiple sequential barcoding steps using a split-pool approach. Through successive integration of molecular barcodes into the cell/nucleus itself, in situ combinatorial methods are capable of building up a library of uniquely barcoded single cells. For these methods to work effectively, it is critical to ensure that the number of barcodes that can be created is well in excess of the number of cells/nuclei being labeled. As the total number of barcodes possible is a combi-nation of (1) the number of unique starting oligos and (2) the number of successive split-barcode-pool-split steps, these methods require careful balancing of cell inputs to available barcodes. Failure to do this will result in cells/nuclei sharing the same barcode.
Notable examples of in situ combinatorial approaches include, a 2015 method to perform single-cell combinatorial
REVIEW ARTICLE
45
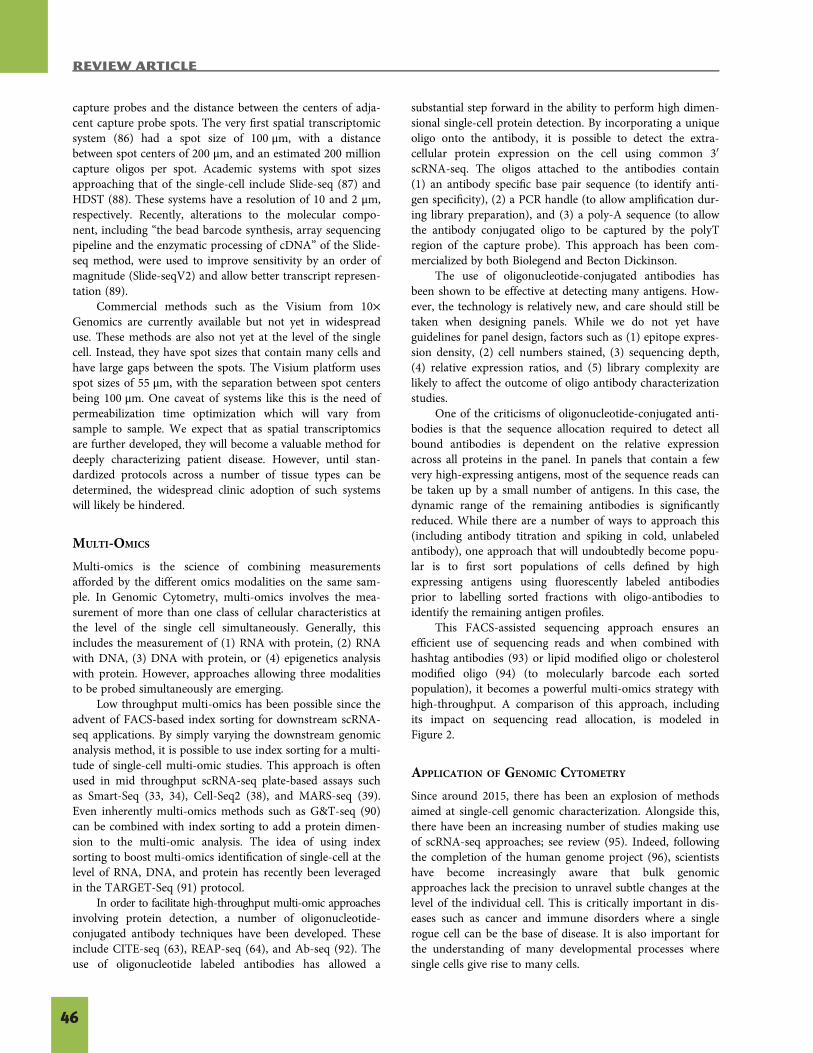
capture probes and the distance between the centers of adja-cent capture probe spots. The very first spatial transcriptomicsystem (86) had a spot size of 100 μm, with a distancebetween spot centers of 200 μm, and an estimated 200 millioncapture oligos per spot. Academic systems with spot sizesapproaching that of the single-cell include Slide-seq (87) andHDST (88). These systems have a resolution of 10 and 2 μm,respectively. Recently, alterations to the molecular compo-nent, including “the bead barcode synthesis, array sequencingpipeline and the enzymatic processing of cDNA” of the Slide-seq method, were used to improve sensitivity by an order ofmagnitude (Slide-seqV2) and allow better transcript represen-tation (89).
Commercial methods such as the Visium from 10×Genomics are currently available but not yet in widespreaduse. These methods are also not yet at the level of the singlecell. Instead, they have spot sizes that contain many cells andhave large gaps between the spots. The Visium platform usesspot sizes of 55 μm, with the separation between spot centersbeing 100 μm. One caveat of systems like this is the need ofpermeabilization time optimization which will vary fromsample to sample. We expect that as spatial transcriptomicsare further developed, they will become a valuable method fordeeply characterizing patient disease. However, until stan-dardized protocols across a number of tissue types can bedetermined, the widespread clinic adoption of such systemswill likely be hindered.
MULTI-OMICS
Multi-omics is the science of combining measurementsafforded by the different omics modalities on the same sam-ple. In Genomic Cytometry, multi-omics involves the mea-surement of more than one class of cellular characteristics atthe level of the single cell simultaneously. Generally, thisincludes the measurement of (1) RNA with protein, (2) RNAwith DNA, (3) DNA with protein, or (4) epigenetics analysiswith protein. However, approaches allowing three modalitiesto be probed simultaneously are emerging.
Low throughput multi-omics has been possible since theadvent of FACS-based index sorting for downstream scRNA-seq applications. By simply varying the downstream genomicanalysis method, it is possible to use index sorting for a multi-tude of single-cell multi-omic studies. This approach is oftenused in mid throughput scRNA-seq plate-based assays suchas Smart-Seq (33, 34), Cell-Seq2 (38), and MARS-seq (39).Even inherently multi-omics methods such as G&T-seq (90)can be combined with index sorting to add a protein dimen-sion to the multi-omic analysis. The idea of using indexsorting to boost multi-omics identification of single-cell at thelevel of RNA, DNA, and protein has recently been leveragedin the TARGET-Seq (91) protocol.
In order to facilitate high-throughput multi-omic approachesinvolving protein detection, a number of oligonucleotide-conjugated antibody techniques have been developed. Theseinclude CITE-seq (63), REAP-seq (64), and Ab-seq (92). Theuse of oligonucleotide labeled antibodies has allowed a
substantial step forward in the ability to perform high dimen-sional single-cell protein detection. By incorporating a uniqueoligo onto the antibody, it is possible to detect the extra-cellular protein expression on the cell using common 30
scRNA-seq. The oligos attached to the antibodies contain(1) an antibody specific base pair sequence (to identify anti-gen specificity), (2) a PCR handle (to allow amplification dur-ing library preparation), and (3) a poly-A sequence (to allowthe antibody conjugated oligo to be captured by the polyTregion of the capture probe). This approach has been com-mercialized by both Biolegend and Becton Dickinson.
The use of oligonucleotide-conjugated antibodies hasbeen shown to be effective at detecting many antigens. How-ever, the technology is relatively new, and care should still betaken when designing panels. While we do not yet haveguidelines for panel design, factors such as (1) epitope expres-sion density, (2) cell numbers stained, (3) sequencing depth,(4) relative expression ratios, and (5) library complexity arelikely to affect the outcome of oligo antibody characterizationstudies.
One of the criticisms of oligonucleotide-conjugated anti-bodies is that the sequence allocation required to detect allbound antibodies is dependent on the relative expressionacross all proteins in the panel. In panels that contain a fewvery high-expressing antigens, most of the sequence reads canbe taken up by a small number of antigens. In this case, thedynamic range of the remaining antibodies is significantlyreduced. While there are a number of ways to approach this(including antibody titration and spiking in cold, unlabeledantibody), one approach that will undoubtedly become popu-lar is to first sort populations of cells defined by highexpressing antigens using fluorescently labeled antibodiesprior to labelling sorted fractions with oligo-antibodies toidentify the remaining antigen profiles.
This FACS-assisted sequencing approach ensures anefficient use of sequencing reads and when combined withhashtag antibodies (93) or lipid modified oligo or cholesterolmodified oligo (94) (to molecularly barcode each sortedpopulation), it becomes a powerful multi-omics strategy withhigh-throughput. A comparison of this approach, includingits impact on sequencing read allocation, is modeled inFigure 2.
APPLICATION OF GENOMIC CYTOMETRY
Since around 2015, there has been an explosion of methodsaimed at single-cell genomic characterization. Alongside this,there have been an increasing number of studies making useof scRNA-seq approaches; see review (95). Indeed, followingthe completion of the human genome project (96), scientistshave become increasingly aware that bulk genomicapproaches lack the precision to unravel subtle changes at thelevel of the individual cell. This is critically important in dis-eases such as cancer and immune disorders where a singlerogue cell can be the base of disease. It is also important forthe understanding of many developmental processes wheresingle cells give rise to many cells.
REVIEW ARTICLE
46
identifying unique cell types. These studies have formed thebasis of the Human Cell Atlas (HCA) project (100). The HCAis a multicenter, international effort aiming to create a databaseof all cell types in the human body using single-cellapproaches. This is an important effort and is the next logicalstep following on from the human genome project. Just as thehuman genome project provides the reference data that hasallowed deep interrogation of the biology associated with geno-mic changes, the completion of the HCA should provide thereference data to allow classification of individual cells fromtheir unique omic signatures. This is particularly important, asmany of the databases that we are currently using to interpretsingle-cell genomic studies are based on bulk genomics.
While there is clear virtue in these types of studies, thisshotgun approach is only designed to provide a fundamental
Figure 2. FACS assisted sequencing provides an efficient and targeted multi-omics approach. (A) A comparison of standard full oligoantibody panel (unbiased) (top), with FACS assisted sequencing (targeted) (bottom) using a combination of fluorescently labeledantibodies (for pre selection of populations) followed by oligo antibody labelling. (B) Read sequencing utilization in a mock panel. Animaginary 30 plex panel was created. The panel consisted of 5 high-expression epitopes, 14 medium-density epitopes, and 11 lowexpressors. To compare the effect of removing the high-expressing antigens from the sequencing run, we compared the relativeproportion of sequencing reads used by each oligo tag under both conditions. Each of the concentric circles in the radar plots indicates asingle percentage of sequencing reads used up by the marker. This model predicts that when highly expressed antigens were removedfrom the oligo antibody panel, it is clear that low-expressing antigens are associated with higher read counts when FACS assistedsequencing was used. [Color figure can be viewed at wileyonlinelibrary.com]
Whole transcriptome analysis, the method used by the majority of scRNA-seq studies to date, allows global profiling of many of the RNA species found in cells in an unbiased manner and without the need of a priori knowledge of the cells or the cell system to be studied. Although single-cell transcriptomic methods are not capable of amplifying every single mRNA, even relatively poorly performing methods are proving capable of accurately identifying many existing and novel cell populations (97). Furthermore, many of the original methodologies are being improved with molecular techniques aimed at increasing transcript detection sensitivity. Notable examples include Chromium V3, Smart-Seq 3, Quartz-Seq2, and Seq-Well S^3 (35, 42, 98, 99).
Early studies have tended to be descriptive efforts, pri-marily aimed at uncovering the cellular heterogeneity and
REVIEW ARTICLE
47

base for more nuanced approaches. The approach required forbiologically directed studies will depend on the (1) biology ofthe system, (2) the questions being asked, (3) the technicalexpertise of the scientists running the experiment, and (4) thefunds available. While the decision of which technology is bestsuited to the biological question being asked is not alwaysstraightforward, we have outlined some of the more commonquestions involved in the decision-making process in Figure 3.
CONCLUSION
As we move into the age of Genomic Cytometry, we are nowlooking to synergistically leverage the modalities of genomics,informatics, microfluidics, and cytometry toward a single aim.To do this, we must develop ways to work in a cross disci-plinary fashion such that microfluidics and FACS-based tech-niques can be seamlessly integrated into molecular workflowsand high-dimensional data analysis frameworks. The combi-nation of these four, traditionally distinct expertise areas, iswhat provides the foundation for the new field of GenomicCytometry.
With Genomic Cytometry, it is possible to study cellularcharacteristics more deeply than ever before. The new tools
emerging to allow RNA-seq, DNA-seq, epigenetic analysis,and protein detection at the level of the single cell will funda-mentally change what we know about biological processesand how quickly we can deeply interrogate complex biologicalsystems. We are beginning to see a systems-based approachthat will allow us to do accurate single-cell multi-omics stud-ies with the sensitivity, efficiency, and cost that means truebiology can be uncovered. This deep characterization is all-owing us to unravel cellular complexity in highly heteroge-neous samples and to find the root cause of disease andunravel the cellular complexity of development. Eventually,we believe it will give us the power to analyze the DNA,RNA, protein, and epigenetic states of individual cells atthroughputs that will rival that of current flow cytometers.
As the field of single-cell genomics matures, and webegin to embrace the broader field of Genomic Cytometry, itwill become increasingly more evident that results fromsingle-cell omics studies will need to be supported and vali-dated by alternate systems. These systems will include tradi-tional imaging, lineage tracing, and fluorescence cytometrymethods. This will create a circle of discovery and validationthat unites the field of genomics and cytometry. For this rea-son, although we envision a dramatic shift in the tools
Figure 3. Flowchart for determining the most suitable Genomic Cytometry method for the biological question. [Color figure can beviewed at wileyonlinelibrary.com]
REVIEW ARTICLE
48

available to the traditional cytometrist, cytometry will stillhold a critical place in the emerging application of single-cellgenomics. It is, for this reason, Genomic Cytometry willbecome the modality of choice for single-cell analysis.
CONFLICT OF INTERESTThe authors declared no potential conflict of interest.
AUTHOR CONTRIBUTIONS
Luciano Martelotto: Conceptualization; writing-review andediting. Fatima Valdes-Mora: Conceptualization; writing-review and editing. David Gallego-Ortega: Conceptualiza-tion; supervision; writing-original draft; writing-review andediting.
LITERATURE CITED
1. Futamura K, Sekino M, Hata A, Ikebuchi R, Nakanishi Y, Egawa G, Kabashima K,Watanabe T, Furuki M, Tomura M. Novel full-spectral flow cytometry with multi-ple spectrally-adjacent fluorescent proteins and fluorochromes and visualization ofin vivo cellular movement. Cytometry A 2015;87(9):830–842.
2. Bendall SC, Simonds EF, Qiu P, Amir el AD, Krutzik PO, Finck R, Bruggner RV,Melamed R, Trejo A, Ornatsky Ol, et al. Single-cell mass cytometry of differentialimmune and drug responses across a human hematopoietic continuum. Science2011;332(6030):687–696.
3. Simoni Y, Chng MHY, Li S, Fehlings M, Newell EW. Mass cytometry: A powerfultool for dissecting the immune landscape. Curr Opin Immunol 2018;51:187–196.
4. Bandura DR, Baranov VI, Ornatsky OI, Antonov A, Kinach R, Lou X, Pavlov S,Vorobiev S, Dick JE, Tanner SD. Mass cytometry: Technique for real time singlecell multitarget immunoassay based on inductively coupled plasma time-of-flightmass spectrometry. Anal Chem 2009;81(16):6813–6822.
5. Bendall SC, Nolan GP, Roederer M, Chattopadhyay PK. A deep profiler’s guide tocytometry. Trends Immunol 2012;33(7):323–332.
6. Angelo M, Bendall SC, Finck R, Hale MB, Hitzman C, Borowsky AD,Levenson RM, Lowe JB, Liu SD, Zhao S, et al. Multiplexed ion beam imaging ofhuman breast tumors. Nat Med 2014;20(4):436–442.
7. Cornett DS, Reyzer ML, Chaurand P, Caprioli RM. MALDI imaging mass spec-trometry: Molecular snapshots of biochemical systems. Nat Methods 2007;4(10):828–833.
8. Schober Y, Guenther S, Spengler B, Rompp A. Single cell matrix-assisted laserdesorption/ionization mass spectrometry imaging. Anal Chem 2012;84(15):6293–6297.
9. Keren L, Bosse M, Thompson S, Risom T, Vijayaragavan K, McCaffrey E,Marquez D, Angoshtari R, Greenwald NF, Fienberg H, et al. MIBI-TOF: A multi-plexed imaging platform relates cellular phenotypes and tissue structure. Sci Adv2019;5(10):eaax5851.
10. Luecken MD, Theis FJ. Current best practices in single-cell RNA-seq analysis: Atutorial. Mol Syst Biol 2019;15(6):e8746.
11. Chen G, Ning B, Shi T. Single-cell RNA-seq technologies and related computa-tional data analysis. Front Genet 2019;10:317.
12. Hwang B, Lee JH, Bang D. Single-cell RNA sequencing technologies and bioinfor-matics pipelines. Exp Mol Med 2018;50(8):96.
13. Huang X, Liu S, Wu L, Jiang M, Hou Y. High throughput single cell RNA sequenc-ing, bioinformatics analysis and applications. Adv Exp Med Biol 2018;1068:33–43.
14. Ji F, Sadreyev RI. Single-cell RNA-seq: Introduction to bioinformatics analysis.Curr Protoc Mol Biol 2019;127(1):e92.
15. Van Dilla MA, Trujillo TT, Mullaney PF, Coulter JR. Cell microfluorometry: Amethod for rapid fluorescence measurement. Science 1969;163(3872):1213–1214.
16. Fulwyler MJ. Electronic separation of biological cells by volume. Science 1965;150(3698):910–911.
17. Chattopadhyay PK, Gaylord B, Palmer A, Jiang N, Raven MA, Lewis G,Reuter MA, Nur-ur Rahman AK, Price DA, Betts MR, et al. Brilliant violetfluorophores: A new class of ultrabright fluorescent compounds for immunofluo-rescence experiments. Cytometry A 2012;81(6):456–466.
18. Nettey L, Giles AJ, Chattopadhyay PK. OMIP-050: A 28-color/30-parameter fluo-rescence flow cytometry panel to enumerate and characterize cells expressing awide array of immune checkpoint molecules. Cytometry A 2018;93(11):1094–1096.
19. Liechti T, Roederer M. OMIP-060-30-parameter flow cytometry panel to assess Tcell effector functions and regulatory T cells. Cytometry A 2019;95:1129–1134.
20. Liechti T, Roederer M. OMIP-051 – 28-color flow cytometry panel to characterizeB cells and myeloid cells. Cytometry A 2019;95(2):150–155.
21. Liechti T, Roederer M. OMIP-058: 30-parameter flow cytometry panel to charac-terize iNKT, NK, unconventional and conventional T cells. Cytometry A 2019;95(9):946–951.
22. Mair F, Prlic M. OMIP-044: 28-color immunophenotyping of the human dendriticcell compartment. Cytometry A 2018;93(4):402–405.
23. Buenrostro JD, Wu B, Litzenburger UM, Ruff D, Gonzales ML, Snyder MP,Chang HY, Greenleaf WJ. Single-cell chromatin accessibility reveals principles ofregulatory variation. Nature 2015;523(7561):486–490.
24. Salzberg SL. Open questions: How many genes do we have? BMC Biol 2018;16(1):94.
25. Willyard C. New human gene tally reignites debate. Nature 2018;558(7710):354–355.
26. Ezkurdia I, Juan D, Rodriguez JM, Frankish A, Diekhans M, Harrow J, Vazquez J,Valencia A, Tress ML. Multiple evidence strands suggest that there may be as fewas 19,000 human protein-coding genes. Hum Mol Genet 2014;23(22):5866–5878.
27. Venter JC, Adams MD, Myers EW, Li PW, Mural RJ, Sutton GG, Smith HO,Yandell M, Evans CA, Holt RA, et al. The sequence of the human genome. Science2001;291(5507):1304–1351.
28. International Human Genome Sequencing Consortium. Finishing the euchromaticsequence of the human genome. Nature 2004;431(7011):931–945.
29. Clamp M, Fry B, Kamal M, Xie X, Cuff J, Lin MF, Kellis M, Lindblad-Toh K,Lander ES. Distinguishing protein-coding and noncoding genes in the humangenome. Proc Natl Acad Sci USA 2007;104(49):19428–19433.
30. Ponomarenko EA, Poverennaya EV, Ilgisonis EV, Pyatnitskiy MA, Kopylov AT,Zgoda VG, Lisitsa AV, Archakov AI. The size of the human proteome: The widthand depth. Int J Anal Chem 2016;2016:7436849.
31. Engel P, Boumsell L, Balderas R, Bensussan A, Gattei V, Horejsi V, Jin BQ,Malavasi F, Mortari F, Schwartz-Albiez R, et al. CD nomenclature 2015: Humanleukocyte differentiation antigen workshops as a driving force in immunology.J Immunol 2015;195(10):4555–4563.
32. Allis CD, Jenuwein T. The molecular hallmarks of epigenetic control. Nat RevGenet 2016;17(8):487–500.
33. Ramskold D, Luo S, Wang YC, Li R, Deng Q, Faridani OR, Daniels GA,Khrebtukova I, Loring JF, Laurent LC, et al. Full-length mRNA-Seq from single-cell levels of RNA and individual circulating tumor cells. Nat Biotechnol 2012;30(8):777–782.
34. Picelli S, Faridani OR, Björklund ÅK, Winberg G, Sagasser S, Sandberg R. Full-length RNA-seq from single cells using Smart-Seq2. Nat Protoc 2014;9(1):171–181.
35. Hagemann-Jensen M, Ziegenhain C, Chen P, Ramsköld D, Hendriks G-J, LarssonAJM, Faridani OR, Sandberg R. Single-cell RNA counting at allele- and isoform-resolution using Smart-Seq3. bioRxiv 2019:817924.
36. Islam S, Kjallquist U, Moliner A, Zajac P, Fan JB, Lonnerberg P, Linnarsson S.Characterization of the single-cell transcriptional landscape by highly multiplexRNA-seq. Genome Res 2011;21(7):1160–1167.
37. Hochgerner H, Lönnerberg P, Hodge R, Mikes J, Heskol A, Hubschle H, Lin P,Picelli S, la Manno G, Ratz M, et al. STRT-seq-2i: Dual-index 50 single cell andnucleus RNA-seq on an addressable microwell array. Sci Rep 2017;7(1):16327.
38. Hashimshony T, Senderovich N, Avital G, Klochendler A, de Leeuw Y, Anavy L,Gennert D, Li S, Livak KJ, Rozenblatt-Rosen O, et al. CEL-Seq2: Sensitive highly-multiplexed single-cell RNA-Seq. Genome Biol 2016;17:77.
39. Jaitin DA, Kenigsberg E, Keren-Shaul H, Elefant N, Paul F, Zaretsky I, Mildner A,Cohen N, Jung S, Tanay A, et al. Massively parallel single-cell RNA-seq formarker-free decomposition of tissues into cell types. Science 2014;343(6172):776–779.
40. Bagnoli JW, Ziegenhain C, Janjic A, Wange LE, Vieth B, Parekh S, Geuder J,Hellmann I, Enard W. Sensitive and powerful single-cell RNA sequencing usingmcSCRB-seq. Nat Commun 2018;9(1):2937.
41. Sasagawa Y, Nikaido I, Hayashi T, Danno H, Uno KD, Imai T, Ueda HR. Quartz-Seq: A highly reproducible and sensitive single-cell RNA sequencing method,reveals non-genetic gene-expression heterogeneity. Genome Biol 2013;14(4):3097.
42. Sasagawa Y, Danno H, Takada H, Ebisawa M, Tanaka K, Hayashi T,Kurisaki A, Nikaido I. Quartz-Seq2: A high-throughput single-cell RNA-sequencingmethod that effectively uses limited sequence reads. Genome Biol 2018;19(1):29.
43. Smallwood SA, Lee HJ, Angermueller C, Krueger F, Saadeh H, Peat J, Andrews SR,Stegle O, Reik W, Kelsey G. Single-cell genome-wide bisulfite sequencing forassessing epigenetic heterogeneity. Nat Methods 2014;11:817–820.
44. Stevens TJ, Lando D, Basu S, Atkinson LP, Cao Y, Lee SF, Leeb M, Wohlfahrt KJ,Boucher W, O’Shaughnessy-Kirwan A, et al. 3D structures of individual mamma-lian genomes studied by single-cell Hi-C. Nature 2017;544:59–64.
45. Sackmann EK, Fulton AL, Beebe DJ. The present and future role of microfluidicsin biomedical research. Nature 2014;507(7491):181–189.
46. Kulasinghe A, Wu H, Punyadeera C, Warkiani ME. The use of microfluidic tech-nology for cancer applications and liquid biopsy. Micromachines (Basel) 2018;9(8):19.
47. Guo MT, Rotem A, Heyman JA, Weitz DA. Droplet microfluidics for high-throughput biological assays. Lab Chip 2012;12(12):2146–2155.
48. Velve-Casquillas G, le Berre M, Piel M, Tran PT. Microfluidic tools for cell biologi-cal research. Nano Today 2010;5(1):28–47.
49. Collins DJ, Neild A, deMello A, Liu AQ, Ai Y. The Poisson distribution andbeyond: Methods for microfluidic droplet production and single cell encapsulation.Lab Chip 2015;15(17):3439–3459.
50. Macosko EZ, Basu A, Satija R, Nemesh J, Shekhar K, Goldman M, Tirosh I,Bialas AR, Kamitaki N, Martersteck EM, et al. Highly parallel genome-wide expres-sion profiling of individual cells using Nanoliter droplets. Cell 2015;161(5):1202–1214.
51. Klein AM, Mazutis L, Akartuna I, Tallapragada N, Veres A, Li V, Peshkin L,Weitz DA, Kirschner MW. Droplet barcoding for single-cell transcriptomicsapplied to embryonic stem cells. Cell 2015;161(5):1187–1201.
52. Salomon R, Kaczorowski D, Valdes-Mora F, Nordon RE, Neild A, Farbehi N,Bartonicek N, Gallego-Ortega D. Droplet-based single cell RNAseq tools: A practi-cal guide. Lab Chip 2019;19:1706–1727.
REVIEW ARTICLE
49
53. Habib N, Avraham-Davidi I, Basu A, Burks T, Shekhar K, Hofree M,Choudhury SR, Aguet F, Gelfand E, Ardlie K, et al. Massively parallel single-nucleus RNA-seq with DroNc-seq. Nat Methods 2017;14(10):955–958.
54. Zheng GX, Terry JM, Belgrader P, Ryvkin P, Bent ZW, Wilson R, Ziraldo SB,Wheeler TD, McDermott GP, Zhu J, et al. Massively parallel digital transcriptionalprofiling of single cells. Nat Commun 2017;8:14049.
55. Rotem A, Ram O, Shoresh N, Sperling RA, Goren A, Weitz DA, Bernstein BE. Sin-gle-cell ChIP-seq reveals cell subpopulations defined by chromatin state. Nat Bio-technol 2015;33(11):1165–1172.
56. Grosselin K, Durand A, Marsolier J, Poitou A, Marangoni E, Nemati F,Dahmani A, Lameiras S, Reyal F, Frenoy O, et al. High-throughput single-cellChIP-seq identifies heterogeneity of chromatin states in breast cancer. Nat Genet2019;51(6):1060–1066.
57. Lareau CA, Duarte FM, Chew JG, Kartha VK, Burkett ZD, Kohlway AS,Pokholok D, Aryee MJ, Steemers FJ, Lebofsky R, et al. Droplet-based combinatorialindexing for massive-scale single-cell chromatin accessibility. Nat Biotechnol 2019;37(8):916–924.
58. Satpathy AT, Granja JM, Yost KE, Qi Y, Meschi F, McDermott GP, Olsen BN,Mumbach MR, Pierce SE, Corces MR, et al. Massively parallel single-cell chroma-tin landscapes of human immune cell development and intratumoral T cell exhaus-tion. Nat Biotechnol 2019;37(8):925–936.
59. Zheng M, Tian SZ, Capurso D, Kim M, Maurya R, Lee B, Piecuch E, Gong L,Zhu JJ, Li Z, et al. Multiplex chromatin interactions with single-molecule precision.Nature 2019;566(7745):558–562.
60. Pellegrino M, Sciambi A, Treusch S, Durruthy-Durruthy R, Gokhale K, Jacob J,Chen TX, Geis JA, Oldham W, Matthews J, et al. High-throughput single-cellDNA sequencing of acute myeloid leukemia tumors with droplet microfluidics.Genome Res 2018;28(9):1345–1352.
61. Velazquez-Villarreal EI, Maheshwari S, Sorenson J, Fiddes IT, Kumar V, Yin Y,Webb M, Catalanotti C, Grigorova M, Edwards PA. Resolving sub-clonal heteroge-neity within cell-line growths by single cell sequencing genomic DNA. bioRxiv2019:757211.
62. Hosokawa M, Nishikawa Y, Kogawa M, Takeyama H. Massively parallel wholegenome amplification for single-cell sequencing using droplet microfluidics. SciRep 2017;7:5199.
63. Stoeckius M, Hafemeister C, Stephenson W, Houck-Loomis B, Chattopadhyay PK,Swerdlow H, Satija R, Smibert P. Simultaneous epitope and transcriptome mea-surement in single cells. Nat Methods 2017;14(9):865.
64. Peterson VM, Zhang KX, Kumar N, Wong J, Li L, Wilson DC, Moore R,McClanahan TK, Sadekova S, Klappenbach JA. Multiplexed quantification of pro-teins and transcripts in single cells. Nat Biotechnol 2017;35(10):936–939.
65. Mimitou EP, Cheng A, Montalbano A, Hao S, Stoeckius M, Legut M, Roush T,Herrera A, Papalexi E, Ouyang Z, et al. Multiplexed detection of proteins, trans-criptomes, clonotypes and CRISPR perturbations in single cells. Nat Methods2019;16(5):409–412.
66. Chen S, Lake BB, Zhang K. Linking transcriptome and chromatin accessibility innanoliter droplets for single-cell sequencing. bioRxiv 2019:692608.
67. Li H, Courtois ET, Sengupta D, Tan Y, Chen KH, Goh JJL, Kong SL, Chua C, HonLK, Tan WS, et al. Reference component analysis of single-cell transcriptomes elu-cidates cellular heterogeneity in human colorectal tumors. Nat Genet 2017;49(5):708–718.
68. Proserpio V, Piccolo A, Haim-Vilmovsky L, Kar G, Lonnberg T, Svensson V,Pramanik J, Natarajan KN, Zhai W, Zhang X, et al. Single-cell analysis of CD4+ T-cell differentiation reveals three major cell states and progressive acceleration ofproliferation. Genome Biol 2016;17:103.
69. Szulwach KE, Chen P, Wang X, Wang J, Weaver LS, Gonzales ML, Sun G, UngerMA, Ramakrishnan R. Single-cell genetic analysis using automated microfluidics toresolve somatic mosaicism. PLoS One 2015;10(8):e0135007.
70. Xin Y, Kim J, Ni M, Wei Y, Okamoto H, Lee J, Adler C, Cavino K, Murphy AJ,Yancopoulos GD, et al. Use of the Fluidigm C1 platform for RNA sequencing ofsingle mouse pancreatic islet cells. Proc Natl Acad Sci USA 2016;113(12):3293–3298.
71. Fan HC, Fu GK, Fodor SP. Expression profiling. Combinatorial labeling of singlecells for gene expression cytometry. Science 2015;347(6222):1258367.
72. Gierahn TM, Wadsworth MH II, Hughes TK, Bryson BD, Butler A, Satija R,Fortune S, Love JC, Shalek AK. Seq-well: Portable, low-cost RNA sequencing ofsingle cells at high throughput. Nat Methods 2017;14(4):395–398.
73. Mair F, Erickson JR, Voillet V, Simoni Y, Bi T, Tyznik AJ, Martin J, Gottardo R, NewellEW, Prlic M. A targeted multi-omic analysis approach measures protein expressionand low abundance transcripts on the single cell level. bioRxiv 2019:700534.
74. Cusanovich DA, Daza R, Adey A, Pliner HA, Christiansen L, Gunderson KL,Steemers FJ, Trapnell C, Shendure J. Multiplex single cell profiling of chromatinaccessibility by combinatorial cellular indexing. Science 2015;348(6237):910–914.
75. Cao J, Packer JS, Ramani V, Cusanovich DA, Huynh C, Daza R, Qiu X, Lee C,Furlan SN, Steemers FJ, et al. Comprehensive single-cell transcriptional profiling ofa multicellular organism. Science 2017;357(6352):661–667.
76. Rosenberg AB, Roco CM, Muscat RA, Kuchina A, Sample P, Yao Z, Graybuck LT,Peeler DJ, Mukherjee S, Chen W, et al. Single-cell profiling of the developing
mouse brain and spinal cord with split-pool barcoding. Science 2018;360(6385):176–182.
77. Vitak SA, Torkenczy KA, Rosenkrantz JL, Fields AJ, Christiansen L, Wong MH,Carbone L, Steemers FJ, Adey A. Sequencing thousands of single-cell genomes withcombinatorial indexing. Nat Methods 2017;14(3):302–308.
78. Cao J, Cusanovich DA, Ramani V, Aghamirzaie D, Pliner HA, Hill AJ, Daza RM,McFaline-Figueroa JL, Packer JS, Christiansen L, et al. Joint profiling of chromatinaccessibility and gene expression in thousands of single cells. Science 2018;361(6409):1380–1385.
79. Lake BB, Chen S, Sos BC, Fan J, Kaeser GE, Yung YC, Duong TE, Gao D, Chun J,Kharchenko PV, et al. Integrative single-cell analysis of transcriptional and epige-netic states in the human adult brain. Nat Biotechnol 2018;36(1):70–80.
80. Mulqueen RM, Pokholok D, Norberg SJ, Torkenczy KA, Fields AJ, Sun D,Sinnamon JR, Shendure J, Trapnell C, O’Roak BJ, et al. Highly scalable generationof DNA methylation profiles in single cells. Nat Biotechnol 2018;36(5):428–431.
81. Ramani V, Deng X, Qiu R, Lee C, Disteche CM, Noble WS, Shendure J, Duan Z.Sci-Hi-C: A single-cell Hi-C method for mapping 3D genome organization in largenumber of single cells. Methods 2019;170:61–68.
82. Chen KH, Boettiger AN, Moffitt JR, Wang S, Zhuang X. RNA imaging. Spatiallyresolved, highly multiplexed RNA profiling in single cells. Science 2015;348(6233):aaa6090.
83. Wang X, Allen WE, Wright MA, Sylwestrak EL, Samusik N, Vesuna S, Evans K,Liu C, Ramakrishnan C, Liu J, et al. Three-dimensional intact-tissue sequencing ofsingle-cell transcriptional states. Science 2018;361(6400):eaat5691.
84. Eng CL, Lawson M, Zhu Q, Dries R, Koulena N, Takei Y, Yun J, Cronin C,Karp C, Yuan GC, et al. Transcriptome-scale super-resolved imaging in tissues byRNA seqFISH. Nature 2019;568(7751):235–239.
85. Goltsev Y, Samusik N, Kennedy-Darling J, Bhate S, Hale M, Vazquez G,Black S, Nolan GP. Deep profiling of mouse splenic architecture with CODEXmultiplexed imaging. Cell 2018;174(4):968–981.e15.
86. Stahl PL, Salmen F, Vickovic S, Lundmark A, Navarro JF, Magnusson J,Giacomello S, Asp M, Westholm JO, Huss M, et al. Visualization and analysis ofgene expression in tissue sections by spatial transcriptomics. Science 2016;353(6294):78–82.
87. Rodriques SG, Stickels RR, Goeva A, Martin CA, Murray E, Vanderburg CR,Welch J, Chen LM, Chen F, Macosko EZ. Slide-seq: A scalable technology for mea-suring genome-wide expression at high spatial resolution. Science 2019;363(6434):1463–1467.
88. Vickovic S, Eraslan G, Salmen F, Klughammer J, Stenbeck L, Schapiro D, Ajio T,Bonneau R, Bergenstrahle L, Navarro JF, et al. High-definition spatial trans-criptomics for in situ tissue profiling. Nat Methods 2019;16(10):987–990.
89. Stickels RR, Murray E, Kumar P, Li J, Marshall JL, Di Bella D, Arlotta P, MacoskoEZ, Chen F. Sensitive spatial genome wide expression profiling at cellular resolu-tion. bioRxiv 2020:2020.03.12.989806.
90. Macaulay IC, Haerty W, Kumar P, Li YI, Hu TX, Teng MJ, Goolam M, Saurat N,Coupland P, Shirley LM, et al. G&T-seq: Parallel sequencing of single-cell genomesand transcriptomes. Nat Methods 2015;12(6):519–522.
91. Rodriguez-Meira A, Buck G, Clark SA, Povinelli BJ, Alcolea V, Louka E,McGowan S, Hamblin A, Sousos N, Barkas N, et al. Unravelling Intratumoral het-erogeneity through high-sensitivity single-cell mutational analysis and parallelRNA sequencing. Mol Cell 2019;73(6):1292.
92. Shahi P, Kim SC, Haliburton JR, Gartner ZJ, Abate AR. Abseq: Ultrahigh-throughput single cell protein profiling with droplet microfluidic barcoding. SciRep 2017;7:44447.
93. Stoeckius M, Zheng S, Houck-Loomis B, Hao S, Yeung BZ, Mauck WM,Smibert P, Satija R. Cell hashing with barcoded antibodies enables multiplexingand doublet detection for single cell genomics. Genome Biol 2018;19(1):224.
94. McGinnis CS, Patterson DM, Winkler J, Conrad DN, Hein MY, Srivastava V,Hu JL, Murrow LM, Weissman JS, Werb Z, et al. MULTI-seq: Sample multiplexingfor single-cell RNA sequencing using lipid-tagged indices. Nat Methods 2019;16(7):619–626.
95. Svensson V, da Veiga Beltrame E, Pachter L. A curated database reveals trends insingle-cell transcriptomics. bioRxiv 2019:742304.
96. Lander ES, Linton LM, Birren B, Nusbaum C, Zody MC, Baldwin J, Devon K,Dewar K, Doyle M, FitzHugh W, et al. Initial sequencing and analysis of thehuman genome. Nature 2001;409(6822):860–921.
97. Mereu E, Lafzi A, Moutinho C, Ziegenhain C, MacCarthy DJ, Alvarez A, Batlle E,Sagar, Grün D, Lau JK, et al. Benchmarking single-cell RNA sequencing protocolsfor cell atlas projects. bioRxiv 2019:630087.
98. Hughes TK, Wadsworth MH, Gierahn TM, Do T, Weiss D, Andrade PR, Ma F, deAndrade Silva BJ, Shao S, Tsoi LC, et al. Highly efficient, massively-parallel single-cell RNA-seq reveals cellular states and molecular features of human skin pathol-ogy. bioRxiv 2019:689273.
99. Ding J, Adiconis X, Simmons SK, Kowalczyk MS, Hession CC, Marjanovic ND,Hughes TK, Wadsworth MH, Burks T, Nguyen LT, et al. Systematic comparativeanalysis of single cell RNA-sequencing methods. bioRxiv 2019:632216.
100. Rozenblatt-Rosen O, Stubbington MJT, Regev A, Teichmann SA. The human cellatlas: From vision to reality. Nature 2017;550(7677):451–453.
REVIEW ARTICLE
50
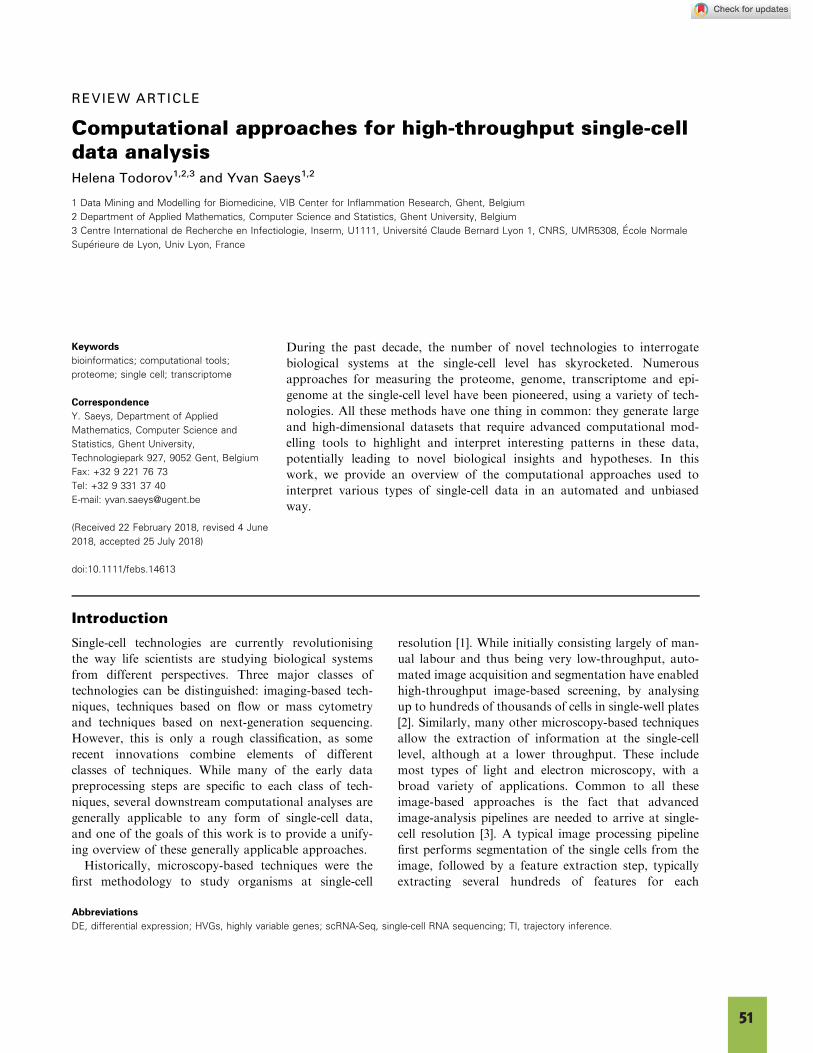
REVIEW ARTICLE
Computational approaches for high-throughput single-celldata analysisHelena Todorov1,2,3 and Yvan Saeys1,2
1 Data Mining and Modelling for Biomedicine, VIB Center for Inflammation Research, Ghent, Belgium
2 Department of Applied Mathematics, Computer Science and Statistics, Ghent University, Belgium
3 Centre International de Recherche en Infectiologie, Inserm, U1111, Universit�e Claude Bernard Lyon 1, CNRS, UMR5308, �Ecole Normale
Sup�erieure de Lyon, Univ Lyon, France
Keywords
bioinformatics; computational tools;
proteome; single cell; transcriptome
Correspondence
Y. Saeys, Department of Applied
Mathematics, Computer Science and
Statistics, Ghent University,
Technologiepark 927, 9052 Gent, Belgium
Fax: +32 9 221 76 73
Tel: +32 9 331 37 40
E-mail: [email protected]
(Received 22 February 2018, revised 4 June
2018, accepted 25 July 2018)
doi:10.1111/febs.14613
During the past decade, the number of novel technologies to interrogate
biological systems at the single-cell level has skyrocketed. Numerous
approaches for measuring the proteome, genome, transcriptome and epi-
genome at the single-cell level have been pioneered, using a variety of tech-
nologies. All these methods have one thing in common: they generate large
and high-dimensional datasets that require advanced computational mod-
elling tools to highlight and interpret interesting patterns in these data,
potentially leading to novel biological insights and hypotheses. In this
work, we provide an overview of the computational approaches used to
interpret various types of single-cell data in an automated and unbiased
way.
Introduction
Single-cell technologies are currently revolutionising
the way life scientists are studying biological systems
from different perspectives. Three major classes of
technologies can be distinguished: imaging-based tech-
niques, techniques based on flow or mass cytometry
and techniques based on next-generation sequencing.
However, this is only a rough classification, as some
recent innovations combine elements of different
classes of techniques. While many of the early data
preprocessing steps are specific to each class of tech-
niques, several downstream computational analyses are
generally applicable to any form of single-cell data,
and one of the goals of this work is to provide a unify-
ing overview of these generally applicable approaches.
Historically, microscopy-based techniques were the
first methodology to study organisms at single-cell
resolution [1]. While initially consisting largely of man-
ual labour and thus being very low-throughput, auto-
mated image acquisition and segmentation have enabled
high-throughput image-based screening, by analysing
up to hundreds of thousands of cells in single-well plates
[2]. Similarly, many other microscopy-based techniques
allow the extraction of information at the single-cell
level, although at a lower throughput. These include
most types of light and electron microscopy, with a
broad variety of applications. Common to all these
image-based approaches is the fact that advanced
image-analysis pipelines are needed to arrive at single-
cell resolution [3]. A typical image processing pipeline
first performs segmentation of the single cells from the
image, followed by a feature extraction step, typically
extracting several hundreds of features for each
Abbreviations
DE, differential expression; HVGs, highly variable genes; scRNA-Seq, single-cell RNA sequencing; TI, trajectory inference.
51

individual cell [4]. In comparison to other single-cell
approaches where cells are dissociated in suspension, a
major advantage of image-based single-cell profiling
methodology is that it inherently provides the user with
two- or three-dimensional spatial information, as know-
ing a cell’s spatial context is often the key to discover
novel biological findings.
Flow cytometry allows profiling and analysing cells
in a high-throughput fashion and is based on passing
cells through a laser beam in a rapidly flowing fluid
stream. This core technology is in essence very similar
to the original design from the late 1960s [5], illustrat-
ing the robustness of the technology [4,6]. The field of
flow cytometry has emerged as a powerful methodol-
ogy for single-cell analysis due to continuous innova-
tions such as (a) multicolour assays enabling the
measurement of a large number of proteins simultane-
ously [7], (b) spectral flow cytometry [8] in which clas-
sical mirrors, optics and detectors are replaced by
dispersive optics and a linear array of detectors allow-
ing highly complex fluorochrome combinations, (c)
imaging flow cytometry [9] combining flow cytometry
and microscopy for high-throughput imaging of single
cells, and (d) acoustic-based focusing and sorting [10].
In addition, other technological advances such as mass
cytometry have replaced the fluorescent labelling and
readout using optics by labelling using heavy isotopes,
and subsequent readout by mass spectrometry [11].
This eliminates the problem of spectral overlap in clas-
sical flow cytometry, allowing the theoretical measure-
ment of up to 100 proteins simultaneously. Mass
cytometry can also be performed on tissue slices,
thereby scanning the tissue spot-by-spot and perform-
ing a single experiment per spot. This approach,
named imaging mass cytometry, allows performing
spatial proteomics in a high-throughput fashion [12].
The ability to measure increasing amounts of proteins
simultaneously [7] complicates the analysis of this type
of data, which can no longer be analysed manually as
was done with datasets containing a few markers per
cell, but needs new computational approaches to cor-
rectly identify cell populations [13].
Recent developments in microvolume sequencing
have led to a new wave of single-cell ‘-omics’ profiling
technologies [14–18], permitting the quantification of
whole genomes, epigenomes and transcriptomes at the
single-cell level. Novel computational tools are being
developed in order to deal with the continuously
increasing dimensionality of these datasets, since a sin-
gle experiment can quantify molecular characteristics
of up to tens of thousands of cells, measuring tens of
thousands of parameters (e.g. transcripts in the case of
single-cell transcriptomics). A high level of resolution
is provided by single-cell omics tools, as they aim to
sequence all of the cell’s content, instead of focusing
on a set of user-defined targets as is done in cytome-
try. This allows performing novel types of analyses,
such as studying the heterogeneity of cell populations
in much greater detail, identifying rare cell types, and
studying the dynamics of cellular systems. Further-
more, the field continues to evolve by combining sin-
gle-cell RNA sequencing with other technologies such
as spatial transcriptomics [19] and CRISPR-mediated
knockout screens (Perturb-Seq [20]/CRISP-seq [21]).
Recent approaches combine transcriptomics with other
types of omics data at a single-cell resolution such as
single-cell proteomics (CITE-seq [22]/REAP-seq [23]),
single-cell genomics (G&T-seq [24]) and single-cell
methylomics (scM&T-seq [25]). These emerging ‘single-
cell multi-omics’ technologies [26] integrate several
types of measurements on the same single cell and are
likely to be part of the everyday methodology of
molecular biologists in the future.
While all techniques described above provide the
user with information at single-cell level, the through-
put, resolution, cost and type of information acquired
differ drastically between technologies. We will take a
computational perspective here, and compare the main
dataset characteristics for the three major classes of
single-cell data introduced above. Classical imaging-
based techniques typically offer a low throughput,
measuring a few hundreds of cells, while more
advanced high-content screening methods allow high-
throughput measurements of hundreds of thousands to
millions of cells. When applying segmentation and fea-
ture extraction, for example using popular pipelines
such as CELLPROFILER [27], almost a thousand image-
derived features can be extracted per cell. However,
many of those capture redundant information and
thus are very correlated. Flow and mass cytometry
allow measuring cells at high throughput, up to mil-
lions of cells for classical flow cytometry. Only a few
tens of parameters can be quantified simultaneously
per single cell, but these parameters often represent
very complementary information, as they are manually
chosen by an expert. Single-cell omics technologies
offer medium throughput, measuring thousands to tens
of thousands of cells in a single run. However, these
data are very rich in information, measuring thousands
of transcripts in the case of single-cell transcriptomics.
While the profiling methodology and dataset charac-
teristics in each of these technologies are very different,
many of the applications and computational workflows
are quite similar. In the remainder of the paper, we
will discuss the differences and commonalities in com-
putational workflows for the different applications.
Computational tools for single-cell data analysis H. Todorov and Y. Saeys
52
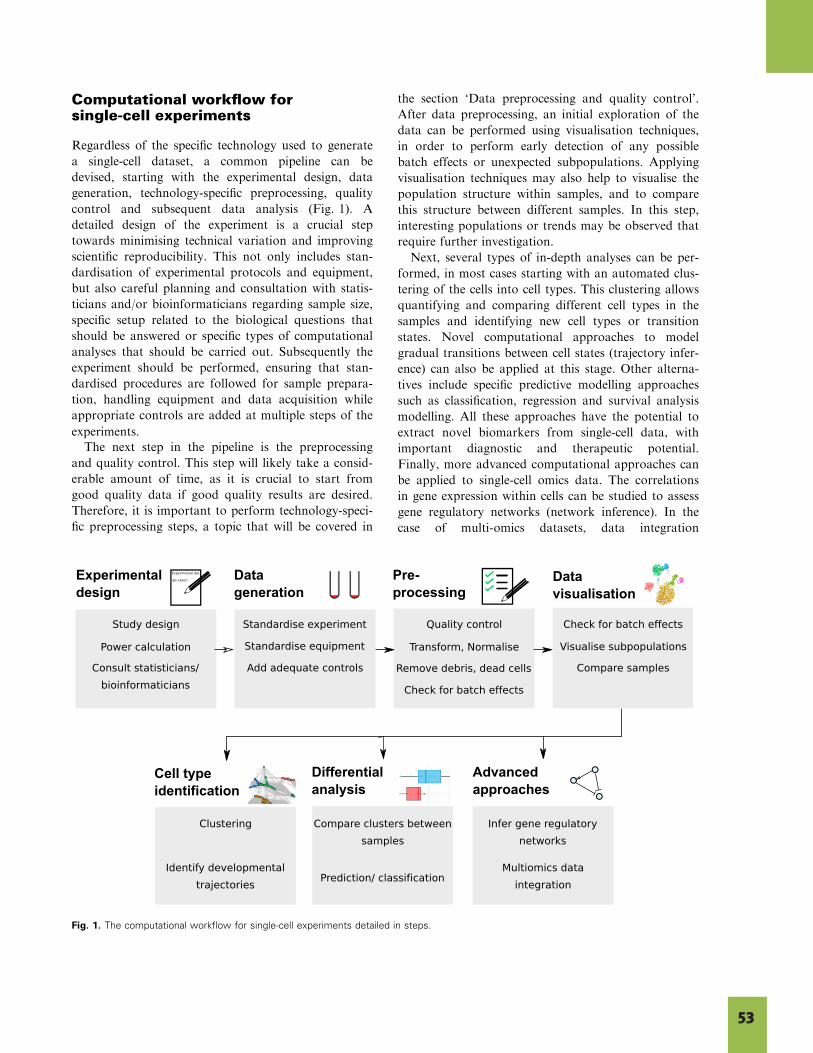
the section ‘Data preprocessing and quality control’.
After data preprocessing, an initial exploration of the
data can be performed using visualisation techniques,
in order to perform early detection of any possible
batch effects or unexpected subpopulations. Applying
visualisation techniques may also help to visualise the
population structure within samples, and to compare
this structure between different samples. In this step,
interesting populations or trends may be observed that
require further investigation.
Next, several types of in-depth analyses can be per-
formed, in most cases starting with an automated clus-
tering of the cells into cell types. This clustering allows
quantifying and comparing different cell types in the
samples and identifying new cell types or transition
states. Novel computational approaches to model
gradual transitions between cell states (trajectory infer-
ence) can also be applied at this stage. Other alterna-
tives include specific predictive modelling approaches
such as classification, regression and survival analysis
modelling. All these approaches have the potential to
extract novel biomarkers from single-cell data, with
important diagnostic and therapeutic potential.
Finally, more advanced computational approaches can
be applied to single-cell omics data. The correlations
in gene expression within cells can be studied to assess
gene regulatory networks (network inference). In the
case of multi-omics datasets, data integration
Fig. 1. The computational workflow for single-cell experiments detailed in steps.
Computational workflow forsingle-cell experiments
Regardless of the specific technology used to generate a single-cell dataset, a common pipeline can be devised, starting with the experimental design, data generation, technology-specific preprocessing, quality control and subsequent data analysis (Fig. 1). A detailed design of the experiment is a crucial step towards minimising technical variation and improving scientific reproducibility. This not only includes stan-dardisation of experimental protocols and equipment, but also careful planning and consultation with statis-ticians and/or bioinformaticians regarding sample size, specific setup related to the biological questions that should be answered or specific types of computational analyses that should be carried out. Subsequently the experiment should be performed, ensuring that stan-dardised procedures are followed for sample prepara-tion, handling equipment and data acquisition while appropriate controls are added at multiple steps of the experiments.
The next step in the pipeline is the preprocessing and quality control. This step will likely take a consid-erable amount of time, as it is crucial to start from good quality data if good quality results are desired. Therefore, it is important to perform technology-speci-fic preprocessing steps, a topic that will be covered in
53
CELLPROFILER has a modular structure that allows the
user to select and configure the individual algorithms
that will be applied, which in turn defines the specific
preprocessing applied and the features that are
obtained at the end of the pipeline. The resulting fea-
tures can later be used for visualisation, clustering or
differential downstream analyses for instance.
Flow/mass cytometry
In conventional flow cytometry, the first preprocessing
step is typically compensation of the spectral overlap,
to correct for spillover of the fluorescent signal into
neighbouring channels. This is typically accounted for
in the experimental procedure, by measuring the fluo-
rescence of single stains in the different channels,
allowing for the calculation of a compensation matrix.
In mass cytometry, this issue is largely avoided by
using rare isotopes instead of light measurements,
although the measurement of certain isotopes can still
be polluted due to metal impurity levels, oxidation and
abundance sensitivity [35]. Mass cytometry panels
should therefore be designed with caution by pairing
strong intensity markers with less sensitive channels in
order to avoid interference between channels [36]. The
data is then transformed through a biexponential or
hyperbolic arcsine transformation, which improves the
separation between negative and positive cells for the
different markers. Fluctuations in measurements can
also be caused by an unsteady flow rate. Typically, up
to 10 000 cells are measured per second at a steady
rate in flow cytometry. Mass cytometry has a slightly
lower throughput, measuring a few thousand cells per
second. However, obstructions in the fluid stream and
manual interventions can disturb the flow, which also
impacts the amount of protein levels measured. To
remove these technical artefacts, the data needs to be
either manually gated against time or screened by tools
such as FLOWCLEAN [37], FLOWQ [38] and FLOWAI [39],
which can automatically identify and remove sections
in which the flow was perturbed.
The acquisition level of cytometers can slightly
change from one day to another, or even within hours.
The use of control tubes to calibrate the machine
before running an experiment can help to make differ-
ent samples more comparable, but batch effects are
often observed between two experiments. The resulting
slight shift in protein expression can be accounted for
manually, by shifting the gates of every sample that
differs, or in an automated way using the FLOWSTATS
[40] package. In mass cytometry, beads are commonly
used in the experiments, allowing normalisation of the
data based on the signal of these beads to have more
approaches can be used to combine the information on single-cell mechanisms.
Data preprocessing and quality control
Single-cell imaging
The preprocessing of single-cell imaging data usually starts by accounting for batch effects through illumina-
tion correction, and image-wise processing such as noise removal, aligning or cropping [28,29]. This pro-cedure is commonly followed by the segmentation of the individual cells within the images, and finally by a feature extraction process that yields a vector of numeric features for each individual cell, usually in a tabular format.
CELLPROFILER [27] is widely used to extract numerical features from two-dimensional microscopy images (such as in high-content screening assays). The main difficulty faced by CELLPROFILER is the segmentation of the cells or objects of interest present in the image. CELLPROFILER contains several fast algorithms that can extract well-separated objects; however, in many cases, these objects appear clumped, hindering their segmen-
tation and making it prone to both false negatives (when the borders between objects cannot be found) and false positives (when the sensitivity of the detec-tion is too high). In order to deal with this difficulty, CELLPROFILER also provides a more complex segmenta-
tion algorithm that follows a hierarchical process: first, it finds primary level objects that are typically well-separated (such as cell nuclei, visible on DNA-stain channels); then, the boundaries of secondary level objects (such as cell edges) are searched around the primary level objects.
However, it is also possible that the primary level objects appear clumped, which is why CELLPROFILER
divides their detection into several steps following the guidelines of previously published algorithms [30–34]. Clumped objects are first detected, segmented and sep-arated by dividing lines, thus avoiding false negatives. Finally, some of the objects are either removed or merged to reduce the false positive rate. Once the pri-mary level objects are properly detected, it becomes simpler to find secondary level objects around them. CELLPROFILER provides an improved algorithm to prop-erly detect the borders even when the objects are clumped against each other. Once the objects have been segmented, multiple features can be extracted from each of them in a per-channel basis (area, shape, intensity, texture, etc.) or at the whole-image level (number of cells, background intensity, etc.).
54
data transformation is then applied to align similar cell
populations, resulting in more consistent datasets that
can be further analysed together.
Several quality control metrics, such as the library
size and the percentage of mitochondrial genes, are
used to filter out abnormal cells, in order to reduce the
technical variance of the data [50]. Additionally, a
great part of intercellular variability can be caused by
the cell cycle, and it is up to the user to decide whether
this variability should be removed from the data or
not. Cyclone [51] is a method that can be used to pre-
dict the cell cycle stage, which can subsequently be
used to either remove cycling cells, or tag them so that
they can be easily identified later in the analysis. F-
scLVM [52] is another algorithm that identifies the
amount of variability across the expression of each
gene that is due to cell cycle differences. It can be used
to infer ‘corrected’ gene expression values, removing
the effect of the cell cycle.
The next step in the process regards the normalisa-
tion of the count data, since a large part of the
observed variability can be due to differences in size,
viability, capturing efficiency and amplification biases
between cells. Some methods aim to standardise the
total number of reads per cell (RPKM [53], TPM [54],
downsampling) or proportions of the total number of
reads per cell (UQ, full quantile [55]). However, these
methods can be seriously impacted by false negative
counts [56]. Indeed, the number of transcripts in a cell
being very low for certain genes, there is a high proba-
bility that these transcripts will be missed, resulting in
a zero count in the final expression data. These missed
transcripts are called dropouts, and lead to a high
technical variance that can affect the final results.
High-throughput scRNA-Seq protocols typically show
higher dropout rates [43], but high amounts of
sequenced cells can help to infer dropout probabilities.
ZIFA [57] is a method which identifies zero counts
that are most likely resulting from dropout events, and
gives less weight to these counts. ZINB-WAVE [58] is
another method which not only assesses the probabil-
ity for a zero to be a dropout based on the sequencing
depth, but also accounts for batch effects between
samples, and computes global-scaling normalisation
factors, which allow it to be used directly on non-
normalised data.
Some methods rely on spike-ins to distinguish techni-
cal variability from biologically relevant changes in
gene expression [59] (BASICS [60], GRM [61], SAMSTRT
[62]). Spike-ins are control RNA transcripts which are
added in the same quantity to all the samples to be
sequenced. They can be used to normalise the data,
as all cells should have exactly the same amount of
comparable samples. Some markers can also be used to barcode cells, and then pool several samples together, to avoid technical bias between different experimental conditions. When performing experi-
ments on different days, it may be advisable to include additional control samples, such as an aliquot from the same sample that is taken along all different exper-iment days, in order to allow normalisation between experiment days later on. Once batch effects have been accounted for, debris, doublets and other low quality cells can be removed either by manual gating or using OPENCYTO [41], or FLOWDENSITY [42].
As flow cytometry allows the measurement of pro-teins at the single-cell level while preserving the integ-rity of the cells, it is sometimes used to sort specific cells into wells before sequencing their transcriptome. The cells can either be sorted by cell population, based on a set of common markers, or index-sorted, in which case single cells are sorted into wells and barcoded, so that their protein expression profile is kept. In this case, doublets and empty wells might occur, which should be carefully removed from the analysis before any further processing step.
Single-cell omics
Preprocessing single-cell omics data based on NGS technologies further builds on the wide availability of NGS preprocessing tools that are already available from experiments on bulk RNA or DNA. However, single-cell omics technologies lead to a number of additional challenges when going through the process from the individual reads to the mapped genomes or transcriptomes. We will focus here more specifically on methods for single-cell transcriptomics, as this is the most widely used type of single-cell omics data at pre-sent. Several scRNA-Seq protocols were developed, usually focusing either on sequencing a large number of cells, or a high amount of genes at an increased sequencing depth [43]. Due to the low amount of tran-scripts in the cells, scRNA-Seq data usually contain a lot of technical variance, requiring specific computa-
tional tools to perform quality control, normalisation and downstream analyses [44–47].
When performing a computational analysis on scRNA-Seq data coming from multiple experiments, batch effects can arise, leading to an increased interex-perimental variability. Two recently published algo-rithms can be used in order to reduce batch effects. These algorithms either identify a gene correlation structure [48], or a subset of cells coming from the same population [49], that are shared between the datasets coming from different experiments. Proper
55
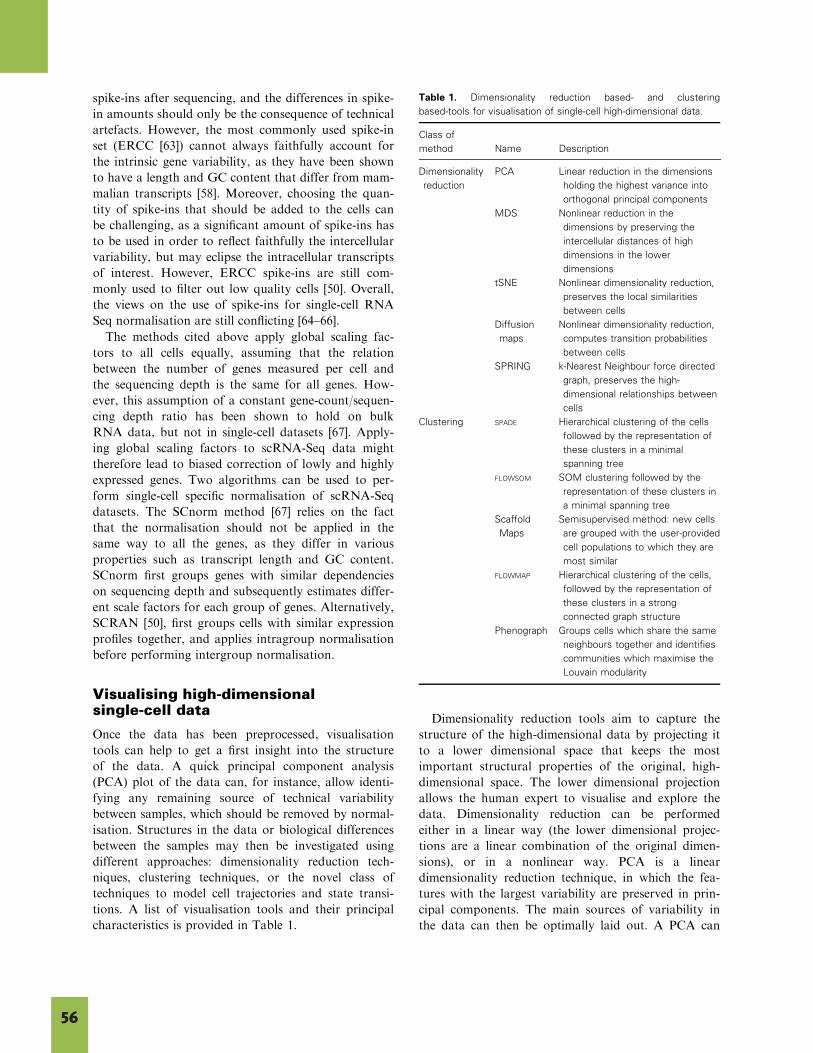
Dimensionality reduction tools aim to capture the
structure of the high-dimensional data by projecting it
to a lower dimensional space that keeps the most
important structural properties of the original, high-
dimensional space. The lower dimensional projection
allows the human expert to visualise and explore the
data. Dimensionality reduction can be performed
either in a linear way (the lower dimensional projec-
tions are a linear combination of the original dimen-
sions), or in a nonlinear way. PCA is a linear
dimensionality reduction technique, in which the fea-
tures with the largest variability are preserved in prin-
cipal components. The main sources of variability in
the data can then be optimally laid out. A PCA can
Table 1. Dimensionality reduction based- and clustering
based-tools for visualisation of single-cell high-dimensional data.
Class of
method Name Description
Dimensionality
reduction
PCA Linear reduction in the dimensions
holding the highest variance into
orthogonal principal components
MDS Nonlinear reduction in the
dimensions by preserving the
intercellular distances of high
dimensions in the lower
dimensions
tSNE Nonlinear dimensionality reduction,
preserves the local similarities
between cells
Diffusion
maps
Nonlinear dimensionality reduction,
computes transition probabilities
between cells
SPRING k-Nearest Neighbour force directed
graph, preserves the high-
dimensional relationships between
cells
Clustering SPADE Hierarchical clustering of the cells
followed by the representation of
these clusters in a minimal
spanning tree
FLOWSOM SOM clustering followed by the
representation of these clusters in
a minimal spanning tree
Scaffold
Maps
Semisupervised method: new cells
are grouped with the user-provided
cell populations to which they are
most similar
FLOWMAP Hierarchical clustering of the cells,
followed by the representation of
these clusters in a strong
connected graph structure
Phenograph Groups cells which share the same
neighbours together and identifies
communities which maximise the
Louvain modularity
spike-ins after sequencing, and the differences in spike-in amounts should only be the consequence of technical artefacts. However, the most commonly used spike-in set (ERCC [63]) cannot always faithfully account for the intrinsic gene variability, as they have been shown to have a length and GC content that differ from mam-
malian transcripts [58]. Moreover, choosing the quan-tity of spike-ins that should be added to the cells can be challenging, as a significant amount of spike-ins has to be used in order to reflect faithfully the intercellular variability, but may eclipse the intracellular transcripts of interest. However, ERCC spike-ins are still com-
monly used to filter out low quality cells [50]. Overall, the views on the use of spike-ins for single-cell RNA Seq normalisation are still conflicting [64–66].The methods cited above apply global scaling fac-
tors to all cells equally, assuming that the relation between the number of genes measured per cell and the sequencing depth is the same for all genes. How-
ever, this assumption of a constant gene-count/sequen-cing depth ratio has been shown to hold on bulk RNA data, but not in single-cell datasets [67]. Apply-
ing global scaling factors to scRNA-Seq data might therefore lead to biased correction of lowly and highly expressed genes. Two algorithms can be used to per-form single-cell specific normalisation of scRNA-Seq datasets. The SCnorm method [67] relies on the fact that the normalisation should not be applied in the same way to all the genes, as they differ in various properties such as transcript length and GC content. SCnorm first groups genes with similar dependencies on sequencing depth and subsequently estimates differ-ent scale factors for each group of genes. Alternatively, SCRAN [50], first groups cells with similar expression profiles together, and applies intragroup normalisation before performing intergroup normalisation.
Visualising high-dimensionalsingle-cell dataOnce the data has been preprocessed, visualisation tools can help to get a first insight into the structure of the data. A quick principal component analysis (PCA) plot of the data can, for instance, allow identi-fying any remaining source of technical variability between samples, which should be removed by normal-
isation. Structures in the data or biological differences between the samples may then be investigated using different approaches: dimensionality reduction tech-
niques, clustering techniques, or the novel class of techniques to model cell trajectories and state transi-tions. A list of visualisation tools and their principal characteristics is provided in Table 1.
56

[50,78], which considerably reduces the number of fea-
tures and the noise they contain, while preserving the
main biologically relevant sources of variability.
Another algorithm was implemented in the SEURAT R
package [79] to filter HVGs. Visualisation, clustering
or any downstream analysis algorithms can then be
applied either to the HVGs, or, if the dimensions of
the data are still too high, on the principal compo-
nents of a PCA run on these HVGs.
In order to highlight the differences between the dif-
ferent methods cited above, we applied two dimension-
ality reduction tools (PCA and tSNE) and two
clustering-based tool (FLOWSOM, Phenograph) on a
publicly available scRNA-Seq dataset [16] of 3000
peripheral blood mononuclear cells (PBMCs) from the
10X Genomics platform (Fig. 2). We first preprocessed
the dataset as described in the data preprocessing sec-
tion by filtering out low quality cells and genes. We
then selected the most highly variable genes, to which
we applied the different visualisation methods. This fil-
tering on highly variable genes has two advantages. It
significantly reduces the size of the dataset, therefore
reducing the analysis time, and it helps to focus on the
genes that are driving heterogeneity across cells [50].
The PBMC dataset had previously been expert-labelled
in the Seurat R pipeline [79], which allowed us to use
the cell identities to simplify the comparison of the
outputs from the different methods. The different
methods provided complementary information on the
structure of the data. For instance, all methods except
PCA identified the rare megakaryocyte cell population,
and all methods except FlowSOM represented these
megakaryocyes close to the monocyte cell population.
As a general guideline, it is often advisable to apply
several techniques in parallel to acquire a deeper
understanding of the data structure.
Cell type identification
While the clustering approach to single-cell analysis
assumes that cells are forming well separated groups,
other types of techniques focus on better detecting
cells that are in transition between cell states. In the
first case, the expression of certain markers is expected
to differ drastically, providing hard separations
between cell populations. In the second case, the mark-
ers are seen as continuous variables which smoothly
change from one cell to another, leading to structural
patterns in the data which can be seen as developmen-
tal trajectories (Fig. 3). The choice between the two
sets of methods depends on the biological question,
but a good practice can be to first apply a clustering
algorithm to identify the main populations in the data,
therefore be applied to check for batch effects in the data, or to identify any main source of variability. The use of nonlinear dimensionality reduction methods (e.g. tSNE [t-stochastic neighbour embedding, 68], MDS [multidimensional scaling, 69], diffusion maps [70], SPRING [71]) allows optimal plotting of the data in two dimensions while preserving the local similari-
ties between cells.Clustering-based visualisation methods group similar
cells together and may be combined with a subsequent visualisation step, for example by laying out the result-ing clusters in two dimensions. This reduces computa-
tion time and can simplify the understanding of the resulting plot. Several methods have been proposed for the visualisation of clusters in single-cell data (SPADE
[Spanning-tree Progression Analysis of Density-
normalized Events] [72], FLOWSOM [73], FLOWMAP [74]). These methods represent the clusters under the form of a graph in which the most similar clusters are linked by an edge. FLOWSOM also allows performing meta-
clustering, grouping clusters into larger populations, which has shown to return results very similar to man-
ual labelling of cytometry data [75]. Single-Cell Analy-
sis by Fixed Force- and Landmark-Directed (Scaffold) maps [76] were specifically designed to simplify the identification of user defined cell populations in cytom-
etry data. Finally, Phenograph [77] identifies closely linked communities of cells in a graph structure. This algorithm therefore identifies populations without any previous knowledge on the number of expected popu-lations, which can be very useful in discovery studies. While most of these methods were initially developed for flow cytometry data, FlowSOM and Phenograph are scalable to high dimensional datasets. These meth-
ods can therefore be applied to mass cytometry and scRNA-Seq datasets, or to features extracted from images, allowing the visualisation of structure in the data.
However, scRNA-Seq and image derived data typi-cally contain much more dimensions than the usual 10–30 colour panels used in cytometry. When dealing with features extracted from images, a first step can consist in performing principal component analysis, which will help to reduce the redundancy of these highly correlated features. One can then choose to work with the principal components containing 95%of the data variability. These principal components can be analysed as new features, using visualisation or clustering techniques. scRNA-Seq datasets tend to contain noise which might bias clustering studies, espe-cially due to the high amount of lowly expressed genes and dropouts. Therefore, the highly variable genes (HVGs) can first be filtered on this type of data
57
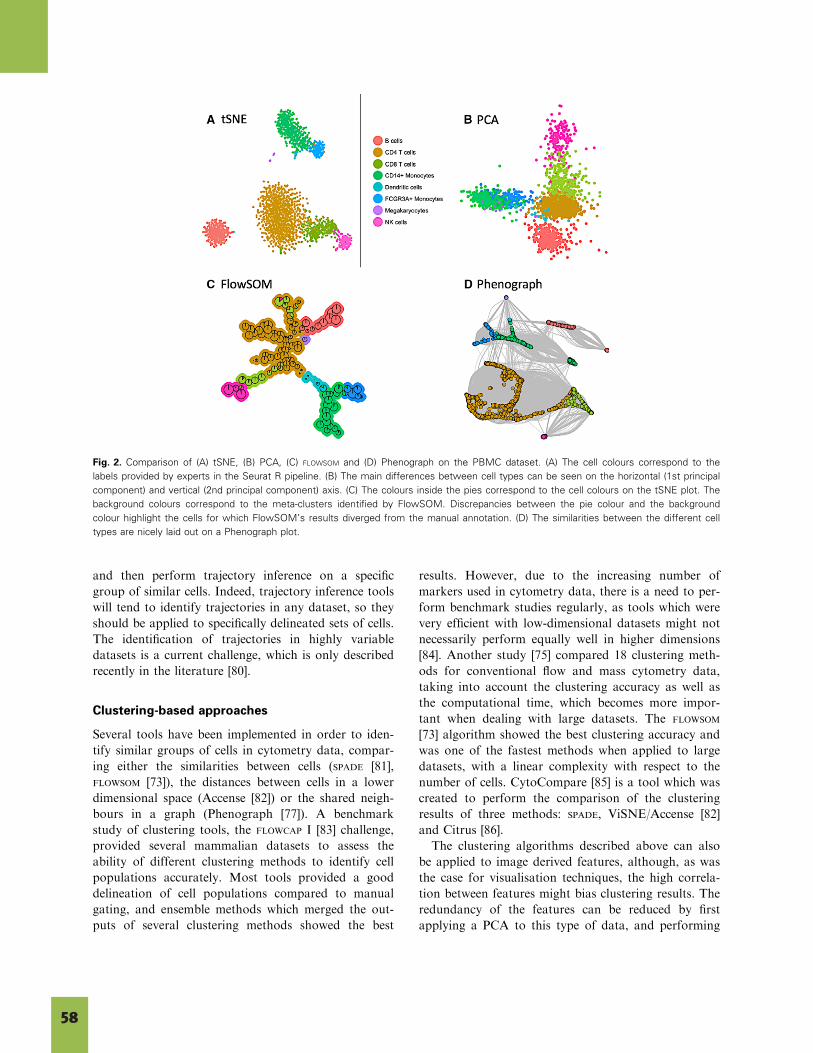
and then perform trajectory inference on a specific
group of similar cells. Indeed, trajectory inference tools
will tend to identify trajectories in any dataset, so they
should be applied to specifically delineated sets of cells.
The identification of trajectories in highly variable
datasets is a current challenge, which is only described
recently in the literature [80].
Clustering-based approaches
Several tools have been implemented in order to iden-
tify similar groups of cells in cytometry data, compar-
ing either the similarities between cells (SPADE [81],
FLOWSOM [73]), the distances between cells in a lower
dimensional space (Accense [82]) or the shared neigh-
bours in a graph (Phenograph [77]). A benchmark
study of clustering tools, the FLOWCAP I [83] challenge,
provided several mammalian datasets to assess the
ability of different clustering methods to identify cell
populations accurately. Most tools provided a good
delineation of cell populations compared to manual
gating, and ensemble methods which merged the out-
puts of several clustering methods showed the best
results. However, due to the increasing number of
markers used in cytometry data, there is a need to per-
form benchmark studies regularly, as tools which were
very efficient with low-dimensional datasets might not
necessarily perform equally well in higher dimensions
[84]. Another study [75] compared 18 clustering meth-
ods for conventional flow and mass cytometry data,
taking into account the clustering accuracy as well as
the computational time, which becomes more impor-
tant when dealing with large datasets. The FLOWSOM
[73] algorithm showed the best clustering accuracy and
was one of the fastest methods when applied to large
datasets, with a linear complexity with respect to the
number of cells. CytoCompare [85] is a tool which was
created to perform the comparison of the clustering
results of three methods: SPADE, ViSNE/Accense [82]
and Citrus [86].
The clustering algorithms described above can also
be applied to image derived features, although, as was
the case for visualisation techniques, the high correla-
tion between features might bias clustering results. The
redundancy of the features can be reduced by first
applying a PCA to this type of data, and performing
Fig. 2. Comparison of (A) tSNE, (B) PCA, (C) FLOWSOM and (D) Phenograph on the PBMC dataset. (A) The cell colours correspond to the
labels provided by experts in the Seurat R pipeline. (B) The main differences between cell types can be seen on the horizontal (1st principal
component) and vertical (2nd principal component) axis. (C) The colours inside the pies correspond to the cell colours on the tSNE plot. The
background colours correspond to the meta-clusters identified by FlowSOM. Discrepancies between the pie colour and the background
colour highlight the cells for which FlowSOM’s results diverged from the manual annotation. (D) The similarities between the different cell
types are nicely laid out on a Phenograph plot.
58
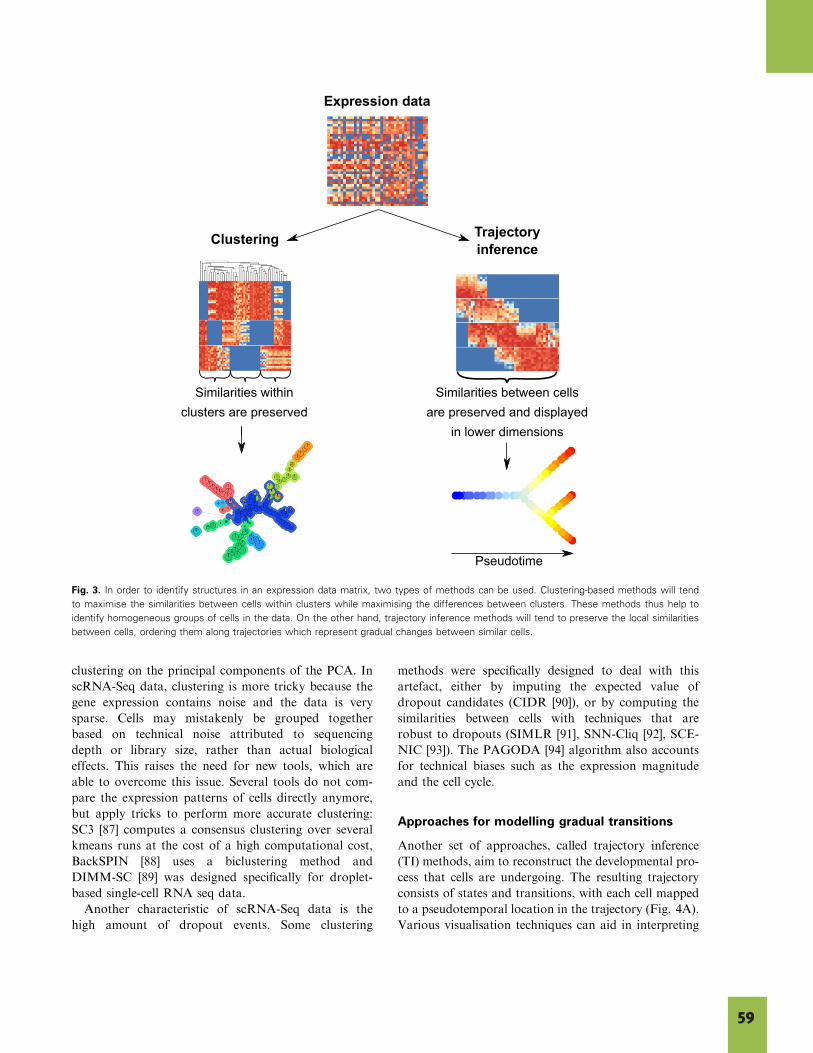
clustering on the principal components of the PCA. In
scRNA-Seq data, clustering is more tricky because the
gene expression contains noise and the data is very
sparse. Cells may mistakenly be grouped together
based on technical noise attributed to sequencing
depth or library size, rather than actual biological
effects. This raises the need for new tools, which are
able to overcome this issue. Several tools do not com-
pare the expression patterns of cells directly anymore,
but apply tricks to perform more accurate clustering:
SC3 [87] computes a consensus clustering over several
kmeans runs at the cost of a high computational cost,
BackSPIN [88] uses a biclustering method and
DIMM-SC [89] was designed specifically for droplet-
based single-cell RNA seq data.
Another characteristic of scRNA-Seq data is the
high amount of dropout events. Some clustering
methods were specifically designed to deal with this
artefact, either by imputing the expected value of
dropout candidates (CIDR [90]), or by computing the
similarities between cells with techniques that are
robust to dropouts (SIMLR [91], SNN-Cliq [92], SCE-
NIC [93]). The PAGODA [94] algorithm also accounts
for technical biases such as the expression magnitude
and the cell cycle.
Approaches for modelling gradual transitions
Another set of approaches, called trajectory inference
(TI) methods, aim to reconstruct the developmental pro-
cess that cells are undergoing. The resulting trajectory
consists of states and transitions, with each cell mapped
to a pseudotemporal location in the trajectory (Fig. 4A).
Various visualisation techniques can aid in interpreting
Pseudotime
Expression data
Trajectory inference
Clustering
Similarities between cellsare preserved and displayed
in lower dimensions
Similarities withinclusters are preserved
Fig. 3. In order to identify structures in an expression data matrix, two types of methods can be used. Clustering-based methods will tend
to maximise the similarities between cells within clusters while maximising the differences between clusters. These methods thus help to
identify homogeneous groups of cells in the data. On the other hand, trajectory inference methods will tend to preserve the local similarities
between cells, ordering them along trajectories which represent gradual changes between similar cells.
59
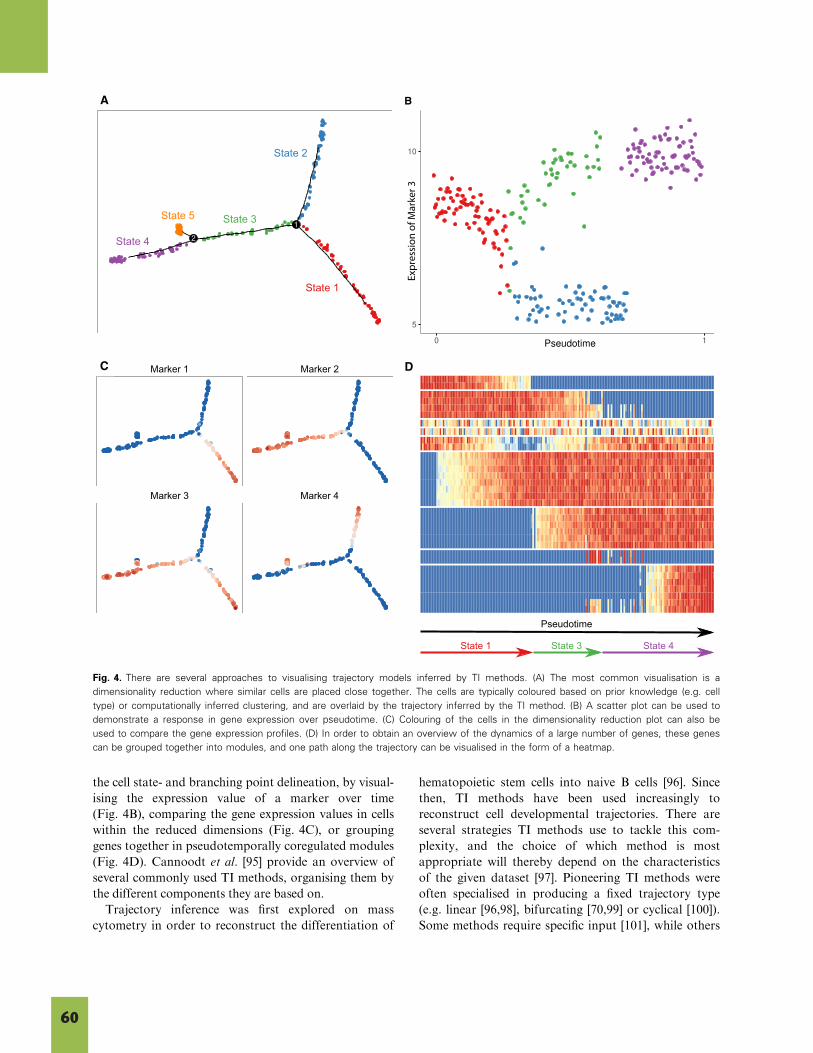
the cell state- and branching point delineation, by visual-
ising the expression value of a marker over time
(Fig. 4B), comparing the gene expression values in cells
within the reduced dimensions (Fig. 4C), or grouping
genes together in pseudotemporally coregulated modules
(Fig. 4D). Cannoodt et al. [95] provide an overview of
several commonly used TI methods, organising them by
the different components they are based on.
Trajectory inference was first explored on mass
cytometry in order to reconstruct the differentiation of
hematopoietic stem cells into naive B cells [96]. Since
then, TI methods have been used increasingly to
reconstruct cell developmental trajectories. There are
several strategies TI methods use to tackle this com-
plexity, and the choice of which method is most
appropriate will thereby depend on the characteristics
of the given dataset [97]. Pioneering TI methods were
often specialised in producing a fixed trajectory type
(e.g. linear [96,98], bifurcating [70,99] or cyclical [100]).
Some methods require specific input [101], while others
State 5
State 2
State 3
State 4
State 1
Marker 1 Marker 2
Marker 3 Marker 4
State 1 State 3 State 4
Pseudotime
A B
b) DC
Expr
essi
on o
f Mar
ker 3
Fig. 4. There are several approaches to visualising trajectory models inferred by TI methods. (A) The most common visualisation is a
dimensionality reduction where similar cells are placed close together. The cells are typically coloured based on prior knowledge (e.g. cell
type) or computationally inferred clustering, and are overlaid by the trajectory inferred by the TI method. (B) A scatter plot can be used to
demonstrate a response in gene expression over pseudotime. (C) Colouring of the cells in the dimensionality reduction plot can also be
used to compare the gene expression profiles. (D) In order to obtain an overview of the dynamics of a large number of genes, these genes
can be grouped together into modules, and one path along the trajectory can be visualised in the form of a heatmap.
60
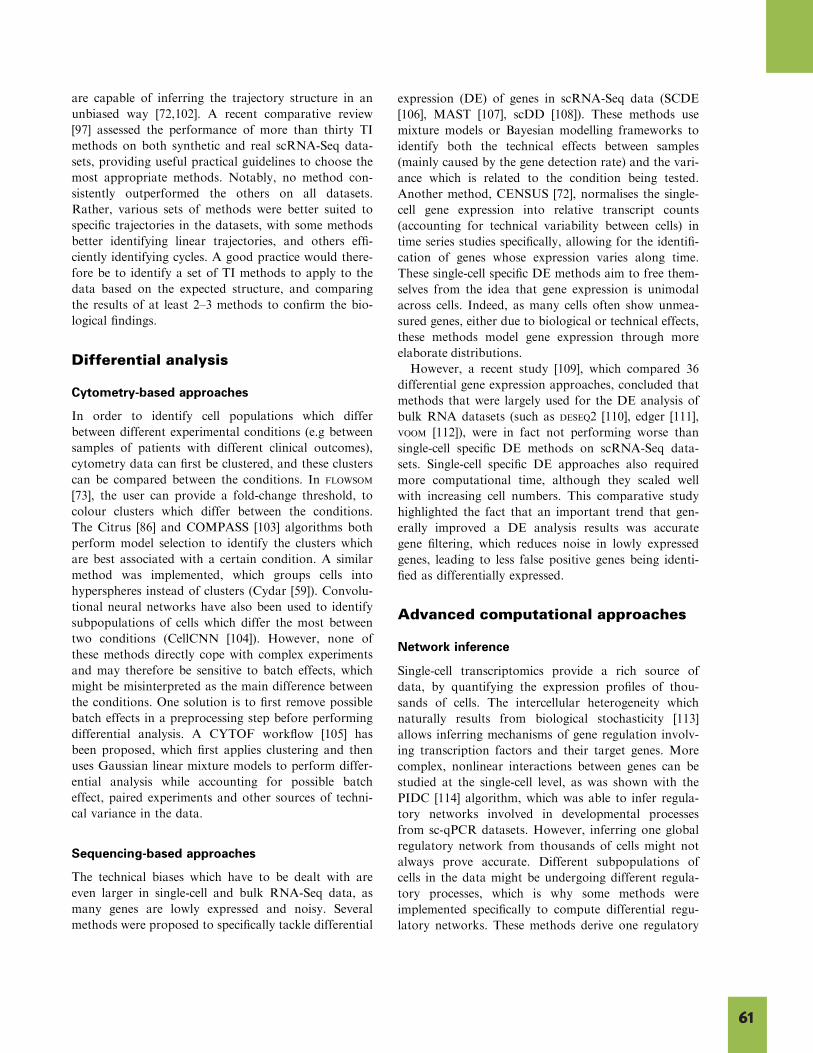
expression (DE) of genes in scRNA-Seq data (SCDE
[106], MAST [107], scDD [108]). These methods use
mixture models or Bayesian modelling frameworks to
identify both the technical effects between samples
(mainly caused by the gene detection rate) and the vari-
ance which is related to the condition being tested.
Another method, CENSUS [72], normalises the single-
cell gene expression into relative transcript counts
(accounting for technical variability between cells) in
time series studies specifically, allowing for the identifi-
cation of genes whose expression varies along time.
These single-cell specific DE methods aim to free them-
selves from the idea that gene expression is unimodal
across cells. Indeed, as many cells often show unmea-
sured genes, either due to biological or technical effects,
these methods model gene expression through more
elaborate distributions.
However, a recent study [109], which compared 36
differential gene expression approaches, concluded that
methods that were largely used for the DE analysis of
bulk RNA datasets (such as DESEQ2 [110], edger [111],
VOOM [112]), were in fact not performing worse than
single-cell specific DE methods on scRNA-Seq data-
sets. Single-cell specific DE approaches also required
more computational time, although they scaled well
with increasing cell numbers. This comparative study
highlighted the fact that an important trend that gen-
erally improved a DE analysis results was accurate
gene filtering, which reduces noise in lowly expressed
genes, leading to less false positive genes being identi-
fied as differentially expressed.
Advanced computational approaches
Network inference
Single-cell transcriptomics provide a rich source of
data, by quantifying the expression profiles of thou-
sands of cells. The intercellular heterogeneity which
naturally results from biological stochasticity [113]
allows inferring mechanisms of gene regulation involv-
ing transcription factors and their target genes. More
complex, nonlinear interactions between genes can be
studied at the single-cell level, as was shown with the
PIDC [114] algorithm, which was able to infer regula-
tory networks involved in developmental processes
from sc-qPCR datasets. However, inferring one global
regulatory network from thousands of cells might not
always prove accurate. Different subpopulations of
cells in the data might be undergoing different regula-
tory processes, which is why some methods were
implemented specifically to compute differential regu-
latory networks. These methods derive one regulatory
are capable of inferring the trajectory structure in an unbiased way [72,102]. A recent comparative review [97] assessed the performance of more than thirty TI methods on both synthetic and real scRNA-Seq data-sets, providing useful practical guidelines to choose the most appropriate methods. Notably, no method con-sistently outperformed the others on all datasets. Rather, various sets of methods were better suited to specific trajectories in the datasets, with some methods better identifying linear trajectories, and others effi-ciently identifying cycles. A good practice would there-fore be to identify a set of TI methods to apply to the data based on the expected structure, and comparing the results of at least 2–3 methods to confirm the bio-logical findings.
Differential analysis
Cytometry-based approaches
In order to identify cell populations which differ between different experimental conditions (e.g between samples of patients with different clinical outcomes), cytometry data can first be clustered, and these clusters can be compared between the conditions. In FLOWSOM
[73], the user can provide a fold-change threshold, to colour clusters which differ between the conditions. The Citrus [86] and COMPASS [103] algorithms both perform model selection to identify the clusters which are best associated with a certain condition. A similar method was implemented, which groups cells into hyperspheres instead of clusters (Cydar [59]). Convolu-tional neural networks have also been used to identify subpopulations of cells which differ the most between two conditions (CellCNN [104]). However, none of these methods directly cope with complex experiments and may therefore be sensitive to batch effects, which might be misinterpreted as the main difference between the conditions. One solution is to first remove possible batch effects in a preprocessing step before performing differential analysis. A CYTOF workflow [105] has been proposed, which first applies clustering and then uses Gaussian linear mixture models to perform differ-ential analysis while accounting for possible batch effect, paired experiments and other sources of techni-cal variance in the data.
Sequencing-based approaches
The technical biases which have to be dealt with are even larger in single-cell and bulk RNA-Seq data, as many genes are lowly expressed and noisy. Several methods were proposed to specifically tackle differential
61

and its transcription. More surprisingly, the measure-
ment of both transcripts and proteins [122,123] in single
cells has highlighted the fact that the amount of these
two entities was poorly correlated. This could be due to
the fact that transcription occurs in bursts, resulting in
high discrepancies between the numbers of transcripts,
whereas protein levels have been shown to be more
stable for particular genes [124].
The experimental procedures cited above led to low-
throughput datasets, typically containing 100 cells at
most, and could therefore be analysed by regular corre-
lation studies to assess the links between different omics
entities. The recently published CITE-seq [22] and
REAP-seq [23] methods have allowed the simultaneous
measurement of the transcriptome as well as 100 pro-
teins in thousands of cells, and have the potential to
measure thousands of proteins in single cells, as these
proteins are tagged with synthetic oligonucleotides.
Some studies have also achieved a broader characterisa-
tion of single cells by combining proteomics- and imag-
ing-based approaches [125,126]. As new experimental
procedures keep providing larger and larger datasets,
and new tools allow getting more insight into the mech-
anisms of regulations at the single-cell level [127,128],
there is a great need for multi-omics integrative compu-
tational tools. These tools should have the ability to
combine the information coming from complementary
sources to infer complex global models.
Conclusions and future perspectives
Various high-throughput approaches currently allow
studying cell populations into unprecedented depth.
The rapid development of novel technologies or
hybridisations between them is generating large and
complex datasets that require designing novel computa-
tional approaches for preprocessing, visualising and
extracting novel patterns from them. As novel tech-
nologies arise, the development of computational tools
and the adequate benchmarking between them is lag-
ging behind. Indeed, many computational approaches
to study single-cell data are continuously being pub-
lished, but the number of benchmark studies that objec-
tively compare these methods is under-represented.
Nevertheless, such benchmarks are essential to extract
useful guidelines for biologists who want to use these
tools, pinpoint limitations of current approaches and
highlight novel directions for future tool development.
While current methods mainly focus on cells in sus-
pension, novel advances that include the spatial con-
text will stimulate novel classes of computational tools
that will enable modelling cellular interactions and cell
dynamics into much greater depth. Such techniques
network for each cell subtype (CSRF [115], P�olya tree models [116]).
In order to improve the inference of gene regulatory networks, external sources of information can be pro-vided. As was discussed in the section ‘Approaches modelling gradual transitions’, cells can be ordered along developmental trajectories. Some network infer-ence methods can include the information from these inferred trajectories to reconstruct dynamic regulatory networks (AR1MA1 [117], SCODE [118]). Another source of external information could come from pertur-bational studies, in which genes are knocked out and the consequences on the transcriptome can be observed [21]. New tools will be needed to optimally use this type of data in order to infer regulatory networks.
Single-cell transcriptomics data represent a rich source of information to infer interactions which occur between genes and transcription factors. However, new studies are highlighting the need to not only focus on a single-cell’s transcripts, but also the methylation state of the DNA, the chromatin state and other epige-nomic data that might enrich our knowledge of the gene regulation dynamics [119,120].
Single-cell multi-omics data integration
Single-cell transcriptomics, proteomics, genomics and epigenomics have provided a level of understanding of the cellular heterogeneity that could not be reached with bulk studies. However, the models which are inferred from single technologies are by definition incomplete. Indeed, the relationships between the gen-ome, the amount of transcripts and proteins in a single cell are not always straightforward. Transcriptional regulatory mechanisms such as methylation may for instance alter the correlation between the gene copy number and the associated number of transcripts. Moreover, post-transcriptional mechanisms regulating protein translation and stability may also influence the relation between the number of transcripts and pro-teins in a cell. In order to fully understand and to start modelling the mechanisms involved in single cells, it will therefore be essential to integrate complementary types of data from the same single cells [26].
New experimental approaches have already been able to achieve a simultaneous and multiparameter measure-
ment by combining methods. The study of the genome together with the transcriptome [24,121] for instance has confirmed the existence of a strong correlation between genes with high copy numbers and the number of mRNA transcripts. The joint analysis of the methylome together with the transcriptome [25] also corroborated the negative relation between the methylation of a gene
62

1 Liu Z, Lavis LD & Betzig E (2015) Imaging live-cell
dynamics and structure at the single-molecule level.
Mol Cell 58, 644.
2 Abraham V, Taylor D & Haskins J (2004) High
content screening applied to large-scale cell biology.
Trends Biotechnol 22, 15–22.3 Goodman A & Carpenter AE (2016) High-throughput,
automated image processing for large-scale
fluorescence microscopy experiments. Microsc
Microanal 22, 538–539.4 Kamentsky L, Jones TR, Fraser A, Bray MA, Logan
DJ, Madden KL, Ljosa V, Rueden C, Eliceiri KW &
Carpenter AE (2011) Improved structure, function and
compatibility for Cell Profiler: modular high-
throughput image analysis software. Bioinformatics 27,
1179–1180.5 Fulwyler MJ (1965) Electronic separation of biological
cells by volume. Science (New York, NY) 150, 910–911.6 Robinson JP & Roederer M (2015) Flow cytometry
strikes gold. Science 350, 739–740.7 Perfetto SP, Chattopadhyay PK & Roederer M (2004)
Innovation: Seventeen-colour flow cytometry:
unravelling the immune system. Nat Rev Immunol 4,
648–655.
8 Nolan JP, Condello D, Nolan JP & Condello D
(2013). Spectral flow cytometry. In Current Protocols
in Cytometry, p. 1.27.1–1.27.13. John Wiley & Sons,
Inc., Hoboken, NJ.
9 McGrath KE, Bushnell TP & Palis J (2008)
Multispectral imaging of hematopoietic cells: where flow
meets morphology. J Immunol Methods 336, 91–97.10 Goddard G, Martin JC, Graves SW & Kaduchak G
(2006) Ultrasonic particle-concentration for sheathless
focusing of particles for analysis in a flow cytometer.
Cytometry Part A 69A, 66–74.11 Bandura DR, Baranov VI, Ornatsky OI, Antonov A,
Kinach R, Lou X, Pavlov S, Vorobiev S, Dick JE &
Tanner SD (2009) Mass cytometry: technique for real
time single cell multitarget immunoassay based on
inductively coupled plasma time-of-flight mass
spectrometry. Anal Chem 81, 6813–6822.12 Giesen C, Wang HA, Schapiro D, Zivanovic N, Jacobs
A, Hattendorf B, Sch€uffler PJ, Grolimund D, Buhmann
JM, Brandt S et al. (2014) Highly multiplexed imaging
of tumor tissues with subcellular resolution by mass
cytometry. Nat Methods 11, 417–422.13 Saeys Y, Van Gassen S & Lambrecht BN (2016)
Computational flow cytometry: helping to make sense
of high-dimensional immunology data. Nat Rev
Immunol 16, 449–462.14 Picelli S, Bj€orklund �AK, Faridani OR, Sagasser S,
Winberg G & Sandberg R (2013) Smart-seq2 for
sensitive full-length transcriptome profiling in single
cells. Nat Methods 10, 1096–1098.15 Macosko EZ, Basu A, Satija R, Nemesh J, Shekhar K,
Goldman M, Tirosh I, Bialas AR, Kamitaki N,
Martersteck EM et al. (2015) Highly parallel genome-
wide expression profiling of individual cells using
nanoliter droplets. Cell 161, 1202–1214.16 Zheng GXY, Terry JM, Belgrader P, Ryvkin P, Bent ZW,
Wilson R, Ziraldo SB, Wheeler TD, McDermott GP, Zhu
J et al. (2017) Massively parallel digital transcriptional
profiling of single cells.Nat Commun 8, 14049.
17 Gierahn TM, Wadsworth MH, Hughes TK, Bryson
BD, Butler A, Satija R, Fortune S, Love JC & Shalek
AK (2017) Seq-Well: portable, low-cost RNA
sequencing of single cells at high throughput. Nat
Methods 14, 395–398.18 Rosenberg AB, Roco C, Muscat RA, Kuchina A,
Mukherjee S, Chen W, Peeler DJ, Yao Z, Tasic B, Sellers
DL et al. (2017) Scaling single cell transcriptomics
through split pool barcoding. bioRxiv [preprint].
19 St�ahl PL, Salm�en F, Vickovic S, Lundmark A,
Navarro JF, Magnusson J, Giacomello S, Asp M,
Westholm JO, Huss M et al. (2016) Visualization and
analysis of gene expression in tissue sections by spatial
transcriptomics. Science (New York, NY) 353, 78–82.20 Dixit A, Parnas O, Li B, Chen J, Fulco CP, Jerby-
Arnon L, Marjanovic ND, Dionne D, Burks T,
will allow going from cells in isolation to tissues and organs, offering new perspectives for multiscale mod-
elling. On the other hand, single-cell multi-omics approaches are providing complementary information that can relate epigenetic, transcriptional and transla-tional information, paving the way for single-cell mul-
ti-omics and multi-source data integration.All of these advances strengthen the idea that the
life sciences are becoming even more data-driven sciences. To be able to analyse and correctly interpret the results of computational pipelines, young research-ers thus should be trained adequately in properly using and understanding the principles of these novel com-
putational approaches.
Acknowledgements
We thank Sofie Van Gassen, Robrecht Cannoodt, Niels Vandamme and Daniel Peralta for critical com-
ments and valuable input. HT is funded by a BOF-
IOP grant from Ghent University; YS is an ISAC Marylou Ingram scholar.
Conflict of interest
The authors declare no competing interests.
References
63

Raychowdhury R et al. (2016) Perturb-Seq: dissecting
molecular circuits with scalable single-cell RNA
profiling of pooled genetic screens. Cell 167, 1853–1866e17.
21 Jaitin DA, Weiner A, Yofe I, Lara-Astiaso D, Keren-
Shaul H, David E, Meir Salame T, Tanay A, van
Oudenaarden A & Amit I (2016) Dissecting immune
circuits by linking CRISPR-pooled screens with single-
cell RNA-Seq. Cell 167, 1883–1896.e15.22 Stoeckius M, Hafemeister C, Stephenson W, Houck-
Loomis B, Chattopadhyay PK, Swerdlow H, Satija R
& Smibert P (2017) Simultaneous epitope and
transcriptome measurement in single cells. Nat
Methods 14, 865–868.23 Peterson VM, Zhang KX, Kumar N, Wong J, Li L,
Wilson DC, Moore R, McClanahan TK, Sadekova S
& Klappenbach JA (2017) Multiplexed quantification
of proteins and transcripts in single cells. Nat
Biotechnol 35, 936–939.24 Macaulay IC, Haerty W, Kumar P, Li YI, Hu TX, Teng
MJ, Goolam M, Saurat N, Coupland P, Shirley LM
et al. (2015) G&T-seq: parallel sequencing of single-cell
genomes and transcriptomes. Nat Methods 12, 519–522.25 Angermueller C, Clark SJ, Lee HJ, Macaulay IC,
Teng MJ, Hu TX, Krueger F, Smallwood SA, Ponting
CP, Voet T et al. (2016) Parallel single-cell sequencing
links transcriptional and epigenetic heterogeneity. Nat
Methods 13, 229–232.26 Macaulay IC, Ponting CP & Voet T (2017) Single-cell
multiomics: multiple measurements from single cells.
TIG 33, 155–168.27 Carpenter AE, Jones TR, Lamprecht MR, Clarke C,
Kang IH, Friman O, Guertin DA, Chang J, Lindquist
RA, Moffat J et al. (2006) Cell Profiler: image analysis
software for identifying and quantifying cell
phenotypes. Genome Biol 7, R100.
28 Peng T, Thorn K, Schroeder T, Wang L, Theis FJ,
Marr C & Navab N (2017) A BaSiC tool for
background and shading correction of optical
microscopy images. Nat Commun 8, 14836.
29 Smith K, Li Y, Piccinini F, Csucs G, Balazs C,
Bevilacqua A & Horvath P (2015) CIDRE: an
illumination-correction method for optical microscopy.
Nat Methods 12, 404–406.30 W€ahlby C (2003) Algorithms for applied digital image
cytometry. Acta Universitatis Upsaliensis.
Comprehensive Summaries of Uppsala Dissertations
from the Faculty of Science and Technology 896,
75 pp., Uppsala. ISBN 91-554-5759-2.
31 Malpica N, de Sol�orzano CO, Vaquero JJ, Santos A,
Vallcorba I, Garc�ıa-Sagredo JM & del Pozo F (1998)
Applyingwatershed algorithms to the segmentation of
clustered nuclei. Cytometry 28, 289–297.32 Wahlby C, Sintorn IM, Erlandsson F, Borgefors G &
Bengtsson E (2004) Combining intensity, edge and
shape information for 2D and 3D segmentation of cell
nuclei in tissue sections. J Microsc 215, 67–76.33 Ortiz de Sol�orzano C, Garc�ıa Rodriguez E, Jones A,
Pinkel D, Gray JW, Sudar D & Lockett SJ. (1999)
Segmentation of confocal microscope images of cell
nuclei in thick tissue sections. J Microsc 193, 212–26.34 Meyer F & Beucher S (1990) Morphological
segmentation. J Vis Commun Image Represent 1, 21–46.35 Leipold MD (2015) Another step on the path to mass
cytometry standardization. Cytometry Part A 87,
380–382.36 Takahashi C, Au-Yeung A, Fuh F, Ramirez-Montagut
T, Bolen C, Mathews W & O’Gorman WE (2017)
Mass cytometry panel optimization through the
designed distribution of signal interference. Cytometry
Part A 91, 39–47.37 Fletez-Brant K, �Spidlen J, Brinkman RR, Roederer M
& Chattopadhyay PK (2016) flowClean: automated
identification and removal of fluorescence anomalies
in flow cytometry data. Cytometry Part A 89,
461–471.38 Bashashati A & Brinkman RR (2009) A survey of flow
cytometry data analysis methods. Adv Bioinform 2009,
584603.
39 Monaco G, Chen H, Poidinger M, Chen J,
deMagalh~aes JP & Larbi A (2016) flowAI: automatic
and interactive anomaly discerning tools for flow
cytometry data. Bioinformatics 32, 2473–2480.40 Hahne F, Khodabakhshi AH, Bashashati A, Wong
CJ, Gascoyne RD, Weng AP, Seyfert-Margolis V,
Bourcier K, Asare A, Lumley T et al. (2010) Per-
channel basis normalization methods for flow
cytometry data. Cytometry Part A 77, 121–131.41 Finak G, Frelinger J, Jiang W, Newell EW, Ramey J,
Davis MM, Kalams SA, De Rosa SC & Gottardo R
(2014) OpenCyto: an open source infrastructure for
scalable, robust, reproducible, and automated, end-to-
end flow cytometry data analysis. PLoS Comput Biol
10, e1003806.
42 Malek M, Taghiyar MJ, Chong L, Finak G, Gottardo
R & Brinkman RR (2015) flowDensity: reproducing
manual gating of flow cytometry data by automated
density-based cell population identification.
Bioinformatics 31, 606–607.43 Ziegenhain C, Vieth B, Parekh S, Reinius B,
Guillaumet-Adkins A, Smets M, Leonhardt H, Heyn
H, Hellmann I & Enard W (2017) Comparative
analysis of single-cell RNA sequencing methods. Mol
Cell 65, 631–643.44 Stegle O, Teichmann SA & Marioni JC (2015)
Computational and analytical challenges in single-cell
transcriptomics. Nat Rev Genet 16, 133–145.45 Poirion OB, Zhu X, Ching T & Garmire L (2016)
Single-cell transcriptomics bioinformatics and
computational challenges. Front Genet 7, 163.
64

46 Bacher R & Kendziorski C (2016) Design and
computational analysis of single-cell RNA-sequencing
experiments. Genome Biol 17, 63.
47 McCarthy DJ, Campbell KR, Lun ATL & Wills QF
(2016) scater: pre-processing, quality control,
normalisation and visualisation of single-cell RNA-seq
data in R. bioRxiv [preprint].
48 Butler A, Hoffman P, Smibert P, Papalexi E & Satija
R (2018) Integrating single-cell transcriptomic data
across different conditions, technologies, and species.
Nat Biotechnol 36, 411–420.49 Haghverdi L, Lun ATL, Morgan MD & Marioni JC
(2018) Batch effects in single-cell RNA-sequencing
data are corrected by matching mutual nearest
neighbors. Nat Biotechnol 36, 421–427.50 Lun ATL, McCarthy DJ & Marioni JC (2016) A step-
by-step workflow for low-level analysis of single-cell
RNA-seq data with bioconductor. F1000Research 5,
2122.
51 Scialdone A, Natarajan KN, Saraiva LR, Proserpio V,
Teichmann SA, Stegle O, Marioni JC & Buettner F
(2015) Computational assignment of cellcycle stage
from single-cell transcriptome data. Methods 85,
54–61.52 Buettner F, Pratanwanich N, McCarthy DJ, Marioni JC
& Stegle O (2017) f-scLVM: scalable and versatile factor
analysis for single-cell RNA-seq. Genome Biol 18, 212.
53 Mortazavi A, Williams BA, McCue K, Schaeffer L &
Wold B (2008) Mapping and quantifying mammalian
transcriptomes by RNA-Seq. Nat Methods 5, 621–628.54 Wagner GP, Kin K & Lynch VJ (2012) Measurement
of mRNA abundance using RNA-seq data: RPKM
measure is inconsistent among samples. Theory Biosci
131, 281–285.55 Bullard JH, Purdom E, Hansen KD & Dudoit S
(2010) Evaluation of statistical methods for
normalization and differential expression in mRNA-
Seq experiments. BMC Bioinformatics 11, 94.
56 Vallejos CA, Risso D, Scialdone A, Dudoit S &
Marioni JC (2017) Normalizing single-cell RNA
sequencing data: challenges and opportunities. Nat
Methods 14, 565–571.57 Pierson E & Yau C (2015) ZIFA: dimensionality
reduction for zero-inflated single-cell gene expression
analysis. Genome Biol 16, 241.
58 Risso D, Perraudeau F, Gribkova S, Dudoit S & Vert
JP (2017) ZINB-WaVE: a general and flexible method
for signal extraction from single-cell RNA-seq data.
bioRxiv [preprint].
59 Lun ATL, Richard AC & Marioni JC (2017) Testing
for differential abundance in mass cytometry data. Nat
Methods 14, 707–709.60 Vallejos CA, Marioni JC & Richardson S (2015)
BASiCS: Bayesian analysis of single-cell sequencing
data. PLoS Comput Biol 11, e1004333.
61 Ding B, Zheng L, Zhu Y, Li N, Jia H, Ai R, Wildberg
A & Wang W (2015) Normalization and noise
reduction for single cell RNA-seq experiments.
Bioinformatics 31, 2225–2227.62 Katayama S, T€oh€onen V, Linnarsson S & Kere J
(2013) SAMstrt: statistical test for differential
expression in single-cell transcriptome with spike-in
normalization. Bioinformatics 29, 2943–2945.63 Reid LH (2005) Proposed methods for testing and
selecting the ERCC external RNA controls. BMC
Genom 6, 150.
64 Baran-Gale J, Chandra T & Kirschner K (2017)
Experimental design for single-cell RNA sequencing.
Brief Funct Genomics 17, 233–239.65 Tung PY, Blischak JD, Hsiao CJ, Knowles DA,
Burnett JE, Pritchard JK & Gilad Y (2017) Batch
effects and the effective design of single-cell gene
expression studies. Sci Rep 7, 39921. https://doi.org/10.
1038/srep39921
66 Lun AT, Calero-Nieto FJ, Haim-Vilmovsky L,
Gottgens B & Marioni JC (2017) Assessing the
reliability of spike-in normalization for analyses of
single-cell RNA sequencing data. bioRxiv [preprint].
67 Bacher R, Chu LF, Leng N, Gasch AP, Thomson JA,
Stewart RM, Newton M & Kendziorski C (2017)
SCnorm: robust normalization of single-cell RNA-seq
data. Nat Methods 14, 584–586.68 van der Maaten L & Hinton G (2008) Visualizing data
using t-SNE. J Mach Learn Res 9, 2579–2605.69 Kruskal JB (1964) Multidimensional scaling by
optimizing goodness of fit to a nonmetric hypothesis.
Psychometrika 29, 1–27.70 Haghverdi L, Buettner F & Theis FJ (2015) Diffusion
maps for high-dimensional single-cell analysis of
differentiation data. Bioinformatics 31, 2989–2998.71 Weinreb C, Wolock S & Klein A (2017) SPRING: a
kinetic interface for visualizing high dimensional
single-cell expression data. bioRxiv [preprint].
72 Qiu X, Mao Q, Tang Y, Wang L, Chawla R, Pliner
HA & Trapnell C (2017) Reversed graph embedding
resolves complex single-cell trajectories. Nat Methods
14, 979–982.73 Van Gassen S, Callebaut B, Van Helden MJ,
Lambrecht BN, Demeester P, Dhaene T & Saeys Y
(2015) FlowSOM: using selforganizing maps for
visualization and interpretation of cytometry data.
Cytometry Part A 87, 636–645.74 Zunder ER, Lujan E, Goltsev Y, Wernig M & Nolan
GP (2015) A continuous molecular roadmap to iPSC
reprogramming through progression analysis of single-
cell mass cytometry. Cell Stem Cell 16, 323–337.75 Weber LM & Robinson MD (2016) Comparison of
clustering methods for high-dimensional single-cell
flow and mass cytometry data. Cytometry Part A 89,
1084–1096.
65

76 Spitzer MH, Gherardini PF, Fragiadakis GK,
Bhattacharya N, Yuan RT, Hotson AN, Finck R,
Carmi Y, Zunder ER, Fantl WJ et al. (2015) An
interactive reference framework for modeling a
dynamic immune system. Science 349, 1259425.
77 Levine JH, Simonds EF, Bendall SC, Davis KL, EaD
A, Tadmor MD, Litvin O, Fienberg HG, Jager A,
Zunder ER et al. (2015) Data-driven phenotypic
dissection of AML reveals progenitor-like cells that
correlate with prognosis. Cell 162, 184–197.78 Klein A, Mazutis L, Akartuna I, Tallapragada N,
Veres A, Li V, Peshkin L, Weitz DA & Kirschner MW
(2015) Droplet barcoding for single-cell
transcriptomics applied to embryonic stem cells. Cell
161, 1187–1201.79 Satija R, Farrell JA, Gennert D, Schier AF & Regev
A (2015) Spatial reconstruction of single-cell gene
expression data. Nat Biotechnol 33, 495–502.80 Campbell KR & Yau C (2016) Order under
uncertainty: robust differential expression analysis
using probabilistic models for pseudotime inference.
PLoS Comput Biol 12, e1005212.
81 Anchang B, Hart TDP, Bendall SC, Qiu P, Bjornson
Z, Linderman M, Nolan GP & Plevritis SK (2016)
Visualization and cellular hierarchy inference of
single-cell data using SPADE. Nat Protoc 11, 1264–1279.
82 Shekhar K, Brodin P, Davis MM & Chakraborty AK
(2014) Automatic classification of cellular expression
by nonlinear stochastic embedding (ACCENSE). Proc
Natl Acad Sci USA 111, 202–207.83 Aghaeepour N, Finak G, Hoos H, Mosmann TR,
Brinkman R, Gottardo R & Scheuermann RH (2013)
Critical assessment of automated flow cytometry data
analysis techniques. Nat Methods 10, 228–238.84 Newell EW & Cheng Y (2016) Mass cytometry:
blessed with the curse of dimensionality. Nat Immunol
17, 890–895.85 Platon L, Pejoski D, Gautreau G, Targat B, Le
Grand R & Beignon AS (2018) A computational
approach for phenotypic comparisons of cell
populations in high-dimensional cytometry data.
Methods 132, 66–75.86 Bruggner RV, Bodenmiller B, Dill DL, Tibshirani RJ
& Nolan GP (2014) Automated identification of
stratifying signatures in cellular subpopulations. Proc
Natl Acad Sci USA 111, E2770–E2777.87 Kiselev VY, Kirschner K, Schaub MT, Andrews T,
Yiu A, Chandra T, Natarajan KN, Reik W, Barahona
M, Green AR et al. (2017) SC3: consensus clustering
of single-cell RNA-seq data. Nat Methods 14, 483–486.88 Zeisel A, Mu~noz-Manchado AB, Codeluppi S,
L€onnerberg P, La Manno G, Jur�eus A, Marques S,
Munguba H, He L, Betsholtz C et al. (2015) Brain
structure. Cell types in the mouse cortex and
hippocampus revealed by single-cell RNA-seq. Science
(New York, NY) 347, 1138–1142.89 Sun Z, Wang T, Deng K, Wang XF, Lafyatis R, Ding
Y, Hu M & Chen W (2018) DIMM-SC: a Dirichlet
mixture model for clustering droplet-based single cell
transcriptomic data. Bioinformatics 34, 139–146.90 Lin P, Troup M & Ho JWK (2017) CIDR: ultrafast
and accurate clustering through imputation for single-
cell RNA-seq data. Genome Biol 18, 59.
91 Wang B, Zhu J, Pierson E, Ramazzotti D & Batzoglou
S (2017) Visualization and analysis of single-cell RNA-
seq data by kernelbased similarity learning. Nat
Methods 14, 414–416.92 Xu C & Su Z (2015) Identification of cell types from
single-cell transcriptomes using a novel clustering
method. Bioinformatics 31, 1974–1980.93 Aibar S, Gonz�alez-Blas CB, Moerman T, Huynh-Thu
VA, Imrichova H, Hulselmans G, Rambow F, Marine
JC, Geur P & Aerts J (2017) SCENIC: single-cell
regulatory network inference and clustering. Nat
Methods 14, 1083–1086.94 Fan J, Salathia N, Liu R, Kaeser GE, Yung YC,
Herman JL, Kaper F, Fan J-B, Zhang K, Chun J
et al. (2016) Characterizing transcriptional
heterogeneity through pathway and gene set over
dispersion analysis. Nat Methods 13, 241–244.95 Cannoodt R, Saelens W & Saeys Y (2016)
Computational methods for trajectory inference from
single-cell transcriptomics. Eur J Immunol 46, 2496–2506.96 Bendall SC, Davis KL, Amir EAD, Tadmor MD,
Simonds EF, Chen TJ, Shenfeld DK, Nolan GP &
Pe’er D (2014) Single-cell trajectory detection uncovers
progression and regulatory coordination in human B
cell development. Cell 157, 714–725.97 Saelens W, Cannoodt R, Todorov H & Saeys Y (2018)
A comparison of single-cell trajectory inference
methods: towards more accurate and robust tools.
bioRxiv [preprint].
98 Cannoodt R, Saelens W, Sichien D, Tavernier S,
Janssens S, Guilliams M, Lambrecht BN, De PK &
Saeys Y (2016) SCORPIUS improves trajectory
inference and identifies novel modules in dendritic cell
development. bioRxiv [preprint].
99 Setty M, Tadmor MD, Reich-Zeliger S, Angel O,
Salame TM, Kathail P, Choi K, Bendall S, Friedman
N & Pe’er D (2016) Wishbone identifies bifurcating
developmental trajectories from single-cell data. Nat
Biotechnol 34, 1–14.100 Liu Z, Lou H, Xie K, Wang H, Chen N, Aparicio
OM, Zhang MQ, Jiang R & Chen T (2017)
Reconstructing cell cycle pseudo time-series via single-
cell transcriptome data. Nat Commun 8, 22.
101 Trapnell C, Cacchiarelli D, Grimsby J, Pokharel P, Li
S, Morse M, Lennon NJ, Livak KJ, Mikkelsen TS &
Rinn JL (2014) The dynamics and regulators of cell
66

N, Purdom E & Dudoit S (2017) Slingshot: cell
lineage and pseudotime inference for single-cell
transcriptomics. bioRxiv [preprint].
103 Lin L, Finak G, Ushey K, Seshadri C, Hawn TR, Frahm
N, Scriba TJ, Mahomed H, HanekomW, Bart P-A et al.
(2015) COMPASS identifies T-cell subsets correlated
with clinical outcomes. Nat Biotechnol 33, 610–616.104 Arvaniti E & Claassen M (2017) Sensitive detection of
rare disease-Associated cell subsets via representation
learning. Nat Commun 8, 1–10.105 Nowicka M, Krieg C, Weber LM, Hartmann FJ,
Guglietta S, Becher B, Levesque MP & Robinson MD
(2017) CyTOF workflow: differential discovery in
high-throughput high-dimensional cytometry datasets.
F1000Research 6, 748.
106 Kharchenko PV, Silberstein L & Scadden DT (2014)
Bayesian approach to single-cell differential expression
analysis. Nat Methods 11, 740–742.107 Finak G, McDavid A, Yajima M, Deng J, Gersuk V,
Shalek AK, Slichter CK, Miller HW, McElrath MJ,
Prlic M et al. (2015) MAST: a flexible statistical
framework for assessing transcriptional changes and
characterizing heterogeneity in single-cell RNA
sequencing data. Genome Biol 16, 278.
108 Korthauer KD, Chu LF, Newton MA, Li Y, Thomson
J, Stewart R & Kendziorski C (2016) A statistical
approach for identifying differential distributions in
single-cell RNA-seq experiments. Genome Biol 17, 222.
109 Soneson C & Robinson MD (2018) Bias, robustness
and scalability in single-cell differential expression
analysis. Nat Methods 15, 255–261.110 Love MI, Huber W & Anders S (2014) Moderated
estimation of fold change and dispersion for RNA-seq
data with DESeq2. Genome Biol 15, 550.
111 Robinson MD, McCarthy DJ & Smyth GK (2010)
edgeR: a Bioconductor package for differential
expression analysis of digital gene expression data.
Bioinformatics 26, 139–140.112 Law CW, Chen Y, Shi W & Smyth GK (2014) voom:
precision weights unlock linear model analysis tools
for RNA-seq read counts. Genome Biol 15, R29.
113 Padovan-Merhar O & Raj A (2013) Using variability
in gene expression as a tool for studying gene
regulation. WIREs Syst Biol Med 5, 751–759.114 Chan TE, Stumpf MPH & Babtie AC (2017) Gene
regulatory network inference from single-cell data
using multivariate information measures. Cell systems
5, 251–267.e3.115 Xu R, Nettleton D & Nordman DJ (2016) Case-specific
random forests. J Comput Graph Stat 25, 49–65.
116 Filippi S & Holmes CC (2017) A Bayesian
nonparametric approach to testing for dependence
between random variables. Bayesian Anal 12, 919–938.117 Castillo MS, Blanco D, Luna IMT, Carrion MC &
Huang Y (2018) A Bayesian framework for the
inference of gene regulatory networks from time and
pseudo-time series data. Bioinformatics 34, 964–970.118 Matsumoto H, Kiryu H, Furusawa C, Ko MSH, Ko
SBH, Gouda N, Hayashi T & Nikaido I (2017)
SCODE: an efficient regulatory network inference
algorithm from single-cell RNA-Seq during
differentiation. Bioinformatics 33, 2314–2321.119 Fiers MWEJ, Minnoye L, Aibar S, Bravo Gonz�alez-
Blas C, Kalender Atak Z & Aerts S (2018) Mapping
gene regulatory networks from single-cell omics data.
Brief Funct Genomics 17, 246–254.120 €Aij€o T & Bonneau R (2017) Biophysically motivated
regulatory network inference: progress and prospects.
Hum Hered 81, 62–77.121 Dey SS, Kester L, Spanjaard B, Bienko M & Van
Oudenaarden A (2015) Integrated genome and
transcriptome sequencing of the same cell. Nat
Biotechnol 33, 285–289.122 Darmanis S, Gallant CJ, Marinescu VD, Niklasson
M, Segerman A, Flamourakis G, Fredriksson S,
Assarsson E, Lundberg M, Nelander S et al. (2016)
Simultaneous multiplexed measurement of RNA and
proteins in single cells. Cell Rep 14, 380–389.123 Albayrak C, Jordi CA, Zechner C, Lin J, Bichsel CA,
Khammash M & Tay S (2016) Digital quantification
of proteins and mRNA in single mammalian cells.
Mol Cell 61, 914–924.124 Schwanh€ausser B, Busse D, Li N, Dittmar G,
Schuchhardt J, Wolf J, Chen W & Selbach M (2011)
Global quantification of mammalian gene expression
control. Nature 473, 337–342.125 Soh KT, Tario JD, Colligan S, Maguire O, Pan D,
Minderman H & Wallace PK (2016) Simultaneous,
single-cell measurement of messenger RNA, cell
surface proteins, and intracellular proteins. Curr
Protoc Cytom 75, 7.45.1–7.45.33.126 Kochan J, Wawro M & Kasza A (2015) Simultaneous
detection of mRNA and protein in single cells using
immunofluorescence combined single-molecule RNA
FISH. Biotechniques 59, 209–212, 214, 216.127 Buenrostro JD, Wu B, Litzenburger UM, Ruff D,
Gonzales ML, Snyder MP, Chang HY & Greenleaf WJ
(2015) Single-cell chromatin accessibility reveals
principles of regulatory variation. Nature 523, 486–490.128 Jin W, Tang Q, Wan M, Cui K, Zhang Y, Ren G, Ni B,
Sklar J, Przytycka TM, Childs R et al. (2015) Genome-
wide detection of DNase i hypersensitive sites in single
cells and FFPE tissue samples. Nature 528, 142–146.
fate decisions are revealed by pseudotemporal ordering of single cells. Nat Biotechnol 32, 381–386.
102 Street K, Risso D, Fletcher RB, Das D, Ngai J, Yosef
67