inox leisure limited...jaipur sunny trade center - 30th september 2016 4 screens 936 seats * 4...
TRANSCRIPT
1
QUARTERLY INVESTOR UPDATE Q2 & H1 FY17
INOX LEISURE LIMITED

DISCLAIMER
2
This presentation and the following discussion may contain “forward looking statements” by Inox Leisure Limited (“ILL” or “the
Company”) that are not historical in nature. These forward looking statements, which may include statements relating to
future state of affairs, results of operations, financial condition, business prospects, plans and objectives, are based on the
current beliefs, assumptions, expectations, estimates, and projections of the management of ILL about the business, industry
and markets in which ILL operates.
These statements are not guarantees of future performance, and are subject to known and unknown risks, uncertainties, and
other factors, some of which are beyond ILL’s control and difficult to predict, that could cause actual results, performance or
achievements to differ materially from those in the forward looking statements.
Such statements are not, and should not be construed, as a representation as to future performance or achievements of ILL. In
particular, such statements should not be regarded as a projection of future performance of ILL. It should be noted that the
actual performance or achievements of ILL may vary significantly from such statements.

DISCUSSION SUMMARY
3
Q2 & H1 FY17 RESULT HIGHLIGHTS
Q2 & H1 FY17 RESULT ANALYSIS
NEW PROPERTIES OPENED
PAN INDIA PRESENCE
NEW SCREENS PIPELINE
CONTENT PIPELINE
SHAREHOLDING STRUCTURE
ANNEXURE

Q2 & H1 FY17 – RESULT HIGHLIGHTS
4
Note: * Net Revenue from Operations, ** EBIDTA excluding Other Income
In Rs. Crore
REVENUES* EBITDA ** and EBITDA MARGIN PAT and PAT MARGIN
307.8 297.4
Q2 FY16 Q2 FY17
56.5
27.2
18.4%
9.1%
Q2 FY16 Q2 FY17
EBIDTA EBIDTA %
3 %
Q2 FY17 YoY ANALYSIS
52 % 21.3
1.6
6.9%
0.5%
Q2 FY16 Q2 FY17
PAT PAT %
93 %
REVENUES* EBITDA ** and EBITDA MARGIN PAT and PAT MARGIN
610.3 634.3
H1 FY16 H1 FY17
121.0 89.3
19.8%
14.1%
H1 FY16 H1 FY17
EBIDTA EBIDTA %
4 %
H1 FY17 YoY ANALYSIS
26 %
46.5
26.5
7.6%
4.2%
H1 FY16 H1 FY17
PAT PAT %
43 %

Q2 & H1 FY17 – RESULT ANALYSIS
5
In Rs. Crore
Note: * Net Revenue from Operations
190.9 179.4
69.2 70.2
21.4 23.8
26.2 24.0
Q2 FY16 Q2 FY17
Net Box Office
Food & Beverages
Advertising
Other Operating Revenues
REVENUES* BREAKUP
Q2 FY17 YoY ANALYSIS
% Share Q2 FY16 Q2 FY17
62.0% 60.3%
22.5% 23.6%
7.0% 8.0%
8.5% 8.1%
297.4
9 %
11 %
1 %
6 %
307.8
NBOC – Net Box Office Collection
379.5 392.9
143.1 150.8
42.1 45.1 45.5 45.4
H1 FY16 H1 FY17
Net Box Office
Food & Beverages
Advertising
Other Operating Revenues
REVENUES* BREAKUP
H1 FY17 YoY ANALYSIS
% Share H1 FY16 H1 FY17
62.2% 61.9%
23.5% 23.8%
6.9% 7.1%
7.5% 7.2%
634.3
0.3 %
7 %
5 %
4 %
610.3

Q2 & H1 FY17 – RESULT ANALYSIS TOP 5 FILMS
6
Q2 FY17 Sultan Rustom Pink Kabali Dishoom
Footfalls (Lakhs) 25.06 12.36 8.32 7.39 6.79
GBOC (Rs Crore) 52.16 25.57 14.74 13.51 12.08
Top 5 films accounted for 51% of Q2 FY17 GBOC revenues (55% in Q2 FY16)
GBOC – Gross Box Office Collection
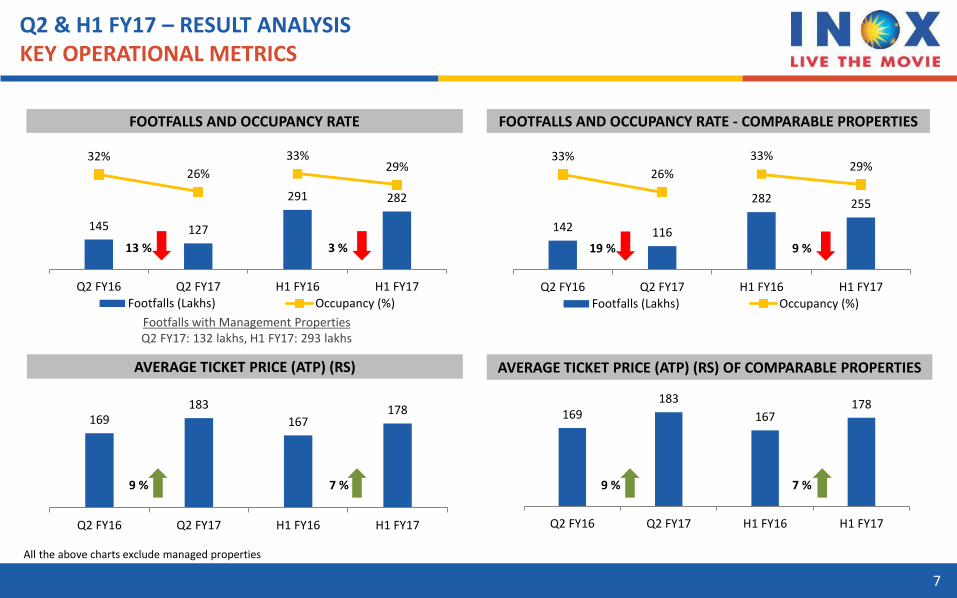
Q2 & H1 FY17 – RESULT ANALYSIS KEY OPERATIONAL METRICS
7
All the above charts exclude managed properties
145 127
291 282
32%
26%
33% 29%
Q2 FY16 Q2 FY17 H1 FY16 H1 FY17
Footfalls (Lakhs) Occupancy (%)
169 183
167 178
Q2 FY16 Q2 FY17 H1 FY16 H1 FY17
169 183
167 178
Q2 FY16 Q2 FY17 H1 FY16 H1 FY17
FOOTFALLS AND OCCUPANCY RATE
AVERAGE TICKET PRICE (ATP) (RS)
9 % 7 %
13 % 3 %
Footfalls with Management Properties Q2 FY17: 132 lakhs, H1 FY17: 293 lakhs
FOOTFALLS AND OCCUPANCY RATE - COMPARABLE PROPERTIES
AVERAGE TICKET PRICE (ATP) (RS) OF COMPARABLE PROPERTIES
9 % 7 %
142 116
282 255
33%
26%
33% 29%
Q2 FY16 Q2 FY17 H1 FY16 H1 FY17
Footfalls (Lakhs) Occupancy (%)
19 % 9 %

21.4 23.8
42.1 45.1
Q2 FY16 Q2 FY17 H1 FY16 H1 FY17
Advertising Revenues (Rs Cr)
Q2 & H1 FY17 – RESULT ANALYSIS KEY OPERATIONAL METRICS
8
ADVERTISING REVENUES OTHER OPERATING REVENUES
FOOD & BEVERAGES - SPEND PER HEAD (SPH) (RS)
56
65 57
63
Q2 FY16 Q2 FY17 H1 FY16 H1 FY17
FOOD & BEVERAGES - NET CONTRIBUTION (%)
74.7% 73.9% 74.9% 75.7%
Q2 FY16 Q2 FY17 H1 FY16 H1 FY17
16 % 9 %
11 % 7%
26.2 24.0
45.5 45.4
Q2 FY16 Q2 FY17 H1 FY16 H1 FY17
Other Operating Revenues (Rs Cr)
9 % 0.3 %

Q2 & H1 FY17 – RESULT ANALYSIS KEY OPERATIONAL METRICS
9
NBOC (Net Box Office Collections) , GBOC (Gross Box Office Collections)
ENTERTAINMENT TAX - % FILM DISTRIBUTOR SHARE (%)
43.7% 46.3% 43.4% 44.2%
34.3% 36.2% 34.1% 34.7%
Q2 FY16 Q2 FY17 H1 FY16 H1 FY17
Distributor Share on NBOC Distributor Share on GBOC
OTHER OVERHEADS PER OPERATING SCREEN (RS LAKHS) Entertainment Tax
Properties Screens Seats Average Residual
Period
Full Tax 91 362 92,888
Exempted 14 55 13,898 2.9 years
4.9 5.5 10.0 10.9 11.2 11.0 22.1 22.7 12.2 10.9
23.3 22.2 12.1 14.0
22.8 26.1
Q2 FY16 Q2 FY17 H1 FY16 H1 FY17Employee Benefits Property Rent & Conducting FeesCAM, Power & Fuel, R&M Other Overheads
40.4
81.9
27.5% 28.2% 27.2% 27.1%
21.6% 22.0% 21.4% 21.3%
Q2 FY16 Q2 FY17 H1 FY16 H1 FY17
Entertainment Tax - % of NBOC Entertainment Tax - % of GBOC
41.3
78.2
Above figures exclude management properties
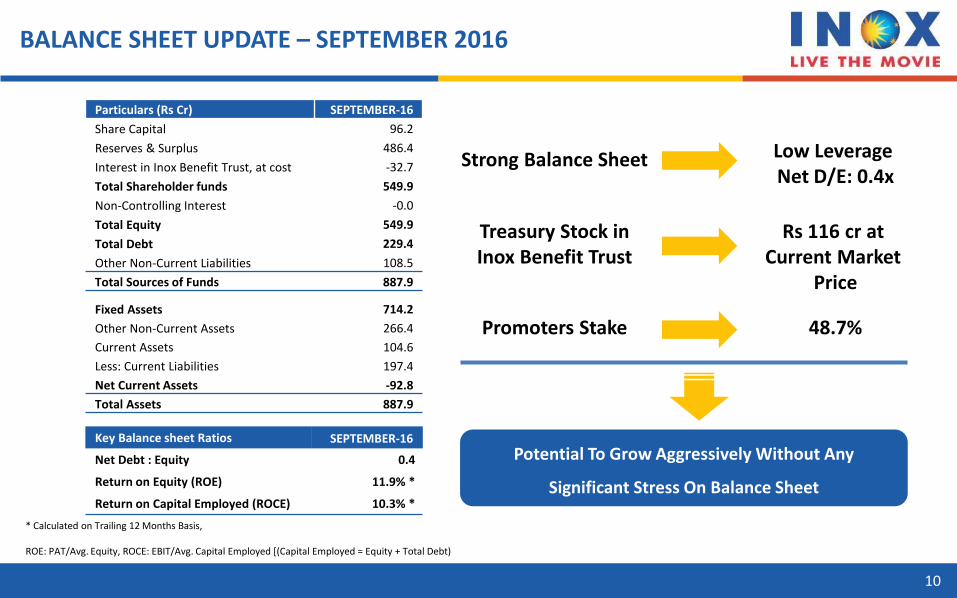
BALANCE SHEET UPDATE – SEPTEMBER 2016
10
Particulars (Rs Cr) SEPTEMBER-16
Share Capital 96.2
Reserves & Surplus 486.4
Interest in Inox Benefit Trust, at cost -32.7
Total Shareholder funds 549.9
Non-Controlling Interest -0.0
Total Equity 549.9
Total Debt 229.4
Other Non-Current Liabilities 108.5
Total Sources of Funds 887.9
Key Balance sheet Ratios SEPTEMBER-16
Net Debt : Equity 0.4
Return on Equity (ROE) 11.9% *
Return on Capital Employed (ROCE) 10.3% *
* Calculated on Trailing 12 Months Basis,
ROE: PAT/Avg. Equity, ROCE: EBIT/Avg. Capital Employed [(Capital Employed = Equity + Total Debt)
Fixed Assets 714.2
Other Non-Current Assets 266.4
Current Assets 104.6
Less: Current Liabilities 197.4
Net Current Assets -92.8
Total Assets 887.9
Potential To Grow Aggressively Without Any
Significant Stress On Balance Sheet
Low Leverage Net D/E: 0.4x
Treasury Stock in Inox Benefit Trust
Rs 116 cr at Current Market
Price
Promoters Stake 48.7%
Strong Balance Sheet

NEW PROPERTIES OPENED
11
ADDITIONS IN Q2 FY17
ADDITIONS – Apr to Oct 2016
PROPERTIES 3
PROPERTIES 5
SCREENS 11
SCREENS 20
SEATS 2,627
SEATS 3,760
Kota Ahluwalia's Great Mall - 13th August 2016 4 Screens 861 Seats
Howrah Bellur Forum Rangoli Mall - 30th September 2016 3 Screens 830 Seats
Jaipur Sunny Trade Center - 30th September 2016 4 Screens 936 Seats
* 4 Screens were added in month of October – - Rajkot Reliance mall – 3 screens – 411 seats - Surat DR World (existing property) – 1 screen – 105 seats
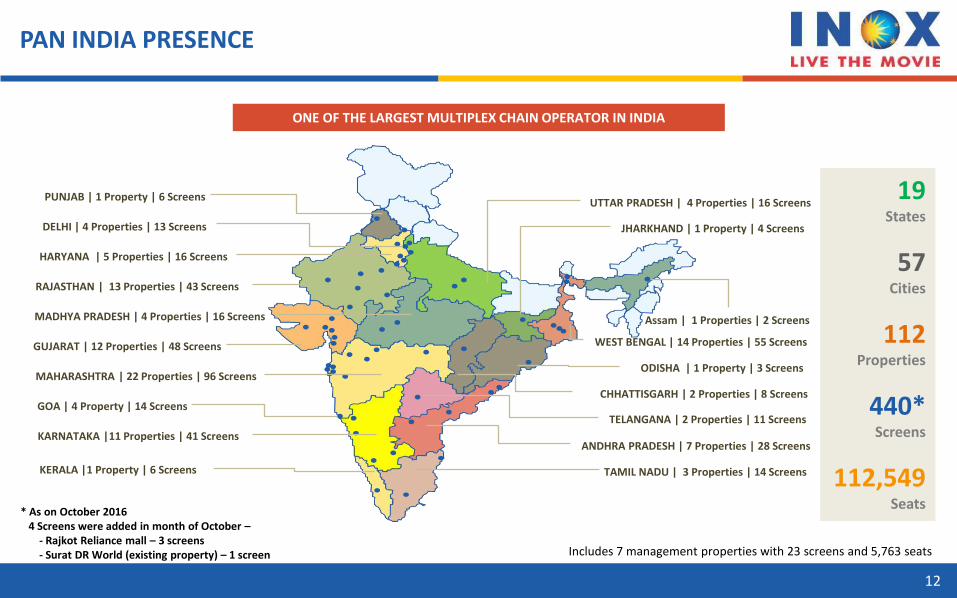
PAN INDIA PRESENCE
Includes 7 management properties with 23 screens and 5,763 seats
ONE OF THE LARGEST MULTIPLEX CHAIN OPERATOR IN INDIA
KERALA |1 Property | 6 Screens
19
States
57
Cities
112
Properties
440*
Screens
112,549 Seats
JHARKHAND | 1 Property | 4 Screens
WEST BENGAL | 14 Properties | 55 Screens
ODISHA | 1 Property | 3 Screens
CHHATTISGARH | 2 Properties | 8 Screens
TELANGANA | 2 Properties | 11 Screens
ANDHRA PRADESH | 7 Properties | 28 Screens KARNATAKA |11 Properties | 41 Screens
GOA | 4 Property | 14 Screens
MAHARASHTRA | 22 Properties | 96 Screens
GUJARAT | 12 Properties | 48 Screens
MADHYA PRADESH | 4 Properties | 16 Screens
RAJASTHAN | 13 Properties | 43 Screens
HARYANA | 5 Properties | 16 Screens
TAMIL NADU | 3 Properties | 14 Screens
UTTAR PRADESH | 4 Properties | 16 Screens
DELHI | 4 Properties | 13 Screens
PUNJAB | 1 Property | 6 Screens
Assam | 1 Properties | 2 Screens
* As on October 2016 4 Screens were added in month of October – - Rajkot Reliance mall – 3 screens - Surat DR World (existing property) – 1 screen
12

13
STRONG VISIBILITY FROM NEW SCREENS PIPELINE BACKED BY SIGNED AGREEMENTS
NEW SCREENS PIPELINE
Properties Screens Seats
FY16 107 420 1,08,931
Additions Apr-16 to Oct-16 5 20 3,760
Additions Nov-16 to Mar-17 8 40 8,904
FY17 120 480 1,21,453*
Additions post FY17 56 289 55,021
LEADING TO 176 769 1,76,474
FY17 – PIPELINE
Properties Screens Seats
Mumbai 6 1,250
Pune 6 1,090
Aurangabad 3 880
Kolhapur 4 870
Cuttack 4 846
Greater Noida 5 1,261
Gurgaon 3 619
Coimbatore 9 2,088
Total – 8 New Properties 40 8,904
* 142 seats reduced due to increase in seat tier width at Bharuch Shree Rang and addition of recliners in Goa Osia

Jack Reacher 2: Never Go Back Release Date: 21st October 2016 Cast: Tom Cruise, Cobie Smoulders Director: Edward Zwick Banner: Paramount Pictures, Skydance Productions
The Accountant Release Date: 14th October 2016 Cast: Ben Affleck, Anna Kendrick Director: Gavin O Connor Banner: Warner Bros., Electric City Entertainment, RatPac-Dune Entertainment
Shivaay Release Date: 28th October 2016 Cast: Ajay Devgan, Vir Das, Abigil Director: Ajay Devgan Banner: Eros International, ADF Films
Ae Dil Hai Mushkil Release Date: 28th October 2016 Cast: Ranbir Kapoor, Anushka Sharma, Aishwarya Rai Bachchan Director: Karan Johar Banner: Dharma Productions , Fox Star Studios
Inferno Release Date: 14th October 2016 Cast: Irfan Khan, Tom Hanks, Ben Foster Director: Ron Howard Banner: Imagine Entertainment, Skylark Productions, Columbia Pictures
CONTENT PIPELINE – OCTOBER 2016
14
Mirzya Release Date: 7th October 2016 Cast: Harshvardhan Kapoor, Sonam Kapoor, Waheeda Rahman Director: Rakesysh Omprakash Mehra
Banner: Rakesysh Omprakash Mehra
Productions, Cinestaan Film Company

Fantastic Beasts & Where To Find Them Release Date: 18th November 2016 Cast: Eddie Redmayne, Ezra Miller, Colin Farell, Ron Pearlman, Jon Voight Director: David Yates Banner: Heyday Films Warner Bros.
Force 2 Release Date: 18th November 2016 Cast: John Abraham, Sonakshi Sinha Director: Abhinay Deo Banner: Ja Entertainment Pvt. Ltd., Viacom18 Motion Pictures, Sunshine Pictures Pvt. Ltd
Dear Zindagi Release Date: 25th November 2016 Cast: Alia Bhatt, Ali Zafar, Aditya Roy Kapoor, Kunal Kapoor Director: Gauri Shinde Banner: Hope Productions, Dharma Productions, Red Chillies Entertainment
Billy Lynn’s Long Halftime Walk Release Date: 11th November 2016 Cast: Vin Diesel, Kristen Stewart, Steve Martin, Chris Tucker Director: Ang Lee Banner: Bona Film Group, Film4, Ink Factory, The Marc Platt Productions, Studio 8, TriStar Pictures
CONTENT PIPELINE – NOVEMBER 2016
15
Rock On 2 Release Date: 11th November 2016 Cast: Farhan Akhtar, Arjun Rampal, Shraddha Kapoor, Purab Kohli Director: Shujaat Saudagar Banner: Eros International, Excel Entertainment
Doctor Strange Release Date: 4th November 2016 Cast: Rachel Mcadams, Benedict Cumberbatch, Tilda Swinton Director: Scott Derrickson
Banner: Marvel Studios, Walt Disney Studios Motion Pictures

Dangal Release Date: 23rd December 2016 Cast: Aamir Khan Director: Nitesh Tiwari Banner: Disney India Studio, Aamir Khan Productions
Rogue One: A Star Wars Story Release Date: 16th December 2016 Cast: Felicity Jones, Alan Tudyk, Donnie Yen, Forest Withtaker Director: Gareth Edwards Banner: Allison Shearmur Productions, Black Hangar Studios, Lucasfilm
Assasins Creed Release Date: 23rd December 2016 Cast: Michael Fassbender, Marion Cotillard Director: Justin Kurzel Banner: Regency Enterprises, New Regency Pictures, Ubisoft Motion Pictures, DMC Film
Passengers Release Date: 30th December 2016 Cast: Jennifer Lawrence, Chris Pratt, Michael Sheen Director: Morten Tyldum Banner: Columbia Pictures, LStar Capital, Village Roadshow Pictures, Start Motion Pictures
Befikre Release Date: 9th December 2016 Cast: Ranveer Singh, Vaani Kapoor Director: Aditya Chopra Banner: Yash Raj Films
CONTENT PIPELINE – DECEMBER 2016
16
Kahaani 2 Release Date: 2nd December 2016 Cast: Vidya Balan, Arjun Rampal Director: Sujoy Ghosh Banner: Pen India Limited

Raees Release Date: 26th January 2017 Cast: Shahrukh Khan, Farhan Akhtar, Nawazuddin Siddhiqui Director: Rahul Dholakia Banner: Red Chillies Entertainment, Excel Entertainment
XXX: The Return of Xander Cage Release Date: 20th January 2017 Cast: Vin Diesel, Deepika Padukone, Samuel J Jackson, Nina Dobrev, Tony Colete Director: DJ Caruso Banner: Maple Cage Productions, One Race Films, Revolution Studios, Rox Productions
Kaabil Release Date: 26th January 2017 Cast: Hrithik Roshan, Yami Gautam Director: Sanjay Gupta Banner: Filmkraft Productions Pvt. Ltd
Resident Evil 6 Release Date: 27th January 2017 Cast: Milla Jovovich, Ali Larter, Shawn Roberts Director: Paul Anderson Banner: Capcom Entertainment, Constantin Film Production, Don Carmody Productions
Ok Janu Release Date: 13th January 2017 Cast: Aditya Roy Kapoor, Shraddha Kapoor Director: Shaad Ali Banner: Dharma Productions Madras Talkies
CONTENT PIPELINE – JANUARY 2017
17
Commando 2 Release Date: 6th January 2017 Cast: Vidhyut Jamwal, Adah Sharma, Esha Gupta, Adil Hussian Director: Deven Bhojani Banner: Reliance Entertainment

SHAREHOLDING STRUCTURE
18
Source: Company * Shares held under Inox Benefit Trust reflect the Treasury Shares
Market Data As on 26.10.16 (BSE)
Market capitalization (Rs Cr) 2,571.6
Price (Rs.) 266.6
No. of shares outstanding (Cr) 9.6
Face Value (Rs.) 10.0
52 week High-Low (Rs.) 292.9 – 170.0
% Shareholding – September 2016 Key Institutional Investors – September 2016 % Holding
Goldman Sachs India 4.74% Kuwait Investment Authority Fund 3.61% DSP Blackrock MF 3.55% Tata MF 2.98% Morgan Stanley 2.54% Macquarie Asia 2.23% Reliance MF 1.90% ICICI Prudential MF 1.67% Aadi Financial Advisors LLP 1.49% SBI MF 1.20% Sundaram MF 1.06%
Promoter & Promoter
Group, 48.70
FII, 16.83
DII, 13.72
Inox Benefit Trust, 4.51
Public / Others, 16.24
150
200
250
300
Apr-16 May-16 Jun-16 Jul-16 Aug-16 Sep-16 Oct-16
Share Price Performance
Source: Company
Source: BSE

19
ANNEXURE

CONSOLIDATED P&L STATEMENT
20
Particulars (In Rs Cr) Q2 FY17 Q2 FY16 YoY % Q1 FY17 QoQ % H1 FY17 H1 FY16 YoY %
Revenue from Operations 297.4 307.8 -3.4% 336.9 -11.7% 634.3 610.3 3.9%
Exhibition Cost (Distributor Share) 86.7 86.6 0.1% 95.4 -9.1% 182.1 171.8 6.0%
Food & Beverages Cost 18.3 17.5 4.6% 18.4 -0.3% 36.7 35.9 2.2%
Employee Benefits Expense 21.8 17.8 22.3% 21.6 0.8% 43.4 36.0 20.8%
Property Rent, Conducting Fees 44.0 40.8 7.9% 46.5 -5.3% 90.5 79.5 13.8%
CAM, Power & Fuel, R&M 43.5 44.5 -2.4% 45.0 -3.4% 88.5 83.9 5.4%
Other Expenses 55.9 44.0 27.0% 47.9 16.5% 103.8 82.1 26.5%
EBITDA 27.2 56.5 -51.9% 62.1 -56.2% 89.3 121.0 -26.2%
EBITDA Margin % 9.1% 18.4% -922bps 18.4% -928bps 14.1% 19.8% -576bps
Depreciation & Amortisation 20.8 19.6 5.7% 20.3 2.4% 41.0 39.4 4.2%
Other Income 2.1 2.0 3.7% 2.5 -14.9% 4.6 3.5 31.7%
Finance Cost 5.8 6.2 -5.4% 5.8 0.9% 11.6 12.4 -6.0%
Exceptional Items 0.0 0.0 - 0.0 - - 0.0 -
PBT 2.7 32.7 -91.7% 38.5 -93.0% 41.2 72.8 -43.4%
Tax Expense 1.1 11.5 -90.2% 13.6 -91.7% 14.7 26.3 -44.1%
PAT 1.6 21.3 -92.6% 25.0 -93.7% 26.5 46.5 -43.0%
Share of Associates / Joint Ventures -0.0 0.0 - 0.0 - -0.0 0.0 -
Minority Interest 0.0 -0.0 - 0.0 - 0.0 -0.0 -
PAT after share of associates/JVs/Minority Interest 1.6 21.3 -92.6% 25.0 -93.7% 26.5 46.5 -43.0%
PAT Margin % 0.5% 6.9% -638bps 7.4% -688bps 4.2% 7.6% -344bps
Earnings Per Share (EPS) 0.17 2.31 -92.6% 2.72 -93.8% 2.89 5.07 -43.0%

CONSOLIDATED BALANCE SHEET STATEMENT
21
Particulars (In Rs Cr) September-16
Equity Share Capital 96.2
Other Equity 486.4
Interest in Inox Benefit Trust, at cost -32.7
Equity attributable to owners of the company 549.9
Non-Controlling Interest -0.0
Total Equity 549.9
Non-current liabilities:
Borrowings 199.4
Other Financial Liabilities 2.5
Other Non-current Liabilities 96.5
Provisions 9.6
Total of Non-Current Liabilities 308.0
Current Liabilities:
Borrowings 0.0
Trade Payables 70.1
Other Financial Liabilities 90.5
Other Current Liabilities 44.4
Provisions 14.9
Current Tax Liabilities (Net) 7.4
Total of Current Liabilities 227.3
Total Equity & Liabilities 1,085.2
Particulars (In Rs Cr) September-16
Non-Current Assets:
Property, Plant & Equipment 630.0
Capital work-in-progress 53.8
Intangible Assets 30.4
Investments 1.3
Other Financial Assets 140.1
Deferred Tax Assets (Net) 50.3
Other Non Current Assets 74.7
Total Non Current Assets 980.6
Current Assets:
Investments 0.2
Inventories 9.1
Trade Receivables 55.6
Cash and Bank Balances 13.3
Other Financial Assets 2.9
Other Current Assets 23.5
Total Current Assets 104.6
Total Assets 1,085.2

BRIEF PROFILE
22
BUSINESS OVERVIEW
KEY STRENGTHS
STRONG FINANCIALS
Inox Leisure Limited (ILL), incorporated in 1999, is one of the largest multiplex operator in India ILL is a part of Inox Group which is diversified across industrial gases, engineering plastics, refrigerants, chemicals, cryogenic
engineering, renewable energy and entertainment sectors ILL currently operates 112 properties (440 screens and 112,549 seats) located in 57 cities across India, being the only multiplex
operator having such a diverse presence across pan India The company accounts for ~19% share of the multiplex screens in India and ~8% share of domestic box office collections The company has aggressively scaled up through organic and inorganic expansion over last decade growing from 2 properties –
8 screens in FY03 to 112 properties – 440 screens at present, virtually adding on an average 3 screens every month over more than a decade.
One of the largest multiplex chains in India Most diversified distribution of multiplexes in India Premium multiplex properties, state of the art technology and unmatched service and ambience Strong partnerships with more than 50 leading Indian and Global brands, offering high growth potential for advertising and
other ancillary revenues Strong management team and recognized and trusted corporate group
Consolidated Revenues, EBITDA and PAT were Rs 1,332.7 cr, Rs 189.9 cr and Rs 77.5 cr in FY16 having grown at CAGR of 20%, 27% and 107% over FY12 to FY16 (as per IGAAP)
Robust operating performance driven by rising footfalls, high ticket prices, highly profitable F&B service, focus on other operating income
Strong balance sheet with Gross Debt of Rs 267.0 cr, Net Debt of Rs 239.9 cr and Equity of Rs 590.8 cr in FY16 with D/E ratio of 0.5x

STRONG PEDIGREE
23
90 year track record of ethical business growth. USD $3Bn Inox Group is diversified across industrial gases, engineering plastics, refrigerants, chemicals, cryogenic engineering, renewable energy and entertainment. More than 9,000 employees at more than 150 business units across India. Distribution network spread across more than 50 countries around the world.
Listed Companies Other Key Companies
Inox Leisure Limited
Largest producer of chloromethanes, refrigerants and Polytetrafluoroethylene in India
Pioneer of carbon credits in India
Inox Air Products Private Limited
50:50 joint venture with Air Products Inc., USA
Largest producer of industrial gases in India
40 plants spread throughout the country
Engaged in the business of setting up and operating of wind farms
Existing operating capacity of ~ 260 MW in states of Rajasthan, Maharashtra, Tamil Nadu and Madhya Pradesh
One of the largest multiplex chain in India
In the business of setting up, operating and managing a national chain of multiplexes under the brand name ‘INOX’
Present in 57 cities with 112 multiplexes and 440 screens
Gujarat Fluorochemicals Limited
Largest producer of cryogenic liquid storage and transport tanks in India
Offers comprehensive solutions in cryogenic storage, vaporization and distribution engineering
Has operations in India, USA, Canada, Netherlands and Brazil
Inox India Private Limited
Inox Renewables Limited
STRONG SPONSORSHIP OF INOX GROUP - RECOGNIZED AND TRUSTED CORPORATE GROUP
Fully integrated player in the wind energy market
State-of-the-art manufacturing plants near Ahmedabad (Gujarat) and at Una (Himachal Pradesh) and new facility in Madhya Pradesh. Madhya Pradesh facility one of the largest in Asia
Ability to provide end-to-end turnkey solutions for wind farms
Inox Wind Limited

TRACK RECORD OF AGGRESSIVE EXPANSION
24
Note: Includes Acquisition of 1. 89 Cinemas in FY08, 2. Fame India in FY11, 3. Satyam Cineplexes in FY15
ON AN AVERAGE ADDITION OF 3 SCREENS EVERY MONTH OVER THE LAST DECADE
8 12 25 35
51 76
91 119
239 257
279
310
372
420 440
2 3 6
9 14
22 26
32
63 68
72 79
96
107 112
FY03 FY04 FY05 FY06 FY07 FY08 FY09 FY10 FY11 FY12 FY13 FY14 FY15 FY16 Oct-16
Screens Properties

25
PAN INDIA PRESENCE
Includes 7 management properties with 23 screens and 5,763 seats
Well Diversified Distribution of
Multiplexes across India
Access to Wide Variety of
Regional Content
Lower Dependency on Hindi and English
Content
East, 9
West, 19
South, 12
North, 17
East, 72
West, 174 South, 100
North, 94
East, 19
West, 42 South, 24
North, 27
East, 18,805
West, 45,957
South, 23,837
North, 23,950
57 Cities 112 Properties
440 Screens 1,12,549 Seats

STRONG BRAND PARTNERSHIPS
26
BFSI FMCG CONSUMER DURABLES AUTOMOBILES ECOMMERCE &TELECOMM.
OTHERS GEC

6.0%
9.4%
11.5%
6.1%
12.4%
1.3%
5.7%
10.3%
3.8%
12.2%
FY12 FY13 FY14 FY15 FY16
ROCE % ROE %
FINANCIAL SUMMARY – LAST 5 YEARS
27
REVENUES * EBITDA & EBITDA MARGIN PAT & PAT MARGIN
REVENUES - SEGMENT BREAKUP LEVERAGE ANALYSIS RETURN METRICS
ROE: PAT/Avg. Equity, ROCE: EBIT/Avg. Capital Employed [(Capital Employed = Equity + Total Debt)
644.9 765.3
868.8 1,016.8
1,332.7
FY12 FY13 FY14 FY15 FY16
72.9 98.0
122.0 122.8
189.9
11.3% 12.8% 14.0% 12.1% 14.2%
FY12 FY13 FY14 FY15 FY16
EBITDA EBITDA Margin %
4.2 18.5
36.9 20.0
77.5
0.7% 2.4% 4.3%
2.0% 5.8%
FY12 FY13 FY14 FY15 FY16
PAT PAT Margin %
CAGR: 20%
CAGR: 27% CAGR: 107%
244.0 281.0 242.2 241.2 267.0
320.3 324.6 390.9 676.2 590.8
0.8 0.9 0.6
0.4 0.5
FY12 FY13 FY14 FY15 FY16
Debt Equity Debt to EquityIn Rs Cr
73% 73% 69% 66% 68%
18% 19% 19% 19% 20%
5% 4% 6% 8% 7%
5% 4% 7% 7% 5%
FY12 FY13 FY14 FY15 FY16
GBOC F & B Adv Others
* Revenues as per IGAAP

28
THANK YOU
FOR FURTHER QUERIES:
Nayana Borthakur AVP - Brand & Corporate Communication Contact No: +9122 4062 6900 Email: [email protected]
Nilesh Dalvi IR Consultant Contact No:+91 9819289131 Email ID: [email protected]