insar water vapour correction models: gps, modis, meris...
TRANSCRIPT
InSAR water vapour correction models: GPS, MODIS, MERIS and InSAR integration
Zhenhong Li(1), Eric J. Fielding(2), Paul Cross(1), and Jan-Peter Muller(1)
(1): Department of Geomatic Engineering, University College London, UK
(2): JPL, California Institute of Technology, Pasadena, California, USA
Sponsored by:
ContentsIntroduction to water vapour products
Water vapour effects on InSAR measurements
InSAR water vapour correction models
GPS Topography-dependent Turbulence Model (GTTM)
MODIS-based water vapour correction model
MERIS water vapour correction model
MERIS+MODIS water vapour correction model
Discussion and Conclusions
Water vapour products used in this study
GPS((GGlobal lobal PPositioning ositioning SSystem)ystem)
MODIS ((ModModerate Resolution erate Resolution IImaging maging SSpectroradiometerpectroradiometer))
MERIS ((MEMEdiumdium RResolution esolution IImaging maging SSpectrometer)pectrometer)
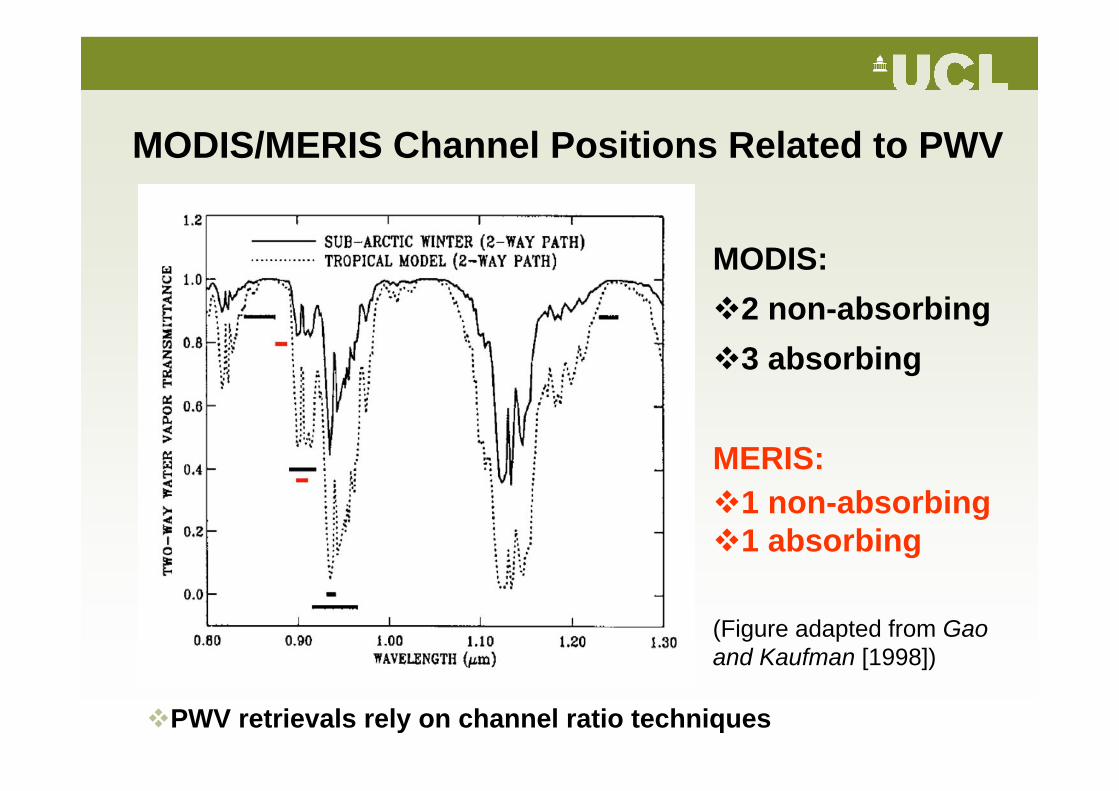
PWV retrievals rely on channel ratio techniques
MODIS/MERIS Channel Positions Related to PWV
MODIS: 2 non-absorbing 3 absorbing
MERIS:1 non-absorbing 1 absorbing
(Figure adapted from Gaoand Kaufman [1998])
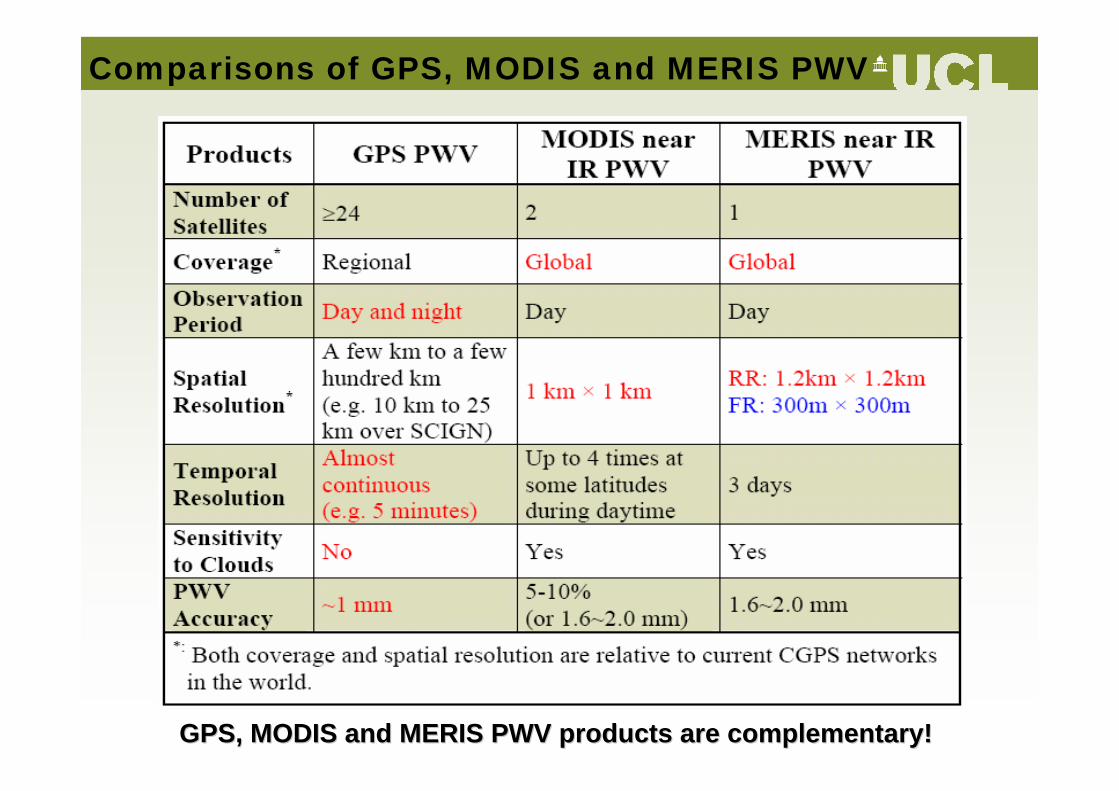
Comparisons of GPS, MODIS and MERIS PWV
GPS, MODIS and MERIS PWV products are complementary!GPS, MODIS and MERIS PWV products are complementary!
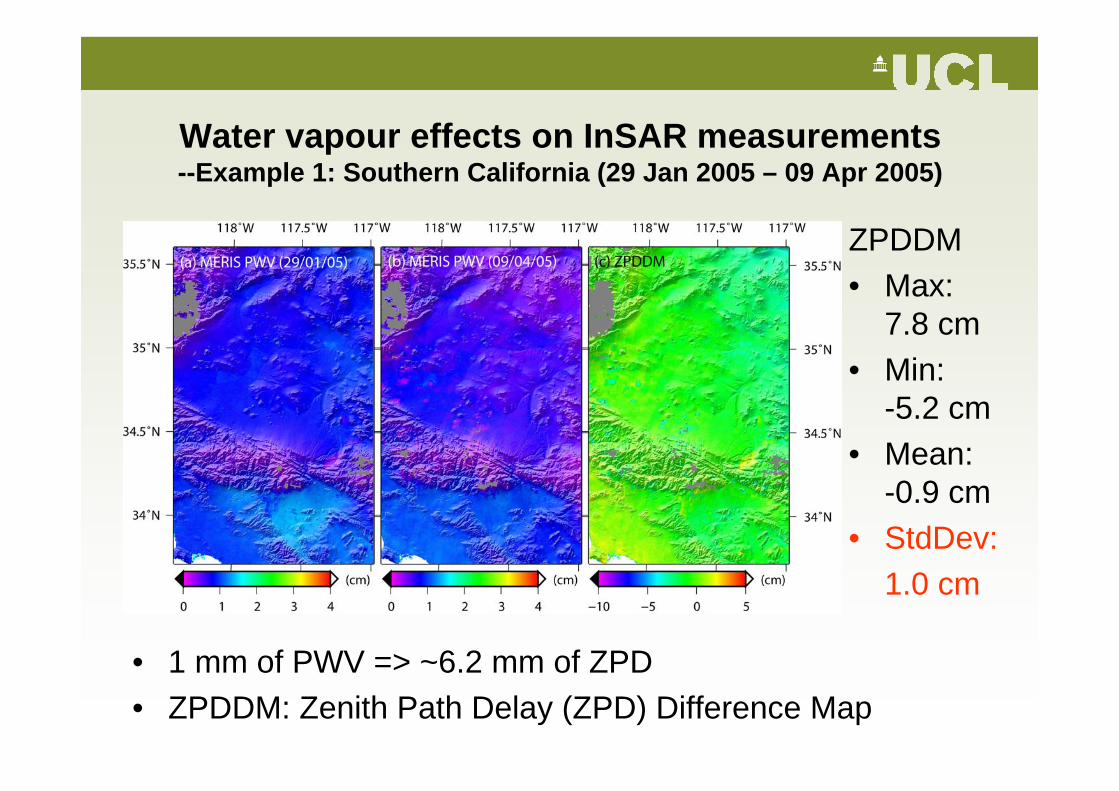
Water vapour effects on InSAR measurements--Example 1: Southern California (29 Jan 2005 – 09 Apr 2005)
• 1 mm of PWV => ~6.2 mm of ZPD• ZPDDM: Zenith Path Delay (ZPD) Difference Map
ZPDDM• Max:
7.8 cm• Min:
-5.2 cm• Mean:
-0.9 cm• StdDev:
1.0 cm
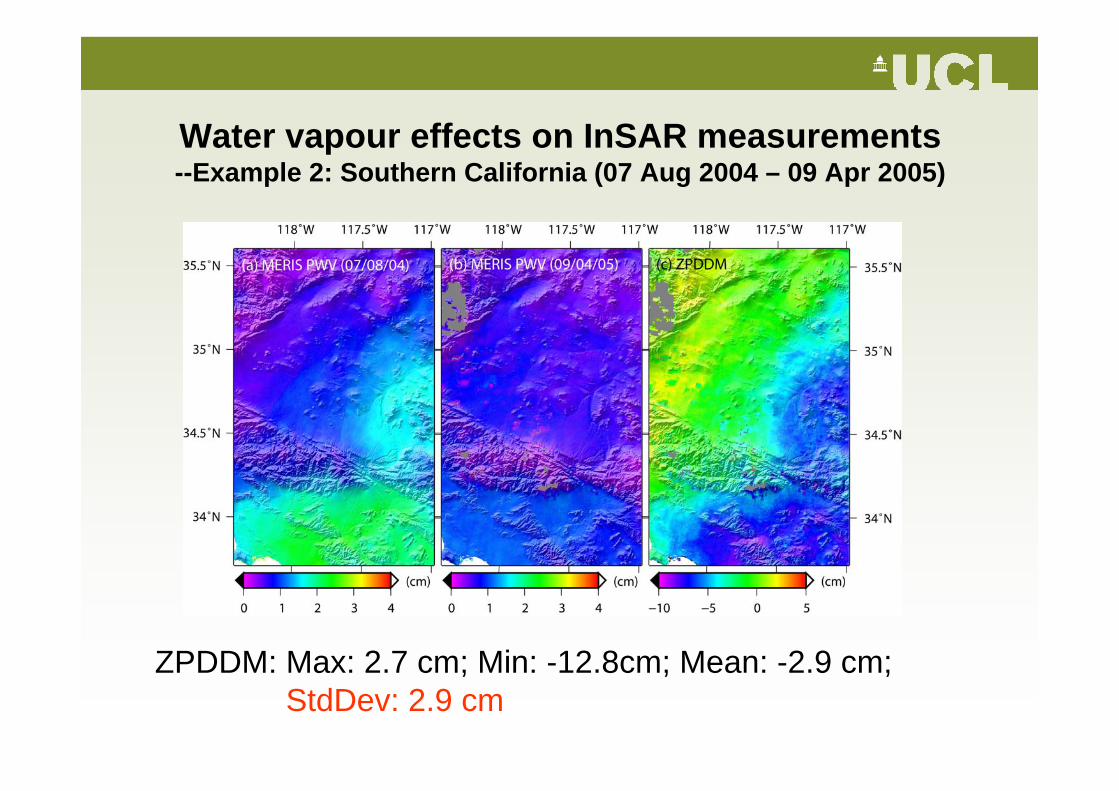
Water vapour effects on InSAR measurements--Example 2: Southern California (07 Aug 2004 – 09 Apr 2005)
ZPDDM: Max: 2.7 cm; Min: -12.8cm; Mean: -2.9 cm; StdDev: 2.9 cm
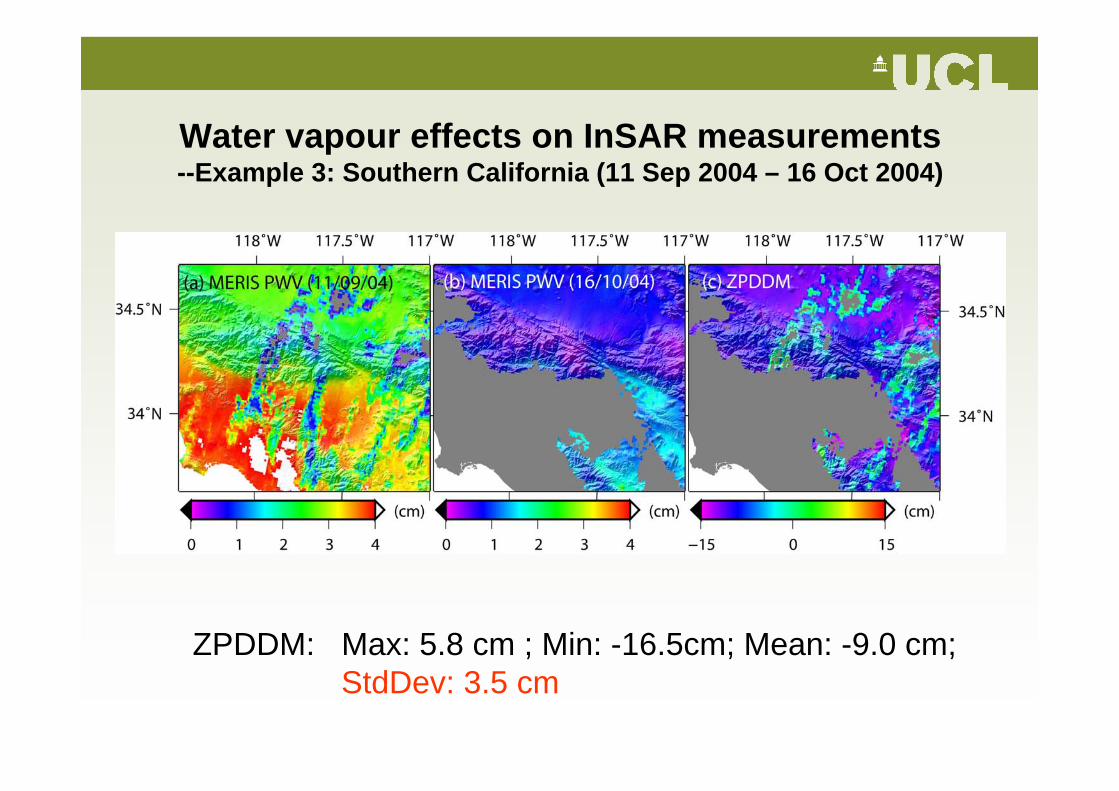
Water vapour effects on InSAR measurements--Example 3: Southern California (11 Sep 2004 – 16 Oct 2004)
ZPDDM: Max: 5.8 cm ; Min: -16.5cm; Mean: -9.0 cm; StdDev: 3.5 cm
GPS Topography-dependent Turbulence Model (GTTM)
Underlying assumptions of GTTM:
Water vapour variations conform temporally and spatially to a statistical turbulent model;
Water vapour distributions are correlated with topography.
Key Finding: Interpolation methods should be applied to Zenith Path Delay differences (NOT ZPD themselves) (Li et al., 2005, JGR, in press)
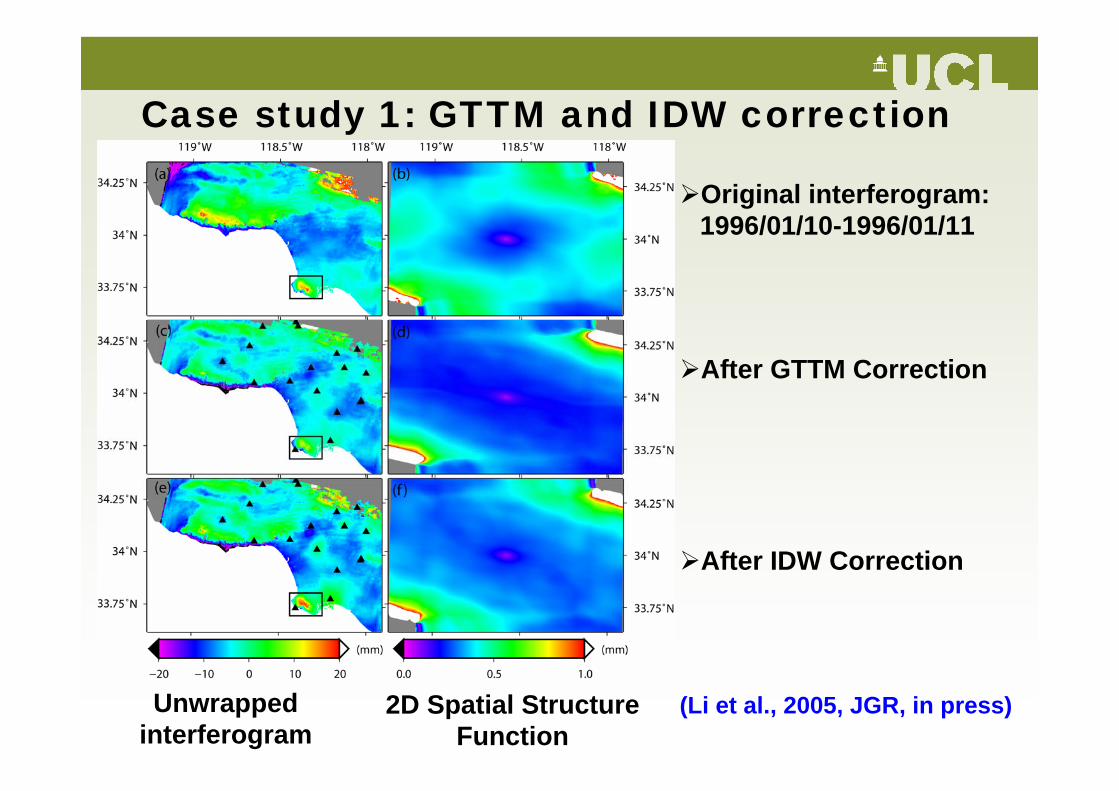
Case study 1: GTTM and IDW correction
Original interferogram: 1996/01/10-1996/01/11
After GTTM Correction
After IDW Correction
(Li et al., 2005, JGR, in press)Unwrapped interferogram
2D Spatial Structure Function
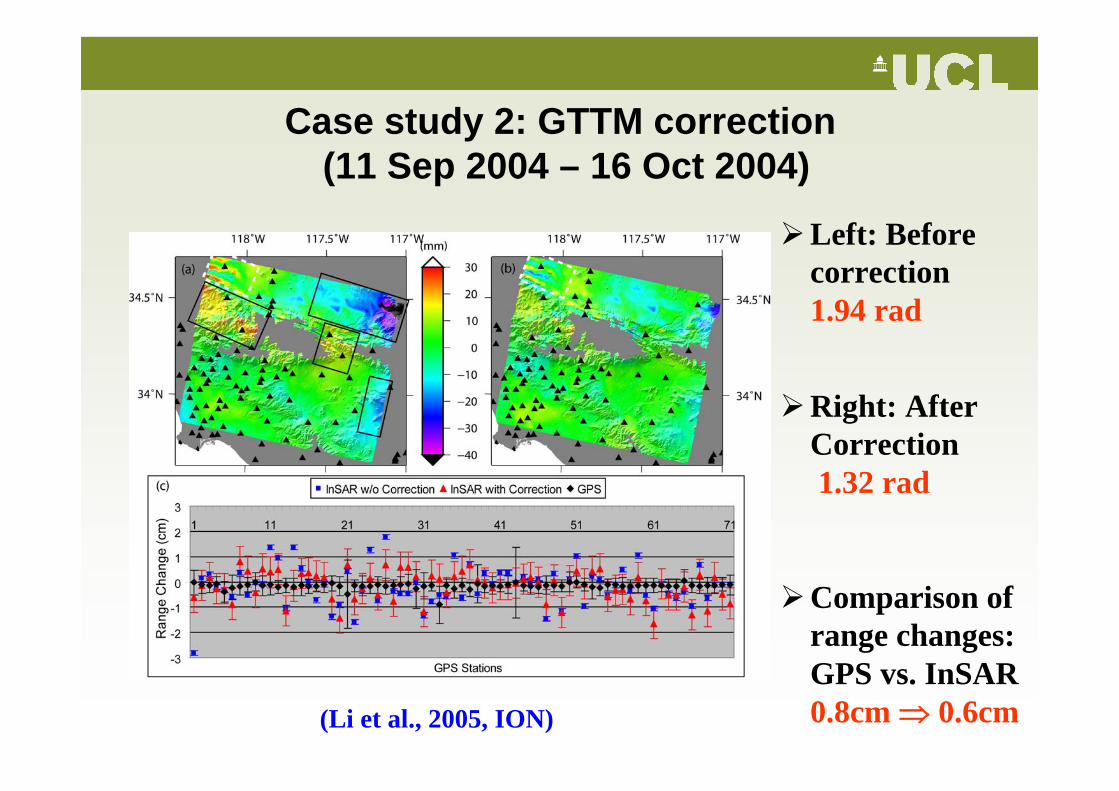
Case study 2: GTTM correction(11 Sep 2004 – 16 Oct 2004)
(Li et al., 2005, ION)
Left: Before correction1.94 rad
Right: After Correction1.32 rad
Comparison of range changes:GPS vs. InSAR0.8cm ⇒ 0.6cm
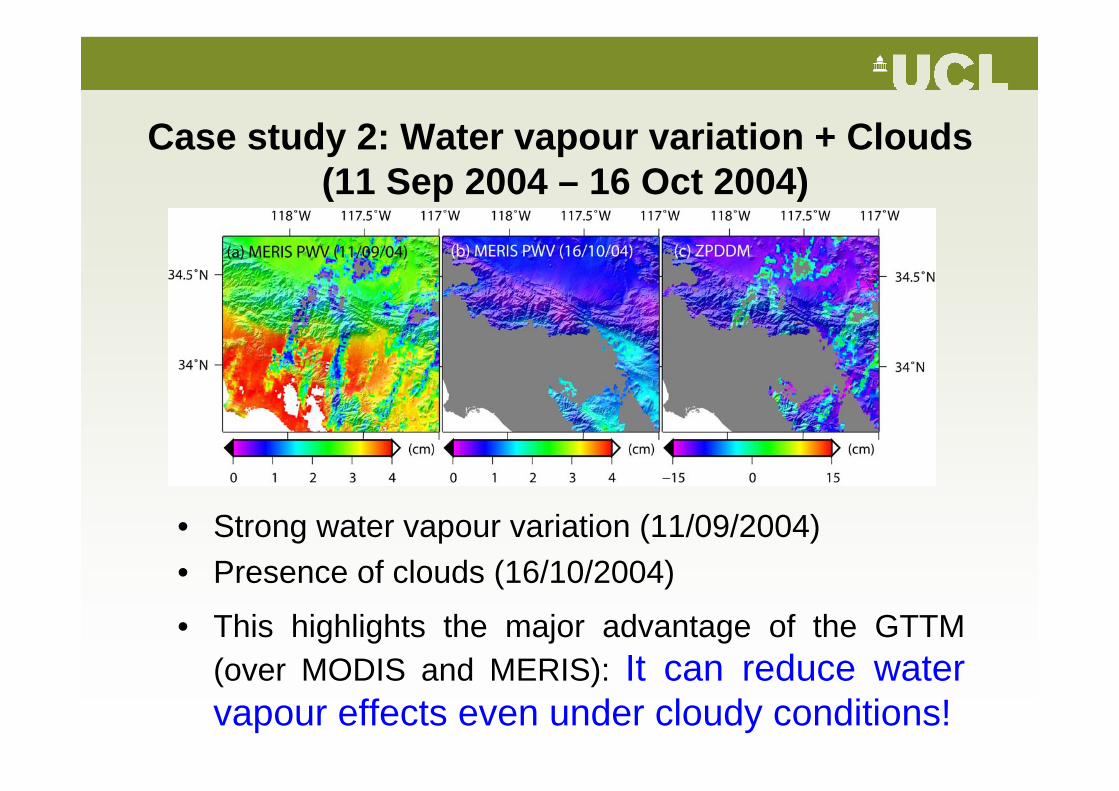
Case study 2: Water vapour variation + Clouds (11 Sep 2004 – 16 Oct 2004)
• Strong water vapour variation (11/09/2004)• Presence of clouds (16/10/2004)
• This highlights the major advantage of the GTTM (over MODIS and MERIS): It can reduce water vapour effects even under cloudy conditions!
MODIS-based (or GPS/MODIS integrated) water vapour correction model
Basic principles:
There is a scale uncertainty in MODIS near-IR water vapour products (Li et al., 2003, JGR)
Only one continuous GPS station is required to calibrate MODIS scale uncertainty within a 2,030 km × 1,354 km MODIS scene
GPS and MODIS data can be integrated to provide regional water vapour fields with a spatial resolution of 1 km × 1 km
~60 minute time difference between ENVISAT and MODIS
Li, Z, J-P Muller, P Cross and E Fielding, InSAR atmospheric correction: GPS, MODIS and InSAR integration. JGR - Solid Earth, 110, B03410, 2005
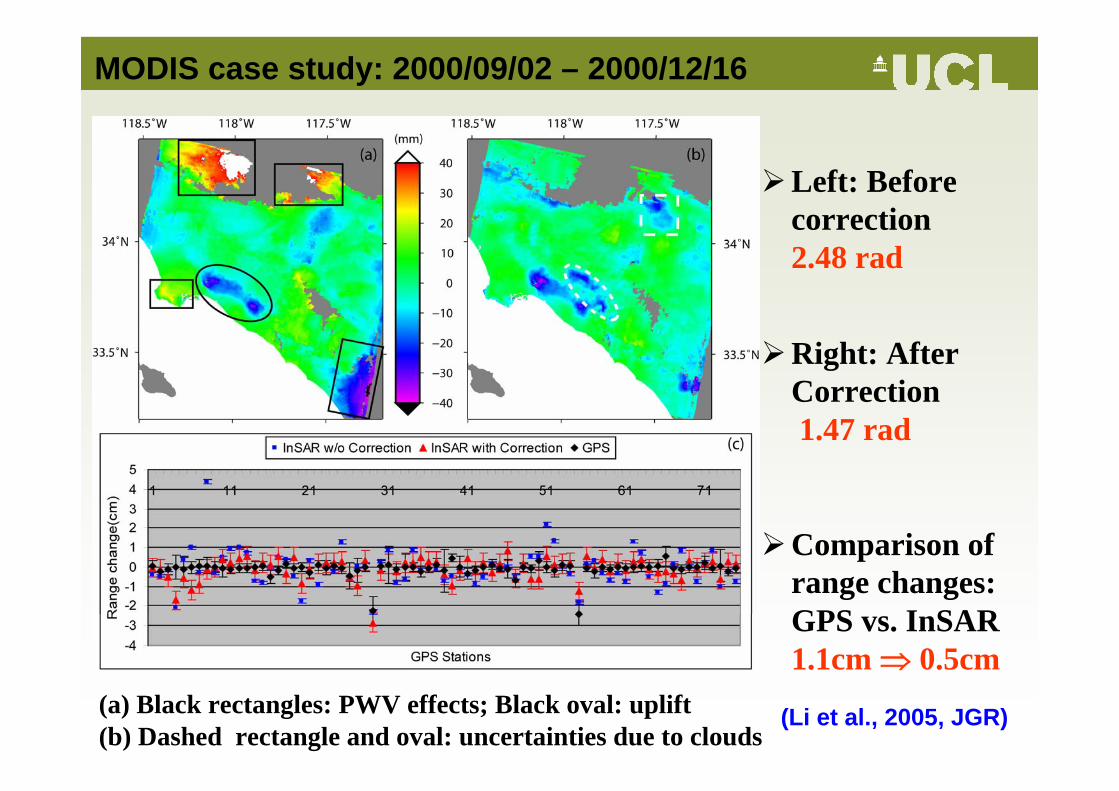
MODIS case study: 2000/09/02 – 2000/12/16
Left: Before correction2.48 rad
Right: After Correction1.47 rad
Comparison of range changes:GPS vs. InSAR1.1cm ⇒ 0.5cm
(a) Black rectangles: PWV effects; Black oval: uplift(b) Dashed rectangle and oval: uncertainties due to clouds
(Li et al., 2005, JGR)
MERIS water vapour correction model
MERIS data can be acquired at the same time as ASAR data (time differences between MODIS and SAR data: ~1 hour)
MERIS has better spatial resolution, up to 300 m against 1km for MODIS
MERIS near IR water vapour product agrees more closely with GPS than MODIS (Li et al., 2005, IJRS)
A paper on MERIS water vapour correction model is under review for Geophysical Research Letters
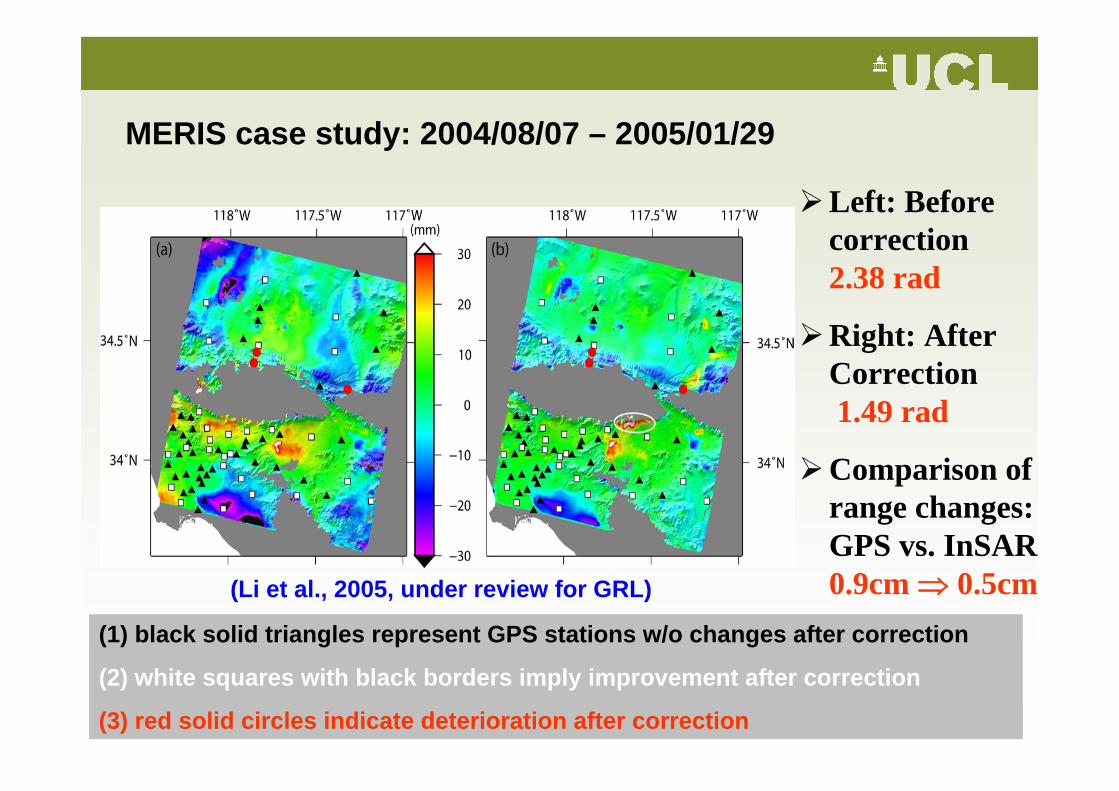
MERIS case study: 2004/08/07 – 2005/01/29
Left: Before correction2.38 rad
Right: After Correction1.49 rad
Comparison of range changes:GPS vs. InSAR0.9cm ⇒ 0.5cm
(1) black solid triangles represent GPS stations w/o changes after correction
(2) white squares with black borders imply improvement after correction
(3) red solid circles indicate deterioration after correction
(Li et al., 2005, under review for GRL)
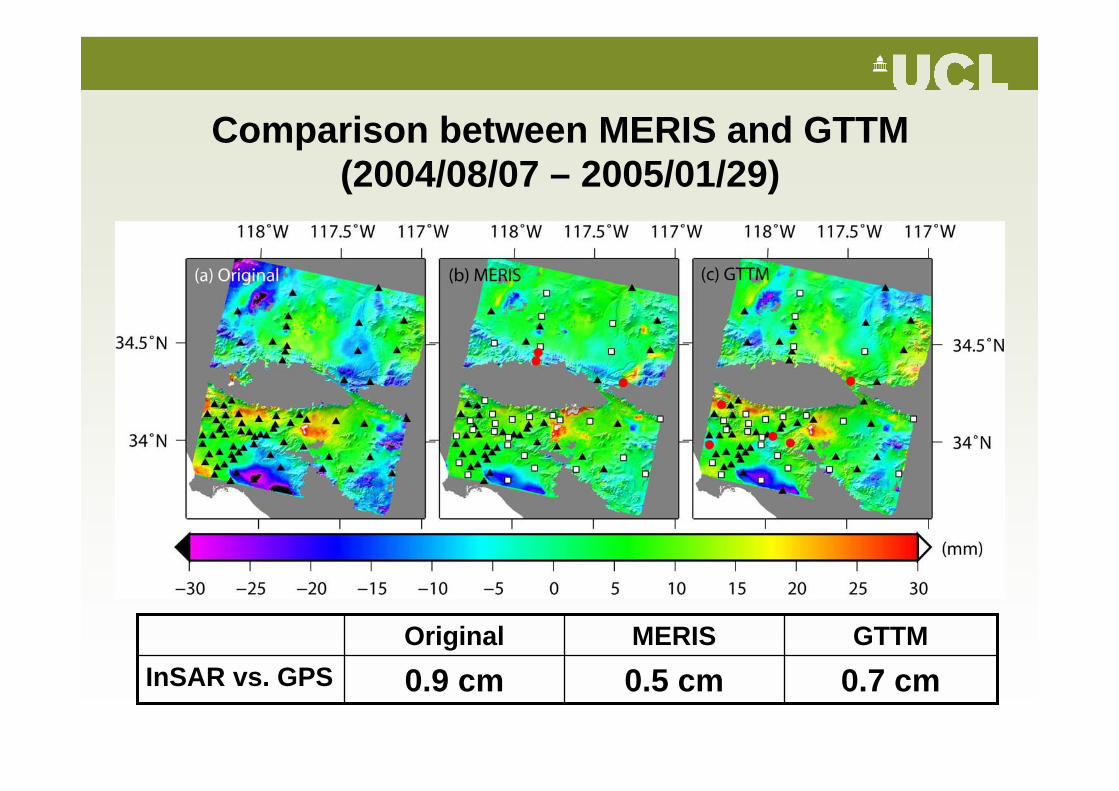
Comparison between MERIS and GTTM(2004/08/07 – 2005/01/29)
0.9 cmOriginal
0.7 cm0.5 cmInSAR vs. GPSGTTMMERIS
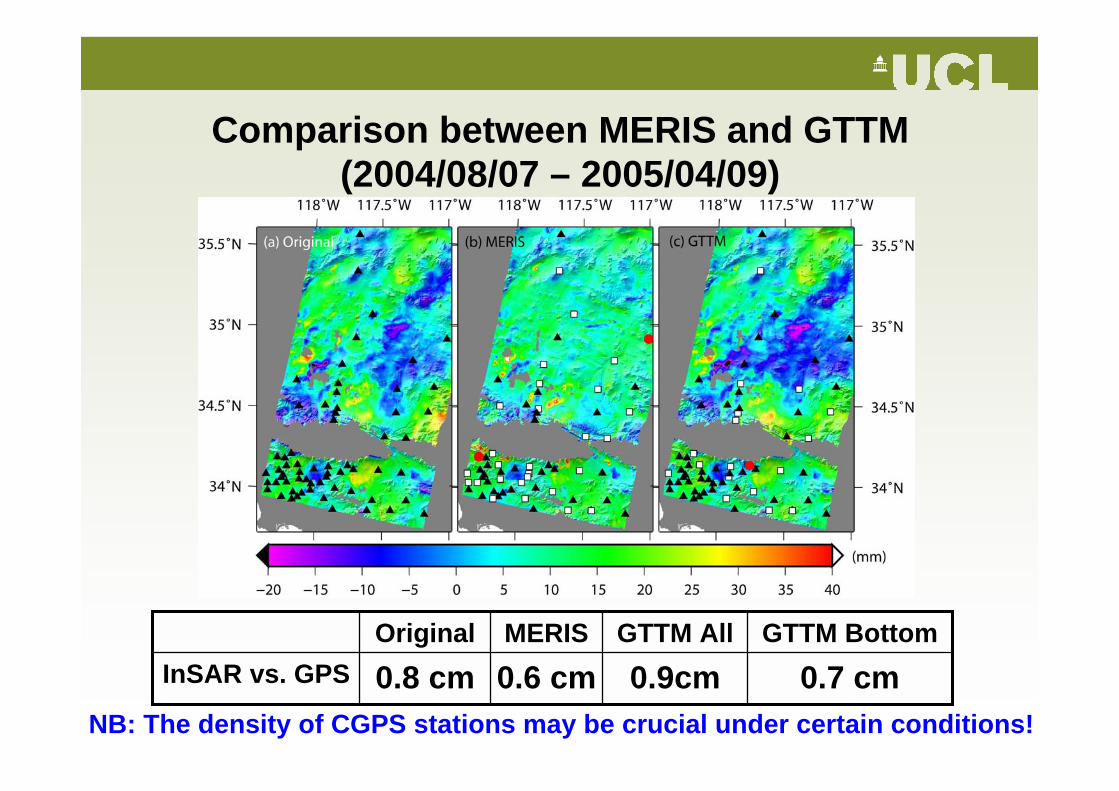
Comparison between MERIS and GTTM(2004/08/07 – 2005/04/09)
0.6 cmMERIS
0.7 cm0.8 cmOriginal
0.9cmInSAR vs. GPSGTTM BottomGTTM All
NB: The density of CGPS stations may be crucial under certain conditions!
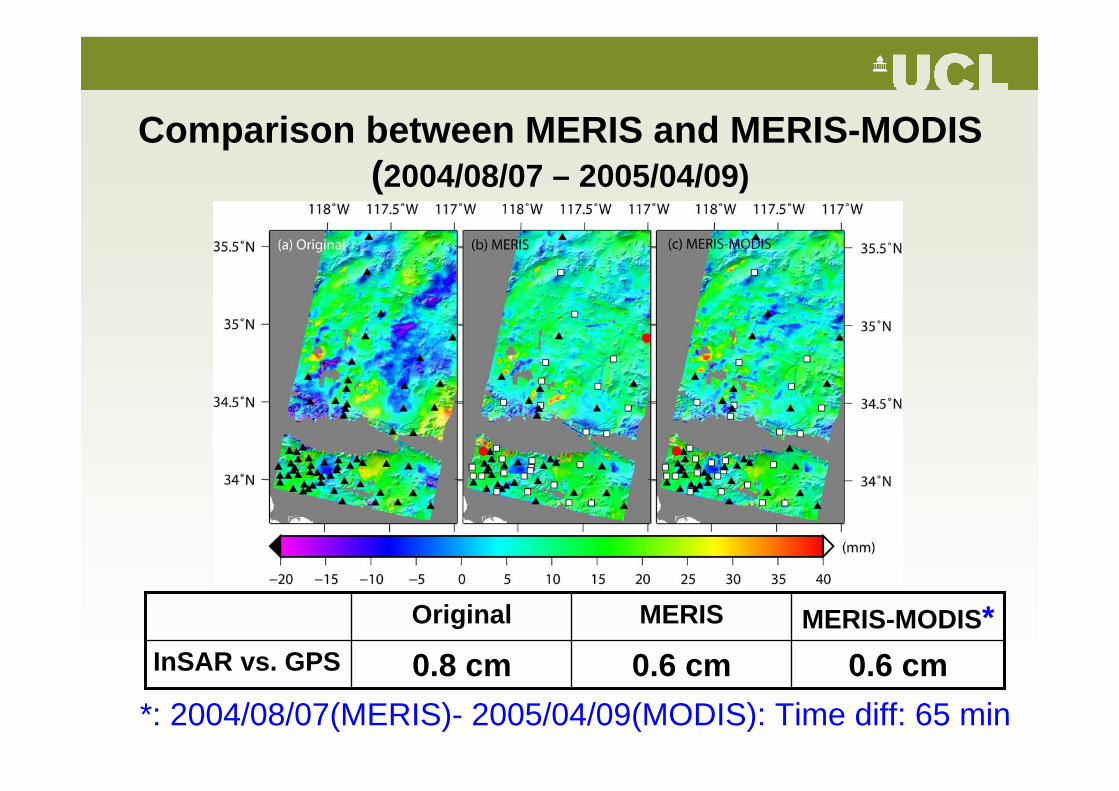
Comparison between MERIS and MERIS-MODIS(2004/08/07 – 2005/04/09)
0.8 cmOriginal
0.6 cm0.6 cmInSAR vs. GPSMERIS-MODIS*MERIS
*: 2004/08/07(MERIS)- 2005/04/09(MODIS): Time diff: 65 min
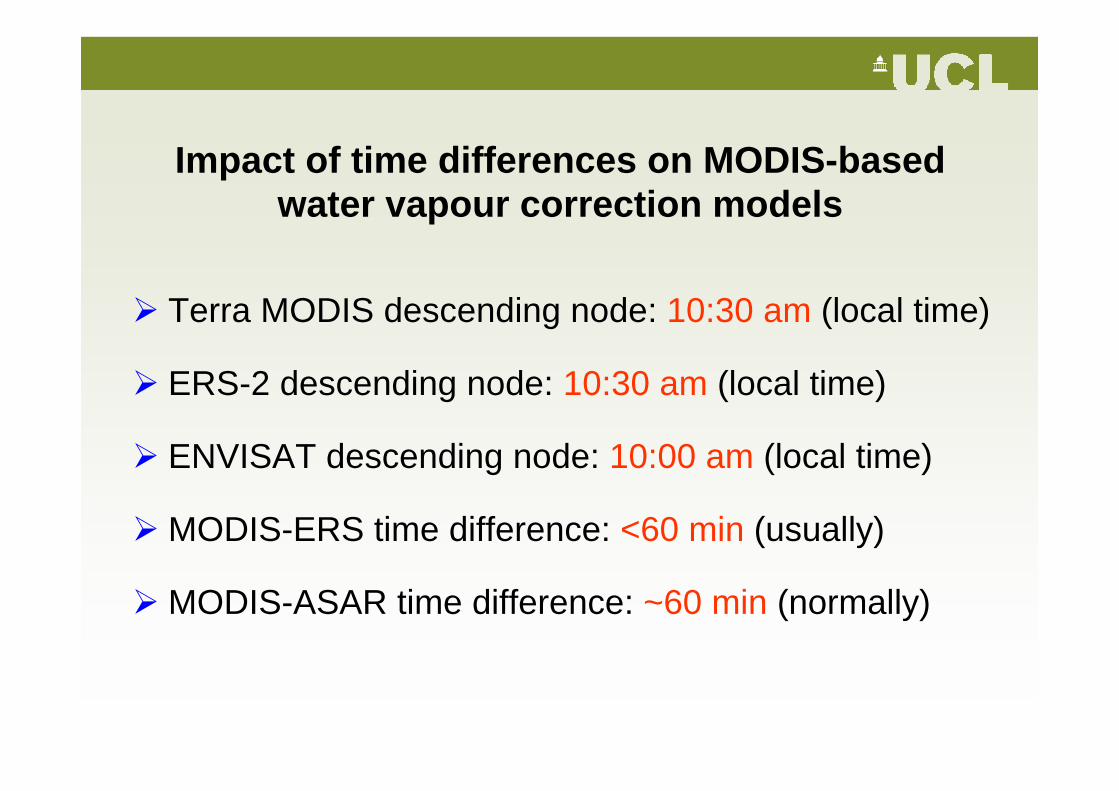
Impact of time differences on MODIS-based water vapour correction models
Terra MODIS descending node: 10:30 am (local time)
ERS-2 descending node: 10:30 am (local time)
ENVISAT descending node: 10:00 am (local time)
MODIS-ERS time difference: <60 min (usually)
MODIS-ASAR time difference: ~60 min (normally)
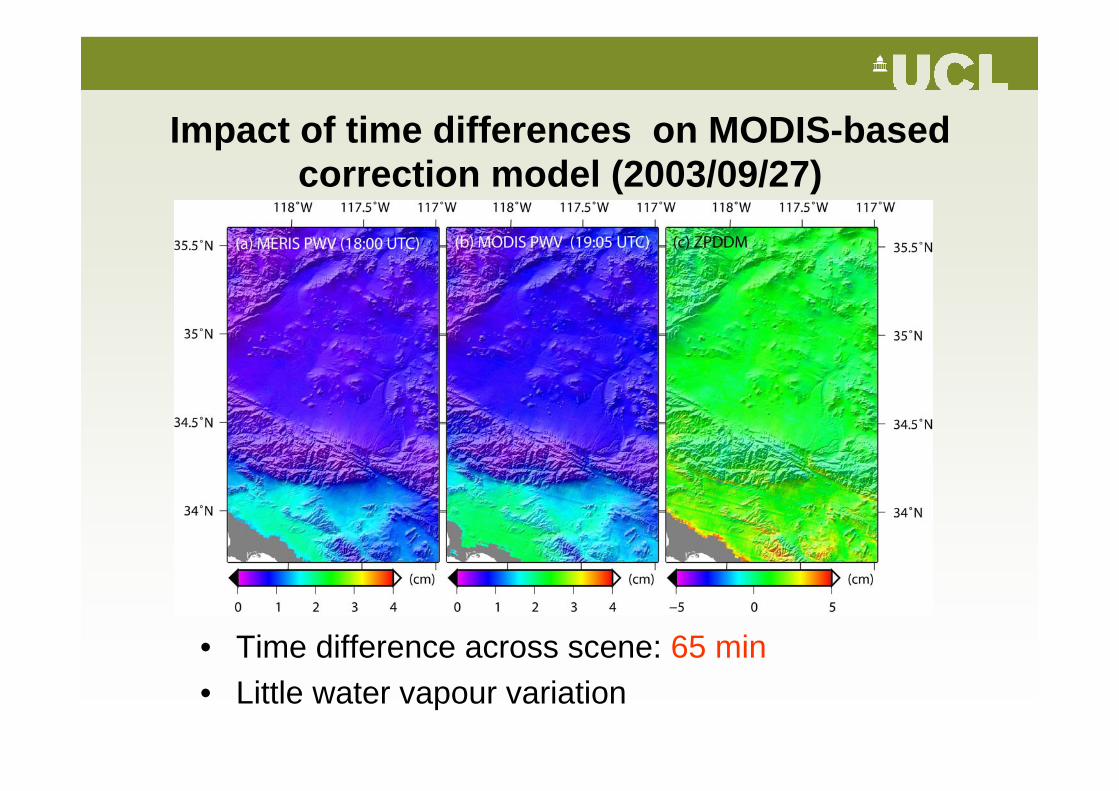
Impact of time differences on MODIS-based correction model (2003/09/27)
• Time difference across scene: 65 min• Little water vapour variation
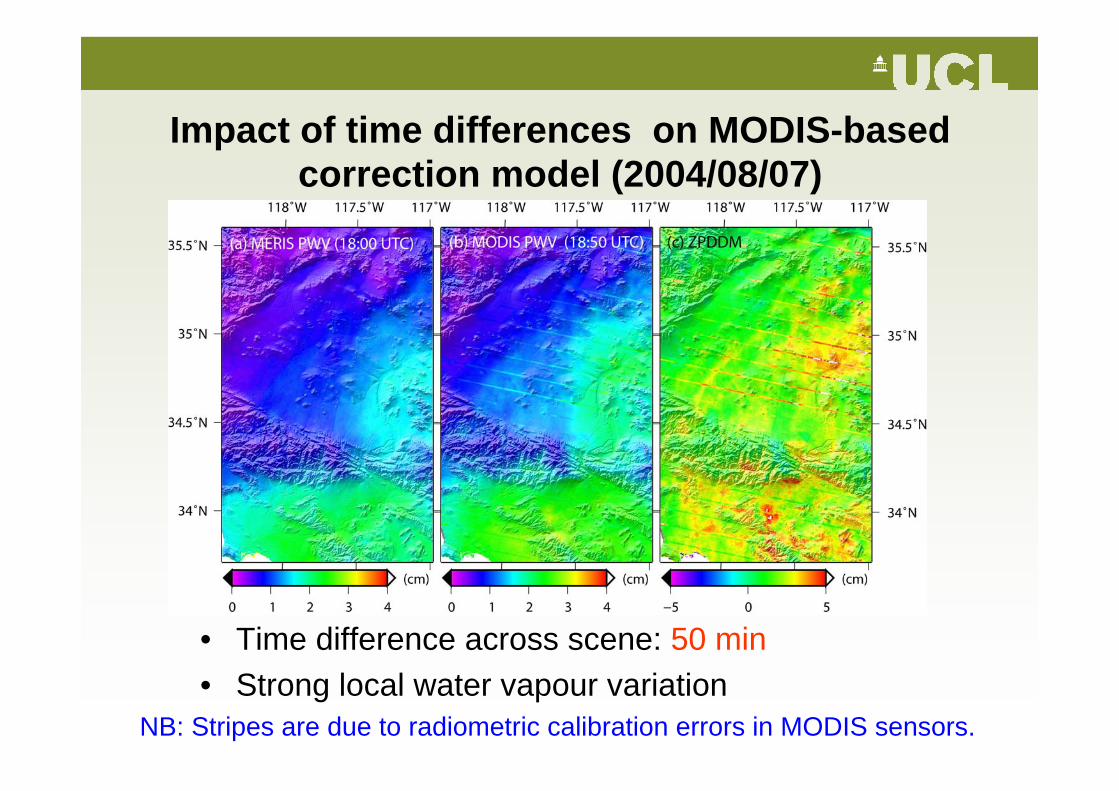
Impact of time differences on MODIS-based correction model (2004/08/07)
• Time difference across scene: 50 min• Strong local water vapour variation
NB: Stripes are due to radiometric calibration errors in MODIS sensors.
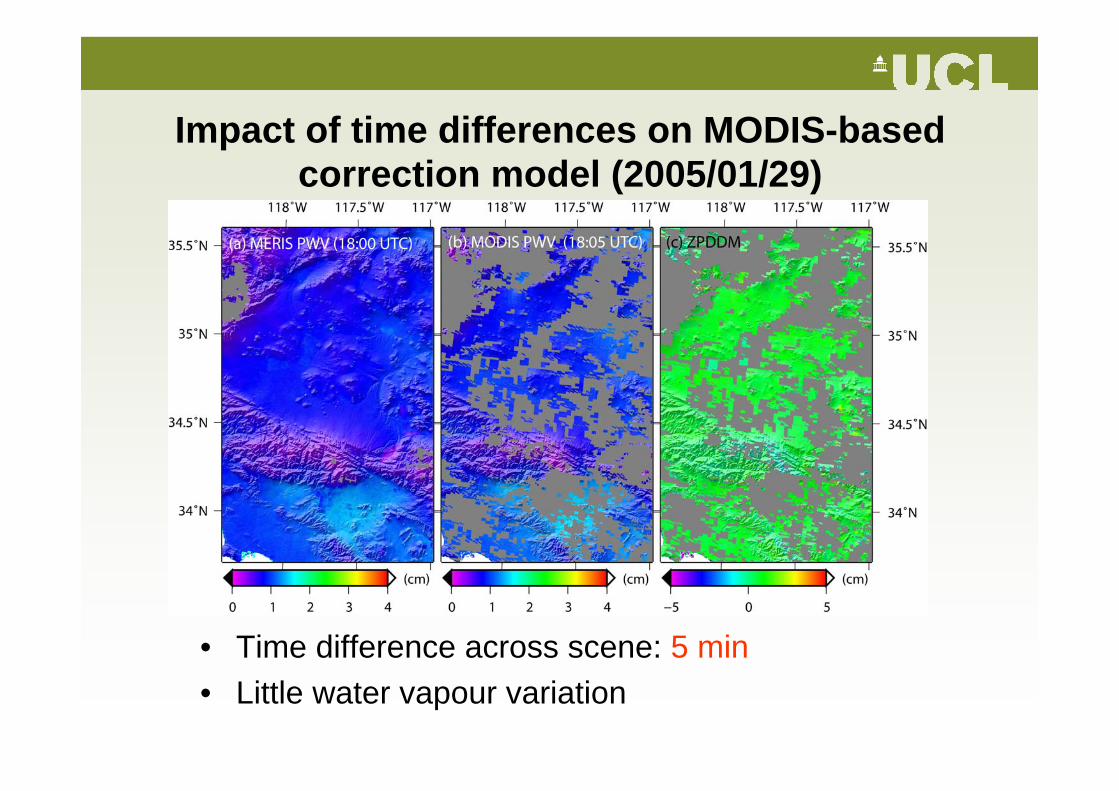
Impact of time differences on MODIS-based correction model (2005/01/29)
• Time difference across scene: 5 min• Little water vapour variation
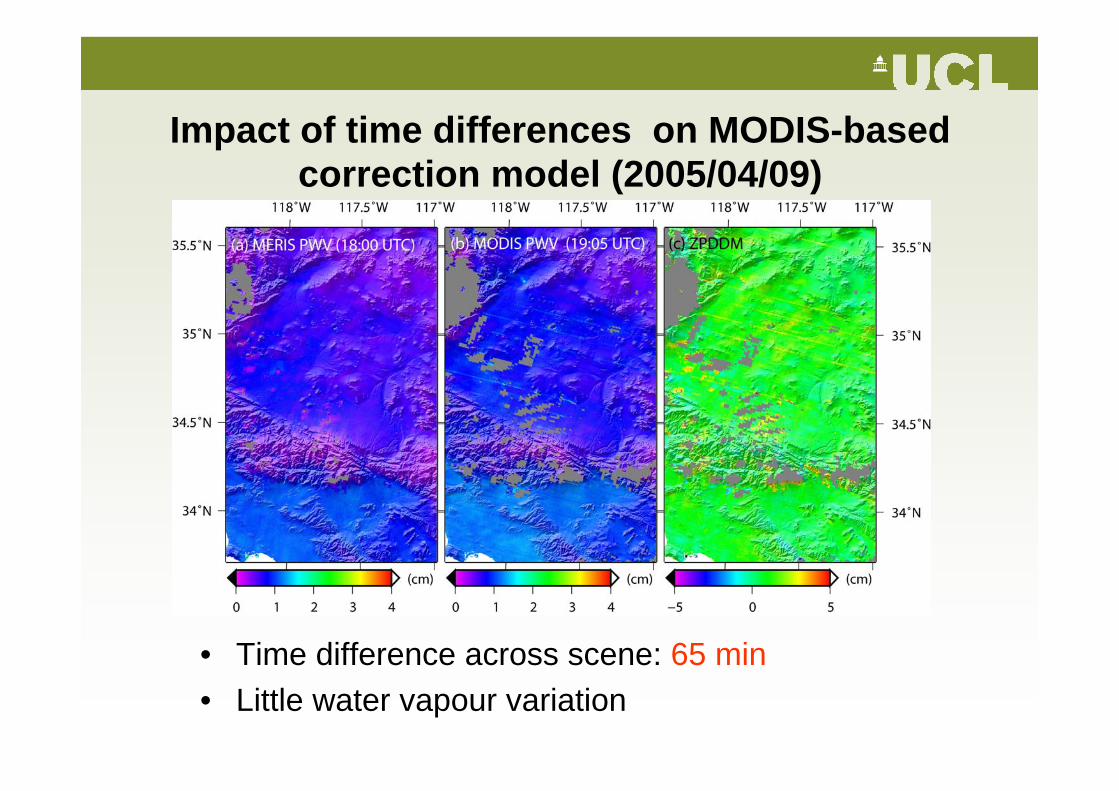
Impact of time differences on MODIS-based correction model (2005/04/09)
• Time difference across scene: 65 min• Little water vapour variation
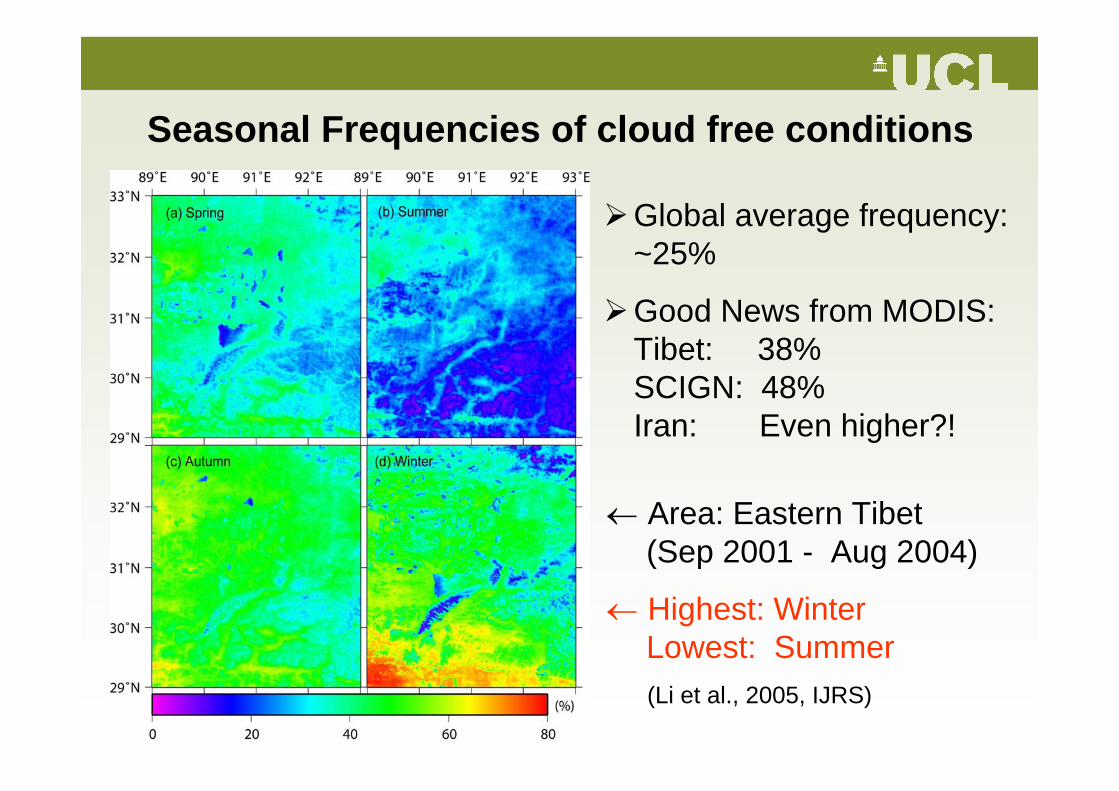
Global average frequency: ~25%
Good News from MODIS: Tibet: 38%SCIGN: 48% Iran: Even higher?!
Seasonal Frequencies of cloud free conditions
← Area: Eastern Tibet(Sep 2001 - Aug 2004)
← Highest: WinterLowest: Summer(Li et al., 2005, IJRS)
ConclusionsTHREE water vapour correction models (GTTM, MODIS & MERIS) have been developed & validated
It shows that the order of water vapour effects on interferograms can be reduced from ~10 mm to ~5 mm using water vapour correction model(s)
The impacts of time differences on MODIS-based models depend on water vapour distribution
Cloud free frequency is a major limitation for MODIS/MERIS models. BUT……
Current & future work
Water vapour field stacking + correction (Encouraging results achieved)
Water vapour correction + phase stacking(Ongoing)
Water vapour + Time series analysis (Ongoing)
Other water vapour products, e.g. infrared
Questions?