“inside the war on poverty: the impact of food … “inside the war on poverty: the impact of...
TRANSCRIPT

1
“Inside the War on Poverty:
The Impact of Food Stamps on Health”
Hilary Hoynes
UC Davis
Joint with Douglas Almond, Columbia University
and Diane Whitmore Schanzenbach, Northwestern University

Context for Research Agenda
• The food stamp program is currently the largest cash or near-cash anti-poverty program in the U.S.:
– In 2009 almost 1 in 9 persons received food stamps
– Only U.S. universal safety net program.
• Given the importance of food stamps, it is surprising that so little is known about the program
– The lack of credible evidence on the impacts of FSP derives from the fact that the program is national
– Little variation across space or time; no variation in program parameters that are typically exploited by researchers
– Most prior studies compare recipients to non-recipients (or structural modeling; some experiments)
• In our work, we identify the effect of the FSP using the county rollout of the program between 1961 and 1975
– First quasi experimental evidence on the FSP
2

3
0
25
50
75
100
125
150
175
200
1980 1985 1990 1995 2000 2005
Per
Cap
ita
Rea
l Exp
end
itu
res
Contractions
AFDC/TANF Cash Benefits Per Capita
Food Stamp Expenditures Per Capita
EITC Expenditures Per Capita
Federal welfare reform
The landscape providing assistance to poor families with
children has changed substantially

Food Stamps has become the fundamental safety net programComparison of current recession to early 1980s recession
4
-20
02
04
06
08
0
Pe
rcen
t C
han
ge
in F
SP
Ca
selo
ad p
er
ca
pita
0 2 4 6 8Change in unemployment rate
Food Stamps and Unemployment RateChange between 2007 and 2009
-20
02
04
06
08
0
Pe
rcen
t C
han
ge
in F
SP
Ca
selo
ad p
er
ca
pita
0 2 4 6 8Change in unemployment rate
Food Stamps and Unemployment RateChange between 1979 and 1982

Food Stamps has become the fundamental safety net programComparison to TANF; current recession
5
-20
02
04
06
08
0
Pe
rcen
t C
han
ge
in F
SP
Ca
selo
ad p
er
ca
pita
0 2 4 6 8Change in unemployment rate
Food Stamps and Unemployment RateChange between 2007 and 2009
-40
-20
02
04
0
Pe
rcen
t cha
ng
e in
AF
DC
/TA
NF
ca
selo
ad p
er
ca
pita
0 2 4 6 8Change in unemployment rate
Cash Welfare (TANF) and Unemployment RateChange between 2007 and 2009

6
Today’s talk draws on two papers
• “Inside the War on Poverty: The Impact of Food Stamps on Birth Outcomes”
– We use the full census of U.S. births and deaths from vital statistics to the examine the impact of the FSP on infant health
– Incidence of low birth weight, infant mortality
• “Childhood Exposure to the Food Stamp Program: Long‐run Health and Economic Outcomes”
– Panel Study of Income Dynamics and use county of birth to assign FSP exposure in early life
– Examine impact on adult BMI, health conditions, disability, economic outcomes
• Understanding the health effects of the FSP is important in its own right and for what it reveals about the relationship between income and health

7
Overview of presentation
• Food stamps as income? Mechanism for program
impacts
• History of the food stamp program (program rollout)
• Food stamps and infant health
– Identification strategy
– Data
– Results
• Food stamps and long run health and economic
outcomes

8
Basics of the food stamp program (SNAP)
• Means tested in-kind assistance program
– Income and asset tests determine eligibility
• Only U.S. means tested program that is not targeted;
universal safety net program
• Federal program; no area variation (other than AK, HI)
• Coupons issued which can be used in stores (recently most
states use debit cards)
– Can purchase all food items except prepared foods and alcoholic
beverages
• Benefits phased out as income increases; in 2009 benefits per
person-month averaged $125 (maximum benefit for a 2-person
family $323)

9
Food stamps as income? Mechanisms for program impacts
• Our earlier work (Hoynes and Schanzenbach AEJ Applied
2009) shows that households are infra-marginal
– Because most recipients received a Food Stamp benefit below
their normal food expenditures, the program is similar to an
income transfer
• Given this, we argue that our results provide an estimate of the
impact of an exogenous increase in income on health. Few
studies provide any convincing evidence on this issue.
• Nonetheless, because recipients were by definition poor, a large
portion of their FSP benefit was spent on food. Thus we expect
that one channel for health gains would operate through
improvement in nutrition
• Therefore, the goal of the analysis is twofold: (1) an evaluation
of FSP; and (2) does increasing income improve health?

10
Why infant health?
• Families represent a substantial fraction of the FSP caseload (60%)
• Increased infant health outcomes (birth weight) lead to cost
savings at birth as well as improvement in long term economic and
health outcomes
– See review in Almond and Currie (2010)
• Vital statistics data is appealing given that our research design
requires identification of counties (and statistical power in the
large samples)

11
Channels that FSP may affect infant health
• Increases in birth weight (without change in composition
of births)
• Composition changes (reduce birth weight)
– Increases in fertility among disadvantaged women
– Increases in fetal survival
Our results for infant mortality and fertility suggest that the
composition of births is not changing (and therefore not
biasing down the effects).

12
Food stamp program: Overview and program rollout

13
A Short History of the (modern) Food Stamp Program
• 1961 Pres. Kennedy executive order; established 8
county-level pilot programs; 1962-1963 expanded to 43
counties
• Food Stamp Act of 1964:
– gave local areas the authority to start up FSP in their county
– Federally funded
– Voluntary adoption by counties
• Steady increases in county adoption; constrained
somewhat by budgetary limits
• 1973 amendments to Food stamp act: mandated that all
counties offer FSP by 1975
14
Examining the timing of county introduction of food
stamps

15
Jan 1962

16
Jan 1963

17
Jan 1964

18
Jan 1965

19
Jan 1966

20
Jan 1967
21
Jan 1968
22
Jan 1969

23
Jan 1970
24
Jan 1971

25
Jan 1972

26
Jan 1973

27
Jan 1974

28
Jan 1975

29
• Our basic identification strategy uses this county level
variation in food stamp “treatment”

30
What existed prior to FSP?
• Commodity distribution program (CDP) was precursor to FSP
• Goal of CDP: support farm prices and farm income by removing
surplus commodities from market
• The evidence shows that the FSP represents an important
“treatment” over and above the CDP. The CDP:
– not universally available: in 1967, 1/3 of the poorest 1,000
counties offered no food assistance program
– limited range of products (most common items include flour,
cornmeal, rice, dried milk, cheese, butter)
– distribution centers that were difficult to reach
– infrequent timing of distribution of goods
• Nonetheless, unfortunately there is sparse data on county
participation in the CDP so we are unable to use this in our
empirical work

31
Percent of US population covered by FSP
Note: Figure shows the percent of counties participating in the FSP, weighted by the 1970
county population
0
20
40
60
80
100
1960 1962 1964 1966 1968 1970 1972 1974
Co
un
ties
Pa
rtic
ipati
ng
in
FS
P (
wei
gh
ted
%)
1961: Pilot
Programs
Initiated
1964 FSA:
Counties Can
Start FSP
1973 Amend:
Manditory FSP by
1975
Natality
micro
data start

32
How quickly do FS Programs ramp up?
Share of 1960 County Population on Food Stamps
by Number of Years from Program Start
0
0.01
0.02
0.03
0.04
0.05
0.06
0.07
0.08
0.09
0.1
-5 -4 -3 -2 -1 0 1 2 3 4 5
event year
sh
are
of
19
60
co
un
ty p
op
ula
tio
n
all counties program starts july, august, sept. program starts april, may, june
Program starts at end of
fiscal year
Program starts at
beginning of fiscal
year

33
Identification Strategy
(and is FSP introduction exogenous?)

34
General Methodology
• Use variation across counties in difference-in-difference model:
• Observations are at the county (c), time (t) level
• Identification comes from variation across counties over time in
adoption of FSP (FSPct)
• Fixed effects for county, time and state*year (or county*linear time)
• We also control for possible confounders:
– 1960 county characteristics interacted with linear time (Zc60)
– Per capita annual county expenditures on other government transfer
programs (TPct)
• Standard errors clustered on county
1 60 2*ct ct c t st c ct cty FSP Z t TP

35
Exogeneity of FSP adoption (Hoynes and Schanzenbach AEJ Policy 2009)
• During period prior to mandatory county adoption, there was a
political battle between farm interests and advocates for the poor
(supporting FSP)
• If differences between counties affected the timing of FSP
adoption AND if the trends in outcomes are correlated with this
timing, then our identification is not valid
• In our earlier work, we estimated the determinants of county
adoption of FSP using county pre-treatment variables (from 1960
Census of Population and Census of Agriculture)
• Consistent with political accounts, earlier county food stamp
adoption occurs for counties with:
– Larger % of population black, poor, urban, larger population and
smaller % of land used in farming

36
While this analysis shows statistically significant impacts of the county
characteristics, overall most of the variation remains unexplained.
Jan-1
960
Jun-1
965
Dec-1
970
Jun-1
976
Month
Food S
tam
p P
rogra
m Initia
ted/F
itte
d v
alu
es
0 20 40 60 80Percent w ith Income<$3,000, 1960
Month Food Stamp Program Initiated Fitted values
Jan-1
960
Jun-1
965
Dec-1
970
Jun-1
976
Month
Food S
tam
p P
rogra
m Initia
ted/F
itte
d v
alu
es
0 20 40 60 80 100Percent of Land in Farming, 1960
Month Food Stamp Program Initiated Fitted values
Jan-1
960
Jun-1
965
Dec-1
970
Jun-1
976
Month
Food S
tam
p P
rogra
m Initia
ted/F
itte
d v
alu
es
0 20 40 60 80Percent Black, 1960
Month Food Stamp Program Initiated Fitted values
(a) % land in farming (b) % income<$3,000
(c) % black (d) log of population
1961
1964
1967
1970
1973
1975
Date
FS
P Im
ple
mente
d
6 8 10 12 14 16Log of Population, 1960
Month Food Stamp Program Initiated Fitted values

37
“The program was quite in demand, as congressmen wanted to reap the good will and publicity that accompanied the opening of a new project. At this time there was always a long waiting list of counties that wanted to join the program. Only funding controlled the growth of the program as it expanded.”
(Berry 1984, p. 36-37)
Nonetheless, we add controls for the interaction between these determinants of FSP adoption and time to the main models to control for the possible (observed) predictors of adoption.

38
Correlation with other program expansions during the great society period
• The expansion of the food stamp program took place
during a period of expansion of government programs
• If the expansion in these programs is correlated with
county FSP adoption, then our results may be biased
• Most likely the state/year fixed effects will absorb most
of this variation
• We also include measures of annual per capita real
government transfers at the county level (Source: BEA
REIS data):
– Welfare programs (AFDC, SSI, General Assistance)
– Health programs (Medicare, Medicaid, Military programs)
– Retirement and Disability programs

39
Bottom line is that variation in adoption dates:
• Little relation to county per capita income, other
transfers, etc.
• Adoption in individual counties is constrained by
federal appropriations
• Controlling for other program spending (e.g. AFDC),
county trends, has little effect on estimates
40
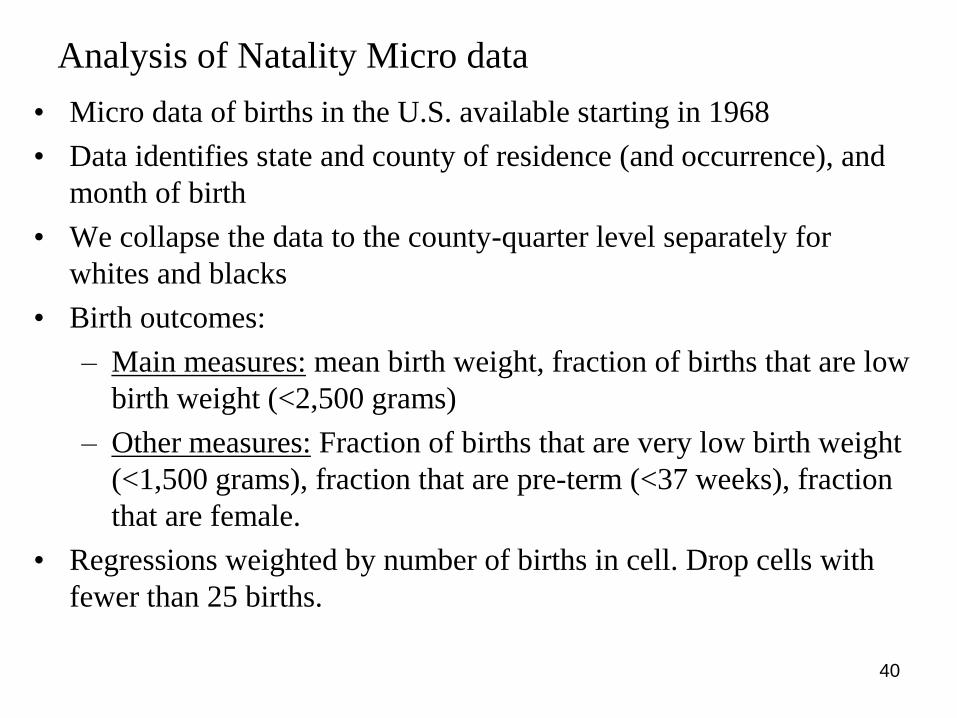
Analysis of Natality Micro data
• Micro data of births in the U.S. available starting in 1968
• Data identifies state and county of residence (and occurrence), and
month of birth
• We collapse the data to the county-quarter level separately for
whites and blacks
• Birth outcomes:
– Main measures: mean birth weight, fraction of births that are low
birth weight (<2,500 grams)
– Other measures: Fraction of births that are very low birth weight
(<1,500 grams), fraction that are pre-term (<37 weeks), fraction
that are female.
• Regressions weighted by number of births in cell. Drop cells with
fewer than 25 births.

41
Assigning the timing of FSP treatment
• Birth data identifies county and month of birth
• We assign FSP=1 if county has program in place by the
beginning of the 3rd trimester (3 months prior to birth)
– Prior research suggests nutritional access in third trimester
is most important timing for birth weight and early survival.
– We experiment with this timing
• We then collapse data (including FSP) to quarters
42
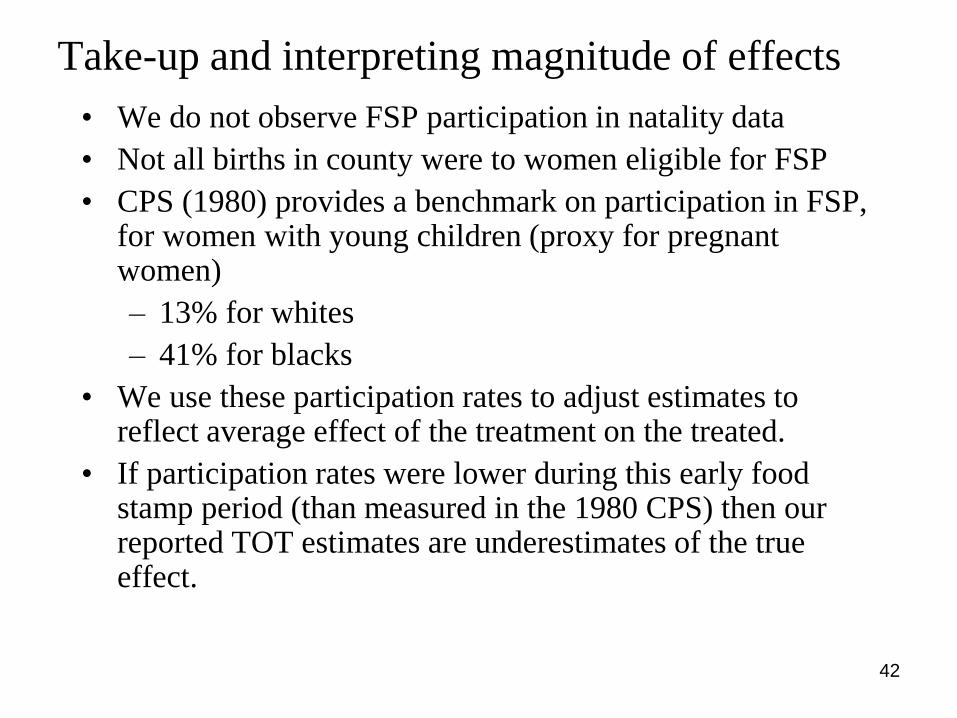
Take-up and interpreting magnitude of effects
• We do not observe FSP participation in natality data
• Not all births in county were to women eligible for FSP
• CPS (1980) provides a benchmark on participation in FSP, for women with young children (proxy for pregnant women)
– 13% for whites
– 41% for blacks
• We use these participation rates to adjust estimates to reflect average effect of the treatment on the treated.
• If participation rates were lower during this early food stamp period (than measured in the 1980 CPS) then our reported TOT estimates are underestimates of the true effect.
43
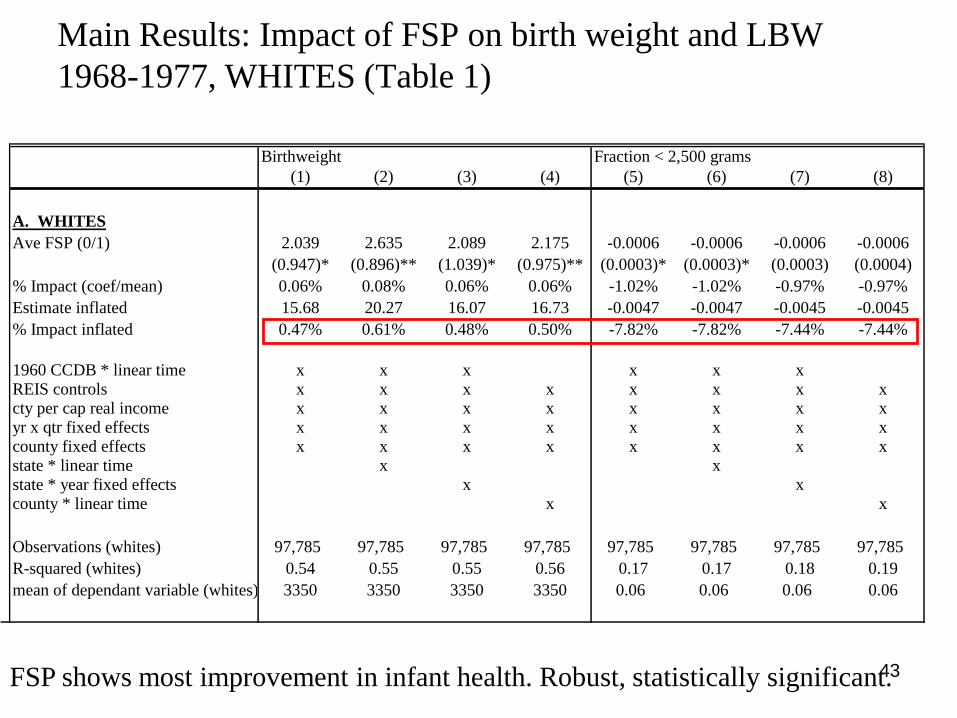
Birthweight Fraction < 2,500 grams
(1) (2) (3) (4) (5) (6) (7) (8)
A. WHITES
Ave FSP (0/1) 2.039 2.635 2.089 2.175 -0.0006 -0.0006 -0.0006 -0.0006
(0.947)* (0.896)** (1.039)* (0.975)** (0.0003)* (0.0003)* (0.0003) (0.0004)
% Impact (coef/mean) 0.06% 0.08% 0.06% 0.06% -1.02% -1.02% -0.97% -0.97%
Estimate inflated 15.68 20.27 16.07 16.73 -0.0047 -0.0047 -0.0045 -0.0045
% Impact inflated 0.47% 0.61% 0.48% 0.50% -7.82% -7.82% -7.44% -7.44%
1960 CCDB * linear time x x x x x xREIS controls x x x x x x x xcty per cap real income x x x x x x x xyr x qtr fixed effects x x x x x x x xcounty fixed effects x x x x x x x xstate * linear time x xstate * year fixed effects x xcounty * linear time x x
Observations (whites) 97,785 97,785 97,785 97,785 97,785 97,785 97,785 97,785
R-squared (whites) 0.54 0.55 0.55 0.56 0.17 0.17 0.18 0.19
mean of dependant variable (whites) 3350 3350 3350 3350 0.06 0.06 0.06 0.06
Main Results: Impact of FSP on birth weight and LBW
1968-1977, WHITES (Table 1)
FSP shows most improvement in infant health. Robust, statistically significant.

44
Birthweight Fraction < 2,500 grams
(1) (2) (3) (4) (5) (6) (7) (8)
B. BLACKS
Ave FSP (0/1) 3.454 4.120 5.466 1.665 -0.0015 -0.0016 -0.0019 -0.0009
(2.660) (2.317) (2.579)* (2.330) (0.0010) (0.0010) (0.0012) (0.0012)
Impact relative to mean 0.11% 0.13% 0.18% 0.05% -1.13% -1.22% -1.49% -0.68%
Estimate inflated 26.57 31.69 42.05 12.80 -0.0113 -0.0122 -0.0149 -0.0068
% Impact inflated 0.86% 1.02% 1.36% 0.41% -8.70% -9.41% -11.48% -5.21%
1960 CCDB * linear time x x x x x xREIS controls x x x x x x x xcty per cap real income x x x x x x x xyr x qtr fixed effects x x x x x x x xcounty fixed effects x x x x x x x xstate * linear time x xstate * year fixed effects x xcounty * linear time x x
Observations (blacks) 27,374 27,374 27,374 27,374 27,374 27,374 27,374 27,374
R-squared (blacks) 0.32 0.33 0.34 0.35 0.15 0.15 0.17 0.18
mean of dependant variable (blacks) 3097 3097 3097 3097 0.13 0.13 0.13 0.13
Main Results: Impact of FSP on birth weight and LBW
1968-1977, BLACKS (Table 1)
Larger point estimates for blacks; less precisely estimated.

45
-10.0%
-8.0%
-6.0%
-4.0%
-2.0%
0.0%
2.0%
4.0%
6.0%
1,500 2,000 2,500 3,000 3,250 3,500 3,750 4,000 4,500
Where are the gains in birth weight?
Impact of FSP on Distribution of Birth Weight (Whites)
Percent Impacts, not
inflated
Largest gains in the bottom of the birth weight distribution.

46
-14.0%
-12.0%
-10.0%
-8.0%
-6.0%
-4.0%
-2.0%
0.0%
2.0%
4.0%
6.0%
1,500 2,000 2,500 3,000 3,250 3,500 3,750 4,000 4,500
Where are the gains in birth weight?
Impact of FSP on Distribution of Birth Weight (BLACKS)
Percent Impacts, not
inflated

47
Results stratifying on 1970 county poverty rate: Show
that effects are concentrated in highest poverty counties
Birth weight
(1)
LBW
(2)
Birth weight
(3)
LBW
(4)
POOLED WHITES & BLACKS
Ave FSP (0/1) 1.871 -0.001 3.409* -0.0012*
(2.013) (0.001) (1.750) (0.0006)
% Impact (coef/mean) 0.06% -1.23% 0.10% -1.50%
Observations 8339 8339 56055 56055
R-squared 0.78 0.38 0.56 0.26
mean of dependant variable 3333 0.07 3303 0.08
Subsample Population 0.23 0.23 0.26 0.26
1960 CCDB * linear time x x x x
REIS controls x x x x
cty per cap real income x x x x
yr x qtr fixed effects x x x x
county fixed effects x x x x
state * year fixed effects x x x x
Low Poverty Counties
(lowest quartile)
High Poverty Counties
(highest quartile)

48
Are the magnitudes sensible?
• Average food stamp benefit for one-trimester “treatment” is about
$525 (2009$). Treatment on the treated results suggest a 16 gram
increase in birth weight impact and a 8% reduction in LBW for
whites (results for blacks not significant)
– Another calculation assuming ONLY benefits of FSP operates through
infant health: implies $8 million per LBW birth averted
• The natural comparison is to a similar sized exogenous increase in
income. Unfortunately, there is little evidence on the causal impact
of income on birth weight and thus few comparisons
– Currie & Cole (1993): use sibling differences to identify the impact of
an increase in AFDC income on birth weight. Insignificant but larger
estimates.
– EITC and infant health (work in progress, with Doug Miller and David
Simon) shows similar magnitudes as those presented here

49
Other results
• Results by region (south/nonsouth) and urban/rural show
much larger impacts in urban areas, and (for blacks) outside
the South.
• Timing maters: results are consistent with FSP exposure
mattering in 3rd trimester (with little marginal gain earlier in
pregnancy).
• Results for pre-term birth (gestation<37 wks): FSP leads to
small but detectable decrease in pre-term births for whites
with statistically insignificant results for blacks.
• FSP leads to a decrease in the fraction of births that are
female. While small and statistically insignificant, this is
consistent with other work that finds nutritional depravation
leads to a sex ratio imbalance favoring girls.
50
Event study analysis
• We also show estimates for an event study model. This
allows us to examine the trends prior to FSP adoption,
and also the changes in the effects of the FSP over time
• We estimate models with same controls as regressions
but estimate a full set of parameters for FSP for periods
prior to and after the adoption.
• We limit to counties that are observed for 6 quarters
before adoption and 8 quarters after adoption (to create
a balanced panel)
• We present event study for the most saturated model,
with county * linear time.

51
Event Study Graphs – BLACKS, Fraction LBW (Fig 5)
-0.014
-0.012
-0.010
-0.008
-0.006
-0.004
-0.002
0.000
-6 -4 -2 0 2 4 6 8
event time in quarters
Diff-Diff treatment effect= -0.002
Number of obs=11,873

52
Event Study Graphs – WHITES, Fraction LBW
-0.0025
-0.0020
-0.0015
-0.0010
-0.0005
0.0000
0.0005
0.0010
-6 -4 -2 0 2 4 6 8
event time in quarters
Diff-Diff treatment effect= -0.0004
Number of obs=49,163

53
Specification tests
• Large expansion in government spending on health
during this time. We have no evidence that this biases
our results:
– Adding the REIS does not change the estimated effects.
– We observe place of birth (hospital, whether physician
attended the birth) and find that FSP has no impact on these
outcomes.
• If FSP introduction changes fertility (especially
composition of births) then the results could be biased.
– Increase in births among disadvantaged? Increase in fetal
survival?
– We apply the same identification strategy to county-quarter
birth rates and find precisely estimated small impacts on
birth rate.

54
Summary of natality results
• Introduction of FSP leads to modest improvement in
infant health: higher birth weight, lower fraction of
births that are LBW
• Results robust across specifications; stand up to event
study analysis
• No evidence that results are biased by changes in
fertility
• Timing of FSP is key: results consistent with
importance of third trimester treatment

55
Analysis of infant mortality
• Vital statistics data, micro data on deaths
• Data identifies state and county of residence, month of death, age at death, and detailed cause of death codes.
• Outcome:
– neonatal infant mortality rate (in first 28 days)
– “cohort” rate: neonatal deaths among those born in quarter t divided by live births in quarter t (natality micro data for births)
– Neonatal deaths related to health during pregnancy/delivery so FSP assigned as of the beginning of the 3rd trimester
• We collapse data to the county-quarter level separately for whites and blacks
• Sample: 1968-1977
• Regressions weighted by number of births in cell, clustered on county. Drop cells with fewer than 50 births.

56
Classifying causes of death
Cause of Death ICD-7 Code (1959-1967) ICD-8 Code (1968-1978)
1 Congenital Anomalies 750-759 740-759
2 Respiratory Distress 773 776.1,776.2
3
Disorders of short gestation and unspecified low
birthweight 776 777
4 Infections specific to the perinatal period 53 038
5 Pneumonia and influenza 480-483, 490-493, 763 470-474,480-486
6
Newborn affected by maternal complications of
pregnancy n/a 769.0-769.2,769.4,769.5,769.9
7 Intrauterine hypoxia and birth asphyxia 762 776.9
8
Newborn affected by complications of placenta, cord,
and membranes 761 770,771
9 Certain gastrointestinal diseases 045-048,543,571,572,764 004,006-009,535,561,563
10 Diseases of the heart 400-402,410-443 390-398,402,404,410-429
11 SIDS NA 795.0
12 Accidents and adverse events E800-E962 E800-E949
13 Birth trauma 760 764-768(.0-.3), 772
14 Hemolytic disease of newborn, due to isoimmunization
and other perinatal jaundice* 770 774,775
15 All Other all other codes all other codes
Deaths possibly
affected by
nutritional
deprevation
Other Deaths
(not likely
affected by
nutrition)

57
Neonatal infant mortality, 1968-1977 deaths per 1000 births
No statistically significant impact on infant mortality. Point estimates
suggest improvement in infant health; larger impacts for deaths
linked to nutrition.
All Deaths
Deaths linked to
Nutrition Other Death
A. WHITES
Ave FSP (0/1) -0.0158 -0.0784 0.0626
(0.1194) (0.0839) (0.0936)
% Impact (coef / mean) -0.13% -1.25% 1.09%
% Impact, inflated -1.01% -9.63% 8.39%
Observations 73,577 73,577 73,577
mean of dependent variable 12.00 6.26 5.74
B. BLACKS
Ave FSP (0/1) -0.0067 -0.3098 0.3032
(0.4610) (0.2953) (0.3348)
% Impact (coef / mean) -0.04% -3.43% 3.06%
% Impact, inflated -0.08% -7.47% 6.65%
Observations 17,655 17,655 17,655
mean of dependent variable 18.94 9.02 9.91

58
Results for FSP and Infant Health
• Across the board, FSP associated with improved health
outcomes. Gradients are reasonable.
– Natality results robust, statistically significant
– Mortality results never statistically significant
• We conclude that despite not targeting pregnant
women, the FSP improved birth weight
• Demonstrate the importance of thinking broadly about
the potential benefits of transfer programs

“Childhood Exposure to the Food Stamp Program:
Long‐run Health and Economic Outcomes”
• We use the same policy variation—the county rollout of
the food stamp program—to examine the impact of
early life exposure to FSP on adult health and economic
outcomes.
59
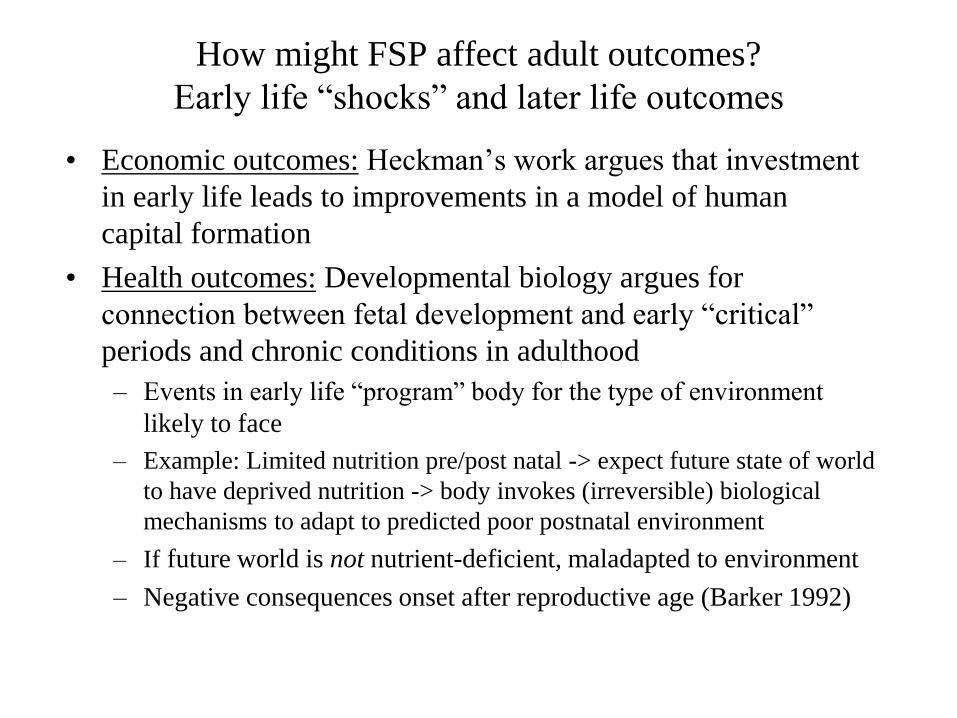
How might FSP affect adult outcomes?
Early life “shocks” and later life outcomes
• Economic outcomes: Heckman’s work argues that investment
in early life leads to improvements in a model of human
capital formation
• Health outcomes: Developmental biology argues for
connection between fetal development and early “critical”
periods and chronic conditions in adulthood
– Events in early life “program” body for the type of environment
likely to face
– Example: Limited nutrition pre/post natal -> expect future state of world
to have deprived nutrition -> body invokes (irreversible) biological
mechanisms to adapt to predicted poor postnatal environment
– If future world is not nutrient-deficient, maladapted to environment
– Negative consequences onset after reproductive age (Barker 1992)

Predictions for FSP introduction
• Economic outcomes: increase in human capital (education,
earnings)
• Adult health: Lack of nutrition higher metabolic
syndrome: high blood pressure, type 2 diabetes, obesity,
cardiovascular disease
– FSP leads to better nutrition lower metabolic syndrome
lower incidence of obesity, high blood pressure
– both pre- and post-natal nutrition can matter
• Note: these responses found even if birth weight unaffected
• Most of the existing studies focus on health shocks and
pollution. There is little evidence using shocks to income.

PSID Sample
• Heads and wives born between 1956-1981, health
outcomes measured for ages 18-51 (or 24-51 for economic
outcomes)
• County from geocode file (restricted data)
• Match adults to their families at birth/early life:
– Assign county codes at birth
– Assign family background : higher/lower risk of being
impacted by FSP
• Outcomes:
– General health status and disability (1984+), Diseases and
weight (1999+), economic variables
62
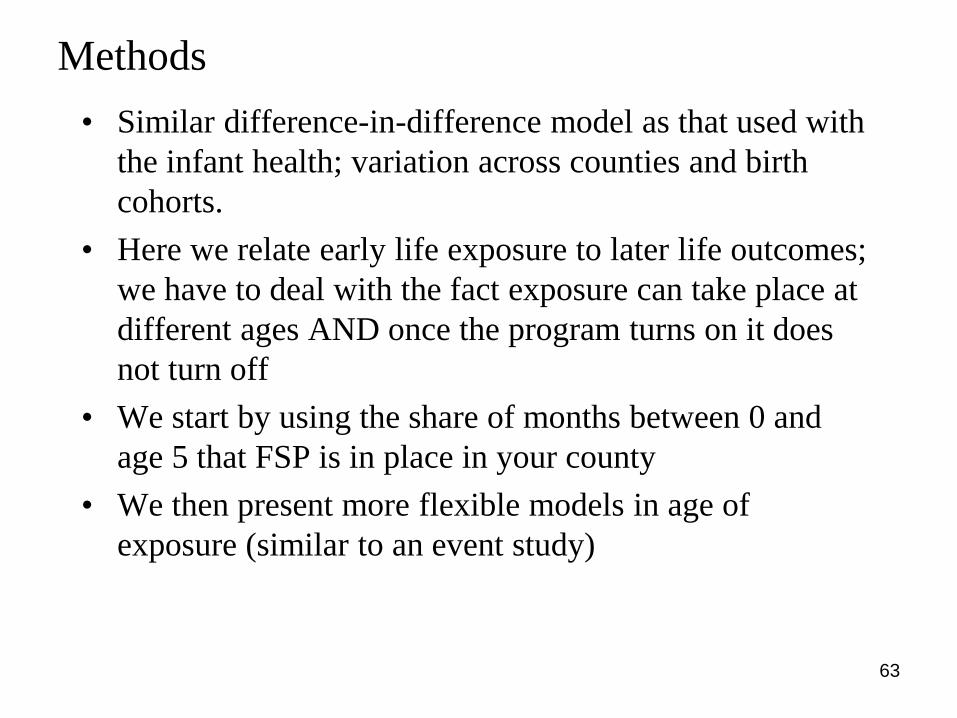
Methods
• Similar difference-in-difference model as that used with
the infant health; variation across counties and birth
cohorts.
• Here we relate early life exposure to later life outcomes;
we have to deal with the fact exposure can take place at
different ages AND once the program turns on it does
not turn off
• We start by using the share of months between 0 and
age 5 that FSP is in place in your county
• We then present more flexible models in age of
exposure (similar to an event study)
63
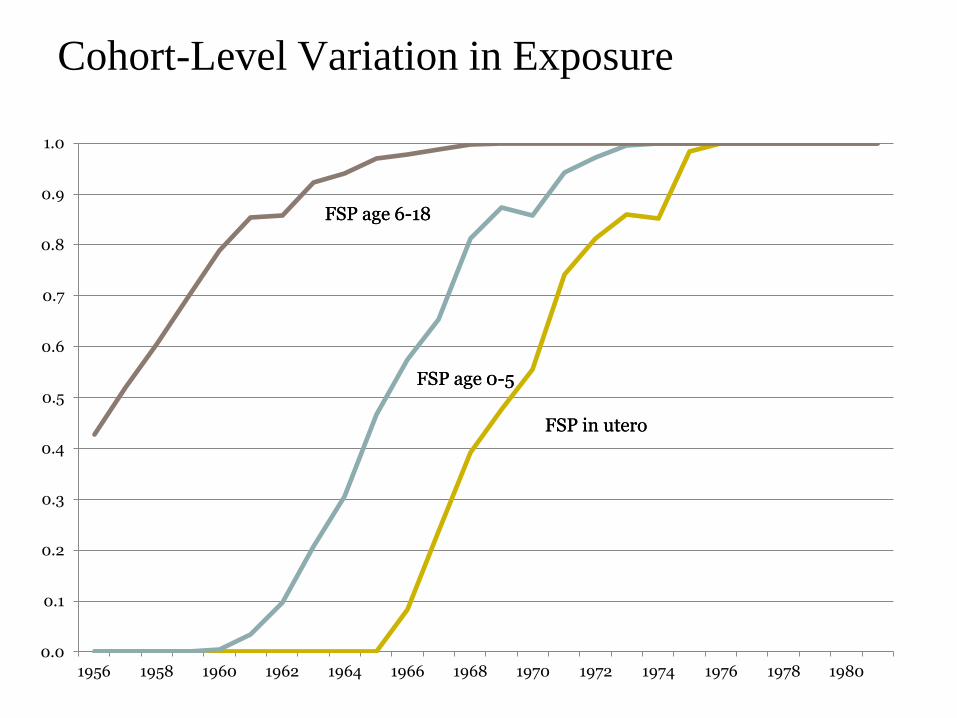
Cohort-Level Variation in Exposure
0.0
0.1
0.2
0.3
0.4
0.5
0.6
0.7
0.8
0.9
1.0
1956 1958 1960 1962 1964 1966 1968 1970 1972 1974 1976 1978 1980
FSP age 0-5
FSP age 6-18
FSP in utero
FSP age 0-5
FSP age 6-18
FSP in utero
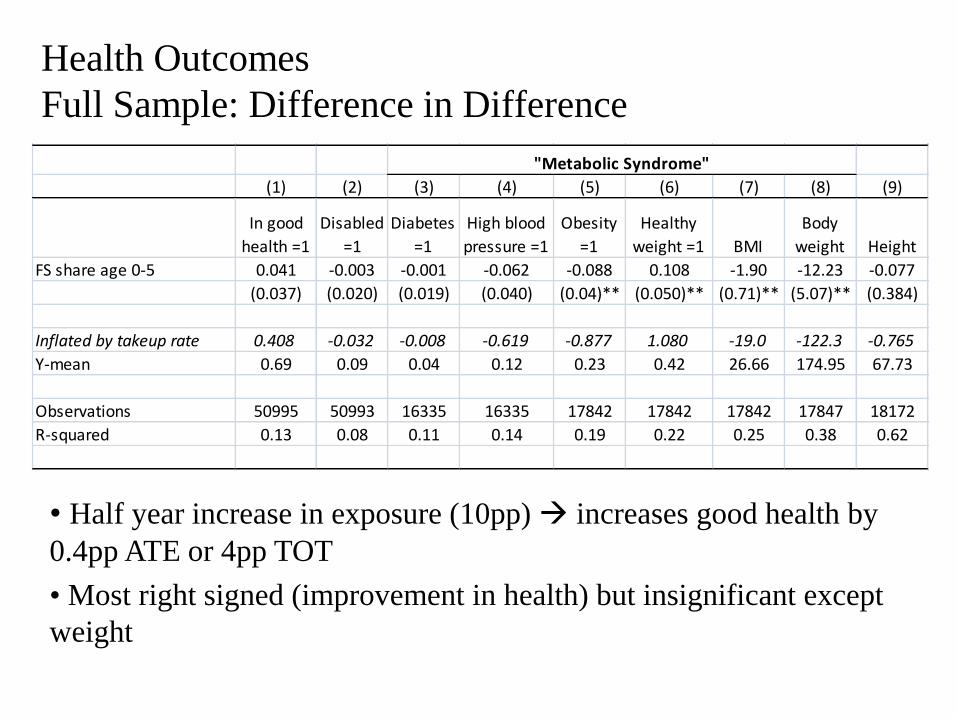
Health Outcomes
Full Sample: Difference in Difference
(1) (2) (3) (4) (5) (6) (7) (8) (9)
In good
health =1
Disabled
=1
Diabetes
=1
High blood
pressure =1
Obesity
=1
Healthy
weight =1 BMI
Body
weight Height
FS share age 0-5 0.041 -0.003 -0.001 -0.062 -0.088 0.108 -1.90 -12.23 -0.077
(0.037) (0.020) (0.019) (0.040) (0.04)** (0.050)** (0.71)** (5.07)** (0.384)
Inflated by takeup rate 0.408 -0.032 -0.008 -0.619 -0.877 1.080 -19.0 -122.3 -0.765
Y-mean 0.69 0.09 0.04 0.12 0.23 0.42 26.66 174.95 67.73
Observations 50995 50993 16335 16335 17842 17842 17842 17847 18172
R-squared 0.13 0.08 0.11 0.14 0.19 0.22 0.25 0.38 0.62
"Metabolic Syndrome"
• Half year increase in exposure (10pp) increases good health by
0.4pp ATE or 4pp TOT
• Most right signed (improvement in health) but insignificant except
weight

Economic Outcomes
Full Sample: Difference-in-Difference
(1) (2) (3) (4)
Educational
Attainment: High
School Plus
log(Family
total income)Employed =1 Poverty =1
FS share age 0-5 0.056 -0.039 0.006 0.000
(0.045) (0.071) (0.028) (0.032)
Inflated by takeup rate 0.563 -0.394 0.063 0.005
Y-mean 0.9 10.85 0.86 0.18
Observations 41397 41863 42047 41863
R-squared 0.24 0.37 0.09 0.23
• Mixed in sign (education increases, income decreases) but all
insignificant

Other results
• We estimate models for subgroups more likely to be
impacted: those born into families with low education
head, female head generally show larger impacts
• Placebo regressions on subgroups unlikely to get FSP
(born into family with high education) zero impact
• When we include in utero along with 0-5 exposure, the
results tend to load onto 0-5. We probably do not have
precision to identify in utero and % of childhood
67

Event Study: by age when FSP introduced (subgroup=female head)
68-0.4
-0.2
0.0
0.2
0.4
0.6
0.8
-5 -4 -3 -2 -1 0 1 2 3 4 5 6 7 8 9 10 11 12 13 14 15
Age at FSP Introduction in County
Outcome = Good Health
FullyTreated, FSP
in place
Birth year
Partially treated, FSP
implemented in early
childhood
Untreated in early
childhood

Event Study: by age when FSP introduced (female head)
69-1.0
-0.8
-0.6
-0.4
-0.2
0.0
0.2
0.4
-5 -4 -3 -2 -1 0 1 2 3 4 5 6 7 8 9 10 11 12 13 14 15
Age at FSP Introduction in County
Outcome = Obesity
Fully Treated, FSP in place
prior to birth
Partially treated, FSP
implemented in early
childhood
Untreated in early
childhood

Triple Difference
1 60ict g ct ct g it cy P FSP FSP P X Z t
2 ct g g c t ictTP t
• The challenge with the PSID is small sample sizes; we want to use
a broad sample but many subgroups have low probability of being
affected by the FSP
• Solution: Pool all data, but scale by higher/lower probability of
being impacted by the program
• Define group-specific participation rate Pg using family
background (race, education, and marital status of head)
• Interact FSP indicator with participation rate

DDD: Health Outcomes interacted w/Part Rate
• Pool all data, but scale by higher/lower probability of being
impacted by FSP (coef are TOT)
• Consistent positive effects, many results reach statistical
significance
(1) (2) (3) (4) (5) (6) (7)
In good
health =1 Disabled =1 Diabetes =1
High blood
pressure =1
Body
Weight BMI Obesity
FS Share age 0-5 * Pg 0.186** -0.071 -0.152* -0.195* -17.000 -2.469 -0.246**
(0.091) (0.056) (0.093) (0.100) (14.605) (1.779) (0.120)
FS share age 0-5 0.026 0.002 0.010 -0.047 -11.90** -1.87** -0.079*
(0.040) (0.022) (0.019) (0.041) (5.449) (0.756) (0.046)
Y-mean 0.69 0.09 0.04 0.12 174.91 26.66 0.23
Observations 50,673 50,671 16,251 16,251 17,750 17,745 17,745
R-squared 0.13 0.09 0.11 0.15 0.39 0.26 0.2
"Metabolic Syndrome"
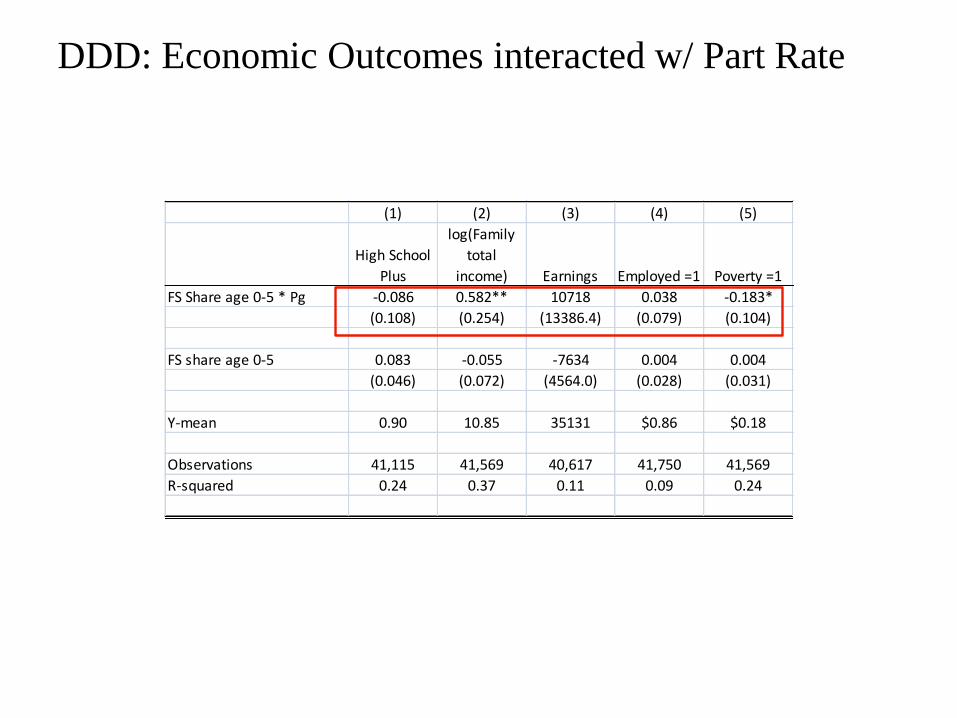
DDD: Economic Outcomes interacted w/ Part Rate
(1) (2) (3) (4) (5)
High School
Plus
log(Family
total
income) Earnings Employed =1 Poverty =1
FS Share age 0-5 * Pg -0.086 0.582** 10718 0.038 -0.183*
(0.108) (0.254) (13386.4) (0.079) (0.104)
FS share age 0-5 0.083 -0.055 -7634 0.004 0.004
(0.046) (0.072) (4564.0) (0.028) (0.031)
Y-mean 0.90 10.85 35131 $0.86 $0.18
Observations 41,115 41,569 40,617 41,750 41,569
R-squared 0.24 0.37 0.11 0.09 0.24

Research agenda and implications for policy
73
• In this work, we show that the food stamp program leads to
improvements in health
• The work illustrates the importance of taking a wide view of the
potential benefits of transfer programs
− Health benefits for non-health programs
− Long run benefits of early life program participation
• This work does not (yet) provide guidance on the relative benefits
of cash (e.g. TANF), tax (e.g. EITC) or near-cash (e.g. FSP)
programs. Why? Because of the lack of similar estimates for these
programs. Stay tuned …

74
Conclusions
• The food stamp program is a very important component of the
U.S. safety net and we know very little about impacts on
family and child well-being
• We use a novel source of variation: the introduction of the
food stamp program across counties over 1961-1975
• Across the board, FSP associated with improved infant health
outcomes
• Further, childhood exposure to the FSP leads to improvement
in adult health, with strongest results for body weight
• Expansion of the safety net, exogenous increase to income in
early life improves infant and adult health
• Illustrates the importance of a wide scope to evaluating the
benefits of cash transfer programs (or government policies
more generally)

75
SUPPLEMENTAL SLIDES

76
% land in farming 0.205***
(0.027)
0.216***
(0.033)
% population with income < $3,000 -0.122
(0.096)
0.422***
(0.154)
% population urban -0.255***
(0.035)
-0.180***
(0.047)
% population black -0.435***
(0.072)
-0.912***
(0.141)
% population <5 -3.917***
(0.635)
-5.521***
(0.826)
% population >65 -1.326***
(0.395)
-3.689***
(0.551)
South * % land in farming -0.177***
(0.061)
South * % population with income <$3,000 -0.742***
(0.203)
South * % population urban -0.075
(0.073)
South * % population black 0.700***
(0.166)
South * % population <5 2.612**
(1.321)
South * % population >65 4.212***
(0.806)
State Fixed Effects X X
Adjusted R-squared 0.52 0.53
Number of Observations 2,823 2,823
Table 1: Determinants of County FSP Start Date

77
Trends in fraction of births LBW
4
6
8
10
12
14
16
1960 1965 1970 1975 1980 1985 1990 1995 2000
Per
cen
t o
f B
irth
s L
ow
Bir
th W
eig
ht
(<2
,50
0g
ms)
Whites
Nonwhites

78
Is there sufficient across county variation within states?
05
01
00
05
01
00
05
01
00
05
01
00
05
01
00
05
01
00
05
01
00
0 50 10 0 15 0 20 0 0 50 10 0 15 0 20 0 0 50 10 0 15 0 20 0 0 50 10 0 15 0 20 0 0 50 10 0 15 0 20 0 0 50 10 0 15 0 20 0
0 50 10 0 15 0 20 0 0 50 10 0 15 0 20 0
AL AR AZ CA CO CT DC DE
FL GA HI IA ID IL IN KS
KY LA MA MD ME MI MN MO
MS MT NC ND NE NH NJ NM
NV NY OH OK OR PA RI SC
SD TN TX UT VA VT WA WI
WV WY
Pe
rce
nt
of
Po
pu
latio
n in
FS
P
Years 1961-1975Graphs by State

79
Prior evidence on FSP and infant health
• Currie and Moretti (2007) examine impact of county
rollout of FSP on birth outcomes in California
• Assign FSP as of 9 months before birth
• Highlight the fact that there are competing effects on
birth outcomes
– Fetal deaths fell 30% from 1965-1975
– Selection versus inframarginal effect
• Find that FSP increased incidence of low birth weight,
esp. in LA
• Raised concern that research design applied to CA may
be confounded by rural-urban migration and
composition change in fertility during this time period

80
Importance of timing of FSP implementation (Birth weight)Birthweight
MAIN POLICY EFFECT:
FSP-beg of 3rd
trimester
FSP-beg of
2nd trimester
FSP-beg of 1st
trimester
FSP-beg of 3rd
trimester
FSP-beg of 3rd
trimester
SECOND POLICY EFFECT: -- -- --
FSP-beg of
2nd trimester
FSP-beg of 1st
trimester
(1) (2) (3) (4) (5)
A. WHITES 2.085 1.696 1.288 2.556 2.434
Ave FSP (0/1) (1.020)** (1.024)* (0.993) (1.640) (1.268)*
Ave FSP (0/1) -- -- -- -0.533 -0.454
SECOND POLICY VAR (1.650) (1.232)
B. BLACKS 5.447 4.704 2.071 5.334 8.108
Ave FSP (0/1) (2.532)** (2.464)* (2.396) (4.596) (3.444)**
Ave FSP (0/1) -- -- -- 0.130 -3.515
SECOND POLICY VAR (4.450) (3.268)
1960 CCDB * linear time x x x x x
REIS controls x x x x x
cty per cap real income x x x x x
yr x qtr fixed effects x x x x x
county fixed effects x x x x x
state * year fixed effects x x x x x
81
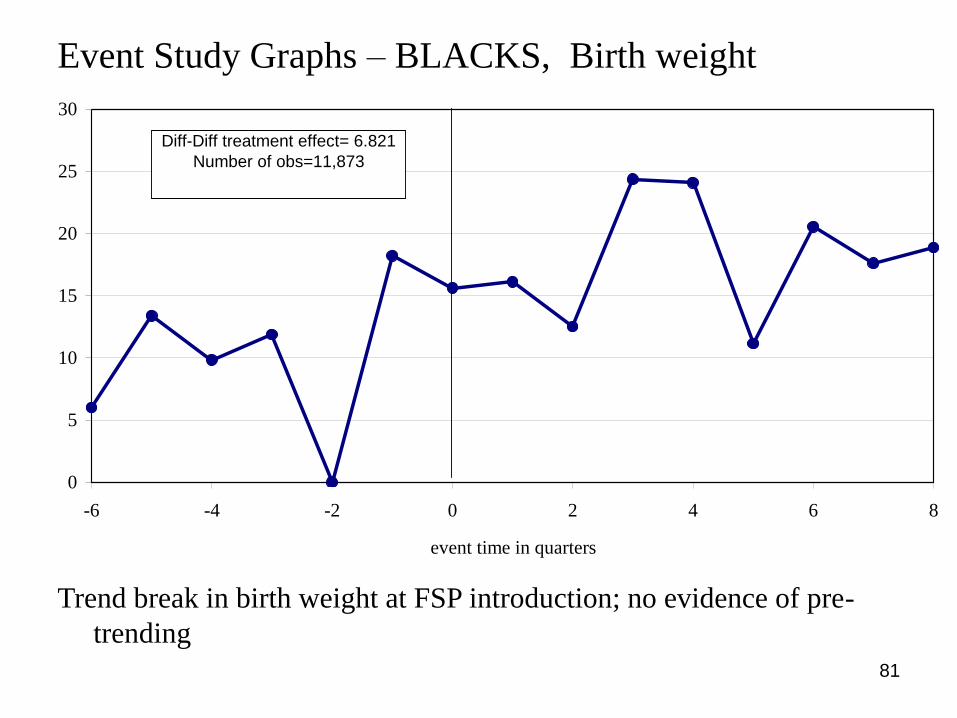
Event Study Graphs – BLACKS, Birth weight
Trend break in birth weight at FSP introduction; no evidence of pre-
trending
0
5
10
15
20
25
30
-6 -4 -2 0 2 4 6 8
event time in quarters
Diff-Diff treatment effect= 6.821
Number of obs=11,873

82
Event Study Graphs – WHITES, Birth weight
0
1
2
3
4
5
6
7
8
-6 -4 -2 0 2 4 6 8
event time in quarters
Diff-Diff treatment effect= 1.83
Number of obs=49,163
Noisier for whites.

83
Results by region / urban
Birthweight LBW Birthweight LBW Birthweight LBW Birthweight LBW(1) (2) (3) (4) (5) (6) (7) (8)
A. WHITES
Ave FSP (0/1) 2.403 -0.0011 1.771 -0.0003 2.364 -0.0008 0.508 -0.0002
(1.612) (0.0005)** (1.322) (0.0004) (1.247)* (0.0004)** (1.615) (0.0006)
% Impact (coef/mean) 0.07% -1.57% 0.05% -0.48% 0.07% -1.13% 0.02% -0.25%
Observations 44194 44194 53591 53591 32282 32282 65503 65503
Subsample Population 0.29 0.29 0.69 0.69 0.73 0.73 0.25 0.25
B. BLACKS
Ave FSP (0/1) 3.527 -0.0023 7.003 -0.0009 8.371 -0.0034 -0.745 0.0023
(3.134) (0.0014)* (3.992)* (0.0022) (2.846)** (0.0013)** (5.219) (0.0023)
% Impact (coef/mean) 0.11% -1.76% 0.23% -0.69% 0.27% -2.59% -0.02% 1.74%
Observations 20837 20837 6537 6537 13090 13090 14284 14284
Subsample Population 0.49 0.49 0.45 0.45 0.77 0.77 0.17 0.17
SOUTH NONSOUTH URBAN COUNTIES
NONURBAN
COUNTIES
Effects concentrated in urban areas.

84
Small positive and insignificant effect of FSP on fertility
[Births per 1000 women aged 15-44, 1968-1977]
3 qtrs 4 qtrs 5 qtrs 6 qtrs 7 qtrs
(1) (2) (3) (4) (5)
A. WHITES 0.013 -0.004 0.007 0.031 0.035
Ave FSP (0/1) (0.078) (0.074) (0.071) (0.074) (0.070)
% Impact (coef/mean) 0.06% -0.02% 0.04% 0.16% 0.18%
B. BLACKS 0.211 0.157 0.276 0.307 0.227
Ave FSP (0/1) (0.221) (0.206) (0.193) (0.190) (0.183)
% Impact (coef/mean) 0.80% 0.60% 1.05% 1.17% 0.86%
1960 CCDB * linear time x x x x x
REIS controls x x x x x
cty per cap real income x x x x x
yr x qtr fixed effects x x x x x
county fixed effects x x x x x
state * year fixed effects x x x x x
Observations (whites) 120293 120293 120293 120293 120293
mean of dependant variable (whites) 19.40 19.40 19.40 19.40 19.40
Observations (blacks) 44044 44044 44044 44044 44044
mean of dependant variable (blacks) 26.24 26.24 26.24 26.24 26.24
FSP implemented as of X quarters prior to birth
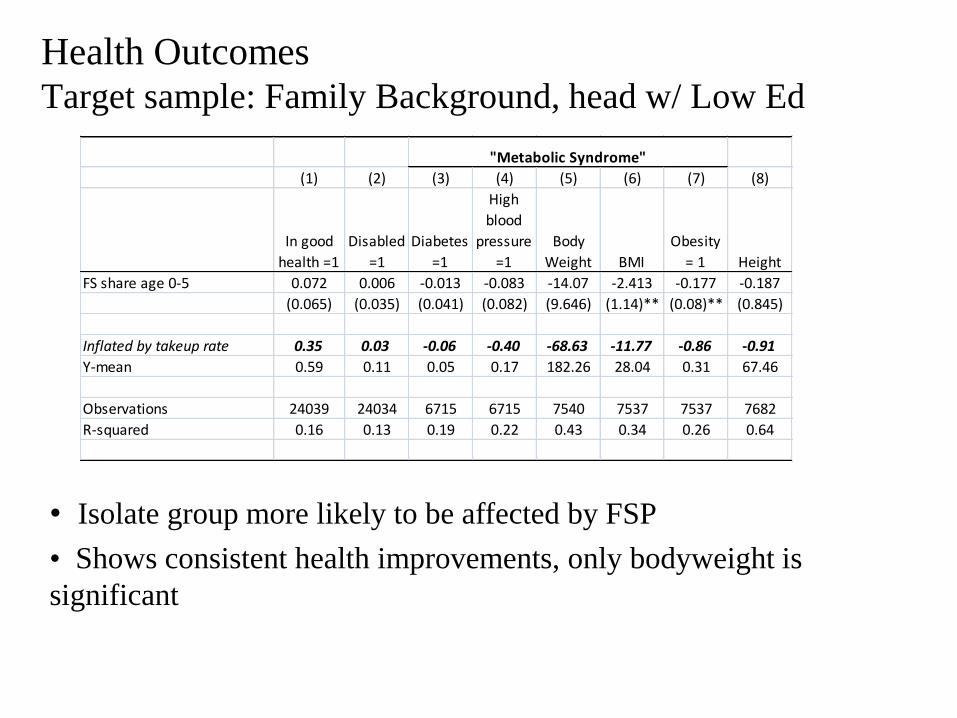
Health OutcomesTarget sample: Family Background, head w/ Low Ed
• Isolate group more likely to be affected by FSP
• Shows consistent health improvements, only bodyweight is
significant
(1) (2) (3) (4) (5) (6) (7) (8)
In good
health =1
Disabled
=1
Diabetes
=1
High
blood
pressure
=1
Body
Weight BMI
Obesity
= 1 Height
FS share age 0-5 0.072 0.006 -0.013 -0.083 -14.07 -2.413 -0.177 -0.187
(0.065) (0.035) (0.041) (0.082) (9.646) (1.14)** (0.08)** (0.845)
Inflated by takeup rate 0.35 0.03 -0.06 -0.40 -68.63 -11.77 -0.86 -0.91
Y-mean 0.59 0.11 0.05 0.17 182.26 28.04 0.31 67.46
Observations 24039 24034 6715 6715 7540 7537 7537 7682
R-squared 0.16 0.13 0.19 0.22 0.43 0.34 0.26 0.64
"Metabolic Syndrome"

Economic OutcomesTarget sample: Family Background, head w/ Low Ed
(1) (2) (3) (4) (5)
Educational
Attainment: High
School Plus
log(Family
total income)Earnings Employed =1 Poverty =1
FS share age 0-5 0.169 0.145 1605 0.012 -0.043
(0.110) (0.157) 4425 (0.053) (0.067)
Inflated by takeup rate 0.824 0.706 7830 0.058 -0.212
Y-mean 0.8 10.52 24654 0.84 0.31
Observations 19572 19650 19065 19776 19650
R-squared 0.27 0.4 0 0.15 0.3
• Isolate group more likely to be affected by FSP
• Shows consistent beneficial effects of FSP, imprecise

Placebo Test:
Family background w/ head high education
(1) (2) (3) (4) (5) (6) (7) (8) (9)
In good
health =1
Diabetes
=1
High
blood
pressure
=1
Obesity
=1 BMI
Body
weight
High School
Plus
log(Family
total
income) Employed
= 1
FS share age 0-5 0.006 0.002 -0.061 -0.016 -0.799 -5.4 -0.031 -0.021 0.109
(0.060) (0.029) (0.058) (0.082) (1.165) (9.7) (0.049) (0.122) (0.038)
Y-mean 0.78 0.02 0.07 0.15 25.35 168 0.98 11.15 0.88
Observations 11,555 4,363 4,364 4,638 4,638 4,638 9,534 9,789 9,810
R-squared 0.16 0.22 0.19 0.30 0.40 0.55 0.34 0.35 0.12
"Metabolic Syndrome" Economic Outcomes
• Shows small and generally wrong signed results