insider trading in derivative securities: an empirical ... · financial instruments have important...
TRANSCRIPT

Insider Trading in Derivative Securities: An Empirical Examination of theUse of Zero-Cost Collars and Equity Swaps by Corporate Insiders
J. Carr BettisSchool of Management
Arizona State University [email protected]
John M. BizjakDepartment of Finance
College of BusinessPortland State University
Michael L. LemmonDepartment of Finance
College of BusinessArizona State University
First Draft: January 25, 1999Current Draft: May 31, 1999
Please do not quote without the authors’ permission. This paper was previously titled “Can Insiders Hide Trades inTheir Own Equity? An Empirical Examination of the Use of Zero-Cost Collars and Equity Swaps by CorporateInsiders”. This paper has benefited from the helpful comments of seminar participants at Arizona State University,the University of Oregon, Portland State University, and the Securities and Exchange Commission.
ABSTRACT
We provide an examination of the use of zero-cost collars and equity swaps by corporate insidersto hedge the risk associated with their personal holdings in the company’s equity. Thesefinancial instruments have important implications for insider trading and incentive-basedcontracts. Our analysis indicates that these transactions generally involve high ranking insiders(CEOs, board members and senior executives) and cover over a third of their equity holdings.We also find that insiders appear to initiate hedging transactions immediately following largeprice runups, prior to increases in stock price volatility, and prior to poor earningsannouncements. In addition, abnormal returns following insider hedging activities are morenegative than those associated with ordinary insider sales. Overall, the evidence indicates thatexecutives can use these hedging instruments to significantly alter their effective ownershippositions in the firm.

1. Introduction
In recent years there has been a dramatic increase in the development, sophistication, and
use of strategies that enable individual shareholders, institutional investors and corporate insiders
to hedge their stock ownership position within a firm. Zero-cost collars, equity swaps, shorting
against the box, exchange funds, and trust structures are just some examples of trading strategies
that allow investors to monetize their equity positions in the firm and reduce their exposure to
adverse stock price movements.
In this paper, we discuss the growing use of these hedging instruments by corporate
insiders and provide evidence on their motivations for using them. Specifically, we examine
zero-cost collar and equity swap transactions by corporate insiders from the period January 1996
through December 1998. A zero-cost collar involves the simultaneous purchase of a put option
funded by the proceeds received from the sale of a call option on the stock of the company. An
equity swap is an exchange of the returns on the firm's stock for the cash flows on another asset
such as an index fund or risk-free security. Both collars and swaps provide protection from
downward movements in the firm’s stock price while allowing insiders to maintain voting rights
and (often) dividend payments.1 We provide information on the structure of these transactions;
the individuals within the firm that most often engage in this type of activity; the amount of
ownership hedged; the timing of these transactions; and on the stock-price performance prior and
subsequent to the initiation of these contracts. We also examine how these transactions relate to
typical open-market insider trading in equity securities.
Analysis of these hedging instruments is important because they offer the potential to
trade on inside information in a substantially different manner than ordinary insider sales and
1 Zero-cost collars and equity swaps are the most common hedging instruments reported by insiders to the SEC.

2
purchases. Unlike open-market trades, insider trading in collars and swaps has not historically
been readily observable by market participants for two reasons. First, the reporting rules for
these instruments were nonexistent prior to 1994 and remain incompletely defined even after a
new ruling by the SEC in 1996. Second, when filed, these transactions appear only on Table II
of Form 4 filed by insiders with the SEC. In general, the services that provide insider trading
data to the financial markets (and others) do not make available the data needed to identify
derivative instrument hedging transactions. If these transactions are less likely than open-market
purchases and sales to attract market and legal scrutiny, then insiders may have greater
incentives to utilize these instruments when they have information that their stock is overvalued.
The use of zero-cost collars and equity swaps by insiders also has important implications
for contracting. These transactions allow insiders to affect the sensitivity of their wealth to firm
performance. Providing insiders with the ability to hedge the risk associated with their personal
equity holdings and human capital investments in the firm may reduce investment distortions
and/or prevent costly hedging of cash flows at the corporate level [Amihud and Lev (1981), and
Stulz (1984)]. On the other hand, the use of these financial instruments has the potential to
increase the agency conflict between managers and shareholders. For example, Jensen and
Meckling (1976) illustrate the conflicts that arise between managers and shareholders when
managers hold only small amounts of equity. Similarly, principal-agent models like those of
Ross (1973), Holmstrom (1979), and Leland and Pyle (1977) show how managerial equity
holdings can reduce the moral hazard and asymmetric information problems faced by investors.
Giving insiders the ability to protect their equity holdings from fluctuations in the stock price
reduces the link between managerial wealth and firm performance. This in turn may lead

3
managers to make inferior decisions on behalf of shareholders because managers no longer bear
the full cost of their actions.
In our sample, we find that high-ranking insiders use collars and swaps to cover a
significant proportion of their holdings of the firm’s stock. The most common individuals to use
these instruments are top executives, such as the CEO/Chairman of the Board, corporate officers
including officers who also serve on the board of directors, and board members. The mean
number of shares covered by the collar represents 36% of the total holdings of these individuals.
Most of the contracts are characterized as European, and generally have long lives. The data
suggest that insiders are able to reduce their exposure to downside risk yet maintain a significant
amount of upside gain. On average, we find that the stock price would have to fall by only 11%
for the put-option component of the collar to finish in the money, and rise by 36% for the call-
option component to be in the money. The asymmetric nature of these contracts is particularly
important if insiders use these instruments when they have private information about firm
performance. Thus, for all practical purposes, these hedging instruments offer insiders the ability
to engage in the benefits of an equity sale, but without giving up voting rights and with
potentially less visibility and perhaps legal liability.
Insiders appear to strategically time the purchase of these hedging instruments. We find
significant positive abnormal performance of 19% relative to the market index over the 120
trading days prior to the collar transaction followed by normal performance over the subsequent
six months. The change in performance surrounding the use of these securities is also reflected
in the market reaction to earnings announcements. In addition, we find an increase in the
volatility of stock returns following the purchase of these securities. The decline in relative
performance, the market reaction to earnings announcements, and the increase in volatility are

4
consistent with the view that, on average, insiders time their transactions to lock in gains in
advance of material changes in firm performance and stock price behavior.
The collar and swap transactions also differ from normal open-market sales by insiders in
the same firms. Regular insider sales at the collar firms do not appear to be associated with
changes in performance surrounding the sale. Like the collar transactions, we find that insider
sales tend to take place following superior stock price performance. Subsequent to an insider
sale, however, we do not detect a drop off in performance. The mean cumulative abnormal
return over the six-month period subsequent to an insider sale is 9.5%, implying that insiders
lose money on the average open-market sale. In addition, the average trade size for an open-
market sale is approximately ten times smaller than the number of shares covered by the average
collar. Overall, these results suggest that insiders execute collars and equity swaps differently
than normal open-market sales.
Our evidence suggests that insider trading in collars and swaps can have a significant
affect on the structure of the contracts between managers and shareholders. Yermack (1997)
examines the timing of stock-option grants to CEOs. He finds that managers are more likely to
receive an option grant prior to significant improvements in the market performance of the firm.
He suggests that managers who become aware of favorable information about the firm influence
the board to grant more performance-based pay. Our work also expands on the paper by Bolster
Chance and Rich (1996), who provide a case study on a single equity swap transaction. They
find large negative abnormal returns following the transaction date. To our knowledge, theirs is
the only other paper that has examined these insider hedging transactions. Similar to these
studies, our results suggest that insiders appear to alter their effective ownership position prior to
changes in firm performance.
5
We also add to the literature on insider trading. A number of studies have found that
insider trades precede significant stock price movements.2 An interesting question is whether
insider hedging transactions are executed in the same manner and reveal the same information as
an outright sale. Our evidence suggests that the use of these instruments does precede important
information about the firm, but that they are different from open market sales. Our findings have
potential implications for disclosure rules governing these transactions, and suggest that the
information contained in these filings could be useful to the market.
Finally, our results have implications for research on corporate governance. Numerous
studies use executive and director shareholdings as a proxy for the alignment of incentives
between insiders and shareholders. Our evidence suggests that experiments that take into
consideration the ability of managers to alter their effective ownership positions are likely to
provide more powerful tests of the affects of ownership on firm structure and performance.
The remainder of the paper is organized as follows. Section 2 discusses the mechanics of
zero-cost collars and equity swaps, the laws governing the use of these instruments by corporate
insiders and the associated reporting requirements. Section 3 discusses the motivations insiders
may have for entering into hedging transactions. Section 4 describes our data, and results are
presented in Section 5. Section 6 concludes with a brief discussion.
2. Mechanics and Reporting Requirements of Collars and Swaps
Zero-cost collars and equity swaps are private bilateral agreements between a corporate
insider and counterparty. The counterparty is usually a commercial or investment bank, which
assumes the role of a broker-dealer. Investment banks are motivated to structure these
2 For example, see Jaffe (1974), Givoly and Palmon (1985), Seyhun (1986, 1992), Rozeff and Zaman (1988), andBettis, Vickrey and Vickrey (1997).

6
agreements because they receive commission fees or spreads from the deal. In addition, they
offer a valuable service to their client that may allow them to expand their business relationship
and provide additional services (such as full-service brokerage).3 When structuring these deals
the counterparty can hedge any residual risk by short selling shares of the firm's stock. In
addition, these contracts allow the insider to monetize their position by borrowing against the
shares escrowed with the counterparty.4
A. Mechanics of Zero Cost Collars and Equity Swaps
Zero-Cost Collar (Costless Collars). A collar transaction involves the simultaneous
purchase of a put option and sale of a call option on the firm's shares. A popular type of collar is
the zero-cost collar (also known as a “costless collar’ or “cash-settled collar”). Typically, the
proceeds from the sale of the call are used to offset the cost of the put, which eliminates the cost
of the hedging instrument. The put provides insurance to the holder against any downward
movement in the stock price below the strike price. Any movement above the strike price of the
call is lost profit. In addition, collars also have favorable tax implications. Because collars are
not considered “constructive sales” under the Internal Revenue Code (IRC Section 1259,
resulting from The Internal Revenue Service Restructuring and Reform Act of 1997; HR 105-
364), the insider can defer capital gains taxes on any appreciation of their securities realized from
the day they acquired their shares through the life of the collar.5
3 An investment bank that structures the derivative transaction may also be interested in establishing a relationshipwith executives in the hopes of performing other services for the firm, such as underwriting any equity or debtofferings.4 For a more complete discussion of swaps, collars and similarly structured instruments see Braddock (1997), Allenand Showers (1991), Beder (1992), Gastineau (1993), and Bolster, Chance and Rich (1996).5 In order to do so, however, the insider must maintain enough market exposure so that the purchase of the putoption is not considered a “constructive sale” of the stock. The legislative history to both the House ofRepresentatives 1997 tax bill and the Senate amendment describe “collar” transactions. They both recommend thatTreasury regulations provide standards for determining which collar transactions result in constructive sales,according to a report issued by congressional conferees (Herman and McGee, 1997). No formal standards havebeen outlined. Currently, brokerage institutions have structured these instruments so that the put side is out of themoney by at least 10% [Achstatter (1998)].

7
Equity Swap (or Diversification Swap). In an equity swap, the insider exchanges the
future returns on their stock for the cash flows of another financial instrument such as the S&P
500 index, or the returns tied to some interest rate such as LIBOR. The use of equity swaps by
individuals has recently fallen out of favor, largely for reasons related to the tax code. Before the
tax law changes resulting from the Internal Revenue Service Restructuring and Reform Act of
1997, an insider who entered into an equity swap could defer capital gains taxes on any
appreciation of their securities realized from the day they acquired their shares through the date
of the swap. Following the 1997 tax law changes, however, equity swaps now trigger an
immediate capital gains tax liability because they are deemed a “constructive sale”.6
B. Reporting Requirements for Swaps and Collars
Prior to August 10, 1994 the SEC viewed swaps and collars as private deals and not
open-market transactions, and therefore did not require insiders to report these transactions
(Norris, 1994; and Bolster, Chance and Rich, 1996). On August 10, 1994, (with modifications
and extensions to the comment period on September 16, 1994) the SEC addressed the reporting
of swap transactions and issued a proposed ruling and requested comments wherein they stated
that equity swaps are reportable on Table II of Form 4.7 In Release No. 34-34514 (1994) the
SEC proposed that insiders report equity swaps as a simultaneous “purchase” and “sale”
transaction with stock appreciation right (SAR) and a stock depreciation right (SDR) being
6 See for example, The Corporate Executive; The Newsletter for Officers and Directors of Public Companies,Volume XI, No.4, Sept-Oct, 1997.7 Form 4’s are the Statement of Changes in Beneficial Ownership which must be filed with both the SEC and theprimary exchange for the related issuer’s securities. The filing has to be received by the SEC no later than the 10th
of the month following the month of the (non-exempt) transaction. The Form 4 has a header which identifies thestatement month for the filing, the name, identification number, address and the position/relationship of the insiderto the issuer, and the name and ticker of the issuer of the securities identified by the filing. The rest of the form isdivided into two Tables: Table I is the report of non-derivative securities acquired, disposed of, or beneficiallyowned. It contains important information about transactions and holdings, including the title of the security, thetransaction date, a transaction code (describing the nature of the transaction), the number of sharesacquired/disposed and the transaction price. Table II of Form 4 is used to report acquisitions, dispositions andbeneficial ownership of derivative securities.

8
shown as the title of the security. When the SEC published their initial ruling (proposal for
comment) on swaps in 1994, Peter Romeo, a former SEC counsel said, “If the attraction of these
swaps was to avoid disclosure, that attraction has been taken away” (Getler, 1994).
In 1994, CDA/Investnet was the contractor who was entering Form 4 data for the SEC,
and neither they nor other insider trading analysts were able to find more than one filing of a
derivative transaction for that year in their archives. The one swap transaction they did find was
by Autotote Corp’s chairman and chief executive officer, who detailed his five-year swap
arrangement with Bankers Trust New York Corp as a footnote to his Form 4 filing in March,
1994 (Getler, 1994). The lack of apparent filings reporting swaps is especially strange given that
the Managing Director of Bankers Trust, the company executing the swap, said “the bank has
done many deals like it”. Even after the SEC ruling in 1994, it appears that insiders were not
reporting these transactions, or that they were not being filed in a way that made them detectable.
In 1996, after receiving comments from interested parties, the SEC formalized their
position regarding collars and swaps in release No. 34-347260 (1996). They backed away from
their earlier requirements and indicated that “any manner of reporting an equity swap, or an
instrument with similar characteristics, that provides an adequate description of the transaction is
appropriate”(pg. 63).8 At this time the SEC also introduced a new transaction code, “K”, to
handle the reporting of equity swaps and other similar instruments. They did not, however,
require the use of this code and instead reiterated the position that they had taken in release no.
34-347260, described above. Subsequently, insiders were given some leeway in how they could
8 The report must provide the following information: (1) the date of the transaction, (2) the term of the swap, (3) thenumber of underlying shares of issuers stock, (4) the exercise or settlement price, (5) the non-exempt acquisition (ordisposition) of shares at the commencement of the term, (6) the non-exempt acquisition (or disposition) of shares atthe end of the term (and on any earlier dates on which an adjustment or interim settlement occurs), (7) the number ofshares owned by the insider after termination of the swap, and (8) any other material terms (pg. 63).

9
record a derivative transaction.9 Our reading of the regulations surrounding these securities
suggests that the reporting requirements for equity swaps and other hedging instruments, such as
zero-cost collars and trusts, remain ambiguous even after the 1996 SEC rule changes.10
Another interesting aspect of the regulations surrounding derivative securities is the
manner in which they are recorded. Derivative transactions appear only on Table II of Form 4,
while regular open market sales and purchases are reported on Table I. Table II data is not
widely available to shareholders because it is not distributed through most services that database
the information from the insider filings. Three of the four major services who collect insider
trading data (First Call/Investnet, Washington Service and Vickers) do not provide or publish
Table II in their own news or paper products. Moreover, they do not provide these data to
investment management services or to re-distributors of their data such as Yahoo. The fact that
hedging instruments such as swaps and collars are filed only on Table II of Form 4 suggests that
these transactions may not be as transparent to market participants as insider sales and purchases
in the open market [e.g., Ip (1997)].
3. Motivations for the Use of Zero-Cost Collars and Equity Swaps by Corporate Insiders
A. The Implications of Collars and Swaps for Insider Trading
Like other capital market transactions by insiders, the use of collars and equity swaps
may provide insiders the opportunity to profit (avoid losses) from their information advantage
relative to other market participants. These contracts protect the insider from downward
movements in the stock price, implying that insiders have incentives to engage in these
9 In a discussion, Anne Krauskopf, Special Counsel, Office of the Chief Counsel, Division of Corporate Financesays the SEC has made it very clear (in their last two Section 16 related initiatives) that collars, equity swaps andsimilar instruments require reporting. Beyond these decisions about disclosure, however, they have not taken anyformal position regarding the way insiders can use these instruments.10 For example, in footnotes to one of our collar filings there was also a reference to an exchange fund that had beenestablished by the executive. An exchange fund is another hedging mechanism that is different from an equity

10
transactions prior to poor performance. Offsetting the profit motive, however, are the threat of
legal penalties. Insiders are prohibited from trading while in possession of material value-
relevant information, and are subject to Section 10(b)-5 and Rule 16(b), which require the insider
to either disclose their private information or refrain from trading, and to disgorge any short-
swing profits, respectively. Insiders are also prohibited from shorting their firm’s stock.
There are a number of significant distinctions between insider sales and purchases in the
open market and the use of collars and swaps that may affect insiders’ incentives to utilize these
instruments. First, open market sales of equity before significant stock price declines often
attract the attention of shareholders and the SEC, resulting in legal action against corporate
insiders [e.g., Eth and Dicke (1994)].11 As previously discussed, however, collars and swaps
may be less likely to be detected by market participants or the firm's shareholders because they
are reported only on Table II of Form 4 (The Statement of Beneficial Ownership). In addition,
while hedging instruments have been around for a long time, the latest SEC reporting rules,
which were released in 1996, allow significant latitude in the reporting of equity swaps and do
not fully address the reporting of other hedging instruments. Finally, there are no apparent
restrictions on when a collar agreement can be terminated.12 These features of collars and swaps
potentially allow insiders to receive the benefits of a sale without giving up voting rights and
without openly revealing the transaction to the market.
swap. No other details were revealed about the structure of the exchange fund in the filing.11 Executives at Donnkenny, one of our sample firms were prosecuted for accounting fraud. Several executiveswere also investigated for insider trading. A collar transaction initiated by Richard Rubin, the CEO of Donnkenny,was cited in the suit. Our search of other insider trading enforcement actions did not turn up any other cases inwhich collars or swaps were mentioned.12 If an insider, however, unwinds the collar before six months has elapsed the transaction would be subject to theshort-swing profit rule [Section 16(b) of the 1934 Act] since this transaction does not have a Section 16(b)

11
B. The Impact of Collars and Swaps on Incentives
Providing managers with the ability to hedge their exposure to firm specific risk has
potential benefits to shareholders. Differences in risk aversion between shareholders and
managers can impose agency costs on the firm. Jensen and Meckling (1976) demonstrate how
managers who are unable to diversify their equity position within the firm may choose negative
NPV projects as long as the investments reduce the variance in stock returns. Similarly, Stulz
(1984) and Smith and Stulz (1985) demonstrate how managers may choose to hedge corporate
cash flows to protect their personal wealth tied to the firm.13 May (1995) finds evidence
consistent with these theories. He finds that CEOs with more personal wealth invested in the
firm are more likely to diversify the firm. Because diversification has been associated with poor
performance, diversification strategies motivated by managers’ desire to reduce their personal
risk could harm shareholders.14 Tufano (1996) studies corporate hedging practices in the gold
mining industry and finds that firms whose managers hold more options manage less gold price
risk and firms whose managers hold more stock manage more gold price risk. These arguments
imply that providing managers with the ability to hedge their personal holdings and the risk
associated with their firm-specific human capital may reduce investment distortions within the
firm and/or prevent costly hedging of cash flows at the corporate level.15
exemption.13 Firms may use derivative securities at the corporate level to reduce their expected tax burden [Smith and Stulz(1985)], to reduce the investment distortions associated with financial distress and debt financing [Smith, Smithson,and Wilford (1990) and Bessembinder (1991)], and to lower the cost of financing [Froot, Scharfstein, and Stein(1993)].14 Lang and Stulz (1994) find a positive correlation between Tobin’s Q and firm focus. Berger and Ofek (1995) observethat the sum of the imputed values for the individual segments of a diversified firm is 13% to 15% higher than the valueof the combined firm. Comment and Jarrell (1995) demonstrate that reductions in diversification are associated withincreases in firm value, while John and Ofek (1995) note that asset sales lead to an improvement in operatingperformance when there is a corresponding improvement in focus.15 An open questions is the extent to which other mechanisms, such as compensation contracts, could substitute formanagerial hedging. For example, the convexity of the option component of pay may reduce investment distortionscaused by the concavity of the managers utility function.
12
Conversely, allowing managers to use financial instruments to hedge their ownership
positions has the potential to increase the agency conflict between stockholders and insiders.
Numerous studies have highlighted the importance of having managerial wealth sensitive to
shareholder value.16 Giving insiders the flexibility to protect their holdings from fluctuations in
stock price reduces the link between managerial wealth and firm performance. Moreover, most
collars and swaps separate cash flows from voting rights, which may further add to the agency
conflict between managers and shareholders. Lease, McConnell, and Mikkelson (1983) find that
voting rights contain non-pecuniary benefits. Jarrell and Poulsen (1988) find that dual class
recapitalizations, which tend to give insiders greater control of voting rights, are harmful to
shareholders. If managers use collars and equity swaps to reduce the sensitivity of their wealth
to firm performance, they may exert less effort and consume more perquisites than they would
otherwise, resulting in lower firm value.
4. Data
Data for collar and equity swap filings comes from Primark Data Company, a company
that was contracted by the SEC to collect information on insider trading from Forms 3, 4, and 5.
Data from Table I of these filings are published in the Official Summary of Securities
Transactions and Holdings, a monthly publication of the SEC. Primark began collecting both
Table I and Table II data in electronic form in January of 1996 and providing related products to
institutional investors in 1997. We use this data in our study.
16 For example, Morck, Shliefer, and Vishny (1988) find a piecewise-linear relation between inside ownership andTobin’s Q. Jensen and Murphy (1990) argue that the sensitivity of managers’ wealth to firm performance is toosmall to adequately align their incentives with those of shareholders. Similarly, Mehran (1995) finds a positiverelation between CEO ownership and Tobin's Q.

13
We constructed a series of queries for the Table II data that were designed to find any
individual data element from a filing that could be related to a collar or equity swap transaction.
Our initial queries resulted in a sample of over 1,000 transactions. Next we reviewed the data
resulting from these queries and identified transactions that were obviously not collars or swaps.
The Primark Data Company then provided us with a paper copy of every filing. From the filings
we identified 87 zero-cost collar transactions and two equity swap transactions by insiders in 65
firms from the period January 1996 through December 1998. The fact that only two equity swaps
are detected is consistent with the tax disadvantage of these transactions relative to zero-cost
collars. Our sample contains 15 transactions in 1996, 39 in 1997, and 35 in 1998. The increase
in the number of reported transactions is consistent with an increase in the popularity and
availability of these instruments and with the implementation of better developed disclosure
requirements. During the sample period, 51 of our firms report one collar/swap transaction,
seven firms report two, four firms report three, and three firms report four. In addition, these
transactions are generally associated with high ranking individuals within the firm. Our sample
contains 23 transactions by CEOs/Chairmen of the board of directors, 44 by corporate officers,
including those that serve on the board, 20 by directors, and two by ten percent blockholders.
Although we have attempted to identify all collar and swap transactions in the population,
there are several reasons why our data may understate the actual usage of hedging instruments.
First, the latitude given to insiders in the reporting rules promulgated by the SEC make the
transactions difficult to identify from the data in electronic form. In addition, the ambiguity
surrounding reporting of these instruments also could reduce the incentives to report.17 Second,
17 For example, from a Lexis-Nexis search of legal cases, we identify a fraud and insider trading suit againstEmanuel Pinez, the CEO of Centennial Technologies. One portion of the suit deals with a collar transactionpurportedly entered into by Mr. Pinez with Lehman Brothers. We searched all of the insider trading filings of Mr.Pinez, but could find no evidence that this collar had ever been filed on Form 4 or 5.

14
Investment Bankers and Broker/Dealers continue to develop new instruments that provide
hedging opportunities for insiders, but whose reporting requirements and standards have not yet
been promulgated by the SEC; insiders may not even attempt to report the use of these
instruments on their filings. 18 Consistent with this possibility, investment bankers claim that
they are doing many deals in hedging instruments with wealthy executives [e.g., Getler (1994)
and Puri (1997)]. Finally, besides issues of under reporting, the long bull market, which overlaps
our sample period, may to some extent mitigate the current demand for insider hedging.
For our set of sample firms we identified a set of control firms that do not file collar or
swap transactions that are matched by size and industry. We use the book value of total assets
for our size match and the three-digit SIC code from Compustat for our industry match. If the
matched firm differed in size from the sample firm by more than 20% we match using the two-
digit SIC code. We match using financial data available in the year prior to the transaction, and
define our matched firms using the earliest reported collar/swap transaction of the corresponding
sample firm. Thus, we match only one firm to each of our sample firms, regardless of the
number of collars reported by that firm.
From corporate proxy statements, we gathered information on the ownership of officers
and directors, and the composition and size of the board of directors. We employ a director
classification scheme similar to the taxonomy used in Weisbach (1988). Directors currently
employed by the firm or retired, and their immediate families are identified as insiders. Outside
directors are identified as members whose only affiliation with the firm is their directorship. We
employ a third classification "gray" to identify those members of the board with existing or
potential business ties to the firm, but who are not full time employees. Examples of gray
18 As noted earlier, in one of the forms examined that involved a zero-cost collar, the executive had also entered intoan exchange fund, which was footnoted, but not detailed, in the filing.

15
directors include consultants, lawyers, financiers, and investment bankers. Where available, we
also gather data on the equity holdings of the individuals who enter into collar/swap
transactions.19
Stock return data comes from Datastream Inc. and from the Center for Research in
Security Prices (CRSP). From Compustat, we gather data on firm size (total assets) and the
market-to-book ratio. Firm age is computed as the number of years between the collar
transaction and when the firm first appears on Datastream. We also collect data on insider
trading activity (open-market equity sales and purchases) from Primark.
5. Empirical Findings
A. Characteristics of the Zero-Cost Collars
Table 1 provides descriptive statistics for the zero-cost collars in our sample.20 Due to
missing data, the number of observations varies for different data items. Panel A provides
information on the time to expiration, the total number of shares covered, and the percentage of
ownership covered. We report two numbers on the percentage of ownership covered. For a few
of the observations the number of shares covered by the collar in the filing was greater than the
reported ownership in the proxy. The discrepancy could be because the collar is written to cover
options that have not yet vested, or because the insiders' ownership position has changed
between the proxy date and the transaction date. To account for the fact that we have reported
coverage that exceeds ownership in a few cases, we also report the percentage of ownership
covered with observations that exceed 100% rounded down to 100%. For our sample, most of
19 We are able to gather ownership data from corporate proxy statements or prospectuses for 85 of the 89 individualsengaging in hedging transactions.20 Table II of form 4 provides details about the nature of the collar transactions that we summarize in this section.Very little detail, however, is given in the filings on swap transactions. Because we do not have much detail about

16
the collars are described as European. The average life of the collars is 2.25 years. Panel A also
indicates that the collars cover a significant fraction of the insider’s ownership. On average,
these hedging instruments cover over 36% of the insider’s shareholdings. The median insider
covers 30% of their equity holdings.
Panels B and C provide information about the call and put components of the collars.
The average stock price on the day of the transaction is $35. The average exercise price of the
call is $48, which puts the call out of the money by about 36% on the transaction date. The
average exercise price of the put is $31, which places the put about 11% out of the money on the
transaction date. The average percentage spread between the strike prices on the call and put
(not reported in the table) is 47%. Most of the spread comes from the call component.21
The results in Table 1 clearly illustrate the potential benefits of the collar transactions to
insiders. On average, insiders are protected from price declines greater than 11%, but retain the
gains from price increases less than 36%. The asymmetric nature of the collar spread is
particularly relevant if insiders possess better information than the market about future firm
performance. Overall, the data indicate that insiders who enter into a collar hedge a significant
fraction of their ownership, do so for a significant period of time, and can potentially achieve
significant economic benefits from the transaction.22
B. Comparison of Collar Firms to a Control Sample
To provide insight into the motivations of insiders to engage in collars and swaps we
examine differences in financial and governance characteristics between firms where insiders use
the characteristics of the swap and because the vast majority of our observations are collars we focus in this sectionon the sample characteristics of the collar observations.21 We ran some simple back-of-the-envelope calculations to value the options on the transaction date with a simpleBlack-Scholes model. We used the average stock and exercise prices in our sample and assumed a stock pricevolatility of 30%. The calls were priced at almost the same value as the puts, which is consistent with the collarsbeing zero cost on the transaction date.22 We also examined if the structure of the collar was affected by the position of the insider within the firm, but did

17
collars and swaps and those where they do not. Specifically, we expect that collars are more
likely to be used in firms with a greater degree of information asymmetry between the firm and
the market (e.g., in firms that have high market-to-book ratios and younger firms) because
insiders in these firms may have better information about the future prospects of these firms.
The demand for hedging should also be stronger in firms that have been performing well because
insiders in these firms will have had large increases in the value of their equity stakes.
Alternatively, if high stock returns are a signal of overvaluation, then insiders will be more likely
to engage in collars to lock in their gains prior to declines in the firm’s stock price. Finally, if
insiders are subject to non priced risk, they will be more likely to engage in hedging transactions
when they expect an increase in uncertainty about the firm’s operations.
Levels of insider ownership may also be related to the use of collars. Insiders that hold
large equity stakes may be more concerned with firm-specific risk leading to a demand for
hedging instruments. Collars may also be more likely to be used in firms where insiders have
more discretion (e.g., firms that have insider dominated boards). Alternatively, firms with large
insider equity stakes and outsider dominated boards may be more likely to have mechanisms in
place that inhibit insiders’ ability to opportunistically engage in these types of transactions.23
Table 2 compares financial and governance characteristics between the set of collar firms
and a set of matched firms. The mean (median) value of total assets is $3.4 billion ($401
million) for the collar firms and $3.2 billion ($522 million) for the control firms.24 The collar
firms and the control firms are not significantly different in size, indicating a good size match.
not find any significant differences.23 Bettis, Coles, and Lemmon (1999) provide some evidence that firms with higher insider ownership are morelikely to have company imposed restrictions on insider trading in general. They do not provide evidence regardingrestrictions on the use of derivative securities.24 The restrictions on the types of investors that are be able to structure one of these transactions with a aninvestment bank to some extent dictate the size of the firms. Usually the brokers require a minimum stock price of$5.00 per share and the stock volume to be at least 10,000 shares or more per day. These restrictions ensure

18
The average market-to-book ratio of our sample firms is 3.73, which is quite high in absolute
terms and significantly different at the one percent level from that of the matched firms (2.21).
Our sample firms are considerably younger than our control firms. The sample firms have
existed for approximately 8.5 years on average, while the matched firms’ average age is 13.5
years. The age difference is statistically significant at the one percent level.
The sample firms perform very well prior to the date of the collar transaction. Over the
120 trading days preceding initiation of the collar, our sample firms outperform the market index
by 16% on average. The abnormal returns for the matched sample average a negative 7%, and
the difference in abnormal returns between the sample and matched firms is highly significant
(p-value=0.001). There is also some evidence that insiders engage in collars and equity swaps
when they expect an increase in uncertainty. To proxy for the change in uncertainty we calculate
the ratio of the standard deviation of stock returns in the period following the initiation of the
collar transaction to that in the period preceding the date of the collar transaction. This ratio
averages 1.16 for our sample firms and 1.08 for the matched firms, suggesting that volatility
increases after insiders enter into collar transactions. The difference in volatility ratios, however,
is not statistically significant.
The boards of our sample firms are composed of 37% inside directors and 27% outside
directors on average. The corresponding numbers for the matched sample are 36% and 36%,
respectively. The difference is not statistically significant for insiders, but is highly significant
(p-value=0.003) for outsiders. Our sample firms are also less likely to have a board composed of
a majority of outsiders (outsider representation>50%). Outsider majority boards are present in
11% of our sample firms and in 20% of our matched firms. The difference is significant at the
five percent level. The higher number of gray directors in our sample firms largely drives these
adequate trading liquidity for the purposes of hedging the collars risk by the counterparty.

19
differences in outside board representation. The findings on board structure suggest that hedging
transactions by insiders are more common in firms with fewer outside directors. In addition to
fewer outside directors, collar firms are also more likely to have one or more financiers on the
board. These directors may provide expertise in structuring these transactions.
The average ownership by all officers and directors in the collar/swap firms is 17.8% and
21.7% in the control firms. The ownership difference, however, is not statistically significant.
The overall ownership levels for both the collar/swap sample and the control sample are similar
to that found in Holderness, Kroszner, and Sheehan (1999). They find average (median)
ownership of 21.1% (14.4%) for a broad sample of 4,202 publicly traded firms in 1995.
However, their sample likely contains more small firms than does ours.
To investigate the relative importance of firm characteristics associated with the use of
collars and swaps, we perform multivariate logit analysis. The dependent variable is one for
firms that have one or more collar or swap transactions. The independent variables are measures
of firm and governance characteristics. We estimate two different model specifications. Model
one includes only financial characteristics, and model two includes financial and governance
characteristics.
The results of the logistic regressions in Table 3 are consistent with most of our
hypotheses and with the univariate test results. With the exception of firm size, all of the other
variables in the regressions are statistically significant. We find that insiders in firms with a
greater degree of information asymmetry are more likely to hedge their ownership positions.
Specifically, firms with high market-to-book ratios and younger firms are significantly more
likely to have insiders that adopt a collar or equity swap. In line with our expectations, insiders
are significantly more likely to initiate a collar following a period of strong prior performance.

20
Ceteris paribus, insiders in firms that experience the largest increases in stock return volatility
subsequent to the collar transaction are more likely to engage in hedging transactions. The
results on volatility suggest that insiders are more likely to enter into a collar prior to a period of
increased uncertainty about firm performance. Consistent with our univariate analysis,
collar/swap firms have fewer outside directors on the board. In the multivariate analysis,
however, we find lower ownership of officers and directors associated with firms where the
insiders have a collar or swap. This last finding is somewhat puzzling, but may also reflect some
unaccounted for effect of firm age or firm size.
C. Stock Price Changes Surrounding Collar Transactions
Potentially, collars and swaps give insiders the ability to effectively engage in an
"undetected" sale by providing a mechanism where insiders profit from inside information
without triggering the scrutiny and discipline of shareholders or even the SEC. If insiders exploit
their information advantage when initiating a collar in order to reduce their exposure to adverse
stock price movements then we expect to find a relative decline in stock-price performance in the
period following the transaction. In the extreme, if insiders act on information that indicates the
stock is overvalued, we expect to see collar transactions precede large negative abnormal returns
on the firm’s stock. In contrast, if insiders do not act on superior information when they enter
into collars and swaps then we do not expect systematic patterns in abnormal returns surrounding
insider hedging transactions.
Cumulative abnormal returns are plotted in Figure 1 for the 250 days preceding and 120
days following the 89 insider hedging transactions in our sample. We follow abnormal stock
price movements up to six months (120 trading days) following an insider hedging transaction.
The six month window is similar to those used in other studies of insider trading, and also

21
ensures that the insider can unwind the position without violating the short-swing profit rule. We
use two different benchmarks to calculate cumulative abnormal returns. First, we measure
abnormal performance relative to the equally weighted market index. Second, we compute
abnormal performance relative to our size and industry matched set of control firms. Traditional
event study techniques based on the use of residuals from the market model are problematic
given the large runup in stock prices prior to the collar transactions.25 Table 4 reports the CARs
and t-statistics over various intervals. Given the similarity in results for the market index and
control firm benchmarks illustrated in Figure 1, Table 4 only reports results relative to the market
index.
Both Figure 1 and Table 4 show that collar and swap transactions occur after large
positive movements in the firm's stock price. As seen in Figure 1, our sample firms outperform
their benchmarks by a margin of 40% in the year (250 trading days) preceding the collar. Over
the 120 trading days prior to the transaction, Table 4 indicates a statistically significant mean
cumulative abnormal return relative to the market index of 18.96% (p-value=0.001). These
abnormal returns are both statistically and economically significant. In the 120 day period
following the collar transaction we detect no abnormal performance. The mean cumulative
abnormal return relative to the market index in the 120 day period following the collar
transactions is a negative 2.74% (p-value=0.467).26 The pattern of abnormal returns suggests
that, on average, insiders act on their informational advantage and enter into zero-cost collars and
25 Specifically, market model intercepts from the estimation period are significantly positive, leading to spuriousnegative abnormal performance over the event window period. For example, the abnormal returns from a marketmodel event study are a highly significant negative 28% over the 120 days following collar and swap transactions.We avoid estimation problems in the benchmark returns by measuring abnormal returns relative to the market indexand our control firms.26 Interestingly, we find a significantly positive abnormal return of 1.7% over the three-day period following thetransaction date. Data on these transactions is not available to market participants on this date, but is filed with theSEC by the tenth day of the month after the transaction date. We also examined various event windows surroundingthe SEC stamp dates (the date the filing is received by the SEC) [e.g., (-1,0) and (-1,1)] and found no evidence of

22
equity swaps to lock in substantial gains. These gains, however, appear to be permanently
impounded in the firms’ stock prices, implying that the average insider does not profit
significantly from the collar or swap due to declines in the stock price subsequent to the
transaction date.27
To further investigate the motivations of insiders who hedge the risk associated with their
equity stakes, we investigate the cross-sectional variation in abnormal performance following
collar and swap transactions. In Table 5 we regress the 120 day cumulative abnormal returns
relative to the market index on variables related to prior performance, volatility, the insider’s
position within the firm, and the characteristics of the hedging transaction. The explanatory
variables include the abnormal returns on the stock in the year preceding the transaction, the ratio
of the standard deviations of stock returns surrounding the transaction date, firm age, indicator
variables equal to one if the insider is a director, officer, or ten percent owner of the firm (CEOs
and Chairs of the board of directors are included in the intercept term), the fraction of insider
holdings covered by the collar, and the percentage in the money of the put option component of
the collar.
The results in Table 5 show that abnormal returns following the transactions are
positively related to prior performance. This fact is consistent with the notion that large stock
price runups increase the normal demand for hedging by corporate insiders. They do not support
the hypothesis that firms with the largest stock-price runups are more overvalued. Table 5 also
shows that post-collar abnormal returns are negatively related to increases in volatility. This
finding provides additional evidence that some insiders may time their transactions to coincide
both with periods of high volatility and low returns. The coefficients on the position indicator
abnormal stock price behavior.27 Carpenter and Remmers (1999) find a similar pattern of abnormal stock-price performance following insider stock

23
variables provide weak evidence that, ceteris paribus, transactions by directors tend to have more
negative abnormal returns compared to other executives. The coefficient on firm age is not
significant, suggesting that the well documented poor performance of IPO firms (e.g., Ritter
1991) does not explain our findings. The coefficients on the fraction of stockholdings covered
by the collar and the percentage in the money of the put option are negative, but neither are
statistically significant. These last results do not support the idea that insiders cover a larger
portion of their holdings or place a tighter floor on their losses when they expect performance to
be poor in the future.28
The evidence in Tables 4 and 5 indicates that, on average, insiders enter into collars and
swaps around a decline in relative firm performance and prior to an increase in the volatility of
equity returns. These findings provide some evidence that insiders strategically time these
transactions. To provide additional evidence on the timing issue, we examine the market
reaction to earnings announcements both before and after these hedging transactions.
D. Market Reaction to Earnings Announcements Around Collar and Swap Transactions
Quarterly earnings announcements provide information to investors that can be used to
update perceptions about future financial performance. If insiders take advantage of their
superior information about firm performance to strategically time the use of a collar or swap, we
expect them to do so prior to a decline in firm performance. If executives are timing their
transactions in hedging instruments to coincide with changes in firm performance, we expect to
observe a more negative market reaction to earnings announcements that immediately follow a
option exercises.28 These variables may not provide a powerful test of this hypothesis, however, because both are constrained byregulatory and market conditions. The exercise price of the put component is affected by IRS tax rules, while thenumber of shares covered may be truncated from below because of minimum dollar value requirements imposed byinvestment banks for these transactions.

24
collar or swap transaction relative to the market reaction to earnings announcements just prior to
these transactions.
Table 6, presents the market reaction to earnings announcements around the execution of a
zero-cost collar or equity swap. We examine the two earnings announcements prior and the one
immediately following the collar or swap transaction. Abnormal returns are calculated using the
residuals from a market model with parameters estimated over the period beginning 250 days
and ending 51 days prior to the event date. Abnormal returns relative to the market index (not
reported) yield similar inferences. To capture any information leakage surrounding the earnings
announcement and for robustness we use (-10,2), (-5,2), and (-2,2) event windows. Table 6
indicates that the average market reaction to earnings announcements just prior to collar and
swap transactions is significantly positive for all three windows. In contrast, the market reaction
to the first earnings announcement following these transactions is significantly negative. Over
the five day period surrounding the earnings announcement (-2,2), the average cumulative
abnormal return for the earnings announcement at t-1 is 0.86% (p-value=0.062), while that for
the earnings announcement at t+1 is –2.85% (p-value=0.000). For all the event windows there is
a statistically significant difference in the market reaction between the pre- and post-collar
transaction periods. The market reaction to earnings announcements is consistent with the
change in stock price performance documented earlier, and provides additional evidence that
insiders strategically time their use of these instruments.
E. Abnormal Returns and Trading Activity Associated with Insider Sales
Because of their differing reporting requirements and favorable tax treatment, insiders
may view collars and swaps as a means of mimicking a sale transaction, but with less visibility
and potentially lower legal liability. Consequently, we expect abnormal stock price performance

25
following insider hedging transactions to be more negative than that associated with typical
insider selling activity and that these transactions will cover significantly more shares than
regular open market sales of equity. We provide evidence about how collar and swap
transactions compare to insider selling activity, by examining trade sizes and abnormal returns
following open-market insider sales for our sample firms.
Table 7 reports abnormal returns associated with all insider sales for our firms occurring
over the period beginning 42 months prior and ending six months prior to the execution of a
collar/swap. We end six months prior to the initiation of the first collar reported, to ensure that
we measure returns associated with typical trading activity within the firm. Our sample consists
of 2,460 sales in 58 of the 65 collar firms where insiders trade during this time period. Panel A
presents results for all insider trades, and Panel B presents the results for trades over 10,000
shares. We examine large insider transactions because they could provide a better benchmark if
collar transactions are associated with a larger number of shares than a normal sale. We find
that, similar to the collar and swap transactions, insider sales in our firms occur following large
stock-price runups. Abnormal performance for the 120 days preceding a regular insider sale is
15.4% and for sales over 10,000 shares is 20%. Unlike collar transactions, however, the stock
price continues to rise following insider sales for both regular and the larger trades. In our
sample firms, insiders who sell equity on the open market lose money on average. The average
cumulative abnormal returns over the 120 days following insider sales in Panel A and Panel B
are 9.49% and 13.4%, respectively, and both are significant at the one percent level. These
findings contrast with results in many previous studies of insider trading, which find that insiders
generally earn abnormal profits from trading in their own securities [e.g., see Rozeff and Zaman

26
(1988), and Seyhun (1986, 1992)]. We attribute the differences to the types of firms that appear
in our sample and to our sample period.
Table 8, repeats the analysis in Table 7 for 248 insider sales by the same insiders that
later engage in collar transactions. We note that, in Table 8, we were only able to identify sale
transaction by insiders who later engage in collars in 32 of our sample firms, suggesting that
these insiders are not active sellers prior to the time they engage in a hedging transaction. The
results shown in Table 8 are qualitatively similar to those in Table 7. Overall, these findings
contrast with the insignificant abnormal returns following collar transactions documented in
Table 4 and are consistent with the notion that collars and swaps may attract less scrutiny than
insider sales.
The average trade size of insider sales also suggests that insiders view collar and swap
transactions in a substantially different manner than a regular sale of equity on the open market.
The average trade size for all insider sales corresponding to Panel A of Table 7 is 26,113 shares.
For large sales, corresponding to Panel B of Table 7, the average trade size is 51,453 shares.29
This compares with the average trade size for collar transactions of 237,411 shares reported in
Table 1.
To further examine whether insiders engage in collars and swaps instead of insider sales
to reduce their potential legal liability, we analyze open-market insider trading in: 1) a
benchmark period beginning 42 months prior and ending six months prior to the collar/swap
transaction (trading days –900 to –121), 2) The six months just before the collar/swap transaction
(trading days –120 to -1) and 3) the three months immediately following the collar/swap
transaction (trading days +1 to +60). Table 9 illustrates trading activity associated with these
29 The corresponding numbers from Table 8 are 27,265 shares (Panel A) and 44,666 shares (Panel B).

27
three different time periods by measuring the frequency of insider trading and the number of
shares transacted.30 Difference of means tests are relative to the benchmark period.
The data indicate an increase in the number of trades but not in the amount of shares
traded between the benchmark period and the days surrounding the derivative transactions. For
example, on average, insiders make a sale on 7.3% of the available trading days in the
benchmark period. Insiders trade on 12.5% of the days in the 120-day period just prior to a
collar and 10.5% of the days in the period 60-days after a collar transaction, on average.
Relative to the benchmark period, the difference in selling rates is statistically significant in the
pre-transaction period, but is not significantly different from zero in the post-transaction period.
The data also show that insider purchases are suppressed during both the pre- and post-
transaction periods. The total number of shares traded per day, however, while slightly larger in
the periods surrounding the derivative transaction, are not statistically significantly different
from the benchmark period. The data indicate that there is an increase in the rate of net insider
selling activity around the time insiders engage in a derivative transaction but we do not find any
increase in the net number of shares sold. The evidence that insider hedging transactions cover a
significantly larger number of shares than a typical insider sale and take place during a period of
increased open-market insider selling activity is consistent with the view that insiders may
engage in collars and equity swaps at times when an outright sale would likely draw increased
scrutiny.
6. Conclusion
The development of various hedging strategies has given insiders greater flexibility to
alter their effective ownership positions and trade on superior information about firm
30 The methodology is similar to that used in Karpoff and Lee (1991).

28
performance. These instruments allow insiders to hedge their personal wealth and human capital
investments in the firm, but may also lead to greater agency conflicts between owners and
managers. Moreover, the reporting requirements for these contracts may make them less visible
than insider transactions in the open market.
Our analysis indicates that these hedging transactions are important from the perspective
of both the insiders that use these instruments and other market participants. Our data suggest
that insiders hedge a significant fraction of their equity holdings, and that transactions are timed
to lock in gains prior to a shift in firm performance and increases in stock-price volatility.
Furthermore, the abnormal returns following insider transactions in collars and swaps are more
negative than those that follow regular insider sales. Our findings suggest that knowledge of
these transactions may convey valuable information to investors.

29
References
Achstatter, G., 1998, “Managing Risk Without Selling Your Stock,” Investor’s Business Daily,January 26, 1998.
Allen, J. and J. Showers, 1991, “Equity-Index-Linked Derivatives: An Investor’s Guide,”Monograph, Salomon Brothers.
Amihud and Lev, 1981, ”Risk Reduction as a Motive for Conglomerate Mergers,” Bell Journalof Economics 12, 605-617.
Beder, T., 1992, “Equity Derivatives for Investors,” Journal of Financial Engineering,September, 174-195.
Bessembinder, H., 1991, “Forward Contracts and Firm Value: Investment Incentive andContracting Effects,” Journal of Financial and Quantitative Analysis 26, 519-532.
Bettis, J. C., J. Coles, and M. Lemmon, 1998, “Corporate Policies Restricting Trading byInsiders,” working paper, Arizona State University.
Bettis, J., Vickrey, D., and Donn Vickrey, 1997, “Mimickers of Corporate Insiders Who MakeLarge Volume Trades,” Financial Analyst Journal 53, 57-66.
Bolster, P., D. Chance, and D. Rich, 1996, “Executive Equity Swaps and Corporate InsiderHoldings,” Financial Management 25, 14-24.
Braddock, J., 1997, “Derivatives Demystified: Using Structured Financial Products,” New York:Wiley.
Carpenter, J., and B. Remmers, 1999, “Executive Stock Option Exercises and InsideInformation,” Working Paper, New York University.
Comment, R. and G.J. Jarrell, 1995, “Corporate Focus and Stock Returns,” Journal of FinancialEconomics, 37, 68-87.
Eth, J., and Dicke, M., 1994, “Symposium on Securities Litigation Reform: Insider Stock Salesin Rule 10b-5 Corporate Disclosure Cases: Separating the Innocent from the Suspicious,”Stanford Journal of Law, Business and Finance 1, 97-.
Froot, K., Scharfstein, D., and J. Stein, 1993, “Risk Management: Coordinating CorporateInvestment and Financing Policies,” Journal of Finance 5, 1629-1658.
Gastineau, G., 1993, “Using Swaps in Equity Portfolios,” Derivative Strategies for ManagingPortfolio Risk, Charlottesville, VA: Association for Investment Management and Research.

30
Getler, Warren, Sept, 28, 1994, Inside Track column: “Equity swaps now reqiure SEC filing,”The Wall Street Journal, C1.
Givoly, D., and D. Palmon, 1985, “Insider Trading and the Exploitation of Inside Information:Some Empirical Evidence,” Journal of Business 58, 69-87.
Herman, Tom and Suzanne McGee, August 7, 1997. Your Money Matters: How to cut yourcapital gains tax bite, The Wall Street Journal, Section C, page 1.
Holderness, C., R. Kroszner, and D. Sheehan, 1999, “Were the Good Old Days That Good?Changes in Managerial Stock Ownership Since the Great Depression,” Journal of Finance 54,435-469.
Holmstrom, B., 1979, “Moral Hazard and Observability,” Bell Journal of Economics 10, 74-91.
Ip, Greg, September 17, 1997. Inside Track Column: “Collars give insiders way to cut risk,” TheWall Street Journal, Section C, page 1.
Jaffe, J., 1974, “Special Information and Insider Trading,” Journal of Business 47, 410-428.
Jarrell, G., and A. Poulsen, 1988, “Dual-Class Recapitalizations as Antitakeover Mechanisms:The Recent Evidence,” Journal of Financial Economics 20, 129-152.
Jensen, M. and W. Meckling, 1976, “Theory of the Firm: Managerial Behavior, Agency Costs,and Ownership Structure,” Journal of Financial Economics, 305-360.
Jensen, M., and K. Murphy, 1990, “Performance Pay and Top-Management Incentives,” Journalof Political Economy 98, 225-264.
John, K. and E. Ofek, 1995, “Asset sales and increases in focus,” Journal of Financial Economics,37, 105-126.
Karpoff, J., and D. Lee, 1991, “Insider Trading Before New Issue Announcements,” FinancialManagement 20, 18-26.
Lang, L., and R. Stulz, 1994, “Tobin’s q, corporate diversification and firm performance,” Journalof Political Economy, 102, 1248-1280.
Lease, R., J. McConnell, and W. Mikkelson, 1983, “The Market Value of Control in Publicly-Traded Corporations,” Journal of Financial Economics 11, 439-471.
Leland, H. and D. Pyle, 1977, “Information Asymmetries, Financial Structure and FinancialIntermediaries,” Journal of Finance 32, 371-387.

31
May, D., 1995, “Do Managerial Motives Influence Firm Risk Reduction Strategies?,” Journal ofFinance 50, 1275-1290.
Mehran, H., “Executive Compensation Structure, Ownership, and Firm Performance,” Journal ofFinancial Economics, 1995, 38, 163-184.
Morck, R., Shliefer, A., and R. Vishny, 1988, “Management Ownership and Market Valuation:An Empirical Analysis,” Journal of Financial Economics 20, 293-315.
Norris, F., 1994, “For Wall Street, A New Tax Break,” The New York Times, March 21, D1.
Puri, Shaifali, November 10, 1997, Personal Fortune/Investing: New tools for the optionscrowd: Derivatives are for billionaire speculators, right? Not the new, defensive variation thatis catching on in Silicon Valley and elsewhere, Fortune Magazine.
Ritter, J.R., 1991, “The Long-Run Performance of Initial Public Offerings,” Journal of Finance46, 3-27.
Ross, S., 1973, “The Economic Theory of Agency: The Principal’s Problem,” AmericanEconomic Review 63, 134-139.
Rozeff, M., and M. Zaman, 1988, “Market Efficiency and Insider Trading: New Evidence,”Journal of Business 61, 25-44.
Smith, C., C. Smithson, and D.S. Wilford, 1990, Strategic Risk Management (InstitutionalInvestor Series in Finance), Harper and Row, New York.
Smith, C., and R. Stulz, 1985, “The Determinants of Firms’ Hedging Policies,” Journal ofFinancial and Quantitative Analysis 20, 391-405.
Stulz, R., 1984, “Optimal Hedging Policies,” Journal of Financial and Quantitative Analysis 19,127-140.
Seyhun, N., 1986, “Insiders’ Profits, Costs of Trading, and Market Efficiency,” Journal ofFinancial Economics 16, 189-212.
Seyhun, N., 1992, “The Effectiveness of the Insider-Trading Sanctions,” Journal of Law andEconomics 35, 149-82.
Tufano, P., 1996, “Who Manages Risk? An Empirical Examination of Risk ManagementPractices in the Gold Mining Industry,” Journal of Finance 51, 1097-1137.
Yermack, D., 1997, “Good Timing: CEO Stock Option Awards and Company NewsAnnouncements,” Journal of Finance 52, 449-476.

Table 1
Descriptive statistics on the characteristics of zero-cost collars and the fraction of ownership covered. Panel Aprovides general information on the collars that includes the time until expiration in days, the number of sharescovered, the percentage of ownership covered, and the percentage of ownership covered excluding observationsthat exceed 100%. Panel B reports the characteristics of the call component of the option, including the stockprice on the transaction date, the exercise price, the dollar amount the option is in or out of the money on thetransaction date, and the percentage that the call is in or out of the money on the transaction date. Panel Creports the same statistics for the put component of the collar. Data for the collar transactions come from Table2 of Forms 4 and 5, which are SEC filings that report insider trades. The sample consists of 89 transactions inzero-cost collars and equity swaps by corporate insiders between January 1996 and December 1998.
Panel A:
Days toExpiration
Total Shares Covered % Ownership Coveredby Collar Purchase
% Ownership Covered byCollar Purchase (max 100%)
Mean 822 237,411 36.36% 36.18%Median 732 129,862 30.11% 30.11%Max 1826 2,000,000 115.53% 100.00%Min 188 4,800 0.50% 0.50%STD 404 305,622 28.67% 28.21%Number of OBS 87 87 85 85
Panel B (Call Option Component): Panel C (Put Option Component):
TransactionDate Price
ExercisePrice
In theMoney ($)
In theMoney (%)
ExercisePrice
In theMoney ($)
In theMoney (%)
Mean $35.16 $48.19 -$12.76 -35.79% Mean $31.15 -$4.18 -11.44%Median $33.88 $45.84 -$11.14 -29.99% Median $29.85 -$3.47 -10.40%Max $90.50 $117.11 $2.01 6.14% Max $82.34 $5.12 12.52%Min $13.63 $15.50 -$46.27 -113.18% Min $11.34 -$16.99 -31.73%STD $13.29 $19.58 $9.48 24.71% STD $11.59 $3.60 7.51%Numberof OBS
87 86 86 86 Numberof OBS
86 86 86
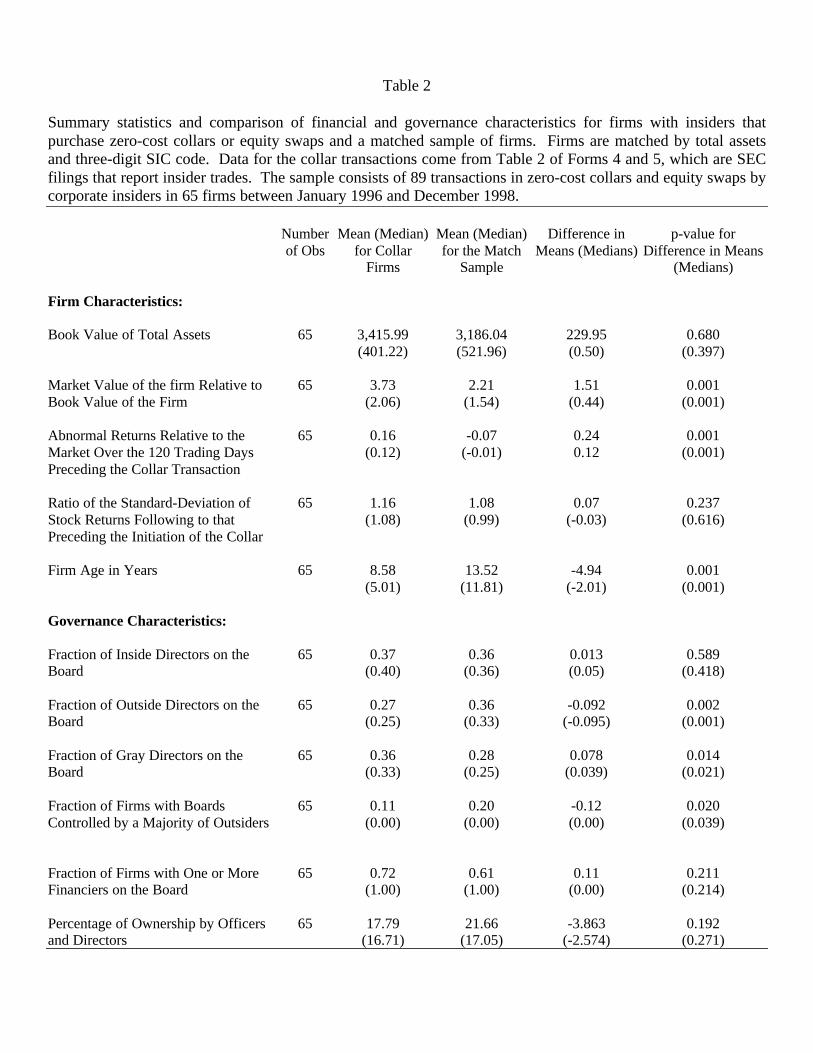
Table 2
Summary statistics and comparison of financial and governance characteristics for firms with insiders thatpurchase zero-cost collars or equity swaps and a matched sample of firms. Firms are matched by total assetsand three-digit SIC code. Data for the collar transactions come from Table 2 of Forms 4 and 5, which are SECfilings that report insider trades. The sample consists of 89 transactions in zero-cost collars and equity swaps bycorporate insiders in 65 firms between January 1996 and December 1998.
Numberof Obs
Mean (Median)for Collar
Firms
Mean (Median)for the Match
Sample
Difference inMeans (Medians)
p-value forDifference in Means
(Medians)
Firm Characteristics:
Book Value of Total Assets 65 3,415.99(401.22)
3,186.04(521.96)
229.95(0.50)
0.680(0.397)
Market Value of the firm Relative toBook Value of the Firm
65 3.73(2.06)
2.21(1.54)
1.51(0.44)
0.001(0.001)
Abnormal Returns Relative to theMarket Over the 120 Trading DaysPreceding the Collar Transaction
65 0.16(0.12)
-0.07(-0.01)
0.240.12
0.001(0.001)
Ratio of the Standard-Deviation ofStock Returns Following to thatPreceding the Initiation of the Collar
65 1.16(1.08)
1.08(0.99)
0.07(-0.03)
0.237(0.616)
Firm Age in Years 65 8.58(5.01)
13.52(11.81)
-4.94(-2.01)
0.001(0.001)
Governance Characteristics:
Fraction of Inside Directors on theBoard
65 0.37(0.40)
0.36(0.36)
0.013(0.05)
0.589(0.418)
Fraction of Outside Directors on theBoard
65 0.27(0.25)
0.36(0.33)
-0.092(-0.095)
0.002(0.001)
Fraction of Gray Directors on theBoard
65 0.36(0.33)
0.28(0.25)
0.078(0.039)
0.014(0.021)
Fraction of Firms with BoardsControlled by a Majority of Outsiders
65 0.11(0.00)
0.20(0.00)
-0.12(0.00)
0.020(0.039)
Fraction of Firms with One or MoreFinanciers on the Board
65 0.72(1.00)
0.61(1.00)
0.11(0.00)
0.211(0.214)
Percentage of Ownership by Officersand Directors
65 17.79(16.71)
21.66(17.05)
-3.863(-2.574)
0.192(0.271)

Table 3
Logistic regressions of the likelihood of insiders engaging in a zero-cost collar or equity swap. The dependentvariable is one for firms where an insider purchased a collar or swap. Independent variables include firm size,the firm's market-to-book ratio, abnormal returns relative to the market in the year preceding the collar, the ratioof the standard deviation of stock returns following the initiation of the collar or swap transaction to thatpreceding the initiation of the collar or swap transaction, firm age, ownership of insiders, and boardcomposition. Firms are matched by total assets and SIC code. Data for the collar transactions come from Table2 of Forms 4 and 5, which are SEC filings that report insider trades. The sample consists of 89 transactions inzero-cost collars and equity swap by corporate insiders in 65 firms between January 1996 and December 1998.χ2 statistics are reported in parentheses.
Dependent variable equals 1 for firms where insiderspurchase a zero-cost collar or equity swap
Explanatory Variables (1) (2)
Intercept -1.407*
(3.48)0.009(0.00)
Total Book Value of Assets 0.000(0.99)
0.000(1.73)
Market Value of the firm Relative to Book Value of theFirm
0.218**
(3.93)0.263**
(4.90)
Abnormal Returns Relative to the Market Over the 120Trading Days Prior to the Collar Transaction
2.095***
(11.11)1.930***
(8.86)
Ratio of the Standard Deviation of Stock Returns in thePeriod Following to that Preceding the Initiation of theCollar
1.205**
(4.48)1.204**
(3.98)
Firm Age in Years -0.061**
(6.51)-0.060**
(5.59)
Percentage of Ownership by Officers and Directors ---- -0.026*
(3.81)
Fraction of Outside Directors on the Board ---- -3.195**
(5.88)
Number of Observations 65 65Log-likelihood 148.35*** 138.63***
***=significant at 1%, ** =significant at 5%, *=significant at 10%.

Table 4
Cumulative abnormal returns following 89 hedging transactions in zero-cost collars and equity swaps bycorporate insiders in 65 firms between January 1996 and December 1998. Abnormal returns are reportedrelative to the equally weighted market index. Both means and medians are reported. Transaction dates areobtained from SEC filings in Table 2 of forms 4 and 5. Returns and the market index are from the Datastreamequity prices database.
Abnormal ReturnInterval
Mean CumulativeAbnormal Return %
Median CumulativeAbnormal Return %
t-statistic for meanCAR equal to zero
Z-statistic forgeneralized sign test
(-120 to 0) 18.96 25.27 4.87*** 4.35***
(0 to +2) 1.71 0.86 2.91*** 1.83*
(0 to +10) -1.04 -0.29 -0.92 -0.1(0 to +20) -1.75 0.81 -1.13 1.19(0 to +40) -3.40 -0.97 -1.56 -0.31(0 to +60) 0.52 3.42 0.20 0.55(0 to +80) -2.09 0.94 -0.68 0.33(0 to +100) -4.89 -4.29 -1.43 -0.31(0 to +120) -2.74 1.52 -0.73 0.76
***=significant at 1%, ** =significant at 5%, *=significant at 10%.

Table 5Cross-sectional analysis of abnormal returns following transactions in zero-cost collars and equity swaps by corporateinsiders. The dependent variable is the cumulative abnormal return calculated relative to the market model over theperiod 120 days following the transaction date. Independent variables include the position of the individual that engagedin the collar, the prior year abnormal stock price performance, the ratio of the standard deviation of stock returnsfollowing the initiation of the collar relative to the standard deviation of stock returns prior to the transaction date, firmage, the fraction of the insider’s shares covered by the collar, and percentage that the put option component of the collar isin the money. The sample consists of 89 transactions in zero-cost collars and equity swaps by corporate insiders in 65firms from the period January 1996 through December 1998. t-statistics are in parentheses
Dependent variable is the cumulative abnormal return relative to the marketindex over the 120 days following the collar transaction.
Explanatory variables
Intercept 0.639***
(2.74)0.418(1.38)
Dummy equal to one if the person is adirector of the firm
-0.312*
(-1.92)-0.324*
(-1.93)
Dummy equal to one if the person is anofficer of the firm
-0.114(-0.82)
-0.140(-0.95)
Dummy equal to one if the person is aten percent owner in the firm
0.169(0.38)
0.104(0.18)
Abnormal Returns Relative to theMarket Over the Year Prior to theCollar Transaction
0.292***
(2.74)0.467***
(3.07)
Ratio of Standard Deviation of StockReturns in the Period Following theCollar to that Preceding the Collar
-0.537***
(-3.29)-0.504***
(-2.74)
Firm Age in Days 0.004(0.57)
0.007(0.95)
Fraction of stockholdings covered bythe collar
_____ -0.06(-0.30)
Percentage in the money of the putoption component of the collar
_____ -0.993(-1.21)
Number of Obs 89 84R2 0.147*** 0.140***
***=significant at 1%, ** =significant at 5%, *=significant at 10%.

Table 6Abnormal returns around earnings announcements in firms whose executives enter into zero cost collars andequity swaps between January 1996 and December 1998. Cumulative abnormal returns are calculated overvarious intervals surrounding earnings announcements. The announcement at t+1 is the first earningsannouncement following the initiation of the hedging transaction. The announcements at t-1 and t-2 are thenearest and second nearest earnings announcements prior to the transaction date, respectively. Abnormalreturns are calculated using the residuals from a market model with parameters estimated over the periodbeginning 250 days and ending 51 days prior to the event date. Returns and the equally weighted market indexare from the Datastream equity prices database. For abnormal returns Z-statistics are in parentheses. Fordifferences in abnormal returns t-statistics are reported in parenthesis.
AbnormalReturn Interval
Mean Cumulative Abnormal Return %
Earnings Announcement Period(t-2) (t-1) (t+1) Difference
(t-1) to (t-2)Difference
(t+1) to (t-1)(-2, +2) -0.46
(1.20)0.86*
(1.89)-2.85***
(-3.80)1.59
(1.25)-3.68**
(-2.00)(-5, +2) 0.18
(1.64)1.82***
(3.05)-3.05***
(3.60)2.18
(1.28)-4.85**
(-2.45)(-10, +2) 0.18
(1.58)2.60***
(3.21)-4.84***
(-4.76)3.18*
(1.83)-7.51***
(-3.40)
***=significant at 1%, ** =significant at 5%, *=significant at 10%.

Table 7Abnormal returns following all insider sales in 58 firms whose executives enter into hedging transactionsagainst their equity holdings between January 1996 and December 1998. Insider sales are from the period –900to –120 days relative to the initiation date of the hedging transaction. If the firm does not report any insidertrades at least six months prior to the transaction date the firm is dropped from the analysis. For firms withmultiple collar transactions, the first collar or swap transaction date is used as the initiation date. Abnormalreturns are relative to the equally weighted market index. The full sample consists of 2,460 insider saletransactions. The sample of sales greater than or equal to 10,000 shares consists of 1,153 insider saletransactions.
Panel A: Abnormal returns around insider salesAbnormal ReturnInterval
Mean CumulativeAbnormal Return %
Median CumulativeAbnormal Return %
t-statistic for meanCAR equal to zero
Z-statistic forgeneralized sign test
(-120 to 0) 14.42 10.78 10.55*** 23.42***
(0 to +2) 0.43 -0.06 2.00** 2.29**
(0 to +10) 1.10 0.56 2.69*** 6.90***
(0 to +20) 1.38 0.41 2.42** 4.40***
(0 to +40) 3.37 2.59 4.24*** 9.85***
(0 to +60) 4.21 2.56 4.35*** 8.64***
(0 to +80) 4.34 1.78 3.88*** 7.59***
(0 to +100) 7.40 5.04 5.93*** 13.04***
(0 to +120) 9.49 8.01 6.95*** 15.34***
Panel B: Abnormal returns around insider sales greater than or equal to 10,000 sharesAbnormal ReturnInterval
Mean CumulativeAbnormal Return %
Median CumulativeAbnormal Return %
t-statistic for meanCAR equal to zero
Z-statistic forgeneralized sign test
(-120 to 0) 17.31 13.07 9.10*** 17.67***
(0 to +2) 0.70 0.16 2.37** 3.30***
(0 to +10) 1.66 1.20 2.91*** 6.37***
(0 to +20) 1.99 0.96 2.51** 4.36***
(0 to +40) 4.42 3.86 4.00*** 9.08***
(0 to +60) 6.07 3.86 4.50*** 7.55***
(0 to +80) 6.97 3.65 4.48*** 7.67***
(0 to +100) 11.09 7.44 6.39*** 12.44***
(0 to +120) 13.40 11.80 7.05*** 13.74***
***=significant at 1%, ** =significant at 5%, *=significant at 10%.

Table 8Abnormal returns following insider sales by insiders who engage in zero-cost collar and equity swaptransactions in 32 firms whose executives enter into hedging transactions against their equity holdings betweenJanuary 1996 and December 1998. Insider sales are from the period –900 to –120 trading days relative to theinitiation date of the hedging transaction. If the firm does not report any insider trades at least six months priorto the transaction date the firm is dropped from the analysis. For firms with multiple collar transactions, thefirst collar or swap transaction date is used as the initiation date. Abnormal returns are relative to the equallyweighted market index. The full sample consists of 248 insider sale transactions. The sample of sales greaterthan or equal to 10,000 shares consists of 140 insider sale transactions.
Panel A: Abnormal returns around insider salesAbnormal ReturnInterval
Mean CumulativeAbnormal Return %
Median CumulativeAbnormal Return %
t-statistic for meanCAR equal to zero
Z-statistic forgeneralized sign test
(-120 to 0) 15.40 11.28 5.04*** 9.27***
(0 to +2) -0.08 -0.70 -0.17 -1.16(0 to +10) 0.09 -0.34 0.11 0.24(0 to +20) -0.11 -1.54 -0.09 -1.16(0 to +40) 0.53 -2.50 0.30 -0.27(0 to +60) 1.34 0.81 0.62 1.64(0 to +80) 1.69 0.32 0.68 1.25(0 to +100) 6.22 6.38 2.23** 3.93***
(0 to +120) 10.48 11.04 3.43*** 6.09***
Panel B: Abnormal returns around insider sales greater than or equal to 10,000 sharesAbnormal ReturnInterval
Mean CumulativeAbnormal Return %
Median CumulativeAbnormal Return %
t-statistic for meanCAR equal to zero
Z-statistic forgeneralized sign test
(-120 to 0) 20.00 16.53 9.10*** 8.14***
(0 to +2) -0.25 -0.75 -0.41 -1.01(0 to +10) 0.84 -0.22 0.72 0.18(0 to +20) 0.86 -0.71 0.53 -0.33(0 to +40) 2.55 0.24 1.13 0.86(0 to +60) 4.38 4.74 1.59 2.04**
(0 to +80) 5.72 1.66 1.80* 2.04**
(0 to +100) 10.77 9.55 3.04*** 4.58***
(0 to +120) 15.44 15.39 3.98*** 6.61***
***=significant at 1%, ** =significant at 5%, *=significant at 10%.

Table 9Trading activity by insiders in 60 firms where executives enter into hedging transactions against their equity holdings between January 1996and December 1998. The benchmark period is measured over the period –900 to –120 trading days relative to the initiation date of thehedging transaction. The event period is measured over the period –120 to –1 trading days relative to the transaction date. If the firm doesnot exist at least six months prior to the transaction date the firm is dropped from the analysis. If a firm has multiple collar or swaptransaction dates, only the first is included. The t-statistic is from a test that the mean of the differences between the event period and thebenchmark period is equal to zero.
Variable Mean DuringBenchmark Period(t=-900 to t=-121)
Mean DuringEvent Period
(t=-120 to t=-1)
Mean Differencefrom Benchmark
(t-statistic)
Mean DuringEvent Period(t=1 to t=60)
Mean Differencefrom Benchmark
(t-statistic)
Number of InsiderSales Per Day
0.073 0.125 0.052**
(2.54)0.105 0.032
(1.42)
Number of InsiderPurchases Per Day
0.013 0.006 -0.007***
(-2.87)0.006 -0.007***
(-2.70)
Net Number ofSales MinusPurchases Per Day
0.060 0.119 0.059***
(2.85)0.099 0.039*
(1.71)
Number of SharesSold Per Day
2,272.4 2,286.7 14.2(0.02)
3,335.6 1063.2(0.86)
Number of SharesPurchased Per Day
576.1 136.1 -440.0(-1.25)
137.0 -439.0(-1.24)
Net Number ofShares Sold minusShares PurchasedPer Day
1,696.3 2,150.6 454.3(0.71)
3,198.6 1502.2(1.17)
***=significant at 1%, ** =significant at 5%, *=significant at 10%.

Figure 1. Cumulative Abnormal Returns Around Zero-Cost Collars and Equity Swaps
-0.1
0
0.1
0.2
0.3
0.4
0.5
-300 -250 -200 -150 -100 -50 0 50 100 150
Event Day
CA
R
CARs relative to the market index
CARs relative to the matched firms