insights into regional development
TRANSCRIPT

http://jssidoi.org/jesi/
ISSN 2669-0195 ONLINE http://doi.org/10.9770/IRD.2020.2.4
INSIGHTS INTO REGIONAL DEVELOPMENT
Volume 2 Number 4
December 2020

INSIGHTS INTO REGIONAL DEVELOPMNET
ISSN 2669-0195 (online) http://jssidoi.org/IRD/
2020 Volume 2 Number 4 (December)
http://doi.org/10.9770/IRD.2020.2.4
Publisher
http://jssidoi.org/esc/home
Volume 2 Number 4 December 2020
INSIGHTS INTO REGIONAL DEVELOPMENT*
* The journal was launched as a platform for dissemination of the project results, which has received funding from
the European Union's Horizon 2020 research and innovation programme European Research Council (ERC) under the
European Union's Horizon 2020 research and innovation programme Marie Sklodowska-Curie Research and Innovation Staff
Exchanges ES H2020-MSCA-RISE-2014 CLUSDEVMED (2015-2019) Grant Agreement Number 645730730
INSIGHTS INTO REGIONAL DEVELOPMENT ISSN 2669-0195 (online) is a peer-reviewed
journal, which publishes original research papers and case studies. It is international journal
published cooperating with universities, social companies, consultancies and associations. It is
published quarterly.
Scope of research includes but is not limited to the following:
Conceptual/Practical Approaches and Methodologies towards Sustainable Regional Development
Globalization, Internationalization and Solutions for Low-Carbon Economies of Scope or Scale
Innovations and Technology Transfer Pilot Results Advancing Regional Development
Information Technologies (IT) and Information Communication Technologies (ICT) for Regional Development, and Socio-
Economic Innovations
Environmental Engineering for Sustainability and Regional Development
Smart Electricity Grid Solutions for Sustainable Regional Development
Entrepreneurship for Regional Development
Safety and Regional Development
Threats to Society, Entrepreneurship and Regional Development
Security and Safety of Countries, Regions and Society as Precondition of Sustainable Regional Development
Boarder Guard Issues and Regional Development
Migration and Sustainable Regional Development
Terrorism, International Crime and Secure Regional Development
Security and Safety Models for Sustainable Regional Development
Emerging Business Drivers, Opportunities, or Constraints in Future Sectors of Current Markets
Retrofitting Techniques and Technologies Near-Zero Energy Demand Buildings and Regional Development
Urban Planning and Advanced Construction Materials for Energy-Efficiency or Smart Cities
Contemporary Regional Development in the Context of Security, Comfort, or Legislation
PPPs for Developments in Sustainable Entrepreneurship, Finance, and Investments
Accounting for Sustainable Regional Development
Sustainable Regional Development in the Context of Management or Life-Long Learning
Strategic Management Practices and Creative Marketing Techniques for Sustainable Regional Development
Organizational Studies and Sustainable Regional Development
Regional Development in the Context of Marketing, ICT, and Creative Industries
Intercultural Communication for Sustainable Regional Development
Institutions and Regional Development
Case Studies on Entrepreneurship and Sustainable Regional Development
Social Cohesion and Social Innovations for Regional Developmnet
Business Models and Strategic Management for Sustainable, Secure and Safe Futures
Corporate Social Responsibility and Sustainable Regional Development
Regional Development in the Context of Psychology, Education, or Women
Intuitions about Emerging Phenomena in Regional Development
Start-Ups, Spin-Offs, SMEs in the Context of Market Growth and Regional Development
Global Value Chain Management for Sustainable Regional Development
Knowledge Management for Sustainable and Safe Regional Development
Legal Regulation Pecularities Affecting Regional Develoment
Editorial correspondence including manuscripts and submissions: E-mail: [email protected]

Editor-in-Chief
Prof. Salvatore Monni, Roma Tre University, Italy
http://orcid.org/0000-0002-6326-5714
Editors
Prof. Manuela Tvaronavičienė, Vilnius Gediminas Technical University, Lithuania
http://orcid.org/0000-0002-9667-3730
Prof. Wadim Strielkowski, Prague Business School, Prague, Czech Republic
http://orcid.org/0000-0001-6113-3841
Prof. Gil Vieira, Instituto Nacional de Pesquisas da Amazônia, Brazil
Author ID: 7005863986
Dr. Keti Lelo, Università degli Studi Roma Tre, Rome, Italy
http://orcid.org/0000-0002-2009-3772
Prof. Sebastian Kot, Management Faculty, Czestochowa University of Technology, Poland
http://orcid.org/0000-0002-8272-6918
Ms. Elisa Natola CONFAP, Brazilian National Council of State Funding Agencies, Brazil
Dr. Throstur Olaf Sigurjonsson, School of Business, Reykjavik University, Iceland throstur(at)hr.is
Author ID: 35520490200
Prof. Abel Femi Adekola, Wilkes University, USA
Author ID: 16302866000
Prof. Fan Lü, Tongji University, Shanghai, China
http://orcid.org/0000-0002-8496-3941
Prof. Gilberto de Miranda Rocha, Federal University of Pará, Belém, Brazil
Author ID: 55813405600
Prof. Marina Sheresheva, Lomonosov Moscow State University, Russian Federation
Author ID: 44662077400
Prof. Dr. Sibylle Heilbrunn, Kinneret Academic College on the Sea of Galilee, Israel
Author ID: 16642930200
Dr. Amr Radwan, Academy of Scientific Research and Technology
http://orcid.org/0000-0002-5567-6708
Prof. Armenia Androniceanu, The Bucharest University of Economic Studies, Faculty of
Administration and Public Management, Bucharest, Romania
Author ID: 35253283800
Prof. Najiba El Amrani, University Sidi Mohamed bin Abdellah, Faculty of Science and Technology,
Fes, Morocco
Author ID: 56122394900
Prof. Bora Aktan, University of Bahrain, the Kingdom of Bahrain
http://orcid.org/0000-0002-1334-3542
Prof. Gunnar Prause, Tallinn University of Technology, Estonia
http://orcid.org/0000-0002-3293-1331
Prof. Vera Komarova, Daugavpils University, Latvia

http://0000-0002-9829-622X
Prof. Fernando García, Department of Economics and Social Sciences, Faculty of Busines
Administration and Management, Polytechnic university of Valencia, Spain
Author ID: 57201603529
Dr. Michal Fabus, School of Economics and Management in Public Administration in Bratislava, Slovak
Republic
http://orcid.org/0000-0002-3792-179X
Prof. Sulphey, M.M. Prince Sattam Bin Abdulaziz Universtiy, Al-Kharj, Saudi Arabia
http://orcid.org/0000-0001-6042-2123
Prof. Mirjana Radović-Marković, Institute of Economic Sciences, Belgrade, Serbia
Author ID: 36680528200
Prof. Ronaldo Lopes Rodrigues Mendes, Federal University of Pará, Belém, Brazil
https://orcid.org/0000-0002-5584-8688
Dr. Andrea Bernardi, Oxford Brookes University, UK
Prof. Francesco Vigliarolo, Universidad Católica de La Plata, Argentina
Dr. Laima Gerlitz, Wismar University of Applied Sciences, Wismar, Germany Author ID:
57015379200
Dr. Federico Tomassi, Agenzia per la Coesione Territoriale, Italy
Dr. Kiran Javaria, University of Lahore, Lahore, Pakistan
https://orcid.org/0000-0002-6147-5283
Prof. Maria da Gloria Gonçalves de Melo, Universidade do Estado do Amazonas, Brazil

INSIGHTS INTO REGIONAL DEVELOPMENT
ISSN 2669-0195 (online) http://jssidoi.org/IRD/
2020 Volume 2 Number (December)
http://doi.org/10.9770/IRD.2020.2.4
Publisher http://jssidoi.org/esc/home
__________________________________________________________________________
Volume 2 Number 4 December 2020
CONTENTS
Minister Rimantas Sinkevičius
FOREWORD 724
Massimiliano Mazzanti, Matteo Mazzarano,
Andrea Pronti, Marco Quatrosi.
FISCAL POLICIES, PUBLIC INVESTMENTS AND WELLBEING:
MAPPING THE EVOLUTION OF THE EU 725
Dainius Genys, Ričardas Krikštolaitis.
LUSTERIZATION OF PUBLIC PERCEPTION OF NUCLEAR ENERGY
IN RELATION TO CHANGING POLITICAL PRIORITIES 750
Peter Ehizokhale Okpamen, Sunday Oseiweh Ogbeide.
BOARD DIRECTOR REPUTATION CAPITAL AND FINANCIAL
PERFORMANCE OF LISTED FIRMS IN NIGERIA 765
Kiran Javaria, Omar Masood, Fernando Garcia
STRATEGIES TO MANAGE THE RISKS FACED BY CONSUNERS IN
DEVELOPING E-COMMERCE 774
Francesco Vigliarolo.
TOWARDS AN ONTOLOGICAL REASON LAW IN ECONOMICS:
PRINCIPLES AND FOUNDATIONS 784
Manuela Tvaronavičienė, Tomas Plėta, Silvia Della Casa, Juozas Latvys.
CYBER SECURITY MANAGEMENT OF CRITICAL ENERGY
INFRASTRUCTURE IN NATIONAL CYBERSECURITY STRATEGIES:
CASES OF USA, UK, FRANCE, ESTONIA AND LITHUANIA 802
Marcel Lincényi, Martin Laczko.
INFLUENCE OF BREXIT ON EDUCATION TOWARDS EUROPEANISM 814
Henry Usunobun Ogiugo, Isaac Olufemi Adesuyi, Sunday Oseiweh Ogbeide.
EMPIRICAL TEST OF CAPITAL ASSET PRICING MODEL ON SECURITIES
RETURN OF LISTED FIRMS IN NIGERIA 825

FOREWORD to
INSIGHTS INTO REGIONAL DEVELOPMENT
2020 Volume 2, Number 4 (December)
Dear readers,
We all have the same destiny to live in the era of accelerating technological changes. Those changes are present
in either, developed and less developed world. Rapidly developing innovations not only allow enjoying life that
is more prosperous. At the same time, we are forced to face new challenges, related to newly emerged threats.
All spectrum of those multifaceted complex phenomena are observed on regional level, from which all processes
spread globally. Therefore, earlier unknown regional development patterns have to be in in permanent focus of
scientists, governments and societies. Observation, understanding new contemporary life trends in different
regions is a key to prudent decision-making at any level of governance. Hence, all attempts to create a hub of
knowledge and experience are valuable contributions leading to better our common future.
Insights into Regional Development journal provides an international platform for expertise sharing. The journal
is supported by European Commission through Horizon 2020 funding. Let us contribute, read and discuss in
order regional achievements would lead to global ones, while regional issues would encounter instant and
efficient, both, local and international, resistance.
With my respectful greetings,
Rimantas SINKEVIČIUS
Minister
Ministry of the Economy and Innovation of the Republic of Lithuania
INSIGHTS INTO REGIONAL DEVELOPMENT
ISSN 2669-0195 (online) http://jssidoi.org/IRD/
2020 Volume 2 Number 4 (December)
http://doi.org/10.9770/IRD.2020.2.4(1)
Publisher http://jssidoi.org/esc/home
725
FISCAL POLICIES, PUBLIC INVESTMENTS AND WELLBEING:
MAPPING THE EVOLUTION OF THE EU*
Massimiliano Mazzanti 1, Matteo Mazzarano 2, Andrea Pronti 3, Marco Quatrosi 4
1,2,3,4 Department of Economics and Management, University of Ferrara, Via Voltapaletto, 11 44121 Ferrara, Italy
E-mails:1 [email protected]; [email protected]; [email protected]; 4 [email protected]
Received 18 June 2020; accepted 27 August 2020; published 30 December 2020
Abstract. The European Union faced several crises in the last twenty years that destabilized its macroeconomic equilibrium
and development capacity. Standard economic methodologies were capable of neither predicting nor completely solving
these crises through appropriate investments. To understand the overall development performance, the well-known Human
Development Index (HDI) is the most widely deployed conceptual framework. In this article, we look at the components of
welfare dynamics in the EU by examining socio-economic performance. Through a ‘beyond gross domestic product (GDP)’
approach, we analyse public expenditures, especially focusing on the pillars of growth and socio-economic development:
education, health, and total R&D. We believe that convergence policies and sustainability policies should together be given a
greater role within the EU agenda. They are necessarily interlinked with each other and with the common welfare, the true
objective of public policy. European strategies on the key human development pillars were heterogeneous during the last
decades. The post 2009 recession was characterized by non-expansionary measures that have undermined development in
most countries. Due to the lack of a robust investment patterns towards human and sustainable development, European
* The research is conceptually related to the activities of the European Topic Centre on Waste, materials and the Green
Economy (ETC WMGE, European Environment Agency). It is also within the research activities of the 2018-2022 UNIFE
project on Circular economy, Innovations and SMEs funded by MIUR Italian ministry under the ‘Departments of excellence’
programme, and the activities of the related CERCIS research centre on Circular Economy, Innovation and SMEs.
All responsibilities remain upon the authors

INSIGHTS INTO REGIONAL DEVELOPMENT
ISSN 2669-0195 (online) http://jssidoi.org/jesi/
2020 Volume 2 Number 4 (December)
http://doi.org/10.9770/IRD.2020.2.4(1)
726
countries were not fully prepared to tackle the COVID-19 shock. Growth and development figures were already gloomy in
2019 and the years before. The hope is that this lesson is useful to create a solid society and economic system for possible
future crises.
Keywords: fiscal policies; public investments; wellbeing; EU
Reference to this paper should be made as follows: Mazzanti, M., Mazzarano, M., Pronti, A., Quatrosi, M. 2020. Fiscal policies, public
investments and wellbeing: mapping the evolution of the EU. Insights into Regional Development 2(4): 725-749.
http://doi.org/10.9770/IRD.2020.2.4(1)
JEL Classifications: Q01
1. Introduction
Is the current systemic crisis a new type of shock? Yes and no. Its global diffusion is certainly a partial novelty.
On the other hand, the evolution of human societies has always been characterized by shocks (pandemics,
pestilences, wars, capitalist recessions, etc.), which generate destructive and creative effects on the socio-
economic side or even radical changes and require political responses in the short and medium term (Krugman,
2018). Economic development and socio-economic patterns are highly nonlinear and heterogeneous: policies,
wars, and recessions act as structural breaks and can modify the patterns that link the environmental, social,
economic, and technological spheres. Smoothness and linearity are specific cases within a very nonlinear
historical development that has largely been driven by crises and policy responses to crises (Musolesi and
Mazzanti, 2014; UNIDO, 2018).
The current COVID crisis is thus partially new. The key point is to reflect upon what happened before the crisis in
terms of investments in some key public goods that support human development and growth, namely, education,
R&D and health. Were we investing enough? Were investments in sustainability (Hamilton and Hartwick, 2005;
Spinozzi and Mazzanti, 2018) on an increasing or decreasing trend?
Those questions are relevant because the current crisis comes exactly 10 years after the previous crisis. It is thus
relevant to analyse how the capacity to tackle the current socio-economic and health crisis is affected by the
investments we made in between the two crises. Societies and economic systems could be more fragile now than
before 2009 due to the disinvestments that may have occurred in some states to ‘adjust’ public budgets, following
so-called expansionary austerity policies†. It is therefore also relevant to reflect on the possible policy changes
(fiscal, monetary, innovation, human development, environmental) that the current crisis calls for.
We had a large, typical capitalistic recession due to excess supply over demand – fuelled by financial
globalization – in 2008-2009. Unlike the USA, Europe did not react with the appropriate mix of monetary and
fiscal policies. Thanks to Mario Draghi’s ‘whatever it takes’ policy, European growth was sustained over 2013-
† In late 2019, the euro area budget balance showed a 1% deficit, in the face of gloomy growth and unemployment figures. The USA
presented a 4.6% deficit before the coronavirus crisis and soon reached 12% in March 2020, while the EU debated the amount and type of
deficit (eurobonds, coronabonds, etc.) to take on. An interesting view, which is possibly the only pragmatic way out, is offered by Jordi
Gali (https://voxeu.org/article/helicopter-money-time-now), who proposes that “there is an alternative to a strategy based on higher taxes
and/or more government debt in order to finance such an emergency fiscal programme, albeit one that has remained a taboo among most
economists and policymakers – namely, direct, unrepayable funding by the central bank of the additional fiscal transfers deemed necessary,
an intervention commonly known as ‘helicopter money’”.

INSIGHTS INTO REGIONAL DEVELOPMENT
ISSN 2669-0195 (online) http://jssidoi.org/jesi/
2020 Volume 2 Number 4 (December)
http://doi.org/10.9770/IRD.2020.2.4(1)
727
2019, but at the end of 2019, unemployment was still at high levels, inflation was dramatically low at under 2%‡,
and the EU’s sustainable debt ratio was at approximately 80% of GDP. Growth and macroeconomic fundamentals
were neither good nor stable before the coronavirus crisis occurred. Fiscal policy mismanagement§ has been
especially relevant in the EU. The only ‘benefit’ of the lack of proper fiscal expansionary measures is the low
debt, which could allow for the expansion of fiscal policy in a very substantial way, with inflation being only a
pseudo-problem now. Instead, a vicious circle of Japanese-style deflation is the threat to be dealt with.
As one example among others, the green recovery packages that were discussed at the G20 in April 2009 were
soon abandoned. The G20 had proposed these packages – which were heterogeneously implemented by countries
– to address the downturn as a sort of global Green New Deal, with specific reference to the technological effects
of ecological tax reforms (UNEP, 2009).
In 2019, after 10 years of low growth and fears of secular stagnation, the EU and key players such as Germany
were discussing Green New Deals to sustain demand, which involve investments in green R&D, infrastructure,
and green human capital. In addition, the EU Circular Economy Strategy (EC, 2015, 2020) highlights innovative
business models and explicitly monitors circular economy innovations, such as ‘patents related to recycling and
secondary raw materials’, at the macroeconomic level (Eurostat, 2020). In a different economic and political
cycle, a proposal for a Green New Deal originated in the US in 2018. The non binding proposal, known as the
‘Ocasio-Cortez resolution’ of the Democratic Party, was defeated in the Senate in 2019. Those Green New Deal
ideas are necessary. Governments could extend such proposals into a Wellbeing New Deal, coherent with a broad
sustainability and human development perspective that considers the necessity of a ‘just transition’ as well.
Against this background, this paper analyses the macroeconomic trends that are most relevant for sustainability**
from a medium- to long-run perspective, which can be useful in helping us ‘understand the past to change the
future’.
2. Sustainable development and wellbeing: a brief background of the concept over history
By acknowledging the human impact on the environment and the extent to which natural capital affects economic
development, the first United Nations “Conference on the environment and sustainable development” in 1972
identified the key principles that led to the definition of the Human Development Index in 1980 and sustainable
development at the end of the 1980s. This was the background for the new emphasis placed on sustainable
development in that period to correct the environmental (and social) distortions of market-driven economic
growth. Macroeconomic thinking was at the centre of the sustainable development idea, formalized by the
Brundtland commission in 1987 and five years later at the Rio convention. The 1990s also witnessed the birth of
EU waste management and disposal policies, the background for the waste prevention/circular economy
framework.
A focus on the interconnections between sustainable and human development (e.g., the key role of human and
social capital) has contributed to the development of a fruitful, broad view of development strategies. The
‡ Related to international competition in financial and goods market, a lack of unionization, flexible labour markets, low oil prices, a lack
of very stringent environmental policy, a lack of expansionary fiscal policy, etc. § In December 2019, Germany presented a budget balance in surplus (+1%) in the face of high unemployment levels in Europe. The US
policy mix was pragmatic (a budget deficit of 4.6% in December 2019, following deficits of 8-10% over 2010-12). Before the crisis,
France (with a deficit of 3.2%) was the only country in the EU to follow a different model of fiscal policy from the German one. The
surplus on the German current account balance (+7% in 2019!) is more a consequence of its fiscal surplus than of German competitiveness.
Germany itself was suffering from its export-biased growth model: its pre-virus growth was 0.6%. ** We do not consider here the issue of environmental and economic sustainability. We refer the reader to the brand-new EEA Report
launched in April 2020 (EEA, 2020), in which some SEEDS and University of Ferrara members appear as contributors.

INSIGHTS INTO REGIONAL DEVELOPMENT
ISSN 2669-0195 (online) http://jssidoi.org/jesi/
2020 Volume 2 Number 4 (December)
http://doi.org/10.9770/IRD.2020.2.4(1)
728
economic approach to the concept of sustainable development revolves around substitutability between natural
and produced capital, which gives rise to the identification of weak or strong sustainability (Neumayer, 2014).
The macroeconomics of sustainable development literature points to the role of capital accumulation in all its
forms (natural, human, manmade, social) through investments and provides theoretical rules for the sustainable
management of renewables and non-renewables (e.g., the Hartwick rule or golden rule to properly manage rents
to set a constant pattern of investments). Genuine savings measures, especially some used by the World Bank,
have originated from the Hartwick rule for the reinvestment of rents from the depletion of natural capital into
reproducible forms of capital. The ‘management of resources’ literature widely debates how to achieve patterns of
sustainability, including related ethical and equity considerations.
From the neo-Keynesian perspective, Heyes (2000) attempted to incorporate the environmental constraint in a
standard IS-LM model. Through this IS–LM–EE framework, he showed that overlooking the environment when
planning economic development is a strategy for serious breakdown and that sustainable economic development
needs to be supported by costly but necessary control measures and by upgraded economic standards (Sim, 2006).
Reconnecting to the Limits to Growth and to the legacy of Herman Daly’s macroeconomic theory, ecological
economists and social scientists introduced the theme of degrowth to achieve the objectives of a new
sustainability, namely, a lighter, fairer, more inclusive society. The concept has stimulated a broad inter- and
multidisciplinary debate and has offered an opportunity to integrate theories.
In this setting, the role played by institutions must be considered. As Van den Bergh (2011) argued, while, on the
one hand, GDP growth is not a robust indicator of social welfare, and so it is possible to completely ignore it, on
the other hand, GDP degrowth is neither necessary nor sufficient for sustainability. The correlations between GDP
and welfare or between GDP and environmental impact are not constant and fixed over time. According to the
author, it should be stressed that being against GDP or against unconditional GDP growth is not the same as being
against growth. Innovation and knowledge are crucial to create a sustainable, inclusive society that is oriented
toward human development, where GDP is a means of achieving objectives, not the objective itself.
While innovation was not a primary factor in the sustainable development debate, it entered the scientific and
policy arena in the late 1990s, mainly through the assessment of the hypothesis that environmental policies may
induce techno-organizational innovations that the market on its own would hardly support. Over time, the notion
of innovation has broadened to include eco-innovations, sustainable innovations, frugal innovations, etc., with
reference to the complementarity between innovation and human resources (knowledge). This reconciles the
innovation framework with economic growth theory and economic development studies.
Overall, the macroeconomic policies and strategies that the EU is shaping, with special emphasis on the Green
New Deal, should be informed by the historical evolution of sustainable development perspectives. Investments in
social and environmental sustainability, and investments in general, are the pillar of a strategy aimed at achieving
increasing wellbeing. The integration of green investments and environmental policies with
innovation/knowledge investments and the fiscal/monetary policy framework is crucial to fully pursuing the
various interconnected development goals. The Green/Wellbeing New Deal should be a way to generate a turning
point in the path towards sustainability for European societies and economic systems, including in the face of
other shocks (economic dislocations, resource scarcities, wars, the coronavirus pandemic) that demand
appropriate macroeconomic responses through investments.
Investment growth is a cycle that requires economic growth. New resources are collected via taxes and then
redistributed. If economic growth is low or higher taxation is not possible to implement, deficit spending is
required. In turn, maintaining the status quo or enacting changes in public expenditure affect the political cycle.
This was the case in Southern European countries. As we will show further on, this policy paid off less than in

INSIGHTS INTO REGIONAL DEVELOPMENT
ISSN 2669-0195 (online) http://jssidoi.org/jesi/
2020 Volume 2 Number 4 (December)
http://doi.org/10.9770/IRD.2020.2.4(1)
729
their northern counterparts, where growth was nourished by trade surpluses. This instability of macroeconomic
accounts affected the divergences of policies.
In this paper, as a first step, various cross-country comparisons will be presented, taking as reference a set of key
fiscal and economic indicators, including innovation, over the main EU economies, which may provide food for
thought on the heterogeneity of their performance. Different economic-fiscal models could emerge on the basis of
an economic equilibrium that has partially recovered from the 2008 downturn but still presents critically high
unemployment, unstable GDP growth and below-target inflation (Krugman, 2018). The lack of a sustainable full-
employment dynamic largely depends on within-EU socio-economic divergences and disequilibria in economic
accounts. These divergences and disequilibria are largely driven by trade surpluses/deficits, public budgets and
debt, R&D expenditures – in other words, a general lack of fiscal coordination and homogeneity, in addition to
the well-known 3% deficit/GDP target. The analyses below are a way to describe the current situation. This ex
post portrait covering the past two decades is useful for discussions – with the help of complementary ex ante
modelling exercises – of the future dynamics of EU fiscal sustainability, starting from the current national fiscal
models, heterogeneity, deficiencies, and criticalities. This paper will provide evidence based on cross-country
comparisons of various indicators and country-specific analysis of the dynamics of these indicators from Eurostat
datasets updated to 2019.
We present indicators on education, research and health as a summary of the most relevant evidence underlying
different patterns of investment amongst EU countries. The set of variables that the paper analyses is limited to
those that mainly influence citizens’ wellbeing. However, the paper tries to capture the essential facts that drive
the macroeconomic variables influencing economic development, which is the central framework wherein
environmental, social and fiscal sustainability is integrated. One of the key messages is that environmental and
social sustainability are embedded and dependent on a higher-level macroeconomic framework, the short- and
medium-term dynamics of which need to be described and understood. We first present the main macroeconomic
and fiscal dynamics, and then the analysis will proceed with a more detailed examination of key indicators and
substantive factors related to wellbeing, considering the investments in economic growth and development
(health, education, innovation). Finally, we conclude by providing some highlights.
3. Public Governance and Wellbeing
Wellbeing can be disentangled into five dimensions related to the fulfilment of a certain set of psychological,
material and social needs (i.e., the objective dimension), individuals’ degree of freedom and resources to meet
their desires (i.e., the preference satisfaction dimension), individuals’ realization of their own potential (i.e., the
flourishing dimension), the relative prevalence of positive moods (i.e., the hedonic dimension) and individuals’
feeling and assessment of their own lives (e.g., the evaluative dimension) (Atkinson and Mourato, 2015;
MacKerron, 2012). Although how to evaluate such aspects appears complex, the path followed by many
researchers leads through the examination of the drivers of human development. The most famous composite
index, the Human Development Index (HDI), is calculated by incorporating three relevant aspects of individual
life: life expectancy, education and access to goods and services (Mericková and Halásková, 2014). Trivially, the
index measures how well and for how long residents of a nation can live considering their health, education and
incomes. The HDI approach has been extended to the assessment of inequality conditions within countries using
the inequality adjusted HDI indicator (UNDP, 2019). Some authors further include sustainability measures in the
calculation to also consider environmental sustainability as a dimension of wellbeing (Biggeri and Mauro, 2018;
Hickel, 2020), while others add further dimensions such as peace and happiness (Prakash and Garg, 2019). Other
indicators of wellbeing have been deeply analysed by Maridal et al. (2018).
The historical roots of the general perspective of the Stiglitz-Sen-Fitoussi Commission date to the aftermath of the
great crisis of 2008. Despite the nature of the event, the aftershocks resonated for years, affecting both economic

INSIGHTS INTO REGIONAL DEVELOPMENT
ISSN 2669-0195 (online) http://jssidoi.org/jesi/
2020 Volume 2 Number 4 (December)
http://doi.org/10.9770/IRD.2020.2.4(1)
730
and non-economic performance. The intuition of the authors is that the crisis and society’s response to it
determined the loss of accumulated capital. Many experts have emphasized (Fleurbaey and Blanchet, 2013;
Stiglitz et al., 2018) the necessity of reinterpreting economic indexes. The national account system based on GDP
ignores issues such as income distribution, environmental impact and hidden capital, as well as other forms of
knowledge accumulation. Other perspectives have tried to cope with these limitations. An environmental
perspective on accounts suggests the addition of natural resource flows to national accounts (Leunig, 2011;
Monfreda et al., 2004). In this line of argument, natural capital represents a direct source of welfare for nearby
communities; therefore, its protection indirectly influences human users (Kamarianakis and Xepapadeas, 2006).
Strong sustainability suggests the need to avoid the use of neoclassical indexes to avoid the errors of policies
based on them (Kallis, 2011; van den Bergh, 2011): material consumption drives economic growth, inducing the
loss of irrecuperable amounts of permanent capital (van den Bergh, 2011). The commonality between these fields
is the link between indexes and policy-making: a change in perspective on the former will impact the latter. The
elaboration of new indexes needs to start from the key factors of wellbeing in our society, with aspects and
definitions that can be operatively accounted for.
The consumption of both goods and services directly affects standards of living; a society with a high HDI
generally should have access to quality healthcare, enough food supplies and broad labour possibilities. The
source of such wellbeing could be related to private entrepreneurship as well as public governance. Good
governance can improve life quality perceptions either directly or indirectly. The direct effect arises because good
governance is preferable to bad governance for improving both social and institutional trust and political
consensus, in turn influencing growth and general perceived wellbeing. In the indirect case, good governance can
be viewed as a generator of the stream of services, goods and opportunities derived from public governance
(Helliwell et al., 2018). Access to services and better job opportunities are directly related to the education
system, which is a public service in the EU. Similarly, safe and healthy livelihoods are secured by access to
healthcare. Good governance in the provision of such public goods strongly fosters the general level of education
and life expectancy (Hardeman and Dijkstra, 2014; Prakash and Garg, 2019).
Citizens’ use of and general concern over public goods and services has tended to be similar across Europe in
recent decades (Lefebvre et al., 2010). This positive feedback loop has improved the general quality of
governance, but over the years, European countries have experienced different compositions of expenditure on
pure public goods such as defence, public order and justice and merit goods†† such as health, education and other
social services (Fiorito and Kollintzas, 2004). In particular, the returns to investing in knowledge, which could be
research, innovation or education, affect the feedback loop of wellbeing growth in the long term (Paliova et al.,
2019). Heitger (2002) provides evidence of a general trend of expansionary government spending on public
goods, albeit with different patterns among European countries; the author highlights that for OECD countries,
public expenditure dedicated to public goods over GDP is on average 14%. Regardless, there is no evidence of a
strict relation between public expenditure on public goods and wellbeing. Davies (2009) highlights that public
expenditures and investments are associated with an increasing level of HDI for developed countries, whereas this
is not evident for less developed countries. Therefore, the effect of public governance on wellbeing apparently
depends on the initial socio-economic conditions of the country itself.
†† The distinction between public and merit goods derives from their respective intrinsic natures and modes of delivery. The former can be
provided only by a public body to avoid market failures as they are non-rivalrous and non-excludable, whereas merit goods can also be
provided in private form through the market, as they are excludable and rivalrous. The main difference from private goods is that merit
goods are provided by the public budget as a political decision to avoid their consumption depending only on citizens' individual
willingness to pay, as these goods have strong positive externalities on society as a whole (Pulsipher, 1972). In this paper, we refer to
public goods in a broad sense, encompassing both pure public and merit goods.

INSIGHTS INTO REGIONAL DEVELOPMENT
ISSN 2669-0195 (online) http://jssidoi.org/jesi/
2020 Volume 2 Number 4 (December)
http://doi.org/10.9770/IRD.2020.2.4(1)
731
Europe generally stands at the frontier of HDI, with some peculiarities. For instance, there is great heterogeneity
in performance. Within nations such Italy and Spain, we can observe both under- and over performance on certain
indicators (Charron et al., 2012). Differences in public goods and governance are evident if evaluated at the
national level but not at the regional level. This is especially relevant for indicators related to education and
healthcare (Paliova et al., 2019). On the whole, there is no stark difference between the access provided by
southern and northern European countries. Education is, on the other hand, the compass of difference, especially
in the long term. North-eastern countries display a higher level of education than their southeastern peers. Studies
stress the long-term effect that education has on economic performance and wellbeing and governance (Paliova et
al., 2019).
The approach applied in other studies focuses on developing indicators to compare nations or regions. Such
indexes normalize outcomes in such a way that it is possible to create scores and ranked lists. Furthermore, many
authors consider public goods such as peace, environmental safety and others to be main factors in wellness. This
approach has the flaw of interpreting wellness or its drivers in a relative manner. It eliminates the possibility of
evaluating the drivers by country in absolute terms. We will therefore present here the dynamics of public goods
such education and healthcare across the EU by considering public expenditure for selected countries from a long-
term perspective using the Eurostat dataset.
4. Main economic and fiscal dynamics of selected EU countries: an overview
Before we conduct the analysis of key indicators, one interesting point might be worth mentioning. The budget
response to the most recent economic downturn was not uniform within the EU. Some countries (i.e., Italy,
France, Spain, Portugal, UK) experienced an expansion of the debt-to-GDP ratio, whereas for others, the opposite
occurred (see Fig. 12 in Appendix A). In most cases, ‘debt crises’ are stagnations of economic productivity
(International Monetary Fund, 2017), which may depend on insufficient structural investments in the drivers of
growth (education and innovation) (UNIDO, 2018, 2016). This is the iconic depiction of EU fragmentation: a lack
of macroeconomic equilibrium within the area and macroeconomic mismanagement of convergence. The
divergences are highly related to structural growth discrepancies and the ‘expansionary austerity’‡‡ measures
adopted in the EU after the crisis. (Conversely, the USA was, at the time of writing, at a 3.7% unemployment rate,
the lowest since the 1960s.)
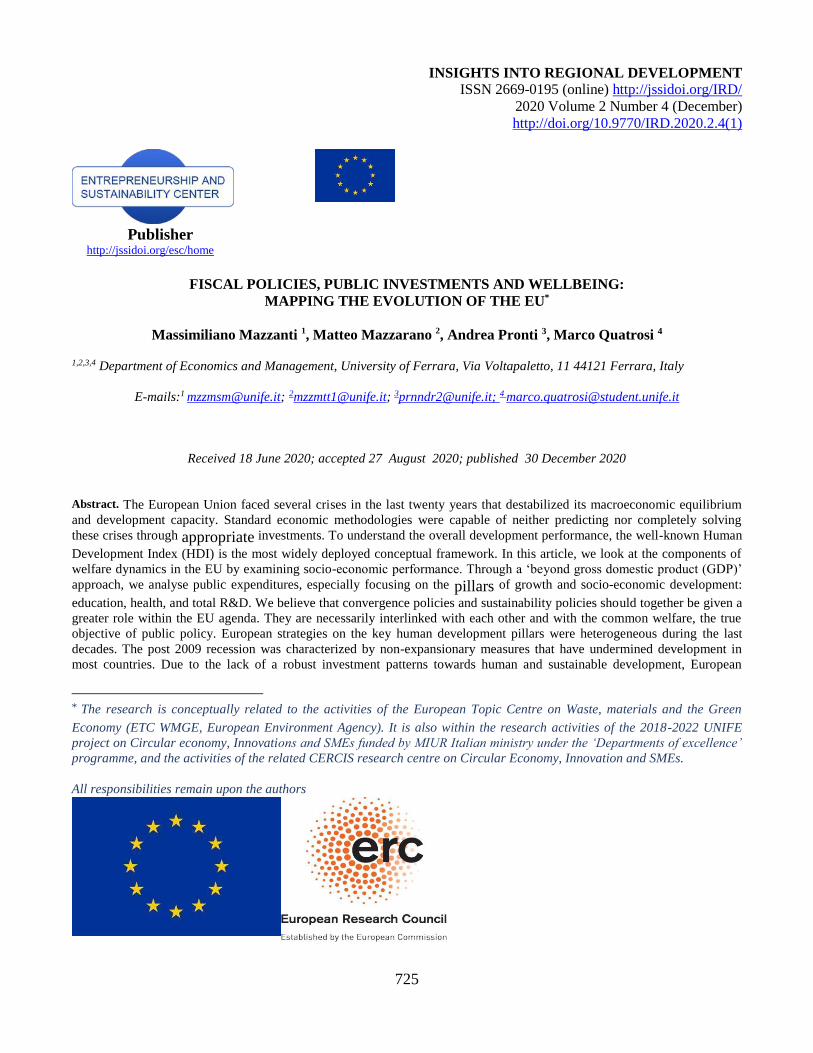
There is, in fact, a common ascending trend (Fig. 1) in expenditure after the crisis to cope with social issues and a
significant decrease starting in 2012-13, after which the EU relied on monetary policy only to address the
stagnation. Though they did not increase their budgets, the two pairs of Sweden-Denmark and France-Italy seem
to have resisted the common declining trend. Divergences have also generated serious trade imbalances§§ (e.g.,
excessive German and Dutch trade surpluses, well beyond the +5.9% EU target ceiling, a signal of uncorrected
imbalances in other aggregate demand factors). As mentioned above, both structural economic conditions and
different fiscal approaches explain the heterogeneity across countries within the common trends. A first dynamic
‡‡ In this regard, the trend in total expenditures in relation to GDP seems to reflect Krugman’s (2018) comment on the ‘premature turn to
austerity’: “In my view we suffered huge, unnecessary losses of output and employment because of the premature turn to austerity.
However, the world avoided descending into a full 1930’s style depression, which in effect left doctrinaire economists free to continue
believing what they wanted to believe”. In this regard, expansionary austerity (Alesina and Ardagna, 2012), that is, growth driven by
reduced public spending stimulating private investments, seems to have been effective as well, even if full employment is still a distant
target for the EU ten years after the crisis. In other words, the EU has not suffered a 1930s-style downturn, but the current recovery is
slower than that of the 1930s (Krugman, 2018). Inflation is still lagging at approximately 1% in spite of very expansionary monetary policy
(quantitative easing), which has involved negative interest rates for years. Krugman’s conceptual approach is a main line of narrative to
read through the data we present here. §§ It is worth noting that in a common trade area with both economic and political links, not all countries can run large trade surpluses given
fundamentals and economic specialization.
INSIGHTS INTO REGIONAL DEVELOPMENT
ISSN 2669-0195 (online) http://jssidoi.org/jesi/
2020 Volume 2 Number 4 (December)
http://doi.org/10.9770/IRD.2020.2.4(1)
732
trend is the reduced deficits when growth was present in the 1990s. This was also the period when countries were
approaching the creation of the euro area: financial markets reduced the spreads on the EU bonds (the difference
in interest rates with German bonds) to almost zero. It is worth noting that some differences in the expenditure
ratios were present, without any clear division that could be attributed to economic models, even during the pre-
crisis period of growth. Global economic growth stimulated tax revenues in some countries more than others
through GDP and tax structure differences, while public expenditures presented the usual structural differences. In
fact, the fiscal composition, fiscal spending level and level of public good investments characterise the varieties of
capitalism within capitalist economic systems. Fiscal revenues in the union range from above 46% (Sweden) to
33% (UK). Increases over time are witnessed for France and Italy, which have tried, to some extent, to maintain
medium-high deficit spending policies. Germany is in between this pair and a heterogeneous club of five other
countries (two representatives of the eastern EU, the UK, Spain and Portugal). The normal increase of deficits in
the crisis was due to a lack of tax revenues and (in indebted countries especially) a reduction in expenditures. This
can also be assessed by looking at the trend for expenditure on public services in general. As Table 1 shows, on
this indicator, countries present a rather homogeneous trend that seems not to be affected by the crisis shock in a
substantial way. Rather, the table shows a smooth decline in expenditures over time, especially in Germany and
Italy but also in Sweden and Denmark, whose welfare systems seem to be radically affected. Countries such as
the UK, Czech Republic and Spain, among others, present less clear figures, with erratic downs but also ups over
time. France, quite expectedly, presents the top figure, ascending to that position before the crisis years and then
remaining stable. All other countries, including Germany and Denmark, have reduced expenditures from 2008-09.
After the crisis, fiscal revenues on GDP generally increase across countries to cope with public deficits deriving
from stagnating GDP as part of the ‘austerity’ rationale. However, the post-crisis situation is still quite
heterogeneous and a signal of the EU’s fiscal weakness: it lacks homogeneous and coordinated fiscal policies,
with countries that still pursue strong (expansionary) fiscal austerity in face of higher unemployment levels than
the EU average.
Fig. 1 Total Expenditure as Share of GDP
Source: own elaboration on data from Eurostat

INSIGHTS INTO REGIONAL DEVELOPMENT
ISSN 2669-0195 (online) http://jssidoi.org/jesi/
2020 Volume 2 Number 4 (December)
http://doi.org/10.9770/IRD.2020.2.4(1)
733
5. Health, Education, and Innovation as drivers of wellbeing and growth
Fiscal policy, in its essence, encompasses economic, legal and institutional aspects of government budgeting with
the aim of achieving strategic goals and objectives for the overall welfare of the citizenry. Modern budget
strategies try to couple the necessity of responding to negative socio-demographic trends with ensuring fiscal
stability and sustainability (Chugunov et al., 2019). In the following three subsections, we present insight into key
indicators on substantive items related to wellbeing and growth (health, education and public R&D expenditures),
considering data from 1995 to 2018, with special attention paid to trends during the economic crisis.
5.1 Health
The effects of economic shocks such as recessions on the health outcomes and wellbeing of citizens are mixed.
The possible loss of employment is likely to generate a higher rate of mental health diseases (e.g., depression,
stress, anxiety) and eventually higher rates of suicide, drug addiction and criminal offenses (i.e., homicides)
(Buffel et al., 2015). On the other hand, some studies have identified that a higher rate of unemployment is
associated with lower rates of traffic injuries, alcohol-related deaths, and hospital admissions in the long term
(Gerdtham and Ruhm, 2006; Ruhm, 2006). In essence, health can be considered a form of human capital that does
not influence productivity itself but rather the amount of time spent in productive activities (Grossman, 1972).
When facing a fiscal crisis, policymakers always struggle over whether to maintain, increase or reduce health
expenditures (Cylus et al., 2012). Health disinvestment and reduced wellbeing can result in a negative impact on
the economy even in the long run (Quaglio et al., 2013).
In fact, in the aftermath of the most recent economic downturn, health systems appear to have been strongly
affected. Many EU countries adopted severe austerity policies with sharp cuts to public expenditure, including
both reductions in health budgets and important structural reforms such as hospital closures and mergers and
reductions in hospital bed numbers without proper investments in primary care, preventive medicine and health
information systems (Quaglio et al., 2013). Contractions in health spending have occurred in various forms within
the EU. Greece saw its health expenditure budget cut from 9.8% of GDP to 6% after the economic crisis. In that
period, even though hospitals faced a reduction in budgets of approximately 40%, there was an increase of 30% in
the utilization of public health services in the country (Ifanti et al., 2013). Other countries (i.e., the UK) froze or
cut the wages of healthcare workers while implementing only weak policies for worker replacement (Karanikolos
et al., 2013; Quaglio et al., 2013). The 2007 economic downturn was also the motive for structural reforms and
the reorganization of hospital infrastructures and primary care interventions. This was the case in Italy, with
massive hospital closures and mergers enacted immediately after the economic crisis. The result was a number of
beds per 1000 persons below the EU average in 2010 (4.1 in Italy compared to 5.5 in the EU) (Quaglio et al.,
2013). However, the economic crisis implied no changes in the scope of healthcare (i.e., the benefit packages
provided by states), although the breadth (e.g., coverage of the population) in some countries (e.g., France,
Greece, Italy, and Portugal) was decreased through increases in user charges for some health services. Increasing
charges in primary or ambulatory specialist care might worsen health outcomes and imply a probable increase in
the use of free, resource-intensive services (Karanikolos et al., 2013).
Considering a broader time frame of analysis, from 1995 to 2018, while some countries such as France, Denmark,
and the UK spent relatively more, critically low figures emerge for Poland, Greece, Portugal, and Spain. The latter
two disinvested in health, reducing one of the pillars of human development; indeed, health is one of the three key
indicators in the main HDI indexes of the UNDP (Mazzanti and Gilli, 2018). Spain and Portugal also present
critically low figures for education. This disinvestment trend might have stopped the weak convergence that
existed within the EU area (Mazzanti and Gilli, 2018) and is a signal of a potentially socio-economically
unsustainable path. Reductions in health expenditures might also affect overall healthcare provision (e.g., leave
medical needs unmet). Healthcare and prevention budgets have been under intense pressure (Quaglio et al., 2013),
putting public health further at risk, as weakening disease prevention can reduce the resilience of the EU health

INSIGHTS INTO REGIONAL DEVELOPMENT
ISSN 2669-0195 (online) http://jssidoi.org/jesi/
2020 Volume 2 Number 4 (December)
http://doi.org/10.9770/IRD.2020.2.4(1)
734
system as whole to exogenous shocks such as the recent COVID-19 outbreaks. However, the critical effects of a
progressive shrinking of health spending might be partly compensated with increasing expenditures on, for
instance, social protection and education on the promotion of good health (Karanikolos et al., 2013). For per
capita spending in this sector, Fig. 17 (see Appendix B) shows a stable pattern with marked differences among
countries. Between the highest trend of Denmark and the lowest of Poland, different healthcare management
models can be identified.
Fig. 2 Total Health Expenditure as Share of GDP
Source: own elaboration on data from Eurostat
5.2 Education
Education and health are objectives monitored by prestigious international organizations (e.g., UNESCO, the
WHO). Public expenditure in those two areas can also be considered investments in different aspects of human
capital (Grossman, 1972; van den Heuvel and Olaroiu, 2017). The right to education is virtually guaranteed by
many international conventions, agreements and documents (e.g., the Universal Declaration of Human Rights, the
Fourth Geneva Convention Relative to the Protection of Civilian Persons in Time of War). In addition, the nexus
connecting education, research and innovation could provide a consistent boost to economic growth, equity and
social inclusion. Many surveys identify a higher level of education as associated with higher satisfaction with
one’s job, place of work, and life (Mărginean, 2014). Investments in this area might be perceived as an attempt by
governments to improve the lives of citizens, generating economic, social, and political stability (Tendetnik et al.,
2018). Furthermore, there is a significant influence of higher education on employment, albeit with heterogeneous
effects among EU countries for historical reasons. In the immediate aftermath of the 2007 crisis, in countries such
as Spain and Italy, more educated workers faced less unemployment, whereas in Greece, there was no marked
difference (Snieska et al., 2015). The share of education expenditures in the EU is also heterogeneous, ranging
between 4 and 7% of GDP. In 2010, for instance, the highest level of education expenditure was in Denmark
(8.4% of GDP), and the lowest was in Greece and Slovakia, with less than half of the top share (4.1% of GDP)
(Fig. 3). This is, on the one hand, normal, but given that human capital is a key driver of growth and a pillar of
HDI, such spending is crucial for EU convergence and overall sustainability. The top investors are Scandinavian
countries (Denmark and Sweden), while the lagging ones are southern EU countries (Italy, Spain, and Germany).
It is worth noting the appalling decrease in education expenditures after the crisis in the UK and Portugal. Overall,
the trend did not change after 2008-2009: higher education investments were not a response to the recession, at

INSIGHTS INTO REGIONAL DEVELOPMENT
ISSN 2669-0195 (online) http://jssidoi.org/jesi/
2020 Volume 2 Number 4 (December)
http://doi.org/10.9770/IRD.2020.2.4(1)
735
least on average. Sweden, Denmark and France present the most positive trends and absolute figures. Again,
different economic and institutional systems seem to produce variegated responses to sustainability challenges.
On the other hand, the economic crisis also drew a surprising response from higher education institutions across
Europe. In Spain and Italy, for instance, the years immediately after 2007 witnessed an increase in the efficiency
of higher education institutions (e.g., an increase in the number of graduates and high-quality scientific
publications) despite budgetary restrictions (Martínez-Campillo and Fernández Santos, 2019). Per capita trends in
education expenditures (Fig. 15 in Appendix B) appear to confirm that Spain and Italy pertain to the cluster with
lower spending together with Portugal and the Czech Republic. A second cluster can be identified among the
Central European countries (e.g., France, Germany, and the UK), whereas Denmark and Sweden spend the
highest amount of funds per inhabitant.
Fig. 3 Total Education Expenditure as Share of GDP
Source: own elaboration on data from Eurostat
5.3 R&D
R&D is the key driver of invention, innovation and GDP growth in the long run. Public expenditure typically
sustains private R&D, treating it as a public good because the positive external effects on society cannot be totally
internalized by private investments, leading to under-supply of R&D and causing market failures and lower
benefits for society as a whole (Hud and Hussinger, 2015). However, the effect of public investments in R&D and
the private innovation response of firms is still not clear in the literature (Alonso-Borrego et al., 2014; David et
al., 2000). Typically, public investments in R&D are beneficial for avoiding social welfare losses due to public
good problems. However, a so-called crowding-out effect may arise from the incentive of firms to reduce their
private investments in R&D by replacing them with public funds, which in the long term can result in distorting
effects on potential growth levels (Hud and Hussinger, 2015).
Private investments in R&D can react to economic crises in two ways: countercyclically, with boosts to R&D as a
measure to cope with production losses, or procyclically, with reductions to R&D expenditures because of
uncertainty and the declining profitability of new investments (Hud and Hussinger, 2015). Public expenditure on
R&D can follow this same pattern, with government budgets dedicated to innovation either increasing or
shrinking depending on government expectations of return on innovation investments. In fact, sustainable
governmental R&D spending in periods of crisis can help countries recover from financial downturns, leading to

INSIGHTS INTO REGIONAL DEVELOPMENT
ISSN 2669-0195 (online) http://jssidoi.org/jesi/
2020 Volume 2 Number 4 (December)
http://doi.org/10.9770/IRD.2020.2.4(1)
736
economic growth through innovation (Hud and Hussinger, 2015). Empirical results show heterogeneous figures
for public intervention in R&D investment during the last economic crisis (Filippetti and Archibugi, 2011;
Makkonen, 2013).
The global economic downturn and credit crisis that affected European countries after 2008 reduced investments
in R&D because of the credit crunch caused by general bank disinvestment in risky activities (Archibugi, 2017).
R&D was also reduced because of both the general demand contraction and companies’ unresponsiveness to
public R&D incentives due to the high level of uncertainty after the crisis (Hud and Hussinger, 2015). However,
this did not occur in all countries and in all sectors; in fact, in northern areas such as Finland, Switzerland,
Germany and Sweden, a relevant number of companies conserved their level of investment in R&D and, in some
cases, increased it because of sectoral specializations in which R&D is a key element of competitiveness (Brem et
al., 2020). These firms investing more in R&D are characterized as young, flexible and small and looking for new
market opportunities (Archibugi et al., 2013). Compared to older and larger companies, they invested more in
R&D despite the economic crisis (Archibugi, 2017).
Beyond the economic downturn, heterogeneous structural patterns in R&D investment among EU countries are
evident from our analysis (Fig. 4). During the last three decades, national investments in R&D present striking
and consolidated differences. Against the Lisbon agenda target of 3% of GDP for R&D investment, only Sweden
has historically invested more than the threshold. Denmark and Germany follow with somewhat increasing
patterns. This northern EU attitude towards R&D investments, which is explained by both public policy actions
and an economic structure with a high density of medium-large firms, is not replicated in other EU countries. Key
countries such France, the UK and Italy lag substantially behind. Italy’s R&D investment has flatlined, serving as
a clear indicator of Italian stagnation in productivity and GDP over the last 15 years. Other southern EU countries
also lag behind. This gap might also explain the EU divide regarding environmental productivity (e.g., CO2/GDP
patterns, Mazzanti and Musolesi, 2014). Eastern EU countries also lag, with R&D spending at approximately 1-
1.5% of GDP, although the Czech Republic shows some positive reaction after the crisis. For education
investments, it does not seem that the EU overall adopted a strong innovation-oriented strategy to deal with the
crisis and post-crisis objectives, namely, stabilizing full employment, achieving the 2020 environmental and
energy targets and building the pillars for long-run growth. That said, R&D spending, the main driver of long-run
economic productivity, has increased overall. It is worth noting that the four large EU economies, Italy, France,
Germany, and the UK, display positive but moderate increases over the last 15 years. Sweden moderately
increased R&D spending but started from a level of higher than 3% of GDP. Eastern EU countries (Poland, Czech
Republic) and Spain and Portugal show greater increases than the abovementioned countries, but the initial levels
were very low. Overall, it seems that the increases are (i) heterogeneous, though coherent with the initial levels,
and (ii) insufficient on average and especially for the leading economies.

INSIGHTS INTO REGIONAL DEVELOPMENT
ISSN 2669-0195 (online) http://jssidoi.org/jesi/
2020 Volume 2 Number 4 (December)
http://doi.org/10.9770/IRD.2020.2.4(1)
737
Fig. 4 Intramural Government R&D Expenditure (GERD) for All Sectors as Share of GDP Source: own elaboration on data from Eurostat
6. Country-by-country analysis (a look at the 2000–2016 transition)
Historical trends can also be analysed by looking at indexes that provide a different angle, namely, the variation,
independent of GDP, of the various items. The evidence below complements the previous analyses in providing a
rich picture of EU variation and criticalities. Table 1 summarizes the main trends by country and indicator
(graphs are available in the Appendix A) since 2000, a period that includes the economic downturn in the middle.
Regarding debt and growth patterns, strictly integrated analyses should always consider the dynamics of growth
drivers: namely, fiscal measures (deficits) in the short run and innovation and education, that is, knowledge, in the
long run.
Table 1. Indexes of selected macroeconomic and fiscal indicators. 2016 index level per capita (2000=100)
Public
Debt GDP Education Health
Total
R&D Env.
Taxes Income
Taxes Defenc
e Public
order Social
Protection HDI
Czech
Republic 561 264 263 280 398 246 260 106 230 270 111
Denmark 113 156 159 187 204 128 160 114 162 63 107
Germany 172 149 157 168 182 118 151 149 149 137 111
Spain 295 173 147 174 232 149 172 137 169 167 107
France 250 151 132 161 162 155 161 130 157 162 105
Italy 170 136 113 152 173 156 145 139 122 161 105
Poland 323 228 202 272 344 290 230 263 282 225 109
Portugal 372 145 107 137 253 144 158 81 162 160 107
Sweden 141 164 150 173 154 138 145 81 160 106 104
UK 313 134 124 180 139 121 125 105 109 152 105 Source: own elaboration on data from Eurostat

INSIGHTS INTO REGIONAL DEVELOPMENT
ISSN 2669-0195 (online) http://jssidoi.org/jesi/
2020 Volume 2 Number 4 (December)
http://doi.org/10.9770/IRD.2020.2.4(1)
738
The trends show high debt growth in the eastern EU (highest in the Czech Republic), the UK and the southern
EU. For the eastern EU, debt growth is partially offset by high GDP growth, which is nevertheless insufficient to
compensate for the debt increases. Poland and Czech Republic double their spending in almost all the public
sectors analysed, but they also display growth in public debt by threefold and fivefold, with respect to 2000 (see
Table 1). On the other hand, these two member states do manage to keep the debt-to-GDP ratio lower than the
threshold established by the Growth and Stability Pact (GSP). France and Italy present lower debt growth but also
low economic growth. Only Denmark and Sweden present GDP growing at a faster pace than nominal debt.
Expenditures in social protection as a share of GDP show that countries with consolidated state intervention, such
as France and Sweden, occupy the two top positions. In the low-ranked positions, we find two eastern EU
countries, namely, Poland and the Czech Republic; the UK, with its Anglo-Saxon variety of capitalism; and
Portugal and Spain, two southern EU economies that have suffered from the sovereign debt crisis. Overall, the
share and the dynamics are heterogeneous. Three main comments emerge: (i) Country differences seem to have
more of a structural nature. (ii) The response to the crisis is a strong reduction in spending in some countries. (iii)
A decrease in most countries appears starting in 2013 due to austerity rationales. In the last 16 years, spending on
social protection has increased for the whole EU, with the highest rates for Poland, the Czech Republic, Portugal,
and Spain. As already mentioned, in some cases, social protection spending might prevent the deterioration of the
social and economic condition of some categories of the population more exposed to certain diseases (e.g., elderly
people, homeless people, children) by, for instance, alleviating financial hardship, undernutrition and hazardous
alcohol drinking (Reeves et al., 2014).
Environmental taxes increase over the period. It appears joining the European Union was a substantial motive for
eastern European countries, that were lagging at the beginning of the period, to increase green taxes. Among the
four large economies, only Italy and France show taxes increases greater than their GDP increases. The Nordic
countries that introduced environmental taxes in the 1990s show slower taxation dynamics. Revenue flows
present a mixed, slightly downward trend. Countries with high taxation and structured welfare systems (e.g.,
France, Germany, Sweden) rank in the lowest positions. Italy, Poland, Denmark are a mixed club that display
high revenue shares that are nevertheless decreasing for Denmark but increasing for Italy; these countries are
among those that have used environmental and energy taxation as a channel to cope with the post-crisis fiscal
vulnerabilities (in relation to deficit debt more than public good financing). Environmental taxation is still below
its potential levels. It has increased in some cases but mainly for mere fiscal reasons. Even though the share of
such taxation remains low compared to overall tax revenues, the proportion, externality links and earmarking of
such taxes could be extended to achieve double dividends in economic and environmental terms.
Eastern EU countries also show the highest increases regarding income taxes: fiscal consolidation, GDP growth
and entrance into the EU are the main drivers. All other EU countries, except for the UK, show homogeneous
increases in income taxes, albeit at a slower pace. The weak increase in the UK is possibly one reason for the high
deficit and debt increases in comparative terms. Social contributions follow similar patterns. While countries
(eastern EU) that have set up new welfare systems show strong increases in this indicator, countries that already
had a structured welfare system in 2000 show only slight increases or even, interestingly, a reduction in the
amount of social contributions (Denmark).
It is also interesting to mention that, even though some member states have almost doubled their spending in the
last 16 years, this increase has not been matched by an increase in the HDI. The index is composed of several
dimensions, encompassing the economic and social spheres, health and education. In this sense, the composition
of the indicator might cover the relative performance of states in each dimension. Of further note is the
heterogeneous scoring not only between states but also between regions within the EU. Especially for eastern
European countries, capital city regions tend to outperform the others overall (Hardeman and Dijkstra, 2014).
Regardless, some EU countries have been able to increase HDI at a higher rate than others, providing even in this
case a scattered distribution of countries that can be divided into different clusters: those that have improved

INSIGHTS INTO REGIONAL DEVELOPMENT
ISSN 2669-0195 (online) http://jssidoi.org/jesi/
2020 Volume 2 Number 4 (December)
http://doi.org/10.9770/IRD.2020.2.4(1)
739
general wellbeing conditions (namely, Denmark, Germany, Czechia, Poland, Portugal and Spain) by between 7%
and 11% and those that have increased HDI relatively less, by approximately 5% (namely, the UK, Sweden,
France and Italy).
7. Conclusions
Structural heterogeneity in the examined dynamics and across countries was high over the last decades, as was the
heterogeneity in the (fiscal and investment) responses to the 2009 economic downturn. While, on the one hand,
some heterogeneity is ‘normal’, an excess might lead to socio-economic imbalances and unsustainable patterns
(Gilli and Mazzanti, 2018). For instance, heterogeneity in R&D and education are insufficient to cope with post-
crisis stagnation and long-run growth and sustainability necessities. In addition to the historical lack of R&D
funding with respect to the Lisbon agenda targets, critical trends appear for education investments, especially after
the economic downturn. Funding for education is staggeringly low, especially in some eastern EU countries
(Poland and the Czech Republic), the UK*** and Portugal and Spain. Various economic systems show investment
deficits in the engines of growth, undermining future convergence of the EU and total wellbeing.
The EU activated relatively small recovery packages just after the 2009 crisis and started reducing growth
stimulus after 2013, leaving monetary policy alone to address growth issues. This mismanagement of
macroeconomic policy has largely driven EU performance. Investments in R&D and education are extremely
heterogeneous across countries, a signal of low social resilience and fragility. The investments are insufficient to
cope with crisis shocks and long-run growth and sustainability necessities. Education and health disinvestments
present figures that may undermine cohesion: overall, the trend is not increasing after the crisis. Some countries
stabilized their expenditure, while others witnessed drastic reductions (Poland, Spain, Portugal). Education and
health trends currently pose serious questions on the overall human development of the EU and its convergence
(north-south; east-west). Italy, Poland, Spain, Portugal, and Greece present a substantial reduction of health and
education expenditures as a share of GDP over 2010-2018, in face of the well-known stagnation in overall R&D
spending.
Our analysis on per capita trends highlighted structural differences within the EU countries in providing public
goods to their citizens. Indeed, a consistent group of these representative countries has not reached 2000 € per
inhabitant in health spending, 1000 € in education spending, or 400 € in R&D spending.
Some EU economies (France, Sweden, Denmark, Germany, the UK, and Italy in some cases) show robust and not
decreasing investments. Given the economic performance of the EU ten years after the 2009 crisis, those efforts
are probably insufficient to achieve the overall sustainability of the EU. Due to an unsuccessful ‘expansionary
austerity’ rationale, EU economic indicators ten years after the crisis are gloomy: GDP is growing at 1.7%
(Germany at 1.9% and France at 1.5%), and unemployment is at 8.1% (the respective figures for the USA are 3%
and 3.7%, with similar inflation rates†††). Furthermore, the structural heterogeneity in the dynamics and across
countries was high over the last decades, as was the heterogeneity in (fiscal and investment) responses to the
economic downturn and post-crisis objectives (full employment, GDP growth, environmental targets such as ‘20-
20-20’ and long-run low-carbon transitions). The robustness of wellbeing (HDI) to socio-economic shocks and
environmental policies should be investigated. Further studies could shed more light on the
convergence/divergence of the different indicators and ultimate wellbeing and sustainability goals.
The objective when the peak of the pandemic has passed will be to structure 'exit' strategies that consider both
health and socio-economic aspects. To transition to the post-crisis period, policies and investments should be
*** This figure might be one factor behind Piketty’s evidence on the ‘divide’ between Anglo-Saxon models and the models of countries like
Sweden, Germany, and Japan with respect to income inequality trends. ††† Source: The Economist, November 10th.

INSIGHTS INTO REGIONAL DEVELOPMENT
ISSN 2669-0195 (online) http://jssidoi.org/jesi/
2020 Volume 2 Number 4 (December)
http://doi.org/10.9770/IRD.2020.2.4(1)
740
guided by cultural and theoretical approaches to sustainability and wellbeing. These investments would make our
human societies and economic systems even more resilient and prepared to face future shocks, whether economic
or health-related or otherwise. Without a mitigation of the inequalities between territories and citizens, there can
be neither stable economic growth nor a 'consensus' for the radical ecological transition. The ecological transition
and sustainability depend greatly on the technè: new technologies and forms of social organization. It will not be
achieved without a broad social consensus, which passes through a better distribution of income and
opportunities, and these depend primarily on investments in health and public schooling. As Alexander Langer
argued, the present situation attests no ecological transition is possible if it is not socially understood, accepted
and shared. The present moment is useful for questioning ourselves again on this point.
The question that arises is as follows: within the fiscal policy response aimed at minimizing socio-economic costs,
will a Green New Deal take on a more central role, or will it become a residual part? The importance of a broad
fiscal response is important for the effects on 2020-21 GDP: whether we put a Green New Deal at the centre of
the response is a political decision that can have medium- to long-term impacts. One choice is to extend the Green
New Deal and the just transition by formulating a broad Wellbeing New Deal, with a focus on the environment,
schooling, healthcare, or human development. The policy suggestion is not a panacea, but it derives from
knowledge of macroeconomics and sustainability and observations of macroeconomic trends in recent decades.
Drivers of growth and development (R&D, education, and health expenditures) should be increased in real terms
and as a percentage of GDP. Beyond the Lisbon agenda targets, the EU could set a ‘South Korea’-style target of
4% of GDP for R&D investment. This amounts to an additional 300 € billion per year. Education and health
expenditure trends should be reversed and increased in most countries, especially in southern Europe ‡‡‡ .
Economic growth should be achieved through more decent and necessary income distribution and capability
creation to reduce economic and social fragility, which opens the way to new recessions and a lack of resilience
during crises. General fiscal and monetary policies should lead the way by being very expansionary over 2020-21
and more expansionary than in the past, even in a – we hope – post-crisis recovery framework, at least until
unemployment figures are as low as 3-4% and wellbeing indicators are enhanced. Inflation should be monitored,
but it does not seem to be a real threat. In fact, deflation is also a possibility, if policies are not expansionary
enough.
One concrete point, emerged from this study, is that European strategies on the key human development pillars
were heterogeneous during the last decades. The post-2009 recession was characterized by non-expansionary
measures that have undermined development in most countries. Due to the lack of a robust investment patterns
towards human and sustainable development, European countries were not fully prepared to tackle the COVID-19
shock. An unsustainable response to a crisis generated socio-economic and system fragility. The socio-economic
and health costs could have been lower if larger investments, especially in health, innovation and education, had
been carried out in between 2010-2019, a sort of ‘lost decade’. Europe is now attempting to react with proper
fiscal measures and investments in face of the COVID-19 effects. It is worth noting that the pre-virus
macroeconomic and development figures should have pointed to the need of a robust pattern of investments.
Growth and development figures were already gloomy in 2019 and the years before. The hope is that this lesson is
useful to create a solid society and economic system for possible future crises. Let’s transform the hope in reality.
‡‡‡ We note that environmental taxation revenue is still below its potential levels. It has increased in some cases but mainly for mere fiscal
reasons. Even though the share of such taxation remains logically low compared to overall tax revenues, the proportion, externality-links
and earmarking of such taxes could be extended to achieve double dividends in both the economic and environmental spheres. In addition
to environmental taxes, substantial revenues are and will be generated by the auction of emission trading allowances. The total revenues
generated by member states from the auctions between 2012 and 30 June 2018 exceeded € 26 billion (in 2017 alone, the generated total
revenues were € 5.6 billion), with Italy accounting for around €2 billion (European Commission, 2018).

INSIGHTS INTO REGIONAL DEVELOPMENT
ISSN 2669-0195 (online) http://jssidoi.org/jesi/
2020 Volume 2 Number 4 (December)
http://doi.org/10.9770/IRD.2020.2.4(1)
741
References
Alesina, A., Ardagna, S., 2012. The design of fiscal adjustments (No. w18423). National Bureau of Economic Research, Cambridge, MA.
https://doi.org/10.3386/w18423
Alonso-Borrego, C., Galan, J., Forcadell, F., Zúñiga-Vicente, J., 2014. Assessing the effect of public subsidies on firm R&D investment: A
survey. J. Econ. Surv. 28, 36–67. https://doi.org/10.1111/j.1467-6419.2012.00738.x
Archibugi, D., 2017. Blade Runner economics: Will innovation lead the economic recovery? Res. Policy 46, 535–543.
https://doi.org/10.1016/j.respol.2016.01.021
Archibugi, D., Filippetti, A., Frenz, M., 2013. The impact of the economic crisis on innovation: Evidence from Europe. Technol. Forecast.
Soc. Change 80, 1247–1260. https://doi.org/10.1016/j.techfore.2013.05.005
Atkinson, G., Mourato, S., 2015. Cost-Benefit Analysis and the Environment (OECD Environment Working Papers No. 97), OECD
Environment Working Papers. https://doi.org/10.1787/5jrp6w76tstg-en
Biggeri, M., Mauro, V., 2018. Towards a more ‘Sustainable’ Human Development Index: Integrating the environment and freedom. Ecol.
Indic. 91, 220–231. https://doi.org/10/gd86tr
Brem, A., Nylund, P., Viardot, E., 2020. The impact of the 2008 financial crisis on innovation: A dominant design perspective. J. Bus. Res.
110, 360–369. https://doi.org/10.1016/j.jbusres.2020.01.048
Buffel, V., Van de Velde, S., Bracke, P., 2015. The mental health consequences of the economic crisis in Europe among the employed, the
unemployed, and the non-employed. Soc. Sci. Res. 54, 263–288. https://doi.org/10.1016/j.ssresearch.2015.08.003
Charron, N., Lapuente, V., Dykstra, L., 2012. Regional Governance Matters: A Study on Regional Variation in Quality of Government
within the EU. Eur. Comm. - Reg. Stud. 23.
Chugunov, I., Makohon, V., Кrykun, T., 2019. Budget strategy in the conditions of economic globalization. Probl. Perspect. Manag. 17,
101–110. https://doi.org/10/ggqnz8
Cylus, J., Mladovsky, P., McKee, M., 2012. Is There a Statistical Relationship between Economic Crises and Changes in Government
Health Expenditure Growth? An Analysis of Twenty-Four European Countries. Health Serv. Res. 47, 2204–2224. https://doi.org/10/ggqnz5
David, P.A., Hall, B.H., Toole, A.A., 2000. Is public R & D a complement or substitute for private R & D? A review of the econometric
evidence 33.
Davies, A., 2009. Human development and the optimal size of government. J. Socio-Econ. 38, 326–330.
https://doi.org/10.1016/j.socec.2008.07.015
Filippetti, A., Archibugi, D., 2011. Innovation in times of crisis: National Systems of Innovation, structure, and demand. Res. Policy 40,
179–192. https://doi.org/10.1016/j.respol.2010.09.001
Fiorito, R., Kollintzas, T., 2004. Public goods, merit goods, and the relation between private and government consumption, European
Economic Review. https://doi.org/10.1016/j.euroecorev.2004.01.004
Fleurbaey, M., Blanchet, D., 2013. Beyond GDP: Measuring welfare and assessing sustainability. Oxford University Press.
Gerdtham, U.-G., Ruhm, C.J., 2006. Deaths rise in good economic times: Evidence from the OECD. Econ. Hum. Biol. 4, 298–316.
https://doi.org/10/bnd8mn
Grossman, M., 1972. On the Concept of Health Capital and the Demand for Health. J. Polit. Econ. 80, 223–255.
Haavard Maridal, J., Palich, L., Morgan, G., Gardner, S., McKinney, J., Bolbocean, C., 2018. Wellbeing Indices: A Comprehensive
Inventory of Standards and a Review of Current Comparative Measures. Ecol. Econ. 149, 1–11. https://doi.org/10/gfztvf Hamilton, K., Hartwick, J.M., 2005. Investing exhaustible resource rents and the path of consumption. Can. J. Econ. Can. Déconomique
38, 615–621. https://doi.org/10.1111/j.0008-4085.2005.00295.x
Hardeman, S., Dijkstra, L., 2014. The EU Regional Human Development Index.
Heitger, B., 2002. The Scope of Government and its Impact on Economic Growth in OECD Countries. Econ. Internazionale Int. Econ. 55,
323–350.
Helliwell, J.F., Huang, H., Grover, S., Wang, S., 2018. Empirical linkages between good governance and national well-being. J. Comp.
Econ. 46, 1332–1346. https://doi.org/10/ggqpc8
Heyes, A., 2000. A proposal for the greening of textbook macro:’IS-LM-EE’. Department of Economics, Royal Holloway University of
London.
Hickel, J., 2020. The sustainable development index: Measuring the ecological efficiency of human development in the anthropocene. Ecol.
Econ. 167, 106331. https://doi.org/10/ggdtt3
Hud, M., Hussinger, K., 2015. The impact of R&D subsidies during the crisis. Res. Policy 44, 1844–1855.
https://doi.org/10.1016/j.respol.2015.06.003

INSIGHTS INTO REGIONAL DEVELOPMENT
ISSN 2669-0195 (online) http://jssidoi.org/jesi/
2020 Volume 2 Number 4 (December)
http://doi.org/10.9770/IRD.2020.2.4(1)
742
Ifanti, A.A., Argyriou, A.A., Kalofonou, F.H., Kalofonos, H.P., 2013. Financial crisis and austerity measures in Greece: Their impact on
health promotion policies and public health care. Health Policy 113, 8–12. https://doi.org/10/f2xsx7
International Monetary Fund, 2017. IMF Fiscal Monitor: Tackling Inequality, World economic and financial surveys.
Kallis, G., 2011. In defence of degrowth. Ecol. Econ. 70, 873–880. https://doi.org/10.1016/j.ecolecon.2010.12.007
Kamarianakis, Y., Xepapadeas, A., 2006. An irreversible investment model with a stochastic production capacity and fixed plus
proportional adjustment costs.
Karanikolos, M., Mladovsky, P., Cylus, J., Thomson, S., Basu, S., Stuckler, D., Mackenbach, J.P., McKee, M., 2013. Financial crisis,
austerity, and health in Europe. The Lancet 381, 1323–1331. https://doi.org/10/k4c
Krugman, P., 2018. Good enough for government work? Macroeconomics since the crisis. Oxf. Rev. Econ. Policy 34, 156–168.
https://doi.org/10.1093/oxrep/grx052
Lefebvre, M., Coelli, T., Pestieauz, P., 2010. On the convergence of social protection performance in the European Union. CESifo Econ.
Stud. 56, 300–322. https://doi.org/10.1093/cesifo/ifp030
Leunig, T., 2011. Measuring economic performance and social progress. Eur. Rev. Econ. Hist. 15, 357–363.
https://doi.org/10.1017/S1361491611000086
MacKerron, G., 2012. Happiness Economics from 35 000 Feet. J. Econ. Surv. 26, 705–735. https://doi.org/10.1111/j.1467-
6419.2010.00672.x
Makkonen, T., 2013. Government science and technology budgets in times of crisis. Res. Policy 42, 817–822.
https://doi.org/10.1016/j.respol.2012.10.002
Mărginean, I., 2014. Public Expenditure with Education and Healthcare in EU Countries. Procedia Econ. Finance, 1st International
Conference “Economic Scientific Research - Theoretical, Empirical and Practical Approaches”, ESPERA 2013 8, 429–435.
https://doi.org/10/ggqnz4
Mazzanti, M., Gilli, M., 2018. Contextualising sustainability, in: Cultures of Sustainability and Wellbeing. ROUTLEDGE in association
with GSE Research, pp. 111–134.
Mericková, B.M., Halásková, R., 2014. Income Redistribution and Socio-economic Development. Rev. Econ. Perspect. 14.
Monfreda, C., Wackernagel, M., Deumling, D., 2004. Establishing National Natural Capital Accounts Based on Detailed Ecological
Footprint and Biological Capacity Assessments. Land Use Policy 21, 231–246. https://doi.org/10.1016/j.landusepol.2003.10.009
Musolesi, A., Mazzanti, M., 2014. Nonlinearity, heterogeneity and unobserved effects in the carbon dioxide emissions-economic
development relation for advanced countries. Stud. Nonlinear Dyn. Econom. 18.
Neumayer, E., 2014. Weak versus Strong Sustainability: Exploring the Limits of Two Opposing Paradigms, Fourth Revised Edition. ed.
Edward Elgar Publishing, Cheltenham and Northampton.
Paliova, I., McNown, R., Nülle, G., 2019. Multiple Dimensions of Human Development Index and Public Social Spending for Sustainable
Development. IMF Work. Pap. 19. https://doi.org/10.5089/9781513511924.001
Prakash, R., Garg, P., 2019. Comparative assessment of HDI with Composite Development Index (CDI). Insights Reg. Dev. 1, 58–76.
https://doi.org/10.9770/ird.2019.1.1(5)
Pulsipher, A.G., 1972. The Properties and Relevancy of Merit Goods 22.
Quaglio, G., Karapiperis, T., Van Woensel, L., Arnold, E., McDaid, D., 2013. Austerity and health in Europe. Health Policy 113, 13–19.
https://doi.org/10/f2xsxj
Reeves, A., Basu, S., McKee, M., Stuckler, D., Sandgren, A., Semenza, J., 2014. Social protection and tuberculosis control in 21 European
countries, 1995–2012: a cross-national statistical modelling analysis. Lancet Infect. Dis. 14, 1105–1112. https://doi.org/10.1016/S1473-
3099(14)70927-2
Ruhm, C., 2006. A Healthy Economy Can Break Your Heart. Natl. Bur. Econ. Res. 44, 829–848. https://doi.org/10.3386/w12102
Snieska, V., Valodkiene, G., Daunoriene, A., Draksaite, A., 2015. Education and Unemployment in European Union Economic Cycles.
Procedia - Soc. Behav. Sci. 213, 211–216. https://doi.org/10.1016/j.sbspro.2015.11.428
Spinozzi, P., Mazzanti, M., 2018. Routing Sustainable Development towards a culture of wellbeing, in: Culture of Sustainability: Theories,
Policies, Histories. Routledge, London.
Stiglitz, J.E., Fitoussi, J.-P., Durand, M., 2018. Beyond GDP. https://doi.org/10.1787/9789264307292-en
Tendetnik, P., Clayton, G., Cathcart, K., 2018. Education and nation-state fragility: Evidence from panel data analysis. Int. J. Educ. Dev.
62, 17–26. https://doi.org/10/ggqnz7
UNDP, 2019. Human Development Report 2019- Beyond income, beyond averages, beyond today: Inequalities in human development in
the 21st century.
UNIDO, 2018. Industrial Development Report 2018. Demand for Manufacturing: Driving Inclusive and Sustainable Industrial
Development (No. ID/448). United Nations Industrial Development Organization, Vienna.
UNIDO, 2016. Industrial Development Report 2016. The Role of Technology and Innovation in Inclusive and Sustainable Industrial
Development. United Nations Industrial Development Organization, Vienna.
van den Bergh, J., 2011. Environment versus growth – A criticism of “degrowth” and a plea for “a-growth.” Ecol. Econ. 70, 881–890.
van den Heuvel, W.J.A., Olaroiu, M., 2017. How Important Are Health Care Expenditures for Life Expectancy? A Comparative, European
Analysis. J. Am. Med. Dir. Assoc. 18, 276.e9-276.e12. https://doi.org/10.1016/j.jamda.2016.11.027

INSIGHTS INTO REGIONAL DEVELOPMENT
ISSN 2669-0195 (online) http://jssidoi.org/jesi/
2020 Volume 2 Number 4 (December)
http://doi.org/10.9770/IRD.2020.2.4(1)
743
Appendix
A. Synthesis of other Macroeconomic variables.
Fig. 8 Social Protection expenditure as Share of GDP
Source: own elaboration on data from Eurostat
Other voices of expenditures account for defence, public order, social protection and finally general services. Last
one refers to all expenditures counted outside the cited: for instance, bureaucracy maintenance and inflation
adaptation of wages, gross capital formation etc. Starting from social protection (Fig. 8), we could divide the
reported countries in three main clusters: who increased, reduced or kept constant such expenditure. This division
is similar for all other expenditures. In this case, the shock of 2009 is evident, but the trend is not reversed. For
instance, share of GDP devoted to social protection in Sweden, Denmark, Poland and Germany reduced over
time. This information must be matched with their economic performances, generally above average in EU28 for
the considered period. Southern countries expanded this sector as a measure of balance to the economic crisis.
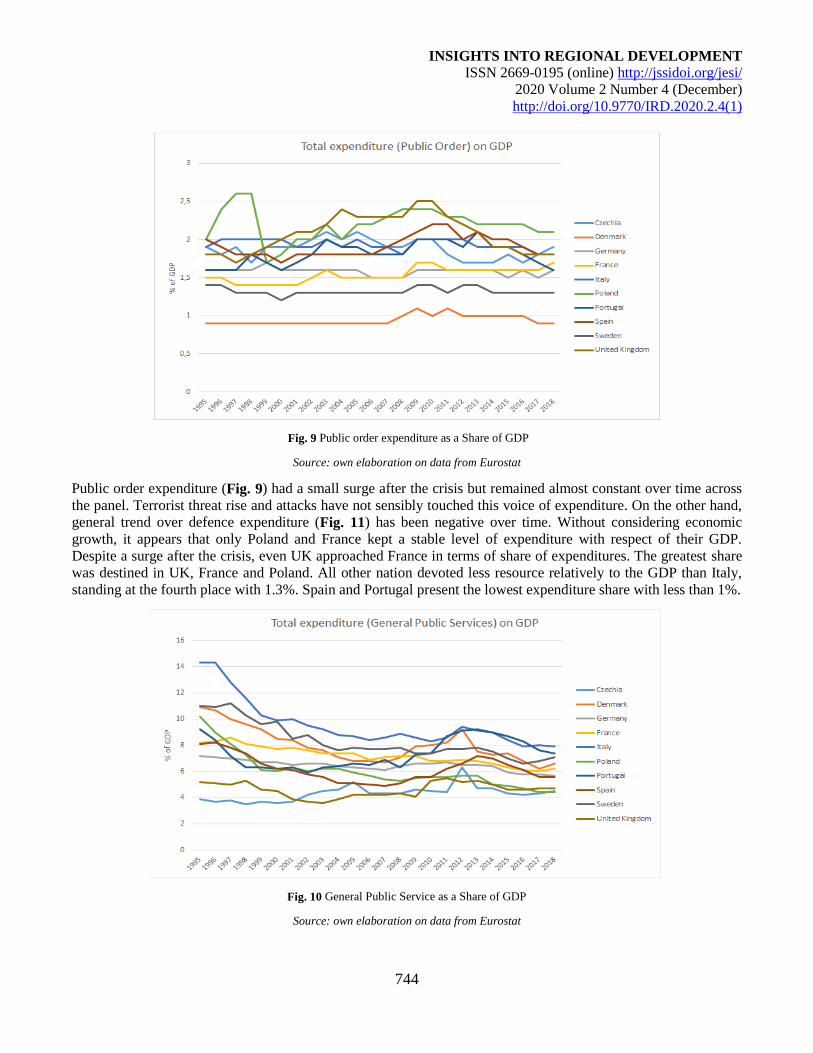
INSIGHTS INTO REGIONAL DEVELOPMENT
ISSN 2669-0195 (online) http://jssidoi.org/jesi/
2020 Volume 2 Number 4 (December)
http://doi.org/10.9770/IRD.2020.2.4(1)
744
Fig. 9 Public order expenditure as a Share of GDP
Source: own elaboration on data from Eurostat
Public order expenditure (Fig. 9) had a small surge after the crisis but remained almost constant over time across
the panel. Terrorist threat rise and attacks have not sensibly touched this voice of expenditure. On the other hand,
general trend over defence expenditure (Fig. 11) has been negative over time. Without considering economic
growth, it appears that only Poland and France kept a stable level of expenditure with respect of their GDP.
Despite a surge after the crisis, even UK approached France in terms of share of expenditures. The greatest share
was destined in UK, France and Poland. All other nation devoted less resource relatively to the GDP than Italy,
standing at the fourth place with 1.3%. Spain and Portugal present the lowest expenditure share with less than 1%.
Fig. 10 General Public Service as a Share of GDP
Source: own elaboration on data from Eurostat

INSIGHTS INTO REGIONAL DEVELOPMENT
ISSN 2669-0195 (online) http://jssidoi.org/jesi/
2020 Volume 2 Number 4 (December)
http://doi.org/10.9770/IRD.2020.2.4(1)
745
General Public Services (Fig. 10) display a clear convergence between the greatest payers (Italy) and smallest
(Czechia). Such feature is probably related to the adoption of the new currency and the general expenditure
revision. Despite the shock around 2008-2009, this expenditure voice did not change sensibly. It appears that
convergence pace continued, nevertheless. The greatest response to the crisis with such expenditure where Italy
and Denmark, proportionally to the dimension of expenditure then. Altogether to Czechia, Denmark surge in
General public expenditures registered lasted only in 2012.
Fig. 11 Defence expenditure as a Share of GDP
Source: own elaboration on data from Eurostat
Fig. 12 Public Debt/GDP ratio
Source: own elaboration on data from Eurostat

INSIGHTS INTO REGIONAL DEVELOPMENT
ISSN 2669-0195 (online) http://jssidoi.org/jesi/
2020 Volume 2 Number 4 (December)
http://doi.org/10.9770/IRD.2020.2.4(1)
746
Public debt flow and stock indicators express a clear divergence within this panel. In terms of debt, a general
stability before the crisis change afterwards. The scenario could be is break down into high (Italy and Portugal),
medium (Spain, France and UK) and low debt countries (Germany, Poland, Denmark etc.). This divergence is
caused by both growth and deficit pace. Nations that used deficit spending while experiencing low or high
growth, had either slow growth of debt (Italy and France) or faster (Portugal, Spain and UK). This is exemplary
trivial if considering debt stock jointly with debt flow. Fig 13 display clearly that Spain, UK, France and Portugal
used extensively deficit spending. On the other hand, Italy reduced constantly deficit spending since 1995, except
for 2009, staying nevertheless below the 3% ratio. Slow growth penalized the efforts of debt reduction. Efforts of
low debt countries were aided by positive economic performances; public balance surplus multiplied the benefits
of growth.
Fig. 13 Public Deficit expenditure/GDP ratio
Source: own elaboration on data from Eurostat
The weight of fiscal revenues on GDP (Fig. 14) remained generally constant over GDP. France and Germany
registered sensible change of almost 10%. Italy remained almost constant. The heterogeneity within the panel
remained constant between 2005 to 2018. In such sense, only UK strongly reduce tax burden during the crisis,
rising slowly the ratio on GDP. The wedge between the highest (Denmark, France) and lowest (UK, Poland) is
almost fifteen points of difference.
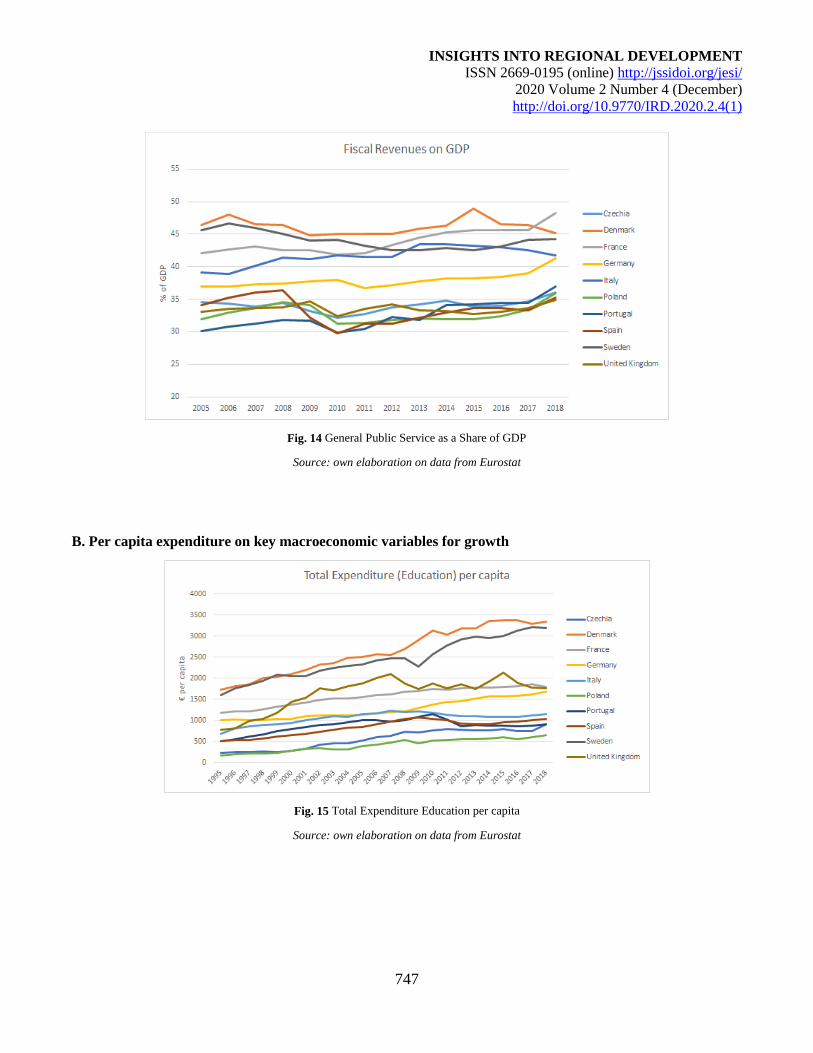
INSIGHTS INTO REGIONAL DEVELOPMENT
ISSN 2669-0195 (online) http://jssidoi.org/jesi/
2020 Volume 2 Number 4 (December)
http://doi.org/10.9770/IRD.2020.2.4(1)
747
Fig. 14 General Public Service as a Share of GDP
Source: own elaboration on data from Eurostat
B. Per capita expenditure on key macroeconomic variables for growth
Fig. 15 Total Expenditure Education per capita
Source: own elaboration on data from Eurostat

INSIGHTS INTO REGIONAL DEVELOPMENT
ISSN 2669-0195 (online) http://jssidoi.org/jesi/
2020 Volume 2 Number 4 (December)
http://doi.org/10.9770/IRD.2020.2.4(1)
748
Fig. 16 Intramural Government R&D Expenditure (GERD) all sectors per capita
Source: own elaboration on data from Eurostat
Fig. 17 Total Expenditure Health per capita
Source: own elaboration on data from Eurostat

INSIGHTS INTO REGIONAL DEVELOPMENT
ISSN 2669-0195 (online) http://jssidoi.org/jesi/
2020 Volume 2 Number 4 (December)
http://doi.org/10.9770/IRD.2020.2.4(1)
749
Acknowledgements
The research is conceptually related to the activities of the European Topic Centre on Waste, materials and the Green
Economy (ETC WMGE, European Environment Agency). It is also within the research activitiesof the 2018-2022 UNIFE
project on Circular economy, Innovations and SMEs funded by MIUR Italian ministry under the ‘Departments of excellence’
programme, and the activities of the related CERCIS research centre on Circular Economy, Innovation and SMEs.
All responsibilities remain upon the authors
Make your research more visible, join the Twitter account of INSIGHTS INTO REGIONAL DEVELOPMENT:
@IntoInsights
Massimiliano MAZZANTI
ORCID ID: https://orcid.org/0000-0002-6538-7942
Matteo MAZZARANO
ORCID ID: https://orcid.org/0000-0002-6106-1048
Andrea PRONTI
ORCID ID: https://orcid.org/0000-0001-8781-3714
Marco QUATROSI
ORCID ID: https://orcid.org/0000-0002-9409-9608
Register for an ORCID ID:
https://orcid.org/register
Copyright © 2019 by author(s) and VsI Entrepreneurship and Sustainability Center
This work is licensed under the Creative Commons Attribution International License (CC BY).
http://creativecommons.org/licenses/by/4.0/

INSIGHTS INTO REGIONAL DEVELOPMENT
ISSN 2669-0195 (online) http://jssidoi.org/IRD/
2020 Volume 2 Number 4 (December)
http://doi.org/10.9770/IRD.2020.2.4(2)
Publisher http://jssidoi.org/esc/home
750
CLUSTERIZATION OF PUBLIC PERCEPTION OF NUCLEAR ENERGY IN RELATION TO
CHANGING POLITICAL PRIORITIES
Dainius Genys ¹, Ričardas Krikštolaitis ²
1,2Vytautas Magnus University, Donelaičio 58, Kaunas, Lithuania
E-mails: [email protected] ; [email protected]
Received 18 May 2020; accepted 15 August 2020; published 30 December 2020
Abstract. The paper is directed to an important yet controversial phenomena of public perception of nuclear energy in Lithuania. It
discusses the conceptualization of nuclear energy public perception in relation to psychometric paradigm and its specified key elements of
public security feelings. The empirical research is based on representative public poll carried out in 2017. Based on the discoveries of
previous research when identifying the interdependence of public perception and support towards concrete political parties, four clusters
were formed to test conceptual notions (importance of personal trust in energy industry and personal knowledge) and then relate it with the
political preferences of each cluster. The results indicate the distribution of both nuclear energy as well as concrete energy projects public
perception in relation to political preferences and peculiarities of security feeling among each cluster.
Keywords: nuclear energy; public perception; political priorities; change; cluster analysis; Lithuania
Reference to this paper should be made as follows: Genys, D., Krikštolaitis, R. 2020. Clusterization of public perception of nuclear energy
in relation to changing political priorities. Insights into Regional Development, 2(4), 750-764. http://doi.org/10.9770/IRD.2020.2.4(2)
JEL Classifications: Z18, Z19, C12, C19
Additional disciplines political sciences; sociology
1. Introduction
Paradoxically enough, the construction of Ostrovets Nuclear Power Plant (NPP) in Belarus brings nuclear energy
back as one of the hottest topics in Lithuanian public discourse. It is internationally known that Lithuania puts a
lot of energy in trying to oppose Ostrovets NPP. There is plenty of analytical attempts (Juozaitis 2016; Molis
2011) to outline the ongoing happenings as well as to prognose possible future developments. Even though
Lithuanian considerations are very specific with respect to concrete ONPP project and geopolitical tension it
creates, on the other hand it somehow address broader discussion regarding the future of nuclear energy in general
(Adamantiades and Kessides 2009; Kessides 2012). Alas, there is almost no contribution on societal opinion,
although it is one of the main factors, which will likely grow in future, especially when the NPP will be launched

INSIGHTS INTO REGIONAL DEVELOPMENT
ISSN 2669-0195 (online) http://jssidoi.org/jesi/
2020 Volume 2 Number 4 (December)
http://doi.org/10.9770/IRD.2020.2.4(2)
751
and its energy will be provided to the market. Having in mind rich Lithuanian history of both the nuclear energy
ambitions and the dynamics of public perception it opens new angles for further analysis of the topic.
Lithuania might be one of the most interesting cases for those analysing public perception of nuclear energy due
to its interdependence with people‘s support to concrete political parties. The studies indicated that public
perception of energy security in Lithuania is based on what political actors people support and the energy policy
of which political powers they support. In other words, priority to political powers also leads to the construction
of their perception of energy security. Therefore, in those cases where political elements of certain powers
coincide, the perception coincides as well. Different social groups value the energy policy of Lithuania according
to their prioritization of the political power (Leonavičius, Genys, Krikštolaitis 2018). This is not very typical, but
it explains why and how public support to nuclear energy eventually decreased and it became irrelevant in overall
public assessment of energy security.
The goal of the paper is to analyse and cluster the division of public attitude towards nuclear energy based on
societal trust in energy industry and personal knowledge (about energy security) and relate it with the division of
the support to political parties. In doing so paper adapts psychometric paradigm. For sociologist, the value of P.
Slovic theory lies in accepting that the public’s perception of risk is influenced by social, cultural, economic and
political factors. The paper contributes to the broader discussion on the worldwide dynamics of nuclear
perception, especially addressing the issues of what determines public attitude to nuclear energy (Goodfellow et
al. 2014; Poortinga, Pidgeon and Lorenzoni 2006; Jewell 2011) and whether it is related with political
participation (Engels et al. 2013; Wagner, Grobelski and Harembski 2016) and what makes people safe (Siegrist,
Sütterlin and Keller 2014; Bird et al. 2014; Tvaronavičienė, Nesterova and Kováčik 2017) as well as energy
security dynamics in contemporary Europe (Balitskiy, Bilan and Strielkowski 2014; Abrhám et al. 2018; Dźwigoł
et al. 2019). The research is focused upon inner processes (dynamics of public discourse, change of political
priorities etc.) rather than external (like accidents, foreign experience, etc.). In Lithuania, the relevance of Slovic’s
theory corresponds to its identified contradiction in risk assessment between expert and lay people, and how it is
rationalized and how it can impact or even overcome each other, for example, when extensive communication
campaigns are embodied to change institutional energy policy (like in shale gas and nuclear energy cases).
The paper is based on empirical research (public poll) carried out in 2017. Representative survey was conducted
by public opinion research company “Vilmorus” in March 2017. Number of respondents: N = 1002; interviewed
18 years old and older residents of Lithuania. In both cases the method of survey: questioning respondents at
home using pre-made questionnaires. Method of selection: multi-stage, probabilistic sampling. Selection of
respondents was prepared so that each resident of Lithuania should have an equal chance of being questioned. The
results reflect the opinion of the entire population of Lithuania and distribution by age, sex, place of residence,
education, purchasing power. Error of survey results – 3% (probability – no less than 97%).
2. Conceptualizing Public Perception of Nuclear Energy
The “psychometric paradigm” developed by Slovic, Fischhoff, and Lichtenstein was a landmark in research about
public attitudes toward risks. This paradigm produced a “cognitive map” of hazards, and the assumption seemed
to be that the characteristics identified were inherent attributes of risk (Marris et al. 1997).
Slovic masterfully summarizes the key qualitative characteristics that result in judgments that a certain activity is
risky or not. People tend to be intolerant of risks that they perceive as being uncontrollable, having catastrophic
potential, having fatal consequences, or bearing an inequitable distribution of risks and benefits (Gorman 2013).
Slovic notes that nuclear power score high on all of these characteristics. Also unbearable in the public view are
risks that are unknown, new, and delayed in their manifestation of harm (Slovic 1996).
Paul Slovic (1987) in his classic article summarized various social and cultural factors that lead to inconsistent
evaluations of risk in the general public. According to P. Slovic perception of the risk – is intuitive assessment of
dangers deriving from technology (1987). He emphasizes the essential way in which experts’ and lay people’s

INSIGHTS INTO REGIONAL DEVELOPMENT
ISSN 2669-0195 (online) http://jssidoi.org/jesi/
2020 Volume 2 Number 4 (December)
http://doi.org/10.9770/IRD.2020.2.4(2)
752
views of risk differ. Experts judge risk in terms of quantitative assessments of morbidity and mortality. Yet most
people’s perception of risk is far more complex, involving numerous psychological and cognitive processes.
The key issues related to public views on nuclear power include trust in nuclear industry, understanding of
nuclear technology and confidence in “expert” views on risk issues such as reactor safety and the long-term
solutions for the storage and/or disposal of radioactive waste (Demski, Poortinga and Pidgeon 2014). The nuclear
energy usually is presented as a vivid example of such a schism between technological expertise and assurance of
NPP’s safety and public scepticism and mistrust in such guarantees (Pidgeon, Lorenzoni and Poortinga 2008;
Novikau 2016).
Slovic aptly noted, that “the public perception has evoked harsh reactions from experts”. And provided some
examples of the reaction (“the irrational fear of nuclear plants is based on a mistaken assessment of the risks”;
“the public has been driven insane over fear of radiation. I use the word “insane” purposefully since one of its
definition is loss of contact with reality”). However, his research on public risk perception provides different
picture, “demonstrating that people’s deep anxieties are linked to the reality extensive unfavorable media
coverage and to strong association between nuclear power and the proliferation and use of nuclear weapon”
(Slovic 1987). Further studies (Pidgeon, Kasperson and Slovic 2003; Goodfellow et al. 2014) have confirmed the
notion and even stronger related the dependence of public attitudes on contextual portrayal of nuclear energy. The
public gains most of its information on energy and nuclear power from the media, but does not trust it. Scientists
and environmental protection or consumer organizations are the most trusted groups. National governments are,
in general, even less trusted on these issues than the media (NEA and OECD 2010).
According to Slovic “lay people sometimes lack certain information about hazards. However, their basic
conceptualization of risk is much richer than that of the experts and reflects legitimate concerns that are typically
omitted from expert risk assessments. As a result, risk communication and risk management efforts are destined
to fail unless they are structured as two-way process. Each side, expert and public, has something valid to
contribute” (Slovic 1987). Having in mind the differences in expert and public risk perception it is important that
society would be well informed and have clear information about the advantages and main dangers of NPP (and
nuclear energy in general) in order to avoid emotionally based assessment of the latter.
Therefore, the safety experts of nuclear power should be attentive to and sensitive about the public’s broad
conception of risk (Gorman 2013). Slovic argues that risk management is a two-way street: just as the public
should take experts’ assessments of risk into account, so should experts respect the various factors, from cultural
to emotional, that result in the public’s perception of risk (Slovic 1987).
Regrettably, in some cases the defenders of nuclear energy (or other dangerous products in general) use Slovic’s
thesis to dismiss lay people‘s perceptions of risk: by hiring “experts” who minimize or disparaged the affected
individuals’ “over-reaction,” and “unscientific” assessment of potential harm, and provide contradictory
arguments full of „statistics“, „strategic interest“ and other „important“ reasoning, allowing the “experts” to
convince decision-makers and opinion leaders that the lay people’s perception of risk is wrong.
3. Subjective dimension of risk construction
Throughout its history nuclear energy has been controversial and susceptible to instinctive public reaction. There
are large sections of the public with no firm views for or against nuclear energy in many countries. The data
clearly shows that countries already include nuclear power in the energy mix have publics that are more
knowledgeable on the issues and are more supportive. Which come first is not clear (NEA and OECD 2010). A
strong emphasis on knowledge production institutes (like science and media) was put by risk specialist U. Beck,
who says that a vast knowledge on certain events and its possible danger and negative consequences transforms it
into risk (Beck 2005). Risk become “visible” only when defined. In this sense, the nature of the risk is related not

INSIGHTS INTO REGIONAL DEVELOPMENT
ISSN 2669-0195 (online) http://jssidoi.org/jesi/
2020 Volume 2 Number 4 (December)
http://doi.org/10.9770/IRD.2020.2.4(2)
753
only to objective events or phenomena, but to the constructive formulation of those events. The overall social,
political, economic and even cultural climate, so called epistemological context, are important for the final
definition of risk, when definition of risk depend on certain interpretation of contextual aspects (Cottle 1998).
From this point of view, the risk is not necessarily a reflection of the reality but a socially constructed perception
(Scott 2005). For example, compared to other technologies, nuclear risks always seem “bigger” and the benefits
seem “less” due to viable stereotypes that nuclear energy is “unsafe”, “uncontrolled”, “deadly”, “catastrophic”.
The perception of nuclear risk forms gradually, which makes them historic and rather inert. Authorities
responsible for risk control tend to have long-term scepticism and mistrust in society.
Paraphrasing Ulrich Beck (2006), the subjective dimension of risk construction is related to different power
groups, thus the definition of energy security is the object of competition among numerous energy security policy
makers who not only pursue different goals, but also have different capabilities to interpret energy risks and
dangers in their own way.
It is worth remembering that nuclear energy in Lithuania was the one of the main aspects to which public‘s and
decision makers (including differences among them) attitudes‘ contradicted the most (Leonavičius, Genys 2017).
Political decision-makers and society have somewhat different perceptions of energy security. The first identifies
energy security with the possibility of free choice of energy suppliers, supply routes and energy resources, and
with favourable energy prices. Meanwhile the second (¾ of society) prefer low energy prices rather than energy
independency. In other words, energy independence and energy affordability for Lithuanians are not equal
priorities when the latter is much more important.
Why does Lithuanian society support energy policy, but is opposed to its implementation measures? On the one
hand, the opposition to energy infrastructure projects is related with problematic material situation of Lithuanian
society, on the other hand, with the actions of the ruling elite.
For poorly informed respondents, the goals of abstract and strongly ideological, for example, the so-called
energy independence, energy security policy, are quite difficult to relate directly to their well-being, and
energy infrastructure projects immediately provoke interest in investment and their potential taxes. The
data show that the lower the respondent's income, the more it would contradict additional investments,
which could increase the prices of energy resources, but even respondents with relatively high income
support only slightly more than support investments in strategic energy projects.
Trust in strategic energy projects is reduced not only by the fear of increased taxes, but also by distrust of
the ruling elite. The collected data (Leonavičius and Genys 2017) reveal that respondents negatively
assess the competence of both politicians and civil servants. The vast majority of respondents also do not
think they represent the public interest. The lack of quality information, too prolonged politicians' debate
and scandals due to corruption undermine public confidence in the success of strategic energy projects.
Particularly damaging is the frequent change in the position of politicians, when a political party supports
a project before one election, and is opposed or offered alternative offers by others.
It is not surprising that political parties have different approaches to energy policy. Right-wing political parties in
the period of 2014-2017 were focusing on fossil fuels, meanwhile left-wing parties, especially peasants and
Greens, campaigned for renewables and heavily criticized the possibility of shale gas extraction and nuclear
power. Surveys have shown that the latter parties have been able to form critical public opinion on both the
construction of the nuclear power plant and the extraction of shale gas, in the form of potential risks. Lithuanian
energy policy documents focused more on fossil energy sources, and public opinion was that renewable energy
was more important. Studies have shown that public discourse over the 2014-2017 period was particularly
unfavourable for energy policy in relation to fossil energy sources and nuclear energy, as nearly half of the
Lithuanian population rated politicians (47.1%) and officials (47.9%) poorly and very badly) opportunities for

INSIGHTS INTO REGIONAL DEVELOPMENT
ISSN 2669-0195 (online) http://jssidoi.org/jesi/
2020 Volume 2 Number 4 (December)
http://doi.org/10.9770/IRD.2020.2.4(2)
754
efficient and competent solutions to energy sector problems (Leonavičius, Genys 2017). Having such
unfavourable public discourse for the implementation of energy policy, the right wing parties could hardly
convince the people of Lithuania of the usefulness of nuclear energy and shale gas.
Bearing in mind that public attitudes towards energy security depend on the political parties they support, it is
worth analysing the implications of the political process for public opinion, such as the political fights among
political parties (deconstruction of the ruling energy policy and continuous presentation of nuclear energy as a
conductor of new problems rather than a solution) – how does it affects public attitude to nuclear energy and their
security feeling?
4. Clustering the perception of nuclear energy
To summarize the most important factors that determine public perception of nuclear energy, on the one hand are
awareness of the problem (individual understanding and knowledge on nuclear energy) and nuances of media
coverage (variety of information sources and its evaluation), and finally, trust in nuclear industry (trust in science
and in institution in charge of taking care of the nuclear energy risk).
Therefore, in the empirical part of the paper we will test two hypotheses. In the first case, we expect that people,
who are better aware of the issue, are more critical to media performance, have diverse information sources and
more trust in nuclear industry will be more positive to nuclear energy and will support the development of this
kind of energy (Hypothesis 1).
In the second case, we expect that people, who less aware of the issue, are less critical to media performance, have
singular information source and less trust in nuclear industry will be less positive to nuclear energy and will not
support the development of this kind of energy (Hypothesis 2).
Both hypotheses were based on two theoretical notions. The first regards what has been called nuclear industry.
According to literature (Slovic, Fischhoff and Lichtenstein 1986; Kasperson et al. 1988) the first hypothesis was
formulated in following way: the more people trust in nuclear industry the less they worry about nuclear risks and
they feel calmer and more support this kind of energy. And vice versa, the less trust, the more worry they fell
about nuclear risks and feel anxious and less support this kind of energy.
For quite a long time Lithuania was nuclear energy producer, but in 2009 Ignalina NPP was decommissioned and
we are not so called nuclear energy producer country any longer. Therefore, we had to modify the term nuclear
industry and make it broader. We use energy industry analogy in this paper instead, which to our view performs
the same function.
As we operationalize the energy industry we see it as it consists of key actors who form politics (government,
parliament), provide expertise and run research (scientists), operate particular projects (municipalities), gain profit
(private companies), advocate nuclear idea globally (international energy organizations), and even opponents
(NGOs), finally, are in charge so to speak – controls nuclear industry (energy ministry). The operationalization of
energy industry encompasses the list of 8 key actors who performs vivid role in energy industry (see Table 1). To
get evaluation from respondents we formulated similar question – “Do You Trust the Influence of these
Institutions and Organizations on Lithuanian Energy Policy?” – each time adding different actor. We believe such
formulation describes the role of every actor in best way and express respondents’ approval or disapproval.
The second notion is related to personal knowledge assessment and evaluation of media performance. According
to literature (Slovic 1987; Sjöberg, Moen and Rundmo 2004; Poortinga, Aoyagi and Pidgeon 2013) the second
hypothesis was formulated in following way: the more diverse information sources people have, the more critical
they evaluates the information they get and the better they feel informed and are aware about the energy issue, the

INSIGHTS INTO REGIONAL DEVELOPMENT
ISSN 2669-0195 (online) http://jssidoi.org/jesi/
2020 Volume 2 Number 4 (December)
http://doi.org/10.9770/IRD.2020.2.4(2)
755
less they worry about nuclear risks and they feel calmer and more support this kind of energy. And vice versa, the
less diverse information sources people have, the less critical they evaluates the information they get and the
worse they feel informed and are unaware about the energy issue, the more they worry about nuclear risks and
feel anxious and less support this kind of energy. Media coverage plays huge role in shaping society’s view
towards nuclear energy. Having in mind media’s hunger for scandalous stories nuclear energy and especially risk
or even catastrophes frequently become “best-selling” stories. To escape the dependency on populist stories it is
important to have diverse sources of information and critical attitude to media performance and their personal
knowledge assessment. The operationalization of this notion encompass the list of 7 aspects regarding both the
variety (special seminars, meetings, family, friends, colleagues, neighbours, news e-portals, paper, Radio, TV)
and frequency of respondents information sources, critical attitude towards media (trust in media) and self-
evaluation awareness on energy issue (awareness on energy security issues, knowledge of the advantages and
disadvantages of nuclear energy). To get evaluation from respondents we formulated similar question – “How
often do you get information about the energy policy from the following sources?” – each time adding different
source and provided statements (see Table 1).
5. Testing hypothesis and formation of the clusters
The two step cluster analysis was performed in trying to track the distribution of the hypothesis among the public.
The cluster analysis revealed four clusters which reflect four types of interrelation between two theoretical notions
(trust in energy industry and personal knowledge assessment and evaluation of media performance) on which the
hypotheses were based on (see Table 1).
Table 1. Final Cluster Centers.
2017 Clusters
Trust in energy industry 1 2 3 4
6.2. Do You Trust the Influence of these Institutions and Organizations on Lithuanian Energy Policy? Lithuanian
Government
2 3 2 3
6.3. Do You Trust the Influence of these Institutions and Organizations on Lithuanian Energy Policy? Lithuanian
Parliament
1 3 1 3
6.4. Do You Trust the Influence of these Institutions and Organizations on Lithuanian Energy Policy? Municipalities 2 3 2 2
6.5. Do You Trust the Influence of these Institutions and Organizations on Lithuanian Energy Policy? Scientists 3 3 3 3
6.6. Do You Trust the Influence of these Institutions and Organizations on Lithuanian Energy Policy? Lithuanian
Energy Ministry
2 3 2 3
6.7. Do You Trust the Influence of these Institutions and Organizations on Lithuanian Energy Policy? NGOs 2 2 2 2
6.9. Do You Trust the Influence of these Institutions and Organizations on Lithuanian Energy Policy? Private Energy
Companies
2 2 2 2
6.17. Do You Trust the Influence of these Institutions and Organizations on Lithuanian Energy Policy?
International/global energy organizations (i.e., IAEA, WEC)
2 3 2 3
Personal knowledge assessment and evaluation of media performance
7.2. How often do you get information about the energy policy from the following sources?
Special seminars and meetings;
1 1 2 1
7.3. How often do you get information about the energy policy from the following sources? Family, friends,
colleagues, neighbours
1 2 2 2
7.4. How often do you get information about the energy policy from the following sources? Media (electronic and
paper format)
1 2 2 3
7.5. How often do you get information about the energy policy from the following sources? Radio, TV 1 2 3 3
8.1. I am very well informed about energy problems 1 1 1 2
8.2. I think that media reflects the energy issues in detail 1 1 2 3
3.3. I know the advantages and disadvantages of nuclear energy 1 1 2 3

INSIGHTS INTO REGIONAL DEVELOPMENT
ISSN 2669-0195 (online) http://jssidoi.org/jesi/
2020 Volume 2 Number 4 (December)
http://doi.org/10.9770/IRD.2020.2.4(2)
756
To identify the common characteristics specific to each cluster, the hypothesis of homogeneity was tested in order
to ascertain whether there are differences among clusters and whether these differences are statistically significant
(see Table 2). The analysis show it has no statistically significant difference at 0.05 level between clusters
members taking into account different age group (Pearson Chi-Square=18.740, p=0.226), occupation (Pearson
Chi-Square=22.169, p=0.225) and education (Pearson Chi-Square=26.578, p=0.185).
But the situation is different with other two socio-demographic characteristics: income and living areas. In both
cases the homogeneity hypothesis is rejected, and the members of the cluster are distributed differently depending
on the relevant characteristics. The analysis confirmed the existence of statistically significant differences among
cluster regarding income (Pearson Chi-Square=71.284, p=0.000) and living area (Pearson Chi-Square=32.872,
p=0.000).
Table 2. The main features of the clusters.
1st cluster – Doubtful/uncertain,
unaware
2nd cluster – Confident/certain,
poorly informed, unaware
3rd cluster – Doubtful/uncertain,
poorly informed, aware
4th cluster –
Certain, aware
Strong doubt/uncertainty
towards energy industry (do not
have an opinion on the role of
Lithuanian government,
Municipalities, Energy Ministry
role on energy policy, and does
not support LT Parliament) is
common for the 1st cluster. The
respondents of this cluster also
lack information, are quite
critical to media performance
and do not have an opinion on
nuclear energy.
The 2nd cluster is more trustful
in energy industry (trust in
Lithuanian government, LT
Parliament, Municipalities,
Scientists, Energy Ministry role,
but have doubts towards
NGO’s, Private companies).
The respondents of this cluster
also have limited sources of
information (mainly Radio and
TV), they are critical to media
performance and poorly
evaluate personal knowledge on
energy problems.
The 3rd cluster trust in
Lithuanian government and
scientists, but has doubts
regarding energy industry (LT
Parliament, Municipalities and
Private energy companies,
Energy ministry, NGO’s and
International organizations role
in energy policy). The
respondents of this cluster have
limited sources of information
(mainly Radio, TV), are
doubtful regarding media
performance and quite sceptical
to personal knowledge on
energy problems.
The 4th cluster trust in energy
industry (trust in Lithuanian
government, LT Parliament,
Scientists, Energy ministry and
International organizations, but
still have doubts towards
Municipalities, NGO’s and
Private companies). The
respondents of this cluster also
have various sources of
information, trust in media
performance and know the
advantages and disadvantages of
nuclear energy.
The socio-demographic characteristics
The 1st cluster is relatively poor.
It has the biggest population of
the poorest category. Most of its
members are with lower
medium (101-200 – 15.2%) and
medium (201-300 – 35.9%)
income. Large part of its
members did not respond to this
question.
The 1st cluster has the biggest
population living in Rural
settlements and single farms
(41.3%) and the smallest living
in District Centres (16.6%) also
relatively small population
living in Main cities (37.7%).
The 2nd cluster is somehow
richer, but also relatively poor.
The largest part of its members
are distributed among three
categories (ranging from 101 –
400 Eur).
The 2nd has the biggest
population living in District
Centres (26.6%) and the
smallest living in Main Cities
(32%).
The most notable peculiarities
of 3rd cluster are smallest
population in third category
(201-300 Eur) and the largest of
those who didn’t respond to the
questions.
The 3rd has the biggest
population living in Small
Towns (5.6%) and many living
in District Centres (23.7%), but
the smallest living in Rural
settlements and single farms
(26.3%).
The 4th is the richest cluster. It
has the largest populations in
three richest categories (from
501-to 701 and more).
The 4th has the biggest
population living in Main cities
(47.8%) and the smallest living
in Small Towns (1.2%).
Speaking about similarities among clusters two tendencies can be distinguished. First, all clusters maintained
huge support for scientists. Second, uncertainty or unaware regarding the role of both NGO and international
organization are also common among clusters. Even though there were some changes in assessing personal
knowledge and media performance within some of the clusters there are no any similarities among clusters.

INSIGHTS INTO REGIONAL DEVELOPMENT
ISSN 2669-0195 (online) http://jssidoi.org/jesi/
2020 Volume 2 Number 4 (December)
http://doi.org/10.9770/IRD.2020.2.4(2)
757
Even though there is no statistically significant difference regarding employment it is interesting to note that the
1st cluster has the biggest unemployed population (10.9%) and those who have Other activities (6.3%) as well as
State enterprise employees (17.6%). It also has the smallest Private company employee’s population (21.3%). The
2nd on the contrary – has the smallest populations of State enterprise employees (11%), Private business owners
(5.9%) and at the same time Unemployed (4.6%), but has the biggest Retired population (38.8%). The 3rd cluster
has the biggest both Private business owners (8.4%) and Private company employees (30.9%) populations. The 4th
cluster has no particular peculiarities (maybe with exception of quite large State enterprise employees’ population
– 17.3%) and are close to total average of every category.
Finally, there is no statistically significant difference regarding education, but the tendencies, however, are quite
notable and interesting. The 1st cluster has biggest population with Secondary education (26%) and quite large
populations with Vocational (18.4%) and Higher education (22.9%), and the smallest Further education (18.8%).
The 2nd cluster has biggest population with Primary (12.2%) and Vocational education (20.3%) and quite large
Secondary Education (23%), and the smallest Higher education (17.6%). The 3rd cluster doesn’t have significant
peculiarities and with the exception of Primary education is very similar to total average by all categories. The 4th
cluster has the biggest population with Higher education (32%) and the smallest populations with Secondary
education (20.9%) and Vocational training (11.9%).
6. Clusters correlation with political parties
In a brief overview of the priorities of the ruling parties‘ energy policy, we saw that until 2012, no opposition
force questioned the importance of nuclear energy (construction of new NPP) for Lithuania's energy security, but
had different opinion on specific measures - how to implement it. Until finally, the idea of a public referendum
was raised, allowing the public to express their will for the future of nuclear energy. Assuming that the change in
public opinion (from strong support to relative confusion) is related to the inconsistency of the nuclear energy
discourse and the new contextual meanings surrounded new NPP (from a project which solves problems to a
project which creates problems;), it is worth analysing the interrelations between clusters and their support for
political parties, as well as some of the strategic directions of energy policy (see Table 3).
Table 3. Political preferences of clusters (distribution of support to political parties).
1st cluster – Doubtful/uncertain,
unaware
2nd cluster – Confident/certain,
poorly informed, unaware
3rd cluster – Doubtful/uncertain,
poorly informed, aware
4th cluster –
Certain, aware
Distribution of clusters‘ support to political parties*
Strong opposition to CP - 53.8%,
strong opposition to SD - 43.5%,
strong opposition to OJ - 44.8%
(40.4% don‘t know), strong
opposition to LP – 50.7% weak
support to LPGU –39 (30.9% do
not support).
Support to CP – 38.8% (the
weakest opposition among
clusters), support to SD –
44.2%, opposition to OJ –
37.4%, support to LP - 34.3%
(but 39.2% don‘t know), strong
support to LPGU – 62.2%
Opposition to CP – 36.7% (but
41.9% support), support to SD –
40.8%, opposition to OJ – 49.8%,
support to LP – 35.1% (but
36.4% oppose), support to LPGU
– 66.4%.
Opposition to CP – 49.6%,
opposition to SD – 49.4%,
opposition to OJ - 49.8%
(and 39.8% don‘t know),
opposition to LP – 45.7%
(and 37.8% don‘t know),
weak support to LPGU -
31.9% (weakest among
clusters) and strong
opposition 36.5% (the biggest
among clusters)
Statistically significant differences of clusters opinion about support to political parties (p=0.000, for all cases)
Which of the following statements do you agree with? (Price vs. Independence)
The state has to take greater care
of low cost energy resources
rather than energy independence
(69.1%).
The state has to take greater care
The state has to take greater
care of low cost energy
resources rather than energy
independence (58.6%).
The state has to take greater
The state has to take greater care
of energy independence despite
larger financial investments
needed for this (54.9%).
The state has to take greater care
The state has to take greater
care of low cost energy
resources rather than energy
independence (66.1%).
The state has to take greater
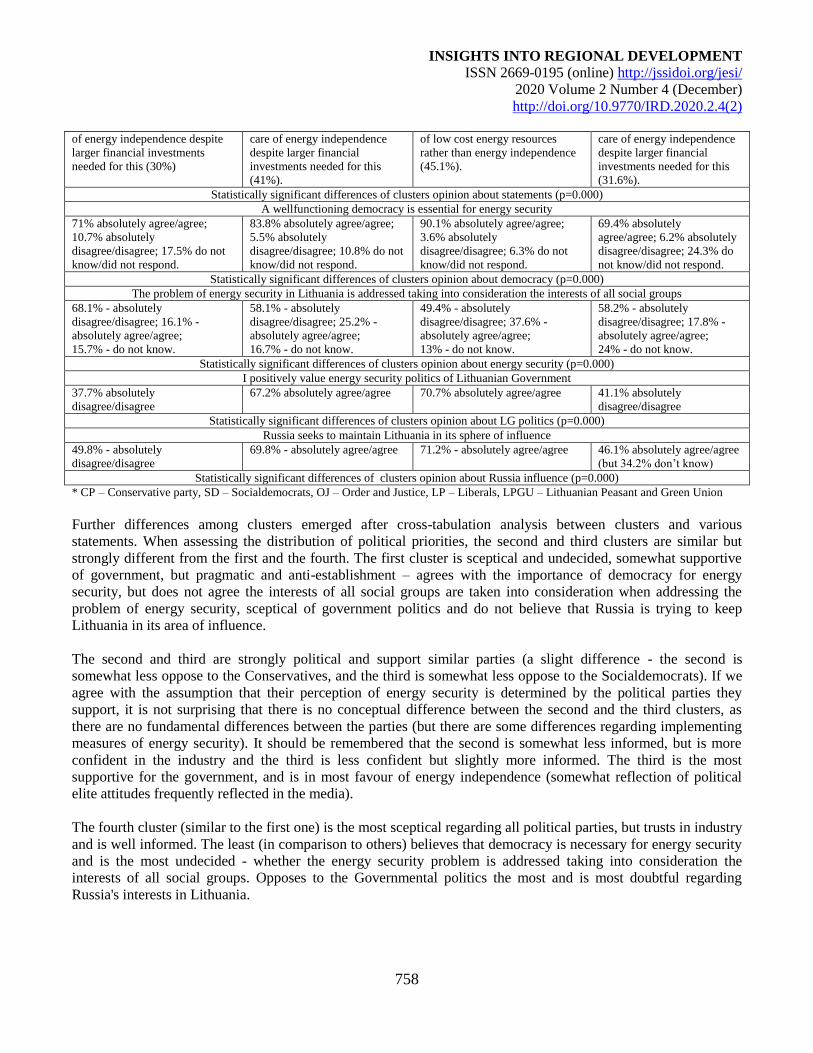
INSIGHTS INTO REGIONAL DEVELOPMENT
ISSN 2669-0195 (online) http://jssidoi.org/jesi/
2020 Volume 2 Number 4 (December)
http://doi.org/10.9770/IRD.2020.2.4(2)
758
of energy independence despite
larger financial investments
needed for this (30%)
care of energy independence
despite larger financial
investments needed for this
(41%).
of low cost energy resources
rather than energy independence
(45.1%).
care of energy independence
despite larger financial
investments needed for this
(31.6%).
Statistically significant differences of clusters opinion about statements (p=0.000)
A wellfunctioning democracy is essential for energy security
71% absolutely agree/agree;
10.7% absolutely
disagree/disagree; 17.5% do not
know/did not respond.
83.8% absolutely agree/agree;
5.5% absolutely
disagree/disagree; 10.8% do not
know/did not respond.
90.1% absolutely agree/agree;
3.6% absolutely
disagree/disagree; 6.3% do not
know/did not respond.
69.4% absolutely
agree/agree; 6.2% absolutely
disagree/disagree; 24.3% do
not know/did not respond.
Statistically significant differences of clusters opinion about democracy (p=0.000)
The problem of energy security in Lithuania is addressed taking into consideration the interests of all social groups
68.1% - absolutely
disagree/disagree; 16.1% -
absolutely agree/agree;
15.7% - do not know.
58.1% - absolutely
disagree/disagree; 25.2% -
absolutely agree/agree;
16.7% - do not know.
49.4% - absolutely
disagree/disagree; 37.6% -
absolutely agree/agree;
13% - do not know.
58.2% - absolutely
disagree/disagree; 17.8% -
absolutely agree/agree;
24% - do not know.
Statistically significant differences of clusters opinion about energy security (p=0.000)
I positively value energy security politics of Lithuanian Government
37.7% absolutely
disagree/disagree
67.2% absolutely agree/agree 70.7% absolutely agree/agree 41.1% absolutely
disagree/disagree
Statistically significant differences of clusters opinion about LG politics (p=0.000)
Russia seeks to maintain Lithuania in its sphere of influence
49.8% - absolutely
disagree/disagree
69.8% - absolutely agree/agree 71.2% - absolutely agree/agree 46.1% absolutely agree/agree
(but 34.2% don’t know)
Statistically significant differences of clusters opinion about Russia influence (p=0.000)
* CP – Conservative party, SD – Socialdemocrats, OJ – Order and Justice, LP – Liberals, LPGU – Lithuanian Peasant and Green Union
Further differences among clusters emerged after cross-tabulation analysis between clusters and various
statements. When assessing the distribution of political priorities, the second and third clusters are similar but
strongly different from the first and the fourth. The first cluster is sceptical and undecided, somewhat supportive
of government, but pragmatic and anti-establishment – agrees with the importance of democracy for energy
security, but does not agree the interests of all social groups are taken into consideration when addressing the
problem of energy security, sceptical of government politics and do not believe that Russia is trying to keep
Lithuania in its area of influence.
The second and third are strongly political and support similar parties (a slight difference - the second is
somewhat less oppose to the Conservatives, and the third is somewhat less oppose to the Socialdemocrats). If we
agree with the assumption that their perception of energy security is determined by the political parties they
support, it is not surprising that there is no conceptual difference between the second and the third clusters, as
there are no fundamental differences between the parties (but there are some differences regarding implementing
measures of energy security). It should be remembered that the second is somewhat less informed, but is more
confident in the industry and the third is less confident but slightly more informed. The third is the most
supportive for the government, and is in most favour of energy independence (somewhat reflection of political
elite attitudes frequently reflected in the media).
The fourth cluster (similar to the first one) is the most sceptical regarding all political parties, but trusts in industry
and is well informed. The least (in comparison to others) believes that democracy is necessary for energy security
and is the most undecided - whether the energy security problem is addressed taking into consideration the
interests of all social groups. Opposes to the Governmental politics the most and is most doubtful regarding
Russia's interests in Lithuania.

INSIGHTS INTO REGIONAL DEVELOPMENT
ISSN 2669-0195 (online) http://jssidoi.org/jesi/
2020 Volume 2 Number 4 (December)
http://doi.org/10.9770/IRD.2020.2.4(2)
759
7. Attitude division among clusters
For the identification of the most important energy security aspects, respondents were provided the vast variety of
different energy security aspects for the evaluation of each them according to personal opinion. The energy
security aspects were formed in line with Lithuanian strategic interests and covered different angles of energy
security: diversification (of energy suppliers as well as resources), reliability (of supply and infrastructure),
independence (from foreign states (mainly Russia) as well as monopolistic practices), ability to take advantage of
international political relations (e.g., EU, NATO) to defend Lithuanian interests, synchronization of electricity
grid with continental European zone, to mitigate the development of nuclear energy in neighbouring countries
(Ostrovets (Belarus) and Kaliningrad (Russia)), lastly – evaluation of strategic projects to be implemented in
upcoming future (renewable energy, shale gas, nuclear energy) (see Table 4).
Table 4. Attitude to energy security differences among clusters.
General
(N=1002)
1 cluster
(N=223)
2 cluster
(N=222) 3 cluster (N=253) 4 cluster (N=304)
Mean Rank Mean Rank Mean Rank Mean Rank Mean Rank
The prices of energy resources 4.46 1 4.43 1 4.41 1 4.53 1 4.45 1
Reliability of energy supply services 4.36 2 4.31 2 4.32 3 4.52 2 4.30 2
Reliability of energy infrastructure
(pipelines, electric transmission
networks, power plants and so on)
4.27 3 4.21 3 4.27 5 4.43 4 4.18 3
Implementation of modern technologies
in the energy system 4.24 4 4.12 4 4.32 2 4.51 3 4.03 5
Development of renewable energy 4.18 5 4.06 5 4.29 4 4.32 7 4.06 4
The ability to take advantage of
international political relations to
defend Lithuanian interests
4.05 6 3.96 7 4.14 6 4.35 5 3.81 8
Independent energy generation 4.05 7 4.01 6 4.07 8 4.22 11 3.91 7
Energy independence from other states 4.01 8 3.83 8 4.08 7 4.25 9 3.91 6
Integration into the common European
Union energy market 3.97 9 3.75 12 4.07 9 4.33 6 3.76 11
Diversification (diversity) of energy
suppliers 3.96 10 3.83 9 4.02 10 4.23 10 3.77 10
Diversification (diversity) of energy
resources 3.95 11 3.80 10 4.01 11 4.20 12 3.79 9
The synchronization of Lithuanian
electricity grid/system with the
European Union synchronous zones
3.91 12 3.79 11 3.99 12 4.31 8 3.60 12
Development of oil extraction (Q8) 3.25 13 3.27 13 3.32 14 3.30 13 3.13 13
The development of nuclear energy in
Lithuania neighbourhood 3.20 14 3.22 14 3.42 13 3.15 14 3.05 14
Development of shale gas extraction 3.03 15 2.79 15 3.24 15 3.09 15 3.01 15
Development of nuclear energy 2.89 16 2.79 16 2.90 16 2.88 16 2.96 16
The analysis showed that two the most important aspects are The prices of energy resources and Reliability of
energy supply services among clusters (with exception of the second cluster when the latter aspects moves into
third place). The four less important (in reversed order) The development of nuclear energy, The development of
shale gas, The development of nuclear energy in Lithuania neighbourhood (Ostrovets in Belarus and the Baltic
Kaliningrad nuclear power plant) (which in case of the second cluster switches places with Q8), The development
of oil extraction (Q8). Thus, we see the strong domination of the most and the least important aspects on the one

INSIGHTS INTO REGIONAL DEVELOPMENT
ISSN 2669-0195 (online) http://jssidoi.org/jesi/
2020 Volume 2 Number 4 (December)
http://doi.org/10.9770/IRD.2020.2.4(2)
760
hand, and quite diverse attitude distribution among clusters regarding other aspects of energy security in Lithuania
on the other. Therefore, data revealed consistent public support to general direction of energy security
(independent and cheap energy) which all political parties agree on. However, the attitude to its implementation
measures are quite mixed, as various political parties articulated it in their own way.
Finally, the further analysis of the attitude to various aspects related to nuclear energy revealed certain tendencies
among clusters (see Table 5).
Table 5. Perception variations among 4 clusters. “Is the development of nuclear energy important for Lithuanian energy security?”
Clusters
Total 1 2 3 4
Totally disagree/ disagree 44.8% 44.1% 39.1% 44.7% 42.9%
Don‘t know/undecided 19.3% 17.6% 25.0% 17.4% 20.2%
Agree/totally agree 35.9% 38.3% 35.9% 37.9% 36.9%
Total 100.0% 100.0% 100.0% 100.0% 100.0%
There are almost no differences in attitude regarding nuclear energy importance for Lithuanian energy security
among clusters (Table 5), unless higher undecidedness in the third cluster. But there are few notable differences
regarding evaluation of the knowledge on the advantages and disadvantages of nuclear energy (Table 6).
Table 6. Perception variations among 4 clusters. “I know the advantages and disadvantages of nuclear energy”
Clusters
Total 1 2 3 4
Totally disagree/ disagree 72.2% 74.8% 40.1% 12.3% 47.9%
Don‘t know/undecided 5.8% 6.7% 20.8% 8.3% 11.2%
Agree/totally agree 22.0% 18.5% 39.1% 79.4% 40.9%
Total 100.0% 100.0% 100.0% 100.0% 100.0%
The 1st and the 2nd clusters hugely disagree (accordingly 72.2% and 74.8%) with the statement “I know the
advantages and disadvantages of nuclear energy”. Meanwhile the 4th cluster on the contrary - has the smallest
population who disagree (12.3%) and the largest who agree (79.4%). The 3rd cluster is divided into two similar
groups who disagree (40.1%) and agree (39.1%). These differences cannot be explained by political priorities, nor
clusters’ trust in nuclear industry but is closely related with informativity. The largest groups who agree belongs
to 4th cluster which is well informed, and its members evaluate their knowledge positively. Even the 3rd cluster,
which is somewhat less informed demonstrated better results (comparing to first two clusters) See Table 7 below.
Table 7. Perception variations among 4 clusters. “Do you agree with the construction of Visaginas NPP?“
Clusters
Total 1 2 3 4
Totally disagree/ disagree 62.3% 57.2% 49.7% 58.1% 56.3%
Don‘t know/undecided 21.6% 26.1% 30.2% 17.0% 24.0%
Agree/totally agree 16.1% 16.7% 20.1% 24.9% 19.7%
Total 100.0% 100.0% 100.0% 100.0% 100.0%
As mentioned before Visaginas NPP (VNPP) were the object for many heated discussions and quite frequently
the interpretations view inconsistent and even controversial. To clarify public attitude general questions regarding
support or unsupported the construction of VNPP were left in the poll even though it is clear Lithuania won’t
come back to nuclear energy production. The division of attitude among clusters distributed differently than in
case of importance of nuclear energy for energy security. If in previous case the 1st cluster didn’t distinguish by
INSIGHTS INTO REGIONAL DEVELOPMENT
ISSN 2669-0195 (online) http://jssidoi.org/jesi/
2020 Volume 2 Number 4 (December)
http://doi.org/10.9770/IRD.2020.2.4(2)
761
significant peculiarities, in this case on the contrary, we see that it is the less supportive (16.1%) and the most
critical (62.3%). The 2nd similarly less supportive (16.7%) but at the same time less critical (57.2%). The 3rd is the
most indecisive (30.2%) and also more supportive (20.1%) and the less critical (49.7%). The 4th is the most
supportive (24.9%), the less indecisive (17%) and yet quite critical (58.1%).
The impact of both cluster’s trust in energy industry and informativity interrelation and cluster’s perception
dependence on political parties’ policy can be traced in this case. First of all, there is a tendency moving through
clusters from 1st (doubtful/uncertain, unaware) to 4th (slightly doubtful/certain, informed, ware) in supporting the
construction of VNPP. The 1st cluster not only is doubtful/uncertain, unaware but also sceptical and less
supporting governmental politics. The 4th is also sceptical but trusts in industry and have enough knowledge to
make autonomous decision. Secondable, the 3rd cluster is a vivid illustration of consequences of nuclear energy
battles among various political parties: this cluster is most political and most supportive for governmental policy
and therefore has the largest indecisive group, the smallest who disagree, and some who agree. One could
presume that features of the 3rd cluster perception reflects the kaleidoscope of nuclear politics. Finally, the 2nd
cluster is less indecisive, but more opposing and less supportive. Even though from political preferences point of
view this cluster is similar to previous, the differences come from its pragmatism (priority to price) and doubt that
energy security problem is addressed taking into consideration the interests of all social groups. Having in mind
the negative discourse regarding nuclear energy (that it might contribute to creation of new problems) there are
notable differences in attitude even though it also strongly supports governmental policy.
To sum up, it seems that the society started to think more frequently that the development of nuclear energy is
dangerous. It could be related not only to the criticism of VNPP in the media but also to the development of
nuclear energy in Lithuanian neighbourhood.
Conclusions
Based on unique type of interrelation between two theoretical notions (trust in energy industry and personal
knowledge assessment and evaluation of media performance) four clusters were formulated. Both – trust in
energy industry as well as personal knowledge assessment and evaluation of media performance – have impact
on perception of nuclear energy. As the analysis has shown each aspect have different consequences to public
perception: the doubt or uncertainty towards energy industry results in indecisiveness and insecurity. Meanwhile
lack of personal knowledge or dependence on solely information source and uncritical evaluation of media
performance results in scepticism and anxiety.
The data analysis revealed consistent public support to general direction of energy security despite existing
difference among clusters regarding political preferences. However, the attitude to concrete projects and
implementation measures are quite mixed, as various political parties articulated it differently. There are almost
no differences in attitude regarding nuclear energy importance for Lithuanian energy security among clusters
(Table 5), but there are notable difference among clusters regarding both deeper understanding of advantages and
disadvantages of nuclear energy and the construction of new VNPP, both of which depend on clusters’
interrelation between trust in energy industry and awareness of the problem and political preferences.
The cluster analysis confirmed the relation between cluster’s trust in energy industry and informativity
interrelation as well as clusters’ perception dependence on political parties’. There is a tendency moving through
clusters from 1st (doubtful/uncertain, unaware, also sceptical and less supporting governmental politics) to 4th
(slightly doubtful/certain, informed, aware, is also sceptical but trusts in industry and have enough knowledge to
make autonomous decision) in supporting the construction of VNPP. Secondable, the 3rd cluster is a vivid
illustration of consequences of nuclear energy battles among various political parties: this cluster is most political
and most supportive for governmental policy and therefore has the largest indecisive group, the smallest who

INSIGHTS INTO REGIONAL DEVELOPMENT
ISSN 2669-0195 (online) http://jssidoi.org/jesi/
2020 Volume 2 Number 4 (December)
http://doi.org/10.9770/IRD.2020.2.4(2)
762
disagree, and some who agree. Meanwhile, the 2nd cluster is less indecisive, but more opposing and less
supportive. Even though from political preferences point of view this cluster is like previous, the differences
come from its pragmatism (priority to price) and doubt that energy security problem is addressed taking into
consideration the interests of all social groups.
References
Abrhám, J., Britchenko, I., Jankovic, M., Garškaitė-Milvydienė, K. 2018. Energy security issues in contemporary Europe, Journal of
Security and Sustainability Issues 7(3): 387–398. https://doi.org/10.9770/jssi.2018.7.3(1)
Adamantiades, A., Kessides, I. 2009. Nuclear power for sustainable development: current status and future prospects. Energy Policy 37:
5149-5166. https://doi.org/10.1016/j.enpol.2009.07.052.
Cottle, S. 1998. Ulrich Beck, ‘Risk Society’ and the Media. A Catastrophic View? European Journal of Communication 13(1): 5-32.
https://doi.org/10.1177/0267323198013001001.
Balitskiy, S., Bilan, Y., Strielkowski, W. 2014. Energy security and economic growth in the European Union. Journal of Security and
Sustainability Issues 4(2): 125-132. https://doi.org/10.9770/jssi.2014.4.2(2)
Beck, U. 2005. Risk Society Revisited: Theory, Politics and Research Programmes, in Adam, B., Beck, U., van Loon, J., (Eds.), The Risk
Society and Beyond: Critical Issues for Social Theory. Sage Publications, London, 211–229.
Bird, D. K., Haynes, K., van den Honert, R., McAneney, J., Poortinga, W. 2014. Nuclear power in Australia: A comparative analysis of
public opinion regarding climate change and the Fukushima disaster. Energy Policy 65: 644-653.
https://doi.org/10.1016/j.enpol.2013.09.047.
Demski, C., Poortinga, W., Pidgeon, N. 2014. Exploring public perceptions of energy security risks in the UK. Energy Policy 66: 369–378.
http://dx.doi.org/10.1016/j.enpol.2013.10.079.
Dźwigoł, H., Dźwigoł–Barosz, M., Zhyvko, Z., Miśkiewicz, R., Pushak, H. 2019. Evaluation of the energy security as a component of
national security of the country. Journal of Security and Sustainability Issues 8(3): 307-317. http://doi.org/10.9770/jssi.2019.8.3(2)
Engels, A., Hüther, O., Schäfer, M., Held, H. 2013. Public climate-change skepticism, energy preferences and political participation.
Globas Environmental Change 23(5): 1018-1027. https://doi.org/10.1016/j.gloenvcha.2013.05.008
Goodfellow, J. M., Dewick, P., Wortley, J., Azapagic, A. 2014. Public perceptions of design options of new nuclear plants in the UK.
Process Safety and Environmental Protection 94: 72-88. https://doi.org/10.1016/j.psep.2014.12.008.
Gorman, S., 2013. How do we perceive risk?: Paul Slovic’s landmark analysis. Retrieved from
http://www.thepumphandle.org/2013/01/16/how-do-we-perceive-risk-paul-slovics-landmark-analysis-2/#.XXcvfyj7TIU.
Jewell, J., 2011. Ready for nuclear energy? An assessment of capacities and motivations for launching new national nuclear power
programs. Energy Policy 39(3): 1041–1055. https://doi.org/10.1016/j.enpol.2010.10.041.
Juozaitis, J., 2016. Lithuanian foreign policy vis-à-vis Belarusian nuclear power plant in Ostrovets. Lithuanian Foreign Policy Review
35(1): 41-66. https://doi.org/10.1515/lfpr-2016-0023.
Kasperson, R. E., Renn, O., Slovic, P., Brown, H. S., Emel, J., Goble, R., Kasperson, J. X., Ratick, S. 1988. The social amplification of
risk: a conceptual framework. Risk Analysis 8(2): 177–187. https://doi.org/10.1111/j.1539-6924.1988.tb01168.x.
Kessides, N. I. 2012. The future of the nuclear industry reconsidered: risks, uncertainties, and continued promise. Energy Policy 48: 185-
208. http://dx.doi.org/0.1016/j.enpol.2012.05.008.
Leonavičius, V., Genys, D., Krikštolaitis, R. 2018. Public Perception of Energy Security in Lithuania: Between Material Interest and
Energy Independence. The Journal of Baltic Studies 49(1): 157-175. https://doi.org/10.1080/01629778.2018.1446033
Leonavičius, V., Genys, D. 2017. Energy Security Sociology. Kaunas, Lithuania: Vytautas Magnus University, Kaunas. (in Lithuanian).
INSIGHTS INTO REGIONAL DEVELOPMENT
ISSN 2669-0195 (online) http://jssidoi.org/jesi/
2020 Volume 2 Number 4 (December)
http://doi.org/10.9770/IRD.2020.2.4(2)
763
Marris, C., Langford, I., Saunderson, T., O’Riordan, T. 1997. Exploring the “psychometric paradigm”: comparisons between aggregate and
individual analyses. Risk Analysis 17(3): 303-12. https://doi.org/10.1111/j.1539-6924.1997.tb00868.x.
Molis, A. 2011. Construction of Ostrovets Nuclear Power Plant: Whom to Trust and What to Expect? Energy Security Highlights. 74-76.
Novikau, A. 2016. Nuclear power debate and public opinion in Belarus: From Chernobyl to Ostrovets. Public Understanding of Science 5:
1-14. https://doi.org/10.1177/0963662516647242.
NEA, OECD. 2010. Public Attitudes to Nuclear Power. Report (NEA No. 6859). Retrieved from https://www.oecd-
nea.org/ndd/reports/2010/nea6859-public-attitudes.pdf
Pidgeon, N. F., Lorenzoni, I., Poortinga, W. 2008. Climate change or nuclear power – no thanks! A quantitative study of public perceptions
and risk framing in Britain. Global Environmental Change 18(1): 69-85. https://doi.org/10.1016/j.gloenvcha.2007.09.005.
Pidgeon, N. F., Kasperson, R., Slovic, P. 2003. The Social Amplification of Risk. Cambridge: Cambridge University Press.
Poortinga, W., Aoyagi, M., Pidgeon, F. N. 2013. Public perceptions of climate change and energy futures before and after the Fukushima
accident: A comparison between Britain and Japan. Energy Policy 62: 1204–1211. https://doi.org/10.1016/j.enpol.2013.08.015.
Poortinga, W., Pidgeon, N. F., Lorenzoni, I. 2006. Public perceptions of nuclear power, climate change and energy options in Britain:
Summary findings of a survey conducted during October and November 2005. Tyndall Centre for Climate Change Research. School of
Environmental Sciences. University of East Anglia. Retrieved from https://sp.ukdataservice.ac.uk/doc/5357/mrdoc/pdf/5357userguide.pdf
Siegrist, M., Sütterlin, B., Keller, C. 2014. Why have some people changed their attitudes toward nuclear power after the accident in
Fukushima? Energy Polic. 69: 356-363. https://doi.org/10.1016/j.enpol.2014.02.026.
Scott, A., 2005. Risk Society or Angst Society? Two Views of Risk, Consciousness and Community, in Adam, B., Beck, U., van Loon, J.,
(Eds.), The Risk Society and Beyond: Critical Issues for Social Theory. London: Sage Publications, 33–46.
Sjöberg, L., Moen, B.-E., Rundmo, T., 2004. Explaining risk perception. An evaluation of the psychometric paradigm in risk perception
research, Rotunde, Trondheim, Norway. Retrieved from http://www.svt.ntnu.no/psy/Torbjorn.Rundmo/Psychometric_paradigm.pdf
Slovic, P. 1996. Perception of risk from radiation. Radiation Protection Dosimetry 68:(3-4), 165–180.
https://doi.org/10.1093/oxfordjournals.rpd.a031860
Slovic, P. 1987. Perception of Risk. Science 236(4799): 280-285. https://doi.org/10.1126/science.3563507.
Slovic, P., Fischhoff, B., Lichtenstein, S. 1986. The Psychometric Study of Risk Perception, in Covello, V.T., Menkes, J., Mumpower, J.,
(Eds.). Risk Evaluation and Management. Contemporary Issues in Risk Analysis, vol 1. Springer, Boston, MA.3–24.
https://doi.org/10.1007/978-1-4613-2103-3_1.
Tvaronavičienė, M., Nesterova, K., Kováčik, V. 2017. Energy security and long-term energy efficiency: case of selected counties. Journal
of Security and Sustainability Issues 7(2): 349-357. https://doi.org/10.9770/jssi.2017.7.2(14)
Wagner, A., Grobelski, T., Harembski, M. 2016. Is energy policy a public issue? Nuclear power in Poland and implications for energy
transitions in Central and East Europe. Energy Research & Social Science 13: 158–169. https://doi.org/10.1016/j.erss.2015.12.010.

INSIGHTS INTO REGIONAL DEVELOPMENT
ISSN 2669-0195 (online) http://jssidoi.org/jesi/
2020 Volume 2 Number 4 (December)
http://doi.org/10.9770/IRD.2020.2.4(2)
764
Dainius GENYS, Doctor Sociology, researcher at Energy Security Research Center in Vytautas Magnus University, Kaunas, Lithuania.
Research interests: energy security, public perception analysis, democratization studies.
Author ID: 54950162900
ORCID ID: https://orcid.org/0000-0003-1224-0127
Ričardas KRIKŠTOLAITIS, Doctor Mathematics, Professor of Department of Mathematics and Statistics at Vytautas Magnus
University, Kaunas, Lithuania. Research interests: energy security, risk and reliability analysis, statistical data analysis.
ORCID ID: https://orcid.org/0000-0001-9556-4121
Copyright © 2020 by author(s) and VsI Entrepreneurship and Sustainability Center
This work is licensed under the Creative Commons Attribution International License (CC BY).
http://creativecommons.org/licenses/by/4.0/
INSIGHTS INTO REGIONAL DEVELOPMENT
ISSN 2669-0195 (online) http://jssidoi.org/IRD/
2020 Volume 2 Number 4 (December)
http://doi.org/10.9770/IRD.2020.2.4(2)
Publisher http://jssidoi.org/esc/home
750
BOARD DIRECTOR REPUTATION CAPITAL AND FINANCIAL PERFORMANCE OF LISTED
FIRMS IN NIGERIA
Peter Ehizokhale Okpamen 1, Sunday Oseiweh Ogbeide 2*
1 Department of Accounting and Finance, Faculty of Humanities, Social & Management Sciences, Elizade University,
Ilara-Mokin, P.M.B. 002, Ondo State, Nigeria
2 Department of Business Administration, Faculty of Management Sciences, Ambrose Alli University, Ekpoma, Edo State,
Nigeria
E-mail: [email protected] (Corresponding author)
Abstract. This study examined the impact of board director reputation capital on financial performance of listed firms in Nigeria. The
population of the study consists of all the listed non- financial firms in Nigeria. A sample of fifty (50) firms was selected and data were
collected over the period 2007 to 2018. Descriptive statistics and system general method of moment estimation methods were used to
undertake the data analysis. Findings reveal that board director reputational capital exerted a positive and significant impact on financial
performance of the firms. Board size and firm size were negative on firm financial performance in the reference period. The study
concludes that board reputational capital is a significant driver of corporate financial performance in Nigeria irrespective of the size of the
board. Based on the empirical findings, it is recommended that there is need for regulators to design a framework to efficiently and
effectively monitor the reputation of executive board directors and managers in firms. This will assist to check mate agency costs,
demonstration of opportunistic behavior capable of destroying the firm value, There is need for firms to encourage adequate interlocking
members who have diverse professional training, high social net worth and experience (experience hypothesis) to positively influence
effective management and financial performance of listed firms in Nigeria.
Key words: board reputational capital; board size; firm size; financial performance; Nigeria
Reference to this paper should be made as follows: Okpamen, H., & Ogbeide, S.O. (2020). Board director reputation capital and financial
performance of listed firms in Nigeria. Insights into Regional Development, 2(4).
JEL Classifications: M41 and M42 https://www.aeaweb.org/econlit/jelCodes.php?view=jel
1. Introduction
Performance of a firm is of utmost concern to shareholders and stakeholders generally. The performance of firms
may be classified into firm and market based performance. Firm performance is a reflection of the effective
expense management and strategies of the directors and their reputation. Firm financial performance is often
captured with return on equity, return on assets, among others. Firm performance precedes market based
performance. Market based performance captures the performance of firm in the market place.

INSIGHTS INTO REGIONAL DEVELOPMENT
ISSN 2669-0195 (online) http://jssidoi.org/jesi/
2020 Volume 2 Number 4 (December)
http://doi.org/10.9770/IRD.2020.2.4(2)
751
Market based financial performance is more often a signal in the market regarding how well a company is doing.
It often reflects in earnings per share, price earnings ratio, stock price, dividend per share, Tobin Q and others.
Performance indicates the efficient management of a firm, assuring the resource owners of return on investment,
increase in the market value and enhances the growth of the industry (Naser & Mokhtar, 2004; Kaguri, 2013).
Both firm and market based financial performance indicators are aspects of serious concern in fundamental
analysis in finance domain. However, empirical finance and accounting researches often requires proxies for
variables of interest with outright justification. Despite this, proxies need to be chosen carefully since
inappropriate proxies could cause a hypothesis to be spuriously rejected or accepted.
Board directors are saddled with the responsibility of managing the resources of the owners – shareholders. They
are expected to demonstrate competence, professionalism and integrity in the discharge of their assigned onerous
duties to maximize the wealth of the shareholders and satisfy interest of other stakeholders in the business
environments. One of the fundamental factors usually considered when appointing a director in a firm board,
besides level of education, financial skills and years of experience is integrity. Integrity is necessary at
effectuating fiduciary duty by board members. Integrity is a social intangible capital which has spiral positive
effects in the firm. In the light of dynamism in corporate world, integrity on the part of board of directors may be
regarded as a reputational capital. To protect their own reputational capital, board of directors do ensure
adherence to quality accounting information disclosure, ethical standards and also demand for optimal
performance with a view to attaining the goal of maximizing the wealth of the shareholders and other stakeholders
at large (Fredriksson, Kiran & Niemi, 2018). With increase in reputational capital by board directors, there is the
likelihood for optimal performance demanded by them. Board directors are sometimes vehement at demanding
for additional external assurance on financial statements if they are skewed at protecting their reputational capital.
One of the attributes expected from board directors by shareholders and stakeholders is a good reputation. A
potential investor do take into consideration the reputation of a firm and its directors before taking investment
decision. Stakeholder such as suppliers might restrict credit lines if the board directors are perceived to have a bad
financial reputation. Thus, the reputational capital of board of directors is a mirror image of the core values of a
firm which has consequential spiral effects. Board director reputation is fundamental to the effective, efficient
management and success of a firm. It is the hub upon which minimization of agency costs hinge on in a firm.
Through it, directors avoid the tendency to engage in rent extraction and thereby enhance the firm market value. A
good reputation may be regarded as a social intangible capital to a company. The ability of board directors to
enhance firm performance is largely dependent on the reputation they have. In today’s corporate world, reputation
of directors is one of the main value-drivers of corporate performance and it is an essential intangible asset
affecting financial outcomes of firms worldwide (Velte, 2017).
Given the prevailing economic factors adversely affecting businesses globally and in the emerging market of
Nigeria in specific, it is difficult for firms to may thrive successfully and operate optimalyy without reputational
capital of directors in placed. Alan Greenspun (2001) cited in Klewes and Wreschniok (2009) surmise that
overtime and in the past two decades, reputation has become the most important corporate value expected of
directors by shareholders and other stakeholders to promote the operational and financial performance of
companies. In the expression of Cao, Myers and Omer (2012), concern for reputation capital makes board
directors to behave ethically in a way and manner that is in the interest of shareholders and other stakeholders.
Reputational capital of board directors boosts their sense of responsibility as well as their specialized knowledge
which in turn enhances their professional judgment about the operational and financial performances of firms (Du
et al. 2017).
The collapse of firms such as Enron WorldCom(US), Parmalat, (Italy), Nortel, (Canada), Onetel (Australia),
Lehman Brother and Merrill Lynch, American International Group (AIG), Oceanic and Intercontinental banks
(Nigeria) may not be unconnected with board directors’ questionable reputation. In the year 2009 in Nigeria for
instance, the erstwhile Governor of the Central Bank of Nigeria, Mr. Sanusi Lamido Sanusi identified banks like

INSIGHTS INTO REGIONAL DEVELOPMENT
ISSN 2669-0195 (online) http://jssidoi.org/jesi/
2020 Volume 2 Number 4 (December)
http://doi.org/10.9770/IRD.2020.2.4(2)
752
Union Bank PLC, Oceanic Bank PLC and others to be in a near state of insolvency. The unhealthy development
was farther from ineffectiveness and non- adherence to ethical values of the affected firms.
Reputation of board of directors mainly consists of managerial reputation which may translates to product
reputation and financial reputation of a firm. Managerial reputation is often associated with adherence to ethics
and professionalism in the day-to- day systematic management of firms by executive directors. Product
reputational capital which primarily concerns with the satisfaction derived by consumers of a firm’s product is a
function of board directors’ reputation and core values. It also concerns how board directors actually follow the
legal and structural processes leading to the production of the final product brought into the market place for sales
and usage. Financial reputational capital of directors is about prudent handling of finances of the company gear
towards the satisfaction of the resources owners. If directors amass wealth for themselves through higher
remuneration and engagement in rent seeking, their financial reputational capital may be at stake. All things
being equal, the higher the reputational capital of board of directors, better is the improvement in the overall
operating and financial performances of a firm. While board director reputational capital are theoretically
explored in literature, the empirical verifiability in the context of Nigeria is lacking.
The association between board director reputation capital and firms’ financial performance has been relatively
investigated in developed countries (e.g, Larcker & Richardson, 2007; Jackson, 2015, Fich & Shivdasani, 2007;
Francis, Huang, Rajhopal & Ziang, 2008; Fredriksson, Kiran & Niemi, 2018). The researches (e.g Ingley and
Walt, 2003; Nierderkofler (2019) on the effect of board director reputation on firm performance in developed
markets are inconclusive. The research of Nierderkofler (2019) mainly focuses on corporate reputation and its
translation to performance of firms. This study takes a departure from it to verify the relationship between board
director reputational capital and the financial performance of listed companies in Nigeria. Similarly, apart from
the theoretical juxtaposition of Iwu-Egwuonwu (2011) on the connectivity between corporate reputation and
organization performance in Nigeria, no studies in the context of the emerging market of Nigeria to the best of our
knowledge which have empirically determine impact of board director reputation capital contributes on firm
financial performance, hence this study is undertaken with a view to contributing to the debate. albeit, the
empirical assessment of the impact of board director reputational capital towards firms financial performance in
emerging market of Nigeria is yet to attract researchers’ attention considerably.
2. Literature Review
2.1 Theoretical Framework
This study relies on ethical theory to examine the link between board director reputational capital and firm
financial performance. Ethics with finding agreement, disagreement and judgments regarding right or wrong,
good or bad, virtue or vice and states of affairs of a system (Booth et al., 2005). An ethical theory offers a set of
related ideas that identify how individuals ought to live or how an organization should be coordinated ethically
(Thiroux & Krasemann, 2009). The theory suggests that an action can only be right if and only if it ratifies the
principle of utility like dependence of right of action on its consequences. Ethical theory posits that individual in
performing their duties must learn the importance of telling the truth, acting on the fairest way possible and also
be able to ensure all promises are kept (Alzeban, 2018). Ethical theory implies that the different actors who are
entrusted with the strategic management of a firm are less likely to engage in unethical behaviour to obtain
financial rewards (Rose, 2015). The thrust of shareholders committing their investment resources into the hands
of board directors is primarily hinged on ethical stance.
Using the ethical theory, reputational capital of board director are supposed to influence a firm financial
performance and quality financial reporting. It requires adherence to ethical standards by corporate board director
mechanisms to influence the operational performance and ensuring compliance with the accounting standards for
quality financial reporting and performance disclosure. So, adherence to ethical behaviour portrays that managers

INSIGHTS INTO REGIONAL DEVELOPMENT
ISSN 2669-0195 (online) http://jssidoi.org/jesi/
2020 Volume 2 Number 4 (December)
http://doi.org/10.9770/IRD.2020.2.4(2)
753
conscientiously manage the resources of the shareholders, report every business activities in the day to day
management of a company. Ethics in corporate governance is very much inclined in the organization’s goals and
framework. This varies depending on the organization since there are cases that an organization is closed or
limited only to some investors in maintaining control of the ownership. Nonetheless this should not be an issue if
there are no unethical decisions being made by those in charge of decision-making conferring to (Hasnan,
Rahman, & Mahenthiran, 2013). This study holds the view that ethical theory connects board director reputational
capital and financial performance of listed firms.
2.2 Empirical Review
Good reputation is an enduring asset to a firm in these days of corporate dynamism. Researchers over the years
have continued to express concern on the need for reputation adherence by board directors in firms. Iwu-
Egwuonwu (2011) avers that for ages, the view that corporate reputation positively impacts on firm performance
has been recorded. The author stresses further that accounting and finance literature support the idea that
corporate reputation brings a large wealth which often is embedded in a firm goodwill. Iwu-Egwuonwu (2011)
opines that some conventional wisdoms point that the reputation firms orchestrate, do bring about sustainable
profits always. Reputation is an intangible asset and it is currently being researched as a source of sustainable
advantages and performance in corporate organizations. In today’s corporate world, what is being refers to as
brand equity is in essence the corporate reputation (Iwu-Egwuonwu, 2011). On the empirical front, Nguyen,
Locke and Reddy (2017) sought to investigate if human capital of board directors adds value to firm in Asian
market. The dynamic system generalized method of moments (system GMM) estimator was employed to analyze
the panel data-set consisting of 315 firm- year observation over a four- year period from 2008 to 2011. The
findings indicate that board director reputational capital have positive influence upon the firms’ financial
performance in Vietnam. James and Roh (2015) in a study titled: revisiting corporate reputation and firm
performance link report that corporate reputations are significant and positive drivers of corporate performance
measures.
Ingley and Walt (2003) found no causal relationship between corporate reputation and financial performance.
This may be due to weaknesses in the existing measure of reputation, or due to unobserved variability in the
intervening variable of managerial exploitation of the reputation. Nierderkofler (2019) research shows that
corporate reputation has a strong positive association with operating performance indicators, viz-a-viz sales
growth and profit margins. Similarly, the research fails to reveal any evidence of a significant correlation between
corporate reputation and operating performances and operating expenses or salaries expenses. It can be observed
that the research of Nierderkofler (2019) mainly focuses on corporate reputation. This study takes a departure
from it to verify the relationship between board of director reputational capital and the financial performance of
listed companies in Nigeria. This study hypothesis that board director does not have significant effect on firm
financial performance in Nigeria.
3. Methodology
Since this study examines the impact of board director reputational capital on firm financial performance, this
causal-research is employed. Fifty (50) listed non- financial firms were selected using the simple random
sampling technique in the period 2007 to 2018. This represents six hundred firm- annual observation. Descriptive
statistics and two step system general method of moment (SGMM2) were employed to analyze the data. The
second step system general method of moment (SGMM2) unlike the first and second steps differenced GMM,
explicitly provides consistent estimates even if endogeneity, heteroscedasticity and serial correlation problems
occur in the analysis (Alhad et al. 2018). IT gives more efficient results than difference GMM even with
unbalanced panel data since it employs more instruments and consists of both level and first difference regression
(Roodman, 2009). Second step System GMM takes care of endogeneity problems and fixed effects in addition to
the fact it removes dynamic panel bias (Nickell, 1981 as cited in Dahir et al., 2018). Additionally, second step

INSIGHTS INTO REGIONAL DEVELOPMENT
ISSN 2669-0195 (online) http://jssidoi.org/jesi/
2020 Volume 2 Number 4 (December)
http://doi.org/10.9770/IRD.2020.2.4(2)
754
system GMM is preferred and appropriate with small times series data. Diagnostic tests were used to determine
the BLUE (best, linear, unbiased estimate) of the properties of the model. The model used is in the study is as
follow:
1
Where,
return on equity of firm in period;; Board direction reputational capital of firm in
period; Board size of firm in period and = consists of firm size;
Individual firm in the sample size; Period the study covers; Error term acting as a surrogate in the
models and Intercept.
Table 1. Procedures used to measure the variables
S/N Variables Type of
Variables
Measurements Sources
1. Financial
Performance
Dependent
variable
Return on Equity (ROE) Sawir (2005)
2. Return on equity
(ROE)
Dependent
variable
Measured using natural logarithm of profit after tax over equity,
expressed in percentage.
Sawir (2005)
3. Board Director Reputational
Capital
Independent
Variable
Measured as the total compensation directors earn from their
directorships.
Fredriksson et al.,
2018
4. Board Size Independent
Variable
Measured as total logarithm of total board size
5. Firm Size Independent
Variable
Natural logarithm of total Assets
Procedures used to measure the variables are presented in table 1 above.
4. Empirical Results and Discussion
The empirical result in this sub- section starts with summary statistics, diagnostics tests results and the baseline
second step system general method of moment (SGMM2) on the variables of the study. The second step system
general method of moment (SGMM2) is employed to analyze the direct effect of board director reputational
capital on the sampled firms’ financial performance.
4.1 Descriptive statistics and multicollinearity test
This part reports the descriptive statistics and multicollinearity test results of the variables in the dynamic panel
regression model. Table 2 concerns the test of multicollinearity among the explanatory variables. The average
variance inflation factor (VIF) of 3.640 is less than 10 and thus indicates absence of multicollinearity among the
independent variables in the model.
Table 2. Variance Inflation Factor Test (VIF)
Variable U/VIF VIF
BODRC 16.996 1.067
BSIZE 1.066 1.041
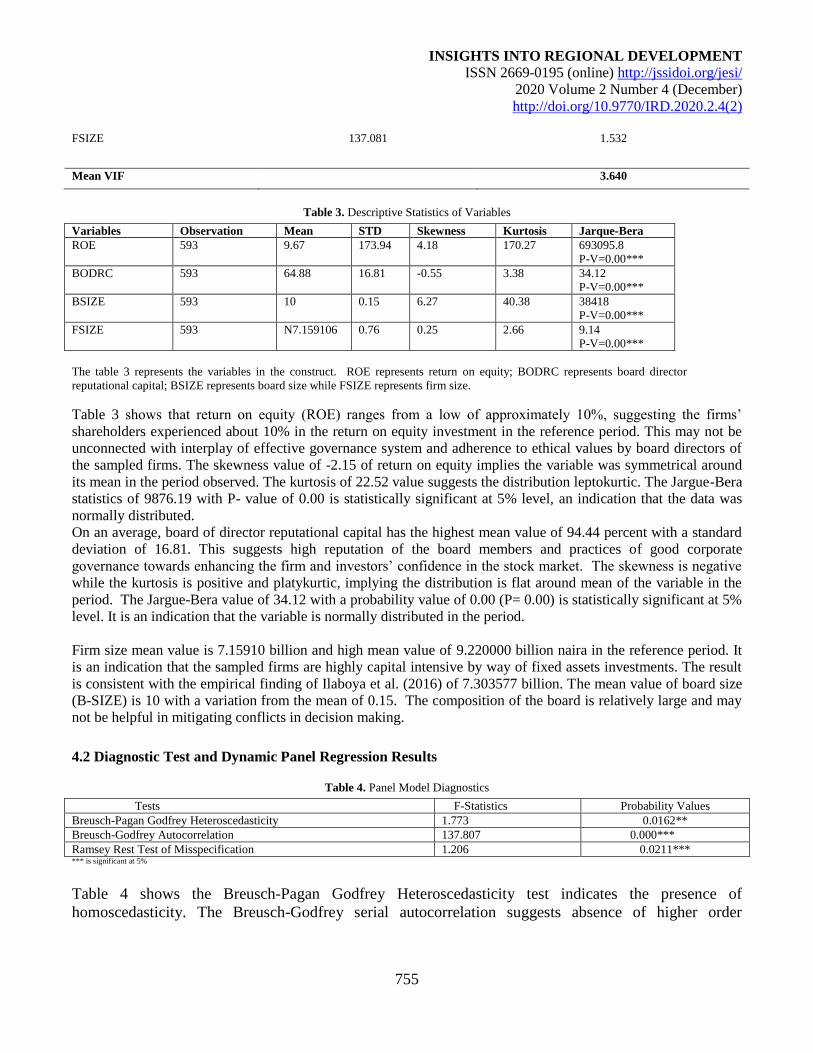
INSIGHTS INTO REGIONAL DEVELOPMENT
ISSN 2669-0195 (online) http://jssidoi.org/jesi/
2020 Volume 2 Number 4 (December)
http://doi.org/10.9770/IRD.2020.2.4(2)
755
FSIZE 137.081 1.532
Mean VIF 3.640
Table 3. Descriptive Statistics of Variables
Variables Observation Mean STD Skewness Kurtosis Jarque-Bera
ROE 593 9.67 173.94 4.18 170.27 693095.8
P-V=0.00***
BODRC 593 64.88 16.81 -0.55 3.38 34.12
P-V=0.00***
BSIZE 593 10 0.15 6.27 40.38 38418
P-V=0.00***
FSIZE 593 N7.159106 0.76 0.25 2.66 9.14
P-V=0.00***
The table 3 represents the variables in the construct. ROE represents return on equity; BODRC represents board director
reputational capital; BSIZE represents board size while FSIZE represents firm size.
Table 3 shows that return on equity (ROE) ranges from a low of approximately 10%, suggesting the firms’
shareholders experienced about 10% in the return on equity investment in the reference period. This may not be
unconnected with interplay of effective governance system and adherence to ethical values by board directors of
the sampled firms. The skewness value of -2.15 of return on equity implies the variable was symmetrical around
its mean in the period observed. The kurtosis of 22.52 value suggests the distribution leptokurtic. The Jargue-Bera
statistics of 9876.19 with P- value of 0.00 is statistically significant at 5% level, an indication that the data was
normally distributed.
On an average, board of director reputational capital has the highest mean value of 94.44 percent with a standard
deviation of 16.81. This suggests high reputation of the board members and practices of good corporate
governance towards enhancing the firm and investors’ confidence in the stock market. The skewness is negative
while the kurtosis is positive and platykurtic, implying the distribution is flat around mean of the variable in the
period. The Jargue-Bera value of 34.12 with a probability value of 0.00 (P= 0.00) is statistically significant at 5%
level. It is an indication that the variable is normally distributed in the period.
Firm size mean value is 7.15910 billion and high mean value of 9.220000 billion naira in the reference period. It
is an indication that the sampled firms are highly capital intensive by way of fixed assets investments. The result
is consistent with the empirical finding of Ilaboya et al. (2016) of 7.303577 billion. The mean value of board size
(B-SIZE) is 10 with a variation from the mean of 0.15. The composition of the board is relatively large and may
not be helpful in mitigating conflicts in decision making.
4.2 Diagnostic Test and Dynamic Panel Regression Results
Table 4. Panel Model Diagnostics
Tests F-Statistics Probability Values
Breusch-Pagan Godfrey Heteroscedasticity 1.773 0.0162**
Breusch-Godfrey Autocorrelation 137.807 0.000***
Ramsey Rest Test of Misspecification 1.206 0.0211*** *** is significant at 5%
Table 4 shows the Breusch-Pagan Godfrey Heteroscedasticity test indicates the presence of
homoscedasticity. The Breusch-Godfrey serial autocorrelation suggests absence of higher order

INSIGHTS INTO REGIONAL DEVELOPMENT
ISSN 2669-0195 (online) http://jssidoi.org/jesi/
2020 Volume 2 Number 4 (December)
http://doi.org/10.9770/IRD.2020.2.4(2)
756
autocorrelation. The Ramsey Reset Test of misspecification result shows the dynamic panel model was
correctly specified and provides evidence of non- linearity.
Table 5. Board Director Reputational Capital and Return on Equity (ROE)
(1) (2) (3) (4)
POLS FE PDLS SGMM
BODRC 0.06* 0.21* 0.00*** 0.06***
[0.14] [0.34] [0.00] [0.04]
BSIZE -21.07* -1.35*** -23.02* -21.07***
[0.66] [0.00] [0.19] [0.22]
FSIZE 0.60* 20.49*** 2.65*** 0.60***
[0.95] [0.05] [0.05] [0.96]
C 10.37* 151.00* - 10.37*
[0.90] [0.56] - [0.93]
ROE(-1) 0.81***
[0.00]
R-Squared 0.64 0.78 0.60 0.83
Adjusted R-Square 0.58 0.69 0.52 0.76
F-Statistics 2.47 21.89 - -
Prob (F-Stat) 0.00*** 0.00*** - -
Durbin-Watson Stat 1.83 2.01 2.07
J-Statistics and P-Value 9.35 (0.00)***
The table represents the variables in the construct. ROE represents return on equity; BODRC represents board
director reputational capital; BSIZE represents board size; FSIZE; represents firm size and values in parenthesis
are t-statistical values; * p < 0.1, ** p < 0.05, *** p < 0.01.
The result of system GMM (SGMM) in Column (4), indicates that the coefficient value of the returns on equity
(ROE) is positive and statistically significant at 95% level. It is suggestive that a period lag of return on equity
(ROE) influences financial performance of firms in Nigeria.
Board director reputational capital (BODRC) is positive and has a significant coefficient value of 6%. The finding
suggests board director reputational capital is a key driver of financial performance of firms and shareholders
wealth maximization in Nigeria. As board director reputational mechanism increases, financial performance
increases also, holding other factors constant. The result agrees with the findings of Du et al. (2017) and
Fredriksson et al., (2018) that to protect their own reputational capital, board directors do ensure adherence to
quality accounting information disclosure, ethical standards and also demands for optimal performance with a
view to attaining the goal of maximizing the wealth of the shareholders and other stakeholders at large.
Board size has negative coefficient value of 21.07 on return on equity (ROE) of the firms. The finding is
suggestive that a relatively large board size engenders conflicts in decision making and may hampers financial
performance of firms. The finding correlates with Igbinosa and Ogbeide (2016); Darmadi (2013) which reported a
negative and insignificant impact of board size on financial performance in firms. Firm size is positive and
insignificant on the firm performance in the reference period.
5. Conclusion and Recommendations
The effect of board reputational capital on firms in the light of global economic challenges cannot be
overemphasized. It presumably takes a center stage in the management of the affairs of firms generally. Albeit,
the incessant collapse of firms and corporate scandals after the reports of statutory auditors in the emerging
market like Nigeria precipitated the need to empirically examine the nexus between reputations of board directors
as a capital and financial performance of listed firms in the context of Nigeria.
The study concludes that board reputational capital is a significant driver of corporate financial performance in
Nigeria irrespective of the size of the board. Based on the empirical findings, it is recommended that there is need
INSIGHTS INTO REGIONAL DEVELOPMENT
ISSN 2669-0195 (online) http://jssidoi.org/jesi/
2020 Volume 2 Number 4 (December)
http://doi.org/10.9770/IRD.2020.2.4(2)
757
for regulators to design a framework to efficiently and effectively monitor the reputation of executive board
directors and managers in firms. This will assist to check mate agency costs, demonstration of opportunistic
behavior capable of destroying the firm value, There is need for firms to encourage adequate interlocking
members who have diverse professional training, high social net worth and experience (experience hypothesis) to
positively influence effective management and financial performance of listed firms in Nigeria.
References:
Carter, D.A., D’souza, F., Simkins, B.J., & Simpson, W.G. (2010). The gender and ethnic diversity of U.S boards and boards committees
and firm financial performance. Corporate: An International Review, 18(5), 398-414.
Darmadi, S. (2013). Do women in top management affect firm performance? Evidence from Indonesia. The International Journal of
Business in Society, 13(3), 288-304. http://dx.dox/10.1108/GG-12-2010-0096.
Du, X., Jian, W., & Lai, S. (2017). Do foreign directors mitigate earnings management? Evidence from China. International Journal of
Accounting, 30(40), 1 – 36.
Eagly, A. H. (1987). Sex differences in social behavior: A social-role interpretation. Hillsdale, NJ: Lawrence Erlbaum.
Eagly, A. H., & Johnson, B. T. (1990). Gender and leadership style: A meta analysis. Psychological Bulletin, 108, 233-256.
Fredriksson, A., Kiran, A., & Niemii, L. (2018). Reputation capital of directorships and audit quality. M.Sc thesis presented in Turuku
School of Economics, Aalto University School of Business.
Geletkanycz, M.A., & Boyd, B.K. (2011). CEO outside directorship and firm performance: a reconciliation of agency and embeddness
views. Academy of Management Journal. 54, 335-354.
Igbinosa, S.O., & Ogbeide, S.O. (2015). Corporate board diversity and stock price performance: Evidence from Nigeria. Journal of
Business & Value Creation, 4(1), 98-116.
Ilaboya, O.J., Obasi, R & Izevbekhai, M.O (2016). Firm level characteristics and effective tax rate. ICAN academic conference
proceedings, 573-593.
Ingley, C., & Walt, N. (2003). Do board processes influence director and board performance? Statutory and performance implications.
Corporate Governance: An international Review, 13, 632-653.
Iwu-Egwuonwu, R.C. (2011). Corporate reputation and firm performance: empirical literature evidence. International Journal of Business
and Management, 6(4), 197-206.
Klewes, A., & Wreschnick, W. (2009). The effect of IFRS on earnings management in Brazilian non financial public companies. Emerging
Markets Review, 21, 42 – 66. http://dx.dox/10.1016/j.ememar.2009.07.009
Marimuthu, M., & Koladasamy, L. (2009). Ethnic and gender diversity in board of directors and their relevance to financial performance of
Malaysian Companies. Journal of Sustainable Development, 2(3), 139-148.
Nierderkofler, T. (2019). Reputational Capital and operating performance. A press media approach. Free University of Bolzano, Italy.
Oyeleke, O.E.O., Erin. O., & Emeni, F. (2016). Female directors and tax aggressiveness of listed banks in Nigeria. 3rdInternational
conference on African development issues covenant university press, 293-299.
Sarkar, D., & Sarkar, J. (2009). Meta-analytic review of board composition, leadership structure, and financial performance. Strategic
Management Journal, 19, 269-290.

INSIGHTS INTO REGIONAL DEVELOPMENT
ISSN 2669-0195 (online) http://jssidoi.org/jesi/
2020 Volume 2 Number 4 (December)
http://doi.org/10.9770/IRD.2020.2.4(2)
758
Sawir, A. (2005). Analisis Kinerja Keuangan dan Perencanaan Keuangan Perusahaan. Jakarta: Penerbit Gramedia Pustaka Utama.
Velte, P. (2017). Do women on boards of directors have an impact on corporate governance quality and firm performance? A literature
review. International Journal of Sustainable Strategic Management, 5(4), 302-346. 10.1504/IJSSM.2017.10010121
Dr. Peter Ehizokhale OKPAMEN is a Senior Academic in the Department of Business Administatrion, Faculty of Management Sciences,
Ambrose Alli University, Ekpoma; Edo State, Nigeria. He holds the Bachelor of Science (B.Sc) degree in mathematics, postgraduate
diploma in computer science and Master of Business Administration (MBA) from the University of Benin, Master of Science (M.Sc) in
Advanced Information Technology, London and Doctor of Philosophy (PhD Management) from the Enugu State University of Technology
(ESUT). Master of Science (M.Sc.) degree in Businss Administration and Doctor of Philosophy (Ph.D. Management) degree from
Ambrose. His area of specliazation include Business Management and Entrepreneurship Development. ORCID ID: https://orcid.org/0000-0002-2710-9431
Dr. Sunday Oseiweh OGBEIDE is an Active Researcher in, and Lecturer of Finance in the Department of Accunting and Finance,
Faculty of Humanities, Social & Management Sciences, Elizade University, P.M. B. 002, Ilara-mokin, Ondo State, Nigeria. He holds the
Bachelor of Science (B.Sc) degree in Accounting, Master of Science (M.Sc. Finance) degree and Doctor of Philosophy (Ph.D. Finance)
degree from the prestigious University of Benin, Edo State, Nigeria. There are over 12000 reads of his articles by researcher all over the
world. His area of specliazation include Standard Finance and Behaviuoral Finance.
ORCID ID: https://orcid.org/0000-0002-2818-7757
Register for an ORCID ID:
https://orcid.org/register
Copyright © 2020 by author(s) and VsI Entrepreneurship and Sustainability Center
This work is licensed under the Creative Commons Attribution International License (CC BY).
http://creativecommons.org/licenses/by/4.0/

INSIGHTS INTO REGIONAL DEVELOPMENT
ISSN 2669-0195 (online) http://jssidoi.org/IRD/
2020 Volume 2 Number 4 (December)
http://doi.org/10.9770/IRD.2020.2.4(4)
Publisher http://jssidoi.org/esc/home
774
STRATEGIES TO MANAGE THE RISKS FACED BY CONSUMERS IN DEVELOPING E-
COMMERCE
Kiran Javaria ¹, Omar Masood ², Fernando Garcia 3
1, 2, School of Accountancy and Finance, University of Lahore, Islamabad, Pakistan 3Department of Economics and Social Sciences, Universitat Politecnica de Valencia, Valencia, Spain
E-mails:1 [email protected]; [email protected]; [email protected]
Received 18 July 2020; accepted 25 September 2020; published 30 December 2020
Abstract. The study investigates the management of risk in E- Commerce and what different barriers are faced by consumers during an
uncertain and risky situation. The study utilizes both primary and secondary data in order to get reliable results. There are different risk
factors that affect the purchasing behaviour of consumers who shop online. The consumer’s perception of risk may be the result of all the
emotional processes through which consumers recognize, organize and provide meaning to sensations received, such as the need for
product quality, safety online and overall satisfaction. The primary data consists of a survey of online shoppers. The research data and
questionnaire was administered to 972 internet users who are classed as experienced and avid users. The secondary data includes an
analysis of the various theories of consumer behaviour, models of online adoption, risk factors to marketing and shopping online, models of
the adoption of innovation and new ways of marketing and trade. Both techniques are utilized that would examine the relationship between
perceived risk strategies and customer satisfaction as well as examined the customer involvement and propensity to take risk on existing
relation of online shopping.
Keywords: E-commerce; risk management; financial manager; perceived risk strategies; customer satisfaction; customer involvement;
propensity to take risk
Reference to this paper should be made as follows: Javaria, K., Masood, O., Garcia, F. 2020. Strategies to manage the risks faced by
consumers in developing e-commerce. Insights into Regional Development, 2(4), 774-783. http://doi.org/10.9770/IRD.2020.2.4(4)
JEL Classifications: G32, Z33, M31
1. Introduction
In today’s competitive environment, technology is the most efficient means through which organization
communicate, keep themselves in touch with market and gained competitive advantage. E-Commerce shopping
or buying through internet is one of the rapid growing phenomenon (Lim, Osman. et al, 2016). It is important for
the E-retailers to maintain customer repurchase intention and sustain operations in order to gain competitive
advantage in the market (Darsono et al. 2019). In an e-Commerce world it is important for the service provider to

INSIGHTS INTO REGIONAL DEVELOPMENT
ISSN 2669-0195 (online) http://jssidoi.org/jesi/
2020 Volume 2 Number 4 (December)
http://doi.org/10.9770/IRD.2020.2.4(4)
775
engage with customers and provide them security from all the risks faced by online consumers. Kim & Hong
(2010) and Cunningham et al (2005) examined the impact on the adoption of the purchase through the Internet
and have outlined them as: financial risk, functional, social and physical environment, incorporating the fifth
dimension of this specific sales system, the risk of privacy. Kim et al (2005) contrasts the opposite effect, by
detecting a significant effect of dimensions of risk on purchase intention via the Internet but not their attitudes
toward such behaviour. Based on the work of Gierl et al (2003) analyzed the effect of six dimensions of perceived
risk on the adoption of electronic commerce. In particular, these authors refer to functional components, financial,
time, psychological, and social and privacy arguing that the latter replaces the physical risk in electronic
environment. The Empirical evidence supports the influence gained in all dimensions, except social intention of
adoption of electronic commerce (Bianchi & Mathews, 2016).
The main motivation of this research is that it strongly contributes to the lack of available research materials on
marketing risk. Despite the quantity of published studies on the subject, including several reviews (Mitchell et al,
1990; Laroche et al., 2004), most of research in this area focuses on the perception of risk in relation to categories
of products, disregarding the means to purchase and customer satisfaction. The present study provides major
contribution in e commerce technology world. The aims of this research is to study the concept of risk in
marketing in e-commerce world as there is currently insufficient research studies on the concept despite its critical
importance in influencing the behaviour of consumers. The analysis of risk has been a field without boundaries in
academia, it has been investigated in areas such medicine, social sciences, among others (Klein; Sterk, 2003). It is
stated by many researchers that e-commerce shopping is one of the most rapid growing phenomenon’s nowadays
(Lim, Osman. et al, 2016). This area of knowledge has a great influence on theories of marketing, especially in the
analysis of consumer behaviour. The aim of the study is to identify the different theories and dimensions of risks
by consumers as they purchase through e-commerce and analyze the efforts of the consumer, through the
strategies of reducing the risk, in the process of purchase through e-commerce and measure consumer satisfaction
in the process of buying.
This paper is divided into four parts. 2nd part will give the literature review which explains different types of risk
reduction strategies and its impact on customer satisfaction and also supports with theoretical background. 3rd part
demonstrates the research methodology of the paper. 4th part will give empirical analysis and 5th part will finally
conclude with recommendations.
2. Literature Review
2.1. Theoretical Background
The theory “Effort in Purchase” proposed by Laroche et al (2004), it is suggested that the greater the effort of
consumers in a particular purchase, the greater would be the perception of satisfaction with the purchase process.
Thus, the perception of the outcome of the bid would be shaped in accordance with the effort invested (Sobihah et
al, 2015). This theory supports this study and explained that individuals tend to perceive a measure of satisfaction
as a result of efforts expended on the search of an item. It is emphasized that the degree of involvement with the
purchase has an influence on risk perceived by consumers and reduction strategies leading to the perception of
satisfaction with the purchase process. There are many studies conducted on consumer online purchase (McCole
et al., 2010). One consumer purchasing a product in different situations or different products may have a greater
or lesser perception of risks (Park, Bhatnagar & Rao, 2010).

INSIGHTS INTO REGIONAL DEVELOPMENT
ISSN 2669-0195 (online) http://jssidoi.org/jesi/
2020 Volume 2 Number 4 (December)
http://doi.org/10.9770/IRD.2020.2.4(4)
776
2.2. Relationship analysis
2.2.1. Risk in online marketing effect on consumer satisfaction to purchase
Evidence supporting the influence of risk on the behaviour of consumers who shop online has been highlighted by
numerous authors in the field. The attitude of online buyers significantly and positively affects customer
satisfaction and their online purchasing behaviour. Internet-based transactions, management of consumers' risk is
very important. Sobihah et al, (2015) analyzed the effect of uncertainty about the product (risk functional) and the
shipping process (source of risk) on the adoption of trade. For its part, the empirical evidence obtained by Lim
(2003) observed that the guarantees of privacy positively affect the confidence in purchasing on the Web, and
through its intended behaviour (Choi, Kim & Kim, 2011). There are various types of risk which are defined
respectively:
Financial Risk: Pires et al (2004) states that financial risk has been employed in studies that relates to the loss of
economic capital by the consumer, or by purchase and / or use of the product or service purchased. It is the risk
that the product is not worth the cost (Schiffman; Kanuk, 1997), and a broader definition, the financial risk is at
any risk related to loss of property and money (Solomon, 1998).
Risk of Performance and functional: Bateson and Hoffman (2001) explain that, the concept that the product or
service purchased may not correspond to the task for which it was purchased. The risk functional, or performance,
is risk that the product does not have the expected performance. It can be mitigate through customer satisfaction
(Sobihah et al, 2015).
Physical Risk: The physical risk is associated with lack of physical tangibility of the products before purchase
(Solomon, 1998), especially since some products are dangerous to health or security and, when they fail, can lead
to physical danger (Weber et al, 2004).
Risk of time: The risk of time was defined as the possibility of a purchase that is likely to be prolonged without
getting the expected benefits or lack of motivation on the product as a result of a time lapse, associated with the
inefficient use of time caused by the product (Son & Han, 2011).
2.2.2. Risk Mitigation Strategies in online electronic commerce:
There are various strategies which organization can use to minimize the risk of online electronic commerce (Lim,
Osman. et al, 2016). These strategies are given below:
Online Networking: A strategy to reduce the risk perceived by the search for information can be minimized
through online networking sites which lots of consumers subscribe to where information is shared on product
reviews, (Kim, 2005). The benefit of this is that the network provides reviews of customers around the world,
quickly and without cost online, (Kuo et al., 2013).
Search for online reviewers and rating system: In a study conducted by Wu et al (2004), the results indicate that
major strategies for risk reduction strategies with regards to high product ratings of the purchase are: firstly the
group of reference (except for products of high perceived risk, which would, in this case, the image of mark),
followed by retailer's reputation, the brand image and guarantees (Lim, Osman. et al, 2016).
2.2.3. The involvement of consumer (as a Moderator):
One of the aspects mentioned in the literature of consumer behaviour is the influence in purchasing decisions and
the individual's involvement with the process, product, and brand (Solomon, 2002). The consumer’s involvement
is defined as the perceived relevance of an individual on an object based on their needs, values and interests
(Ranaweera, 2016). Corroborating with this idea, Engel et al. (1995) comments that this involvement increases
when the social pressure is perceived, i.e. the extent to which consumers feel they will be judged by an

INSIGHTS INTO REGIONAL DEVELOPMENT
ISSN 2669-0195 (online) http://jssidoi.org/jesi/
2020 Volume 2 Number 4 (December)
http://doi.org/10.9770/IRD.2020.2.4(4)
777
acquisition, involvement tends to be higher (Sobihah et al, 2015). The involvement can be seen as the motivation
to process information in that, to where there is a connection between the perceived needs, goals or values of and
knowledge of consumer product, the individual will be motivated to pay attention in information about this (Mou,
Shin, Cohen. 2015).
2.2.4. The propensity to take risk (as a Moderator)
The propensity to take risks is an individual characteristic as stated by Engel et al (1995) who states, there are
segments of consumer who love to take risks, or risk hunters or thrill seekers. Another finding from the survey
suggests that that the risk takers were quite prevalent among young people, ranging from 16 to 24 years, with
declining age (Mercado & Rajagopal, 2015). Thus, the search of sensations is a characteristic of personality,
related to diverse experiences, new and complex and their willingness to accept risks for experiencing them. In
choosing the Internet as a channel for the acquisition, the searches for sensations influence these decisions
(Mercado & Rajagopal, 2015).
2.2.5. Customer satisfaction as way to reduce customer risk
The satisfaction of the consumer is considered one of the central themes of the concept of marketing. Companies
now back up, increasingly, for the client and the majority this includes, indeed, the need to satisfy the consumer,
especially due to more fierce competition in the market (Sobihah et al, 2015). Satisfaction is considered the
largest output of the marketing activity and serves as a liaison between the process of purchasing and
consumption, which culminates with the phenomena of post-purchase, such as a change of attitude, repeat
purchase and brand loyalty (Mercado & Rajagopal, 2015). Thus, the satisfaction of the consumer has been seen as
a crucial factor for the success of organizations by directly influence behaviours such as brand loyalty, announced
positive mouth to mouth, repeat purchases, and, consequently, greater market share and profitability (Oliver,
1997) (Sobihah et al, 2015). Theoretical framework is presented in Figure 1 below.
Figure 1: Theoretical framework
Hypotheses Development:
H1: The risk reduction strategies have significant and positive impact on customer satisfaction in e-commerce
H1a: The Perceived Risk strategies have significant and positive impact on customer satisfaction in e-commerce
H1b: The Price Risk strategies have significant and positive impact on customer satisfaction in e-commerce
H1c: The Product Risk strategies have significant and positive impact on customer satisfaction in e-commerce
H1d: The Privacy Risk strategies have significant and positive impact on customer satisfaction in e-commerce
H1e: The Time Risk strategies have significant and positive impact on customer satisfaction in e-commerce
Risk Strategies
Perceived Risk security
Price Risk Security
Product Risk Security
Privacy Risk Security
Customer Satisfaction
Dependent Variable Independent Variable
Customer Involvement
Moderator
Propensity to take risk
Moderator

INSIGHTS INTO REGIONAL DEVELOPMENT
ISSN 2669-0195 (online) http://jssidoi.org/jesi/
2020 Volume 2 Number 4 (December)
http://doi.org/10.9770/IRD.2020.2.4(4)
778
H2: The involvement moderate the relationship between risk reduction strategies and customer satisfaction in e-commerce
H2a: The involvement moderate the relationship between Perceived Risk strategies and customer satisfaction in e-commerce
H2b: The involvement moderate the relationship between Price Risk strategies and customer satisfaction in e-commerce
H2c: The involvement moderate the relationship between Product Risk strategies and customer satisfaction in e-commerce
H2d: The involvement moderate the relationship between Privacy Risk strategies and customer satisfaction in e-commerce
H2e: The involvement moderate the relationship between Time Risk strategies and customer satisfaction in e-commerce
H3: The propensity to take risk moderate the relationship between risk reduction strategies and customer satisfaction in e-
commerce
H3a: The propensity to take risk moderate the relationship between Perceived Risk strategies and customer satisfaction in e-commerce
H3b: The propensity to take risk moderate the relationship between Price Risk strategies and customer satisfaction in e-commerce
H3c: The propensity to take risk moderate the relationship between Product Risk strategies and customer satisfaction in e-commerce
H3d: The propensity to take risk moderate the relationship between Privacy Risk strategies and customer satisfaction in e-commerce
H3e: The propensity to take risk moderate the relationship between Time Risk strategies and customer satisfaction in e-commerce
3. Research Methodology
Present research methodology used quantitative based approach and study utilized triangulation method for data
collection. In triangulation method researcher used different data source to validate the results. In this study
researcher utilized three methods which includes: Primary data collection and interviews from online shoppers of
Pakistan and also used Secondary data collection (Theoretical Support).Primary data consist of a survey of online
shoppers. The data collection instrument of this phase was a semi-structured script. Questionnaires and interviews
are administered to a sample segment of the population of consumers who shop online from different online
website in Pakistan (like OLX, daraz.pk, Alibaba etc). The question for online website was an open ended
questionnaire. The secondary data included a literature review from the main academic research portals which
includes an analysis of the various theories of consumer behaviour, models of online adoption. The research data
and questionnaire was administered to 972 internet users who are classed as experienced and avid users. Their
pattern of usage includes: A 38% daily, 52% regularly and 10% rarely. Of those surveyed, 79% have already
purchased online. Based on the sample evidence, 5 of 7 risk women faced a greater risk than men in the form of
online harassment. 35% of those interviewed have suffered some kind of harassment while internet chatting. For
each risk criterion, women have a perception of risk far greater than men for all risks, except the security risk
where there is no difference between the sexes. In all the risk factors considered, age was also an important
distinguishing factor, so at the age is higher than the perceived risk is strong. In a first phase, the questionnaire
was tested with a dozen people. This pre-test allowed us to change the wording of some questions or statements.
Thereafter, 2 modes of distributions have been made. First researcher used pilot testing for questionnaire
validation and then distributed 1000 questionnaire among responded. 972 respondents filled the questionnaire, so
the response rate was 97%. Researcher utilized three means of sources for present research validation. First
researcher used secondary data in which theories and literature were used to support the results then researcher
utilized survey method in which questionnaire and interviews were conducted from customers. Questionnaires
were distrusted among the respondent and as mentioned above the response rate was 97%. Other source was
interview with 20 customers who were internet users and frequently utilized internet tool for their online shopping
from different online website in Pakistan (like OLX, daraz.pk, Alibaba etc). So basically researcher used
triangulation technique in order to analyze the present research data set.
4.Empirical Analysis
4.1. Validation and Robustness of Regression Model
Validity of present study shows that findings truly represent the present study phenomena. Study finds out Eign
value which is 0.566 and it is less than 1. (Eign value <1) shows that data is valid in nature. Percentage of
variance should be less than 50% and present study percentage of variance is less than fifty. F statistics of at least
3.95 is needed to accept alternative hypothesis. Present study model F statistics value is 96.23 shows overall

INSIGHTS INTO REGIONAL DEVELOPMENT
ISSN 2669-0195 (online) http://jssidoi.org/jesi/
2020 Volume 2 Number 4 (December)
http://doi.org/10.9770/IRD.2020.2.4(4)
779
significance of regression model. Present study utilized model of risk management strategies and their impact on
customer satisfaction is overall significant.
4.2. Correlation Analysis (see Table 1) Table 1: Correlation Analysis of Variables
Variables M SD PerR PriR ProR PrivR TR PTR CI CS
Perceived Risk
Security
1.946 0.667 1
Price Risk Security 2.157 0.786 0.687* 1
Product Risk Security 1.916 0.634 0.711* 0.636* 1
Privacy Risk Security 2.017 0.670 0.698* 0.654* 0.759* 1
Time Risk Security 2.199 0.946 0.493* 0.406* 0.536* 0.477* 1
Propensity to take
Risk
1.846 0.567 0.741* 0.627* 0.722* 0.556* 0.759* 1
Customer
Involvement
2.167 0.886 0.721* 0.788* 0.536* 0.453* 0.666* 0.677* 1
Customer
Satisfaction
2.116 0.544 0.546* 0.646* 0.697* 0.755* 0.456* 0.731* 0.435* 1
Description: Correlation and descriptive analysis are one of the important analysis technique used to determine
the association among independent and dependent variables and it also explains that how much one variable
depends on other variable. In present study, correlation analysis shows that all variable correlation value lies
within range (CA < 0.80) so it is stated that all variable acts independently and can use for further analysis.
4.3. Regression Analysis:
After determining relationship between variables through correlation, regression analysis is used to assess the
cause and effect relationship between dependent and independent variable. It determines that how much change in
dependent variable is caused by independent variables. Below mention regression model equations which are used
by researcher for present study.
4.3.1. Equation for Customer Involvement Interaction Term Customer Satisfaction = α + β1 (Perceived Risk Security) + β2 (Customer Involvement) + β3 (Interaction PerR_CI) + e
Customer Satisfaction = α + β1 (Price Risk Security) + β2 (Customer Involvement) + β3 (Interaction PerR_CI) + e
Customer Satisfaction = α + β1 (Product Risk Security) + β2 (Customer Involvement) + β3 (Interaction ProR_CI) + e
Customer Satisfaction = α + β1 (Privacy Risk Security) + β2 (Customer Involvement) + β3 (Interaction PrivR_CI) + e
Customer Satisfaction = α + β1 (Time Risk Security) + β2 (Customer Involvement) + β3 (Interaction TR_CI) + e
4.3.2. Equation for Propensity to take Risk Interaction Term Customer Satisfaction = α + β1 (Perceived Risk Security) + β2 (Propensity to take Risk) + β3 (Interaction PerR_PTR) + e
Customer Satisfaction = α + β1 (Price Risk Security) + β2 (Propensity to take Risk) + β3 (Interaction PerR_PTR) + e
Customer Satisfaction = α + β1 (Product Risk Security) + β2 (Propensity to take Risk) + β3 (Interaction ProR_PTR) + e
Customer Satisfaction = α + β1 (Privacy Risk Security) + β2 (Propensity to take Risk) + β3 (Interaction PrivR_PTR) + e
Customer Satisfaction = α + β1 (Time Risk Security) + β2 (Propensity to take Risk) + β3 (Interaction TR_PTR) + e
In this equation, ‘e’ is the error term that measures influence of variables other than independent variables (see Table 2).

INSIGHTS INTO REGIONAL DEVELOPMENT
ISSN 2669-0195 (online) http://jssidoi.org/jesi/
2020 Volume 2 Number 4 (December)
http://doi.org/10.9770/IRD.2020.2.4(4)
780
Table 2: Regression Analysis
Un-standardized
Coefficient
Standardized
Coefficient
Variables Beta Beta T Sig VIF
Constant 0.002 0.036 0.024
Z score (PerR) 0.225 0.225 2.662 0.009 3.048
Z score (PriR) 0.192 0.192 2.736 0.007 2.096
Z score (ProR) 0.457 0.457 5.150 0.000 3.352
Z score (PrivR) 0.049 0.049 2.333 0.000 1.721
Z score (TR) 0.236 0.236 2.556 0.003 2.096
Z score (CI) 0.224 0.224 4.323 0.000 3.352
Z score (PTR) 0.344 0.344 0.772 0.000 1.721
InteractionPerR_CI 0.051 0.063 0.698 0.000 3.497
InteractionPri_CI 0.080 0.087 1.109 0.000 2.593
InteractionPro_CI 0.017 0.025 0.298 0.001 2.994
InteractionPriv_CI 0.246 0.226 5.150 0.000 2.096
InteractionTR_CI 0.254 0.244 2.333 0.003 3.352
InteractionPer_PTR 0.090 0.087 2.556 0.000 1.721
InteractionPri_PTR 0.017 0.025 4.323 0.000 2.096
InteractionPro_PTR 0.226 0.226 0.772 0.002 3.352
InteractionPriv_PTR 0.070 0.087 0.698 0.003 1.721
InteractionTR_PTR 0.087 0.085 1.109 0.000 3.497
Description
Study shows that beta value of all variables shows strong relationship between risk strategies and customer
satisfaction and also shows the moderators impact on present relationship. Results of present study explains that
all relationships are significant in nature as all variables z score P values are less than 0.05 which shows that
hypothesis H1a, H1b, H1c, H1d and H1e are accepted and perceived price, products, privacy and time risk
securities have significant impact on customer satisfaction. Interaction terms of customer involvement and
Propensity to take Risk are also significant which shows that hypothesis H2 and H3 all dimensions are accepted.
Customer involvement and Propensity to take Risk significantly influence the relationship between risk strategies
and customer satisfaction.
4.4. Interviews Interpretation
Another data source was interviews which were conducted from 20 customers who were internet users and
frequently utilized internet tool for their online shopping. Interview was conducted to a sample segment of the
population of consumers who shop online from different online website in Pakistan (like OLX, daraz.pk, Alibaba
etc). There was open choice for consumer to select any website during their interview. The basic purpose was to
check their customer satisfaction and how it was affected by different risk strategies. Results of interviews show
that:
There was a consensus from 70% of the respondents of the dangers of online shopping with tales of woes from
the respondents from lists of stolen card numbers. The reason cited by users for to not shop online is the fear of
online payment. (Perceived Risk). 77% of the respondents interviewed, stated that laptops and other very
expensive items was what constituted the risk of the product, but there was much lower risk to the product on
account of very low quality e.g. a book and were less apprehensive to price risk (Price Risk). 55% of the
respondents affirmed greater risk to the product on account of very low quality. (Product Risk). For 85% of the
respondents interviewed had recorded negative outcomes with regards to security risk. The respondents stressed
on the difference in safety with a physical store. 35% of those interviewed have suffered some kind of harassment
while internet chatting. (Privacy Risk). 59% of the respondents cited their instances of wasted time on the internet

INSIGHTS INTO REGIONAL DEVELOPMENT
ISSN 2669-0195 (online) http://jssidoi.org/jesi/
2020 Volume 2 Number 4 (December)
http://doi.org/10.9770/IRD.2020.2.4(4)
781
spent comparing products between different sites and spends more time in this type of search on a single site.
(Time Risk). (See Table 3).
Table 3: Summary of Result
Hypotheses Results P- value Reason of
rejection
H1a: The Perceived Risk strategies have significant and positive
impact on customer satisfaction in e-commerce
Accepted 0.009 Significant
H1b: The Price Risk strategies have significant and positive
impact on customer satisfaction in e-commerce
Accepted 0.007 Significant
H1c: The Product Risk strategies have significant and positive
impact on customer satisfaction in e-commerce
Accepted 0.000 Significant
H1d: The Privacy Risk strategies have significant and positive
impact on customer satisfaction in e-commerce
Accepted 0.000 Significant
H1e: The Time Risk strategies have significant and positive
impact on customer satisfaction in e-commerce
Accepted 0.003 Significant
H2a: The involvement moderate the relationship between
Perceived Risk strategies and customer satisfaction in e-commerce
H2b: The involvement moderate the relationship between Price
Risk strategies and customer satisfaction in e-commerce
Accepted
Accepted
0.000
0.000
Significant
Significant
H2c: The involvement moderate the relationship between Product
Risk strategies and customer satisfaction in e-commerce
Accepted 0.001 Significant
H2d: The involvement moderate the relationship between Privacy
Risk strategies and customer satisfaction in e-commerce
Accepted 0.000 Significant
H2e: The involvement moderate the relationship between Time
Risk strategies and customer satisfaction in e-commerce
Accepted 0.003 Significant
H3a: The propensity to take risk moderate the relationship
between Perceived Risk strategies and customer satisfaction in e-
commerce
Accepted 0.000 Significant
H3b: The propensity to take risk moderate the relationship
between Price Risk strategies and customer satisfaction in e-
commerce
Accepted 0.000 Significant
H3c: The propensity to take risk moderate the relationship
between Product Risk strategies and customer satisfaction in e-
commerce
Accepted 0.002 Significant
H3d: The propensity to take risk moderate the relationship
between Privacy Risk strategies and customer satisfaction in e-
commerce
Accepted 0.003 Significant
H3e: The propensity to take risk moderate the relationship
between Time Risk strategies and customer satisfaction in e-
commerce
Accepted 0.000 Significant
5. Conclusions
Theories exist to discuss the theory of perceived risk, but no theory deals with questions of change in the
perceived risk while using the Internet. The development of assumptions of this study's questionnaire, tours
around five risks dimensions in electronic commerce. These dimensions were indicative of a change in Internet
user’s perceptions. Thus, we realized that what the characteristics of risk influence on customer purchase
perception are. Customer satisfaction is one of the major factors studied by current research. The study represents
different risk strategies which organizations should understand and provide security to their customers so that
they get more involved with online services and encourage propensity to take risk which leads toward customer
satisfaction and their repeat purchases. In each risk situation it is revealed that the purchase of a book is
significantly higher than buying a laptop. This would mean that if transaction is less risky for customer, they
don’t want to share their credit card number and their personal information online. This is because of the risk are

INSIGHTS INTO REGIONAL DEVELOPMENT
ISSN 2669-0195 (online) http://jssidoi.org/jesi/
2020 Volume 2 Number 4 (December)
http://doi.org/10.9770/IRD.2020.2.4(4)
782
less cautious during their online transactions. Indeed, risks related to learning (lost time) and consumption
patterns (product risk and intimacy) are based on customer satisfaction. If customers are satisfied with their
internet transactions, they graduly become risk takers. The present study examined the impact of risk taking
strategies which involved perceived, product, price, privacy and time risk security and investigated these
strategies' influence on customer satisfaction. The study explained that these strategies (confidentiality, time
security, no visual distortion of product) taken by organizations have major influence on customer satisfaction
and this relationship is influenced by customer involvement and their propensity to take risk variables. Many
sites provide clear information on safety, but more than half do not provide this information clearly and in a way
that is sufficiently accessible. It is therefore imperative for merchants and retailers on the web to review the
usability of their sites to put forward safety tools that would be visible to all users such as signs and labels and
certifications. It is important for the organizations to build their security systems and provide the customers a
good experience and a less risky online environment so that the more they get involved with the product the more
they will be satisfied and repurchase it. Future studies should include more risk dimensions and also should
increase the study sample which will be helpful to increase the generalizability of study.
References
Ariff, M.S.M, Sylvester, M., Zakuan N, Ismail, K. & Ali, K.M. (2014). Consumer Perceived Risk, Attitude and Online Shopping
Behaviour; Empirical Evidence from Malaysia, IOP Conference Series: Materials Science And Engineering
Bateson, John E. G. & Hoffman, K. Douglas. (2001). Marketing Service: Bookman.
Bianchi & Mathews. (2016). Internet Marketing and Export Market Growth in Chile. Journal of Business Research 69, 426-434.
Choi, H., Kim, Y. & Kim, J. (2011). Driving Factors of Post Adoption Behavior in Mobile Data Services. Journal of Business Research,
64(11), 1212-1227.
Cunningham, L.F., Gerlach, J.H., Harper, M.D., & Young, C.E. (2005). Perceived Risk and the Consumer Buying Process: Internet Airline
Reservations. International Journal of Service Industry Management, 16(4), 357-372.
Darsono, J.T., Susana, E., Prihantono, E. Y., Kasim, E.S. 2019. Strategic policies for small and medium businesses in marketing through e-
commerce. Entrepreneurship and Sustainability Issues, 7(2), 1230-1245. http://doi.org/10.9770/jesi.2019.7.2(30)
Engel, James F., Blackwell, Roger D. & Miniard, Paul W. (1995). Consumer Behaviour. 8. Ed. Orlando: The Dryden Press. 951 p.
Bibliography: p. 441 - 442.
Gierl, H., Hammer, C. (2003). Fear of Loss of Anonymity on the Internet and Consumers' Reactions: An Empirical Investigation.
Yearbook of Marketing and Consumer Research, 1, 89-106.
Kim, E., Hong, T. (2010). Segmentating Customers in Online Stores from Factors That Affect the Customer's Intention to Purchase, pp.
383-388
Kim, L.H., Kim, D.J., & Leong, J.K. (2005). The Effect Of Perceived Risk On Purchase Intention In Purchasing Airline Tickets Online,
Journal Of Hospitality & Leisure Marketing, 13(2), 33-53.
Klein, H. E. & Sterk, E.C. (2003). “At Risk” Women Who Think That They Have No Chance Of Getting Hiv: Self-Assessed Perceived
Risks. Woman and Health, 38(2), 47-63.
Kovacs, M. & Farias, H. (2002). Perceived Risks and Ways to Purchase: The Duality versus Internet Consumers Online. Journal of
Economics and Management, 1(2), April / June
Kuo Y F, Hu T L., & Yang, S. C. (2013). Effects of Inertia and Satisfaction in Female Online Shoppers on Repeat-Purchase Intention.
Managing Service Quality: An International Journal, 168-187.
Laroche, M., Bergeron, J. & Goutaland, C. (2004). How Intangibility Affects Perceived Risk: The Moderating Role Of Knowledge And
Involvement. The Journal of Services Marketing, 17(2/3), 122-141.
Lim, N. (2003). Consumer Perceived Risk: Sources Versus Consequences, Electronic Consumer Research And Applications, 2, 216-28.
Lim,, Y. J, Osman,. A, Salahuddin,, S.N, Romle A. R, & Abdullah. S. (2016). Factors Influencing Online Shopping Behavior: The
Mediating Role of Purchase Intention, Procedia Economics and Finance, 32, 401- 410.
Mccole, P., Ramsey, E. & Williams, J. (2010). Trust Considerations On Attitudes Towards Online Purchasing: The Moderating Effect of
Privacy and Security Concerns, Journal of Business Research, 63(9/10), 1018-24.
Mercado & Rajagopal. (2015). Driving Consumers toward Online Retailing Technology: Analyzing Myths and Realities. Journal of
Transnational Management, 20, 155-171.
Mitchell, V.-W. (1998). A Role for Consumer Risk Perceptions in Grocery Retailing. British Food Journal, 4, 171-183.
Mitchell, V.-W. & Greatorex, M. (1990). Consumer Purchasing In Foreign Countries: The Perceived Risk Perspective. International
Journal of Advertising, 9(4), 295-307.
Mou, Shin & Cohen. (2015). Trust and Risk in Consumer Acceptance of E-Services. Electronic Commerce Research, 17, 255-288.
https://doi.org/10.1007/s10660-015-9205-4

INSIGHTS INTO REGIONAL DEVELOPMENT
ISSN 2669-0195 (online) http://jssidoi.org/jesi/
2020 Volume 2 Number 4 (December)
http://doi.org/10.9770/IRD.2020.2.4(4)
783
Oliver, Richard L. (1997) Satisfaction: A Behavioural Perspective On The Consumer. New York: Mcgraw-Hill Company.
Park, I., Bhatnagar, A. & Rao, H.R. (2010). Assurance Seals, On-Line Customer Satisfaction, and Repurchase Intention, International
Journal of Electronic Commerce, 14(3), 11-34.
Ranaweera. (2016). Perspective of Trust towards E-Government Initiatives in Sri Lanka. Springerplus 5. https://doi.org/10.1186/s40064-
015-1650-y
Santos, J. (2002). From Intangibility To Tangibility On Service Quality Perceptions: A Comparison Study Between Consumers And
Service Providers In Four Service Industries, Managing Service Quality, 12(5), 292-302.
Schhiffman J.B., & Kanuk. L. L. (1997). Consumer Behavior Published By Prentice Hall Sixth Edition, 446p.
Sobihah, M., Mohamad, M., Ali, N.A.M, & Ismail, W.Z.W. (2015), E-Commerce Service Quality on Customer Satisfaction, Belief and
Loyalty: A Proposal, Mediterranean Journal of Social Sciences, Vol. 2
Solomon. (2002). The Consumer Behaviour: Buying, Having Being. 5 Ed. Porto Alegre: Bookman, 446p. Bibliography: p.216-217
Solomon, Michael R. (1998). Consumer Behaviour: Buying, Having and Being. 4. Ed. New Jersey: Prentice Hall. 640 p: p.280-281
Son, M. & Han, K. (2011). Beyond The Technology Adoption: Technology Readiness Effects on Post-Adoption Behavior, Journal of
Business Research, 64(11), 1178-82.
Wu, George, Jiao, Z., & Richard. G. (2004). Decision under Risk, In Blackwell Handbook of Judgment and Decision Making, Nigel
Harvey & Derek Koehler, Eds. London: Blackwell Publishing.
Zeithaml, V.A., & Bitner, M.J. (2003). Services Marketing: Integrating Customer Focus across the Firm, 3rd Ed., Mcgraw-Hill, New York,
Ny.
Kiran JAVARIA is Lead Learning Advisor of OM International Learning Partner Asia-e-University, Malaysia. She is also Lecturer at
School of Accountancy and Finance, University of Lahore, Islamabad Campus, Pakistan. Her specialization is in finance, Islamic banking
and research based topics. Her PhD is in Islamic Banking & Finance from Asia e University, Kuala Lumpur, Malaysia. She has authored
several research papers which have been published in some leading international journals and presented at conferences. Her recent
publications are in international journals i.e. “Problems and Perspectives in Management” and “Global Advanced Research Journals”. Her
recent publications have been highly recommended and cited globally.
ORCID ID: http://orcid.org/0000-0002-6147-5283
Prof. Dr. Omar MASOOD (PhD UK) is CEO OM International Learning Partner Asia-e-University, Malaysia. He is also Professor at
School of Accountancy and Finance, University of Lahore Islamabad, Pakistan. He is former Director of the Centre of Islamic Banking and
Finance at the Royal Docks Business School, University of East London, United Kingdom. He had worked with financial advisors like
Goldman Sachs. He is a lead advisor and trainer in the area of Islamic banking and finance worldwide, to financial as well as academic
institutions. He is a founding member of Research Centers in Malaysia. Dr. Masood supervises PhD dissertations in the areas of banking,
finance, corporate financial management, risk management, fund management, banking regulations, Islamic banking, international business
and other finance, accounting and management related subjects, with a number of successful completions. He holds visiting professorships
in universities all over the world, and has served as an advisor/consultant to a number of governments including the Turkish and Saudi
Arabian. Dr. Masood has authored over a hundred peer reviewed research papers which have been published in international journals and
presented at conferences. A number of his papers have been listed as highly recommended and most read by leading publishers. He has also
authored a number of books, including the bestselling “Truth about the Global Financial Crisis” and the text book “Multiplying Money
through Financial Management”.
ORCID ID: http://orcid.org/0000-0001-5481-4032
Fernando GARCÍA: Department of Economics and Social Sciences, Universitat Politecnica de Valencia, Valencia, Spain.
ORCID ID: http://orcid.org/0000-0001-6364-520X
Make your research more visible, join the Twitter account of INSIGHTS INTO REGIONAL DEVELOPMENT:
@IntoInsights
Copyright © 2020 by author(s) and VsI Entrepreneurship and Sustainability Center
This work is licensed under the Creative Commons Attribution International License (CC BY).
http://creativecommons.org/licenses/by/4.0/

INSIGHTS INTO REGIONAL DEVELOPMENT
ISSN 2669-0195 (online) http://jssidoi.org/IRD/
2020 Volume 2 Number 4 (December)
http://doi.org/10.9770/IRD.2020.2.4(5)
Publisher http://jssidoi.org/esc/home
784
TOWARDS AN ONTOLOGICAL REASON LAW IN ECONOMICS: PRINCIPLES AND
FOUNDATIONS
Francesco Vigliarolo 1,2,3
1Catholics University of La Plata, Argentina, Street 25, between 47 and 48 streets, CP 1900, La Plata, Argentina
2Chair free Economics system and Human Rights, National University of La Plata, Argentina 3Centre Study of Sociology of work, Economics Faculty, UBA, Argentina
E-mail: [email protected]
Received 15 May 2020; accepted 10 October 2020; published 30 December 2020
Abstract. The objective of this article is to propose what can be called a law of ontological reason in economics as opposed to the law of
supply and demand. To do this, it uses a phenomenological approach that interprets economics in terms of primary ideas. To this end, it's
defined the ontological reason and the space in which it is built in order to introduce the concept of demand of rights and not of
consumption. In this context, the relationship that underlies an ontological reason which presupposes a different behavior from that of the
law of supply and demand is then described. According to this approach, it is claimed that the latter leads to structural problems. It
subordinates the general identity of a country to the interests of individuals, as it focuses on maximizing personal utility that is unrelated to
the creation of the rights of men and women living in a context that contains them in a relational way.
Keywords: economics; ontology; phenomenology; demand for rights
Reference to this paper should be made as follows: Vigliarolo, F. 2020. Towards an ontological reason law in economics: principles and
foundations. Insights into Regional Development, 2(4), 784-801. http://doi.org/10.9770/IRD.2020.2.4(5)
JEL Classifications: A10, N01, P00
Additional disciplines: sociology; phenomenology.
1. Introduction
Why in economics is the law of supply and demand considered the main if not the only existing law that defines
the behavior of economic actors and goods’ value? Is it possible that this law has serious problems in itself, that
is, it does not correctly describe behavior if the objective is the general identity of countries that exists as a
potential ontological dimension that cannot be reduced to a sum of individual interests? Furthermore, why did
mathematical reasoning monopolize the spaces of economic decisions? Why can there be no other motivation to
act, and all of them are based primarily on positivist mathematical logic? And if so, it is possible to get out of this
paradigm that leads to living everything in terms of utility, even the ideas of what is considered important and the

INSIGHTS INTO REGIONAL DEVELOPMENT
ISSN 2669-0195 (online) http://jssidoi.org/jesi/
2020 Volume 2 Number 4 (December)
http://doi.org/10.9770/IRD.2020.2.4(5)
785
same workforce that should have a life in its own and, therefore, a value potentially linked to defining the
ontological elements of a people?
Based on these questions, the paper proposes what we call an ontological reason law in economics. A relation that
tries to describe the possibility of the economic system to achieve the ontological conditions of a community that
cannot be subject to the law of supply and demand because this only explains the maximization of personal utility
in conditions of fluctuations of prices and quantities based on mathematical reasoning.
The analysis is based on the assumptions of economic phenomenology, a branch of phenomenology that studies
economics in the formation of its primary ideas and, therefore, in terms of possible ontological reason, that is
what is considered important for people through the relationship between noesis (intention of the subject) and
noema (object) which is always an idea, a concept to be interpreted (Vigliarolo, 2019). Therefore, the ontological
reason implies a relational dimension that constitutes a potential identity dimension, between people and the
context (natural) and among the same people (social). By definition, it supposes the existence of common values
that cannot be managed as an individual utility dimension based on the law of supply and demand. Before
exposing this, are proposed the basics of economic phenomenology, the process of reducing goods and services
into primary ideas, the presence of the general and particular characteristics that make up ideas as a
presupposition of the union between individual freedoms and general identity, the spaces where these priorities
can be built, that is the meso-economy, where what is called a demand for rights as opposed to that of
consumption is constituted.
2. Economic phenomenology: a theoretical approach for observing the ontological reason of economics
Economic phenomenology is the branch of phenomenology that aims to study the economy in the formation of its
primary ideas, which contribute to the creation of the structure and vision of life of a country, a society, starting
from the pure consciousness that opens up to the world, interpreting the relationship between noesis and noema.
In this direction, it studies the coherence of economic systems with respect to these ideas considered priority in
human consciousness and how these can represent the structures of an ontological reason that allows the
implementation of what we call the Being of societies in the world (Vigliarolo, 2019).
For these reasons, economic phenomenology observes and interprets what we call the possible "ontological
reason" of societies as opposed to utilitarian reason, the result of a positivist vision focused mainly on individual
interest and on the mathematical logic that presupposes an increase in monetary value without limits that leaves
out important questions such as: what kind of world do we want? What is important for our societies?
Starting from this premise, it is proposed that the economy can be understood through a "demand for rights" and
not of consumption, which arises from what is considered important as ontological elements that can potentially
be present in everyone. For example, the use of food implies the idea of eating. We don't have to wait until we are
hungry to incorporate it into social organization, because in our consciousness we already know that it is essential
to live. Therefore, if considered important for everyone, it represents a right or a value because it is necessary for
the whole society. Healthcare facilities, education, etc. The idea of health care, training and so on. Therefore, the
phenomenological approach always observes the social conscience, which is behind the economic system and not
the single individual. All this implies that the rights of men and women living in a society, as phenomenological
aspects of individual and social being, are considered rights when they are considered potentially part of
everyone's identity. This means that some rights, although they are something that arise (as a potential structure)
with people, also depend on the conditions that are installed in society and, first of all, in the economic system to
have their full realization. Without roads or means of transport, our right to travel would be limited. Without a

INSIGHTS INTO REGIONAL DEVELOPMENT
ISSN 2669-0195 (online) http://jssidoi.org/jesi/
2020 Volume 2 Number 4 (December)
http://doi.org/10.9770/IRD.2020.2.4(5)
786
home, our right to have a home and living intimately with our family would not exist. Without manufacturing,
many phenomenological aspects of our way of being, such as sitting, sleeping in a bed, drinking in a glass, etc.
they would be limited and affect our social rights. Without being able to go to school and receive instruction from
teachers, our right to education would also be limited. And so on for many other aspects that can be added and
that are part of what can be called the ontological reason for social life that emerges from the relationship with
materiality and from what men and women who live in a context define as such; which therefore is always a
concept, an idea, which can be interpreted and to which a degree of importance can be given.
General and particular characteristics
These ideas can be defined through general and particular characteristics. Generals are, for example, the idea of
eating, the idea of having a health system, the mobility, the functions that derive from the production of
manufactures, or having a house where living with the family, etc. Particular are the ways in which these ideas are
realized, that is the specific production of goods and services, specific foods, roads, cars, buses, trains, houses,
etc. to implement these general characteristics. That’s allow us to dissociate the economy form the materiality and
affirm that not all that is tangible is real, as positivism asserts.
Therefore, society can define what is important, its vision of life that determines from all the ideas considered
essential, if they are potentially valid for everyone or if they are in conflict with each other; that's what we call
ontological reason. For these reasons, an individual economic action, if it wants to pursue a community
ontological reason, must always tend to build a general vision in which to seek its coherence (as we will see later
with some standard reports). For example, a company is born, lives and always develops in a context made of
relationships with others and with the surrounding environment. It can produce goods that are useful for social
life, it is a source of wages that are needed by families to satisfy their present and future necessities (when they
can save) and refeed the same company again. It is subject to a national and international legal rules within a
political and social order that defines and contains it. It is part of a social and natural context which, if not
respected, will cause serious damage to the community. It is made up of workers with a human and social history
who live in a own biographical dimension. But, first of all, they are bearers of relational ontological needs at a
specific time. If a company acts only according to the law of supply and demand that seeks only commercial
interests, it does not necessarily contribute to the development of an ontological reason. Instead, if it builds a "we"
with the society, strengthens the context and its identity at the same time. Together with other actors, it can
contribute to the creation of a general identity from which potential rights are generated. When all these are linked
together, we call them "relational and constitutive rights" of a country. In other words, they are common values
represented by goods and services as necessary tools of social being that contain an interpretable intention and,
therefore, an intelligibility of the economic system in terms of an ontological reason and not only of maximization
of profits.

INSIGHTS INTO REGIONAL DEVELOPMENT
ISSN 2669-0195 (online) http://jssidoi.org/jesi/
2020 Volume 2 Number 4 (December)
http://doi.org/10.9770/IRD.2020.2.4(5)
787
3. The method of economic reduction in ideas
The observation is based on the interpretation of the intentions that animate the relationships between people and
objects. This intention is part of the formation of the process of knowledge that takes place in each man's own
biographical situation and is intersubjective by definition (Schültz, 1962). This allows us to interpret goods and
services in terms of primary ideas that can thus be interpreted by consciousness giving them a degree of
importance. In this scenario, the economic reduction interprets the social conscience behind the economic system
and allows us to understand if it responds to priorities considered to be such, what we have called ontological
reason.
Then, we can ask ourselves: how can we observe the dimension of social consciousness which animates an
economic system that presupposes individual actions? How to interpret the primary ideas of an economic system
through the intersubjective knowledge and relationship with materiality?
Starting from these questions, we define phenomenological reduction in economics, the transformation of
economic facts into "primary ideas" through the process that leads to its extreme consequences a process, a
relationship through their intention. By intention, we mean the deep motivations of people that arise from
interpreting their life plans, how they live, why they use goods and services, the meaning they give to things and
so on. In Heidegger's terms, who puts the emphasis on Being and ontology, it means describing what he calls the
"structure of everyday life," or "being in the world," and what he defines intentional projects. To understand true
intentionality, it is necessary to define understanding the deep meaning of human experiences in their daily life.
This intentionality is more fundamental and the one that makes directionality possible from scientific knowledge.
In other words, behind the relationship between people and between them and materiality we can reduce the
primary ideas that animate the social essence and determine the thinking structure of economic systems. For
example, the idea of eating, living in a house, studying, the different meanings that arise from the use of
manufactures, etc... If all people may need to have a home, move, education, health, ... at the same time and at a
specific time, if they are not in conflict, they can be considered essential for a society and not for an individual.
Hence, they can be considered values and orient the economic system in terms of being. If these are necessary and
potentially universal, they can also be defined as rights (relational and constitutive rights of a society for a given
historical moment). In this way it is observed whether the real intentions of systems, through relationships, can
coexist and how they depend on the processes and organization of social life. Thus, the reduction of the economy
to ideas presupposes interpreting the experiences of people in their daily lives, that is, what they buy, what they
produce, where they invest, etc. but also what they consider important.
The reduction can be done a priori, simply by interpreting the idea that arises from the intention observed directly
through social relations and with objects (experiences in everyday life); or, a posteriori, by analyzing over time
what the intention actually produces at a general level. The two dimensions (a priori and a posteriori) can be fed
and, since it is impossible to reach the end of time, in the absence of stable or present data, the ideas underlying a
behavior are subjectively brought to extreme consequences in a subjective way. Therefore, a subjective
interpretation of intentionality (economic reduction) is determined with progressive degrees of objectivity; for this
reason, it is stated that economics is a social phenomenon and, as such, it is not an exact science according to
mathematical laws. In fact, the law of supply and demand, which is based on a direct relationship with the
maximization of profit, in its extreme consequences does not allow us to understand what kind of ontological
dimension develops. The noematic dimension cannot be interpreted directly as behavior because the absolute
value of a good or service changes based on fluctuations in quantity. Which ontologically makes no sense, as we
will see below.

INSIGHTS INTO REGIONAL DEVELOPMENT
ISSN 2669-0195 (online) http://jssidoi.org/jesi/
2020 Volume 2 Number 4 (December)
http://doi.org/10.9770/IRD.2020.2.4(5)
788
3.1 Some standard relationships
In the next frameworks are proposed some standard relationships can be observed which allow to interpret the
coherence of the relationships between the economic actors with respect to a shared human and social values,
starting from their intentions toward the relation with the others and goods (see Figure 1).
Complete correspondence between visions and goods based on exchange according to need and reciprocity.
Set of common priorities considered as such by a society
View
Social actor 1
Good
Money
Buy a good contains an idea related a need
(no negatives externalities)
It produces a right according to the vision.
Being is defined
Social actor 2
Money
Good
(no negative externalities)
Satisfy a need
It produces a right according to the vision.
Being is defined
Figure 1. Type of extreme relationship.
The first panel shows that the two actors have an intention that contains a "potentially coherent relationship"
directly interpretable. On the one hand, the action is oriented towards a defined object (it has a direct relationship
between noesis and noema), and both want what the other offers. On the other hand, the intentions do not
contradict each other or with the common space (for example, it has no negative externalities with the
environment) and the ideas behind the goods are not in conflict. In this scenario, the two actors expect the other to
behave according to principles that do not contradict each other and create a common conscience that guides
socio-economic relations, regardless of whether it is a market or a public economic system. We can deduce the
primary ideas that guide the organization of the system and the management of resources that feed the progressive
phases of consciousness in continuous evolution. Progressive levels of consciousness are determined for various
goods and services considered necessary to exercise certain rights. This is why we talk about relational and
constitutive rights, which arise from the relationship with society and constitute it at the same time. This does not
mean that they share the same values, but that priorities do not contradict each other (see Figure 2).

INSIGHTS INTO REGIONAL DEVELOPMENT
ISSN 2669-0195 (online) http://jssidoi.org/jesi/
2020 Volume 2 Number 4 (December)
http://doi.org/10.9770/IRD.2020.2.4(5)
789
Partial correspondence, with the absence of complete common vision and the presence of negative externalities.
Set of common priorities considered as such by a society
View
Social actor 3
Good
Money
Invest in asset
with high negative externalities
or
commercial goods whose use does not produce
something
that satisfies an essential need
Increases a personal interest
by an economics model without limits with the
context
Social actor 4
Money
Good
(no negative externalities)
Satisfy a need
Produces a right if your Being grows according to
the vision (essential and universal)
Figure 2. Typology of extreme relation.
The second panel shows a partial relationship in terms of common vision. For actor 3, money is not used to
directly purchase goods that satisfy needs, so it does not produce, as we have said, an interpretable concept (the
observable ontological dimension is partially lost). Furthermore, it is an accumulation tool that is invested in other
securities and, at the same time, has negative externalities. It can be said that only a fraction of the money will be
used to create an ontological dimension. The remainder is used to augment a system in which neither actor
operates with an observable phenomenological relationship (see Figure 3).

INSIGHTS INTO REGIONAL DEVELOPMENT
ISSN 2669-0195 (online) http://jssidoi.org/jesi/
2020 Volume 2 Number 4 (December)
http://doi.org/10.9770/IRD.2020.2.4(5)
790
Partial correspondence, with no common vision and speculation.
Set of common priorities considered as such by a society
View
Social actor 5
Good
Money
Buy another good
(without negative externalities)
Produces a right if you define your being according
to the (essential) vision
Social actor 6
Money
Good
Sell to make other money
Produces plus value
Accumulate
Invest in the financial markets to accumulate in
stocks
Increase only personal interests through financial
income
Figure 3. Type of extreme relationship
In this third panel, we are also faced with a partial ontological relationship, but for other reasons. An actor uses
the relationship only to improve his personal interests and buys to sell and invest in financial markets without an
observable noematic dimension. Bringing it to its extreme consequences, prices are formed through the laws of
supply and demand on stock exchanges, which remove the value of goods from real production factors because
profit depends on the financial income that is produced and this has different paths from production. There are
speculative phenomena that allow to buy without having the real value of the securities. Then, non-real nominal
values are installed, depending on the monetary fluctuations that allow large capital gains, ultimately unrelated to
real size. This is how the economy becomes financial and nominal, that is, in phenomenological terms, it loses its
ontological observable potential. We could say that this process is one of the standard relationships that
phenomenologically causes the breakdown between society and the economy and, at the same time, the same
systems, because the declared liquidity does not exist. This could also be read as a low level of social awareness
of individuals with respect to the type of social order they are building; in terms of Stiglitz (2010), is due to the
behavior of economic actors (Figure 4).

INSIGHTS INTO REGIONAL DEVELOPMENT
ISSN 2669-0195 (online) http://jssidoi.org/jesi/
2020 Volume 2 Number 4 (December)
http://doi.org/10.9770/IRD.2020.2.4(5)
791
Total lack of correspondence, with absence of common vision and presence of high negative externalities.
Set of common priorities considered as such by a society
View
Social actor 7
Good
Money
Invest in goods
with high negative externalities
or
whose use causes
does not satisfy an essential need
Increase only personal interests without limits with
the context
Social actor 8
Money
Good/Action
Sell to make other money
Produces plus value
Accumulate
Invest in financial markets to accumulate actions
related to sectors with high negative externalities
Increase personal monetary interest with high
negative externalities
Figure 4. Type of extreme relationship
The fourth panel, represents a type of extreme relationship which, according to this observation, offers more
closely for example the causes of the financial crises that we have observed in recent years. The type of
relationship contains an almost definitive loss of phenomenologically observable ontological reason. It represents
a potential situation of global crisis if adequate measures are not taken to protect universal ontological elements
for all. For example, we have some concrete cases such as the health systems in Europe, real production in
developing countries or the presence of goods essential to life such as food in poor countries. Not to mention the
negative externalities of the economic system of the industrial countries, the result of the unlimited exploitation of
resources. All this due to transactions based on the law of supply and demand that transform everything into
monetary interest with no social horizon.
Some structural limits that underlines the law of supply and demand and mathematical reasoning
The law of supply and demand is based on the variation of two variables, quantity and price. It is assumed that if
the quantity of the supply of goods and services decreases, the price value of the same increases. We can have
goods whose value is defined on quantity and price variation, based on behavior, such as Giffens or luxury ones;
values are not defined on the basis of the meaning they have or the function they perform and whether they are
considered important to life. For these reasons they can also be defined all as consumer or commercial goods,
whose main intention is to increase monetary interest (which are the most important microeconomic variables of
classical economy). The first observation is that, in its extreme consequences, this law treats all goods equally, as
if they were all instruments for maximizing the self-interest that ends up being, the increase in monetary gain.
Secondly, relationships between people are reduced to "using" the other to achieve a personal goal and not to
build a relational identity. It distances people from a common social construction.

INSIGHTS INTO REGIONAL DEVELOPMENT
ISSN 2669-0195 (online) http://jssidoi.org/jesi/
2020 Volume 2 Number 4 (December)
http://doi.org/10.9770/IRD.2020.2.4(5)
792
According to the schemes seen above, this law will never allow the economy to have a social behavior oriented
towards the search for goods and services that respond to a relational ontological dimension (common priorities).
It is the market that defines the priorities and value of goods according to fluctuations in quantity and price. So, it
does not allow us to interpret the economy in terms of ontological intelligibility, because in their primary
intention market players tend to maximize monetary values and not produce goods and services that respond to
needs. This produces a society of interests, that is, it transforms passions, vocations, feelings, ... into interests
(Hirschman, 1979) accentuating the separation between ontological reason and the economic system. In case of
special needs or crisis of extreme scarcity of resources, the underlying behavior cannot provide answers because
the relationships, in their extreme consequences, do not meet in common values but only pursue interests.
Below, we propose how to solve this situation and the law of ontological reason that is proposed, on the basis of
other hypotheses and behaviors than those underlying the law of supply and demand. Before doing it, we can say
that from the typed relations seen above, when the economy is guided by relations that do not realize a common
ontological vision, which by definition is relational, it risks imploding because it progressively destroys the real
basis on which society is founded. For these reasons, as we have seen, that depends on the vision of life and
relationships or the social capital that underlies an economic system. In this direction, we propose the concept of
ethical social capital which underlies the law of an ontological reason.
4. Ethical social capital
In order to build an ontological reason, the existence of an ethical social capital is necessary. To understand what
we are referring, we introduce the concept of “social capital”. Starting from the collectivist extreme -using the
terms of Katz and Lazarsfeld (1955)- ended up having an individualistic approach -according to Bourdieu and
neoliberal concepts-, which today can be seen as a resource through which individuals can profit
opportunistically. In fact, generally, this type of capital is defined as the system of relationships that underlie
contemporary capitalist societies. Seen in this way, the meaning of social capital approaches the notion of
“means” according to the theories of the sociology of action; and in the clearly Durkheimian collectivist meaning
it does not differ much from the concept of “dynamic density”, ie the relative weight of the
organizations/networks of a society. All this, however, tells us nothing about the purposes, the intentionality,
pursued by this type of capital. Anyway, it can be bonding, exclusive and working for families and friendly
bonds; or bridging, inclusive and capable of creating bridges to each other. In the first case, we have the families
and group power lobbies or mafia too, as bonding social capital type; in the second case, we do not have
information on common values necessary for a primary socialization. It means, in its extreme consequences, that
everybody can act only based on individual freedom. This, in fact, despite being inclusive, tells us nothing about
the possibly “universal” collective construction with respect to the type of world it tends towards, in the sense of
whether it includes elements that are potentially possible and necessary for everyone’s life. It is in this context
that the concept of ethical social capital is introduced (Vigliarolo, 2011), because it proposes that there needs a
nucleon of common values. In this scenario, when relationships are guided to promote common values and
considered necessary and potentially universal to define an intersubjective identity that surpasses the individual
and contains it at the same time, we can speak of ethical social capital. That is, we can define it as: “The set of
free actions and relationships guided by cultural meanings conceived as values - potentially universal, reciprocal
and necessary - that feed a common identity in which individual freedom and general interest are strongly related
and tend to build an ontological reason that can guide the economy "(Vigliarolo, 2012). In this case, relationships
presuppose a "positive" expectation, defined on the basis that everyone expects that others also have the same
behavior with respect to a core of common values considered necessary for collective life. All this, when
transferred into economics, determines what we call the demand for rights of a population or the whole world. In
continuation, we see how.
INSIGHTS INTO REGIONAL DEVELOPMENT
ISSN 2669-0195 (online) http://jssidoi.org/jesi/
2020 Volume 2 Number 4 (December)
http://doi.org/10.9770/IRD.2020.2.4(5)
793
5. The meso-economy
According to the architecture we proposed, in economy we can define “intentional variables” which relations with
object allow to observe the primaries ideas, in terms of noesis and noema. For example, “investments” when are
directed to “production of good and services” can be interpreted in term of ideas and priorities. On the contrary,
when it’s oriented to other financial variables without relations with productions, lose the human and social
intelligibility. For these reasons, we can define the following as the main intentional variable: investments and
wages deriving from the workforce. Without labor there is no possibility of production. On the other hand, we can
have the secondary ones, such as: savings, interest tax, etc. Because they depend on the former. Every
interpretation needs production, the noematic dimension and the relationship between people. But not all
production is linked to people's rights. For example, we cite a 1980 study by Daly and Cobb which analyzes how
in the 1970s, in the United States, GDP increased and ISEW decreased. This meant fewer rights for people and a
greater concentration of resources in a few people; o an economy that increases production for nominal financial
purposes, remember that 95% of the financial value is not related to goods and services; or the increase of new
poverties due to market dysfunctions and not due to lack of resources. Or the fact that a country can grow with the
arms industry, which means a vision of a life of war that not all people would like. Recalling the standard
relations described above, in other words, we can say that not all economic relations lead to the exercise of rights
and, at the same time, not all financial values can be interpreted. It depends on the ability to direct investments
towards that production whose ideas can be interpreted and considered important for the whole society. To this
end, a social pact is necessary which represents the set of life priorities of a people at a given historical moment.
In economic terms, this pact can be studied and constructed in an intermediate dimension, between the micro and
the macro economy. A space that goes beyond the individual interests of the micro and the positivist
mathematical variables of the macro, such as the public-GDP deficit. This space allows to give intelligibility to
the system that is inspired by common priorities defined subjectively through the interaction of social partners
who carry forward an ethical social capital as ideas/values. It can be called “meso-economics dimension”. It
allows the definition of strategic sectors, giving them a social meaning based on the function they perform for
progressive levels of rights (demand for rights). In other words, it defines the set of values (social, environmental,
etc.) that a country or a society must promote in order to affirm its ontological reason.
It can be made up of social movements, civil society, trade associations, trade unions, companies, organizations,
etc. Which together with the State define strategic priorities starting from the primary ideas that define a demand
for rights to which strategic productive sectors correspond in order to implement it. In this scenario, we can define
the Ontological Strategic Growth Index (OSGI). (See formula below and Table 1)
ICE = values of goods and services related to strategic sectors thought as rights
(it includes related financial values and costs of social and political institutions)
values of total goods and services total
(includes all financial values and costs of social and political institutions)

INSIGHTS INTO REGIONAL DEVELOPMENT
ISSN 2669-0195 (online) http://jssidoi.org/jesi/
2020 Volume 2 Number 4 (December)
http://doi.org/10.9770/IRD.2020.2.4(5)
794
Table 1. Ideas with general and particular characteristics
Economic in “primary ideas”
Generals characteristics (social
pact, meso economy)
Particular characteristics
(individual freedom)
Eventual
conflicts/externalities
The idea of eat Different types of food Environmental and social
impact
The idea of education/Formation Different subjects, topics and
different levels and degrees of
teaching
The idea of moving Different ways and means for moving Environmental and social
impact
The idea of wealth Different services
Different ideas tha correspond to
life functions such as sleeping in a
bad, drinking in a glass, etc.
Different manufactures Environmental and social
impact
The idea of having a home to live
in
Homes, building, … Environmental and social
impact
Etc. Etc. Etc.
6. The law of ontological reason
According to what we said, we can call a “law of ontological reason” the relationship that allows to observe and
describe the functioning of the system in terms of the production of tools (noema), in order to lead to the exercise
of the rights considered as such for a society in a meso-economics dimension (noesis). It depends principally on
the sectors through which the direct intention of the actors can be interpreted, i.e. investment and wages. With the
first, materiality is transformed; with the latter the resources are oriented to satisfy needs, etc. and they represent
the way to feed again production. Using the above method, we can have two types of systems. The first, based on
demand and supply law, that tends to balance through the fluctuations of price and quantity as we exposed; the
second, which tends to balance between production and necessity/priorities. In this case, the prices depend on
production factors and does not increase in case of scarcity of resources, otherwise they lose their social
intelligibility.
In order to understand it, we can expose the following scenario. Suppose that some goods have a price X in a
situation of quantity Q and elastic demand. If the demand for the goods increases, according to the law of supply
and demand, the price increases. This means that the price reduces the purchasing power of families and reduces
their range of access to rights with the same wages. At a certain point, families cannot buy more and companies
keep unsold goods or they can sell them later with different prices that do not respond to the need that arose at a
given moment. The behavior, in this case, only tends to increase the profit of those who sell the goods.
If, on the other hand, the price remains the same, families will buy more goods at the same price and the company
can achieve an economy of scale based on production by also increasing profits. A maximum point is reached
when the profit is related to production and not to price and quantity fluctuations. The behavior responds to the
expansion of an ontological situation and not to the maximization of profit. Furthermore, if the prices do not allow
the maintain the purchase power, in the short time, the company loses profits due to the lack of sale and a
relationship identity is lost.
In the second case, we speak of responsible behavior (or communitarian ethics) according to the social capital that
we have seen, because it allows the two actors to create a "relational right" and maintain a common vision. The

INSIGHTS INTO REGIONAL DEVELOPMENT
ISSN 2669-0195 (online) http://jssidoi.org/jesi/
2020 Volume 2 Number 4 (December)
http://doi.org/10.9770/IRD.2020.2.4(5)
795
two actors have strengthened, they can subsequently invest their time, knowledge and resources in other activities,
allowing the economy to expand permanently starting from real capabilities. In the other scenario, everything is
transformed in interests where one wins and the other loses because of the law of supply and demand that lose the
value dimension of life. At the beginning one actor is strengthened in a situation of temporary advantage, but in
the long term the whole context is weakened and the same actor too, because wages are reduced and can’t buy
anymore.
If we suppose another scenario in which the resources are limited and there are no possibilities to increase more
productions, we are in front another choice in base to the objective. In this problem, Walras (Vuotto, 2006:11-66)
come in our help.
If we hypothesize another scenario in which resources are limited and there is no possibility of further increasing
production, we are faced with another choice that assumes its right logic based on the objective. To deal with this
problem, Walras (1896, in Vuotto, 2006: 11-66) comes to our aid. The author of the famous economic balance, in
an article (The science of social justice, 1896) deals with the problems of the economy and social justice,
contrasting materialism and spiritualism. It rightly distinguishes two types of organizations, the first acting for
social values, the second for economic profits. Organizations that act for social values are guided by spiritualism,
or by right, placing man in the foreground. The second typology pursues the material objective by subordinating
human life to wealth. But Walras affirms that "if man's work produces wealth, it is already not about man's
wealth, but the same man". It cannot be dominated by materialistic logics but rather by logics relating to being,
that is, right comes before materiality.
Therefore, in situations of extreme need for goods, the right to live in order to be, must prevail over the
materialism, because without men and women, there is no possibility of continuing life. In this way, goods and
services in extreme scarcity must follow other criteria, those that make it possible to implement the right to life
and not to increase profits (to which the law of supply and demand responds).
Is it possible to put everything that has been said so far into a formula with economics intentional variables?
In theoretical, assumption society ideas/values have to be expressed in production of good and services (demand
of rights).
Sm = Pm
The principle intencional variables toward production are: investment and workforce. If all production P, depend
on workforce, WF, and Investment, I, other factors, Z, we have:
WF (m) + I + Z = P (m)
If we assume that wages value depends on the B prices that define the real purchasing power and it has to contain
a percentage of savings E necessary for the expansion of the system considered to be in constant evolution, we
can replace L with L (B) +% E (that is, the real potential cost of money related to production value), we have:
WF (B + %E) + C + Z = P (m)
It means that only investments (capital, work, etc.) linked to priorities considered as rights (meso-economic goods
and services as ideas) make the system expand according to a potential ontological direction; it means
interpretable investment in ideas.

INSIGHTS INTO REGIONAL DEVELOPMENT
ISSN 2669-0195 (online) http://jssidoi.org/jesi/
2020 Volume 2 Number 4 (December)
http://doi.org/10.9770/IRD.2020.2.4(5)
796
Sm is the set of values and principles considered by society to be objectified through goods and services interpretable through
phenomenological approach in a meso-economics dimension.
Pm is the production of ontological or strategic goods at a given moment, defined at a meso-economic level. These are goods and services
that directly or indirectly determine the identity of societies in terms of "priorities" in constant evolution, the value of which is linked to
production and not to trade. Production depends on local, territorial, human and social vocations, on the skills acquired over time (workers'
knowledge), etc ... but also and on the investment capacity of producers/entrepreneurs and the State. To be as representative as possible of
ontological reason, it must be as pluralistic as possible because it responds to the process of knowledge formation which is intersubjective
by definition. In other words, the more pluralistic the productive process, according to the different roles and functions, the more
representative is the ontological reason of a society.
C all private and public resources transformed in production and cost of institutions related. It on the training system and on the "wisdom"
accumulated over the years by the workers, what Hegel called the true economic capital.
WF = B + %E are the value of wages permanently linked to prices and which contain a percentage of savings necessary for expansion.
Wages must contain a defined percentage of strategic savings that families direct in the future in strategic sectors linked to rights.
B are the prices of goods and services whose ideal conditions are determined by the company's ability to achieve its economy of scale,
albeit in a situation of non-rigid demand. Under these conditions, the maximum profit is based on the workforce and capital and not on
commercial operations or fluctuations due to supply and demand.
Z are other aspects related to the context, such as distances, technology, environmental limits, social ethical codes, ontological priority
coefficients related to strategic sectors, infrastructures, public goods, etc.
This relationship shows that the system creates ontological priorities only if there is a constant relationship
between workforce, investment and production linked to the priorities of life. If we think that today the economy,
through the process of economic financialization, registers 95% of financial values without relation to production,
we assume that this relationship is no granted. This means that the economy today, as it is conceived, does not
allow to reach an ontological reason of the peoples.
For this to happen, a different behavior is required, as we have seen, in accordance with Stiglitz said too, when he
talks about the agency of economics actors (Stiglitz, 2010). But it is also necessary, and fundamentally, a
collective institutional and social construction based on an ethical social capital that permanently imprints the
priorities of life in the economy with norms, policies, priorities, that is, a stratecic mesoeconomic dimension.
Otherwise, the economy tends only to represent a crematistic dimension (personal interest) and not to allows to
manage the resources for the promotion of the "home", a specific context (ie the true function of the economy).
If there are any alterations between the described variables we have high chances that the system does not respond
to a vision of community life but to unstable mechanisms that lead the system to permanent crises. For example,
the active mesoeconomics tax of interest of money can’t be incoherente with saving capability of wages. The
maximum monetary benefits depend on achieving economies of scale based on the increase in production linked
to needs through the workforce and the investment (capital, work, time, etc.) that generat goods and services with
added value. This is called the ability of the economy to carry out an ontological reason.
Some implications are:
- The intelligibility of an economic system is based on the existence of primary ideas that must be implemented
in practice to be objectified (pure reason is transformed into practical reason) by permanently constructing
those "historical" answers and a vision of life.
- There is a minimum level of investment necessary for the activation of structural changes and this depends on
the ability of countries to react to their situation of need or crisis. The ability to react depends on the
awareness of what is important to people and on its need to make it happen.
- Firms make the most profit in relation to their economy of scale and when wages are a direct and proportional
relationship between capital and prices.
- If capital is accumulated, the identity dimension of production is lost. In other words, in a capitalist system
that orients its intention only to the accumulation of capital, the intention with objects is lost and can no
longer be interpreted in terms of ontological reason. In other words, it loses the dimension of interpretable
social consciousness and the possibility of achieving priorities, which happens with the law of supply and
demand which is not linked to an identity dimension but to the opportunity for personal profit.

INSIGHTS INTO REGIONAL DEVELOPMENT
ISSN 2669-0195 (online) http://jssidoi.org/jesi/
2020 Volume 2 Number 4 (December)
http://doi.org/10.9770/IRD.2020.2.4(5)
797
- We can distinguish two types of capitalism, that which accumulates and that which invests in strategic sectors
for human and social life. If there are no investments in ontological goods and services, society cannot
develop its ontological reason which does not depend on the law of supply and demand.
Being the production and being of constantly evolving societies we speak of circular and progressive equilibrium.
The union between freedom and common interest occurs in the union between particular characteristics and
general characteristics. The former concretely realize the latter, they can be guided by individual freedoms which
must build the general characteristics of ideas. For example, the idea of eating as a need for all, presupposes the
production of food, that is general characteristic; the type of food that is produced, is freely defined by the actors,
that is particular one. The same for mobility, the type of instruments depend on the free and individual initiative.
Social priorities/Values ---- Production ---- Rights ------ Wages/%Investment
Figure 5. Circular equilibrium situation
Figure 6. Graph of aggregate demand of rights for different levels of equilibrium
Goods and services
functional to the
ontological reason
Rights
Rights/ideas
Equilibrium 1
Equilibrium 2
Equilibrium N
Society meta -
economy

INSIGHTS INTO REGIONAL DEVELOPMENT
ISSN 2669-0195 (online) http://jssidoi.org/jesi/
2020 Volume 2 Number 4 (December)
http://doi.org/10.9770/IRD.2020.2.4(5)
798
Conclusions
Economics, which originated in the ancient world as a field of ethics, has lost its normative dimension (Keynes,
1891) due to the law of supply and demand; this implies that each actor seeks his own individual interests without
building a relationship that carries forward a relational identity that can be interpreted in ontological terms. All
this is accentuated with the classic system. Thus, more than two hundred years of classical economics have
transformed the economic sciences into the sciences of individual opportunism and have made it lose its
communitary ontological reason.
In fact, the foundations of classical economics describe only one type of behavior, which according to these pages
is primitive to the construction of the "we" of a community. Classical economics is, therefore, a primitive science
that does not take into account the intersubjective dimension of knowledge between men and women, and ends up
not allowing the formation of the identity of the community. In other words, individual interest does not
presuppose, in phenomenological terms, a common good. It depends only on a relational identity that allows the
construction of a common vision of life, and not on thousands of loose individual interests.
Indeed, Keynes has addressed this problem, but this approach highlights that Keynesian solutions themselves
have limitations; for example, production needs a social orientation. Aggregate consumer demand must be
transformed into a demand of rights.
In this scenario, the phenomenological approach shows that capitalism works very well as it is based on
individual interest; in fact, the gap in the distribution of resources increases every year. It is societies, as a
collective construction, which can be considered in a crisis of rights (identity), or engulfed by the loss of meaning
due to a loss of interpretation, because of the positivist logics (see Figure 7).
Finally, we can conclude that individual freedom when it is devoid of ontological elements is emptied of content
and endangers the life of communities which by definition is above the individual. In this context, the attempt of
this law is to try to combine individual freedom and the general interest by using the general and particular
characteristics of the primary ideas. The general categories orient the system in terms of what is important, while
the particular ones implement their own orientation by defining the modalities (this area is based on individual
freedom). This implies that, if there are situations of scarcity, equilibrium is not obtained by increasing prices but
by increasing production, because the objective is not to maintain the system in terms of prices and quantities but
in terms of goods/services and needs. This means, that a good economic system is one that maintains direct
coherence between the variables proposed in the law and to the capacity of workforce to change to the challenges
of the time. If there are inconsistencies, there is the risk that the system becomes unbalanced and does not
generate an ontological reason but only a nominal system with no relationship between economy and society. To
do this, it may need a stock exchange that works with other rules.

INSIGHTS INTO REGIONAL DEVELOPMENT
ISSN 2669-0195 (online) http://jssidoi.org/jesi/
2020 Volume 2 Number 4 (December)
http://doi.org/10.9770/IRD.2020.2.4(5)
799
Figure 7. Socio-economic areas between individual freedom and community identity.
Individual
freedoms
High level
Relational identity
High level
Individual freedoms
Low level
Relational identity
Low level
Area 4: primary economies
Low levels of ethics social
capital and cooperation in
general
Area 1: public/State
Public economy, low level of
private initiative, presence of
bonding social capital
Area 2: Social organization/meta-economics
Ontological reason and strong presence of
ethical social capital
Area 3: of the free market
Utilitarianism, strong law supply and
demand presence based on individualist
social capital, presence of bridging social
capital

INSIGHTS INTO REGIONAL DEVELOPMENT
ISSN 2669-0195 (online) http://jssidoi.org/jesi/
2020 Volume 2 Number 4 (December)
http://doi.org/10.9770/IRD.2020.2.4(5)
800
References
Bourdieu, Pierre 1980. Le capital social. Notes provisoires, Actes de la Recherche en Sciences Sociales, N° 31, pp. 2-3.
Bourdieu, Pierre 1986. The forms of capital, Westport: Greenwood Press.
Braudel, Fernand 1986. I tempi della storia economica, società, civiltà, Bari: Dédalo.
Finley Moises I., 2008. L’economia degli antichi e dei moderni, Bari: Laterza.
Friedman Milton, 1953. Essays in Positive Economics, Chicago University, Chicago.
Donati Pierpaolo, Solci Riccardo, 2011. I beni relazionali. Che cosa sono e quali effetti producono, Torino: Bollati Boringhieri.
Heidegger Martin. 2011 [1927]. El ser y el tiempo, Fondo de Cultura Económica, México.
Husserl Edmund, 2008. La crisis de las ciencias europeas y la fenomenología trascendental, Buenos Aires: Prometeo.
Hirschman, A. (Ed.). (1979). Le passioni e gli interessi. Argomenti politici in favore del capitalismo prima del suo trionfo, Milán:
Feltrinelli.
Hobsbawm, E. (Ed.). (2010 [1975]). La era del Capital 1848-1875, Buenos Aires: Crítica.
Husserl, Edmund, 1986. Ideas relativas a una fenomenología pura y a una filosofía fenomenológica, Fondo de Cultura Económica,
México.
Kant Immanuel, 2004 [1788]. Critica della ragion pratica, Editrice Bompiani, Milano, 2004.
Kant Immanuel, 1991 [1781]. Critica della ragion pura, III Edizione, Editrice Tascabili Bompiani, Milano.
Keynes John Maynard, 2012. Teoría general de la ocupación, el interés y el dinero, Buenos Aires: Fondo de Cultura Económica.
Keynes Naville, 1884. Studies and Exercises in Formal Logic, Macmillan and Company.
Keynes Naville, 1999 [1891]. The Scope and Method of Political Economy, Batoche Book.
Polanyi Karl, 2000 [1944]. La grande trasformazione, Einaudi, Torino.
Rifking Jeremy, (1995). La fine del lavoro, il declino della forza lavoro globale e l'avvento dell'era post-mercato, Baldini&Castoldi.
Schütz Alfred, 2003 [1962]. El problema de la realidad Social, Escritos I. Buenos Aires-Madrid: Amorrortu, Editores.
Schumpeter Joseph, 1990. Storia dell'analisi economica, Turín: Bollati Boringhieri.
Smith Adam, 2013. La Ricchezza delle Nazioni, Novara: UTET.
Stiglitz, Joseph (2010). Caída libre: El libre mercado y el hundimiento de la economía mundial, Madrid: Taurus.
Vigliarolo Francesco, 2017. Lupi e agnelli. Societá capitaliste e vie d’uscita, Milano: Jaca Book.
Vigliarolo Francesco, 2019. La economía es un fenómeno social. Principios de fenomenología económica, Buenos Aires: Eudeba.
Vigliarolo F. (2012a). Capitale sociale nella costruzione del bene comune: dal capitale sociale etico alla socializzazione dell'economia
(Social Capital and the Pursuit of the Common Good: From Ethical Social Capital to the Socialization of Economy), En Revista Sociologia
e Politiche sociali, 15, 1, 2012, Migration studies e capitale sociale (a cura di) M. Bertani e P. Di Nicola, Bologna: Franco Angeli Editore.
pp. 123-134. DOI: 10.3280/SP2012-001007.
Vigliarolo, F. (Ed.). (2011). Le imprese recuperate. Argentina, dal crac finanziario alla socializzazione dell’economia. Reggio Calabria-
Milano: Città del Sole e Altreconomia Edizioni.
Vuotto Mirta compiladora, 2006. Economía social. Precisiones conceptuales y algunas experiencias históricas, Buenos Aires: Editorial
Altamira.
Walras, Léon, 1896. Estudios de Economía Social, Segunda Sección; en Vuotto, Mirta (compiladora) 2003. Economía Social, Precisiones
Conceptuales y Algunas Experiencias Históricas: 17-36. Buenos Aires: Editorial Altamira.
Acknowledgements
I thank some friends and colleagues who have stimulated me, in particular prof. Sixto Jiménez Muniain, Spanish
economist, for the constructive criticism and advices, as well as prof. Stefano Zamagni for encouraging me to
follow along on this work path, that is, to resume the epistemological debate in economics set aside for several
decades.

INSIGHTS INTO REGIONAL DEVELOPMENT
ISSN 2669-0195 (online) http://jssidoi.org/jesi/
2020 Volume 2 Number 4 (December)
http://doi.org/10.9770/IRD.2020.2.4(5)
801
Francesco VIGLIAROLO is the full Professor of Regional Economy, University of Catolica of La Plata, Argentina. He is
Director of free Chair in Economics Systema and Human Right, National University of La Plata; Associate Researcher in
Centre Study of Sociology of work, Economics Faculty, UBA. Research interests: relation between society and economy,
social economy and recovered enterprises, local and sustentaible devolevolpment, economic phenomenology. He has
published books and articles on these topics: (2019). Economy is a social phenomenon. Principles of economic
phenomenology, EUDEBA, Buenos Aires; (2017). Wolves and lambs, capitalist societies and the way out, Jaka Book, Milan.
ORCID ID: orcid.org/0000-0002-9667-3730
Register for an ORCID ID:
https://orcid.org/register
Make your research more visible, join the Twitter account of INSIGHTS INTO REGIONAL DEVELOPMENT:
@IntoInsights
Copyright © 2020 by author(s) and VsI Entrepreneurship and Sustainability Center
This work is licensed under the Creative Commons Attribution International License (CC BY).
http://creativecommons.org/licenses/by/4.0/

INSIGHTS INTO REGIONAL DEVELOPMENT
ISSN 2669-0195 (online) http://jssidoi.org/IRD/
2020 Volume 2 Number 4 (December)
http://doi.org/10.9770/IRD.2020.2.4(6)
Publisher http://jssidoi.org/esc/home
802
CYBER SECURITY MANAGEMENT OF CRITICAL ENERGY INFRASTRUCTURE IN NATIONAL
CYBERSECURITY STRATEGIES: CASES OF USA, UK, FRANCE, ESTONIA AND LITHUANIA*
Manuela Tvaronavičienė ¹, Tomas Plėta ², Silvia Della Casa ³, Juozas Latvys 4
1,2 Vilnius Gediminas Technical University Saulėtekio al. 11, LT-10223 Vilnius 1Daugavpils University, Parades Str. 1-421, Daugavpils, LV-5401, Latvia
3,4 NATO Energy Security Center Of Excellence, Šilo g. 5a, 10322 Vilnius, Lithuania
E-mails:1 E-mails: [email protected] ; [email protected]; [email protected]; [email protected]
Received 18 March 2020; accepted 10 July 2020; published 30 September 2020
Abstract. The progresses made in terms of cybersecurity in these past years have been huge, and the implementation of newer strategies
has brought interesting results all over the globe. However, the full implementation of cybersecurity presents a challenge to a lot of
countries, especially if considered the Critical Infrastructure Protection (CIP), which is still one of the areas with the most gaps in terms of
cybersecurity. In this article, the first five countries by cybersecurity level according to the Global Cybersecurity Index (GCI) 2018, in
order UK, USA, France, Estonia and Lithuania, will be evaluated for their solutions in terms of Critical Infrastructure Protection. The
results will show the effective accuracy of the index and will shed light on the various approaches to Critical Infrastructure Protection.
Keywords: cybersecurity; critical infrastructure protection; management; energy security; cyber attack
Reference to this paper should be made as follows: Tvaronavičienė, M., Plėta, T., Della Casa, S., Latvys, J. 2020. Cyber security
management of critical energy infrastructure in national cybersecurity strategies: cases of USA, UK, France, Estonia and Lithuania.
Insights into Regional Development, 2(4), 802-.813. http://doi.org/10.9770/IRD.2020.2.4(6)
JEL Classifications: M15, Q48
* This research is/was funded by the European Social Fund under the No 09.3.3-LMT-K-712 “Development of Competences
of Scientists, other Researchers and Students through Practical Research Activities” measure.

INSIGHTS INTO REGIONAL DEVELOPMENT
ISSN 2669-0195 (online) http://jssidoi.org/jesi/
2020 Volume 2 Number 4 (December)
http://doi.org/10.9770/IRD.2020.2.4(6)
803
1. Introduction
The introduction of the concept of cybersecurity has brought to a major development of the role and responsibility
of a state towards its citizens. Since cyber-attacks have been regarded as a growing phenomenon, especially in
advanced countries, many of them decided to implement newer strategies, which considered the cybersecurity of
both private and public spheres. According to the International Telecommunication Union (ITU), by the end of
2018, 3.9 billion people were using the Internet (ITU, 2019), which means that the cyberspace is growing more
and more wach year and needs to be protected. Many countries worldwide have published National Cybersecurity
Strategies (NCSSs), which embodied the will of securing the cyberspace from cyber attacks and ransomware.
However, there seems to be an obstacle to the achievement of full cybersecurity, which is the protection in
particular of Critical Energy Infrastructures (CEI). For “critical infrastructures”, the definition can vary from
country to country, but the general meaning can be traced back to “services and facilities used by society which
disruption or malfunction would generate negative consequences to the public” (Izycki et al., 2019). While past
attacks were focused mainly to IT (Information Technology) environments, the trend shows that cyber risks is
now greater in the OT (Operational Technology) environment. Even though the risk is present and growing, many
NCCs do not address specific plans which include Critical Infrastructure Protection (CIP) or recognize the need of
an adequate framework for granting supply chain and aid during and after a cyber attack.
This article will attempt to examine the issue of the CIP as a gap in NCSSs, by analyzing and comparing five
different NCSSs. The countries will be firstly chosen by picking the first five that are represented in the Global
Cybersecurity Index (GCI) 2018, issued by the ITU. The list is made by evaluating the country’s commitment and
development into cybersecurity solutions. The ranking is made by evaluating five elements, all with the same
weight in the calculation of the final grade: legal, so the existence of legal institutions or frameworks concerning
cybersecurity, technical, the existence of such technical institutions and framework, organizational, meaning
policy coordinating institutions, capacity building, existence of research & development and education and
training programs, and cooperation, so in terms of partnerships and cooperative framework (ITU, 2019). The list
of the Global Ranking of 2018 puts in the first five slots (in order): UK, USA, France, Lithuania and Estonia
(ITU, 2019).
The analysis would proceed by evaluating the strategies of Critical Infrastructure Protection of the first five
countries by using the model that was developed by Limba T., Plėta T. et al., named the “Cyber Security
Management Model for Critical Infrastructure”, developed in 2017 (Limba, et al., 2017). The tiers are six, and
each evaluates a specific feature needed for an adequate framework of management model for cybersecurity.
Legal regulation evaluates the understanding of an organization of cybersecurity, its aims and the required
planning; the second tier is for risk management, which evaluates the organization’s ability to identify the
growing risks and to develop adequate responses. Other important elements are Security Culture, which evaluates
the level of undersanding of cybersecuirty for every member of the organization’s staff, Technology Management,
which concerns the knowledge of all of the organization’s elements and their vulnerabilities and Incident
Management, which considers whether the organizaiton has special planc regarding the incident consequence
management (Limba, et al., 2017). After the evaluation, there will be a ranking which will establish the best and
the worst strategy in terms of CEIP, and it would be possible to compare the results to the ones resulted from the
GCI 2018. Furtherly, a new model will be proposed which could better ensure a high level of CEIP. In order to
determine the level of preparation of NCSSs in terms of management models for Critical energy infrastructure
protection, documents will be taken from official sources. However, the priority will be to consider documents

INSIGHTS INTO REGIONAL DEVELOPMENT
ISSN 2669-0195 (online) http://jssidoi.org/jesi/
2020 Volume 2 Number 4 (December)
http://doi.org/10.9770/IRD.2020.2.4(6)
804
specifically dedicated to Critical Infrastructure Protection, in particular on management model and strategy. In the
case of the country not having specific documents on CIP, the National Cyebrsecurity Strategies will be used.
2. Analysis of the National Cybersecurity strategies
The following chapter will offer an analysis of national cybersecurity approaches to the protection of critical
infrastructures. As mentioned in the introduction, the model that will be used for the evaluation will be of Limba
et al. (Limba, et al., 2017), called Cyber Security Management Model for Critical Infrastructure. The goal of the
analysis it to show the existing gaps in the national strategies when it comes to protection of critical
infrastructures (CIP). For this reason, the countries that were chosen supposedly to implement the best possible
practices according to the Global Cybersecurity Index (GCI). The evaluations will assess the presence of
frameworks dedicated to CEIP and of effective management strategies. If the country does not provide a specific
document on CEIP management, the analysis will be conducted on the existing NCCS.
3. UK
According to the Global Cybersecurity Index (GCI), the United Kingdom is placed at the first place of the list,
immediatey before the US (ITU, 2019). The choice to put the UK in the first place reflects a serious commitment
of the country to invest in cybersecurity development. In the 2015 National Security Strategy and Strategic
Defence and Security Review issued by the government (HM Government, 2015), it can be found a part dedicated
to the Critical National Infrastructure (CNI) and Energy security. In the strategy, it is mentioned the will to
ensure resilience of CNI to future threats such as power disruptions and such (HM Government, 2015). Moreover,
the government founded the Center for Protection of National Infrastructure, which focuses on reducing the
vulnerability of the national infrastructure, in particular on CIP (CPNI, 2020) along with the National Cyber
Security Centre in 2016 (National Cyber Security Centre, 2020).
The analysis that was conducted on the UK approach to management aspects of Critical Infrastructure Protection
revealed a peculiar situation. The main documents concerning the topic were the second and third report of the
Joint Committee on the National Security Strategy on Cyber Security Skills and the UK’s Critical National
Infrastructure (Joint Committee on the National Security Strategy , 2018) (Joint Committee on the National
Security Strategy, 2018). The documents confirm that, even though in 2016 the government published in 2016 the
National Cyber Security Strategy 2016-2021, under the “Develop” section there are quoted “the systemic issues at
the heart of the cyber skills shortage” (Joint Committee on the National Security Strategy, 2018). The issues that
are recorded have to do with the lack of education and established carreers concerning the topic of cybersecurity
(Joint Committee on the National Security Strategy, 2018), so that there are not enough English citizens who
posses the needed skills and the abilioty to work in the Critical National Infrastructure sector (Joint Committee on
the National Security Strategy, 2018). In the third report, as well, it is said that the Government’s definition of
Critical National Infrastructure it is too broad, and it does not help in identifying the types of Infrastructure that
need the most protection (Joint Committee on the National Security Strategy, 2018).
In the analysis, it was difficult to find the requirements described in the Limba et al. model. Legal regulation,
meaning the acknowledgement of the need of Critical Infrastructure Protection by official institutions (Limba et
al., 2017), can be found in the National Cyber Security Strategy 2016-2021 (HM Government, 2016). In the
document, one of the objectives in the “Defend” section is “protecting our Critical National Infrastructure and
other priority sectors” (HM Government, 2016). The Government declares that a reguatory framework is needed,
but at the same time does not provide additional details about it. The UK government’s has the Cabinet Office’s
Civil Contingencies Secretariat (CCS) held responsible for big emergencies including the ones involving Critical
Infrastructures. The Cabinet office elects, a number designated Lead Government Department (LGD), which
guides the incident management and planning in emergencies of high classification (Civil Contingencies

INSIGHTS INTO REGIONAL DEVELOPMENT
ISSN 2669-0195 (online) http://jssidoi.org/jesi/
2020 Volume 2 Number 4 (December)
http://doi.org/10.9770/IRD.2020.2.4(6)
805
Sectretariat, 2004). The 2004 document that was formed for describing the guidelines that LGDs have to follow to
promote assistance, The Lead Government Department and its role – Guidance and Best Practice (Civil
Contingencies Sectretariat, 2004) contains a bit of general parts of the elements of good governance and risk
management according to the Limba model (Limba et al., 2017). The procedures and the planning processes are
presented in the document, as well as the emergency operation checklists and the responsibilities; however, since
the LGDs can intervene in varioius situation of emergency, the outline results to be too general to have an
adequate overview on the correct procedures (Civil Contingencies Sectretariat, 2004). About the security culture,
there are various documents that explain in general the different types of cyber attack that an organization can
experience, such as Common cyber attacks: reducing the impact (CESG, 2016). The document presents basic
knowledge on the different types of cyber attacks, but it focuses more on the procedures that a non-critical
organization could follow (CESG, 2016). Concerning technology management and Incident management, there
are no known solutions or specific documents from the govenrment that cocern Critical Infrastructures.
4. USA
The second country in the world for level of cybersecurity level, according to the GCI 2018, is the Unites States
of America. In fact, the US government dedicated a Department of Homeland Security to cybersecurity, the
Cybersecurity and Infrastructure Security Agency (CISA) which has a National Infrastructure Protection Plan
(NIPP) (CISA, 2018), to form a dedicated and comprehensive strategy for CIP. The documents that were revised
for the evaluation are many, since the NIPP website provides a lot of material available to anyone. Firstly it is
necessary to say that there are multiple documents entirely dedicated to Critical Infrastructures: the website offers
an extensive access to core services and capabilities of the CISA. Amongst the listed, the Department of
Homeland Security has as a priority to conduct assessments on infrastructure and communities to help the
organizations to make decisions, to provide and share information to both public and private sector (public-private
partnerships are considered vital to the development of CIP). Another major focus in the core services is on
training and exercises by collaborating on state, local, and tribal level and providing training on critical
infrastructure security (CISA, 2018).
In order to conduct the analysis, the documents that will be taken into consideration will be eight. The most
important is the NIPP 2013, Partnering for Critical Infrastructure Security and Resilience, (Homeland Security,
2013), which outlines how the government and the private sector should behave in order to achieve CIP. The
document represents an evolution of the preexisting version of the NIPP published in 2006, and provides the
guidelines to achieve an integrated and collaborative approach to a secure and resilient critical infrastructure. The
document is divided into five sections: Vision, Mission and Goals, which considers the guidelines for the critical
infrastructure community, Critical Infrastructure Environment, which instead describes the policy, the risks and
the partnership structure needed to achieve the community’s goals, Core Tenets, describing the principles of the
NIPP, Collaborating to Manage risks, which describes the framework for risk management activities, and finally
the Call to Action to the entire critical infrastructure community (Homeland Security, 2013). There are as well
three supplements of the NIPP 2013 that will be taken into consideration, such as the Supplemental Tool:
Executing A Critical Infrastructure Risk Management Approach (Homeland Security, 2013), the Supplemental
Tool: Incorporating Resilience into Critical Infrastructure Projects (Homeland Security, 2013) and the
Supplemental Tool: NPPD Resources to Support Vulnerability Assessments (Homeland Security, 2013). In
addition to the NIPP 2013 framework, which is appliable to all types of Critical Infrastructures, there are Sector
specifici plans tailored for each type. Since that, as aforementioned, the focus on the article will be on Critical
Energy Infrastructure (CEI), the two documents that will be considered for the analysis are the Energy Sector-
Specific Plan (Homeland Security, 2015) and the Energy Sector Cybersecurity Framework Implementation
Guidance (US Department of Energy, 2015). Ultimately, there will be mention as well of NIST: Framework for

INSIGHTS INTO REGIONAL DEVELOPMENT
ISSN 2669-0195 (online) http://jssidoi.org/jesi/
2020 Volume 2 Number 4 (December)
http://doi.org/10.9770/IRD.2020.2.4(6)
806
Improving Critical Infrastructure Cybersecurity (NIST, 2018) and and the Critical Infrastructure Threat
Information Sharing Framework (Homeland Security, 2016).
Firstly, the field of legal regulation according to Limba et al. (Limba, et al., 2017) is broadly evaluated by the
presence of security instructions to employees, information security officers, network administrators and
standards (Limba, et al., 2017). The US documentation offers a broad choice of standards, but the most important
is surely the NIST: Framework for Improving Critical Infrastructure Cybersecurity (NIST, 2018). The document
has a complementary role, meaning that is accessible to every organization in order to enhance their cybersecurity
level and to evaluate their performance (NIST, 2018). In terms of instruction to information security and network
administrator another important document is the Critical Infrastructure Threat Information Sharing Framework
(Homeland Security, 2016), which offers a list and contacts of all the entities participating in the information-
sharing process, as well as the Supplemental Tool: NPPD Resources to Support Vulnerability Assessments
(Homeland Security, 2013), which provides information on the Federal resouces that are available to the sector
partners to identify and assess CI vulnerabilities.
For what concerns the aspect of good governance, the model refers to it also as security planning (Limba, et al.,
2017), and the document which is the most useful in that sense surely is the NIPP 2013, Partnering for Critical
Infrastructure Security and Resilience (Homeland Security, 2013), which enlightens the policy and the
environments in CIP. The documents offers an insight on the stucture of partnerships and the-ir fundamental role
into the collaboration into building an effective regulation, as well as describing the National Partnership
Structure, and the role of Infrastructure Partners and Stakeholders (Homeland Security, 2013). Instead for the
aspect of risk management, which evaluates the presence of a contingency plan and is one of the main focus of the
analysis, the document that is considered the most adequate is the Supplemental Tool: Executing A Critical
Infrastructure Risk Management Approach (Homeland Security, 2013). In the document, it is described the
Critical Infrastructure Risk Management Framework, which can be applied to all types of threats and hazards and
is supported by the Threat and Hazard Identification and Risk Assessment (THIRA). As well the the Energy
Sector Cybersecurity Framework Implementation Guidance (US Department of Energy, 2015) offers the Energy
Sector Cybersecurity Risk Management Approaches, a list of possible approach s that can be implemented by any
organization.
Concerning the security culture, meaning the presence of the security measures for all the employees (Limba, et
al., 2017), can be evaluated as well in the Critical Infrastructure Threat Information Sharing Framework
(Homeland Security, 2016), which offers as well a Reference guide for critical infrastructure owners and
operators and general guidelines on the reporting of critical incidents, which as well reflect as well incident
management (Limba et al.,2017). The technology management element (Limba et al., 2017) is overall about the
organization’s knowledge of their components and how they worked, and it can be found as a part of the
aforementioned NIPP 2013, Partnering for Critical Infrastructure Security and Resilience, (Homeland Security,
2013), which has as a priority the identification of the Infrastrucure.
5. France
According to the 2016 French National Digital Security Strategy (Government of France, 2015), one of the
strategic objective of France in the field of cybersecurity is to gain “fundamental interests, defence and security of
state information systems and critical infrastrucrtures, major cybersecuirity crises” (Government of France,
2015). Being in the third place in ranking in terms of cybersecurity index (ITU, 2019), France developed in terms
of cybersecurity. In the document, it is explained the government’s decision of partnering at the European level
with the European agency ENISA (European Union Agency for Network and Information Security), and relying

INSIGHTS INTO REGIONAL DEVELOPMENT
ISSN 2669-0195 (online) http://jssidoi.org/jesi/
2020 Volume 2 Number 4 (December)
http://doi.org/10.9770/IRD.2020.2.4(6)
807
on the CERT-EU (Computer Emergency Response Team of the European Union (EU) institutions, bodies and
agencies) and to the NCIRC (Computer Incidence Response Capability) of the North Atlantic Treaty Organization
(NATO) (Government of France, 2015). Hence, the approach of France is quite peculiar, as it bases on the
international level rather than the national level. In terms of national organizations, France established in 2013 a
regulatory framework for Critical Infrastructures Information Protection (CIIP) (ANSSI, 2020), the “CIPP law”.
The framework identifies, in coordination with the General Secretariat for National Defence and Security, 12
sectors and 200 operators, defined as “operator[s] whose unavailability could strongly threaten the economical or
military potential, the security or the resilience of the Nation”(ANSSI, 2020). The protection of CI is regardes as
a priority, and the National Cybersecurity Agency (ANSSI) works with the government to nominate operators for
each CI, which should be able to draw both operator security plan (OSP) and specific protection plans
(Secretariat-General for National Defence and Security, 2017).
However, if we analyze the French approach, we can found gaps in the model proposed by Limba et al. (Limba et
al., 2017). The legal regulaton is present, since the government is aware of the issue of Critical Infrastructures
and hence is developing a solution, by putting their protection as one of the main objectives of their strategy, as
aforementioned (Government of France, 2015). For what concerns good governance, the security planning is
hardly markable as adequate, since the only security rules are common to every type of CI, and the processes are
depending on the various operators and there is no mention of an effective common and comprehensive
framework (ANSSI, 2020) (Limba et al., 2017). There are some measures in case of emergencies, during which
the ANSSI receives information from the organization and provides assistance, but there are no mentions of plans
or to effective regulations: the incident management could be considered as at a low level, but still present
(ANSSI, 2020) (Limba et al., 2017). For what concerns the other elements in the model, France does not provide
any more insights.
6. Estonia
Placed at the fourth place in the GCI 2018 (ITU, 2019), Estonia is seldom seen as the poster child of Europe’s
digitalization. The republic of Estonia is deeply invested in the cause of cybersecurity, however in their
Cybersecurity Strategy 2019-2022 one of the challenges marked in 2018 is “Insufficient understanding of the
impact of cyber threats, incidents and infrastructure interdependencies” (Republic of Estonia, 2018). The
republic passed in 2018 the Cybersecurity Act, which established requirements from businesses and institutions
for preparing for a cyber threat (Republic of Estonia, 2018). In addition, the Minister of Entrepreneurship and
Information Technology passed in 2018 the Requirements for risk analysis of network and information systems
and description of security measures, established under the Cyber Security Act (Republic of Estonia, 2018).
Following the 2007 cyber attacks in Tallinn, which brought distruption for the civilans for days, the government
established the Emergency Act in 2009, which provides the legal basis for planning and crisis management
(Government of Estonia, 2009): despite being passed in 2009, the act provides with guidelines for planning and
risk assessment directed to providers of vital services, meaning Critical Infrastructure.It is important as well to
mention the presence in Estonia of the NATO Cooperative Cyber Defence Centre of Excellence, which researches
on cyber security expertise, and of the CERT-EE, established in 2006 and responsible for management of security
incidents in .ee compiuter networks (Information System Authority, 2020) (CCDCOE, 2020).
The analysis accordind to the Limba model shows a better preparation for Critical Infrastructure protection than
France, which is however put a rank above Estonia in the GCI. In terms of legal regulation (Limba et al. 2017),
all the aforementioned documents mention the necessity to develop an effective cybersecurity for Critical
Infrastructures, however in particular the Cyber Security Act enphasizes the necessity to maintain the functioning
and maintenance of “network and information systems essential for the functioning of societ and state” (Republic
of Estonia, 2018). The Cyber Security Act can be regarded, toghether with the regulation of Requirements for risk
analysis of network and information systems and description of security measures can be part of the good

INSIGHTS INTO REGIONAL DEVELOPMENT
ISSN 2669-0195 (online) http://jssidoi.org/jesi/
2020 Volume 2 Number 4 (December)
http://doi.org/10.9770/IRD.2020.2.4(6)
808
governance requirements , since it offers security planning over the risk analysis of Critical Infrastructures
(Republic of Estonia, 2018). For what concerns Risk management, hence the presence of a contingency plan, the
Estonian government offers an overview in the 2009 Emergency Act, in which are described the obligations of
the vital service providers under law to perform risk assesments plan and continuous operation risk assessment
(Government of Estonia, 2009). In the same doument there are the guidelines that the operators have to follow in
the case of incident and disruption of critical services, which can be identified as part of the incident management
tier (Limba et al., 2017) (Government of Estonia, 2009). Security culture and technology management have yet to
be assessed for Estonia.
7. Lithuania
The last country to be part of the analysis is Lithuania, placed in the fifth place of the GCI (ITU, 2019). The
resolution to the issue of cybersecurity is discussed in the 2018 National Cyber Security Strategy (Government of
the Republic of Lithuania, 2018). Additionally, in September 2016 Lithuania launched its own National Cyber
Security Centre (NKSC), which took on the information security incident investigation previously performed by
the Communications Regulatory Authority of the Republic of Lithuania on January 2018 (National Cyber
Security Centre, 2020). Concerning the protection of cyberspace, it is currently present the Computer Emergency
Response Team in Lithuania (CERT-LT), which plays a key role in providing assistance to organizations and
businesses (Government of the Republic of Lithuania, 2018). In the strategy however, it is mentioned that “[…]
on the national level, the security risk assessment culture and cyber security risk assessment are still fragmentary.
There is a lack of analysis on cyber threats and gaps in security as well as full integration into activity risk
assessment processes.” (Government of the Republic of Lithuania, 2018). There is a focus on the protection of
Critical Information Infrastructure, but no sign of will if implementing a framework to protect CI. It is worth
mentioning as well that in the capital Vilnius the NATO Energy Security Centre of Excellence (ENSEC COE) is
collaborating with the government to research newer solutions to the issue of Critical Infrastructure Protection
(NATO Energy Security Center of Excellence, 2020). Another important document that needs to be taken into
consideration for the purposes of the analysis is the National Cyber Incident Management Plan, developed and
implemented in 2018 (Government of the Republic of Lithuania, 2018).
According to the Limba model, the Lithuanian approach to the problem of Critical Infrastructure Protection seems
unadequate, since that the documents taken into consideration were not either specifically drafted for Critical
Infrastructures, or had mention of the issue as a separate goal. The National Cyber Incident Management Plan
offers some insight to the general procedures of risk management and incident management, as it provides general
guidelines on how to report and communicate to the authorities in case of a cyber incident (Government of the
Republic of Lithuania, 2018) (Limba et al., 2017). There are general mentions to improve the cybersecurity of
Critical Information Infrastructures in the National Strategy could be seen as an initial stage of legal regulation
(Limba et al., 2017).
8. Evaluation and comparison
The previous part of the article provided an analysis of the first five countries for Cybersecurity Level according
to the GCI 2018 (ITU, 2019). The model that was used provides six indicators, which are described in the table 1
below: each indicator can have a value that ranges from zero to five. Zero means that there is no mention of the
indicator in the chosen documents, and there is no alternative seen in general cybersecurity approaches, and it
ranges till the level Five, which indicates an adequate and comprehensive implementation of functioning
regulations.

INSIGHTS INTO REGIONAL DEVELOPMENT
ISSN 2669-0195 (online) http://jssidoi.org/jesi/
2020 Volume 2 Number 4 (December)
http://doi.org/10.9770/IRD.2020.2.4(6)
809
Table 1. Indicators of Cybersecurity Level
Legal
Regulation
Good
Governance
Risk
Management
Security
Culture
Technology
Management
Incident
Management
UK 4 3 3 4 0 0
USA 5 5 4 4 4 4
France 3 2 0 0 0 2
Estonia 4 4 3 0 0 3
Lithuania 2 0 1 0 0 2
From the results gathered from the analysis of the five countries, it is noticeable how the protection of Critical
Infrastructure, despite being vital for the cybersecurity of a country, has yet to be developed even in the most
developed countries in terms of cybersecurity. The US model currently represents the most comprehensive and
adequate framework in terms of Critical Infrastructure Protection, as it offers higher marks compared to all the
other countries, as seen in the analysis. It is interesting to see how much the evaluation shows a distancing
between the USA and the rest of the countries taken in for the analysis, while according to ITU, the UK still has
the first place for cybersecurity index (ITU, 2019). The table clearly shows the areas in which the countries
possess gaps in the framework, and the countries that score the worst performance by having more zeros are
Lithuania, at the last place of the GCI, and surprisingly France, which instead is placed above Estonia in the GCI.
The areas that have resulted in getting the highest evaluations are Legal regulation and Good Governance, while
the areas in which are regarded the more gaps are security culture and technology management. This shows how
the weakest spot in the implementation of Critical Infrastructure Protection is the awareness and the training of
the workers, fundamental for the development of newer solutions. In addition, beside the US it is seen a total lack
of knowledge of the various components and parts of Critical Infrastructures, along with their functioning.
The analysis brought to light an average deep inadequacy concerning the protection of Critical Infrastructures,
except the US approach. The model not only shows how the countries generally lack an adequate framework, but
also how the general approach to cybersecurity can be apparently satisfactory, like the criteria used by the ITU to
develop the GCI, but can be deceiving in evaluating the practical applications of the cybersecurity principles. The
Limba model that was used in the analysis is adequate, but it could be highly improved. It should be implemented
an international criteria which would consider more elements to be necessary for a country to develop. The model
should also take into consideration a more hierarchical approach to the classification of Critical Infrastructure, by
organizing a list in which the different types of Critical Infrastructure in the country could be evaluated in order of
importance in case of attack or emergency, and to assure the supply-chain to the most important ones. This could
help countries with a poorer state budget to prioritize their investment in Critical Infrastructure Protection.
Another important issue that should be taken into consideration in developing a newer model should focus as well
on the planning, as seldom it is unclear what it is to protect in Critical Infrastructure, and the previous analysis
confirmed this vision with the lacks in technology management.
In order to develop a model with adequate criteria, the best standard that should be used to implement a newer
approach is the ISO/IEC 27002: Information Technology – Security Techniques – Code of practice for
information security controls (Technical Committee ISO/IEC JTC 1, 2013), which represents the best practices
for implementing an effective model for Critical Infrastructure Protection.

INSIGHTS INTO REGIONAL DEVELOPMENT
ISSN 2669-0195 (online) http://jssidoi.org/jesi/
2020 Volume 2 Number 4 (December)
http://doi.org/10.9770/IRD.2020.2.4(6)
810
Bibliography
Government of the Republic of Lithuania. (2018). National Cyber Incident Management Plan. Vilnius:
https://www.ird.lt/media/force_download/?url=/uploads/structure/docs/42166_cf30b855d9ac94e388b0d52cbf96ae86.pdf.
ANSSI. (2020). FAQ: The French CIIP Framework. Retrieved from ANSSI: https://www.ssi.gouv.fr/en/cybersecurity-in-france/ciip-in-
france/faq/#2-3
ANSSI. (2020). The French CIIP Framework. Retrieved from ANSSI: https://www.ssi.gouv.fr/en/cybersecurity-in-france/ciip-in-france/
ANSSI. (2020). The French CIPP Framework. Retrieved from ANSSI: https://www.ssi.gouv.fr/en/cybersecurity-in-france/ciip-in-france/
CCDCOE. (2020). About us. Retrieved from CCDCOE: https://ccdcoe.org/about-us/
CESG. (2016). Common Cyber Attacks: Reducing The Impact. London: CESG. Retrieved from https://www.ncsc.gov.uk/static-
assets/documents/common_cyber_attacks_ncsc.pdf
Cichonski P., M. T. (2012). NIST Special Publication 800-61 Revision 2: Computer Security Incident Handling Guide. Washington: U.S.
Department of Commerce. Tratto il giorno 2012 da https://nvlpubs.nist.gov/nistpubs/SpecialPublications/NIST.SP.800-61r2.pdf
CISA. (2018, November 21). National Infrastructure Protection. Tratto il giorno May 8, 2020 da https://www.cisa.gov/national-
infrastructure-protection-plan
Civil Contingencies Sectretariat. (2004). The Lead Government Department and its role – Guidance and Best Practice. London: Cabinet
Office. Retrieved from
https://assets.publishing.service.gov.uk/government/uploads/system/uploads/attachment_data/file/61355/lead-government-
departments-role.pdf
CPNI. (2020). About . Retrieved from Centre for the Protection of National Infrastructure: https://www.cpni.gov.uk/who-we-work
Government of Estonia. (2009). Emergency Act. Tallinn: Government of Estonia. Retrieved from
https://www.riigiteataja.ee/en/eli/525062014011/consolide
Government of France. (2015). French National Digital Security Strategy. Paris: Government of France. Retrieved from
https://www.enisa.europa.eu/topics/national-cyber-security-strategies/ncss-map/national-cyber-security-strategies-interactive-
map/strategies/information-systems-defence-and-security-frances-strategy
Government of the Republic of Lithuania. (2018). Resolution on the approval of the National Cyber Security Strategy. Vilnius:
Government of the Republic of Lithuania.
HM Government. (2015). National Security Strategy and Strategic Defence and Security Review 2015. London: HM Government.
Retrieved from
https://assets.publishing.service.gov.uk/government/uploads/system/uploads/attachment_data/file/478933/52309_Cm_9161_NSS
_SD_Review_web_only.pdf
HM Government. (2016). National Cyber Security Strategy 2016-2021. London: HM Government. Retrieved from
https://assets.publishing.service.gov.uk/government/uploads/system/uploads/attachment_data/file/567242/national_cyber_securit
y_strategy_2016.pdf
Homeland Security. (2013). NIPP 2013 Partnering for Critical Infrastructure Security and Resilience. Washington DC: Homeland
Security. Retrieved from https://www.cisa.gov/publication/nipp-2013-partnering-critical-infrastructure-security-and-resilience

INSIGHTS INTO REGIONAL DEVELOPMENT
ISSN 2669-0195 (online) http://jssidoi.org/jesi/
2020 Volume 2 Number 4 (December)
http://doi.org/10.9770/IRD.2020.2.4(6)
811
Homeland Security. (2013). Supplemental Tool: Executing A Critical Infrastructure Risk Management Approach. Washington DC:
Homeland Security. Retrieved from https://www.cisa.gov/publication/nipp-2013-ci-risk-management-approach
Homeland Security. (2013). Supplemental Tool: Incorporating Resilience into Critical Infrastructure Projects. Washington DC: Homeland
Security. Retrieved from https://www.cisa.gov/publication/nipp-2013-resilience-ci-projects
Homeland Security. (2013). Supplemental Tool: NPPD Resources to Support Vulnerability Assessments. Washington DC: Homeland
Security. Retrieved from https://www.cisa.gov/publication/nipp-2013-resilience-ci-projects
Homeland Security. (2015). Energy Sector-Specific Plan. Washington DC: Homeland Security. Retrieved from
https://www.cisa.gov/publication/nipp-ssp-energy-2015
Homeland Security. (2016). Critical Infrastructure Threat Information Sharing Framework. Washington DC: Homeland Security.
Retrieved from https://www.cisa.gov/publication/ci-threat-info-sharing-framework
Information System Authority. (2020, January 24). CERT-EE. Retrieved from Information System Authority: https://ria.ee/en/cyber-
security/cert-ee.html
ITU. (2019). Global Cybersecurity Index (GCI) 2018. Geneva: ITU. Retrieved from https://www.itu.int/dms_pub/itu-d/opb/str/D-STR-
GCI.01-2018-PDF-E.pdf
Izycki E., C. R. (2019). Protection of critical infrastructure in national cyber security strategies. Coimbra: European Conference on Cyber
Warfare and Security. Retrieved from
https://www.researchgate.net/publication/335760609_Protection_of_critical_infrastructure_in_national_cyber_security_strategies
Joint Committee on the National Security Strategy. (2018). Cyber Security of the UK’s Critical National Infrastructure: Third Report of
Session 2017–19. London: House of Lords & House of Commons. Retrieved from
https://publications.parliament.uk/pa/jt201719/jtselect/jtnatsec/1708/1708.pdf
Joint Committee on the National Security Strategy. (2018). Cyber Security Skills and the UK’s Critical National Infrastructure: Second
Report of Session 2017–19. London: House of Lords & House of Commons. Retrieved from
https://publications.parliament.uk/pa/jt201719/jtselect/jtnatsec/706/706.pdf
Limba, T., Plėta, T., Agafonov, K., & Damkus, M. (2017). Cyber security management model for critical infrastructure. Entrepreneurship
and Sustainability Issues, 4(4), 559-573. https://doi.org/10.9770/jesi.2017.5.2(15)
National Cyber Security Centre. (2020). National Cyber Security Centre. Retrieved from National Cyber Security Centre:
https://www.nksc.lt/en/
National Cyber Security Centre. (2020). What we do . Retrieved from National Cyber Security Centre:
https://www.ncsc.gov.uk/section/about-ncsc/what-we-do
NATO Energy Security Center of Excellence. (2020). About. Retrieved from NATO Energy Security Center of Excellence:
https://enseccoe.org/en/about/6
NIST. (2018). Framework for Improving Critical Infrastructure Cybersecurity. Washington: National Institute of Standards and
Technology. doi:https://doi.org/10.6028/NIST.CSWP.04162018
Republic of Estonia. (2018). Cybersecurity Act. Tallinn: Republic of Estonia. Retrieved from
https://www.riigiteataja.ee/en/eli/523052018003/consolide
Republic of Estonia. (2018). Cybersecurity Strategy 2019-2022. Tallinn: Republic of Estonia. Retrieved from
https://www.mkm.ee/sites/default/files/kyberturvalisuse_strateegia_2022_eng.pdf

INSIGHTS INTO REGIONAL DEVELOPMENT
ISSN 2669-0195 (online) http://jssidoi.org/jesi/
2020 Volume 2 Number 4 (December)
http://doi.org/10.9770/IRD.2020.2.4(6)
812
Republic of Estonia. (2018). Requirements for risk analysis of network and information systems and description of security measures.
Tallinn. Retrieved from https://www.ria.ee/en/cyber-security/critical-information-infrastructure-protection-ciip.html
Secretariat-General for National Defence and Security. (2017). The Critical Infrastructure protection in France. Paris: Government of
France. Retrieved from http://www.sgdsn.gouv.fr/uploads/2017/03/plaquette-saiv-anglais.pdf
Technical Committee ISO/IEC JTC 1. (2013). Information technology - Security techniques - Code if practice for information security
controls. Switzerland: ISO/IEC. Retrieved from https://www.iso.org/standard/62726.html
US Department of Energy. (2015). Energy Sector Cybersecurity Framework Implementation Guidance. Washington DC: US Department
of Energy. Retrieved from
https://www.energy.gov/sites/prod/files/2015/01/f19/Energy%20Sector%20Cybersecurity%20Framework%20Implementation%2
0Guidance_FINAL_01-05-15.pdf
Acknowledgements
This research is/was funded by the European Social Fund under the No 09.3.3-LMT-K-712 “Development of Competences of
Scientists, other Researchers and Students through Practical Research Activities” measure.

INSIGHTS INTO REGIONAL DEVELOPMENT
ISSN 2669-0195 (online) http://jssidoi.org/jesi/
2020 Volume 2 Number 4 (December)
http://doi.org/10.9770/IRD.2020.2.4(6)
813
Manuela TVARONAVIČIENĖ is professor at Vilnius Gediminas Technical University and Jonas Zemaitis Military
Academy of Lithuania. She is national head of several international projects, financed by European Commission, author of
numerous papers, editor of a book, published by Elsevier. Her research interests embrace wide range of topics in area of
sustainable development and security issues.
ORCID ID: https://orcid.org/0000-0002-9667-3730
Tomas PLĖTA is a Communications and Information System Security Officer / Head of Division at the NATO Energy
security Center of Excellence and PhD student at Vilnius Gediminas Technical University. His PhD topic related to cyber
security management for critical energy infrastructure. His research interests also include information and data security, data
protection and Industrial control system cybersecurity.
ORCID ID: https://orcid.org/0000-0002-5376-6873
Silvia DELLA CASA is an MA student at the University of Bologna at the Interdisciplinary Research and Studies of Eastern
Europe (MIREES) and intern in the NATO Energy Security Centre of Excellence (ENSEC COE) in Vilnius. Her MA paper
topic related to cyber security management and energy security management. Her research interests also include hybrid
warfare and cyber security issues. ORCID ID: https://orcid.org/0000-0003-3231-8323
Juozas LATVYS is a PA officer at the NATO Energy Security Centre of Excellence ([email protected]). His
main research interests are related to cyber security management of states critical energy infrastructure, state geopolitical
aspects and its influence through strategic national resources, energy sector development and its impact on states economies.
ORCID ID: https://orcid.org/0000-0002-9284-677X
Register for an ORCID ID:
https://orcid.org/register
Copyright © 2020 by author(s) and VsI Entrepreneurship and Sustainability Center
This work is licensed under the Creative Commons Attribution International License (CC BY).
http://creativecommons.org/licenses/by/4.0/

INSIGHTS INTO REGIONAL DEVELOPMENT
ISSN 2669-0195 (online) http://jssidoi.org/IRD/
2020 Volume 2 Number 4 (December)
http://doi.org/10.9770/IRD.2020.2.4(7)
Publisher http://jssidoi.org/esc/home
814
INFLUENCE OF BREXIT ON EDUCATION TOWARDS EUROPEANISM*
Marcel Lincényi ¹, Martin Laczko ²
1,2 Alexander Dubček university of Trenčin, Študentská 1639/2, 911 01 Trenčín, Slovakia
E-mails:1 [email protected] ; 2 [email protected]
Received 18 July 2020; accepted 10 October 2020; published 30 December 2020
Abstract. The present research study explores the extent to which the withdrawal of the UK from the European Union may negatively
affect the efforts to lead in particular young people to have a positive attitude towards this integration group, enhance a feeling of belonging
to it or a certain sense of common European citizenship. The main aim of the paper was to identify those selected circumstances of Brexit
and its campaigns that could evoke strong Eurosceptic sentiments and, on the contrary, look for ways to eliminate these negative
tendencies. The authors discuss how a populist, emotionally focused and often misleading campaign has significantly contributed to the
vote of Brexit in a referendum, which is a precedent that may under certain circumstances be repeated in other member countries. The
paper also discusses the media dimension of the topic. Especially the question of spreading misinformation, hoaxes, conspiracy or
propaganda in alternative media that can strengthen Euroscepticism in many EU countries, including the Slovak Republic.
Keywords: Brexit; education; European Union; Euroscepticism; media
Reference to this paper should be made as follows: Lincényi, M., Laczko, M. 2020. Influence of Brexit on education towards
Europeanism. Insights into Regional Development, 2(4), 814-824. http://doi.org/10.9770/IRD.2020.2.4(7)
JEL Classification: F50, F68, Z11
Additional disciplines: General, Policy, Economics of the Arts and Literature
1. Introduction
Brexit, the British referendum on the withdrawal of the United Kingdom of Great Britain and Northern Ireland
(further referred to as the United Kingdom) from the European Union, is still an actual topic. The issue of the
impact of the UK's withdrawal from the European Union is still a very crucial issue for European or international
politics. Brexit, therefore, represents an opportunity to study a unique political phenomenon, which is currently
insufficiently professionally researched and still in the process of its development at the time of writing.
Especially in the Slovak professional literature, we record a lack of scientific works or publications dealing with
* This research was carried out in the framework of the project KEGA 003TnUAD-4/2018: Innovation of methodological
letters for teachers of civic education from the point of view of prevention of manifestations of extremism and education for
democratic citizenship

INSIGHTS INTO REGIONAL DEVELOPMENT
ISSN 2669-0195 (online) http://jssidoi.org/jesi/
2020 Volume 2 Number 4 (December)
http://doi.org/10.9770/IRD.2020.2.4(7)
815
this phenomenon and its impact. “From this point of view, the prevention itself is crucial, which should be
applied, among other things, in curriculum at primary schools and secondary schools or grammar schools.”
(Čársky, 2019:7) We know that the citizens of Great Britain chose a final divorce with the European Union on 23
June 2016. With this decision, they moved their country to a position in which no other member state of EU has
been before. The unprecedented election of British people pushed their country into a new unknown era. It was
the start of a long marathon of political negotiations between the two sides, which are still not finished and it is
still not clear under what conditions Britain will leave the EU. Dlhá a komplikovaná cesta taktiež viedla aj k
tomuto referendu. “Much of the country, especially England, has always been relatively less inclined and
unfavourable about European political integration.“ (Cremedes, Novak 2017:5) The more or less openly declared
goal of most British governments, from the Labor government of Harold Wilson to the government of David
Cameron, was to keep further political or economic integration or the merging of sovereignty, to a minimum.
Perceptions of European integration were usually negative, and European integration was presented by most
media as a process of loss rather than sharing sovereignty (Cremedes, Novak 2017).
During the referendum campaign, many advocates of leaving the EU emphasised the vision of UK independence,
which harnesses the potential of its citizens through direct democratic control, as well as national and local self-
government and giving maximum freedom and responsibility to its people. There is, therefore, strong opposition
to the concepts and ideas of shared sovereignty, multilevel governance at European level, supranational
democracy or an ever closer union, in which decisions are taken as close as possible to the citizen following the
principle of subsidiarity (Cremedes, Novak 2017).
The UK Independence Party (UKIP), which won almost four million votes (13%) in the May 2015 elections, has
been openly campaigning for the UK's withdrawal from the EU for many years. They were soon joined by several
members of the Conservative Party's Eurosceptic wing and even six members of the cabinet. On the other hand,
the Labour Party, the Liberal Democratic Party and the Scottish National Party were in a campaign for staying in
the EU (Cremedes, Novak 2017).
As the A. Hrubinko (2019, p. 126) wrote, the general public attitude towards European integration was marked by
instability, which was caused by insufficient awareness of its citizens, Eurosceptic attitude of leading parties,
conservatism of public sentiment and specificity of British identity, anti-European propaganda of the leading
press. Contradictory character of European policy of the British governments and the lack of popularity of the
unifying tendencies in the region among the local public caused the lack of unity in the question of the future
participation of the state in the European Community, the uncertain positions of Great Britain on the eve of key
events in the history of European integration related to the formation of the EU laid the basis for further problems
in the UK's relations with the EU.
Leaving the European Union is an unprecedented process, and the United Kingdom will be the first country to
undergo it. Will it become a model for other EU member states that choose to follow in its footsteps, or will it be
a frightening example that such a step can bring more loss than gain?
2. Methodology and methods
The research problem that we will address is the degree of harmfulness or usefulness of a Member State's
withdrawal from the EU for Great Britain, but also the European Union. The main research goal of the theoretical
study was to identify those selected circumstances of Brexit and its campaigns that could provoke strong
Eurosceptic sentiments, and instead to look for ways to eliminate these negative tendencies.

INSIGHTS INTO REGIONAL DEVELOPMENT
ISSN 2669-0195 (online) http://jssidoi.org/jesi/
2020 Volume 2 Number 4 (December)
http://doi.org/10.9770/IRD.2020.2.4(7)
816
The secondary research objective was to discuss how a populist, emotionally focused and often misleading
campaign significantly contributed to the Brexit vote in a referendum. This precedent may be repeated in the other
Member States in certain circumstances.
Within the methodology of the work, we determined three research questions:
RQ1: What will be the consequences for the United Kingdom of leaving the European Union?
RQ2: What is the forecast of the most significant impacts of Brexit for the United Kingdom, the European Union
and Slovakia?
RQ3: What are the options for increasing the credibility of the European Union and its institutions after Brexit for
citizens of EU member states?
Foreign research literature and Internet articles will serve us as a research file.
The methodology we will use in this work consists of analysis of the current state of negotiations on Brexit,
review and comparison of possible models of post -Brexit economic cooperation between the EU and Great
Britain and forecasts of the most significant impacts of Brexit for Great Britain, European Union and the Slovak
Republic.
2.1 Model and Data
Forecast of the most significant impacts of Brexit
We can say that most of the economic, political and social consequences of Brexit will depend on the future of
economic cooperation between Great Britain and the EU. The European Union was created mainly as an
economic integration structure. The EU's greatest asset is its single market and the customs union, which
guarantees the free movement of goods, services, people and capital between the member states of this group.
However, with this economic integration is also associated a certain level of political integration. The Member
States of the European Union must comply with EU legislation relating to the single market or other EU policies.
They must also contribute to the EU's common budget. Political integration is accepted among the Member States
with much less enthusiasm than that economical. However, the political and economic integration of the Union is
interlinked. No Member State can only enjoy the benefits of its membership in the EU. It must also fulfil the
obligations associated with that membership. That is why the future state of trade relations between Great Britain
and the EU after Brexit will be crucial. It will be about finding compromises. Britain's goal is to gain as much
political freedom as possible from the EU, but at the same time to have the freest possible access to its single
market. In other words, the more political freedom the United Kingdom gains from the EU, the more it will cost
them in the form of negative economic consequences.
In this chapter, we will try to predict the most significant impacts of Brexit. This prediction will help us to form a
picture of whether Britain has a chance to be in a better position after Brexit than when it was a member of the
EU. However, we will also talk about what can happen to the European Union after Brexit, especially in the
political context. Last but not least, we will also mention the most severe possible impacts of Brexit for the Slovak
Republic.

INSIGHTS INTO REGIONAL DEVELOPMENT
ISSN 2669-0195 (online) http://jssidoi.org/jesi/
2020 Volume 2 Number 4 (December)
http://doi.org/10.9770/IRD.2020.2.4(7)
817
Brexit Impact Forecast for the United Kingdom
From an economic point of view, Britain seeks to achieve the highest possible degree of access to the EU single
market, but at the same time the least possible compliance with EU acquis, as well as the least possible
contributions to the common EU budget. Prime Minister May said the UK would not seek to adopt any model
already used by other countries, but instead wanted the British government to enter into an ambitious,
comprehensive economic partnership with the EU. (House of Commons, 2018) We can, therefore, rule out the
possibility that the United Kingdom would remain a member of the European Economic Area or the Customs
Union after Brexit. We may also exclude future trade relations under the terms of the World Trade Organization.
Agreements similar to the Canadian CETA or the Ukrainian DCFTA are possible. Canada's Comprehensive
Economic and Trade Agreement with the EU eliminates tariffs on trade in industrial products between the EU and
Canada. The agreement also includes the substantial elimination of tariffs on agricultural products. CETA also
provides a forum for cooperation on regulatory and technical standards for products from both sides, which will
allow the exchange of relevant information between EU and Canadian regulators, which will help identify areas
where they could cooperate, thus removing some non-tariff barriers to trade. In the case of CETA, it goes well
beyond WTO-GATS provisions, allows worker mobility, mutual recognition of professionals, removes certain
restrictions in financial services and maritime transport services, and also opens up domestic markets for public
procurement. (Emerson. 2017) Another advantage of the EU-Canada CETA agreement is that Canada has access
to the EU's single market without having to comply with the EU's legal obligations or contribute to the EU
budget. The problem is that the European Union does not want to allow the United Kingdom to, figuratively
speaking, pick raisins from a pie. If Britain is to have any access to the single market, it must abide by its rules
and pay for it in the EU budget. Being a member of the single market and not being a member of the EU is also a
problem that the United Kingdom would have no opportunity or influence to change EU acquis, as it would no
longer be represented on EU decision-making bodies. However, the UK wants to retain its ability to influence
possible future changes to EU law, which should be transformed into UK law. (Emerson a kol. 2017) Such a
provision to change the details of the agreement exists under the DCFTA / Association Agreement with Ukraine,
as the lists of EU legislation contained in the annexes to the main text of the agreement may be changed if both
parties agree. (Emerson. 2017) DCFTA agreement can ensure a very high degree of access to the EU single
market. However, it leads to a high degree of compliance with EU acquis and is therefore outside the category of
agreements that the UK would like to reach.
The possibility of a combination of the principles of the CETA and DCFTA agreements, therefore, seems most
likely. There could be set up a system under which the United Kingdom would begin its post-Brexit
independence in full compliance with EU acquis, but could subsequently deviate from it in a specific sector where
it suits it. Such a derogation would, of course, be subject to a mutual agreement. However, as a tax, Britain would
lose preferential access to the market for the goods or services in the area, which are governed by directives from
which Britain would derogate. (Emerson a kol. 2017) This reaffirms our assumption that the agreement on future
British-EU trade relations will be based on the necessary compromises. The more political sovereignty the United
Kingdom gains, the more negative economic consequences await it. This means that it will not be possible for the
United Kingdom to conclude a preferable agreement with the EU that, with its advantages, exceeds full
membership of the European Union. The benefits of acquired political sovereignty could be negligible compared
to the negative economic consequences associated with it.
The economic impact of Brexit will also be dependent on the agreed financial settlement between the EU and the
United Kingdom. If the goal of Brexit is to free the country from the costly financing of the EU budget, we can
say that it can succeed in the long term, but only if the UK no longer remains a member of the single market or
the customs union. However, Britain will have to pay a relatively expensive divorce bill of around 35 to 39 billion
pounds. (Keep, 2018a) Britain will also continue to pay for participation in programs in which it wishes to
maintain membership as well as contributions to the pensions of European employees, which will be a relatively

INSIGHTS INTO REGIONAL DEVELOPMENT
ISSN 2669-0195 (online) http://jssidoi.org/jesi/
2020 Volume 2 Number 4 (December)
http://doi.org/10.9770/IRD.2020.2.4(7)
818
low annual payment, but it will last for decadesHowever, what works in favour of Britain is that it should no
longer pay for access to the single market and membership of the customs union. The paid-up capital from the
EIB and the ECB will also be returned to the UK. The shrinking of the British economy and the fall of the pound
against the euro could be seen mainly as a negative impact, but the positive is that, as a result, Britain will again
contribute a little less to the EU (Curtis. 2017).
Another area in which Britain is to gain more sovereignty after Brexit is control over migration from EU
countries. Citizens' rights, which will be part of the Brexit Agreement, will apply to those UK citizens and EU
citizens, including their family members, who exercised their rights to free movement within the EU / UK before
the date set for Britain's withdrawal from the EU. We can, therefore, say that people living and working in the UK
will have the right to remain in the UK without the need for visas or other residence permits.
The British government has succeeded in gaining the right to require EU citizens living in Britain to apply for
status and freedoms under the Brexit agreement. By this, the government wants to gain more overview and
control over EU immigrants. Given that everything in the agreement is reciprocal, it may happen that some or all
EU Member States will similarly demand the same from UK citizens. As regards the rights of foreign nationals to
social welfare, EU and British negotiators have agreed that the rules on social security coordination will continue
to apply to EU citizens who are covered by the UK social security system or British nationals who are or have
been included in the social security system of a particular EU Member State until the date of withdrawal from the
EU. (Curtis. 2017) This seems like enough compromise to suit both the UK and the EU. Britain will be able to
require visas and residence permits from new EU migrants who have not yet lived there. EU citizens already
living and working in Britain will have the right to stay there after Brexit. They will not be required to have any
visas or residence permits. They will also continue to be covered by the social security system.
The land border between Northern Ireland and the Republic of Ireland also remains an important issue. It should
change from a symbolic internal to a solid external border of the EU after Brexit. Both the EU and the United
Kingdom have pledged to prevent a fixed border on the island of Ireland. However, without Britain being a
member of the single market and the customs union, this will be very difficult to achieve. The proposals to resolve
this situation submitted by the United Kingdom did not satisfy the EU. The possibility of full compliance with the
rules of the single market and the customs union has been moved to the preliminary EU withdrawal agreement.
(House of Commons 2018) While this would certainly remove the need for a land border, it is again at odds with
Britain's plans to leave the EU's single market and customs union. If Britain wanted to keep only Northern Ireland
in the customs union, a border would have to be created in the Irish Sea, which would cut the region off from the
rest of the country. This would have negative effects on trade not only in the United Kingdom but also in Ireland.
This possibility was therefore rejected by the British Government. In any case, for now, it looks like Britain, with
its current position, will have to establish a solid border with Ireland after Brexit. This would have several adverse
effects, in particular, related to cross-border trade and people's mobility. Such a border would also be contrary to
the Treaty of Good Friday, and a breach of that Treaty could jeopardise the fragile peace between Great Britain
and Ireland.
Not all authors are determined whether Brexit will be positive or negative for the UK. „But what is better for
Great Britain, stay in or go out? There is no universal answer to this question. It depends which way we look at it
or what we believe is important.“ (Melus, 2016, p. 462).

INSIGHTS INTO REGIONAL DEVELOPMENT
ISSN 2669-0195 (online) http://jssidoi.org/jesi/
2020 Volume 2 Number 4 (December)
http://doi.org/10.9770/IRD.2020.2.4(7)
819
Brexit impact forecast for the EU and Slovakia
The departure of Great Britain forms the EU should not mean significant economic damage to the European
Union as a whole. The biggest downside is that the EU will lose one of its most significant net contributors to its
budget. The United Kingdom will continue to contribute to this budget, but a much lesser extent than before
Brexit. A significant advantage for the EU may be that large banks, financial service providers or British
companies can start relocating to the EU, which can create a lot of new jobs in the EU and strengthen its
economy. Brexit's challenges for the EU are mainly political. The very vote for Brexit in the UK has sparked a
wave of nationalism and Euroscepticism across Europe. Questions have arisen about the future viability of the
European Union. (Ford, Goodwin, 2017) Many European (far-right) political parties and movements have
included in their electoral programs a request to give the citizens of their country a similar opportunity to decide
in a referendum on membership in the European Union as a people in the UK did. Some of these parties have
failed, such as the French National Front of Marine le Pen or the Dutch Independence Party of Geert Wilders.
However, many parties may have achieved small or more significant victories thanks to such a policy. An
example is that several European Eurosceptic, nationalist and populist political parties were elected to their
national parliaments. The Alternative for Deutschland party, which is often described as neo-Nazi, has entered the
German parliament. The populist Freedom and Direct Democracy party of Tomio Okamura entered the Czech
parliament, and the referendum on the EU was one of the mainstays of this party's election campaign. In Slovakia,
the far-right Kotleba - the People's Party of Our Slovakia, entered the parliament after the last elections This party
is currently the loudest critic of the European Union of all Slovak parliamentary parties and is also pushing for a
referendum on EU membership. If the support of the Eurosceptic parties continues to grow, the EU may lose
more members in the future. On the other hand, the Union will by Brexit get rid of its most critical member and
biggest opponent of European political integration. For the EU, this means an opportunity for even deeper
political integration. In the future, therefore, it may happen that the European Union will no longer be just an
integration grouping, but will become a kind of superstate based on the principle of the federal establishment. So
it could become something like the United States of Europe.
Slovakia is one of those countries in the European Union that is likely to experience the harmful effects of Brexit.
Britain is the 5th largest export market for Slovakia, our exports to the United Kingdom represent more than 5%
of GDP, only four European countries have a higher ratio. (KPMG, 2017) In the case of labour mobility, Slovakia
is also in slight risk. Still, the Brexit negotiations have already reached an agreement on preserving the rights of
EU citizens living in the United Kingdom and the British living in the EU Member States. So there are likely to
be specific groups of people who will have the right to live and work in the UK. Still, the new administrative
procedures for applying for this status may make it more difficult or impossible for them to exercise these rights.
The share of exports to Britain in terms of total exports or as a percentage of GDP ranks Slovakia among the
countries that will be most affected by Britain's exit from the EU single market. Exports to the United Kingdom
accounts for the largest share of the total exports in Ireland (4.17%), Slovakia (3.27%), Spain (2.87%) and
Germany (2.54%). If we take into account the share of exports to Britain in relation to GDP, Slovakia is one of
the most endangered countries. Within the EU member states, Luxembourg has the largest share of exports in
GDP to the UK with 10.1%. It is followed by Malta (9.1%), the Netherlands (7.6%), Belgium (7.3%) and
Slovakia (5.2%) closes the top five (KPMG, 2017).
Cars account for almost half of exports to the UK. The United Kingdom is the second-largest export market for
our car manufacturers and every seventh car made in Slovakia goes to Britain. Following the UK's exit from the
single market, exports to the British Isles can be more complicated for all car manufacturers in continental
Europe, to what extent, that will be determined by a final agreement between the UK and the European Union
(Melioris, 2016).
INSIGHTS INTO REGIONAL DEVELOPMENT
ISSN 2669-0195 (online) http://jssidoi.org/jesi/
2020 Volume 2 Number 4 (December)
http://doi.org/10.9770/IRD.2020.2.4(7)
820
Another economic impact of Brexit for the Slovak economy is a slowdown in GDP growth; most economists and
analysts expect a slowdown in Slovak GDP growth in the range from one-tenth to two-tenths of a percentage
point due to Brexit. A more severe problem is the expected slowdown in economic growth in more of the euro
area countries, which could again have a negative effect on Slovak exports. The downturn in the British economy
will have a direct impact on our exporters. However, our economy will feel a more pronounced effect secondarily
through the slowdown of our main trading partners. The impact of growing uncertainty and weakening investor
and consumer confidence will also be substantial, especially in Britain, but also in other EU countries. The
strengthening of the euro against the pound and the currencies of neighbouring countries will worsen the price
competitiveness of Slovak exporters. (Melioris a kol., 2016) According to estimates by the National Bank of
Slovakia, the Slovak economy due to Brexit could experience a slowdown in the economic growth of 0.34% by
2020. In 2017, the NBS estimated the economic growth of the Slovak Republic at the level of 3.3% and the
creation of approximately 80,000 new jobs by 2018. However, the departure of the United Kingdom from the EU
could, according to NBS analysts, affect these forecasts and create 5,300 fewer jobs in Slovakia by 2020 (Vravec,
2017).
One of the indirect effects may be the return of a large number of Slovaks from the British labour market home to
Slovakia. (Vravec, 2017) Another indirect impact for Slovakia may be the fact that Brexit means the departure of
a member of the Union who pushed for modernisation and progressive economic reforms. Britain's withdrawal
from the EU may reduce the pro-reform efforts and innovation potential that the country has represented within
the Union.
On Wednesday 2 May 2018, the European Commission presented a draft of the new post-brexit budget of the
European Union for the years 2021-2027. The Commission presented a budget of almost € 1.14 trillion (€ 1.28
trillion when inflation is taken into account), representing 1.11% of the total economic output (after Brexit) of the
27 EU countries. This represents a slight increase over the current budget for 2014-2020, which amounts to € 1.09
trillion (1.03% of the EU's economic output). (TASR, 2018) For EU member states, including Slovakia, this will
mean higher contributions to the EU budget. The system by which the EU wants to penalize the Member States
violating the EU law is also interesting. Under this mechanism, compliance with EU law will be linked with
access to EU money. This means that in the event of non-compliance with them, Union funds for a particular state
will be frozen (TASR, 2018). This could be seen as a new political tool through which the EU wants to force
some rebel states to be more in line with their policy and thus to deeper political integration.
To sum it up, the extent of Brexit's adverse economic impact on Slovakia will depend on the shape of the future
trade agreement between the United Kingdom and the European Union. The United Kingdom is the fifth-largest
export market for us. If it does not secure access to the single market in the negotiations, the Slovak economy may
be negatively affected by the introduction of tariff and non-tariff barriers in international trade. Brexit can also
slow our economic growth and job creation. It may increase the Slovaks' tendency toward Euroscepticism and
reduce their efforts to reform the EU. Another impact of Brexit may be the return of a large number of Slovaks
from the British labour market to Slovakia. That could help the Slovak malnourished labour market. However, it
is possible that if Slovaks begin to return en masse from Britain, there will not be enough jobs at home for them.
If Britain succeeded in negotiating a free trade agreement, at least in the area of goods, the negative economic
impact on Slovakia would be considerably smaller. Due to the loss of Great Britain's contributions to the EU
budget, Slovakia will contribute more to the EU and receive less from it. As for the effects of Brexit on Slovaks
living in Great Britain, their further stay in this country should not be endangered by Brexit. It also applies to
some of their family members and children. The only problem may be the process of applying for the new
resident status provided by the Brexit Agreement, some people may fail in this process, may not know about it or
may not be able to prove their stay or work sufficiently. The reason for the mass withdrawal of Slovaks from
Britain may be the weakening of the British economy. Working and living in the UK may no longer be so
beneficial for Slovaks, so many of them may decide to return home.

INSIGHTS INTO REGIONAL DEVELOPMENT
ISSN 2669-0195 (online) http://jssidoi.org/jesi/
2020 Volume 2 Number 4 (December)
http://doi.org/10.9770/IRD.2020.2.4(7)
821
3. Problem Solution
The referendum on Britain's withdrawal from the European Union is a unique and unprecedented phenomenon.
The study shows several conclusions:
The final agreement will be a compromise between gaining greater political sovereignty of Britain and the
negative economic consequences that would result from it. The final agreement could, therefore, take the form of
a comprehensive, in-depth economic partnership, in which Britain could choose in which segment of the
common market it wants to have preferential access. However, it would have to comply with EU legislation
applicable to the selected market segment. The EU is likely to ask Britain for financial contributions to its
budget, for any preferential access to its single market.
We also analysed the outcome of the Brexit negotiations to date, which were published in a joint report by the
United Kingdom and the EU in December 2017. It helped us to find out what the financial settlement between
the UK and the EU might look. Assuming that the UK wants to free itself from the costly financing of the EU
budget, it can be said that it can succeed in the long term, of course, it will also depend on the extent to which it
has access to the EU's single market. Britain will also have to pay a Divorce bill of around £ 35 to £ 39 billion. It
should continue to contribute for participation in programs in which it wishes to maintain membership. Britain
will also continue to contribute to the pensions of European employees, which will be a relatively low annual
contribution, but this contribution will last for decades. However, what works in favour of Britain is that it should
no longer pay for access to the single market and membership of the customs union. However, this depends on
the degree of access to this market that could be negotiated in the framework of a new comprehensive trade
agreement. However, the UK's access to the EU market is far from as complex as that of EU membership.
Therefore, if there will be some contributions to the EU single market in the future, they are likely to be much
lower than at present. The paid-up capital from the EIB and the ECB will also be returned to the UK. The
shrinking of the British economy and the fall of the pound against the euro could be seen mainly as a negative
impact, but the positive thing is that as a result, Britain will again pay the EU a little less. Exactly how much
Britain will pay for Brexit will not be known until all payments related to the withdrawal have been made.
However, the estimated cost of this break-up looks more favourable than if Britain were to continue to pay high
net contributions to the EU budget each year.
Another area in which Britain is to gain more sovereignty after Brexit is control over migration from EU
countries. Citizens' rights, which will be part of the Brexit Agreement, will apply to those UK citizens and EU
citizens, including their family members, who exercised their rights to free movement within the EU / UK before
the date set for Britain's withdrawal from the EU. It can, therefore, be said that people living and working in the
UK will have the right to stay there, without the need for visas or other residence permits. However, the United
Kingdom will require EU citizens to register their residence in the country after Brexit. Given that everything in
the agreement is reciprocal, it is possible that some or all EU Member States will similarly demand the same
from UK citizens. As regards the rights of foreign nationals to social welfare, EU and British negotiators have
agreed that the rules on social security coordination will continue to apply to EU citizens who are covered by the
UK social security system or British nationals, who are or have been included in the social security system of a
particular EU Member State until the date of withdrawal from the EU. It is a fair two-way compromise, it will
give the UK more control over immigration from the EU, but at the same time, people who already live in the
UK will have the right to continue to live and work in it.
On the issue of the Irish border, we have found that the United Kingdom has not yet provided a sufficiently
comprehensive and workable solution to exit the single market and the customs union while maintaining an open
and invisible land border between Northern Ireland and the Republic of Ireland. Currently, a solid border is most
likely to be created on the island of Ireland, which will have substantial implications for imports and exports

INSIGHTS INTO REGIONAL DEVELOPMENT
ISSN 2669-0195 (online) http://jssidoi.org/jesi/
2020 Volume 2 Number 4 (December)
http://doi.org/10.9770/IRD.2020.2.4(7)
822
between Ireland and the United Kingdom. It can also directly jeopardise the Good Friday Agreement, which
guarantees peace and cooperation between the Irish and the British.
Conclusion
Given the aim of our work, we can say that the United Kingdom will not be in a better position with Brexit than
under its membership in the European Union. The positive effects of the financial balance between the EU and the
United Kingdom, stronger control over immigration and greater political sovereignty will not offset the negative
economic impact of leaving or restricting access to the EU single market or abolishing membership of the
European Customs Union. Thus, with our final hypothesis, we assume that Brexit will do more harm than good to
the UK.
As wrote Kamil Kotlinki (2018, str. 157), the effects of the United Kingdom leaving the EU will be more
unfavorable for the UK than for the EU. The amount of losses depends on the type of Brexit. A soft Brexit means
a relatively slow negotiation designed to retain as close as possible a relationship with the rest of the EU. Access
to the EU's single market will reduce losses due to having as few tariffs as possible. A hard Brexit would mean
getting out of the EU quickly, having no institutional or political relationship with the union, and regaining full
control of UK borders. Therefore, a negotiated free trade deal with the EU would seem to reduce losses for
everyone.
According to Jean Arthuis (2018, str. 37), Brexit is a chance for Europe. It casts a cruel light on the institutional
fragility of the European Union, whose functioning is hardly defensible to public opinion.
In the article, we also set a partial goal, which is to predict the most severe possible impacts of the Brexit for the
European Union, including the effects for the Slovak Republic. Perhaps the most substantial economic impact for
the European Union will be the fact that it will lose one of the most significant net contributors to its budget and
the second strongest economy of all member states. The relocation of large British companies, banks and financial
service providers to EU countries can be a significant positive. The draft of the European Commission's new post-
Brexit budget, which was presented in May 2018, already counts with losses. It should be a combination of cuts
and higher contributions from the Member States. Also noteworthy is the proposed mechanism that would allow
the EU to financially penalise the Member States for their inadmissible proceedings. This is just one more
indication that the EU will work even harder for greater political integration. The EU will undoubtedly want to
take advantage of the fact that the most critical member of its political integration will leave it. It is, therefore,
possible that in the future, the EU will have an even more significant impact on the policies of its Member
StatesEurosceptic, populist or far-right parties in Europe will fight against this. Brexit has given inspiration to
such parties if they continue to gain momentum, it is possible that the EU will lose more members in the future.
The extent of the negative economic impact of Brexit for Slovakia will again depend on the shape of the future
trade agreement between the United Kingdom and the European Union. The United Kingdom is the fifth-largest
export market for us. If Britain does not secure access to the common market in the negotiations, the Slovak
economy may be negatively affected by the introduction of tariff and non-tariff barriers in international trade. For
example, the important export of our cars can be significantly affected. Brexit can also slow our economic growth
and job creation. It may increase the Slovaks' tendency toward Euroscepticism and reduce their efforts to reform
the EU. Another impact of Brexit may be the return of a large number of Slovaks from the British labour market
to Slovakia. Due to the loss of Great Britain's contributions to the EU budget, Slovakia will contribute more to the
EU and receive less from it. As for the effects of Brexit on Slovaks living in Great Britain, their further stay in
this country should not be endangered by Brexit. It also applies to some of their family members and children.
The only problem may be the process of applying for the new resident status provided by the Brexit Agreement,
some people may fail in this process, may not know about it or may not be able to prove their stay or work
sufficiently.

INSIGHTS INTO REGIONAL DEVELOPMENT
ISSN 2669-0195 (online) http://jssidoi.org/jesi/
2020 Volume 2 Number 4 (December)
http://doi.org/10.9770/IRD.2020.2.4(7)
823
Brexit in the United Kingdom, after the European economic crisis, the migration crisis is another important reason
why the negative moods of citizens in the European Union are increasing. The authors, therefore, believe that the
Council of the European Union and the European Commission can contribute to increasing citizens' credibility
with the European Union by addressing issues that affect EU citizens as a matter of priority. "Representatives of
the Slovak Republic in European institutions play a vital role, including members of the European Parliament,
who should explain the positives of EU membership to the citizens of the Slovak Republic" (Bočáková, Lincényi,
2014, p. 50).
The authors also agree with several authors that a positive identity with membership in the European Union could
be enhanced by more intensive citizenship education. "The European dimension of education and training is still
relevant not only in the old member states of the European Union but also in the new or future member states"
(Hubálek, Lincényi, Staněk 2018, p. 56).
Last but not least, an effective marketing and media campaign could help to improve public opinion on the
European Union's action as well as on citizens' trust in the European institutions. Such a campaign should be
carried out throughout the European Union under the coordination of the European Commission. (Lincényi, 2018,
p. 433)
References
CREMEDES, M. T., NOVAK, P. 2017. Brexit and the European Union: General Institutional and Legal Consideration. [E-Reader
Version]. Retrieved from https://www.europarl.europa.eu/thinktank/en/document.html?reference=IPOL_STU(2017)571404
ČÁRSKY, J. 2019. The importance of media education in terms of prevention against extremism in the subject of Civic education in
Slovak republic. In: Sborník z VIII. Mezinárodní vědecké konference studentú doktorských studijných programú v oblasti společenských
věd. Praha: Nakladatelství Epocha, 2019. ISBN: 978-80-7557-240-0. p. 7.-14.
EMERSON, M., 2017. An Assessment of the Economic Impact of Brexit on the EU27. European Parliament. Brussels.
FORD, G., GOODWIN, M. 2017. Britain After Brexit. In Journal of Democracy. [E-Reader Version]. Retrieved from:
https://www.journalofdemocracy.org/articles/britain-after-brexit-a-nation-divided/
VRAVEC, J. 2017. Analýza vybraných ekonomických aspektov odchodu Veľkej Británie z Európskej únie (Analysis of selected economic
aspects of the UK's exit from the European Union). FINANČNÉ TRHY. ISSN 1336-5711, 1/2017 1-7
CURTIS, J. 2017. Brexit: 'sufficient progress' to move to phase 2. Retrieved from:
https://researchbriefings.files.parliament.uk/documents/CBP-8183/CBP-8183.pdf
HOUSE OF COMMONS. 2018. The land border between Northern Ireland and Ireland. Retrieved from:
https://publications.parliament.uk/pa/cm201719/cmselect/cmniaf/329/329.pdf
KEEP, M. 2018. The UK's contribution to the EU Budget. Retrieved from: https://researchbriefings.parliament.uk/.../Summary/CBP-7886
KPMG. 2017. Odhad vplyvu Brexitu na Slovensko (Estimation of the impact of Brexit on Slovakia). Retrieved from:
https://home.kpmg.com/sk/sk/home/media/press-releases/2017/03/slovensko-patri-medzi-krajiny-eu-najviac-ohrozene-brexitom.html
MELIORIS, L. 2016. What will Brexit bring? Estimation of the impact of Brexit on the Slovak economy. Retrieved from:
http://www.finance.gov.sk/Default.aspx?CatID=11174
TASR. 2018. Eurokomisia predstavila návrh nového rozpočtu EÚ po odchode Británie (The European Commission presented a draft of the
new EU budget after Britain's departure). Retrieved from: http://www.teraz.sk/najnovsie/ek-predstavila-navrh-noveho-rozpoctu/322899-
clanok.html

INSIGHTS INTO REGIONAL DEVELOPMENT
ISSN 2669-0195 (online) http://jssidoi.org/jesi/
2020 Volume 2 Number 4 (December)
http://doi.org/10.9770/IRD.2020.2.4(7)
824
LINCÉNYI, M. 2018. Prieskum názorov Slovákov na budúcnosť Európskej únie (A survey of the opinion of the citizens of Slovak on the
future of the European Union). Proceedings of the 19th International Scientific Conference “International Relations 2018: Current Issues
in World Economy and Politics”: Bratislava : Ekonomická univerzita, 424-435.
HUBÁLEK, T., LINCÉNYI, M., STANĚK, A. 2018. A comparative analysis of pupils' and teachers' public opinion on European
citizenship and European identity in the Czech Republic and the Slovak Republic, 2018. Economic Annals-XXI. ISSN 1728-6220. 171, (5-
6), 50-56.
BOČÁKOVÁ, O., LINCÉNYI, M. (2014). Perception of Slovakia´s membership in the European Union from the perspective of Slovaks,
2014. In: Proceedings of the 2nd international conference on European integration 2014. - Ostrava: VŠB, 43-50.
HRUBINKO, A. 2019. The way to Brexit: A socio-political dimension of Great Britain's participation in the processes of European
integration. In UKRAINSKYI ISTORYCHNYI ZHURNAL, 6, 126-141,
KOTLINSKI, K. 2018. The economic consequences of leaving European Union by Great Britain. EKONOMIA I PRAWO-ECONOMICS
AND LAW, 17(2), 157-167.
ARTHUIS, J., FARRELL, H. 2018. What future for a democratic Europe following brexit? TOCQUEVILLE REVIEW, 39(1), 37-48
MELUS, M. 206. REFERENDUM ABOUT "BREXIT" AND FURTHER DEVELOPMENT IN GREAT BRITAIN. Proceedings of 14th
international scientific conference: Economic policy in the European union member countries. 462-470
Acknowledgements
This research was carried out in the framework of the project KEGA 003TnUAD-4/2018: Innovation of methodological
letters for teachers of civic education from the point of view of prevention of manifestations of extremism and education for
democratic citizenship.
Short biographical note about the contributors at the end of the article (name, surname, academic title and scientific degree, duties,
research interests):
Marcel LINCÉNYI, PhD. in Media studies, obtained at Constantine the Philosopher University in Nitra, currently at Department of
Political Science as associate professor, Trenčín University of Alexander Dubček in Trenčín (TnUAD), Slovakia.
ORCID ID: https://orcid.org/0000-0002-9076-026X
Martin LACZKO, Mgr. is currently external PhD. student at the Department of Political Science, Alexander Dubček University of
Trenčín in Trenčín, Slovakia
ORCID ID: https://orcid.org/0000-0002-9620-2541
Make your research more visible, join the Twitter account of INSIGHTS INTO REGIONAL DEVELOPMENT:
@IntoInsights
Copyright © 2020 by author(s) and VsI Entrepreneurship and Sustainability Center
This work is licensed under the Creative Commons Attribution International License (CC BY).
http://creativecommons.org/licenses/by/4.0/

INSIGHTS INTO REGIONAL DEVELOPMENT
ISSN 2669-0195 (online) http://jssidoi.org/IRD/
2020 Volume 2 Number 4 (December)
http://doi.org/10.9770/IRD.2020.2.4(8)
Publisher http://jssidoi.org/esc/home
825
EMPIRICAL TEST OF CAPITAL ASSET PRICING MODEL ON SECURITIES RETURN OF LISTED
FIRMS IN NIGERIA
Henry Usunobun Ogiugo 1, Isaac Olufemi Adesuyi 2, Sunday Oseiweh Ogbeide 3
1Department of Accounting and Finance
Faculty of Management Sciences
AJAYI Crowther University, Ibadan, Oyo State, Nigeria
2Department of Business Administration
Faculty of Humanities, Social & Management Sciences
Elizade University, Ilara-Mokin, P.M.B. 002, Ondo State, Nigeria
3Department of Accounting and Finance
Faculty of Humanities, Social & Management Sciences
Elizade University, Ilara-Mokin, P.M.B. 002, Ondo State, Nigeria
E-mails: [email protected]; [email protected]; [email protected]
Received 18 May 2020; accepted 10 October 2020; published 30 December 2020
Abstract: This paper applied the capital-asset pricing model (CAPM) to determine stock returns of listed firms in the Nigeria Stock
Exchange (NSE). For the purpose of investigation, annual data on stock price of twenty six (26) listed firms, Treasury bill a measure of
risk- free rate and all share indexes a proxy for market returns were extracted while beta value was computed for the period 2010 to 2016
upon which the model was analyzed. Finding indicates that the CAPM generated a very high return among the firms given the influence of
the beta coefficient. The study concludes that higher market risk measured by beta, is associated with higher expected returns. It is
therefore recommended that managers of firms in other sectors in Nigeria need to constantly use this model to price security return with a
view to guiding investors at investing in securities based on risk preference behavior and also to enable them maximize wealth from a
basket of portfolio. .
Key words: Market returns; Treasury bill; beta; covariance; security return; Stock Returns
Reference to this paper should be made as follows: Ogiugo, H.U., Adesuyi, I., & Ogbeide, S.O. (2020). Empirical test of capital asset
pricing model on securities return of listed firms in Nigeria. Insights into Regional Development, 825-836.
http://doi.org/10.9770/IRD.2020.2.4(8)
JEL Classifications: G12, E4
1. Introduction
The capital asset pricing model (CAPM) of Sharpe (1964) grew from the mean- variance analysis of Harry
Markowitz in 1952 and 1959 to assess securities risk and returns in the stock market. The mean- variance is used
to assess the risk peculiar to individual securities against the expected returns. The mean- variance approach

INSIGHTS INTO REGIONAL DEVELOPMENT
ISSN 2669-0195 (online) http://jssidoi.org/jesi/
2020 Volume 2 Number 4 (December)
http://doi.org/10.9770/IRD.2020.2.4(8)
826
holds the view that expected return (gain) from securities is a reflection of the level of associated risk. Following
this, the CAPM demonstrates the linear association between market risk and return of portfolios given risk-free
rate (Lipiec, 2014). The risk free asset often measured with Treasury bills and government bond is used to
minimize risk and maximize returns in the capital asset pricing model. Example of risk- free asset is Treasury
bills. Treasury bills as money market instrument attract very minimal risk with a low return on it, unlike
investment in risky assets such as shares in the stock market.
The CAPM shows the market risk associated with portfolio return for a time window (Oke, 2013). The risk
common to the market portfolio is revealed through a beta co-efficient. Herbert, Nwude and Onyilo (2017), posit
that the CAPM and its beta component are presumed to be good predictors of asset returns in finance literature.
Usually the risk in the market portfolio determines its returns. What happens to the market affect every security in
the market. The impact of beta in the stock market affecting security returns may be described in the U.S
aphorism: ‘when they raid the brothel, they took all the girls away’, portraying that systematic factors occurring in
the market, affect the securities return. Generally, the securities market as a whole has a beta coefficient of 1.0.
The beta co-efficient of individual firms are calculated relative to the market beta. Beta can be calculated through
dividing the co-variance between individual securities and market to the variance of market. A beta above 1.0
implies a higher risk and a beta below 1.0 implies less than the market average risk. Beta could be positive or
negative. High and positive beta increase the risk of the investor’s portfolio such that investors tend to
demand higher expected return in compensation for the high risk. If the stock has negative a beta , it reduces
the risk of the market portfolio and this ordinarily makes an investor to accept a lower expected return in
exchange for the risk reduction. In this case, investors in the stock market are able to build a basket of portfolio
around their risk preference behavior which consists of risk aversion, risk seeking and risk neutral.
Prediction of securities return in the light of market risks through CAPM holds under assumptions. These
assumptions are segmented into classical and non- classical assumptions. The classical assumptions are often
relaxed to give room for the non- classical assumptions. Some of the classical assumptions according to Olowe
(1997) are that investors are risk averse, investors are price takers and have homogenous expectations about
securities (or assets), there exists a risk free security (or asset) such that investors may borrow or lend unlimited
amount at the risk-free, securities (or assets) are marketable and perfectly divisible, securities markets are
frictionless. Information is costless and simultaneously available to all investors and there are no market
imperfections such as taxes, regulations, or transaction costs. These classical assumptions partly do not hold in
real life market situation. Hence they are relaxed to form the non- classical assumptions upon which investors are
guided in taking investment decision on portfolio investments. Arguing in support of the non- classical
assumption, Fama and French (2004) believe that the assumption that short selling is unrestricted is as unrealistic
as unrestricted risk-free borrowing and lending. If there is no risk-free asset and short-sales of risky assets are not
allowed, mean-variance investors will still choose efficient portfolios (Oke, 2013). But basically all attractive
models involve impractical simplifications, which is why they must be tested against data. Against this backdrop,
this study is undertaken with a view to contributing to accounting and finance literature using data from listed
firms in the Nigeria Stock Market. Following the introductory part, section two is literature review, section three
is methodology and section four is empirical analysis while section five dwells on conclusion and
recommendations.
2. Litertature Review
2.1 Theoretical framework
The portfolio theory developed by Markowitz (1952), has to do with a concept of using the variance of expected
returns as a measure of risk an investor can form an efficient portfolio that minimizes the risk for a given level of
return and maximizes the return for a given level of risk, had a greater influence over the development of CAPM
by Sharpe (1964) and Linter (1965). The CAPM is an extension of portfolio theory, which implies that beta alone
INSIGHTS INTO REGIONAL DEVELOPMENT
ISSN 2669-0195 (online) http://jssidoi.org/jesi/
2020 Volume 2 Number 4 (December)
http://doi.org/10.9770/IRD.2020.2.4(8)
827
is sufficient to explain the cross section return of any security at any given point of time. Thereafter, numerous
researches on the CAPM have been made to test the validity of this model but empirical test results generated
many unsolved questions regarding the applicability of this model in different markets throughout the world. The
CAPM is built on the modern portfolio theory which was initially developed by Markowitz (1952). As developed
by Sharpe (1964) and Lintner (1965), the CAPM models the equilibrium expected return on an asset as a positive
linear function of its beta risk. In the CAPM world, the only relevant risk measure is systematic risk, as this
cannot be diversified away. Investors should be proportionately rewarded for bearing this risk. Beta measures the
volatility (risk) of a share or a share portfolio and hence estimates how the returns on the share or portfolio will
move relative to the movements in the market portfolio (Jones, 1998). By definition, the market portfolio has a
beta of one. The beta of a portfolio is the weighted average of the betas of all securities contained in the portfolio.
Therefore, portfolios with betas greater than one have higher systematic risk than the market, while those with
betas less than one have lower systematic risk. Hence, by adding securities with betas that are higher to a
portfolio, we increase the systematic risk of the portfolio and hence shares, or share portfolios with high betas
should exhibit high returns and viz. (Elton & Gruber, 1995).
2.2 Empirical Review
Khan. et al. (2012) assessed and tested the CAPM through the calculation of beta of ten companies registered on
the Karach Stock Exchange and the comparison between actual and expected returns. It was found that the Capital
Asset Pricing Model (CAPM), failed to give accurate results. Mobarek & Mollah (2005) investigated the
underlying factors determining share returns on the Dhaka Stock Exchange (DSE) and found unsupportive results
of the critical condition of the CAPM that stock beta is positively related to share return. Rahman & Baten (2006)
examined the validity of the CAPM in Bangladesh using 120 non-financial firms listed in Dhaka Stock Exchange
for the period of 1999 to 2003. They found that the variables like beta, book to market value and size have strong
relationships with stock return. Michailidis et al. (2006) tested weekly stock returns of 100 firms listed in Greece
between January 1998, and December 2002, and arrived at conclusions that higher risk is correlated with higher
return, but the reverse correlation does not hold. Adedokun & Olakojo (2012) arrived at the same results by
testing monthly stock returns from a hundred Nigerian firms between January 2008, and December, 2009. Hasan
et al. (2013) tested CAPM for the Bangladesh stock market and found out that this model does not prove its
validity. Rahman (2012) in his study found a significant negative relationship between taking risks and extra
return using weekly data of 87 publicly listed companies in DSE from 2000 to 2008. Lipiec (2014) studied test the
capital asset pricing model (CAPM) on the Warsaw Stock Exchange (WSE) by measuring the performance of two
portfolios composed of construction firms: family-controlled and nonfamily controlled. These portfolios were
selected from the Warszawski Indeks Giełdowy listed in the Warsaw Stock Exchange Index) in the period 2006 to
2012 with respect to three sub-periods, namely, pre-crisis period of 2006 to2007; crisis period of 2008 to 2009
and post-crisis period of 2010 to 2012. The finding indicates that public family firms significantly outperformed
non-family peers in the crisis times in terms of security returns.
Herbert et al. (2017) applied the capital asset pricing model to determine stock returns of listed firms in the
chemicals and paints sector of Nigeria over a 13-year period, 2000 to2012. From the empirical result, the beta
content of the entire sector ranges between 1.04% and -0.13 or between 6.78 and -2.31% providing an average
beta content of 0.37 or 1.50% of the total risk for the sector. The results further indicate that the unsystematic risk
content in chemicals/paints sector stocks constitutes the bulk of the sector’s risk profile and that most of the
stocks’ betas had defensive attributes over the study period. The investment implication is that including an
appropriate mix of chemical and paints stocks in the investors’ portfolios would, all things being equal, help
investors to achieve a combination of investments that are not highly correlated with larger economic cycle as
well as higher-risk equity securities that can potentially yield higher returns than the market.

INSIGHTS INTO REGIONAL DEVELOPMENT
ISSN 2669-0195 (online) http://jssidoi.org/jesi/
2020 Volume 2 Number 4 (December)
http://doi.org/10.9770/IRD.2020.2.4(8)
828
3. Methodology
The main objective of this research is to examine the validity of Capital Assets Pricing Model in pricing portfolio
return of listed firms in Nigeria. To attain this objective, data on stock price of twenty six (26) listed firms were
collected from the Nigeria Stock Exchange publications while Treasury bill rates and All Share Index data used as
proxies for Risk-free rates and market Returns were sourced from the Central Bank of Nigeria Statistical Bulletin
respectively. After calculating the beta for the security, expected return or required rate of return for the security
was determine using the panel CAPM estimation method. The approach used is a follow up of the research
procedure of Oke (2013).
3.1 Model Specification
Capital Asset Pricing Model (CAPM)
The CAPM is usually expressed as:
Where:
is the expected excess return on the capital asset. Rf is the risk-free rate of interest. is the beta
coefficient (The sensitivity of the asset returns to market returns). is the expected return of the market.
Rf is the risk premium (the difference between the expected market rate of return and the risk-free rate of
return).
4. Empirical Analysis
The tables below represents the descriptive and correlation statistics analysis as well as the capital asset pricing
model panel estimation results of the sampled manufacturing firms in Nigeria for the period 2010 to 2016. (As
well see Appendix A and Appendix B).
Table 1: Descriptive statistics
stats | stock_~s market~s free_r~e beta
---------+----------------------------------------
mean | .7270879 3.837143 10.54429 .2078022
p50 | 0 4.59 10.97 .05
max | 57.2 6.19 14.27 7.49
min | -50.16 .02 4.57 -13.81
sd | 10.39977 2.478659 3.225802 1.904334
skewness | .4807739 -.6028233 -.6384747 -1.586072
kurtosis | 10.85942 1.692664 2.26016 20.39744
N | 182 182 182 182
--------------------------------------------------
Table 2: Correlation Matrix
| stock_~s market~s free_r~e beta
-------------+------------------------------------
stock_retu~s | 1.0000
market_ret~s | 0.1031 1.0000
free_risk_~e | -0.0989 0.3054 1.0000
beta | 0.1166 -0.0297 -0.1129 1.0000
Table 3: Hausman test
---- Coefficients ----
| (b) (B) (b-B) sqrt(diag(V_b-V_B))
| re fe Difference S.E.
-------------+----------------------------------------------------------------
Market_Pre~m | 1.194699 1.194699 -3.11e-15 1.69e-08
------------------------------------------------------------------------------

INSIGHTS INTO REGIONAL DEVELOPMENT
ISSN 2669-0195 (online) http://jssidoi.org/jesi/
2020 Volume 2 Number 4 (December)
http://doi.org/10.9770/IRD.2020.2.4(8)
829
Table 4: Capm Fixed Effect Result
Fixed-effects (within) regression Number of obs = 182
Group variable: cross Number of groups = 26
R-sq: within = 0.1525 Obs per group: min = 7
between = . avg = 7.0
overall = 0.1330 max = 7
F(1,155) = 27.89
corr(u_i, Xb) = 0.0000 Prob > F = 0.0000
--------------------------------------------------------------------------------
Firm_Excess_~t | Coef. Std. Err. t P>|t| [95% Conf. Interval]
---------------+----------------------------------------------------------------
Market_Premium | 1.194699 .2262196 5.28 0.000 .7478279 1.64157
_cons | -1.80418 1.701736 -1.06 0.291 -5.165767 1.557407
---------------+----------------------------------------------------------------
sigma_u | 4.068595
sigma_e | 10.395272
rho | .1328367 (fraction of variance due to u_i)
--------------------------------------------------------------------------------
F test that all u_i=0: F(25, 155) = 1.07 Prob > F = 0.3807
Table 1 concerns the descriptive statistics result and it shows that the average stock returns of the sample firms is
72%, the maximum stock return is 572% while the average market return. The average beta is 20 and this may
have compensated the investors by way of the mean portfolio return of 72%. The maximum beta value is 7.49.
The risk free rate average value is 10.54% while the maximum return is 14.27%.
Table 2 relates to correlation matrix result. It shows there is a positive relationship between stock prices and
market returns (R = 0.103). The relationship between bet (β) and stock price of the sampled manufacturing is
positive (r = 0.1166) while market returns and risk free rates are positively correlated (r = 0.3054). The findings
are consistent with Oke (2013); Lipiec (2014); Herber, Nwude & Onyilo (2017)
Table 3 deals with the Hausman test result. The table shows that fixed effect result is preferred for the analysis.
Table 4 relates to the capital asset pricing model panel estimation. It that shows that the overall R-squared result is
0.1330, which is 13%. The F – statistic of 27.89 is statistically significant given the probability value 0.0000. The
firm excess return (market premium) for the period was positive (1.1946) and significant at 95% and it means that
the market risks contribute largely to the expected returns of the firms in the period observed. The empirical
findings are consistent with Mobarek & Mollah (2005).
Conclusions and Recommendations
This study applied the capital asset pricing model to determine portfolio returns of listed firms in the Nigeria
Stock Exchange. Three components of the model, namely, risk free rate, market return and beta were determine
with the data from secondary sources. The empirical results of the study explicitly suggests that share price return
of the sampled firms improved very well after the stock market melt- down in Nigeria. This intriguing results may
have be an influencing factor to investors in optimal portfolio selection, diversification as well as guiding their
risk preference behavior in the stock market after the global financial crisis. The model is thus validated in
Nigeria and therefore remains a potent tool for investors to assess returns on investment in stocks, other than
relying on the Markowitz mean-variance to determine efficient securities. It is therefore suggested that future
researchers need to apply the model to determine portfolio return of firms on sector by sector basis in pre-and-
post stock market melt -down in Nigeria as this reveal the magnitude of the loss encountered by investors during
these periods.

INSIGHTS INTO REGIONAL DEVELOPMENT
ISSN 2669-0195 (online) http://jssidoi.org/jesi/
2020 Volume 2 Number 4 (December)
http://doi.org/10.9770/IRD.2020.2.4(8)
830
References
Adedokun, A.J., & Olakojo, S.A. (2012). Test of Capital Asset Pricing Model: Evidence from Nigerian Stock Exchange. Journal of
Economic Theory, 6, 121–127.
CBN (2016). Statistical Bulletin.
Chare D.E., & Priestly, R.J. (1998). Security Analysis and Portfolio Management, 6ed: Prentice-Hall.
Elton, E.J. & Gruber, M.J. (1995). Risk Reduction and Portfolio Size: An Analytic Solution. Journal of Business 50 (October 1977). 415-
37.
Hasan, M. Z., Kamil, A. A., Mustafa, A., & Baten, M. A. (2011). A Validity test of Capital Asset Pricing Model for Dhaka Stock
Exchange. Journal of Applied Sciences, 11(20), 3490-3496.
Hasan, Z. Kamil, A.A. & Baten, A. (2013). Analyzing and estimating portfolio performance of Bangladesh stock market. American Journal
of Applied Sciences, 10, 139–146.
Herbert, W.E., Nwude, E.C., & Onyilo, F. (2017). The application of the capital asset pricing model (CAPM) in the Nigerian Chemicals
and Paints Industrial sector. European Journal of Accounting, Auditing and Finance, 5(8), 12-32.
Jones, T. (1998). Capital Asset Pricing Model in building investment portfolio. Lahti University of Applied Sciences. Faculty of Economic
and Business Administration
Khan, M.I., Gul, M., Khan, N.M., Nawaz, B. & Sanaullah. (2012). Assessing and Testing the Capital Asset Pricing Model (CAPM): A
Study Involving KSE-Pakistan. Global Journal of Management and Business Research, 12(10), 32-
Lintner, J. (1965). The Valuation of Risk Assets and Selection of Risky Investments in Stock Portfolios and Capital Budgets. Review of
Economics and Statistics, 47(2), 13- 37.
Lipiec, J. (2014). Capital Asset Pricing Model Testing at Warsaw Stock Exchange: Are Family Businesses the Remedy for Economic
Recessions? International Journal of Financial Studies. 2, 266–279. http://dx.doi.org/10.3390/ijfs2030266
Markowitz, H. (1952). Portfolio Selection. The Journal of Finance, 7(1), 77-91.
http://links.jstor.org/sici?sici=00221082%28195203%297%3A1%3C77%3APS%3E2.0.CO%3B2-1
Markowitz, H. (1959). Portfolio selection: Efficient diversification of investments. New York, United States: Wiley & Sons, Inc.
Michailidis, G., Tsopoglou, S., Papanastasiou, D., & Mariola, E. (2006). Testing the Capital Asset Pricing Model (CAPM): The Case of the
Emerging Greek Securities Market. International Research Journal of Finance and Economics, 4, 78–91.
Mobarek, A., & Mollah, A.S. (2005). The General Determinants of Share Returns: An Empirical Investigation on the Dhaka Stock
Exchange. Review Pacific Basin Financial Market and Policy, 8, 593–612.
Oke, B.O. (2013). Capital Asset Pricing Model (CAPM): Evidence from Nigeria. Research Journal of Finance and Accounting, 4(9), 17-27.
Olowe, R. A. (1997). Financial Management: Concepts, Analysis, and Capital. Lagos: Brierly Jones Nigeria Limited.
Rahman, A.F.M. (2012). Reward for Taking Risk at DSE – An Application of Zero Beta CAPM. Journal of Business and Policy Research,
7(3), 48-59.
Rahman, M.M., & Baten, M.A. (2006). An Empirical Testing of capital Asset Pricing odel in Bangladesh. Journal of Research (Science),
17(4), 225-234.
Sharpe, W. F. (1964). Capital asset prices: A theory of market equilibrium under conditions of risk. The Journal of Finance, 19(3), 425-
442. http://dx.doi.org/10.2307/2977928
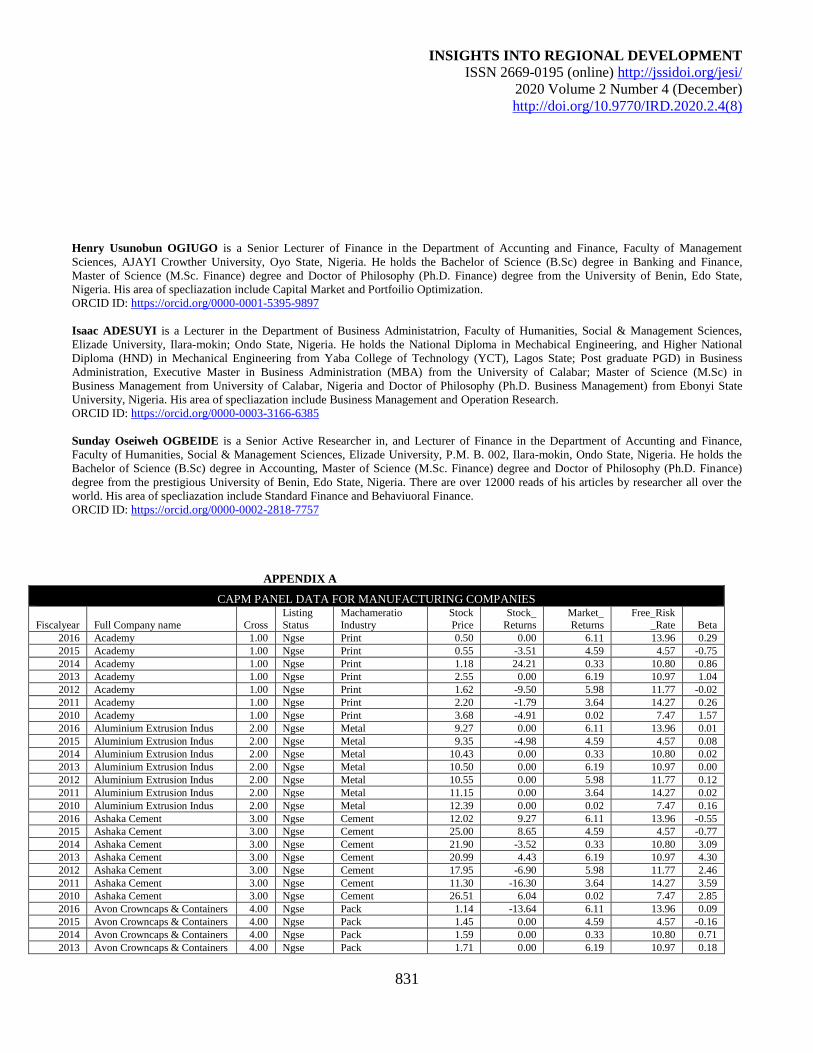
INSIGHTS INTO REGIONAL DEVELOPMENT
ISSN 2669-0195 (online) http://jssidoi.org/jesi/
2020 Volume 2 Number 4 (December)
http://doi.org/10.9770/IRD.2020.2.4(8)
831
Henry Usunobun OGIUGO is a Senior Lecturer of Finance in the Department of Accunting and Finance, Faculty of Management
Sciences, AJAYI Crowther University, Oyo State, Nigeria. He holds the Bachelor of Science (B.Sc) degree in Banking and Finance,
Master of Science (M.Sc. Finance) degree and Doctor of Philosophy (Ph.D. Finance) degree from the University of Benin, Edo State,
Nigeria. His area of specliazation include Capital Market and Portfoilio Optimization.
ORCID ID: https://orcid.org/0000-0001-5395-9897
Isaac ADESUYI is a Lecturer in the Department of Business Administatrion, Faculty of Humanities, Social & Management Sciences,
Elizade University, Ilara-mokin; Ondo State, Nigeria. He holds the National Diploma in Mechabical Engineering, and Higher National
Diploma (HND) in Mechanical Engineering from Yaba College of Technology (YCT), Lagos State; Post graduate PGD) in Business
Administration, Executive Master in Business Administration (MBA) from the University of Calabar; Master of Science (M.Sc) in
Business Management from University of Calabar, Nigeria and Doctor of Philosophy (Ph.D. Business Management) from Ebonyi State
University, Nigeria. His area of specliazation include Business Management and Operation Research.
ORCID ID: https://orcid.org/0000-0003-3166-6385
Sunday Oseiweh OGBEIDE is a Senior Active Researcher in, and Lecturer of Finance in the Department of Accunting and Finance,
Faculty of Humanities, Social & Management Sciences, Elizade University, P.M. B. 002, Ilara-mokin, Ondo State, Nigeria. He holds the
Bachelor of Science (B.Sc) degree in Accounting, Master of Science (M.Sc. Finance) degree and Doctor of Philosophy (Ph.D. Finance)
degree from the prestigious University of Benin, Edo State, Nigeria. There are over 12000 reads of his articles by researcher all over the
world. His area of specliazation include Standard Finance and Behaviuoral Finance.
ORCID ID: https://orcid.org/0000-0002-2818-7757
APPENDIX A
CAPM PANEL DATA FOR MANUFACTURING COMPANIES
Fiscalyear Full Company name Cross
Listing
Status
Machameratio
Industry
Stock
Price
Stock_
Returns
Market_
Returns
Free_Risk
_Rate Beta
2016 Academy 1.00 Ngse Print 0.50 0.00 6.11 13.96 0.29
2015 Academy 1.00 Ngse Print 0.55 -3.51 4.59 4.57 -0.75
2014 Academy 1.00 Ngse Print 1.18 24.21 0.33 10.80 0.86
2013 Academy 1.00 Ngse Print 2.55 0.00 6.19 10.97 1.04
2012 Academy 1.00 Ngse Print 1.62 -9.50 5.98 11.77 -0.02
2011 Academy 1.00 Ngse Print 2.20 -1.79 3.64 14.27 0.26
2010 Academy 1.00 Ngse Print 3.68 -4.91 0.02 7.47 1.57
2016 Aluminium Extrusion Indus 2.00 Ngse Metal 9.27 0.00 6.11 13.96 0.01
2015 Aluminium Extrusion Indus 2.00 Ngse Metal 9.35 -4.98 4.59 4.57 0.08
2014 Aluminium Extrusion Indus 2.00 Ngse Metal 10.43 0.00 0.33 10.80 0.02
2013 Aluminium Extrusion Indus 2.00 Ngse Metal 10.50 0.00 6.19 10.97 0.00
2012 Aluminium Extrusion Indus 2.00 Ngse Metal 10.55 0.00 5.98 11.77 0.12
2011 Aluminium Extrusion Indus 2.00 Ngse Metal 11.15 0.00 3.64 14.27 0.02
2010 Aluminium Extrusion Indus 2.00 Ngse Metal 12.39 0.00 0.02 7.47 0.16
2016 Ashaka Cement 3.00 Ngse Cement 12.02 9.27 6.11 13.96 -0.55
2015 Ashaka Cement 3.00 Ngse Cement 25.00 8.65 4.59 4.57 -0.77
2014 Ashaka Cement 3.00 Ngse Cement 21.90 -3.52 0.33 10.80 3.09
2013 Ashaka Cement 3.00 Ngse Cement 20.99 4.43 6.19 10.97 4.30
2012 Ashaka Cement 3.00 Ngse Cement 17.95 -6.90 5.98 11.77 2.46
2011 Ashaka Cement 3.00 Ngse Cement 11.30 -16.30 3.64 14.27 3.59
2010 Ashaka Cement 3.00 Ngse Cement 26.51 6.04 0.02 7.47 2.85
2016 Avon Crowncaps & Containers 4.00 Ngse Pack 1.14 -13.64 6.11 13.96 0.09
2015 Avon Crowncaps & Containers 4.00 Ngse Pack 1.45 0.00 4.59 4.57 -0.16
2014 Avon Crowncaps & Containers 4.00 Ngse Pack 1.59 0.00 0.33 10.80 0.71
2013 Avon Crowncaps & Containers 4.00 Ngse Pack 1.71 0.00 6.19 10.97 0.18

INSIGHTS INTO REGIONAL DEVELOPMENT
ISSN 2669-0195 (online) http://jssidoi.org/jesi/
2020 Volume 2 Number 4 (December)
http://doi.org/10.9770/IRD.2020.2.4(8)
832
2012 Avon Crowncaps & Containers 4.00 Ngse Pack 1.90 -4.52 5.98 11.77 -0.29
2011 Avon Crowncaps & Containers 4.00 Ngse Pack 5.94 0.00 3.64 14.27 -0.07
2010 Avon Crowncaps & Containers 4.00 Ngse Pack 6.91 0.00 0.02 7.47 0.01
2016 B.O.C Gases Nig 5.00 Ngse Chem 3.53 0.28 6.11 13.96 -0.07
2015 B.O.C Gases Nig 5.00 Ngse Chem 3.79 -4.77 4.59 4.57 0.03
2014 B.O.C Gases Nig 5.00 Ngse Chem 5.48 0.00 0.33 10.80 -0.23
2013 B.O.C Gases Nig 5.00 Ngse Chem 6.66 0.00 6.19 10.97 -0.07
2012 B.O.C Gases Nig 5.00 Ngse Chem 6.25 4.69 5.98 11.77 0.02
2011 B.O.C Gases Nig 5.00 Ngse Chem 6.85 0.74 3.64 14.27 0.08
2010 B.O.C Gases Nig 5.00 Ngse Chem 9.20 -9.63 0.02 7.47 -0.27
2016 Berger Paints Nig 6.00 Ngse Paint 6.40 2.73 6.11 13.96 -0.27
2015 Berger Paints Nig 6.00 Ngse Paint 10.00 2.56 4.59 4.57 0.40
2014 Berger Paints Nig 6.00 Ngse Paint 9.00 3.45 0.33 10.80 0.37
2013 Berger Paints Nig 6.00 Ngse Paint 8.00 0.00 6.19 10.97 0.73
2012 Berger Paints Nig 6.00 Ngse Paint 8.98 6.78 5.98 11.77 -0.04
2011 Berger Paints Nig 6.00 Ngse Paint 8.47 -0.59 3.64 14.27 6.52
2010 Berger Paints Nig 6.00 Ngse Paint 8.36 -7.11 0.02 7.47 2.11
2016 Beta Glass Company 7.00 Ngse Pack 30.32 -8.32 6.11 13.96 -4.06
2015 Beta Glass Company 7.00 Ngse Pack 53.45 4.95 4.59 4.57 -2.11
2014 Beta Glass Company 7.00 Ngse Pack 27.78 25.99 0.33 10.80 -1.23
2013 Beta Glass Company 7.00 Ngse Pack 14.43 4.95 6.19 10.97 -0.40
2012 Beta Glass Company 7.00 Ngse Pack 10.50 0.00 5.98 11.77 -0.39
2011 Beta Glass Company 7.00 Ngse Pack 12.71 0.00 3.64 14.27 0.51
2010 Beta Glass Company 7.00 Ngse Pack 15.58 0.00 0.02 7.47 0.07
2016 Cement Comy Of Northern Nig 8.00 Ngse Cement 5.00 11.61 6.11 13.96 -0.40
2015 Cement Comy Of Northern Nig 8.00 Ngse Cement 9.35 26.18 4.59 4.57 0.79
2014 Cement Comy Of Northern Nig 8.00 Ngse Cement 10.39 -7.97 0.33 10.80 1.64
2013 Cement Comy Of Northern Nig 8.00 Ngse Cement 11.75 26.34 6.19 10.97 5.00
2012 Cement Comy Of Northern Nig 8.00 Ngse Cement 5.30 7.72 5.98 11.77 0.20
2011 Cement Comy Of Northern Nig 8.00 Ngse Cement 4.35 -9.38 3.64 14.27 0.49
2010 Cement Comy Of Northern Nig 8.00 Ngse Cement 15.49 15.34 0.02 7.47 5.13
2016 Chemical & Allied Product 9.00 Ngse Paint 32.00 -3.03 6.11 13.96 -0.38
2015 Chemical & Allied Product 9.00 Ngse Paint 37.60 -0.92 4.59 4.57 -0.16
2014 Chemical & Allied Product 9.00 Ngse Paint 37.50 3.65 0.33 10.80 -0.07
2013 Chemical & Allied Product 9.00 Ngse Paint 48.45 -3.10 6.19 10.97 2.53
2012 Chemical & Allied Product 9.00 Ngse Paint 28.00 3.93 5.98 11.77 0.90
2011 Chemical & Allied Product 9.00 Ngse Paint 14.50 -9.99 3.64 14.27 1.05
2010 Chemical & Allied Product 9.00 Ngse Paint 34.03 4.74 0.02 7.47 -0.11
2016 Cutix 10.00 Ngse Elec 1.80 -4.76 6.11 13.96 0.60
2015 Cutix 10.00 Ngse Elec 1.66 1.22 4.59 4.57 0.09
2014 Cutix 10.00 Ngse Elec 1.30 -13.33 0.33 10.80 0.39
2013 Cutix 10.00 Ngse Elec 1.78 0.00 6.19 10.97 1.99
2012 Cutix 10.00 Ngse Elec 1.53 0.66 5.98 11.77 2.91
2011 Cutix 10.00 Ngse Elec 1.55 -8.82 3.64 14.27 0.22
2010 Cutix 10.00 Ngse Elec 2.21 0.00 0.02 7.47 1.37
2016 Dangote Cement 11.00 Ngse Cement 173.99 12.98 6.11 13.96 1.19
2015 Dangote Cement 11.00 Ngse Cement 170.00 8.27 4.59 4.57 1.02
2014 Dangote Cement 11.00 Ngse Cement 200.00 11.17 0.33 10.80 0.75
2013 Dangote Cement 11.00 Ngse Cement 218.99 12.30 6.19 10.97 1.52
2012 Dangote Cement 11.00 Ngse Cement 128.10 5.43 5.98 11.77 1.07
2011 Dangote Cement 11.00 Ngse Cement 110.77 5.39 3.64 14.27 1.11
2010 Dangote Cement 11.00 Ngse Cement 120.00 -3.23 0.02 7.47 4.34
2016 Dn Meyer 12.00 Ngse Paint 0.87 0.00 6.11 13.96 0.34
2015 Dn Meyer 12.00 Ngse Paint 0.67 0.00 4.59 4.57 -0.04
2014 Dn Meyer 12.00 Ngse Paint 0.87 0.00 0.33 10.80 -0.81
2013 Dn Meyer 12.00 Ngse Paint 1.41 -4.08 6.19 10.97 1.08
2012 Dn Meyer 12.00 Ngse Paint 1.55 -50.16 5.98 11.77 -1.66
2011 Dn Meyer 12.00 Ngse Paint 1.07 4.90 3.64 14.27 0.05
2010 Dn Meyer 12.00 Ngse Paint 3.51 -18.18 0.02 7.47 0.15
2016 Fidson Healthcare 13.00 Ngse Pharmacetical 1.28 -12.33 6.11 13.96 -0.57
2015 Fidson Healthcare 13.00 Ngse Pharmacetical 2.50 -12.28 4.59 4.57 -0.16
2014 Fidson Healthcare 13.00 Ngse Pharmacetical 3.90 14.71 0.33 10.80 -3.16
2013 Fidson Healthcare 13.00 Ngse Pharmacetical 2.79 32.86 6.19 10.97 0.66
2012 Fidson Healthcare 13.00 Ngse Pharmacetical 1.06 3.92 5.98 11.77 -0.91

INSIGHTS INTO REGIONAL DEVELOPMENT
ISSN 2669-0195 (online) http://jssidoi.org/jesi/
2020 Volume 2 Number 4 (December)
http://doi.org/10.9770/IRD.2020.2.4(8)
833
2011 Fidson Healthcare 13.00 Ngse Pharmacetical 0.79 -30.70 3.64 14.27 -0.72
2010 Fidson Healthcare 13.00 Ngse Pharmacetical 3.06 5.52 0.02 7.47 1.20
2016 First Alumminium Nig 14.00 Ngse Metal 0.50 0.00 6.11 13.96 0.00
2015 First Alumminium Nig 14.00 Ngse Metal 0.50 0.00 4.59 4.57 0.00
2014 First Alumminium Nig 14.00 Ngse Metal 0.50 0.00 0.33 10.80 0.00
2013 First Alumminium Nig 14.00 Ngse Metal 0.50 0.00 6.19 10.97 0.00
2012 First Alumminium Nig 14.00 Ngse Metal 0.50 0.00 5.98 11.77 0.00
2011 First Alumminium Nig 14.00 Ngse Metal 0.50 0.00 3.64 14.27 0.00
2010 First Alumminium Nig 14.00 Ngse Metal 0.73 -3.95 0.02 7.47 -2.76
2016 Flour Mills Of Nigeria 15.00 Ngse Food 18.49 -5.13 6.11 13.96 -0.25
2015 Flour Mills Of Nigeria 15.00 Ngse Food 20.80 4.00 4.59 4.57 0.33
2014 Flour Mills Of Nigeria 15.00 Ngse Food 39.20 -22.08 0.33 10.80 -0.70
2013 Flour Mills Of Nigeria 15.00 Ngse Food 87.00 -2.47 6.19 10.97 0.30
2012 Flour Mills Of Nigeria 15.00 Ngse Food 65.00 -1.52 5.98 11.77 -0.08
2011 Flour Mills Of Nigeria 15.00 Ngse Food 65.45 2.27 3.64 14.27 -2.78
2010 Flour Mills Of Nigeria 15.00 Ngse Food 69.00 0.00 0.02 7.47 7.49
2016 Forte Oil (Ap) 16.00 Ngse Oil 84.43 57.20 6.11 13.96 0.80
2015 Forte Oil (Ap) 16.00 Ngse Oil 330.00 26.08 4.59 4.57 -2.86
2014 Forte Oil (Ap) 16.00 Ngse Oil 227.90 2.66 0.33 10.80 -13.81
2013 Forte Oil (Ap) 16.00 Ngse Oil 108.30 -5.00 6.19 10.97 -4.71
2012 Forte Oil (Ap) 16.00 Ngse Oil 7.73 -12.56 5.98 11.77 0.98
2011 Forte Oil (Ap) 16.00 Ngse Oil 11.60 -23.18 3.64 14.27 -2.96
2010 Forte Oil (Ap) 16.00 Ngse Oil 21.90 2.91 0.02 7.47 1.14
2016 Ftn Cocoa Processors 17.00 Ngse Plant 0.50 0.00 6.11 13.96 0.00
2015 Ftn Cocoa Processors 17.00 Ngse Plant 0.50 0.00 4.59 4.57 0.00
2014 Ftn Cocoa Processors 17.00 Ngse Plant 0.50 0.00 0.33 10.80 0.00
2013 Ftn Cocoa Processors 17.00 Ngse Plant 0.50 0.00 6.19 10.97 -0.05
2012 Ftn Cocoa Processors 17.00 Ngse Plant 0.50 0.00 5.98 11.77 0.00
2011 Ftn Cocoa Processors 17.00 Ngse Plant 0.50 0.00 3.64 14.27 0.27
2010 Ftn Cocoa Processors 17.00 Ngse Plant 0.61 -3.17 0.02 7.47 0.79
2016 Glaxosmithkline Nig 18.00 Ngse Pharmacetical 15.75 12.50 6.11 13.96 0.24
2015 Glaxosmithkline Nig 18.00 Ngse Pharmacetical 34.20 -10.00 4.59 4.57 1.00
2014 Glaxosmithkline Nig 18.00 Ngse Pharmacetical 50.00 -3.85 0.33 10.80 -1.11
2013 Glaxosmithkline Nig 18.00 Ngse Pharmacetical 68.00 4.62 6.19 10.97 0.94
2012 Glaxosmithkline Nig 18.00 Ngse Pharmacetical 45.10 -0.88 5.98 11.77 -0.63
2011 Glaxosmithkline Nig 18.00 Ngse Pharmacetical 23.00 -5.08 3.64 14.27 -0.81
2010 Glaxosmithkline Nig 18.00 Ngse Pharmacetical 26.00 -8.77 0.02 7.47 5.70
2016 Greif Nig 19.00 Ngse Pack 10.88 0.00 6.11 13.96 0.01
2015 Greif Nig 19.00 Ngse Pack 11.48 0.00 4.59 4.57 0.01
2014 Greif Nig 19.00 Ngse Pack 12.08 0.00 0.33 10.80 0.01
2013 Greif Nig 19.00 Ngse Pack 12.68 0.00 6.19 10.97 0.01
2012 Greif Nig 19.00 Ngse Pack 12.98 0.00 5.98 11.77 0.03
2011 Greif Nig 19.00 Ngse Pack 13.28 0.00 3.64 14.27 -0.10
2010 Greif Nig 19.00 Ngse Pack 15.03 0.00 0.02 7.47 0.00
2016 Julius Berger 20.00 Ngse Const 38.58 10.23 6.11 13.96 -0.20
2015 Julius Berger 20.00 Ngse Const 42.00 12.18 4.59 4.57 0.88
2014 Julius Berger 20.00 Ngse Const 60.66 0.00 0.33 10.80 -0.40
2013 Julius Berger 20.00 Ngse Const 72.29 4.77 6.19 10.97 0.64
2012 Julius Berger 20.00 Ngse Const 34.65 5.00 5.98 11.77 0.09
2011 Julius Berger 20.00 Ngse Const 31.60 -17.77 3.64 14.27 -2.57
2010 Julius Berger 20.00 Ngse Const 50.00 0.04 0.02 7.47 1.02
2016 Nigerian Northen Flour Mill 21.00 Ngse Food 6.27 9.81 6.11 13.96 0.36
2015 Nigerian Northen Flour Mill 21.00 Ngse Food 8.55 -4.89 4.59 4.57 0.12
2014 Nigerian Northen Flour Mill 21.00 Ngse Food 18.05 -5.00 0.33 10.80 -0.28
2013 Nigerian Northen Flour Mill 21.00 Ngse Food 23.16 -4.97 6.19 10.97 0.47
2012 Nigerian Northen Flour Mill 21.00 Ngse Food 18.38 -0.27 5.98 11.77 0.01
2011 Nigerian Northen Flour Mill 21.00 Ngse Food 21.48 0.00 3.64 14.27 -0.75
2010 Nigerian Northen Flour Mill 21.00 Ngse Food 39.88 -0.25 0.02 7.47 0.38
2016 Okomu Oil Palm 22.00 Ngse Plant 40.17 10.97 6.11 13.96 0.17
2015 Okomu Oil Palm 22.00 Ngse Plant 30.30 12.64 4.59 4.57 0.40
2014 Okomu Oil Palm 22.00 Ngse Plant 25.35 -15.50 0.33 10.80 -0.30
2013 Okomu Oil Palm 22.00 Ngse Plant 44.00 3.77 6.19 10.97 -2.37
2012 Okomu Oil Palm 22.00 Ngse Plant 42.50 25.00 5.98 11.77 0.89
2011 Okomu Oil Palm 22.00 Ngse Plant 23.10 -2.04 3.64 14.27 -0.22

INSIGHTS INTO REGIONAL DEVELOPMENT
ISSN 2669-0195 (online) http://jssidoi.org/jesi/
2020 Volume 2 Number 4 (December)
http://doi.org/10.9770/IRD.2020.2.4(8)
834
2010 Okomu Oil Palm 22.00 Ngse Plant 15.20 9.35 0.02 7.47 0.05
2016 Redstar Express 23.00 Ngse Transp 4.40 -1.12 6.11 13.96 -0.41
2015 Redstar Express 23.00 Ngse Transp 4.25 6.25 4.59 4.57 1.08
2014 Redstar Express 23.00 Ngse Transp 3.94 -2.48 0.33 10.80 -0.47
2013 Redstar Express 23.00 Ngse Transp 4.42 5.24 6.19 10.97 0.87
2012 Redstar Express 23.00 Ngse Transp 3.00 -0.99 5.98 11.77 0.58
2011 Redstar Express 23.00 Ngse Transp 2.39 4.37 3.64 14.27 0.46
2010 Redstar Express 23.00 Ngse Transp 2.88 -1.71 0.02 7.47 1.84
2016 Total Nigeria 24.00 Ngse Oil 299.00 15.49 6.11 13.96 1.33
2015 Total Nigeria 24.00 Ngse Oil 147.01 1.34 4.59 4.57 0.31
2014 Total Nigeria 24.00 Ngse Oil 142.50 -9.51 0.33 10.80 -0.84
2013 Total Nigeria 24.00 Ngse Oil 170.00 3.02 6.19 10.97 0.22
2012 Total Nigeria 24.00 Ngse Oil 120.57 -3.30 5.98 11.77 0.13
2011 Total Nigeria 24.00 Ngse Oil 188.10 -5.95 3.64 14.27 -0.94
2010 Total Nigeria 24.00 Ngse Oil 234.00 -0.26 0.02 7.47 1.49
2016 Trans-Nationwide Express 25.00 Ngse Transp 1.00 -6.54 6.11 13.96 -0.53
2015 Trans-Nationwide Express 25.00 Ngse Transp 1.13 10.78 4.59 4.57 1.30
2014 Trans-Nationwide Express 25.00 Ngse Transp 1.23 -4.65 0.33 10.80 -4.91
2013 Trans-Nationwide Express 25.00 Ngse Transp 1.17 -4.10 6.19 10.97 -0.17
2012 Trans-Nationwide Express 25.00 Ngse Transp 2.78 -4.79 5.98 11.77 -0.18
2011 Trans-Nationwide Express 25.00 Ngse Transp 3.45 0.00 3.64 14.27 -0.99
2010 Trans-Nationwide Express 25.00 Ngse Transp 6.40 0.00 0.02 7.47 0.02
2016 Vitafoam Nig 26.00 Ngse Hoshold 2.40 0.00 6.11 13.96 -1.10
2015 Vitafoam Nig 26.00 Ngse Hoshold 5.41 10.41 4.59 4.57 1.61
2014 Vitafoam Nig 26.00 Ngse Hoshold 4.03 4.68 0.33 10.80 -1.30
2013 Vitafoam Nig 26.00 Ngse Hoshold 4.90 6.52 6.19 10.97 0.62
2012 Vitafoam Nig 26.00 Ngse Hoshold 3.66 2.81 5.98 11.77 -0.73
2011 Vitafoam Nig 26.00 Ngse Hoshold 5.06 5.42 3.64 14.27 0.48
2010 Vitafoam Nig 26.00 Ngse Hoshold 6.66 7.42 0.02 7.47 1.79
APPENDIX B
Empirical Results
DESCRIPTIVE STATISTICS
stats | stock_~s market~s free_r~e beta
---------+----------------------------------------
mean | .7270879 3.837143 10.54429 .2078022
p50 | 0 4.59 10.97 .05
max | 57.2 6.19 14.27 7.49
min | -50.16 .02 4.57 -13.81
sd | 10.39977 2.478659 3.225802 1.904334
skewness | .4807739 -.6028233 -.6384747 -1.586072
kurtosis | 10.85942 1.692664 2.26016 20.39744
N | 182 182 182 182
--------------------------------------------------
CORRELATION ANALYSIS

INSIGHTS INTO REGIONAL DEVELOPMENT
ISSN 2669-0195 (online) http://jssidoi.org/jesi/
2020 Volume 2 Number 4 (December)
http://doi.org/10.9770/IRD.2020.2.4(8)
835
| stock_~s market~s free_r~e beta
-------------+------------------------------------
stock_retu~s | 1.0000
market_ret~s | 0.1031 1.0000
free_risk_~e | -0.0989 0.3054 1.0000
beta | 0.1166 -0.0297 -0.1129 1.0000
CAPM FIXED EFFECT RESULTS FOR MANUFACTURING COMPANIES
Fixed-effects (within) regression Number of obs = 182
Group variable: cross Number of groups = 26
R-sq: within = 0.1525 Obs per group: min = 7
between = . avg = 7.0
overall = 0.1330 max = 7
F(1,155) = 27.89
corr(u_i, Xb) = 0.0000 Prob > F = 0.0000
--------------------------------------------------------------------------------
Firm_Excess_~t | Coef. Std. Err. t P>|t| [95% Conf. Interval]
---------------+----------------------------------------------------------------Market_Premium | 1.194699 .2262196 5.28 0.000 .7478279
1.64157
_cons | -1.80418 1.701736 -1.06 0.291 -5.165767 1.557407
---------------+----------------------------------------------------------------
sigma_u | 4.068595
sigma_e | 10.395272
rho | .1328367 (fraction of variance due to u_i)
--------------------------------------------------------------------------------
F test that all u_i=0: F(25, 155) = 1.07 Prob > F = 0.3807
CAPM RANDOM EFFECT RESULTS
Random-effects GLS regression Number of obs = 182
Group variable: cross Number of groups = 26
R-sq: within = 0.0000 Obs per group: min = 7
between = 0.0000 avg = 7.0
overall = 0.1330 max = 7
Wald chi2(1) = 27.89
corr(u_i, X) = 0 (assumed) Prob > chi2 = 0.0000
--------------------------------------------------------------------------------
Firm_Excess_~t | Coef. Std. Err. z P>|z| [95% Conf. Interval]
---------------+----------------------------------------------------------------
Market_Premium | 1.194699 .2262196 5.28 0.000 .751317 1.638081
_cons | -1.80418 1.714302 -1.05 0.293 -5.16415 1.55579
---------------+----------------------------------------------------------------
sigma_u | 1.0564476
sigma_e | 10.395272
rho | .01022261 (fraction of variance due to u_i)
--------------------------------------------------------------------------------
Hausman test

INSIGHTS INTO REGIONAL DEVELOPMENT
ISSN 2669-0195 (online) http://jssidoi.org/jesi/
2020 Volume 2 Number 4 (December)
http://doi.org/10.9770/IRD.2020.2.4(8)
836
---- Coefficients ----
| (b) (B) (b-B) sqrt(diag(V_b-V_B))
| re fe Difference S.E.
-------------+----------------------------------------------------------------
Market_Pre~m | 1.194699 1.194699 -3.11e-15 1.69e-08
------------------------------------------------------------------------------
b = consistent under Ho and Ha; obtained from xtreg
B = inconsistent under Ha, efficient under Ho; obtained from xtreg
Test: Ho: difference in coefficients not systematic
chi2(1) = (b-B)'[(V_b-V_B)^(-1)](b-B)
= 0.01
Prob>chi2 = 0.9900
Copyright © 2020 by author(s) and VsI Entrepreneurship and Sustainability Center
This work is licensed under the Creative Commons Attribution International License (CC BY).
http://creativecommons.org/licenses/by/4.0/