institutional environment and capital structure: evidence ... reddot/iag/documents/wp_57... ·...
TRANSCRIPT

Institutional environment and capital structure:evidence on EU companies
Regis Coeurderoy
IAG – Business School
Universite Catholique de Louvain
Place des Doyen, 1
B-1348 Louvain-La-Neuve, Belgium
Tel 32 10 47 33 84
Fax 32 10 47 34 84

2
Abstract
LLSV (1997) recently opened a wide research avenue when they supported the idea
that a sizeable chunk of economic and financial heterogeneity across countries stems
from differences in legal origins. In line with this stream of literature, the present
article gives evidence on the fact that corporate capital structures are substantially
impacted by the legal systems in which they operate. To the best of our knowledge, it
is one of the first study providing conclusive results with a statistical cross-country
sample from ten Members of the European Union. Furthermore, the results give
evidence on a clear cut between the smaller and the larger companies: the capital
structures are impacted by the legal framework in both cases but in different ways: the
smaller firms have a higher leverage capability in a legal environment oriented
towards creditor rights. By contrast, the larger companies seem more prone to switch,
in the same context, towards a more intense financing by own funds.
3
Corporate decisions are often studied without any consideration of the institutional
context in which they take place. A number of precepts for corporate governance are
formulated and tested on samples of domestic firms (and the most often on US
companies) and lead to general rules valid throughout the world. Institutional
Economics, however, reminds that the design of any organizational arrangement is
encapsulated within an institutional environment (North 1981; Williamson 1991). In
this perspective decision makers can face severe difficulties as they have to produce
general rules in a heterogeneous institutional framework. Ignoring that could lead to
misleading assumptions.
The present research addresses this issue through the lens of capital structure at a
firm’s level. Variations across countries in corporate finance are well known by
academics but remain a highly neglected topic too. International differences are often
reduced to accounting discrepancies or country “folklore” (Rajan and Zingales, 1998).
Recently, La Porta, Lopez-de-Silanes, Shleifer and Vishny (LLSV, 1997; 1998)
proposed, however, to view international differences through the perspective of legal
rules implemented by the countries. The main objective of the research is to study at a
microeconomic level the impact of national legal systems on the financial structures
of firms in 10 European countries. A series of regressions is run to test the effects of
legal variables on indebtedness. The analysis of results suggests some comments on
the influence of legal rules. This paper clearly shows that corporate financial
structures are not independent from their legal framework. But the results should be
differentiated by corporate size class. Facing risk aversion from lenders, the smaller
companies benefit from a legal framework designed to support creditor rights. On the
grounds of the bargaining power they can afford, the larger companies prefer to lower

4
their debt ratio in favor of other sources of financing as they have more trade-off
opportunities.
In the first section of the paper the general background is presented. The hypothesis
about the influence of legal systems on external finance and the effects at a micro-
level are detailed. The second section describes the data and provides descriptive
results. The last section gives evidence through a set of regressions differentiating
companies by size.
GENERAL BACKGROUND
Legal systems and the development of finance
“Why do some countries have so much bigger capital markets than others?” It is with
this question that La Porta, Lopez-de-Silanes, Shleifer and Vishny (LLSV, 1997) open
their article about the legal determinants of external finance. Their basic assumption
boils down to the idea that the differences in the nature and the efficiency of financial
systems around the world is likely to come from differences in investor protections
against expropriation by insiders as reflected by legal rules and the quality of
enforcement.
In particular, LLSV (1998) single out four legal origins throughout the world:
English, French, German and Scandinavian. English law is common law made by
5
judges and introduced into legislature afterwards. By contrast, the three other legal
origins are more based upon Roman law. Their computation supports the widespread
opinion that the English system is much more oriented towards the protection of
investors. In German and Scandinavian countries, a particular attention is made in
favor of the protection of creditor rights. In French-style countries, the investor rights
are clearly lower than they are in the other legal systems.
LLSV (1997) give evidence in favor of the hypotheses they suggest. Their empirical
findings show that civil law, and especially French-civil law countries, have both the
weakest investor protection and the least developed capital markets. Such
conclusions, however, are less sound for creditors than for shareholders. Moreover,
the results are mainly provided at a macro-economic level.
An empirical test is made at a micro-economic level but, as the authors said, the
results appear very poor. They do not manage to find significant relations between the
legal systems and the corporate capital structures. Their main explanation stems from
the structure of their international sample: most of the firms are large enterprises
(LEs) and they are apt to benefit from many sources of financing, inside and outside
their home country. By contrast, Small and Medium sized enterprises (SMEs) are
reputed not to have the same opportunities and are thus much more likely to be
dependent on their legal system. Unfortunately this common sense hypothesis is still
lacking information to verify.
The breakthrough approach developed by LLSV has led to a series of comments and
criticisms (Mesnard 2000). Most of them point out the crude classification in terms of

6
legal origins. For instance, Coffee (1991) showed that, at the beginning of the century,
the legal systems were already different but the financial systems were very similar
among the main capitalist countries. Another stream of comments concerns the true
causality between legal systems and the development of external finance. Rajan and
Zingales (1999) suggest that the minority shareholder rights have been mainly
induced by their growing role in the financial system. The inverse causality (“The
definition of minority shareholder rights has strongly supported the development of
these investors”) is very unlikely.
Empirical evidence may also be criticized on several aspects. Many indicators used by
LLSV are dummy variables or scales with few items. They are built upon purely
formal sources of information or sources oriented towards specific goals – for
instance, guides for investors (for a detailed listing of sources, see LLSV 1996). We
can thus wonder whether these very synthetic indexes are really unbiased or do not
provide a very partial view. Moreover, at a micro-level, the relevance of the empirical
tests is questionable, apart from the size issue. It seems quite natural to find in the
capital structure of firms the blueprint of external financing – as firms are on the
demand-side here. But a cross-country sample of firms throughout the world is likely
to face multiple disturbances (e.g. accounting discrepancies, degree of corporate
internationalization, etc…). Because of these difficulties, the mitigated results are not
so surprising.
In a nutshell, LLSV’s approach provides one of the first attempts to introduce the
legal topic into the economics field with measures and empirical evidence.

7
Methodological and empirical limits are real but they propose useful tools to tackle a
number of pending questions.
Creditor Rights and Corporate Finance
This paper endeavors to go further on one specific topic LLSV do not truly explore
through the following question: “Are capital structures of SMEs really much more
affected by the legal system of their home country than LEs?” The research is focused
on Western European countries. European countries are historically at the source of
the four legal systems described by LLSV and their national regulations are still
deeply shaped by their historical origins. On the other hand, the arena of European
business has been driven for several decades by powerful convergence forces within
the framework of the Single Market (and, more recently, the Euro currency).
Consequently, the European field provides a unique opportunity to compare the
possible impact of different legal systems on firms relatively homogenous in terms of
economic development.
As the capital structure is mainly shared between own funds and debts, we choose to
study it through the perspective of the corporate leverage. Most of the European firms
– which mean mainly SMEs – have a restricted access to equity markets and mainly
rely upon debt as regards external financing. Basically, the credit relationship is a
contractual agreement between two parts: a borrower commits to reimburse a clearly
defined amount on a regular basis for a fixed period. The most critical issue is here to
know what happens in case of breach in this contractual relationship. As LLSV (1996)
8
explained, the most basic creditor right is undoubtedly the right to repossess collateral
when a loan is in default.
In some countries, the law makes more difficult for the borrowers to repossess
collateralised loans in order to limit liquidation cases and immediate consequences in
terms of employment. The law can limit the right for a creditor to have or not a say in
reorganization. But creditors likely to experience such losses may be more reluctant to
finance companies and very eager to discriminate risky businesses. It thus follows that
the differences in creditor rights by country alter the credit relationship between
creditors and borrowers and, consequently, the capital structures.
LLSV (1998) describe creditor rights in a four-item scale based upon the sum of four
dummies: the first dummy indicates if the country does not impose an automatic stay
in case of reorganization procedure; the second one whether the country assures the
secured creditors the right to collateral in reorganization; the third one if the
management needs creditor consent to file for reorganization; and the last one whether
the management is replaced during the reorganization procedure (a more detailed
reasoning is exposed presented in the LLSV paper mentioned just above). It is
claimed that the higher the index, the higher the creditor rights.
It is also worthwhile to note that some countries impose the existence of legal reserve
requirements. This constraint forces firms to maintain a certain level of capital to
avoid an automatic liquidation. It protects creditors when they have few powers.
Moreover, some countries are stricter to enforce the rules defined by the laws. The
quality of legal enforcement may also influence the financial structure of firms. If the

9
legal rules are not enforced despite a formal claim, such a situation erases the legal
foundations. Lenders and borrowers do not trust the functioning of courts and cannot
really rely upon the contractual terms they have designed (table 1).
Table 1
Description of legal variables
Variable Description
Creditor rights
(CREDIT)
Index synthesizing the level of creditor rights in a country. It is
the sum of four dummies entitled “No automatic Stay on
Assets”, “Secured Creditors First Paid”, “Restrictions for going
into Reorganization” and “Management does not Stay in
Reorganization”
Legal reserve
(LEGRES)
It is the percentage of total share capital mandated by Corporate
Law to avoid the Company dissolution of an existing firm. It
takes a value of zero for countries without such Commercial
Code restriction.
Rule of law
(RULAW)
Assessment of the law and order tradition in the country
produced by the country-risk-rating agency ICR. Average of the
months of April and October of the monthly index between
1982 and 1995. Scale from O to 10, with lower scores for less
tradition for law and order.
Source: LLSV (1996, 1998).
What micro-economic impact these factors are likely to have on financial structures of
firms? On one hand, it is possible to consider that strongly protected creditors are less
risk averse and lend more easily. Creditor protections would thus lead to higher
leverage capabilities for firms. Such an argument is in line with LLSV’s reasoning at
a macro-level. But, on the other hand, it can be suggested that firms could be more
prone to choose other sources of finance if they consider that creditors benefit from
10
excessive protections. Such an alternative depends upon the bargaining power the
firms can have. If they are strictly dependent upon the credit source, it is likely to find
a positive impact of creditor rights on corporate leverage. If they were not, it would be
more likely to find no impact. An inverse effect (id est. a negative impact) could be
also possible when firms have bargaining power on their side. Corporate size is a
proxy available to tackle the bargaining power. Indeed, as mentioned above, SMEs
are often claimed to be dependent upon the financial system of their home country.
By contrast, LEs may search for multiple sources of financing in geographical and
financial terms and they are able to trade-off between these sources.
DATA DESCRIPTION
Data source
Corporate information stems from the Bach database managed by the European
Commission (DG Economics and Finance)1. The BACH database contains aggregated
information on thirteen countries including Japan and the United States; three size
classes; twenty-three sectors or sub-sectors; time series of a maximum of 15 years;
and ninety-five items, including assets, liabilities and the profit & loss account. All
items are presented in structured form, i.e. as a percentage of balance sheet total or net
turnover (Partsch and Savary, 1997).
Accounting harmonization is still incomplete at the international and even at the
European level. The common layout for accounting harmonization is, however, based
1 More information is available on http://europa.eu.int/comm/dg02/databases/bach_en.htm.

11
on Articles 10 and 23 of the 4th Council Directive with some adjustments for the
presentation of the data. The existing time series have been recalculated on the basis
of the new definitions wherever possible. Harmonization work is occasionally at the
expense of the amount of information contained in BACH. Moreover harmonization
work has been mainly concentrated on the European countries due to less detailed
information on the American and Japanese data. The comparability of the data from
the U.S.A. and Japan with the European data is therefore limited.
Twenty-three sectors or sub-sectors are included. Corporate data exist for the whole
business industry (Energy and Water; Manufacturing industry; Building & Civil
Engineering; Trade; Transports and communications; other services) but they are not
always available in all the countries.
Three corporate size classes are in the BACH database, except the US where only two
size classes are available: for European countries, a distinction is made between small
companies with a turnover of less than 7 million EURO (ECU); medium-size
companies with a turnover between 7 million EURO (ECU) and 40 million EURO
(ECU); and large companies with turnover in excess of EURO (ECU) 40 million.
Data from 10 European countries were extracted from BACH: Austria, Belgium,
Denmark, Finland, France, Germany, Italy, Netherlands, Portugal and Spain. Except
Denmark, all these countries are included in the Euroland; only Ireland and
Luxembourg being missing. Swedish data were not available when the research was
undertaken. The cases provide information on a five-year period, from 1993 to 1997.
12
For each country, the companies are available aggregated in three size classes
according to the thresholds defined above.
Only data on manufacturing industry were selected: the data for the other industries
were too often missing to provide a sound basis for analysis. The most precise and
available level of classification was preferred (3-digit level). We had the 10 following
breakdowns: (1) In intermediate products, ‘Extraction of metalliferous ores and
preliminary processing of metal’ (sector 211); ‘Extraction of non-metalliferous ores
and manufacture of non-metallic mineral products’ (sector 212); ‘Chemicals and man-
made fibbers’ (sector 213); (2) in Investment and consumer durable goods,
‘Manufacture of metal articles, Mechanical and instrument engineering’ (sector 221);
‘Electrical and electronic equipment, including office and computing equipment’
(sector 222); ‘Manufacture of transport equipment’ (sector 223); (3) in, ‘Food, drink
and tobacco’ (sector 231); ‘Textiles, leather and clothing’ (sector232); ‘Timber and
paper manufacture, printing’ (sector 233); ‘Other manufacturing industries not
elsewhere specified’ (sector 234).
Basically, the structure of the sample is a panel and the unit of analysis observed
during the period 1993 - 1997 is the following:
Firmj,k,l = Countryj * Sectork * Sizel
Here the unit of analysis looks like a “quasi-firm”, which is the average behavior of
the small/medium/large firms in manufacturing industry in Europe (EU10).
13
Sample structure
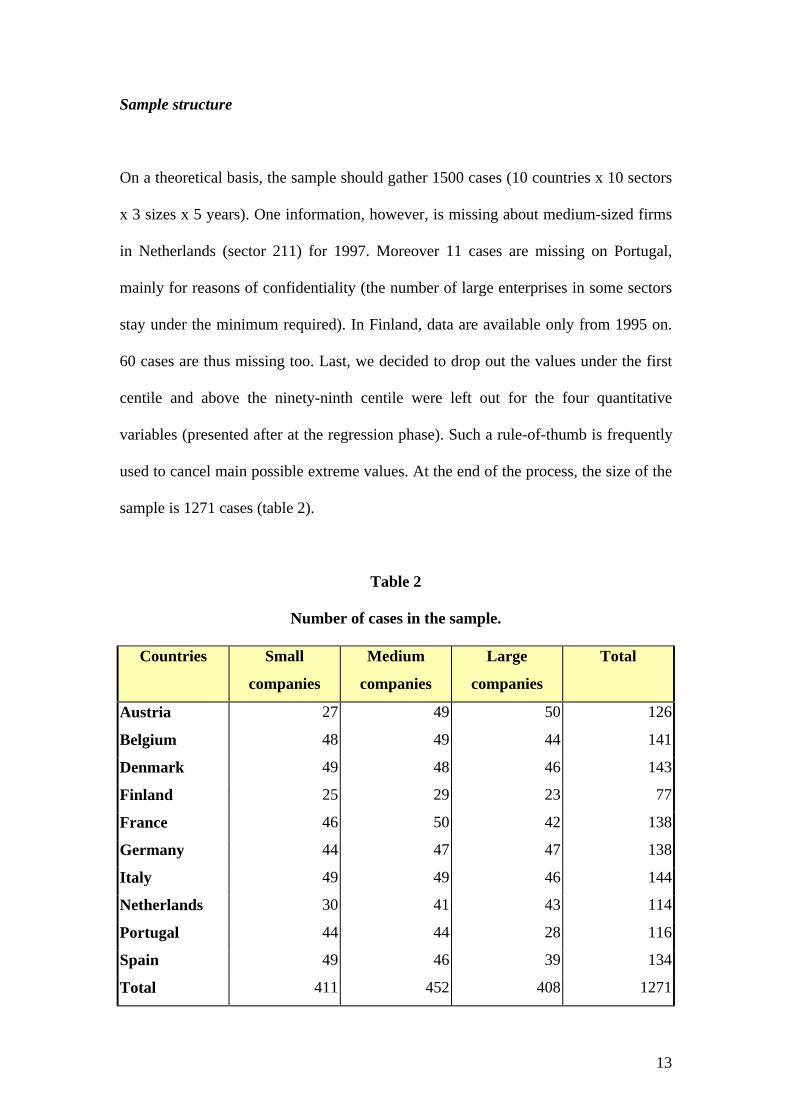
On a theoretical basis, the sample should gather 1500 cases (10 countries x 10 sectors
x 3 sizes x 5 years). One information, however, is missing about medium-sized firms
in Netherlands (sector 211) for 1997. Moreover 11 cases are missing on Portugal,
mainly for reasons of confidentiality (the number of large enterprises in some sectors
stay under the minimum required). In Finland, data are available only from 1995 on.
60 cases are thus missing too. Last, we decided to drop out the values under the first
centile and above the ninety-ninth centile were left out for the four quantitative
variables (presented after at the regression phase). Such a rule-of-thumb is frequently
used to cancel main possible extreme values. At the end of the process, the size of the
sample is 1271 cases (table 2).
Table 2
Number of cases in the sample.
Countries Small
companies
Medium
companies
Large
companies
Total
Austria 27 49 50 126
Belgium 48 49 44 141
Denmark 49 48 46 143
Finland 25 29 23 77
France 46 50 42 138
Germany 44 47 47 138
Italy 49 49 46 144
Netherlands 30 41 43 114
Portugal 44 44 28 116
Spain 49 46 39 134
Total 411 452 408 1271
14
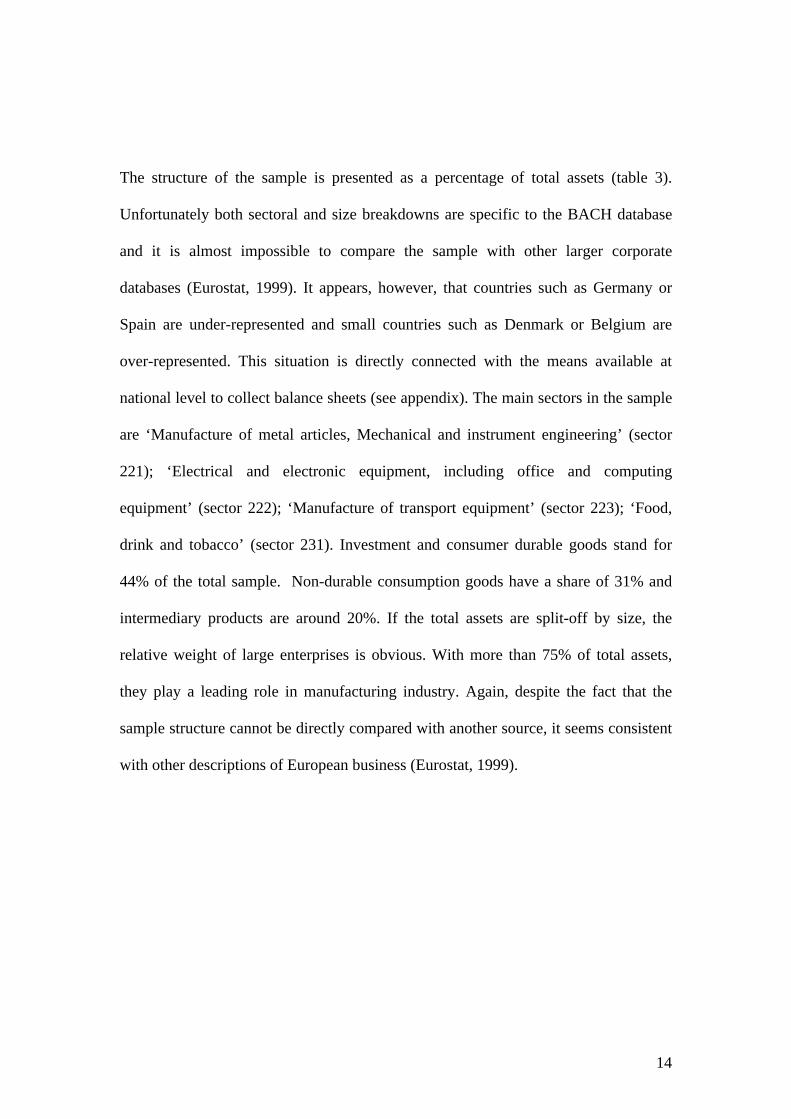
The structure of the sample is presented as a percentage of total assets (table 3).
Unfortunately both sectoral and size breakdowns are specific to the BACH database
and it is almost impossible to compare the sample with other larger corporate
databases (Eurostat, 1999). It appears, however, that countries such as Germany or
Spain are under-represented and small countries such as Denmark or Belgium are
over-represented. This situation is directly connected with the means available at
national level to collect balance sheets (see appendix). The main sectors in the sample
are ‘Manufacture of metal articles, Mechanical and instrument engineering’ (sector
221); ‘Electrical and electronic equipment, including office and computing
equipment’ (sector 222); ‘Manufacture of transport equipment’ (sector 223); ‘Food,
drink and tobacco’ (sector 231). Investment and consumer durable goods stand for
44% of the total sample. Non-durable consumption goods have a share of 31% and
intermediary products are around 20%. If the total assets are split-off by size, the
relative weight of large enterprises is obvious. With more than 75% of total assets,
they play a leading role in manufacturing industry. Again, despite the fact that the
sample structure cannot be directly compared with another source, it seems consistent
with other descriptions of European business (Eurostat, 1999).
15
Table 3Structure of the sample by country, sector and size (in % of total assets).
By country %Austria 2,81%Belgium 5,92%Denmark 2,87%Finland 2,38%France 16,78%Germany 27,39%Italy 24,54%Netherlands 7,99%Portugal 1,61%Spain 7,71%Total 100,00%
By size %Small companies 6,30%Medium companies 17,67%Large companies 76,03%Total 100,00%
By sector %211 5,17%212 4,78%213 15,14%221 15,64%222 14,04%223 13,96%231 13,98%232 4,96%233 7,44%234 4,90%
Total 100,00%
Descriptive results
16
In this descriptive section, the figures on legal systems and financial structures are
examined country by country. Six countries have a French legal origin, two other a
German origin and two other a Scandinavian origin (table 4). Unfortunately, no
country from the Common Law tradition is available in the sample. Nevertheless,
LLSV (1997) pointed out that French countries are very different from German and
Scandinavian countries as regards creditor rights. Such an opposition will thus be a
matter of special attention in the empirical test.
In German countries, the proxies exhibit very close figures, diverging only on the
threshold for legal reserves. In Scandinavian countries, the main difference is in the
value of the creditor index with a high gap of 2 % points. Of course, the variance is
higher for the six French countries. France has the lowest rating on the creditor right
index but none of the French countries goes beyond the rating “2”. The figures are
more contrasted on the two other items. It is worthwhile to note that the rating for the
rule of law index varies on a geographical border: French countries in the northern
part of Europe reach the top value of “10”. Other countries in the Southern part of
Europe are rated with a lower value (from 7.80 to 8.98). This gap of 1 or 2 points
measured on a scale of 10 is sizeable. The situation is contrasted about the legal
reserves. Basically, one group of countries sets up thresholds up to 10 % (Belgium,
Finland, France, Germany and Netherlands) ; another group requires 20 % or more
(Austria, Denmark, Italy, Portugal, Spain). By contrast with the two items described
above, the requirement of legal reserve does not seem to be linked with the legal
origin of the 10 European countries in the sample.

17
Table 4
Legal systems by country
Countries CREDIT RULAW LEGRES
(%)
Legal origin
Austria 3 10 0.25 German
Belgium 2 10 0.10 French
Denmark 3 10 0.25 Scandinavian
Finland 1 10 0.10 Scandinavian
France 0 8.98 0.10 French
Germany 3 10 0.10 German
Italy 2 8.33 0.20 French
Netherlands 2 10 0.00 French
Portugal 1 8.68 0.20 French
Spain 2 7.80 0.20 French
Source: LLSV (1998)
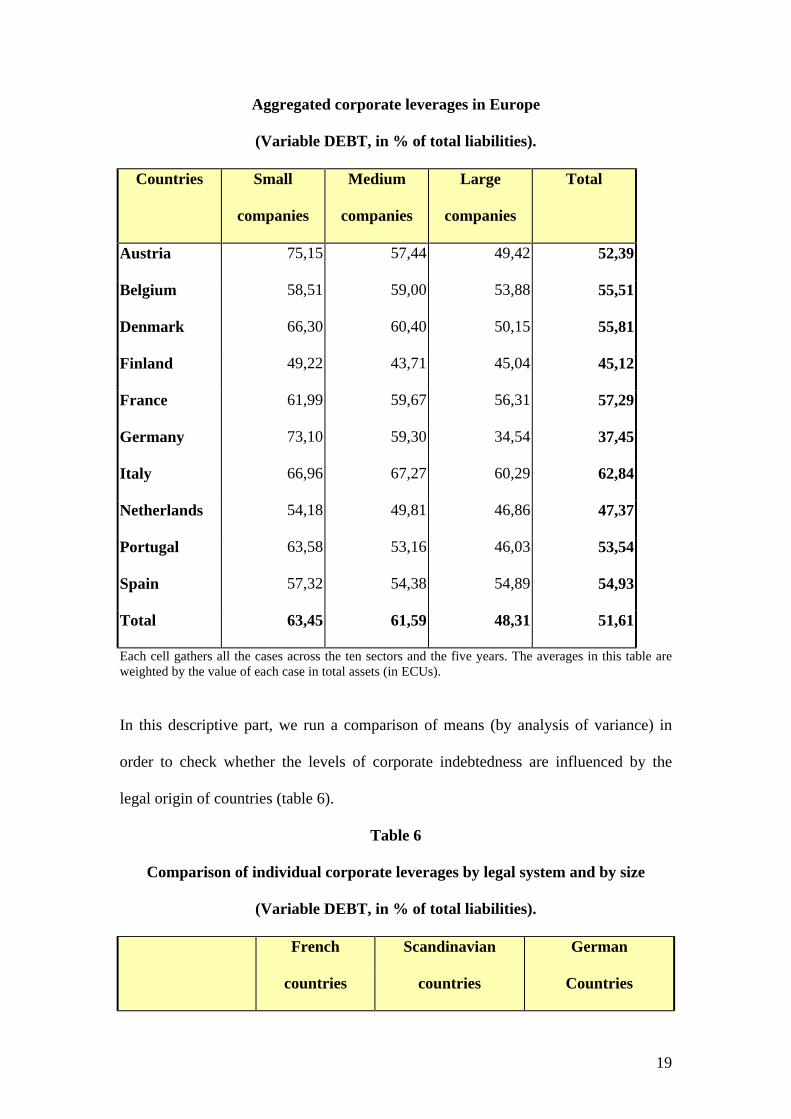
The figures describing the corporate structures in the ten European countries are
presented through a cross tabulation table country by size (table 5). As much research
in this field (Rajan and Zingales, 1995; Kremp and Stöss, 2001), a firm’s financial
structure is looked upon through the angle of indebtedness. The concept of debt used
here is the overall debt ratio, which reflects the proportion of short and long term
debts in the balance sheet. All debt is taken into consideration, i.e. not only bank debt,
which accounts for the bulk of total debt, but also bonds issue, commercial, tax and
social security debts, any intra-group debt, etc.
18
Table 5 gives descriptive averages summarizing the data by country and size. During
the period 1993-1997, the debt generally remains the first source of financing for the
European firms in the manufacturing industry. The figures show a 15 % gap between
the smallest and the largest companies. The size effect exhibits a very linear pattern
with a constant decrease from small to medium and large companies. This size gap
seems widespread throughout European countries. Despite presenting different
patterns, Spain, Italy, France and Finland, however, have narrower gaps (around 5 %).
The Italian companies are the most dependant on credit with more than 60% of total
liabilities. Five countries (Portugal, Spain, Belgium, Denmark and France) are
concentrated between 53 % and 58 %, i.e. 5 points. But, in Denmark and Portugal, the
capital structure substantially differs between the smallest and the largest companies
in the sample. By contrast, in Belgium, Spain and France, the gap never exceeds 5 %.
Austria, Finland, Germany and the Netherlands have the lowest levels of leverage
(from 52 % - Austria – to 37 % - Germany). But a strong heterogeneity is obvious
when the figures are observed size by size. Small companies in Austria and Germany
are the most indebted firms in Europe. It is widely claimed that such a situation stems
from the specific regulation on provisions existing in Germanic countries (Delbreil
and al., 1997). By contrast, the Netherlands and Finland exhibit much more
homogeneous situation with relatively low levels of leverage on average and no more
than 8 % between the smaller and the larger companies
Table 5
19
Aggregated corporate leverages in Europe
(Variable DEBT, in % of total liabilities).
Countries Small
companies
Medium
companies
Large
companies
Total
Austria 75,15 57,44 49,42 52,39
Belgium 58,51 59,00 53,88 55,51
Denmark 66,30 60,40 50,15 55,81
Finland 49,22 43,71 45,04 45,12
France 61,99 59,67 56,31 57,29
Germany 73,10 59,30 34,54 37,45
Italy 66,96 67,27 60,29 62,84
Netherlands 54,18 49,81 46,86 47,37
Portugal 63,58 53,16 46,03 53,54
Spain 57,32 54,38 54,89 54,93
Total 63,45 61,59 48,31 51,61
Each cell gathers all the cases across the ten sectors and the five years. The averages in this table areweighted by the value of each case in total assets (in ECUs).
In this descriptive part, we run a comparison of means (by analysis of variance) in
order to check whether the levels of corporate indebtedness are influenced by the
legal origin of countries (table 6).
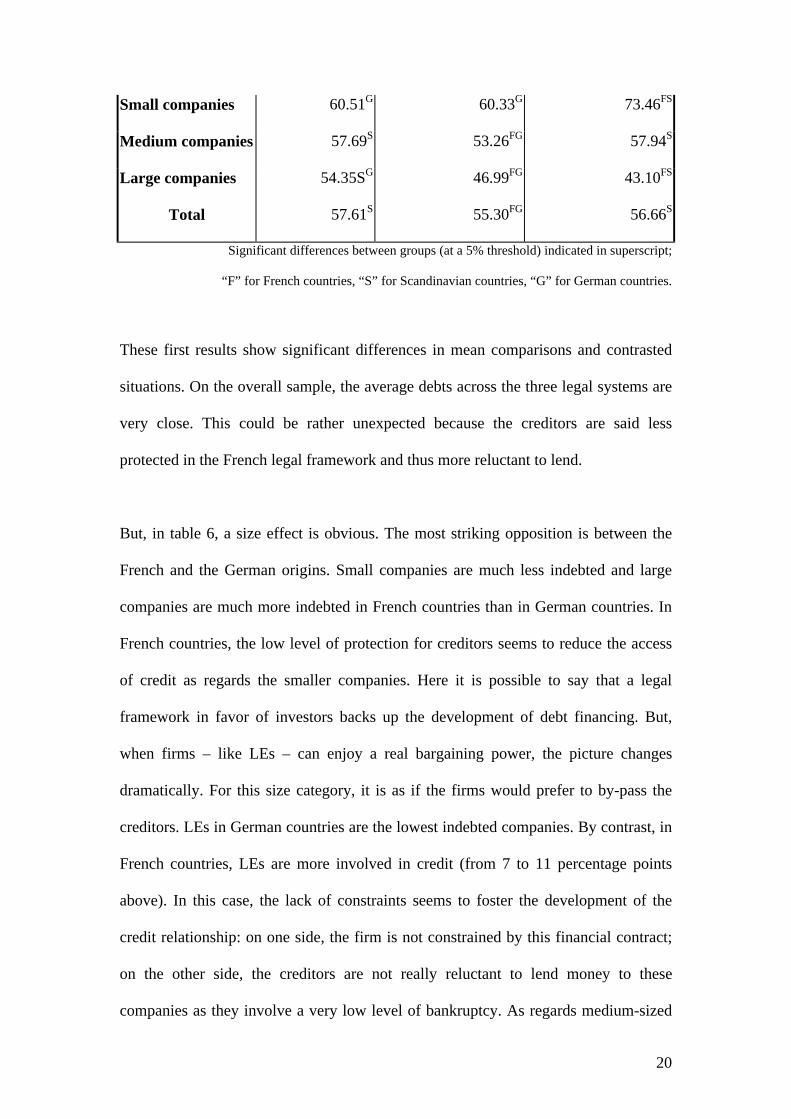
Table 6
Comparison of individual corporate leverages by legal system and by size
(Variable DEBT, in % of total liabilities).
French
countries
Scandinavian
countries
German
Countries
20
Small companies 60.51G 60.33G 73.46FS
Medium companies 57.69S 53.26FG 57.94S
Large companies 54.35SG 46.99FG 43.10FS
Total 57.61S 55.30FG 56.66S
Significant differences between groups (at a 5% threshold) indicated in superscript;
“F” for French countries, “S” for Scandinavian countries, “G” for German countries.
These first results show significant differences in mean comparisons and contrasted
situations. On the overall sample, the average debts across the three legal systems are
very close. This could be rather unexpected because the creditors are said less
protected in the French legal framework and thus more reluctant to lend.
But, in table 6, a size effect is obvious. The most striking opposition is between the
French and the German origins. Small companies are much less indebted and large
companies are much more indebted in French countries than in German countries. In
French countries, the low level of protection for creditors seems to reduce the access
of credit as regards the smaller companies. Here it is possible to say that a legal
framework in favor of investors backs up the development of debt financing. But,
when firms – like LEs – can enjoy a real bargaining power, the picture changes
dramatically. For this size category, it is as if the firms would prefer to by-pass the
creditors. LEs in German countries are the lowest indebted companies. By contrast, in
French countries, LEs are more involved in credit (from 7 to 11 percentage points
above). In this case, the lack of constraints seems to foster the development of the
credit relationship: on one side, the firm is not constrained by this financial contract;
on the other side, the creditors are not really reluctant to lend money to these
companies as they involve a very low level of bankruptcy. As regards medium-sized
21
companies, the differences in are comparatively narrower than for the two other size
classes. This supports the idea of a size effect with a switch in the visible impact from
the smaller to the larger companies. By contrast, the Scandinavian is
“idiosyncratically in the middle”.
REGRESSION RESULTS AND COMMENTS
On the basis of the descriptive results, the impact of the legal variables on the debt
level is tested through a set of regressions not only on the whole sample but also by
size class. It is strongly expected that the coefficients could substantially differ
alongside with the size.
A number of control variables is introduced into the regression. The choice is based
upon previous works on corporate financial structures and upon availability (Rajan
and Zingales, 1995; Kremp and Stöss, 2001): A first proxy – gathering tangible fixed
assets and stocks in the balance sheet – stands for firm collaterals (COLL). Stocks and
tangible fixed assets are often considered as an asset easy to resale in case of financial
distress. In case of bankruptcy, creditors with a right on these assets can find buyers
and be repaid with a low search cost. Moreover, they can be priced by reference to
market prices. The higher the level of collaterals, the higher a firm’s leverage. A
second proxy provides an approximation of the cost of financing by debt (FINCH).
An enterprise’s financial charges essentially constitute interest paid for loans as a
percentage of turnover. The concept of financial charges used here (for reasons
inherent in the technical problems of international comparability) is broader than the
traditional concept of “interest paid”. In certain countries it includes negative
22
foreign-exchange items (such items represent varying proportions of financial charges
depending on the country in question and range from 5% to 15%). Financial charges
also include sums repaid to the group and to associated enterprises. This ratio gives a
crude but comparable estimate across countries of the “price” of debt for companies.
The higher the cost of debt financing, the lower a firm’s leverage. A third variable
gives an assessment of the firm capability of self-financing. It is based upon the return
on asset (ROA). An enterprise return on assets corresponds to the final profit of the
year as a percentage of turnover. The higher the return on assets, the lower a firm’s
leverage. It can be considered as a proxy for the profitability of investments by the
companies and an important source to generate cash flow. In order to take into
account the effect of size on leverage which is generally identified (Coeurderoy,
2001), the turnover is introduced in the regression (measured by its logarithm).
Sector (SECT 211-234) and year (YEAR94-97) variables are also introduced to tackle
specific business needs and possible business cycles effects.
In order to keep into account a mre microeconomic perspective, each is considered
individually – as a “quasi-firm” -, whatever the size of the companies. However,
considering (and checking) that such a cross section – cross country sample is
exposed to heteroscedasticity problems, we test coefficients with asymptotic standard
errors in order to obtain heteroscedastic – consistent evaluations.
It is decided to test separately but systematically regressions with dummies indicating
the legal origin on one hand; and the three items on the creditor rights, the rule of law
and the legal reserves on the other hand. Because of strong colinearities among these
two sets of variables, it is not really possible to gather them in a single regression. The
23
four tables (table 7 to 10) exhibit the three same regression outputs: (1) a regression
run with only the control variables; (2) a regression run with the control variables plus
the dummies of legal origin; (3) a regression run with the control variables plus the
three legal items.
Even if it is not directly of interest in this paper, some comments about the control
variables deserve attention as they are closely related with the credit relationship. At
first, a strong influence of economic and financial variables on capital structure is
noticeable. These results are consistent with previous empirical findings (Rajan and
Zingales, 1995; Kremp and Stöss, 2001). The existence of collaterals (COLL variable)
increases the firm capabilities of lending. These assets stand for credible
commitments in the credit relationship. But such reasoning appears mainly relevant
for the smaller companies. The coefficients are not significant in the case of medium
nor large companies. As suggested previously, numerous reasons may be put forward:
large companies have a bigger bargaining power with their creditors; they often have
in-house better skills in financial engineering; and their risk of bankruptcy is lower.
As regards the financial variables (CHFI and ROA), the coefficients have the
expected negative signs too. The higher the cost of financing, the lower the
indebtedness level. But there is a gap between the coefficients of LEs and SMEs. In
absolute terms, LEs have higher coefficients. It is another evidence in favor of LEs
capabilities to trade-off among alternative sources of financing. By comparison,
European SMEs are more in a position of hostage in terms of external finance. The
coefficients of the ROA variable are relatively constant across sizes. This tends to
show a constant managerial behavior in terms of corporate finance choices.

24
If we move now towards our core issue, we find a very strong impact of legal
variables on firm capital structure. Looking at the changes in explained variance (R2),
we find that, for the whole sample, regression (2) gains + 1 % and regression (3) + 4
% only ; but that, for the small companies, regression (2) gains + 16 % and regression
(3) + 10 %; that, for the medium-sized companies, regression (2) gains 0.5 % only
and regression (3) + 10 %; and that, for the larger companies, regression (2) gains +
17 % and regression (3) + 6 %. These gains are often sizeable as we keep in mind the
limited variance of these legal proxies. It gives evidence that the legal systems
introduce a deep segmentation into national corporate finance patterns. This
conclusion supports LLSV’s intuitions at a micro-level. In particular, the dummy for
the legal origin (FRENCH ORIGIN) has often a 10% share in the explained variance.
Despite economic and financial convergence in Europe at a macro-level, huge
discrepancies are pending at the micro-level of firms because legal systems impose
different rules of the game in business.
The reading of the coefficients by size class is an incentive to go further in the
analysis. Basically, there is one story for each size class. In French origin countries,
the smaller companies have less access to credit financing than in Scandinavian or
Germanic countries. The results on the small firms are really in line with LLSV’s
arguments. They also give evidence to support the idea that the creditor rights
improve the development of this source of external finance through a better credibility
of the contractual credit relationship. Legal reserve requirements help also the credit
relationship to strive. Similarly, the smaller companies benefit from a more efficient
rule of law.
25
The medium-sized enterprises are affected by the legal environment in the same way
as the small companies but at a lower extent. As regards the second regression, the
legal origin does not seem to matter, apart from the significant but limited opposition
between French and German origins. The legal reserve requirement strongly increases
the levels of corporate debt. Moreover, like the smaller companies, their capability of
lending rises when the creditor rights are high. But the two other variables on the
French origin and on the rule of law have not any significant impact. Yet, the
relevance of the size class is questionable, especially when considering the opposition
between the smaller and the larger companies. We would need a more precise size
breakdown to know whether there is or not a specificity for medium-sized firms.
The coefficients of the larger enterprises are in a total opposition with those of the
smaller companies, apart from the LEGRES proxy. As regards LEs, the higher the
creditor rights, the lower the debt ratio in capital structures. When the rule of law has
a high rating, the debt share is lower in the capital structure too. These findings are
more in favor of the alternative hypothesis to LLSV’s argument. They support the
idea that LEs can benefit from a bargaining power to trade-off between equity and
credit sources of financing. In this case, they prefer to by-pass the constraints imposed
on credit regulation by the legal system.
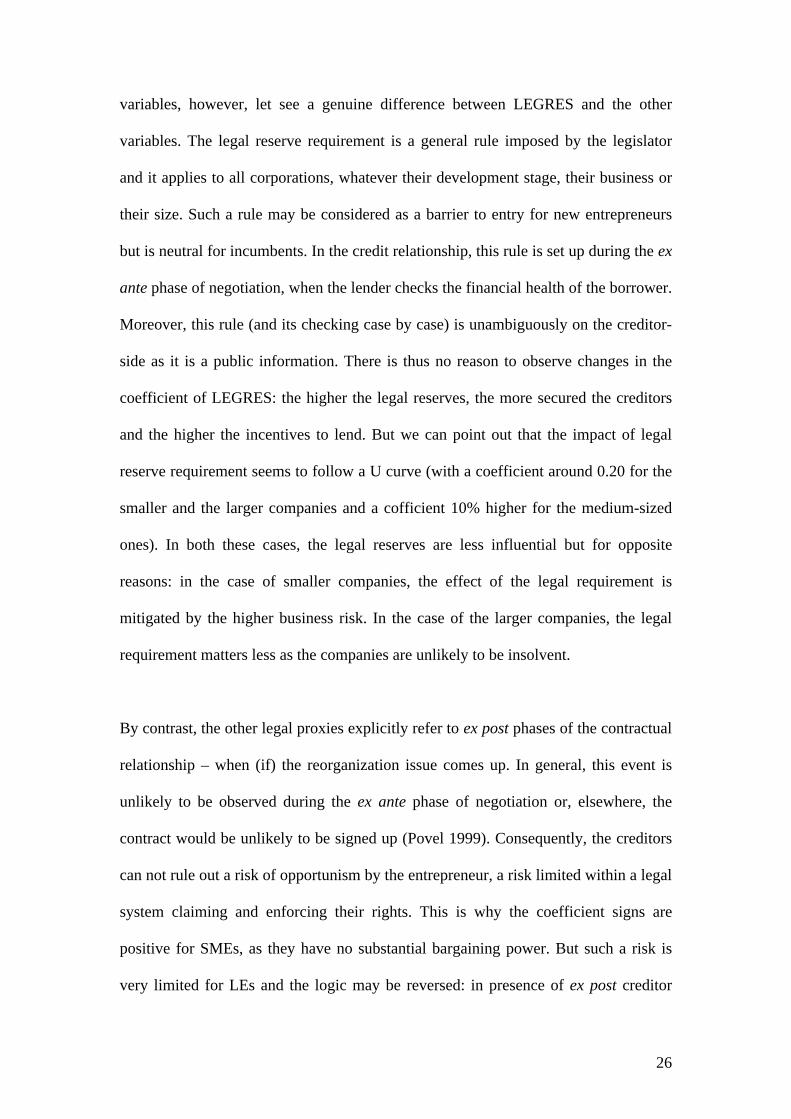
Considering these results, one question has to be addressed now: how can we explain
that the coefficients of LEGRES are constantly positive and do not vary by size class
as the others? Indeed all the legal proxies are oriented in the same way (the higher the
value, the higher the creditor rights). Consequently, the difference in signs can
jeopardize our reasoning discriminating among size classes. A close attention to these
26
variables, however, let see a genuine difference between LEGRES and the other
variables. The legal reserve requirement is a general rule imposed by the legislator
and it applies to all corporations, whatever their development stage, their business or
their size. Such a rule may be considered as a barrier to entry for new entrepreneurs
but is neutral for incumbents. In the credit relationship, this rule is set up during the ex
ante phase of negotiation, when the lender checks the financial health of the borrower.
Moreover, this rule (and its checking case by case) is unambiguously on the creditor-
side as it is a public information. There is thus no reason to observe changes in the
coefficient of LEGRES: the higher the legal reserves, the more secured the creditors
and the higher the incentives to lend. But we can point out that the impact of legal
reserve requirement seems to follow a U curve (with a coefficient around 0.20 for the
smaller and the larger companies and a cofficient 10% higher for the medium-sized
ones). In both these cases, the legal reserves are less influential but for opposite
reasons: in the case of smaller companies, the effect of the legal requirement is
mitigated by the higher business risk. In the case of the larger companies, the legal
requirement matters less as the companies are unlikely to be insolvent.
By contrast, the other legal proxies explicitly refer to ex post phases of the contractual
relationship – when (if) the reorganization issue comes up. In general, this event is
unlikely to be observed during the ex ante phase of negotiation or, elsewhere, the
contract would be unlikely to be signed up (Povel 1999). Consequently, the creditors
can not rule out a risk of opportunism by the entrepreneur, a risk limited within a legal
system claiming and enforcing their rights. This is why the coefficient signs are
positive for SMEs, as they have no substantial bargaining power. But such a risk is
very limited for LEs and the logic may be reversed: in presence of ex post creditor
27
safeguards, entrepreneurs in LEs are less prone to borrow and more prone to trade-off
with the alternative sources of financing that are available for them. Negative signs
give significant evidence of this strategy.
To conclude, going back to our seed question, “Are capital structures of SMEs really
much more affected by the legal system of their home country than LEs?” we would
like to provide a two-stage answer. First, both of them are impacted by the legal
system. But, second, there are not affected in the same way. Facing risk aversion from
lenders, the smaller companies benefit from a legal framework designed to support
creditor rights. But, the larger companies prefer to lower their debt ratio in favor of
other sources of financing as they have more trade-off opportunities.
28
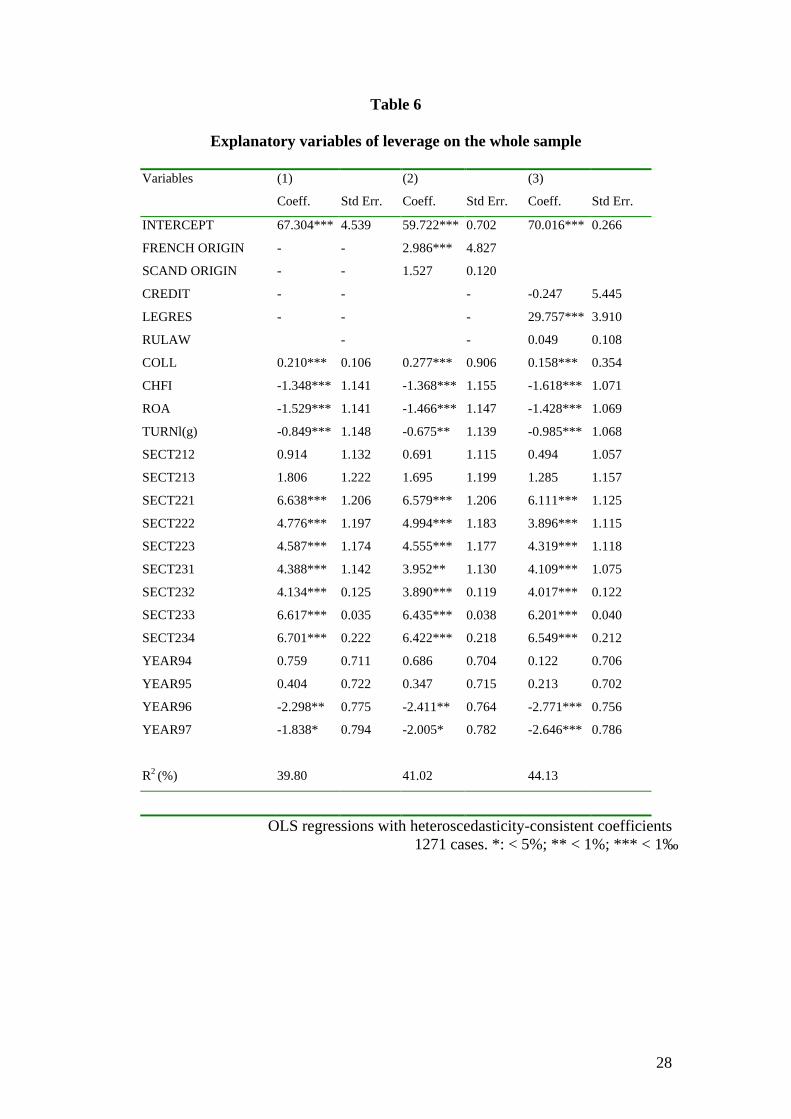
Table 6
Explanatory variables of leverage on the whole sample
Variables (1)
Coeff. Std Err.
(2)
Coeff. Std Err.
(3)
Coeff. Std Err.
INTERCEPT 67.304*** 4.539 59.722*** 0.702 70.016*** 0.266
FRENCH ORIGIN - - 2.986*** 4.827
SCAND ORIGIN - - 1.527 0.120
CREDIT - - - -0.247 5.445
LEGRES - - - 29.757*** 3.910
RULAW - - 0.049 0.108
COLL 0.210*** 0.106 0.277*** 0.906 0.158*** 0.354
CHFI -1.348*** 1.141 -1.368*** 1.155 -1.618*** 1.071
ROA -1.529*** 1.141 -1.466*** 1.147 -1.428*** 1.069
TURNl(g) -0.849*** 1.148 -0.675** 1.139 -0.985*** 1.068
SECT212 0.914 1.132 0.691 1.115 0.494 1.057
SECT213 1.806 1.222 1.695 1.199 1.285 1.157
SECT221 6.638*** 1.206 6.579*** 1.206 6.111*** 1.125
SECT222 4.776*** 1.197 4.994*** 1.183 3.896*** 1.115
SECT223 4.587*** 1.174 4.555*** 1.177 4.319*** 1.118
SECT231 4.388*** 1.142 3.952** 1.130 4.109*** 1.075
SECT232 4.134*** 0.125 3.890*** 0.119 4.017*** 0.122
SECT233 6.617*** 0.035 6.435*** 0.038 6.201*** 0.040
SECT234 6.701*** 0.222 6.422*** 0.218 6.549*** 0.212
YEAR94 0.759 0.711 0.686 0.704 0.122 0.706
YEAR95 0.404 0.722 0.347 0.715 0.213 0.702
YEAR96 -2.298** 0.775 -2.411** 0.764 -2.771*** 0.756
YEAR97 -1.838* 0.794 -2.005* 0.782 -2.646*** 0.786
R2 (%) 39.80 41.02 44.13
OLS regressions with heteroscedasticity-consistent coefficients1271 cases. *: < 5%; ** < 1%; *** < 1‰
29
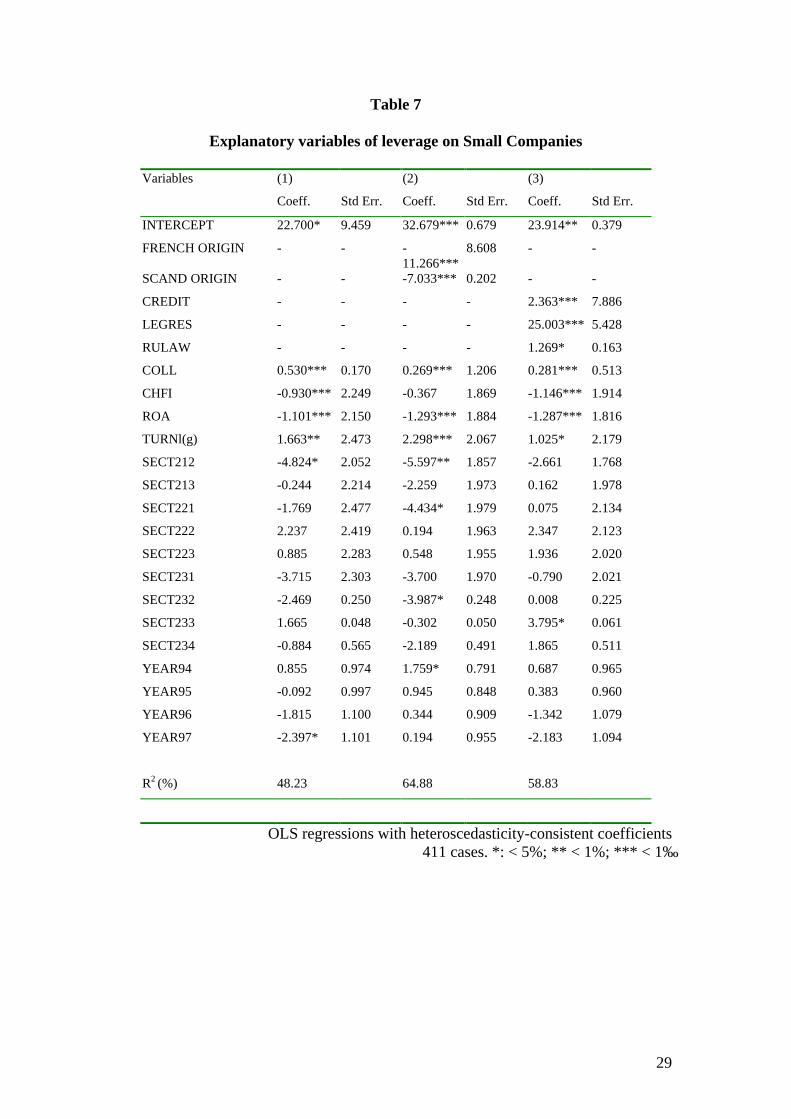
Table 7
Explanatory variables of leverage on Small Companies
Variables (1)
Coeff. Std Err.
(2)
Coeff. Std Err.
(3)
Coeff. Std Err.
INTERCEPT 22.700* 9.459 32.679*** 0.679 23.914** 0.379
FRENCH ORIGIN - - -11.266***
8.608 - -
SCAND ORIGIN - - -7.033*** 0.202 - -
CREDIT - - - - 2.363*** 7.886
LEGRES - - - - 25.003*** 5.428
RULAW - - - - 1.269* 0.163
COLL 0.530*** 0.170 0.269*** 1.206 0.281*** 0.513
CHFI -0.930*** 2.249 -0.367 1.869 -1.146*** 1.914
ROA -1.101*** 2.150 -1.293*** 1.884 -1.287*** 1.816
TURNl(g) 1.663** 2.473 2.298*** 2.067 1.025* 2.179
SECT212 -4.824* 2.052 -5.597** 1.857 -2.661 1.768
SECT213 -0.244 2.214 -2.259 1.973 0.162 1.978
SECT221 -1.769 2.477 -4.434* 1.979 0.075 2.134
SECT222 2.237 2.419 0.194 1.963 2.347 2.123
SECT223 0.885 2.283 0.548 1.955 1.936 2.020
SECT231 -3.715 2.303 -3.700 1.970 -0.790 2.021
SECT232 -2.469 0.250 -3.987* 0.248 0.008 0.225
SECT233 1.665 0.048 -0.302 0.050 3.795* 0.061
SECT234 -0.884 0.565 -2.189 0.491 1.865 0.511
YEAR94 0.855 0.974 1.759* 0.791 0.687 0.965
YEAR95 -0.092 0.997 0.945 0.848 0.383 0.960
YEAR96 -1.815 1.100 0.344 0.909 -1.342 1.079
YEAR97 -2.397* 1.101 0.194 0.955 -2.183 1.094
R2 (%) 48.23 64.88 58.83
OLS regressions with heteroscedasticity-consistent coefficients411 cases. *: < 5%; ** < 1%; *** < 1‰

30
Table 8
Explanatory variables of leverage on Medium Companies
Variables (1)
Coeff. Std Err.
(2)
Coeff. Std Err.
(3)
Coeff. Std Err.
INTERCEPT 18.420** 6.604 13.904* 0.643 21.253** 0.271
FRENCH ORIGIN - - 1.521* 7.063 -
SCAND ORIGIN - - 0.924 0.184
CREDIT - - 0.594* 7.843
LEGRES - - 32.336*** 3.815
RULAW 0.836* 0.161
COLL 0.088 0.171 0.140* 0.959 -0.025 0.390
CHFI -0.703*** 1.509 -0.777*** 1.535 -0.962*** 1.351
ROA -1.126*** 1.517 -1.149*** 1.536 -1.079*** 1.414
TURNl(g) 3.082*** 1.442 3.174*** 1.414 2.471*** 1.283
SECT212 -6.489*** 1.544 -6.412*** 1.525 -6.429*** 1.411
SECT213 -6.800*** 1.263 -6.690*** 1.249 -6.778*** 1.228
SECT221 -5.991*** 1.451 -5.936*** 1.427 -5.658*** 1.297
SECT222 -1.757 1.327 -1.516 1.306 -2.278 1.243
SECT223 1.025 1.420 1.016 1.415 0.854 1.275
SECT231 -4.932*** 1.443 -5.143*** 1.442 -4.096** 1.353
SECT232 -2.202 0.149 -2.327 0.154 -1.373 0.140
SECT233 -3.301* 0.051 -3.248* 0.060 -3.013* 0.053
SECT234 -1.303 0.317 -1.256 0.312 -0.965 0.308
YEAR94 1.159 0.657 1.159 0.662 0.505 0.575
YEAR95 0.125 0.705 0.120 0.705 -0.045 0.615
YEAR96 -1.290 0.748 -1.311 0.747 -1.852** 0.654
YEAR97 -0.788 0.810 -0.809 0.812 -1.577* 0.730
R2 (%) 55.67 56.17 65.28
OLS regressions with heteroscedasticity-consistent coefficients458 cases. *: < 5%; ** < 1%; *** < 1‰

31
Table 9
Explanatory variables of leverage on Large Companies
Variables (1)
Coeff. Std Err.
(2)
Coeff. Std Err.
(3)
Coeff. Std Err.
INTERCEPT 72.596*** 9.514 43.219*** 0.858 71.628*** 0.525
FRENCH ORIGIN - - 10.991*** 8.028 -
SCAND ORIGIN - - 7.475*** 0.139
CREDIT - - -2.505*** 14.185
LEGRES - - 22.073** 6.793
RULAW -0.146 0.146
COLL -0.108 0.138 0.091 1.243 -0.062 0.844
CHFI -1.654*** 1.627 -1.459*** 1.633 -1.754*** 1.666
ROA -1.214*** 1.701 -1.068*** 1.356 -1.050*** 1.493
TURNl(g) -0.340 1.816 0.376 1.593 -0.096 1.710
SECT212 -0.643 1.749 0.171 1.521 -1.057 1.655
SECT213 0.904 2.393 -0.040 1.878 -0.438 2.188
SECT221 6.073*** 1.705 7.719*** 1.459 6.437*** 1.537
SECT222 1.550 1.947 3.019* 1.825 1.037 1.778
SECT223 6.295** 1.618 6.388*** 1.874 5.885** 1.759
SECT231 3.867* 1.770 3.433* 1.540 2.908 1.654
SECT232 1.869 0.194 2.869 0.157 1.882 0.174
SECT233 4.553** 0.061 4.867*** 0.061 3.926* 0.070
SECT234 6.927*** 0.492 6.938*** 0.402 6.545*** 0.473
YEAR94 -0.793 1.330 -0.849 1.063 -1.383 1.258
YEAR95 -0.189 1.329 -0.231 1.055 -0.819 1.237
YEAR96 -3.565** 1.352 -3.476** 1.140 -4.336*** 1.247
YEAR97 -2.701 1.442 -2.560* 1.207 -3.605*** 1.337
R2 (%) 38.97 56.44 45.43
OLS regressions with heteroscedasticity-consistent coefficients408 cases. *: < 5%; ** < 1%; *** < 1‰
32
REFERENCES
Coffee J. (1991) Liquidity versus Control: The Institutional Investor as Corporate
Monitor, Columbia Law Review, 6, p.1277-1369.
Coeurderoy R. (2001) Is there a Size Gap in Corporate Leverage? A European
comparison. Jahrbücher für Nationalökonomie und Statistik, 221 (5-6), p.672 – 688.
Delbreil M, J. Cano, H. Friderichs, B. Gress, B. Paranque, F. Partsch and F. Varetto
(1997) Equity of European Industrial Corporations. International Conference of the
ECCB Offices. (available on http://www.banque-france.fr/gb/publi/main.htm).
European Commission (2000) Guide for Bach Data Users.
Eurostat (1999) Enterprises in Europe - Fifth Report - Data 1994-95. European
Office of Publications.
Kremp E., E. Stöss and D. Gerdesmeier (1999) Estimation of a Debt Function:
Evidence from French and German Firm Panel Data, in Sauve A. and M. Scheuer, Ed.
Corporate Finance in Germany and France. A Joint Research Project of the Deutsche
Bundesbank and the Banque de France. Deutsche Bundesbank and Banque de France,
p.140-194 (available on http://www.banque-france.fr/gb/publi/main.htm).
La Porta R., F. Lopez-de-Silanes, A. Shleifer and R. Vishny (1996) Law and Finance,
NBER Working Paper, 5661, p.1131-1150.
La Porta R., F. Lopez-de-Silanes, A. Shleifer and R. Vishny (1997) Legal
Determinants of External Finance, Journal of Finance, 52, p.1131-1150.
La Porta R., F. Lopez-de-Silanes, A. Shleifer and R. Vishny (1998) Law and Finance,
Journal of Political Economy, 106, p.1113-1155.
33
Mesnard, M. (2000) Institutional Complementarity and Corporate Governance: A
Reassessment of the Russian Transition Failure. ATOM Working Paper, presented at
International Conference on Institutions in Transition 2000, Slovenia.
Partsch F. and M. Savary (1997) The BACH Data Base Comparison of International
Aggregated Company Data : Profitability Analysis. International Conference of the
ECCB Offices, Paris (available on http://www.banque-france.fr/gb/publi/main.htm).
Povel P. (1999) Optimal “Soft” or “Tough” Bankruptcy Procedures, Journal of Law,
Economics and Organization, 3, p.659-684.
Rajan R. and L. Zingales (1995) What do we Know about Capital Structure? Some
Evidence from International Data, Journal of Finance, 50, p.1421-1460.
Rajan R. and L. Zingales (1998) Debt, Folklore and Financial Structure, in Mastering
Finance, Financial Times Series, p.53-59.
Rajan R. and L. Zingales (1999) The Politics of Financial Development, Mimeo,
University of Chicago.

34
Appendix
Description of sample sources.
Countries Approximatecoverage
Comments
Austria 54 % (as apercentage of totalnet turnoverreported by theAustrian CentralStatistical Office)
To check the solvency of non-financial enterprises involved in thecollaterization of monetary policy operations, the OeNB asks forannual accounts. Most of the financial statements are drawn up tocomply with tax requirements. Due to the special structure of thesource material the OeNB’s sample is not a statistical sample andthere is a bias in the database. Commercial banks usually presentcollateral from companies that they expect will satisfy the one’ssolvency requirements. Sound enterprises are thusover-represented in the sample.
Belgium 99 % (of coverin GDP of nonfinancialcompanies)
The National Bank of Belgium is authorized to collect and todiffuse the whole of annual accounts deposited in Belgium. Shehas to put this information at the disposal of third parties (onmicrofilm, magnetic tape or optical disc) and to draw up sectoralstatistics based on standardized annual accounts.
Denmark 100% (of totalnumber ofcompanies)
Data have been collected from all Danish manufacturingenterprises with 20 or more persons engaged. The survey ismandatory, so the response rate is close to 100 per cent.
Finland 92 % (of totalturnover)
The statistics were sample-based until 1995. All enterprises with100 or more employees were included in the survey, whereas asample was selected from smaller enterprises. The data ofaccepted responses were raised to the branch level usingproportional estimation. Since 1995 the financial statement surveyis directed to larger enterprises, and for smaller business firms,administrative registers complemented with imputations are used.A threshold of 10 or 20 employees is used in the direct datacollection.
France 60 % (of totalemployees)
Data have been collected by the Bank of France on a voluntarybasis. It is not a statistical sample but almost all the largeenterprises are included.
Germany 52 % (of total turn-over)
The sample is restricted on annual accounts available for westGerman incorporated enterprises. Due account must be taken ofthe fact that, because large enterprise carry great weight in thesource material and small and medium sized enterprises areconsiderably underrepresented, the German BACH datapredominantly reflect the situation of large west Germanenterprises and must by no means be regarded as representativefor the economy as a whole.
Italy 55 % (of totaladded value)
The sample is collected through commercial banks. It is not astatistical sample but almost all the large enterprises are included.
Netherlands 55 % (of totaladded value)
The data on the balance sheet and the profit and loss account areconsolidated data, describing the group as one economic unit.
Portugal 54 % (of total turn-over)
Data have been collected by the Bank of Portugal on a voluntarybasis. It is not a statistical sample but almost all the largeenterprises are included.
Spain 36 % (of totalturnover)
The Central Balance Sheet Data Office of the Bank of Spaincollects both the annual accounts and the complementaryinformation from a sample of enterprises that have voluntarilycontributed.
Source: EC (2000)