institutional equities - nirmalbang.com motors... · 2017-07-19 · royal enfield’s market share...
TRANSCRIPT

Institutional Equities
Reuters: EICH.NS; Bloomberg: EIM IN
Eicher Motors
Initi
atin
g C
over
age
Aspire The Bike, Aspire The Stock! We initiate coverage on Eicher Motors (EML) with a Buy rating as we believe its growth momentum will continue over FY18/FY19. We expect 20% volume CAGR for Royal Enfield, over FY17-19E. In terms of demand, we believe the demand in leisure bike and premium segments will continue to remain strong as the existing two-wheeler base (~70mn) moves towards better and high-end products. Royal Enfield’s EBITDA margin at 31% is the best in the industry, which we believe will expand further by ~120bps over FY18E/FY19E as better economies of scales leads to further margin expansion. The company plans to add ~300 dealers over FY18E/FY19E (~40% growth over FY17 number) which coupled with the launch of new bikes (two new launches in FY18/FY19) should result in demand remaining strong for another two years. We have assigned Buy rating to EML with a SOTP-based target price of Rs32,566, up 16% from the current market price (35x FY19E EPS of Royal Enfield and 15x FY19E EPS of VECV).
Volume growth expected to continue: Royal Enfield’s volume growth in the past few years has been phenomenal, posting 51% CAGR over FY11-FY17. Consistent strong demand has outpaced supply resulting in a strong order book for the company which currently stands at ~1.5 – 2.0 months. The company is expanding capacity by 150,000 units to 825,000 units and will commence production from its new plant at Vallam Vadgal in Chennai by August 2017, which will further result in higher despatches to customers. We believe Royal Enfield has more legs to grow in the coming years as Royal Enfield’s market share is just 5.9% of the over 11mn domestic motorcycle industry volume in India. Strong replacement demand, uptrade of existing two wheeler – base to premium segment bikes, strong dealer expansion, rising exports and marketing initiatives should result in double-digit volume growth momentum for Royal Enfield in the coming years. We expect 20% volume CAGR growth for Royal Enfield over FY17- FY19E.
Margins set to expand further: EML is one of the most profitable companies with its two-wheeler EBITDA margin above 30%. 4QFY17 margin at 31.4% is the highest-ever as the company has been consistently improving margins YoY. In the last seven years, the company posted 2,100bps margin expansion from 10.0% to 31.3%. We expect the margins to expand further on the back of better economies of scale with. We expect another 120bps margin expansion over FY18E/FY19E.
Strong financials: We believe that Royal Enfield’s ready brand acceptance in the two-wheeler space and its niche positioning in the cruise bike segment will help it sustain 20% CAGR volume growth over FY17-19E. The company has lined up two new launches over FY18/FY19 which will serve in strengthening its product portfolio. We expect the company to post sales/EBITDA/PAT CAGR of 24%/26%/25%, respectively, over FY17-FY19E and margins to remain resilient at over 30% level. Further, the company has been generating strong free cash flow over the past few years which is expected to remain strong over FY17-FY19 even after meeting capex requirement.
Valuation: EML stock has re-rated significantly in the past few years on the back of strong volume growth and earnings growth led by volume and margin expansion. It is one of the most expensive automobile stocks, but we believe the premium is justified on account of continuous outperformance on volume and margin fronts. We have assigned Buy rating to EML with a SOTP-based target price of Rs32,566, up 16% from the current market price (35x FY19E EPS of Royal Enfield and 15x FY19E EPS of VECV).
BUY
Sector: Automobiles
CMP: Rs28,059
Target Price: Rs32,566
Upside: 16%
Gaurant Dadwal Research Analyst [email protected] +91-22-3926 8145 Vivek Sarin Research Associate [email protected] +91 22 3926 8176
Key Data
Current Shares O/S (mn) 27.2
Mkt Cap (Rsbn/US$bn) 763.8/11.9
52 Wk H / L (Rs) 30,051/19,525
Daily Vol. (3M NSE Avg.) 49,981
Share holding (%) 2QFY17 3QFY17 4QFY17
Promoter 50.6 50.6 50.6
DII 36.7 36.4 36.5
Public & Others 13.9 13.9 13.9
One -Year Indexed Stock Performance
80
90
100
110
120
130
140
150
160
Jul-16 Sep-16 Nov-16 Jan-17 Mar-17 May-17 Jul-17
EICHER MOTORS Nifty 50
Price Performance (%)
1 M 6 M 1 Yr
Eicher Motors (2.4) 25.5 41.9
Nifty Index 3.4 18.1 16.1
Source: Bloomberg
Y/E March (Rsmn) CY14 FY16 (15 months) FY17 FY18E FY19E
Net sales 30,312 61,862 70,380 90,438 108,573
EBITDA 7,336 17,082 22,059 28,879 35,286
Net profit 5,589 13,092 15,601 20,134 24,383
EPS (Rs) 206.2 482.0 573.3 740.0 896.1
EPS growth (%) 101.0 133.7 18.9 29.1 21.1
EBITDA margin (%) 24.2 27.6 31.3 31.9 32.5
P/E (x) 136.0 58.2 48.9 37.9 31.3
P/BV (x) 61.9 32.7 19.5 15.1 11.0
EV/EBITDA (x) 103.6 44.6 34.6 26.4 21.6
RoE (%) 45.3 46.6 39.8 39.7 35.1
RoCE (%) 44.0 45.3 38.4 38.6 34.4
Source: Company, Nirmal Bang Institutional Equities Research
18 July 2017
Institutional Equities
Eicher Motors 2
Valuation/stock price performance
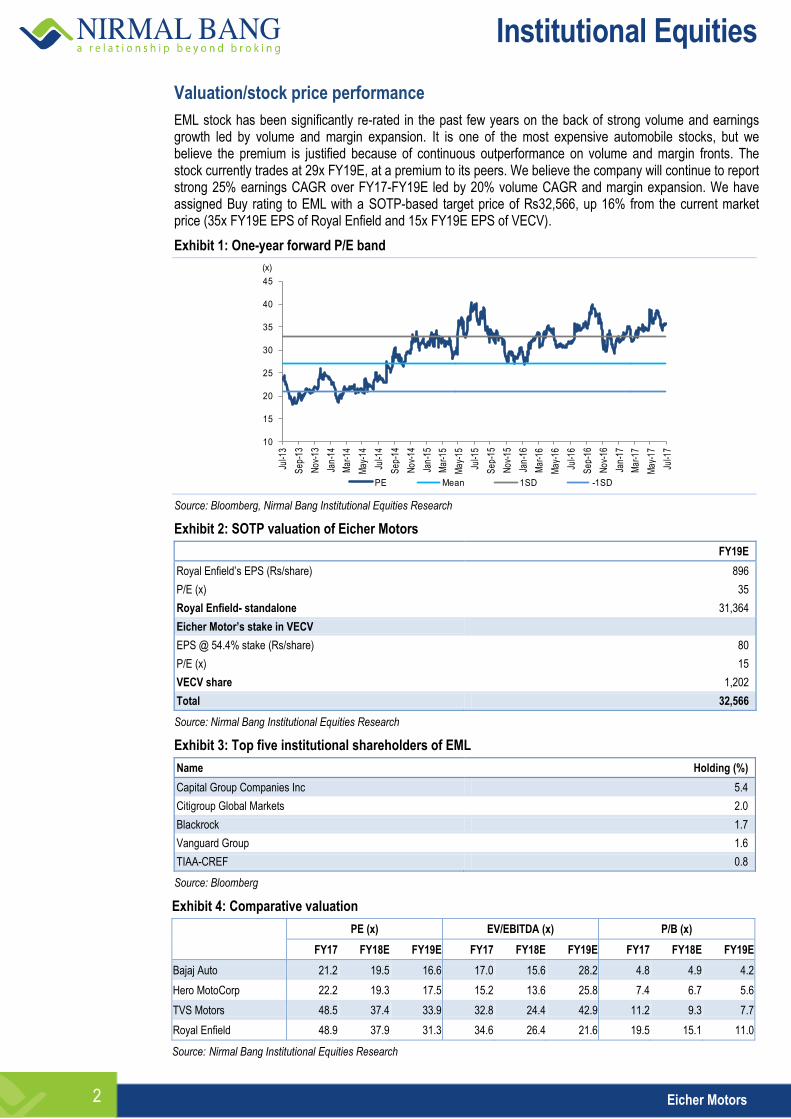
EML stock has been significantly re-rated in the past few years on the back of strong volume and earnings growth led by volume and margin expansion. It is one of the most expensive automobile stocks, but we believe the premium is justified because of continuous outperformance on volume and margin fronts. The stock currently trades at 29x FY19E, at a premium to its peers. We believe the company will continue to report strong 25% earnings CAGR over FY17-FY19E led by 20% volume CAGR and margin expansion. We have assigned Buy rating to EML with a SOTP-based target price of Rs32,566, up 16% from the current market price (35x FY19E EPS of Royal Enfield and 15x FY19E EPS of VECV).
Exhibit 1: One-year forward P/E band
10
15
20
25
30
35
40
45Ju
l-13
Sep
-13
Nov
-13
Jan-
14
Mar
-14
May
-14
Jul-1
4
Sep
-14
Nov
-14
Jan-
15
Mar
-15
May
-15
Jul-1
5
Sep
-15
Nov
-15
Jan-
16
Mar
-16
May
-16
Jul-1
6
Sep
-16
Nov
-16
Jan-
17
Mar
-17
May
-17
Jul-1
7
(x)
PE Mean 1SD -1SD
Source: Bloomberg, Nirmal Bang Institutional Equities Research
Exhibit 2: SOTP valuation of Eicher Motors
FY19E
Royal Enfield’s EPS (Rs/share) 896
P/E (x) 35
Royal Enfield- standalone 31,364
Eicher Motor’s stake in VECV
EPS @ 54.4% stake (Rs/share) 80
P/E (x) 15
VECV share 1,202
Total 32,566
Source: Nirmal Bang Institutional Equities Research
Exhibit 3: Top five institutional shareholders of EML
Name Holding (%)
Capital Group Companies Inc 5.4
Citigroup Global Markets 2.0
Blackrock 1.7
Vanguard Group 1.6
TIAA-CREF 0.8
Source: Bloomberg
Exhibit 4: Comparative valuation
PE (x) EV/EBITDA (x) P/B (x)
FY17 FY18E FY19E FY17 FY18E FY19E FY17 FY18E FY19E
Bajaj Auto 21.2 19.5 16.6 17.0 15.6 28.2 4.8 4.9 4.2
Hero MotoCorp 22.2 19.3 17.5 15.2 13.6 25.8 7.4 6.7 5.6
TVS Motors 48.5 37.4 33.9 32.8 24.4 42.9 11.2 9.3 7.7
Royal Enfield 48.9 37.9 31.3 34.6 26.4 21.6 19.5 15.1 11.0
Source: Nirmal Bang Institutional Equities Research
Institutional Equities
Eicher Motors 3
Investment Rationale
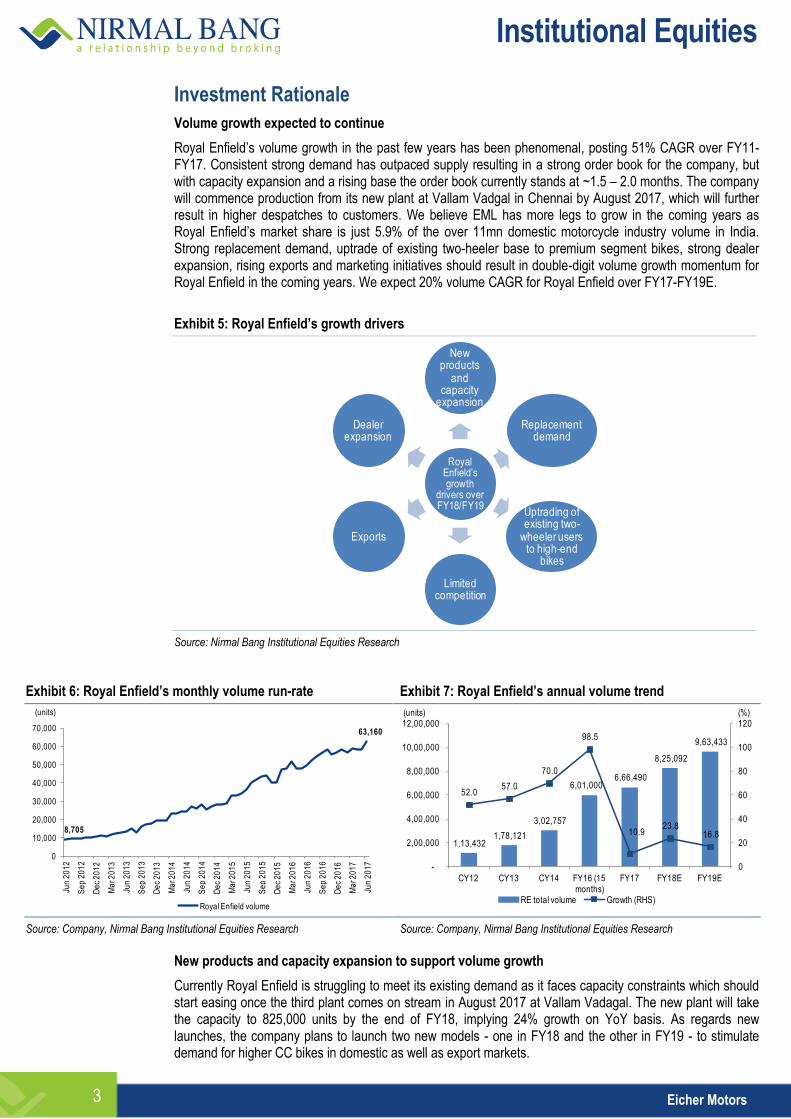
Volume growth expected to continue
Royal Enfield’s volume growth in the past few years has been phenomenal, posting 51% CAGR over FY11-FY17. Consistent strong demand has outpaced supply resulting in a strong order book for the company, but with capacity expansion and a rising base the order book currently stands at ~1.5 – 2.0 months. The company will commence production from its new plant at Vallam Vadgal in Chennai by August 2017, which will further result in higher despatches to customers. We believe EML has more legs to grow in the coming years as Royal Enfield’s market share is just 5.9% of the over 11mn domestic motorcycle industry volume in India. Strong replacement demand, uptrade of existing two-heeler base to premium segment bikes, strong dealer expansion, rising exports and marketing initiatives should result in double-digit volume growth momentum for Royal Enfield in the coming years. We expect 20% volume CAGR for Royal Enfield over FY17-FY19E.
Exhibit 5: Royal Enfield’s growth drivers
Royal Enfield’s growth
drivers over FY18/FY19
New products
and capacity
expansion
Replacement demand
Uptrading of existing two-
wheeler users to high-end
bikes
Limited competition
Exports
Dealer expansion
Source: Nirmal Bang Institutional Equities Research
Exhibit 6: Royal Enfield’s monthly volume run-rate Exhibit 7: Royal Enfield’s annual volume trend
8,705
63,160
0
10,000
20,000
30,000
40,000
50,000
60,000
70,000
Jun
20
12
Se
p 2
01
2
De
c 2
01
2
Ma
r 20
13
Jun
20
13
Se
p 2
01
3
De
c 2
01
3
Ma
r 20
14
Jun
20
14
Se
p 2
01
4
De
c 2
01
4
Ma
r 20
15
Jun
20
15
Se
p 2
01
5
De
c 2
01
5
Ma
r 20
16
Jun
20
16
Se
p 2
01
6
De
c 2
01
6
Ma
r 20
17
Jun
20
17
(units)
Royal Enfield volume
1,13,432 1,78,121
3,02,757
6,01,000 6,66,490
8,25,092
9,63,433
52.0 57.0
70.0
98.5
10.9 23.8
16.8
0
20
40
60
80
100
120
-
2,00,000
4,00,000
6,00,000
8,00,000
10,00,000
12,00,000
CY12 CY13 CY14 FY16 (15 months)
FY17 FY18E FY19E
(%)(units)
RE total volume Growth (RHS)
Source: Company, Nirmal Bang Institutional Equities Research Source: Company, Nirmal Bang Institutional Equities Research New products and capacity expansion to support volume growth
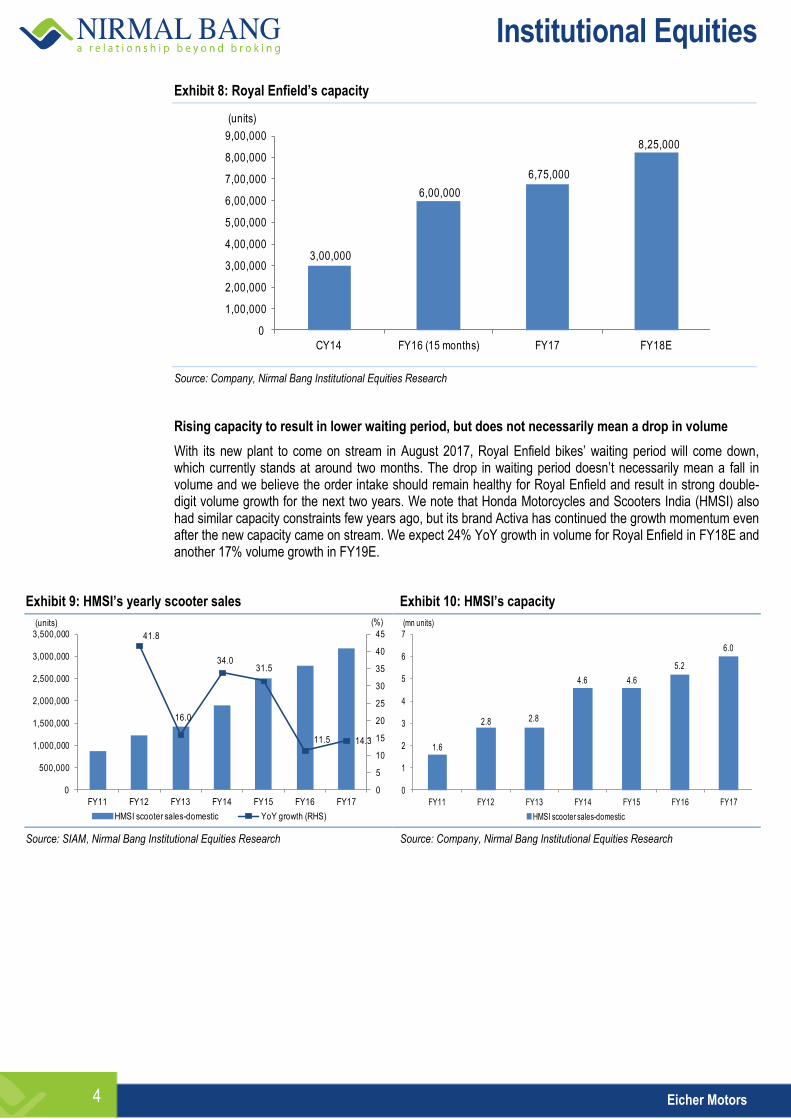
Currently Royal Enfield is struggling to meet its existing demand as it faces capacity constraints which should start easing once the third plant comes on stream in August 2017 at Vallam Vadagal. The new plant will take the capacity to 825,000 units by the end of FY18, implying 24% growth on YoY basis. As regards new launches, the company plans to launch two new models - one in FY18 and the other in FY19 - to stimulate demand for higher CC bikes in domestic as well as export markets.
Institutional Equities
Eicher Motors 4
Exhibit 8: Royal Enfield’s capacity
3,00,000
6,00,000
6,75,000
8,25,000
0
1,00,000
2,00,000
3,00,000
4,00,000
5,00,000
6,00,000
7,00,000
8,00,000
9,00,000
CY14 FY16 (15 months) FY17 FY18E
(units)
Source: Company, Nirmal Bang Institutional Equities Research
Rising capacity to result in lower waiting period, but does not necessarily mean a drop in volume
With its new plant to come on stream in August 2017, Royal Enfield bikes’ waiting period will come down, which currently stands at around two months. The drop in waiting period doesn’t necessarily mean a fall in volume and we believe the order intake should remain healthy for Royal Enfield and result in strong double-digit volume growth for the next two years. We note that Honda Motorcycles and Scooters India (HMSI) also had similar capacity constraints few years ago, but its brand Activa has continued the growth momentum even after the new capacity came on stream. We expect 24% YoY growth in volume for Royal Enfield in FY18E and another 17% volume growth in FY19E.
Exhibit 9: HMSI’s yearly scooter sales Exhibit 10: HMSI’s capacity
41.8
16.0
34.031.5
11.5 14.3
0
5
10
15
20
25
30
35
40
45
0
500,000
1,000,000
1,500,000
2,000,000
2,500,000
3,000,000
3,500,000
FY11 FY12 FY13 FY14 FY15 FY16 FY17
(%)(units)
HMSI scooter sales-domestic YoY growth (RHS)
1.6
2.8 2.8
4.6 4.6
5.2
6.0
0
1
2
3
4
5
6
7
FY11 FY12 FY13 FY14 FY15 FY16 FY17
(mn units)
HMSI scooter sales-domestic Source: SIAM, Nirmal Bang Institutional Equities Research Source: Company, Nirmal Bang Institutional Equities Research

Institutional Equities
Eicher Motors 5
Exhibit 11: Steady capacity expansion has truncated the waiting period for Royal Enfield bikes
60,000 75,000
1,74,000
3,00,000
6,00,000
6,75,000 12.0
7.5
4.5
5.03.0
2.0
0
2
4
6
8
10
12
14
0
1,00,000
2,00,000
3,00,000
4,00,000
5,00,000
6,00,000
7,00,000
8,00,000
CY11 CY12 CY13 CY14 FY16 (15 months)
FY17
(months)(units)
Production capacity Waiting period (RHS)
Source: Company, Nirmal Bang Institutional Equities Research
Uptrading of existing two-wheelers
India is the biggest two-wheeler market in the world with a two-wheeler population base of ~70mn. Existing life cycle of a two-wheeler is close to six to eight years. With rising disposable income and aspiration of upgrading to a better product, Royal Enfield is in a sweet spot to get the maximum from uptrading of two-wheelers. In FY17 Royal Enfield sold ~0.65mn two-wheelers India, which is ~1% of the existing two-wheeler population in India. Even if a small percentage of the huge two-wheeler base moves from motorcycles/scooters/mopeds to Royal Enfield bikes, it should take care of the growth in the coming years. We note that customers are moving from entry/executive bikes to premium motorcycles/scooters. Premium segment motorcycles’ share has gone up from 17% in FY14 to 23% in FY17, while that of Royal Enfield in the premium bike segment has increased from 39% to 45% in the same period.
Exhibit 12: Domestic two-wheeler industry’s sales– cumulative sales of over 100mn in the past seven years
9
1213 14
15
16 1618
0
2
4
6
8
10
12
14
16
18
20
FY10 FY11 FY12 FY13 FY14 FY15 FY16 FY17
(mn units)
Two-wheeler industry volume
Source: SIAM, Nirmal Bang Institutional Equities Research

Institutional Equities
Eicher Motors 6
Exhibit 13: Segmental share in motorcycle industry - premium segment growing
Exhibit 14: Royal Enfield’s share in premium bike segment
19 18 20 23 23
64 65 62 56 54
16 17 19 21 23
-
10
20
30
40
50
60
70
80
90
100
FY13 FY14 FY15 FY16 FY17
(%)
Economy Executive Premium
15.8
24.7
38.6 38.5 37.9
45.3
0
5
10
15
20
25
30
35
40
45
50
FY12 FY13 FY14 FY15 FY16 FY17
(%)
RE volumes as % premium motorcycles Source: SIAM Nirmal Bang Institutional Equities Research Source: SIAM, Nirmal Bang Institutional Equities Research
Dealer expansion to further drive growth for the company
Royal Enfield currently has 675 dealer touchpoints in India. This is much less than Hero MotoCorp’s ~6,500 dealer touch points. Royal Enfield has focused on cities as the price points for its models are nearly 2x that of traditional motorcycles, but the company is now focusing on increasing its dealer network in small towns and cities. We believe there is ample scope for Royal Enfield to increase its distribution network in India and that should drive growth for the company in the coming years. The company currently derives close to 40 – 45 % of its volume from top 20 cities in India where stores are reporting 15% same-store sales growth or SSG every year. With the next segmental growth expected to come from rural areas as customers move from entry/executive segment bikes to leisure bikes, we believe Royal Enfield will register strong distribution-led growth in the coming years.
Exhibit 15: Royal Enfield’s dealer network
186 249
307
400
500
675
825
975
0
200
400
600
800
1,000
1,200
CY11 CY12 CY13 CY14 FY16 (15 months)
FY17 FY18E FY19E
Source: Company, Nirmal Bang Institutional Equities Research
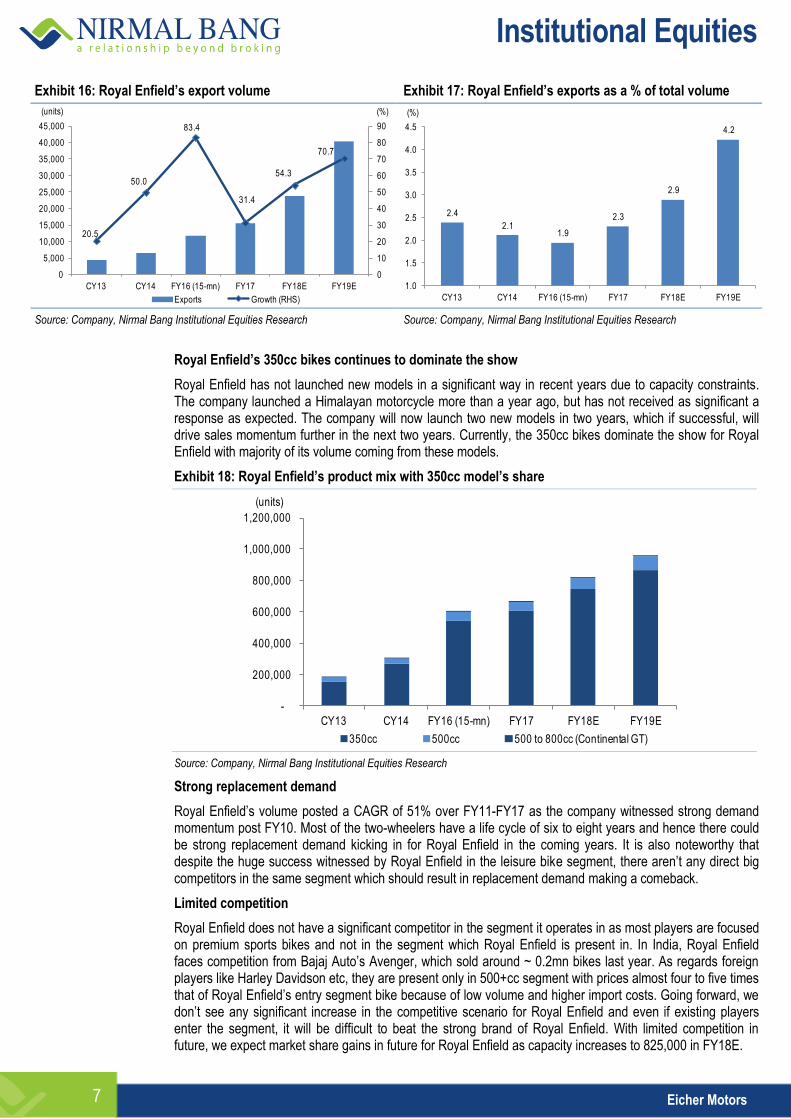
Export strategy still to play out in a big way
Exports currently form just 2% of Royal Enfield’s overall volume, although they have increased in line with strong domestic volume ramp-up backed by rising capacity. We expect Royal Enfield’s exports to contribute 4% to overall sales by FY19E as the company launches two new models for global markets – one each in 2017 and 2018. Royal Enfield has created decent international exposure with company-owned dealerships in key cities globally through 25 exclusive stores The company will now launch a 750cc motorcycle and another mid-sized motorcycle globally in 2018. We expect the export volume to grow significantly in absolute numbers from 15,000 units in FY17 to 41,000 units in FY19E. With a rising distribution network in export markets and two new bike launches, there is upside prospect to our export estimate.
Institutional Equities
Eicher Motors 7
Exhibit 16: Royal Enfield’s export volume Exhibit 17: Royal Enfield’s exports as a % of total volume
20.5
50.0
83.4
31.4
54.3
70.7
0
10
20
30
40
50
60
70
80
90
0
5,000
10,000
15,000
20,000
25,000
30,000
35,000
40,000
45,000
CY13 CY14 FY16 (15-mn) FY17 FY18E FY19E
(%)(units)
Exports Growth (RHS)
2.4
2.1 1.9
2.3
2.9
4.2
1.0
1.5
2.0
2.5
3.0
3.5
4.0
4.5
CY13 CY14 FY16 (15-mn) FY17 FY18E FY19E
(%)
Source: Company, Nirmal Bang Institutional Equities Research Source: Company, Nirmal Bang Institutional Equities Research
Royal Enfield’s 350cc bikes continues to dominate the show
Royal Enfield has not launched new models in a significant way in recent years due to capacity constraints. The company launched a Himalayan motorcycle more than a year ago, but has not received as significant a response as expected. The company will now launch two new models in two years, which if successful, will drive sales momentum further in the next two years. Currently, the 350cc bikes dominate the show for Royal Enfield with majority of its volume coming from these models.
Exhibit 18: Royal Enfield’s product mix with 350cc model’s share
-
200,000
400,000
600,000
800,000
1,000,000
1,200,000
CY13 CY14 FY16 (15-mn) FY17 FY18E FY19E
(units)
350cc 500cc 500 to 800cc (Continental GT)
Source: Company, Nirmal Bang Institutional Equities Research
Strong replacement demand
Royal Enfield’s volume posted a CAGR of 51% over FY11-FY17 as the company witnessed strong demand momentum post FY10. Most of the two-wheelers have a life cycle of six to eight years and hence there could be strong replacement demand kicking in for Royal Enfield in the coming years. It is also noteworthy that despite the huge success witnessed by Royal Enfield in the leisure bike segment, there aren’t any direct big competitors in the same segment which should result in replacement demand making a comeback.
Limited competition
Royal Enfield does not have a significant competitor in the segment it operates in as most players are focused on premium sports bikes and not in the segment which Royal Enfield is present in. In India, Royal Enfield faces competition from Bajaj Auto’s Avenger, which sold around ~ 0.2mn bikes last year. As regards foreign players like Harley Davidson etc, they are present only in 500+cc segment with prices almost four to five times that of Royal Enfield’s entry segment bike because of low volume and higher import costs. Going forward, we don’t see any significant increase in the competitive scenario for Royal Enfield and even if existing players enter the segment, it will be difficult to beat the strong brand of Royal Enfield. With limited competition in future, we expect market share gains in future for Royal Enfield as capacity increases to 825,000 in FY18E.
Institutional Equities
Eicher Motors 8
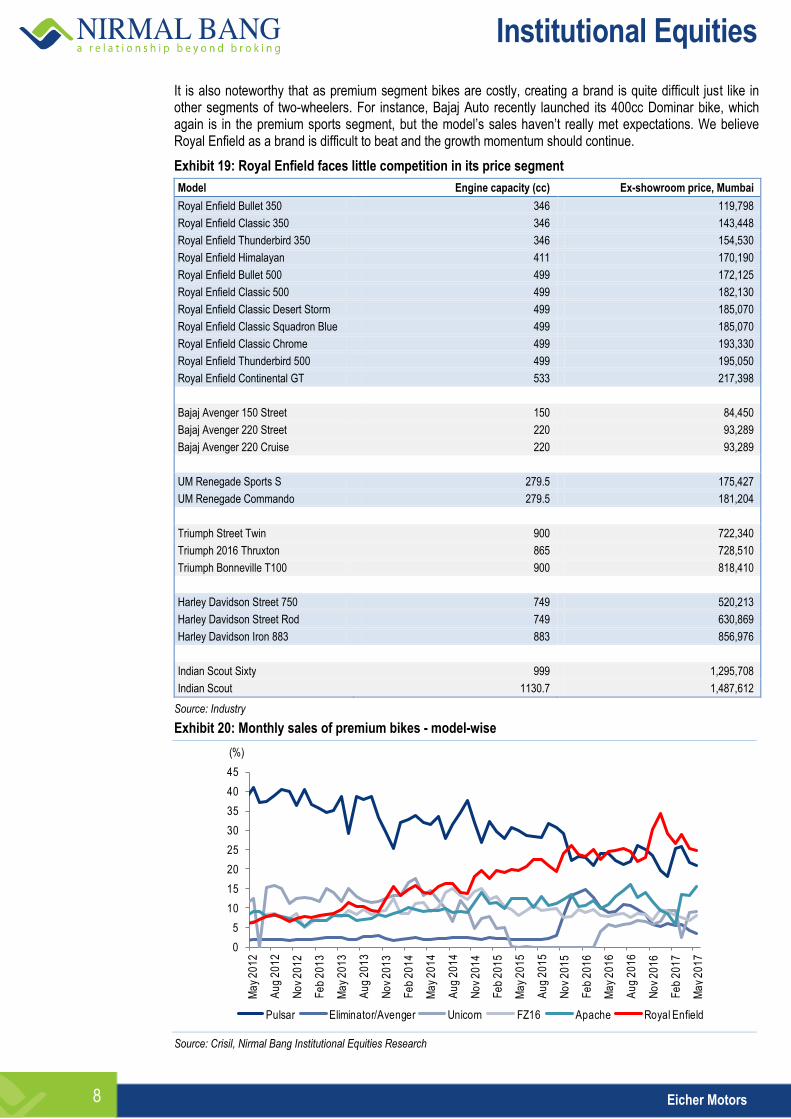
It is also noteworthy that as premium segment bikes are costly, creating a brand is quite difficult just like in other segments of two-wheelers. For instance, Bajaj Auto recently launched its 400cc Dominar bike, which again is in the premium sports segment, but the model’s sales haven’t really met expectations. We believe Royal Enfield as a brand is difficult to beat and the growth momentum should continue.
Exhibit 19: Royal Enfield faces little competition in its price segment
Model Engine capacity (cc) Ex-showroom price, Mumbai
Royal Enfield Bullet 350 346 119,798
Royal Enfield Classic 350 346 143,448
Royal Enfield Thunderbird 350 346 154,530
Royal Enfield Himalayan 411 170,190
Royal Enfield Bullet 500 499 172,125
Royal Enfield Classic 500 499 182,130
Royal Enfield Classic Desert Storm 499 185,070
Royal Enfield Classic Squadron Blue 499 185,070
Royal Enfield Classic Chrome 499 193,330
Royal Enfield Thunderbird 500 499 195,050
Royal Enfield Continental GT 533 217,398
Bajaj Avenger 150 Street 150 84,450
Bajaj Avenger 220 Street 220 93,289
Bajaj Avenger 220 Cruise 220 93,289
UM Renegade Sports S 279.5 175,427
UM Renegade Commando 279.5 181,204
Triumph Street Twin 900 722,340
Triumph 2016 Thruxton 865 728,510
Triumph Bonneville T100 900 818,410
Harley Davidson Street 750 749 520,213
Harley Davidson Street Rod 749 630,869
Harley Davidson Iron 883 883 856,976
Indian Scout Sixty 999 1,295,708
Indian Scout 1130.7 1,487,612
Source: Industry
Exhibit 20: Monthly sales of premium bikes - model-wise
0
5
10
15
20
25
30
35
40
45
Ma
y 2
01
2
Au
g 2
01
2
No
v 2
01
2
Fe
b 2
01
3
Ma
y 2
01
3
Au
g 2
01
3
No
v 2
01
3
Fe
b 2
01
4
Ma
y 2
01
4
Au
g 2
01
4
No
v 2
01
4
Fe
b 2
01
5
Ma
y 2
01
5
Au
g 2
01
5
No
v 2
01
5
Fe
b 2
01
6
Ma
y 2
01
6
Au
g 2
01
6
No
v 2
01
6
Fe
b 2
01
7
Ma
y 2
01
7
(%)
Pulsar Eliminator/Avenger Unicorn FZ16 Apache Royal Enfield
Source: Crisil, Nirmal Bang Institutional Equities Research

Institutional Equities
Eicher Motors 9
Exhibit 21: Key comparable models in leisure segment
FY13 FY14 FY15 FY16 FY17
Royal Enfield (volume) 120,677 199,816 324,961 501,585 654,095
Bajaj Avenger (volume) 32,147 40,056 44,847 147,216 204,258
Dom. Leisure Segment (volume) 152,824 239,872 369,808 648,801 858,353
Royal Enfield share (%) 79.0 83.3 87.9 77.3 76.2
Bajaj Avenger share (%) 21.0 16.7 12.1 22.7 23.8
Domestic Motorcycle (volume) 10,084,850 10,479,837 10,738,360 10,700,376 11,094,543
Domestic Two-wheeler (volume) 13,797,034 14,805,501 15,997,701 16,455,821 17,589,511
% of Dom. Motorcycle volume 1.5 2.3 3.4 6.1 7.7
% of Dom. Two-wheeler volume 1.1 1.6 2.3 3.9 4.9
Source: Crisil, Nirmal Bang Institutional Equities Research
Margins set to expand further
EML is one of the most profitable companies with its two-wheeler EBITDA margin in excess of 30%. 4QFY17 margin at 31.4% is among the highest ever as the company has been consistently improving margins YoY. In the past seven years, the company posted 2,100bps margin expansion from 10.0% to 31.3%. We expect the margins to expand further on the back of better economies of scale. We expect another 120bps margin expansion over FY18E/FY19E.
Exhibit 22: Quarterly EBITDA and gross margin Exhibit 23: Yearly EBITDA and gross margin
23.124.9 25.0
23.626.1 26.1
27.228.3
29.630.8 31.3 31.8 31.4
38.740.6 40.9 40.9
42.9 42.8 43.546.1 45.5
46.748.0 47.2 47.4
20
25
30
35
40
45
50
1QC
Y14
2QC
Y14
3QC
Y14
4QC
Y14
4QF
Y15
1QF
Y16
2QF
Y16
3QF
Y16
4QF
Y16
1QF
Y17
2QF
Y17
3QF
Y17
4QF
Y17
(%)
37.7 40.4
44.3 47.3 47.0 48.1
18.4
24.2
27.6
31.3 31.9 32.5
10
15
20
25
30
35
40
45
50
55
CY13 CY14 FY16 (15 months)
FY17 FY18E FY19E
(%)
Gross margin EBITDA margin Source: Company, Nirmal Bang Institutional Equities Research Source: Company, Nirmal Bang Institutional Equities Research
Advertisement spending continues to remain low, can support volume growth in future
Royal Enfield currently has the lowest advertisement spending in the domestic industry as it witnessed strong demand without any significant advertisement spending. Following a strong waiting period and continuous demand, it has not spent money on advertising but rather focused on organising various events like Rider Mania etc to get Royal Enfield customers together. Apart from this, the company also conducts various rides throughout India for Royal Enfield customers. Royal Enfield’s advertisement spending is only 0.6% of sales, while that of competitors is in excess of 2% of sales.
Exhibit 24: Advertisement spending as a percentage of sales
0.70.7
0.40.2
0.6
1.6
2.0 2.0 2.4 2.5
0.8
1.0 1.3
1.5 1.9
1.9
2.8
3.5
2.6 2.8
0.0
0.5
1.0
1.5
2.0
2.5
3.0
3.5
4.0
FY12 FY13 FY14 FY15 FY16
(%)
Royal Enfield Hero Bajaj TVS
Source: Company, Nirmal Bang Institutional Equities Research

Institutional Equities
Eicher Motors 10
Consistent outperformance versus industry growth, expect market share gains
Over the past few years, EML has consistently outperformed the domestic two-wheeler industry’s growth as rising disposable income and segmental shift from entry executive to premium segment bikes resulted in Royal Enfield doing better than the industry. We expect Royal Enfield to continue with its growth momentum and report strong earnings growth in future.
Exhibit 25: Premium segment motorcycle growth RE vs. industry
FY12 FY13 FY14 FY15 FY16 FY17
150-200cc 238,865 238,816 237,282 379,689 639,131 588,772
200cc & above 246,723 249,913 287,540 462,404 677,376 849,540
Volume 485,588 488,729 524,822 842,093 1,316,507 1,438,312
Growth (%) - 0.6 7.4 60.5 56.3 9.3
Growth ex Royal Enfield
RE domestic volume 76,672 120,694 202,759 324,048 498,791 651,107
Industry volume ex-RE 408,916 368,035 322,063 518,045 817,716 787,205
Growth (%) - (10.0) (12.5) 60.9 57.8 (3.7)
Source: SIAM, Nirmal Bang Institutional Equities Research
Exhibit 26: Royal Enfield’s premium bike segment market share on the rise
0
5
10
15
20
25
30
35
40
Ap
r 20
12
Jul 2
01
2
Oct
20
12
Jan
20
13
Ap
r 20
13
Jul 2
01
3
Oct
20
13
Jan
20
14
Ap
r 20
14
Jul 2
01
4
Oct
20
14
Jan
20
15
Ap
r 20
15
Jul 2
01
5
Oct
20
15
Jan
20
16
Ap
r 20
16
Jul 2
01
6
Oct
20
16
Jan
20
17
Ap
r 20
17
(%)
Royal Enfield market share
Source: Crisil, Nirmal Bang Institutional Equities Research
Exhibit 27: Domestic market share of motorcycle players
FY09 FY10 FY11 FY12 FY13 FY14 FY15 FY16 FY17
Hero Honda 59.8 58.5 54.6 56.0 53.2 51.8 52.9 52.4 51.3
Bajaj Auto 21.9 24.3 26.8 25.4 24.4 20.0 16.5 17.7 18.0
HMSI 6.2 6.2 7.3 7.6 11.8 15.8 16.3 14.0 13.8
TVS Motor 7.9 6.7 7.0 6.2 5.5 5.5 6.3 6.7 7.0
Yamaha Motor 2.8 3.0 3.1 3.5 3.0 2.9 3.2 3.1 3.1
Suzuki Motorcycle 0.8 0.6 0.6 0.5 0.8 0.6 0.6 0.9 0.6
Royal Enfield 0.7 0.7 0.6 0.8 1.2 1.9 3.0 4.7 5.9
Source: SIAM

Institutional Equities
Eicher Motors 11
Commercial vehicle business at inflection point
VECV has outperformed its peers in a tough operating environment and has captured incremental market share in the commercial vehicle (CV) space. The company’s investments in the truck and bus divisions and in introducing the Pro-series range of vehicles will help it expand its footprint in the CV segment. VECV has recently completed the development of its new 5000 Pro-series which will be launched in the coming year. The company has also started production of its upgraded Starline range which will also be launched during the year.
Exhibit 28: VECV’s MHCV volume growth over the years Exhibit 29: VECV’s LCV volume growth over the years
8.1
(23.1)
(25.3)
15.6
30.4
0.0
21.7
(6.1)
(35.7)
13.1
25.6 9.6
(40)
(30)
(20)
(10)
0
10
20
30
40
FY12 FY13 FY14 FY15 FY16 FY17
(%)
Industry MHCV growth VECV MHCV growth
27.2
14.0
(17.6) (11.5)
0.3
7.4
23.7
(5.1)
5.4 5.6
27.1
14.8
(20)
(15)
(10)
(5)
0
5
10
15
20
25
30
FY12 FY13 FY14 FY15 FY16 FY17
(%)
Industry LCV growth VECV LCV growth Source: SIAM, Nirmal Bang Institutional Equities Research Source: SIAM, Nirmal Bang Institutional Equities Research
Exhibit 30: VECV’s EBITDA margin trend Exhibit 31: VECV’s realisation
5.8
6.66.9
7.3 7.1
8.2 8.08.5
4.5
9.1
7.26.9
8.2
3
4
5
6
7
8
9
10
1Q
CY
14
2Q
CY
14
3Q
CY
14
4Q
CY
14
4Q
FY
15
1Q
FY
16
2Q
FY
16
3Q
FY
16
4Q
FY
16
1Q
FY
17
2Q
FY
17
3Q
FY
17
4Q
FY
17
(%)
VECV EBITDA margin
1,269
1,287
1,462
1,480
1,458
1,472
1,529 1,569
1,334
1,331
1,470
1,600
1,482
1,000
1,100
1,200
1,300
1,400
1,500
1,600
1,700
1Q
CY
14
2Q
CY
14
3Q
CY
14
4Q
CY
14
4Q
FY
15
1Q
FY
16
2Q
FY
16
3Q
FY
16
4Q
FY
16
1Q
FY
17
2Q
FY
17
3Q
FY
17
4Q
FY
17
(Rs'000)
VECV realisation/vehicle Source: Company, Nirmal Bang Institutional Equities Research Source: Company, Nirmal Bang Institutional Equities Research
Exhibit 32: VECV assumptions
FY15 FY16 (12 months) FY17 FY18E FY19E
Volume 41,822 52,025 58,604 61,534 65,842
YoY (%) 3% 24% 13% 5% 7%
Net sales 60,850 77,370 85,490 91,560 99,928
YoY (%) - 27.1 10.5 7.1 9.1
EBITDA 4,230 6,490 6,750 7,229 7,890
EBITDA margin (%) 7.0 8.4 7.9 7.9 7.9
PAT 1,980 3,390 3,430 3,674 4,009
YoY (%) - 71.2 1.2 7.1 9.1
PAT margin (%) 3.3 4.4 4.0 4.0 4.0
Source: Company, Nirmal Bang Institutional Equities Research
Institutional Equities
Eicher Motors 12
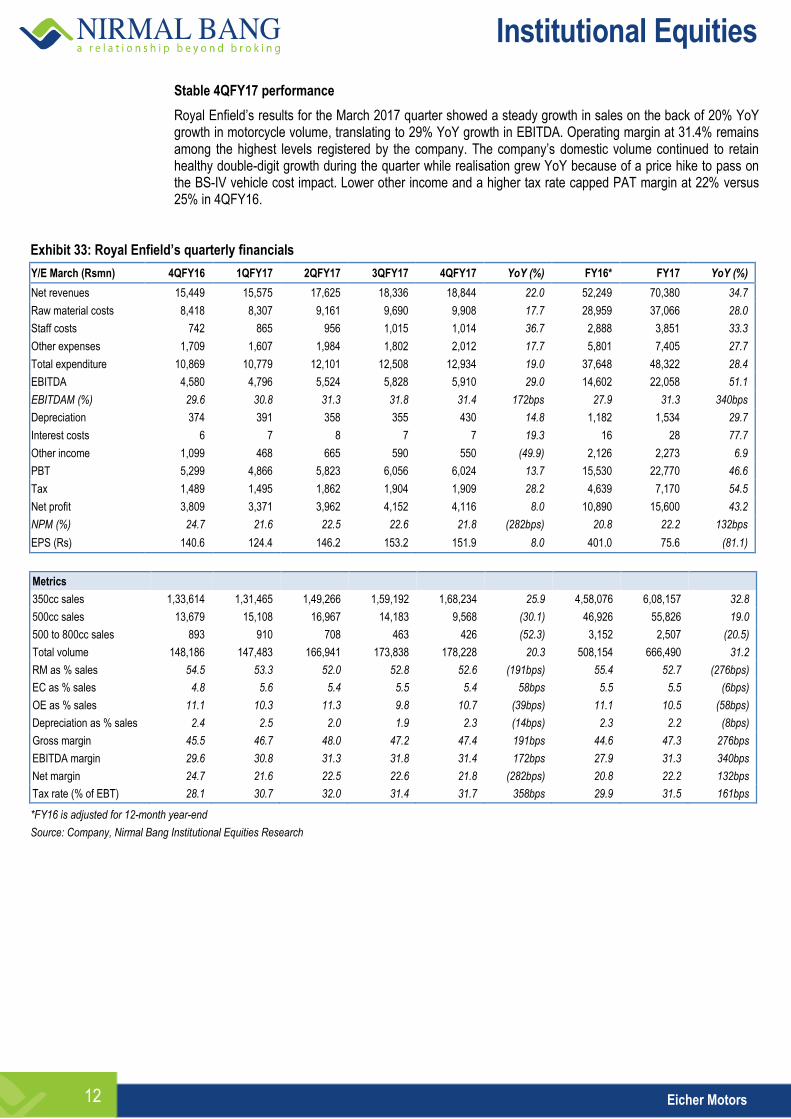
Stable 4QFY17 performance
Royal Enfield’s results for the March 2017 quarter showed a steady growth in sales on the back of 20% YoY growth in motorcycle volume, translating to 29% YoY growth in EBITDA. Operating margin at 31.4% remains among the highest levels registered by the company. The company’s domestic volume continued to retain healthy double-digit growth during the quarter while realisation grew YoY because of a price hike to pass on the BS-IV vehicle cost impact. Lower other income and a higher tax rate capped PAT margin at 22% versus 25% in 4QFY16.
Exhibit 33: Royal Enfield’s quarterly financials
Y/E March (Rsmn) 4QFY16 1QFY17 2QFY17 3QFY17 4QFY17 YoY (%) FY16* FY17 YoY (%)
Net revenues 15,449 15,575 17,625 18,336 18,844 22.0 52,249 70,380 34.7
Raw material costs 8,418 8,307 9,161 9,690 9,908 17.7 28,959 37,066 28.0
Staff costs 742 865 956 1,015 1,014 36.7 2,888 3,851 33.3
Other expenses 1,709 1,607 1,984 1,802 2,012 17.7 5,801 7,405 27.7
Total expenditure 10,869 10,779 12,101 12,508 12,934 19.0 37,648 48,322 28.4
EBITDA 4,580 4,796 5,524 5,828 5,910 29.0 14,602 22,058 51.1
EBITDAM (%) 29.6 30.8 31.3 31.8 31.4 172bps 27.9 31.3 340bps
Depreciation 374 391 358 355 430 14.8 1,182 1,534 29.7
Interest costs 6 7 8 7 7 19.3 16 28 77.7
Other income 1,099 468 665 590 550 (49.9) 2,126 2,273 6.9
PBT 5,299 4,866 5,823 6,056 6,024 13.7 15,530 22,770 46.6
Tax 1,489 1,495 1,862 1,904 1,909 28.2 4,639 7,170 54.5
Net profit 3,809 3,371 3,962 4,152 4,116 8.0 10,890 15,600 43.2
NPM (%) 24.7 21.6 22.5 22.6 21.8 (282bps) 20.8 22.2 132bps
EPS (Rs) 140.6 124.4 146.2 153.2 151.9 8.0 401.0 75.6 (81.1)
Metrics
350cc sales 1,33,614 1,31,465 1,49,266 1,59,192 1,68,234 25.9 4,58,076 6,08,157 32.8
500cc sales 13,679 15,108 16,967 14,183 9,568 (30.1) 46,926 55,826 19.0
500 to 800cc sales 893 910 708 463 426 (52.3) 3,152 2,507 (20.5)
Total volume 148,186 147,483 166,941 173,838 178,228 20.3 508,154 666,490 31.2
RM as % sales 54.5 53.3 52.0 52.8 52.6 (191bps) 55.4 52.7 (276bps)
EC as % sales 4.8 5.6 5.4 5.5 5.4 58bps 5.5 5.5 (6bps)
OE as % sales 11.1 10.3 11.3 9.8 10.7 (39bps) 11.1 10.5 (58bps)
Depreciation as % sales 2.4 2.5 2.0 1.9 2.3 (14bps) 2.3 2.2 (8bps)
Gross margin 45.5 46.7 48.0 47.2 47.4 191bps 44.6 47.3 276bps
EBITDA margin 29.6 30.8 31.3 31.8 31.4 172bps 27.9 31.3 340bps
Net margin 24.7 21.6 22.5 22.6 21.8 (282bps) 20.8 22.2 132bps
Tax rate (% of EBT) 28.1 30.7 32.0 31.4 31.7 358bps 29.9 31.5 161bps
*FY16 is adjusted for 12-month year-end
Source: Company, Nirmal Bang Institutional Equities Research
Institutional Equities
Eicher Motors 13
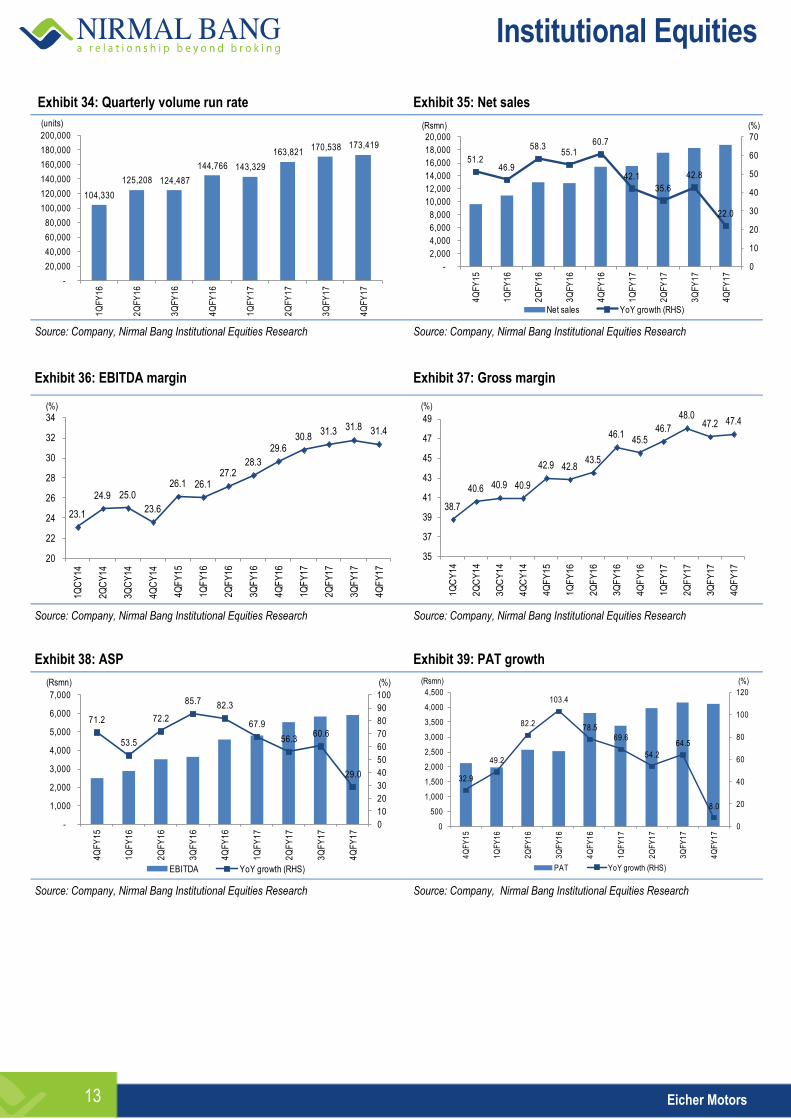
Exhibit 34: Quarterly volume run rate Exhibit 35: Net sales
104,330
125,208 124,487
144,766 143,329
163,821 170,538 173,419
-
20,000
40,000
60,000
80,000
100,000
120,000
140,000
160,000
180,000
200,000
1Q
FY
16
2Q
FY
16
3Q
FY
16
4Q
FY
16
1Q
FY
17
2Q
FY
17
3Q
FY
17
4Q
FY
17
(units)
51.246.9
58.355.1
60.7
42.1
35.6
42.8
22.0
0
10
20
30
40
50
60
70
-
2,000
4,000
6,000
8,000
10,000
12,000
14,000
16,000
18,000
20,000
4Q
FY
15
1Q
FY
16
2Q
FY
16
3Q
FY
16
4Q
FY
16
1Q
FY
17
2Q
FY
17
3Q
FY
17
4Q
FY
17
Net sales YoY growth (RHS)
(%)(Rsmn)
Source: Company, Nirmal Bang Institutional Equities Research Source: Company, Nirmal Bang Institutional Equities Research
Exhibit 36: EBITDA margin Exhibit 37: Gross margin
23.1
24.9 25.0
23.6
26.1 26.127.2
28.3
29.630.8
31.3 31.8 31.4
20
22
24
26
28
30
32
34
1QC
Y14
2QC
Y14
3QC
Y14
4QC
Y14
4QF
Y15
1QF
Y16
2QF
Y16
3QF
Y16
4QF
Y16
1QF
Y17
2QF
Y17
3QF
Y17
4QF
Y17
(%)
38.7
40.6 40.9 40.9
42.9 42.843.5
46.145.5
46.7
48.047.2 47.4
35
37
39
41
43
45
47
49
1Q
CY
14
2Q
CY
14
3Q
CY
14
4Q
CY
14
4Q
FY
15
1Q
FY
16
2Q
FY
16
3Q
FY
16
4Q
FY
16
1Q
FY
17
2Q
FY
17
3Q
FY
17
4Q
FY
17
(%)
Source: Company, Nirmal Bang Institutional Equities Research Source: Company, Nirmal Bang Institutional Equities Research
Exhibit 38: ASP Exhibit 39: PAT growth
71.2
53.5
72.2
85.7 82.3
67.9
56.360.6
29.0
0
10
20
30
40
50
60
70
80
90
100
-
1,000
2,000
3,000
4,000
5,000
6,000
7,000
4Q
FY
15
1Q
FY
16
2Q
FY
16
3Q
FY
16
4Q
FY
16
1Q
FY
17
2Q
FY
17
3Q
FY
17
4Q
FY
17
EBITDA YoY growth (RHS)
(Rsmn) (%)
32.9
49.2
82.2
103.4
78.569.6
54.2
64.5
8.0
0
20
40
60
80
100
120
0
500
1,000
1,500
2,000
2,500
3,000
3,500
4,000
4,500
4Q
FY
15
1Q
FY
16
2Q
FY
16
3Q
FY
16
4Q
FY
16
1Q
FY
17
2Q
FY
17
3Q
FY
17
4Q
FY
17
PAT YoY growth (RHS)
(Rsmn) (%)
Source: Company, Nirmal Bang Institutional Equities Research Source: Company, Nirmal Bang Institutional Equities Research
Institutional Equities
Eicher Motors 14
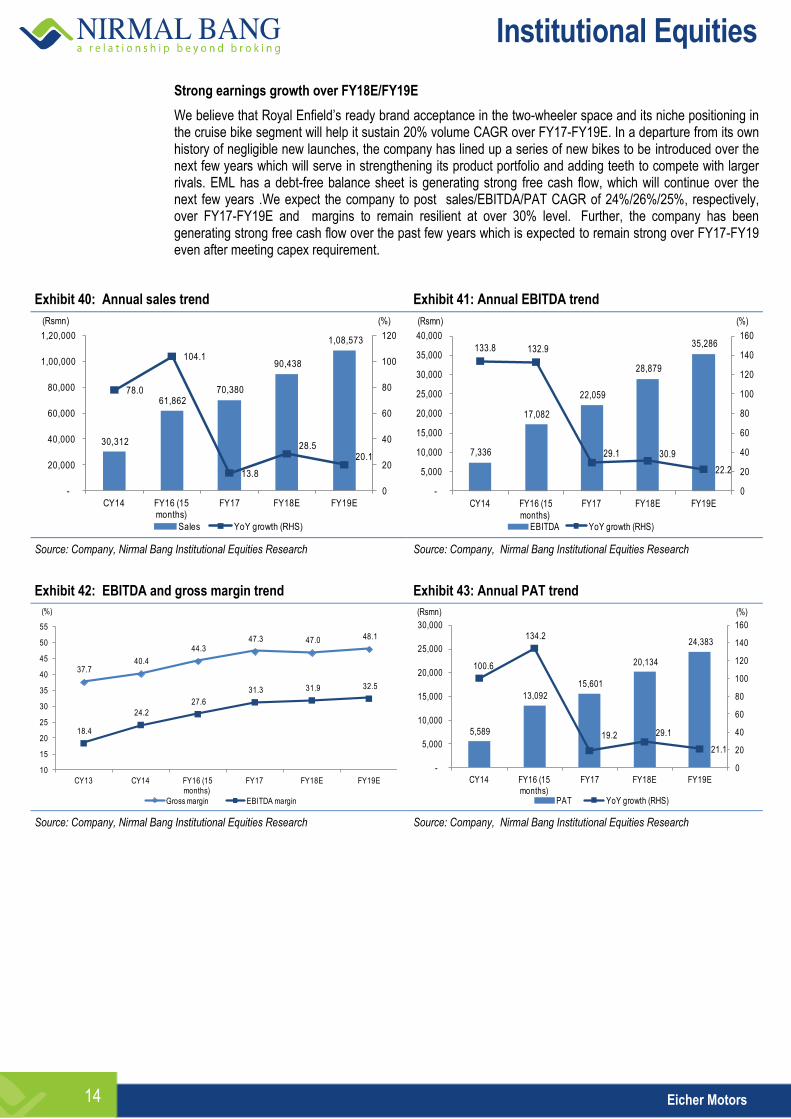
Strong earnings growth over FY18E/FY19E
We believe that Royal Enfield’s ready brand acceptance in the two-wheeler space and its niche positioning in the cruise bike segment will help it sustain 20% volume CAGR over FY17-FY19E. In a departure from its own history of negligible new launches, the company has lined up a series of new bikes to be introduced over the next few years which will serve in strengthening its product portfolio and adding teeth to compete with larger rivals. EML has a debt-free balance sheet is generating strong free cash flow, which will continue over the next few years .We expect the company to post sales/EBITDA/PAT CAGR of 24%/26%/25%, respectively, over FY17-FY19E and margins to remain resilient at over 30% level. Further, the company has been generating strong free cash flow over the past few years which is expected to remain strong over FY17-FY19 even after meeting capex requirement.
Exhibit 40: Annual sales trend Exhibit 41: Annual EBITDA trend
30,312
61,862 70,380
90,438
1,08,573
78.0
104.1
13.8
28.5 20.1
0
20
40
60
80
100
120
-
20,000
40,000
60,000
80,000
1,00,000
1,20,000
CY14 FY16 (15 months)
FY17 FY18E FY19E
(%)(Rsmn)
Sales YoY growth (RHS)
7,336
17,082
22,059
28,879
35,286 133.8 132.9
29.1 30.9
22.2
0
20
40
60
80
100
120
140
160
-
5,000
10,000
15,000
20,000
25,000
30,000
35,000
40,000
CY14 FY16 (15 months)
FY17 FY18E FY19E
(%)(Rsmn)
EBITDA YoY growth (RHS)
Source: Company, Nirmal Bang Institutional Equities Research Source: Company, Nirmal Bang Institutional Equities Research
Exhibit 42: EBITDA and gross margin trend
Exhibit 43: Annual PAT trend
37.7 40.4
44.3 47.3 47.0 48.1
18.4
24.2
27.6
31.3 31.9 32.5
10
15
20
25
30
35
40
45
50
55
CY13 CY14 FY16 (15 months)
FY17 FY18E FY19E
(%)
Gross margin EBITDA margin
5,589
13,092
15,601
20,134
24,383
100.6
134.2
19.2 29.1
21.1
0
20
40
60
80
100
120
140
160
-
5,000
10,000
15,000
20,000
25,000
30,000
CY14 FY16 (15 months)
FY17 FY18E FY19E
(%)(Rsmn)
PAT YoY growth (RHS) Source: Company, Nirmal Bang Institutional Equities Research Source: Company, Nirmal Bang Institutional Equities Research

Institutional Equities
Eicher Motors 15
Exhibit 44: Management profile
Personnel Designation Background
Mr. Siddhartha Lal MD & CEO
Siddhartha Lal is the Chief Executive Officer of Royal Enfield. He is also the Managing Director & chief Executive of Eicher Motors Ltd. Since October 2012, he is the Chairman of VECV. July 2012 onwards, Siddhartha is also the Chairman of Eicher-Polaris Private Limited (EPPL), a newly formed 50:50 strategic joint venture between Eicher Motors Ltd. and US based Polaris Industries Inc.
Mr. Lalit Malik CFO
Lalit Malik is the Chief Financial Officer & Head Business Development at Eicher Motors Ltd. Prior to joining Eicher Motors Ltd, he worked at Max India as Vice President- Corporate Development, where his primary responsibility included managing investments of Max India in the Insurance space.
Mr. Rudrajeet Singh
President
Rudratej Singh is the President at Royal Enfield. He joined the company in January 2015 and has over eighteen years of experience in leading Brand and Marketing mandate for well-known companies in India and across the globe. As President, Royal Enfield, he is responsible for building thought leadership for the brand and leading the commercial business
Mr. B Govindrajan COO
Mr. B. Govindarajan is the Chief Operating Officer (COO) at Royal Enfield from January 2013. He joined Royal Enfield in June 2011 as the Senior Vice President - Industry for his second stint with the company. During his tenure as the Senior Vice President - Industry, he was actively involved in ramping up production at Royal Enfield's Thiruvottiyur facility and raised the capacity to 1 lakh units per annum
Mr. Sudhakar Bhagavatula
CIO
Sudhakar Bhagavatula is the Chief Information Officer at Royal Enfield. He joined the company in 2014 and brings with him over 23 years of extensive industry experience across India, Asia, US & UK in the areas of IT consulting, Product Engineering, in-house IT strategy and transformation. In his current role at Royal Enfield, he is leading the IT strategy for the company, enabling business processes and enhancing the IT infrastructure across the board.
Mr. Rajeev Sharma
HR
Mr. Rajeev Sharma joined Royal Enfield as the Chief Human Resource officer (CHRO) in November 2015. He is an engineer with post graduation in HR from XLRI, Jamshedpur. His experience as a human resource professional spans across 20+ years in significant HR leadership roles at prominent brands such as Hindustan Unilever Ltd., Coca Cola India, GE Capital International Services/Genpact.
Source: Company

Institutional Equities
Eicher Motors 16
Financials
Exhibit 45: Income statement
Y/E March (Rsmn) CY14 FY16* FY17 FY18E FY19E
Net sales 30,312 61,862 70,380 90,438 108,573
% growth 78.0 104.1 13.8 28.5 20.1
Raw material expenses 18,076 34,442 37,066 47,957 56,334
Staff costs 1,609 3,422 3,851 4,619 5,667
Other expenses 3,291 6,916 7,405 8,982 11,285
Total expenditure 22,977 44,780 48,321 61,558 73,287
EBITDA 7,336 17,082 22,059 28,879 35,286
% growth 133.8 132.9 29.1 30.9 22.2
EBITDA margin (%) 24.2 27.6 31.3 31.9 32.5
Other income 1,163 2,835 2,273 2,591 2,954
Interest costs 17 21 28 - -
Gross profit 12,236 27,420 33,314 42,480 52,239
% growth 90.4 124.1 21.5 27.5 23.0
Depreciation 502 1,366 1,533 1,862 2,383
Profit before tax 7,980 18,530 22,771 29,609 35,857
% growth 119.8 132.2 22.9 30.0 21.1
Tax 2,391 5,438 7,170 9,475 11,474
Effective tax rate (%) 30.0 29.3 31.5 32.0 32.0
Net profit 5,589 13,092 15,601 20,134 24,383
% growth 100.6 134.2 19.2 29.1 21.1
EPS (Rs) 206.2 482.0 573.3 740.0 896.1
% growth 101.0 133.7 18.9 29.1 21.1
DPS (Rs) 50.0 100.0 100.0 133.2 179.2
Payout (%) 24.2 20.7 17.4 18.0 20.0
Source: Company, Nirmal Bang Institutional Equities Research
Exhibit 47: Balance sheet
Y/E March (Rsmn) CY14 FY16* FY17 FY18E FY19E
Equity 271 272 272 272 272
Reserves 12,066 23,093 38,954 50,435 69,185
Net worth 12,337 23,364 39,226 50,707 69,457
Net deferred tax liabilities 201 408 792 792 792
LT liabilities/provisions 183 451 664 664 664
Total loans - 226 - - -
Liabilities 12,721 24,449 40,682 52,163 70,913
Gross block 6,389 10,616 12,920 20,920 29,420
Depreciation 1,383 2,686 4,219 6,081 8,464
Net block 5,006 7,931 8,701 14,839 20,956
Capital work-in-progress 593 945 3,738 3,738 3,738
Long-term investments 2,715 15,387 26,857 31,857 44,857
Other long-term assets 1,688 1,482 2,320 2,320 2,320
Inventories 2,051 3,004 3,225 4,221 5,331
Debtors 107 461 489 675 889
Current investments 9,171 5,829 8,836 10,336 12,136
Cash 209 445 206 544 524
Other current assets 749 755 848 957 1,145
Total current assets 12,287 10,494 13,604 16,733 20,025
Trade payables 4,902 7,213 8,319 10,006 11,947
Other current liabilities/provisions 4,666 4,577 6,217 7,317 9,035
Total current liabilities 9,568 11,790 14,537 17,323 20,982
Net current assets 2,719 (1,296) (933) (590) (957)
Total assets 12,721 24,449 40,682 52,163 70,913
Source: Company, Nirmal Bang Institutional Equities Research
Exhibit 46: Cash flow
Y/E March (Rsmn) CY14 FY16* FY17 FY18E FY19E
EBIT 7,997 17,710 22,798 29,609 35,857
(Inc.)/dec. in working capital 1,729 2,463 2,180 1,495 2,148
Cash flow from operations 9,726 20,172 24,978 31,104 38,005
Other (income)/expense, net (1,113) (1,716) (2,273) (2,591) (2,954)
Depreciation 502 1,377 1,533 1,862 2,383
Tax paid (2,255) (5,187) (7,170) (9,475) (11,474)
Net cash from operations 6,860 14,647 17,069 20,899 25,959
Capital expenditure (3,699) (4,987) (5,096) (8,000) (8,500)
Net cash after capex 3,161 9,660 11,972 12,899 17,459
Other investment activity (2,283) (5,097) (9,028) (8,375) (11,846)
Cash from financial activity (856) (4,327) (3,183) (4,186) (5,633)
Opening cash balance 187 209 445 206 544
Closing cash balance 209 445 206 544 524
Change in cash balance 22 236 (240) 338 (20)
Source: Company, Nirmal Bang Institutional Equities Research
Exhibit 48: Key ratios
Y/E March CY14 FY16* FY17 FY18E FY19E
Profitability & return ratios
EBITDA margin (%) 24.2 27.6 31.3 31.9 32.5
EBIT margin (%) 26.4 30.0 32.4 32.7 33.0
Net profit margin (%) 18.4 21.2 22.2 22.3 22.5
RoE (%) 45.3 46.6 39.8 39.7 35.1
RoCE (%) 44.0 45.3 38.4 38.6 34.4
Working capital & liquidity ratios
Receivables (days) 1 2 2 3 3
Inventory (days) 21 15 16 18 18
Payables (days) 64 49 59 60 59
Cash conversion cycle (WC days) (42) (33) (40) (39) (38)
Current ratio (x) 1.3 0.9 0.9 1.0 1.0
Quick ratio (x) 1.1 0.6 0.7 0.7 0.7
Valuation ratios
EV/sales (x) 25.1 12.3 10.8 8.4 7.0
EV/EBITDA (x) 103.6 44.6 34.6 26.4 21.6
P/E (x) 136.0 58.2 48.9 37.9 31.3
P/BV (x) 61.9 32.7 19.5 15.1 11.0
*Note: FY16 financials are for 15-month period
Source: Company, Nirmal Bang Institutional Equities Research

Institutional Equities
Eicher Motors 17
Disclaimer
Stock Ratings Absolute Returns
BUY > 15%
ACCUMULATE -5% to15%
SELL < -5%
This report is published by Nirmal Bang’s Institutional Equities Research desk. Nirmal Bang group has other business units with independent research teams separated by Chinese walls, and therefore may, at times, have different or contrary views on stocks and markets. Reports based on technical and derivative analysis may not match with reports based on a company's fundamental analysis. This report is for the personal information of the authorised recipient and is not for public distribution. This should not be reproduced or redistributed to any other person or in any form. This report is for the general information for the clients of Nirmal Bang Equities Pvt. Ltd., a division of Nirmal Bang, and should not be construed as an offer or solicitation of an offer to buy/sell any securities.
We have exercised due diligence in checking the correctness and authenticity of the information contained herein, so far as it relates to current and historical information, but do not guarantee its accuracy or completeness. The opinions expressed are our current opinions as of the date appearing in the material and may be subject to change from time to time without notice.
Nirmal Bang or any persons connected with it do not accept any liability arising from the use of this document or the information contained therein. The recipients of this material should rely on their own judgment and take their own professional advice before acting on this information. Nirmal Bang or any of its connected persons including its directors or subsidiaries or associates or employees or agents shall not be in any way responsible for any loss or damage that may arise to any person/s from any inadvertent error in the information contained, views and opinions expressed in this publication.
Nirmal Bang Equities Private Limited (hereinafter referred to as “NBEPL”) is a registered Member of National Stock Exchange of India Limited, Bombay Stock Exchange Limited. NBEPL has registered with SEBI as a Research Entity in terms of SEBI (Research Analyst) Regulations, 2014. (Registration No: INH000001436 -19.08.2015 to 18.08.2020).
NBEPL or its associates including its relatives/analyst do not hold any financial interest/beneficial ownership of more than 1% in the company covered by Analyst.
NBEPL or its associates/analyst has not received any compensation from the company covered by Analyst during the past twelve months. NBEPL /analyst has not served as an officer, director or employee of company covered by Analyst and has not been engaged in market-making activity of the company covered by Analyst.
The views expressed are based solely on information available publicly and believed to be true. Investors are advised to independently evaluate the market conditions/risks involved before making any investment decision.
Access all our reports on Bloomberg, Thomson Reuters and Factset.
Team Details:
Name Email Id Direct Line
Rahul Arora CEO [email protected] -
Girish Pai Head of Research [email protected] +91 22 3926 8017 / 18
Dealing
Ravi Jagtiani Dealing Desk [email protected] +91 22 3926 8230, +91 22 6636 8833
Pradeep Kasat Dealing Desk [email protected] +91 22 3926 8100/8101, +91 22 6636 8831
Michael Pillai Dealing Desk [email protected] +91 22 3926 8102/8103, +91 22 6636 8830
Atul Vitha Dealing Desk [email protected] +91 22 3926 8071 / +91 22 3926 8226
Nirmal Bang Equities Pvt. Ltd.
Correspondence Address
B-2, 301/302, Marathon Innova,
Nr. Peninsula Corporate Park,
Lower Parel (W), Mumbai-400013.
Board No. : 91 22 3926 8000/1; Fax. : 022 3926 8010