institutional research 20152016 fact book · pdf fileindex abcdefghijklmnopqrstuvwxyz...
TRANSCRIPT

Fact Book 2015‐2016
TABLE OF CONTENTS
General Information Students Alumni
Faculty & Staff Courses
Academic Departments & Programs Finances & Facilities

Fact Book 2015‐2016
General Information

AccreditationInstitutional and Specialized
INSTITUTIONAL ACCREDITATION
DATE OF LAST COMPREHENSIVE REVIEW ACCREDITATION LETTER
Accredited by The Higher Learning Commission September, 2006www.hlcommission.org; (800) 621-7440; (312) 263-0456
SPECIALIZED ACCREDITATION OF ACADEMIC PROGRAMSAccounting: The Association to Advance Collegiate Schools of Business January, 2015
Administration Preparation Program (School Administration):Department of Education, State of Iowa October, 2014
Art and Design: National Association of Schools of Art and Design Commission on Accreditation May, 2013
Aerospace Engineering: Engineering Accreditation Commission of ABET August, 2013
Agriculture Engineering: Engineering Accreditation Commission of ABET August, 2013
Agricultural Systems Technology Program, Agricultural and Biosystems Management Option, ATMAE December, 2010
Agricultural Systems Technology Program, Machine Systems Option, ATMAE December, 2010
Apparel, Merchandising, and Design: National Association of Schools of Art and Design Commission on Accreditation May, 2013
Architecture: National Architectural Accrediting Board August, 2013
Athletic Training Education Program: Commission on Accreditation of Athletic Training Education August, 2011
Biological/Pre-Medical Illustration: National Association of Schools of Art and Design Commission on Accreditation May, 2013
Biological Systems Engineering: Engineering Accreditation Commission of ABET August, 2013
Business: The Association to Advance Collegiate Schools of Business January, 2015
Chemical Engineering: Engineering Accreditation Commission of ABET August, 2013
Child Development Laboratory School: National Association for the Education of Young Children October, 2013
Civil Engineering: Engineering Accreditation Commission of ABET August, 2013
Community and Regional Planning: Planning Accreditation Board November, 2012
Computer Engineering: Engineering Accreditation Commission of ABET August, 2013
Computer Science: Computing Accreditation Commission of ABET July, 2010
Construction Engineering: Engineering Accreditation Commission of ABET August, 2013
Counseling Psychology (Doctoral Program): American Psychological Association August, 2011
Counseling Psychology (Internship Program): American Psychological Association November, 2008
Dietetics (Didactic Program): Accreditation Council for Education in Nutrition and Dietetics November, 2008
Dietetics (Internship Program): Accreditation Council for Education in Nutrition and Dietetics November, 2008
Electrical Engineering: Engineering Accreditation Commission of ABET August, 2013
Family Counseling and Planning: Certified Financial Planning Board of Standards July, 2015
Forestry: Society of American Foresters December, 2012
Graphic Design: National Association of Schools of Art and Design Commission on Accreditation May, 2013
Hospitality Management: Accreditation Commission for Programs in Hospitality Administration August, 2015
Industrial Design: National Association of Schools of Art and Design Commission on Accreditation May, 2013
Industrial Engineering: Engineering Accreditation Commission of ABET August, 2013
Industrial Technology Program, Agricultural and Biosystems Management Option, ATMAE December, 2010
Industrial Technology Program, Occupational Safety Option, ATMAE December, 2010
Integrated Studio Arts: National Association of Schools of Art and Design Commission on Accreditation May, 2013
Integrated Visual Arts: National Association of Schools of Art and Design Commission on Accreditation May, 2013
Interior Design: Council for Interior Design Accreditation August, 2009
Interior Design: National Association of Schools of Art and Design Commission on Accreditation May, 2013
Journalism and Mass Communication: Accrediting Council on Education in Journalism and Mass Communications May, 2010
Landscape Architecture: Landscape Architectural Accreditation Board August, 2014
Materials Engineering: Engineering Accreditation Commission of ABET August, 2013
Mechanical Engineering: Engineering Accreditation Commission of ABET August, 2013
Music: National Association of Schools of Music July, 2015
Practitioner Preparation Program (Teacher Preparation): Department of Education, State of Iowa October, 2014
Software Engineering: Engineering Accreditation Commission of ABET August, 2013
Veterinary Diagnostic Laboratory: American Association of Veterinary Laboratory Diagnosticians November, 2012
Veterinary Medicine: American Veterinary Medical Association, Council on Education April, 2011
Office of Institutional Research (Source: Office of Senior Vice President & Provost)
Last updated: September, 2015
Faculty, Staff, and Student
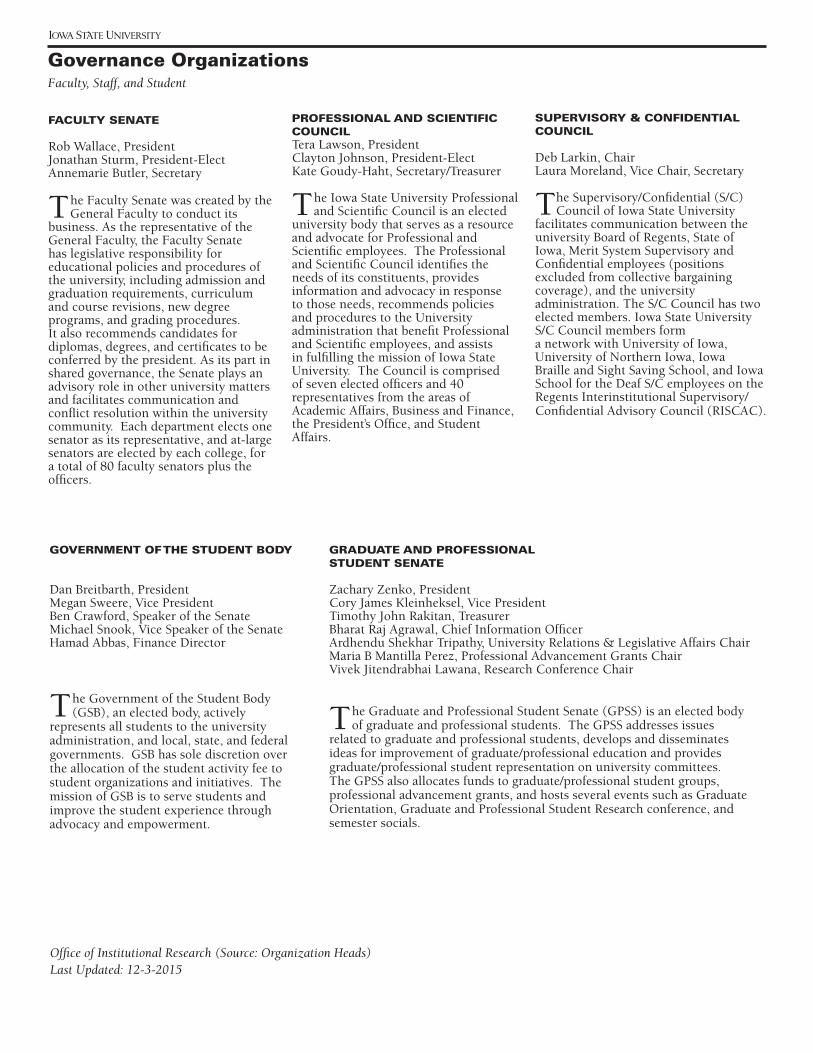
Governance Organizations
FACULTY SENATE
Rob Wallace, PresidentJonathan Sturm, President-ElectAnnemarie Butler, Secretary
The Faculty Senate was created by the General Faculty to conduct its
business. As the representative of the General Faculty, the Faculty Senate has legislative responsibility for educational policies and procedures of the university, including admission and graduation requirements, curriculum and course revisions, new degree programs, and grading procedures. It also recommends candidates for diplomas, degrees, and certifi cates to be conferred by the president. As its part in shared governance, the Senate plays an advisory role in other university matters and facilitates communication and confl ict resolution within the university community. Each department elects one senator as its representative, and at-large senators are elected by each college, for a total of 80 faculty senators plus the offi cers.
PROFESSIONAL AND SCIENTIFIC COUNCIL
Tera Lawson, PresidentClayton Johnson, President-ElectKate Goudy-Haht, Secretary/Treasurer
The Iowa State University Professional and Scientifi c Council is an elected
university body that serves as a resource and advocate for Professional and Scientifi c employees. The Professional and Scientifi c Council identifi es the needs of its constituents, provides information and advocacy in response to those needs, recommends policies and procedures to the University administration that benefi t Professional and Scientifi c employees, and assists in fulfi lling the mission of Iowa State University. The Council is comprised of seven elected offi cers and 40 representatives from the areas of Academic Affairs, Business and Finance, the President’s Offi ce, and Student Affairs.
SUPERVISORY & CONFIDENTIAL COUNCIL
Deb Larkin, ChairLaura Moreland, Vice Chair, Secretary
The Supervisory/Confi dential (S/C) Council of Iowa State University
facilitates communication between the university Board of Regents, State of Iowa, Merit System Supervisory and Confi dential employees (positions excluded from collective bargaining coverage), and the university administration. The S/C Council has two elected members. Iowa State University S/C Council members form a network with University of Iowa, University of Northern Iowa, Iowa Braille and Sight Saving School, and Iowa School for the Deaf S/C employees on the Regents Interinstitutional Supervisory/Confi dential Advisory Council (RISCAC).
GOVERNMENT OF THE STUDENT BODY
Dan Breitbarth, PresidentMegan Sweere, Vice PresidentBen Crawford, Speaker of the SenateMichael Snook, Vice Speaker of the SenateHamad Abbas, Finance Director
The Government of the Student Body (GSB), an elected body, actively
represents all students to the university administration, and local, state, and federal governments. GSB has sole discretion over the allocation of the student activity fee to student organizations and initiatives. The mission of GSB is to serve students and improve the student experience through advocacy and empowerment.
GRADUATE AND PROFESSIONAL STUDENT SENATE
Zachary Zenko, PresidentCory James Kleinheksel, Vice PresidentTimothy John Rakitan, TreasurerBharat Raj Agrawal, Chief Information Offi cerArdhendu Shekhar Tripathy, University Relations & Legislative Affairs ChairMaria B Mantilla Perez, Professional Advancement Grants ChairVivek Jitendrabhai Lawana, Research Conference Chair
The Graduate and Professional Student Senate (GPSS) is an elected body of graduate and professional students. The GPSS addresses issues
related to graduate and professional students, develops and disseminates ideas for improvement of graduate/professional education and provides graduate/professional student representation on university committees. The GPSS also allocates funds to graduate/professional student groups, professional advancement grants, and hosts several events such as Graduate Orientation, Graduate and Professional Student Research conference, and semester socials.
Offi ce of Institutional Research (Source: Organization Heads)Last Updated: 12-3-2015

BOARD OF REGENTSState of Iowa
IOWA STATE UNIVERSITY
Steven LeathPresident
DIVISION OF ACADEMIC AFFAIRS
Jonathan A. WickertSenior Vice President & Provost
DIVISION OF BUSINESS & FINANCE
Warren R. MaddenSenior Vice President
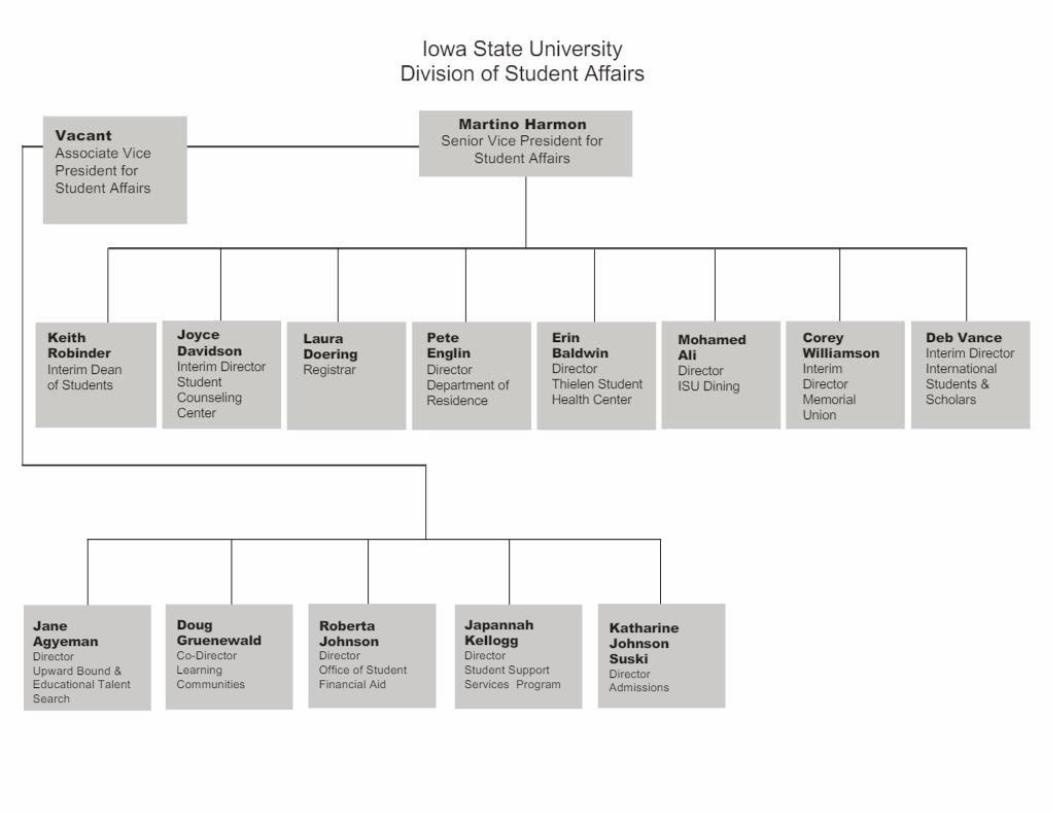
DIVISION OF STUDENT AFFAIRS
Martino HarmonSenior Vice President
ISU FOUNDATIONLarissa Holtmyer Jones,
President & CEO ASSOCIATE VICE PRESIDENT
& CHIEF OF STAFFMiles Lackey
RESEARCH
Sarah M. Nusser
Vice President
EXTENSION & OUTREACH
Cathann A. KressVice President
DEAN OF STUDENTSK Robinder,
Interim Dean
STUDENT HEALTH CENTERE Baldwin, Director
DEPARTMENT OF RESIDENCE
P Englin, Director
INTERNATIONAL STUDENTS & SCHOLARS
D Vance, Interim Director
STUDENT COUNSELING SERVICE
J Davidson, Interim Director
MEMORIAL UNIONC Wi lliamson,
Interim Director
STUDENT AFFAIRSVacant, Associate Vice
President
ISU DININGM Al i, Director
STUDENT FINANCIAL AID
R Johnson, Director
LEARNING COMMUNITIESD Gruenewald,
Co-Director & VP Student Affairs
ADMISSIONSK Suski, Director
LIBRARYB McNeil, Dean
INFORMATION TECHNOLOGY SERVICES
J Kurtenbach, InterimVice President & CIO
COLLEGE OF AGRICULTURE & LIFE SCIENCES
W Wintersteen, Dean
COLLEGE OF BUSINESSD Spalding, Dean
COLLEGE OF DESIGNL Rico-Gutierrez, Dean
COLLEGE OF ENGINEERINGS Rajala, Dean
COLLEGE OF HUMAN SCIENCES
P White, Dean
COLLEG E OF LIBERAL ARTS & SCIENCES
B Schmittmann, Dean
COLLEGE OF VETERINARY MEDICINE
L Nolan, Dean
GRADUATE COLLEGED Holger, Dean
AMES LABORATORY, DOEA Schwartz, Director
FACILITIES PLANNING & MANAGEMENT
D Miller, Associate Vice President
DIVERSITY & INCLUSIONR Stewart,
Vice President
BUSINESS SERVICESN Brooks, Interim
Assistant Vice President
PUBLIC SAFETY
A Delashmutt, Interim Assistant Vice President
ENVIRONMENTAL HEALTH & SAFETY
A D Inyang, Assistant Vice President
TREASURER’S OFFICEJ Piscitello, Treasurer
REIMAN GARDENSE Lyon, Director
UNIVERSITY MUSEUMS
L Pohlman, Director
WOI RADIO GROUPK Edmister,
IPR Chief Admin Officer
IOWA STATE CENTERT Koolbeck,
Executive Director
ALUMNI ASSOCIATIONJeffery W. Johnson, President & CEO
UNIVERSITY RELATIONS
J McCarroll, Director
ATHLETICSJ Pollard, Director
STATE RELATIONSJ Murphy, Officer,Board of Regents
UNIVERSITY COUNSEL
P Tanaka, Counsel
ISU RESEARCH PARK
S Carter, Director
REGISTRARL Doering, Registrar
BUSINESS & FINANCEP Cain,
Associate Vice President & University Secretary
Org Chart Org Chart Org Chart Org Chart Org Chart
ISURF, OIPTTL Lorenzen, Executive
Director
CIRAS(Also reports to
College of Engineering)
R Cox, Director
PAPPAJOHN CENTER FOR ENTREPRENEURSHIP
(Also reports to College of Business)
S Carter, Director
SBDC(Also reports to College of
Business)
L Shimkat, Director
IOWA STATE UNIVERSITY April 25, 2016
ECONOMIC DEVELOPMENT &
INDUSTRY RELATIONSMichael R. Crum,
Vice President for Economic Development & Business
Engagement
UPWARD BOUND & EDUC TALENT SEARCHJ AGYEMA N, DIRECTOR
STUDENT SUPPORT SERVICES
J Kellogg, Director
UNIVERSITY HUMAN RESOURCES
J Nuter, Vice President
INTERNAL AUDIT
T Stewart, Director,Board of Regents
OMBUDS OFFICEE Newell,
Ombuds Officer
UNIVERSITY MARKETING
C Custer, Director
FEDERAL RELATIONSS Magil l,
Assistant Director
FINANCIAL PLANNING & BUDGETS
D Wohlgemuth, Assistant Vice President
EQUAL OPPORTUNITY M Foreman,
Director


`
Senior Vice President for
Business and Finance
Warren R. Madden
SENIOR VICE PRESIDENT FOR BUSINESS AND FINANCE
ORGANIZATIONAL CHART
Budget and Analysis
Assistant to the Vice President
Patricia Strah
Assistant to the Vice President
Judy Hankins
Assistant Vice President
for Business Services
Arlo Meyer
Assistant Vice President
for Environmental Health
& Safety
A. David Inyang
Associate Vice President
for Facilities Planning
& Management
David Miller
Associate Vice President
for Business & Finance &
University Secretary
Pamela Elliott Cain
Administrative Specialist
Madeline Burkhardt
Controller’s Department
Trademark Office
University Book Store
Central Stores
Printing Services
Purchasing
ISU Surplus
Risk Management
Transportation Services
Facilities Management
Custodial, Grounds, Building Maintenance
Facilities Planning, Design, Construction
Space Planning & Management
Utilities
Flight Service
Veenker Golf Course
Sustainability
Iowa State Center
Mark North, Executive Director
(SMG Contract Management)
Treasurer’s Office
Joan Piscitello, Treasurer
Assistant Vice President
for Public Safety
Jerry Stewart
Reiman Gardens
Edward Lyon, Director
University Museums
Lynette Pohlman, Director
WOI Radio Group
Kelly Edmister, IPR—CAO
Senor VPBF Org Chart—March 2015

Jonathan WickertSenior Vice President and
Provost
Sarah M. NusserVice President for Research
Jerry ZamzowAssistant Vice President for
Research (P40)
Wolfgang KliemannAssociate Vice President for
Research (Faculty)
Asrun KristmundsdottirDirector of Strategic Planning
and Operations (Director II, P39)
VACANTAssociate Vice President for
Research (P41)
Jim ReecyDirector of Office of
Biotechnology (Faculty)
Asrun KristmundsdottirInterim Director of Grants Hub
(Director I, P38)
Becky MusselmanDirector of Office of Sponsored Programs Administration (P40)
Lisa LeidenDirector of Office for Responsible Research
(Director I, P38)
Robert ShipleyDirector of Laboratory Animal
Resources(Director II, P39)
Mary SauerAttending Veterinarian
(Director III, P40)
Robyn DavisExecutive Assistant
(Admin Specialist III, P33)
ISU OFFICE OF THE VICE PRESIDENT FOR RESEARCH
VACANTSecretary and Receptionist
(Secretary II, Merit)
Brooke LanglitzDirector of Office for Research Integrity(Director I, P38)

Italics = Working Titles Last updated July 2016
College of Ag & Life Sciences
College of Design
College of Human
Sciences
Lyn Brodersen Assistant Vice
President, Organizational Development
John Flickinger Extension Finance
Manager Budget Officer I
Extension Distribution
Center ----------
Extension Information Technology
---------- Facilities
Conference Planning &
Management ------------ Extension
Human Resources
---------- Professional Development
County Finance ----------
Regional Directors ---------- IACEC Director
Cathann Kress Vice President for
Extension & Outreach
Gary Taylor Associate Professor, College of Design; Interim Program
Director, Community & Economic Development Extension &
Outreach
Deb Sellers Associate Dean,
College of Human Sciences; Director, Human Sciences
Extension & Outreach
Chad Higgins Senior Director for Extension & Outreach Director II
John-Paul Chaisson-Cárdenas State 4-H
Program Leader Program
Manager II
John Lawrence Associate Dean,
College of Ag & Life Sciences; Director,
Ag & Natural Resources
Extension & Outreach
Ross Wilburn Diversity Officer for
Extension and Outreach Director II
Jacy Johnson Director of
Organizational Advancement
Director II
Iowa State University Extension and Outreach
Leadership Organizational Chart
Iowa 4-H Foundation
County Extension Councils ---------- County
Extension Offices ----------
Iowa Assoc. of County
Extension Councils (IACEC)
Robert Dodds Assistant Vice
President, County Services

CountyServices
OrganizationalDevelopment
ProgramLeadership Operations
People
Process
Partners
Product
Vice President for Extension and Outreach
Senior Vice President and Provost
County Extension Councils
County Extension Offices
Iowa Assoc. of County Extension Councils (IACEC)
County Finance
County IT Support
Regional Directors
IACEC Director
Advancement
Conference Planning and Management
Extension Human Resources
Professional Development
Extension Distribution Center
Extension Finance
Extension Information Technology
Operations
College of Ag & Life Sciences
ANR Extension
College of Design CED Extension
College of Human Sciences HSEO
School of Education
K-12 Outreach
4-H Youth Development
DiversityOfficer
President
Iowa State University Extension and Outreach Organizational Chart

Office of the President
Copyright © 19952016, Iowa State University of Science and Technology. All rights reserved.
Steven Leath2012
Gregory Geoffroy2001 2012
Martin Jischke1991 2000
Gordon Eaton1986 1990
W. Robert Parks1965 1986
James Hilton1953 1965
Charles Friley1936 1953
Raymond Hughes1927 1936
Raymond Pearson1912 1926
Albert Storms1903 1910
William Beardshear1891 1902
William Chamberlain1886 1890
Leigh Hunt1885 1886
Seaman Knapp1883 1884
Adonijah Welch1868 1883
ISU presidents

Meeting the Challenges of the 21st CenturyIntegrating Basic Research, the Design of New Technologies, and Entrepreneurial Applications
The challenges of the 21st century demand that we focus on what we do best. To ensure that Iowa State University is a leading research university in 2050, we must recruit, support, and retain students, faculty, and staff who are committed to excellence, integrity, the free exchange of ideas, and collaboration. It is imperative that the creation, sharing, and application of knowledge be a global effort characterized by a profound respect for the diversity of people and ideas. These are the values that enrich our work and guide Iowa State’s Strategic Plan.
Mission: Create, share, and apply knowledge to make Iowa and the world a better place.We must prepare the leaders of our nation and the world. To make the world a better place, Iowa State will call upon its great strengths in student-centered education, global collaboration, and transformational basic and applied research. Iowa State will lead in developing more sustainable ways to produce and deliver safe and nutritious food, water, materials, and energy; integrate the protection of plant, animal, and human health; and care for our environment. We will design tools and infrastructure that will create entrepreneurial opportunities. The major changes sweeping the
• To create knowledge, Iowa State must be a magnet for attracting outstanding students, faculty, and staff who will learn, work, and conduct world-class research and scholarship that address the challenges of the 21st century.
• To share knowledge, Iowa State’s faculty, staff, and students must be able to communicate with and learn from diverse populations. The University must maintain a strong focus on student success and provide exceptional undergraduate, graduate, professional, and outreach programs that prepare students and citizens for leadership and success.
• To apply knowledge, Iowa State’s faculty, staff, and students must be able to develop global partnerships to convert what they know into products, services, and information that will improve the quality of life for the citizens of Iowa, the nation, and the world.
Vision: Iowa State University will lead the world in advancing the land-grant ideals of putting science, technology, and human creativity to work.
U.S. Department of Energy national laboratory; five U.S. Department of Agriculture research laboratories; the nation’s finest genomic-based agricultural breeding, health, and biotechnology programs; world-renowned virtual reality, plant science, and bioeconomy institutes; and one of the nation’s most successful technology transfer programs. Major recent investments in new research and educational facilities and an outstanding tradition of cross-disciplinary research bring all of Iowa State’s colleges and departments together with global partners. The student experience emphasizes outstanding practical, international, and leadership opportunities, as well as a focus on student success. Iowa State alumni and friends are deeply engaged and invested in improving Iowa State. Over the next five years, Iowa State will continue to enhance its campus, capitalize on and leverage its strengths, and engage with partners to realize the goals of this Strategic Plan and create a better future for all.
world are creating extraordinary opportunities for Iowa State to capitalize on its land-grant mission and be at the forefront in addressing our common, global challenges.
Under the provisions of the Morrill Act of 1862, the State of Iowa designated Iowa State as the nation’s first land-grant institution. The Act established the land-grant ideals that higher education should be accessible to all, regardless of race, gender, or economic circumstance, and that the university should teach liberal arts and practical subjects to provide an outstanding quality of life for future citizens. Iowa State pioneered the nation’s first extension service and remains a leader in realizing the promise of the land-grant vision. The university enjoys a number of internationally known and prestigious assets that provide a unique foundation for continued growth and productivity. Iowa State and the city of Ames are home to a
Strategic Plan 2010-2015

Priorities:
Iowa State will be a magnet for attracting outstanding students who seek an education that prepares them to make a difference in the world.Goals:
• Recruit, support, retain, and graduate a diverse group of outstanding undergraduate, graduate, and professional students dedicated to making a difference in the world.
• Provide accessible residential and distance educational programs that build on Iowa State’s strengths and excellence in science and technology integrated with design, business, education, arts, humanities, and social sciences.
• Provide a high quality student life that engages and challenges students to collaboratively learn, grow, and succeed as resilient global citizens and involved alumni.
Iowa State will be a magnet for attracting outstanding faculty and staff who create, share, and apply knowledge to improve the quality of life.Goals:
• Recruit, support, and retain a diverse group of outstanding faculty and staff. • Foster a university culture and work environment that rewards faculty and staff for their
contributions, supports a balance between work and life, and inspires individuals to work together to achieve at the highest level of their abilities.
• Collaborate with Ames and surrounding communities to provide a premier living environment.
Iowa State will be internationally known for faculty, staff, and students who address the challenges of the 21st century. Goals:
• Produce and disseminate transformational basic and applied research and creativity to improve the quality of life. Focus the resources of Iowa State on developing the basic knowledge and designing new technologies to create entrepreneurial solutions to the challenges of 2050 and beyond.
• Build and enhance outreach and global partnerships to promote scientific advances, economic growth, creative thinking, and improvement of the human condition.
Iowa State will be a treasured resource for Iowa, the nation, and the world.Goals:
• Incorporate research and engagement in the student experience to produce civic-minded graduates who are well prepared to address complex societal problems.
• Build partnerships with communities of place and interest to solve problems and create opportunities.
• Involve citizens of Iowa and the world in collaborative interactions through extension, outreach, and engagement.
Iowa State University does not discriminate on the basis of race, color, age, religion, national origin, sexual
orientation, gender identity, genetic information, sex, marital status, disability, or status as a U.S. veteran. Inquiries
can be directed to the Director of Equal Opportunity and Compliance, 3280 Beardshear Hall, (515) 294-7612.
Strategic Plan 2010-2015

Fact Book 2015‐2016
STUDENTS

Admission Requirements
Regent Admission Index
Students who wish to enter Iowa State University directly from high school will be admitted based upon their Regent Admission Index(RAI) score. There are two mathematical formulas for computing student's RAI scores, the primary RAI formula (for students whose highschool provides class rank) and the Alternative RAI formula (for students whose high school does not provide class rank). Below is adetailed description of each formula:
Primary RAI Formula (for students whose high school provides class rank)
Alternative RAI Formula (for students whose high school does NOT provide class rank)
Percentile class rank x 1 + ACT composite score x 2 + Cumulative GPA x 20 + Number of years of high school core courses x 5 RAI score
ACT composite score x 3+ Cumulative GPA x 30 + Number of years of high school core courses x 5 RAI score
Note: For purposes of calculating the RAI, SAT scores will be converted to ACT composite equivalents; high school rank is expressed asa percentile with 99% as the top value; high school GPA is expressed on a 4point scale; and number of high school courses completedin the core subject areas is expressed in terms of years or fractions of years of study.
Applicants who achieve at least a 245 RAI score and who meet the minimum high school course requirements will automatically beoffered admission. Applicants who achieve less than a 245 RAI score and who meet the minimum high school course requirements mayalso be offered admission, but their applications will be reviewed on an individual basis.
Calculate your unofficial Regent Admission Index.
Minimum High School Course Requirements for Admission
Students who wish to enter Iowa State University directly from high school must also meet the minimum high school course requirementsfor admission as indicated below:
Subject Requirement Description
English/Language Arts 4 yearsEmphasizing writing, speaking, and reading, as well as an understandingand appreciation of literature
Mathematics 3 years Including one year each of algebra, geometry, and advanced algebra.
Science 3 yearsIncluding one year each of two of the following fields: biology, chemistry, andphysics.
Social Studies 2 years
Additional entrance requirements for the Colleges of Engineering and Liberal Arts and Sciences
In addition to the high school course requirements listed above, students applying for admission to the College of Engineering mustcomplete two years of a single foreign language. Students applying for admission to the College of Liberal Arts and Sciences mustcomplete a third year of social studies and two years of a single foreign language.
Nontraditional students
Nontraditional students are held to the same high school course requirements as all entering freshmen. However, because research hasshown that traditional measures of high school performance (e.g., GPA, class rank) are not always good predictors of academic successfor nontraditional students, those who achieve less than a 245 RAI score are still encouraged to apply for admission.
General Equivalency Diploma (GED)

General Equivalency Diploma (GED) applicants are welcome to enroll at Iowa State University. The specific GED score requirements foradmission depend upon when the GED test was taken.
GED taken prior to 2014
Applicants who have achieved an overall average score at the 50th percentile or higher with no score lower than the 45th percentile willbe offered admission. Applicants are also required to achieve GED subtest scores at the 75th percentile for subject areas in which theydid not satisfy the Minimum High School Course Requirements for Admission.
GED taken in 2014 or later
Applicants who have achieved a score of 170 or higher on each of the four content areas (Reasoning Through Language Arts,Mathematical Reasoning, Science, and Social Studies) will be offered admission.
High School Equivalency Test (HiSET)
In January, 2014, the state of Iowa began using the HiSET (in place of the GED) as the assessment for persons who wish to earn theirhigh school equivalency diploma. The HiSET is composed of five subtests listed below, each of which are scored from 120 with a scoreof 8 considered "passing" and a score of 15 considered "college ready". The total HiSET score ranges from 1100.
HiSET subtests:
Language Arts – ReadingLanguage Arts – WritingMathematicsSocial StudiesScience
Freshman applicants who achieve a minimum sum score of 75 on the HiSET and a minimum score of 15 on each of the five subtests willautomatically be offered admission. Applicants who do not meet these minimum requirements will be considered on an individual basis.
Home schooled students
Each year, Iowa State welcomes students who have been educated at home. Because some of the factors that make up the RAI arefrequently not available for these students, increased emphasis is given to standardized test scores in the admission review.
Homeschooled students are asked to provide thorough documentation regarding the subject matter (i.e. subject titles, text books, andsyllabus) studied.
Please contact the Office of Admissions for additional details.
Students with disabilities
Students with documented disabilities are held to Iowa State's regular freshman admission requirements. Those who feel their academicrecord does not accurately reflect their ability to succeed and, therefore, wish to be considered for admission on an individual basis areasked to submit additional documentation explaining their circumstances. This documentation should include:
A letter from the applicant requesting special consideration. This letter should identify the disability and include a description ofhow the disability impacts academic performance.Information pertaining to accommodations and services used in high school or the most recent educational setting.A recent typed report prepared by a qualified provider that contains a specific current diagnosis, treatment history, and existingfunctional impact as it relates to one's participation at Iowa State University. Please refer to Student Disability Resources Web sitefor more details on documentation requirements.
For additional information about services for students with disabilities, visit Student Disability Resources.
Summer trial enrollment
Some freshman applicants who are not admitted unconditionally are offered the opportunity to enroll during the summer session on atrial basis. View more information about summer trial enrollment.

New Student Admissions Fall Semester New Student Applications, Admissions, and Enrollment 1
2011 2012 2013 2014 2015Undergraduate
ApplicationsNew Freshman 14,540 16,584 17,525 18,399 19,164Transfer 3,443 3,607 3,848 3,776 3,859
Special2 558 622 1,014 976 888Total 18,541 20,813 22,387 23,151 23,911
AdmissionsGross Admissions (Offers)
New Freshman 12,541 13,648 14,975 15,990 16,702Transfer 2,565 2,674 2,946 2,964 2,922
Special2 518 502 718 684 672Total 15,624 16,824 18,639 19,638 20,296
Net Accepts3
New Freshman 5,111 5,461 6,131 6,092 6,285Transfer 1,834 1,889 2,098 2,018 2,012
Special2 518 502 718 684 672Total 7,463 7,852 8,947 8,794 8,969
EnrolledNew Freshman 5,048 5,366 6,089 6,041 6,230Transfer 1,781 1,841 2,042 1,960 1,949
Special2 348 375 429 411 386Total 7,177 7,582 8,560 8,412 8,565
Vet Med 4
Applications 1,019 1,126 1,068 992 1,025Admissions
Gross Admissions (Offers) 208 221 281 213 263
Admitted/Withdrew 55 64 124 58 113
Net Accepts3 152 150 154 155 150Enrolled 144 145 151 151 149
Graduate
Applications 6,334 6,358 6,474 6,564 6,334
Admissions5
Gross Admissions (Offers) 1,912 2,065 1,977 2,151 2,033Admitted/Withdrew
Enrolled 1,305 1,398 1,427 1,494 1,461
1 Enrollment counts include Summer entries who continued into Fall.
2 Special students are non-degree-seeking students.
4 Effective Fall 2007, students participating in the Nebraska Education Alliance are included.
5 Counts for 2009 have been restated from data presented in previous Fact Books .
Office of Institutional Research (Source: Office of Admissions)Last Updated: 9/22/2015
3 Prior to 2003, Net Accepts reflects Net Admissions data; data has been restated from data presented in previous Fact Books . Net Accepts only applies to
students who have to formally accept an offer. Graduate students are therefore excluded from this variable.

Academic Preparation of New FreshmenFall Semester First-Time Freshmen
2010 2011 2012 2013 2014 2015
ACT Composite Scores
75th Percentile 27.8 27.8 27.8 28.0 28.0 28.0
Mean 24.9 24.9 24.9 24.9 25.0 25.0
25th Percentile 22.0 22.0 22.1 22.0 22.0 22.0
High School Rank1, 2
Mean 77.0 74.6 74.9 77.0 75.5 75.1
Percent in Upper 10% 29.1 24.9 25.5 25.0 25.9 22.1
Percent in Upper 20% 51.4 45.7 46.6 46.6 47.2 44.1
Percent in Upper 50% 92.1 89.7 90.4 90.2 90.9 90.5
Average High School GPA3 3.54 3.53 3.55 3.59 3.57 3.58
1 Beginning Fall Semester 2006, freshmen with estimated high school rank are excluded.
2 Beginning Fall Semester 2011, high school rank is final rank only.
3 Number is estimated using available data.
Office of Institutional Research (Source: Office of Admissions)
Last Updated: 9/28/2015

Transfer Admissions Fall Semester New Transfer Students by Type of Transfer College
TRANSFER COLLEGE TYPE 2010 2011 2012 2013 2014 2015
Iowa Area Community Colleges 1,001 1,050 1,111 1,255 1,181 1,162
Iowa Four-Year Public
University of Iowa 54 54 45 49 37 45
University of Northern Iowa 44 64 55 49 42 39
Subtotal 98 118 100 98 79 84
Iowa Four-Year Private 128 131 129 132 129 145
Iowa Two-Year Private 1 5 1 1 0 0
Non-Iowa (U.S.) 309 349 372 429 460 446
Foreign 136 128 128 127 111 112
Total 1,673 1,781 1,841 2,042 1,960 1,949
Office of Institutional Research (Source: Office of Admissions)Last Updated: 9/22/2015

Enrollment1: 1868 – 2015
Office of Institutional Research (Source: Office of the Registrar)1 Enrollment includes Post-Doctoral students
36,001
20,350
15,651
0
6,000
12,000
18,000
24,000
30,000
36,000
42,000
1855 1875 1895 1915 1935 1955 1975 1995 2015
EN
RO
LL
ME
NT
FALL TERM
Female
Male
1868
Total
Last Updated 9/18/2015

Enrollment1: 1868 – 2015Total Fall Term Students
1868 68 1918 2,944 40.8% 1968 18,083 7.4%
1869 192 182.4% 1919 3,147 6.9% 1969 19,172 6.0%
1870 216 12.5% 1920 3,584 13.9% 1970 19,620 2.3%
1871 188 -13.0% 1921 3,896 8.7% 1971 19,274 -1.8%
1872 263 39.9% 1922 4,008 2.9% 1972 19,206 -0.4%
1873 263 0.0% 1923 3,898 -2.7% 1973 19,267 0.3%
1874 295 12.2% 1924 3,759 -3.6% 1974 19,914 3.4%
1875 277 -6.1% 1925 3,780 0.6% 1975 21,205 6.5%
1876 241 -13.0% 1926 3,936 4.1% 1976 21,831 3.0%
1877 260 7.9% 1927 4,047 2.8% 1977 22,803 4.5%
1878 284 9.2% 1928 3,982 -1.6% 1978 23,052 1.1%
1879 284 0.0% 1929 4,171 4.7% 1979 23,486 1.9%
1880 252 -11.3% 1930 4,318 3.5% 1980 24,268 3.3%
1881 226 -10.3% 1931 3,966 -8.2% 1981 24,202 -0.3%
1882 282 24.8% 1932 3,410 -14.0% 1982 24,906 2.9%
1883 315 11.7% 1933 3,292 -3.5% 1983 26,020 4.5%
1884 252 -20.0% 1934 3,716 12.9% 1984 26,321 1.2%
1885 306 21.4% 1935 4,412 18.7% 1985 26,529 0.8%
1886 305 -0.3% 1936 4,843 9.8% 1986 26,431 -0.4%
1887 293 -3.9% 1937 5,423 12.0% 1987 25,707 -2.7%
1888 265 -9.6% 1938 6,103 12.5% 1988 25,448 -1.0%
1889 284 7.2% 1939 6,457 5.8% 1989 25,489 0.2%
1890 336 18.3% 1940 6,567 1.7% 1990 25,339 -0.6%
1891 425 26.5% 1941 6,220 -5.3% 1991 25,250 -0.4%
1892 519 22.1% 1942 6,054 -2.7% 1992 25,263 0.1%
1893 566 9.1% 1943 3,126 -48.4% 1993 25,112 -0.6%
1894 563 -0.5% 1944 2,436 -22.1% 1994 24,728 -1.5%
1895 526 -6.6% 1945 3,407 39.9% 1995 24,431 -1.2%
1896 509 -3.2% 1946 9,216 170.5% 1996 24,899 1.9%
1897 524 2.9% 1947 9,700 5.3% 1997 25,384 1.9%
1898 845 61.3% 1948 10,114 4.3% 1998 25,585 0.8%
1899 874 3.4% 1949 8,987 -11.1% 1999 26,110 2.1%
1900 1,062 21.5% 1950 8,135 -9.5% 2000 26,845 2.8%
1901 1,153 8.6% 1951 7,548 -7.2% 2001 27,823 3.6%
1902 1,254 8.8% 1952 7,483 -0.9% 2002 27,898 0.3%
1903 1,334 6.4% 1953 7,780 4.0% 2003 27,380 -1.9%
1904 1,326 -0.6% 1954 8,308 6.8% 2004 26,380 -3.7%
1905 1,369 3.2% 1955 9,176 10.4% 2005 25,741 -2.4%
1906 1,595 16.5% 1956 9,673 5.4% 2006 25,462 -1.1%
1907 1,683 5.5% 1957 9,826 1.6% 2007 26,160 2.7%
1908 1,766 4.9% 1958 9,503 -3.3% 2008 26,856 2.7%
1909 1,590 -10.0% 1959 9,252 -2.6% 2009 27,945 4.1%
1910 1,562 -1.8% 1960 9,726 5.1% 2010 28,682 2.6%
1911 1,800 15.2% 1961 10,413 7.1% 2011 29,887 4.2%
1912 1,830 1.7% 1962 10,887 4.6% 2012 31,040 3.9%
1913 1,936 5.8% 1963 11,517 5.8% 2013 33,241 7.1%
1914 2,108 8.9% 1964 12,451 8.1% 2014 34,732 4.5%
1915 2,511 19.1% 1965 14,014 12.6% 2015 36,001 3.7%
1916 2,562 2.0% 1966 15,183 8.3%
1917 2,091 -18.4% 1967 16,841 10.9%
1 Enrollment includes Post-Doctoral students
Office of Institutional Research (Source: Office of the Registrar)Last Updated: 9-10-2015
YEAR, NUMBER OF STUDENTS, AND PERCENT CHANGE

Enrollment by AgeFall Semester Headcount by Level
––––––––––––UNDERGRADUATE–––––––––––– ––––––––––––Vet Med–––––––––––– –––––––––––––––GRADUATE 1–––––––––––––––
AGE 2011 2012 2013 2014 2015 2011 2012 2013 2014 2015 2011 2012 2013 2014 2015Under 18 186 183 203 285 227 0 0 0 0 0 0 0 0 1 0
18 4,062 4,387 4,935 5,142 5,037 0 0 0 0 0 0 0 0 0 0
19 4,518 4,920 5,509 5,905 5,877 0 0 0 0 0 0 1 0 2 2
20 4,712 4,914 5,396 5,908 6,346 0 0 1 1 1 1 5 6 8 6
21 4,687 4,754 5,015 5,355 5,857 2 10 11 9 12 46 57 55 74 76
22 2,915 3,034 3,133 3,031 3,283 78 67 62 75 76 288 290 306 331 323
23 1,194 1,286 1,277 1,182 1,315 110 114 97 101 100 423 429 433 482 478
24 500 513 601 508 543 119 121 126 113 115 472 433 471 493 489
25 308 311 295 360 321 105 117 122 128 108 424 446 439 471 543
26 229 198 230 208 244 65 58 71 57 70 379 399 434 423 451
27 155 190 169 180 143 25 35 24 42 24 367 350 365 392 393
28 131 132 157 110 157 18 11 21 12 27 309 298 321 312 345
29 112 109 109 108 87 16 12 7 13 10 260 235 256 283 276
30-39 478 462 465 456 431 39 38 36 36 38 1,168 1,192 1,158 1,192 1,212
40-49 110 116 101 105 106 6 5 7 4 2 360 324 302 318 351
50-64 47 41 60 44 55 0 0 1 1 1 181 145 159 160 147
Over 64 1 3 2 6 2 0 0 0 0 0 1 3 3 7 4
Not available 1 0 2 0 3 4 0 0 0 0 2 0 2 1 0 Total 24,343 25,553 27,659 28,893 30,034 587 588 586 592 584 4,681 4,607 4,710 4,950 5,096
Average Age 20.9 20.8 20.7 20.6 20.6 25.3 25.2 25.3 25.0 25.0 30.4 30.1 30.0 29.3 29.3
Percent > 25 6.5% 6.1% 5.7% 5.5% 5.1%
1 Beginning 2011, Graduate and Total exclude Post Docs in this table.
Office of Institutional Research (Source: Office of the Registrar)Last Updated: 10/5/2015

Enrollment: College, Term, and LevelFiscal Year
2011- 2012
2012-2013
2013-2014
2014-2015
2015-2016
2011- 2012
2012-2013
2013-2014
2014-2015
2015-2016
2011- 2012
2012-2013
2013-2014
2014-2015
2015-2016
Agriculture and Life Sciences
Summer 732 854 900 991 977 514 459 474 524 531 1,246 1,313 1,374 1,515 1,508Fall 3,584 3,900 4,291 4,475 4,612 627 655 692 730 763 4,211 4,555 4,983 5,205 5,375Spring 3,434 3,736 4,086 4,256 615 663 702 730 4,049 4,399 4,788 4,986
Business
Summer 908 855 904 902 936 151 114 110 130 170 1,059 969 1,014 1,032 1,106Fall 3,212 3,327 3,687 3,836 4,161 258 198 221 246 324 3,470 3,525 3,908 4,082 4,485Spring 3,104 3,286 3,509 3,719 223 198 218 241 3,327 3,484 3,727 3,960
Design
Summer 377 393 395 349 282 60 73 85 78 82 437 466 480 427 364Fall 1,798 1,762 1,799 1,775 1,771 158 182 202 223 213 1,956 1,944 2,001 1,998 1,984Spring 1,690 1,681 1,680 1,723 155 177 192 208 1,845 1,858 1,872 1,931
Engineering
Summer 1,707 2,026 2,241 2,302 2,308 661 595 697 744 810 2,368 2,621 2,938 3,046 3,118Fall 5,935 6,495 7,123 7,523 7,949 997 1,013 1,161 1,266 1,363 6,932 7,508 8,284 8,789 9,312Spring 5,385 5,914 6,413 6,771 969 1,066 1,176 1,270 6,354 6,980 7,589 8,041
Human Sciences
Summer 1,099 1,169 1,254 1,392 1,445 574 643 576 641 599 1,673 1,812 1,830 2,033 2,044Fall 3,430 3,707 4,068 4,320 4,290 766 758 732 773 697 4,196 4,465 4,800 5,093 4,987Spring 3,400 3,642 3,983 4,235 756 722 712 762 4,156 4,364 4,695 4,997
Liberal Arts and Sciences
Summer 1,967 1,919 1,917 1,903 1,918 866 791 781 758 750 2,833 2,710 2,698 2,661 2,668Fall 6,384 6,362 6,691 6,964 7,251 1,217 1,161 1,145 1,162 1,186 7,601 7,523 7,836 8,126 8,437Spring 5,731 5,724 6,080 6,317 1,155 1,112 1,102 1,122 6,886 6,836 7,182 7,439
2011- 2012
2012- 2013
2013-2014
2014-2015
2015-2016
2011- 2012
2012- 2013
2013-2014
2014-2015
2015-2016
2011- 2012
2012- 2013
2013-2014
2014-2015
2015-2016
Vet Med
Summer 212 188 167 173 159 92 82 77 90 97 304 270 244 263 256Fall 587 588 586 592 584 102 94 122 140 146 689 682 708 732 730Spring 588 586 586 593 93 95 122 140 681 681 708 733
Interdepartmental Units and Graduate Undeclared
Summer 439 335 345 243 266 439 335 345 243 266Fall 556 546 435 410 404 556 546 435 410 404Spring 490 496 414 378 490 496 414 378
Office of Institutional Research (Source: Office of the Registrar)Last Updated: 9-24-2015
–––––––––––––––––GRADUATE–––––––––––––––– TOTAL PROFESSIONAL AND GRADUATE
TOTAL UNDERGRADUATE AND GRADUATE–––––––––––––––––GRADUATE––––––––––––––––––––––––––––UNDERGRADUATE–––––––––––––COLLEGEAND TERM
COLLEGEAND TERM
––––––––––––––PROFESSIONAL–––––––––––––––

Enrollment:Term and Level TotalsFiscal Year
2011- 2012
2012- 2013
2013-2014
2014-2015
2015-2016
2011- 2012
2012- 2013
2013-2014
2014-2015
2015-2016
2011- 2012
2012- 2013
2013-2014
2014-2015
2015-2016
Total UniversitySummer 6,790 7,216 7,611 7,839 7,866 3,357 3,092 3,145 3,208 3,305 212 188 167 173 159Fall 24,343 25,553 27,659 28,893 30,034 4,681 4,607 4,710 4,950 5,096 587 588 586 592 584Spring 22,744 23,983 25,751 27,021 4,456 4,529 4,638 4,851 587 586 586 593
2011- 2012
2012- 2013
2013-2014
2014-2015
2015-2016
Total UniversitySummer 10,359 10,496 10,923 11,220 11,330Fall 29,611 30,748 32,955 34,435 35,714Spring 27,787 29,098 30,975 32,465
1 Beginning Fall 2011, Post Docs excluded from this table.
––––––––––––UNDERGRADUATE––––––––––––– –––––––––––––––––GRADUATE–––––––––––––––– –––––––––––––––––PROFESSIONAL––––––––––––––––
–––––––––––––––ALL LEVELS –––––––––––––––––
COLLEGEAND TERM
0
5,000
10,000
15,000
20,000
25,000
30,000
35,000
40,000
2011- 2012 2012- 2013 2013-2014 2014-2015 2015-2016
Fall Enrollment by Level
Professional
Graduate
Undergraduate

Enrollment: FTE1 by Level Fall Semester
LEVEL 2011 2012 2013 2014 2015
Undergraduate
Freshmen 6,220 6,572 7,115 6,896 6,890
Sophomores 5,087 5,452 6,007 6,177 6,398
Juniors 5,592 5,829 6,344 6,661 7,020
Seniors 6,904 7,206 7,587 8,000 8,550
Specials 2 242 236 260 196 195
Total Undergraduate 24,045 25,295 27,313 27,930 29,053
Vet Med 587 588 586 592 717
Graduate 4,392 4,108 4,206 4,429 4,577
Total FTE3
29,024 29,991 32,105 32,951 34,347
1 FTE for undergraduates is computed using a denominator of 15.0 credit hours. This is also the case for Vet Med beginning in 2015,
prior to that it was equal to headcount. The denominator for graduate students is 9 credit hours.2 Special students are non-degree-seeking students.
3 Beginning in 2011, Post Docs are excluded from counts.
Office of Institutional Research (Source: Office of the Registrar)Last Updated: 10/5/2015
0
5,000
10,000
15,000
20,000
25,000
30,000
35,000
Undergraduate Graduate Vet Med
2011
2012
2013
2014
2015

Enrollment: Full-Time1 and Part-Time2
Fall Semester Headcount and Percent by Level
LEVEL NUMBER % NUMBER % NUMBER % NUMBER % NUMBER %
Undergraduate
Freshmen (includes New Freshmen) 6,032 6,375 6,913 6,993 7,033Full-time 5,988 6,336 6,861 6,936 6,796Part-time 44 0.7% 39 0.6% 52 0.8% 57 0.8% 237 3.4%
New Freshmen 5,048 5,366 6089 6041 6,231
Full-time 5,026 5,351 6061 6013 6,028
Part-time 22 0.4% 15 0.3% 28 0.5% 28 0.5% 203 3.3%
Sophomores 4,995 5,337 5,888 6,169 6,408Full-time 4,914 5,252 5,790 6071 6264
Part-time 81 1.6% 85 1.6% 98 1.7% 98 1.6% 144 2.2%
Juniors 5,608 5,798 6,359 6,717 7,058Full-time 5,416 5,592 6,102 6,490 6,777Part-time 192 3.4% 206 3.6% 257 4.0% 227 3.4% 281 4.0%
Seniors 7,222 7,548 7,952 8,457 9,021Full-time 6,583 6,840 7,233 7,701 8,236Part-time 639 8.8% 708 9.4% 719 9.0% 756 8.9% 785 8.7%
Specials 486 495 547 557 514Full-time 202 189 192 237 129Part-time 284 58.4% 306 61.8% 355 64.9% 320 57.5% 385 74.9%
Total Undergraduate 24,343 25,553 27,659 28,893 30,034Full-time 23,103 24,209 26,178 27,435 28,202Part-time 1,240 5.1% 1,344 5.3% 1,481 5.4% 1,458 5.0% 1,832 6.1%
Vet Med 587 588 586 592 584Full-time 585 583 582 586 579Part-time 2 0.3% 5 0.9% 4 0.7% 6 1.0% 5 0.9%
Graduate 3
4,681 4,607 4,710 4,950 5,096
Full-time 2,506 2,504 2,650 2,850 2,920Part-time 2,175 46.5% 2,103 45.6% 2,060 43.7% 2,100 42.4% 2,176 42.7%
Total 29,611 30,748 32,955 34,435 35,714
Full-time 26,194 27,296 29,410 30,871 31,701
Part-time 3,417 11.5% 3,452 11.2% 3,545 10.8% 3,564 10.3% 4,013 11.2%
1 Beginning Fall 2015, for reporting purposes, full-time enrollment will no longer include remedial courses in the calculation of total credit hours.2 Part-time: fewer than 12 credits for undergraduate and Vet Med; fewer than 9 credits for graduate.
3 Beginning Fall 2011, Post Docs are excluded from Graduate and Total in this table.
Office of Institutional Research (Source: Office of the Registrar)Last Updated: 9-14-2015
–––––––––2012–––––––– –––––––––2014–––––––––––––––––2013–––––––– ––––––––––2015–––––––––––––––––2011––––––––

Enrollment: Gender by College and LevelFall 2015 Semester Headcount and Percent Women
College Men Women TotalPercent Women Men Women Total
Percent Women Men Women Total
Percent Women
Agriculture and Life Sciences 2,273 2,339 4,612 50.7% 427 336 763 44.0% 2,700 2,675 5,375 49.8%
Business 2,726 1,435 4,161 34.5% 202 122 324 37.7% 2,928 1,557 4,485 34.7%
Design 803 968 1,771 54.7% 106 107 213 50.2% 909 1,075 1,984 54.2%
Engineering 6,697 1,252 7,949 15.8% 1,042 321 1,363 23.6% 7,739 1,573 9,312 16.9%
Human Sciences 902 3,388 4,290 79.0% 191 506 697 72.6% 1,093 3,894 4,987 78.1%
Liberal Arts and Sciences 3,670 3,581 7,251 49.4% 715 471 1,186 39.7% 4,385 4,052 8,437 48.0%
Vet Med 74 72 146 49.3% 74 72 146 49.3%
Interdepartmental Units and Undeclared 199 205 404 50.7% 199 205 404 50.7%
Total 17,071 12,963 30,034 43.2% 2,956 2,140 5,096 42.0% 20,027 15,103 35,130 43.0%
Office of Institutional Research (Source: e-data)Last Updated: 9/14/2015
Undergraduate Graduate Total

Enrollment: Gender by College and LevelFall 2015 Semester Headcount and Percent Female
Office of Institutional Research (Source: e-data)Last Updated: 9/14/2015
0% 20% 40% 60% 80% 100%
Agriculture and Life Sciences
Business
Design
Engineering
Human Sciences
Liberal Arts and Sciences
Vet Med
Interdepartmental Units andUndeclared
Total
Percent of Graduate Men and Women by College
Men
Women
0% 20% 40% 60% 80% 100%
Agriculture and Life Sciences
Business
Design
Engineering
Human Sciences
Liberal Arts and Sciences
Total
Percent of Undergraduate Men and Women by College
Men
Women

Undergraduate Enrollment: Gender by College Fall 2015 Semester Headcount
Office of Institutional Research (Source: e-data)Last Updated: 9/14/2015
0% 10% 20% 30% 40% 50% 60% 70% 80% 90% 100%
Men
Women
Undergraduate Enrollment: Gender by College
Agriculture and Life Sciences
Business
Design
Engineering
Human Sciences
Liberal Arts and Sciences
0% 10% 20% 30% 40% 50% 60% 70% 80% 90% 100%
Men
Women
Undergraduate Enrollment: Gender by College
Agriculture and Life Sciences
Business
Design
Engineering
Human Sciences
Liberal Arts and Sciences

Enrollment Residency Maps: Graduate by Iowa County
Year: 2015 College: All CollegesTerm: Fall Department: All Departments
Level: Grad
County Enrollment
Adair 6
Adams 2
Allamakee 5
Appanoose 6
Audubon 1
Benton 5
Black Hawk
43
Boone 35
Bremer 10
Buchanan 8
Buena Vista
1
Butler 3
Calhoun 2
Carroll 7
Cass 7
Cedar 5
Cerro Gordo
15
Cherokee 5
Chickasaw 2
Clarke 3
Clay 4
Clayton 3
Clinton 6
Crawford 3
County Enrollment
Dallas 48
Davis 1
Decatur 4
Delaware 3
Des Moines
9
Dickinson 6
Dubuque 19
Emmet 1
Fayette 5
Floyd 5
Franklin 2
Fremont 1
Greene 2
Grundy 2
Guthrie 4
Hamilton 6
Hancock 6
Hardin 8
Harrison 3
Henry 6
Howard 3
Humboldt 1
Ida 1
Iowa 1
County Enrollment
Jackson 2
Jasper 14
Jefferson 6
Johnson 43
Jones 2
Keokuk 2
Kossuth 5
Lee 5
Linn 82
Lucas 3
Madison 2
Mahaska 6
Marion 13
Marshall 21
Mills 3
Mitchell 2
Montgomery 3
Muscatine 10
Non-Iowa 3,554
O'Brien 2
Osceola 1
County Enrollment
Palo Alto 7
Plymouth 8
Pocahontas 3
Polk 363
Pottawattamie 11
Poweshiek 9
Ringgold 1
Sac 3
Scott 34
Shelby 8
Sioux 5
Story 405
Tama 8
Taylor 1
Union 7
Van Buren 1
Wapello 8
Warren 29
Washington 5
Wayne 2
Webster 16
Winnebago 4
Winneshiek 11
Woodbury 27
Worth 2
Wright 3
Enrollment
1,0003501005025101
Office of Institutional Research (Source: e-Data warehouse)Last updated: Nov 3, 2015
Graduate Enrollment Iowa Resident 1,542 U.S., Non-Iowa Resident 1,655 International (in Non-Iowa) 1,899 Total 5,096

Enrollment Residency Maps: Graduate by State
Year: 2015 College: All CollegesTerm: Fall Department: All Departments
Level: Grad
State Enrollment
Alabama 15
Alaska 7
Arizona 15
Arkansas 13
California 108
Colorado 35
Connecticut 11
Delaware 6
Florida 33
Georgia 27
Guam 1
Hawaii 7
Idaho 12
Illinois 184
Indiana 44
Iowa 1,542
Kansas 47
Kentucky 11
Louisiana 13
State Enrollment
Maine 5
Marianas Islands 1
Maryland 27
Massachusetts 21
Michigan 54
Minnesota 208
Mississippi 3
Missouri 66
Montana 6
Nebraska 63
Nevada 10
New Hampshire 1
New Jersey 28
New Mexico 13
New York 55
Non-U.S. 1,899
North Carolina 27
North Dakota 14
Not Established Residency
13
Ohio 28
Oklahoma 19
Oregon 11
State Enrollment
Pennsylvania 45
Puerto Rico 7
Rhode Island 4
South Carolina 10
South Dakota 28
Tennessee 16
Texas 65
U.S. Citizen in a Foreign Country
19
Utah 16
Vermont 1
Virgin Islands 1
Virginia 33
Washington 32
Washington, DC 3
West Virginia 3
Wisconsin 106
Wyoming 4
Enrollment
5,0001,00020010025101
Office of Institutional Research (Source: e-Data warehouse)Last updated: Nov 3, 2015
Graduate Enrollment Iowa Resident 1,542 U.S., Non-Iowa Resident 1,655 International (Non-U.S.) 1,899 Total 5,096

Enrollment: Headcount by Level Fall Semester
LEVEL 2011 2012 2013 2014 2015
Undergraduate
Freshmen 6,032 6,375 6,913 6,993 7,033
Sophomores 4,995 5,337 5,888 6,169 6,408
Juniors 5,608 5,798 6,359 6,717 7,058
Seniors 7,222 7,548 7,952 8,457 9,021
Specials1486 495 547 557 514
Total Undergraduate 24,343 25,553 27,659 28,893 30,034
Vet Med2
587 588 586 592 584
Graduate 4,681 4,607 4,710 4,950 5,096
Post Docs 276 292 286 297 287
Total 29,887 31,040 33,241 34,732 36,0011 Special students are non-degree-seeking students.
2 The Vet Med category was previously labeled 1st Professional and denotes students in the College of Veterniary Medicine seeking a doctorate of Veterinary Medicine.
Office of Institutional Research (Source: Office of the Registrar)
0
6,000
12,000
18,000
24,000
30,000
36,000
42,000
2011 2012 2013 2014 2015
Post Docs
Graduate
Vet Med
Specials
Seniors
Juniors
Sophomores
Freshmen
Last updated:12/3/2015

Enrollment by Housing Type 1
Fall Semester Headcount and Percent
TYPE OF HOUSING 2011 2012 2013 2014 2015
University Operated
Residence Halls2 8,847 9,273 10,102 11,032 11,512Percent 29.9% 30.2% 30.7% 32.0% 32.2%
University Student Apartments 1,083 1,097 1,120 1,121 1,155Percent 3.7% 3.6% 3.4% 3.3% 3.2%
Total University Operated 9,930 10,370 11,222 12,153 12,667Percent 33.5% 33.7% 34.1% 35.3% 35.5%
Off-Campus in Ames
Fraternities and Sororities 916 869 963 898 813Percent 3.1% 2.8% 2.9% 2.6% 2.3%
Other 13,579 14,190 15,054 15,621 16,459Percent 45.9% 46.1% 45.7% 45.4% 46.1%
Total Off-Campus in Ames 14,495 15,059 16,017 16,519 17,272Percent 49.0% 49.0% 48.6% 48.0% 48.4%
Outside Ames 5,186 5,319 5,716 5,763 5,775Percent 17.5% 17.3% 17.3% 16.7% 16.2%
No Information 0 0 0 0 0Percent 0.0% 0.0% 0.0% 0.0% 0.0%
Total University 29,611 30,748 32,955 34,435 35,714
1 Beginning in Fall 2011, Graduate and Total exclude Post Docs in this table.2 Fredriksen Court, Maricopa, and Legacy student apartments are included in this count.
Office of Institutional Research (Source: Office of the Registrar)Last Updated: 10/22/2015
36%
48%
16%
2015 Enrollment by Housing Type
Total University Operated
Total Off-Campus in Ames
Outside Ames

International Enrollment by Country: Undergraduate, Vet Med, and GraduateFall 2015
AFRICA ASIA EUROPE NORTH AMERICA
26 countries, 123 students 35 countries, 3,545 students 29 countries, 122 students 7 countries, 90 studentsNigeria 30 China: United Kingdom of Canada 39Egypt 21 People’s Republic 1796 Great Britain and 31 Mexico 37Uganda 14 Taiwan 51 Northern Ireland Panama 5Ghana 9 Hong Kong 21 Russia 11 Costa Rica 3Libya 7 India 575 Germany 9 El Salvador 3Kenya 6 Malaysia 299 Italy 9 Guatemala 2Tanzania 5 Korea, South 235 Ukraine 8 Honduras 1Rwanda 4 Iran 80 France 6Botswana 3 Saudi Arabia 55 Sweden 6 OCEANIA
Cameroon 3 Vietnam 53 Greece 4 2 countries, 19 students
Zambia 3 Indonesia 49 Spain 4 Australia 14
Congo, Democratic Rep of 2 Sri Lanka 43 Switzerland 4 New Zealand 5Sudan 2 Bangladesh 39 Netherlands 3Zimbabwe 2 Nepal 35 Albania 2 SOUTH AMERICA
Burkino Faso 1 Turkey 33 Austria 2 9 countries, 128 students
Congo, Republic of 1 Oman 28 Croatia 2 Brazil 50Guinea-Bissau 1 Jordan 24 Cyprus 2 Colombia 26Eritrea 1 Pakistan 20 Czech Republic 2 Venezuela 14Ethiopia 1 United Arab Emirates 18 Finland 2 Ecuador 12Malawi 1 Thailand 15 Kosovo 2 Argentina 11Mauritius 1 Japan 13 Lithuania 2 Peru 6Morocco 1 Singapore 12 Romania 2 Uruguay 6Mozambique 1 Kuwait 11 Poland 1 Chile 2Togo 1 Philippines 6 Bulgaria 1 Bolivia 1South Sudan 1 Israel 5 Georgia 1The Gambia 1 Kazakhstan 5 Ireland 1 Total
Qatar 5 Latvia 1 Countries 116
CARIBBEAN Afghanistan 4 Portugal 1 Students 4,041
8 countries, 14 students Iraq 4 Serbia 1
Bahamas, The 4 Lebanon 4 Malta 1
Dominica 2 Armenia 2 Montenegro 1
Antigua and Barbuda 2 Bahrain 1
Dominican Republic 2 Cambodia 1
Jamaica 1 Burma 1
Saint Lucia 1 Syria 1
Trinidad & Tobago 1 Uzbekistan 1
Martinique 1
Last Updated: 9-10-2015
Office of Institutional Research (Source: Office of the Registrar)

Enrollment by Race/Ethnicity1, 2, 3
Fall Semester Headcount and Percent by Level
LEVEL AND RACE/ETHNICITY NUMBER % NUMBER % NUMBER % NUMBER % NUMBER %Undergraduate 24,343 25,553 27,659 28,893 30,034
Black or African American 637 2.6% 659 2.6% 693 2.5% 739 2.6% 802 2.7%American Indian/Alaskan Native 47 0.2% 54 0.2% 59 0.2% 66 0.2% 73 0.2%Asian 657 2.7% 705 2.8% 759 2.7% 816 2.8% 875 2.9%Hispanic or Latino of Any Race 882 3.6% 987 3.9% 1,181 4.3% 1,291 4.5% 1,393 4.6%Native Hawaiian/Other Pacific Islander 14 0.1% 24 0.1% 27 0.1% 26 0.1% 28 0.1%Two or More Races 307 1.3% 416 1.6% 533 1.9% 624 2.2% 655 2.2%
Total Minority 2,544 10.5% 2,845 11.1% 3,252 11.8% 3,562 12.3% 3,826 12.7%White 19,105 78.5% 19,908 77.9% 21,197 76.6% 21,910 75.8% 22,584 75.2%International 1,894 7.8% 1,989 7.8% 2,172 7.9% 2,216 7.7% 2,138 7.1%Prefer Not to Respond 800 3.3% 811 3.2% 1,038 3.8% 1,205 4.2% 1,486 4.9%
Vet Med 587 588 586 592 584
Black or African American 1 0.2% 1 0.2% 2 0.3% 1 0.2% 2 0.3%American Indian/Alaskan Native 2 0.3% 1 0.2% 2 0.3% 2 0.3% 2 0.3%Asian 5 0.9% 7 1.2% 11 1.9% 8 1.4% 7 1.2%Hispanic or Latino of Any Race 8 1.4% 11 1.9% 14 2.4% 15 2.5% 17 2.9%Native Hawaiian/Other Pacific Islander 0 0.0% 0 0.0% 0 0.0% 0 0.0% 0 0.0%Two or More Races 2 0.3% 2 0.3% 3 0.5% 4 0.7% 4 0.7%
Total Minority 18 3.1% 22 3.7% 32 5.5% 30 5.1% 32 5.5%White 496 84.5% 502 85.4% 490 83.6% 440 74.3% 439 75.2%International 5 0.9% 3 0.5% 2 0.3% 3 0.5% 4 0.7%Prefer Not to Respond 68 11.6% 61 10.4% 62 10.6% 119 20.1% 109 18.7%
Graduate 4,681 4,607 4,710 4,950 5,096
Black or African American 149 3.2% 128 2.8% 124 2.6% 151 3.1% 139 2.7%American Indian/Alaskan Native 9 0.2% 6 0.1% 6 0.1% 12 0.2% 16 0.3%Asian 91 1.9% 89 1.9% 105 2.2% 116 2.3% 111 2.2%Hispanic or Latino of Any Race 103 2.2% 136 3.0% 139 3.0% 146 2.9% 154 3.0%Native Hawaiian/Other Pacific Islander 1 0.0% 1 0.0% 2 0.0% 5 0.1% 7 0.1%Two or More Races 30 0.6% 28 0.6% 29 0.6% 44 0.9% 41 0.8%
Total Minority 383 8.2% 388 8.4% 405 8.6% 474 9.6% 468 9.2%White 2,563 54.8% 2,498 54.2% 2,497 53.0% 2,493 50.4% 2,493 48.9%International 1,525 32.6% 1,518 32.9% 1,623 34.5% 1,790 36.2% 1,899 37.3%Prefer Not to Respond 210 4.5% 203 4.4% 185 3.9% 193 3.9% 236 4.6%
Total 29,611 30,748 32,955 34,435 35,714
Black or African American 787 2.7% 788 2.6% 819 2.5% 891 2.6% 943 2.6%
American Indian/Alaskan Native 58 0.2% 61 0.2% 67 0.2% 80 0.2% 91 0.3%
Asian 753 2.5% 801 2.6% 875 2.7% 940 2.8% 993 2.8%
Hispanic or Latino of Any Race 993 3.4% 1,134 3.7% 1,334 4.0% 1,452 4.3% 1,564 4.4%
Native Hawaiian/Other Pacific Islander 15 0.1% 25 0.1% 29 0.1% 31 0.1% 35 0.1%
Two or More Races 339 1.1% 446 1.5% 565 1.7% 672 2.0% 700 2.0%
Total Minority 2,945 9.9% 3,255 10.6% 3,689 11.2% 4,066 12.0% 4,326 12.1%
White 22,164 74.9% 22,908 74.5% 24,184 73.4% 24,843 73.4% 25,516 71.4%
International 3,424 11.6% 3,510 11.4% 3,797 11.5% 4,009 11.8% 4,041 11.3%
Prefer Not to Respond 1,078 3.6% 1,075 3.5% 1,285 3.9% 1,517 4.5% 1,831 5.1%
1 Race/ethnicity groups include U.S. citizens, immigrants, and refugees only. International includes non-resident alien students regardless of race/ethnicity affiliation.
2 Beginning Fall 2011, Graduate and Total exclude Post Docs in this table.
3 In previous years, the Prefer not to Respond category was included in the White count.
Office of Institutional Research (Source: Office of the Registrar)Last Updated: 9-10-2015
–––––2011––––– –––––2012––––– –––––2013––––– –––––2014––––– –––––2015–––––

Enrollment by Race/Ethnicity: All Students
Office of Institutional Research (Source: Office of the Registrar)Last Updated: 9-10-2015
0
4,000
8,000
12,000
16,000
20,000
24,000
28,000
2011 2012 2013 2014 2015
EN
RO
LL
ME
NT
FALL TERM
White
Total Minority
International
Prefer Not to
Respond
2010
Last Updated 9/18/2015

Enrollment by Residence Fall Semester Headcount and Percent by Level
LEVEL AND RESIDENCE NUMBER % NUMBER % NUMBER % NUMBER % NUMBER %New Freshmen 5,048 5,366 6,089 6,041 6,231
Iowa Resident2 3,105 61.5% 3,251 60.6% 3,540 58.1% 3,509 58.1% 3,586 57.6%U.S., Non-Iowa Resident 1,712 33.9% 1,865 34.8% 2,188 35.9% 2,240 37.1% 2,369 38.0%International 231 4.6% 250 4.7% 361 5.9% 292 4.8% 276 4.4%
Undergraduate (includes New Freshmen) 24,343 25,553 27,659 28,893 30,034
Iowa Resident 16,552 68.0% 17,050 66.7% 18,009 65.1% 18,478 64.0% 19,285 64.2%U.S., Non-Iowa Resident 5,897 24.2% 6,514 25.5% 7,478 27.0% 8,213 28.4% 8,611 28.7%International 1,894 7.8% 1,989 7.8% 2,172 7.9% 2,202 7.6% 2,138 7.1%
Vet Med 587 588 586 592 584Iowa Resident 260 44.3% 262 44.6% 247 42.2% 243 41.0% 237 40.6%U.S., Non-Iowa Resident 322 54.9% 323 54.9% 337 57.5% 346 58.4% 343 58.7%International 5 0.9% 3 0.5% 2 0.3% 3 0.5% 4 0.7%
Graduate1 4,681 4,607 4,710 4,950 5,096
Iowa Resident 1,714 36.6% 1,610 34.9% 1,594 33.8% 1,539 31.1% 1,542 30.3%U.S., Non-Iowa Resident 1,442 30.8% 1,479 32.1% 1,493 31.7% 1,636 33.1% 1,655 32.5%International 1,525 32.6% 1,518 32.9% 1,623 34.5% 1,775 35.9% 1,899 37.3%
Total1
29,611 30,748 32,955 34,435 35,714
Iowa Resident 18,526 62.6% 18,922 61.5% 19,850 60.2% 20,260 58.8% 21,064 59.0%
U.S., Non-Iowa Resident 7,661 25.9% 8,316 27.0% 9,308 28.2% 10,195 29.6% 10,609 29.7%
International 3,424 11.6% 3,510 11.4% 3,797 11.5% 3,980 11.6% 4,041 11.3%
1 Beginning in Fall 2011, Graduate and Total exclude Post Docs in this table.
2 The Iowa Resident counts includes student veterans or other qualified individuals who were changed to Iowa residents due to Choice Act and/or Home Base Iowa Inititative.
Office of Institutional Research (Source: Office of the Registrar)Last Updated: 9-10-2015
–––––––2013–––––– ––––––2014–––––––––––––2012–––––––––––––2011–––––– –––––––2015–––––––

Enrollment by Residence continued
Office of Institutional Research (Source: Office of the Registrar)Last Updated: 9-10-2015
0
5,000
10,000
15,000
20,000
25,000
2011 2012 2013 2014 2015
Nu
mb
er
of
Stu
den
ts
Total Number of Enrolled Students by Residence
Iowa Resident
U.S., Non-Iowa Resident
International

Enrollment: Undergraduate by College and Classification Fall Semester
COLLEGE 2011 2012 2013 2014 2015Agriculture and Life Sciences 3,584 3,900 4,291 4,475 4,612
Freshmen 791 841 910 923 908Sophomores 750 855 891 972 1,004Juniors 914 990 1,112 1,108 1,197Seniors 1,059 1,114 1,257 1,372 1,392
Specials1
70 100 121 100 111
Business 3,212 3,327 3,687 3,836 4,161Freshmen 623 682 791 781 866Sophomores 700 718 849 810 939Juniors 843 889 934 1,044 1,073Seniors 1,034 1,024 1,090 1,184 1,267
Specials1
12 14 23 17 16
Design 1,798 1,762 1,799 1,775 1,771Freshmen 459 429 448 430 406Sophomores 418 384 379 391 412Juniors 352 374 382 357 391Seniors 555 563 578 585 555
Specials1
14 12 12 12 7
Engineering 5,935 6,495 7,123 7,523 7,949Freshmen 1,764 1,901 2,065 2,110 2,201Sophomores 1,220 1,332 1,498 1,608 1,674Juniors 1,225 1,268 1,437 1,568 1,601
Seniors 1,661 1,907 2,033 2,171 2,433
Specials1
65 87 90 66 40
Human Sciences 3,430 3,707 4,068 4,320 4,290Freshmen 691 781 834 856 748Sophomores 723 814 925 1,003 907Juniors 887 924 1,035 1,095 1,150Seniors 1,108 1,168 1,251 1,336 1,455
Specials1
21 20 23 30 30
Liberal Arts and Sciences 6,384 6,362 6,691 6,964 7,251Freshmen 1,704 1,741 1,865 1,893 1,904Sophomores 1,184 1,234 1,346 1,385 1,472Juniors 1,387 1,353 1,459 1,545 1,646Seniors 1,805 1,772 1,743 1,809 1,919
Specials1
304 262 278 332 310
Total 24,343 25,553 27,659 28,893 30,034
Freshmen 6,032 6,375 6,913 6,993 7,033
Sophomores 4,995 5,337 5,888 6,169 6,408
Juniors 5,608 5,798 6,359 6,717 7,058
Seniors 7,222 7,548 7,952 8,457 9,021
Specials1
486 495 547 557 514
1Special students are non-degree-seeking students.
Office of Institutional Research (Source: Office of the Registrar)Last Updated: 9/11/2015

Enrollment Residency Maps: Undergraduate by Iowa County
Year: 2015 College: All CollegesTerm: Fall Department: All Departments
Level: UGrad
County Enrollment
Adair 55
Adams 25
Allamakee 63
Appanoose 48
Audubon 47
Benton 153
Black Hawk
436
Boone 301
Bremer 120
Buchanan 82
Buena Vista
111
Butler 46
Calhoun 65
Carroll 221
Cass 72
Cedar 81
Cerro Gordo
272
Cherokee 58
Chickasaw 72
Clarke 45
Clay 80
Clayton 78
Clinton 153
Crawford 127
County Enrollment
Dallas 747
Davis 28
Decatur 26
Delaware 117
Des Moines
146
Dickinson 101
Dubuque 317
Emmet 47
Fayette 95
Floyd 99
Franklin 80
Fremont 37
Greene 90
Grundy 85
Guthrie 76
Hamilton 146
Hancock 90
Hardin 132
Harrison 78
Henry 83
Howard 57
Humboldt 71
Ida 44
Iowa 152
County Enrollment
Jackson 84
Jasper 262
Jefferson 58
Johnson 468
Jones 89
Keokuk 36
Kossuth 119
Lee 99
Linn 1,190
Louisa 36
Lucas 36
Lyon 29
Madison 141
Mahaska 97
Marion 235
Marshall 266
Mills 76
Mitchell 84
Monona 32
Monroe 34
Montgomery 40
Muscatine 205
Non-Iowa 10,749
O'Brien 68
Osceola 29
County Enrollment
Page 42
Palo Alto 52
Plymouth 176
Pocahontas 47
Polk 3,967
Pottawattamie 343
Poweshiek 94
Ringgold 25
Sac 63
Scott 723
Shelby 116
Sioux 88
Story 2,130
Tama 93
Taylor 16
Union 53
Van Buren 17
Wapello 94
Warren 414
Washington 112
Wayne 24
Webster 234
Winnebago 68
Winneshiek 110
Woodbury 470
Worth 58
Wright 88
Enrollment3,9671,000350100502510
Office of Institutional Research (Source: e-Data warehouse)Last updated: Nov 3, 2015
Undergraduate Enrollment Iowa Residents 19,285 U.S., Non-Iowa Residents 8,611 International (in Non-Iowa) 2,138 Total 30,034

Enrollment Residency Maps: Undergraduate by State
Year: 2015 College: All CollegesTerm: Fall Department: All Departments
Level: UGrad
State Enrollment
Alabama 5
Alaska 2
Arizona 22
Arkansas 8
California 178
Colorado 98
Connecticut 31
Delaware 3
Florida 46
Georgia 14
Guam 3
Hawaii 10
Idaho 8
Illinois 3,307
Indiana 43
Iowa 19,285
Kansas 112
Kentucky 3
Louisiana 4
State Enrollment
Maine 7
Maryland 19
Massachusetts 21
Michigan 55
Minnesota 2,836
Mississippi 4
Missouri 188
Montana 5
Nebraska 308
Nevada 9
New Hampshire 7
New Jersey 29
New Mexico 4
New York 40
Non-U.S. 2,138
North Carolina 15
North Dakota 11
Not Established Residency
6
Ohio 44
Oklahoma 13
Oregon 3
State Enrollment
Pennsylvania 34
Puerto Rico 108
Rhode Island 2
South Carolina 1
South Dakota 82
Tennessee 9
Texas 236
U.S. Citizen in a Foreign Country
48
Utah 1
Vermont 2
Virgin Islands 4
Virginia 29
Washington 20
Washington, DC 1
West Virginia 1
Wisconsin 506
Wyoming 6
Enrollment19,2855,0001,00020010025101
Office of Institutional Research (Source: e-Data warehouse)Last updated: Nov 3, 2015
Undergraduate Enrollment Iowa Residents 19,285 U.S., Non-Iowa Residents 8,611 International (Non-U.S.) 2,138 Total 30,034

Enrollment Residency Maps: Veterinary Medicine by Iowa County
Year: 2015 College: All CollegesTerm: Fall Department: All Departments
Level: Vet Med
County Enrollment
Adams 2
Allamakee 1
Audubon 1
Benton 2
Black Hawk
11
Bremer 2
Buchanan 5
Buena Vista
3
Calhoun 1
Cass 2
Cedar 1
Cerro Gordo
5
Cherokee 2
Chickasaw 1
Clarke 1
Clay 2
Clayton 4
Clinton 3
Crawford 2
County Enrollment
Dallas 7
Delaware 2
Des Moines
1
Dubuque 10
Floyd 2
Fremont 1
Grundy 1
Guthrie 2
Hamilton 2
Hancock 1
Hardin 2
Harrison 1
Henry 1
Iowa 3
County Enrollment
Jackson 7
Jasper 2
Jefferson 1
Johnson 8
Jones 2
Keokuk 2
Kossuth 2
Linn 14
Marion 1
Marshall 1
Mills 2
Mitchell 1
Montgomery 2
Muscatine 2
Non-Iowa 347
O'Brien 1
County Enrollment
Plymouth 1
Pocahontas 1
Polk 22
Pottawattamie 7
Poweshiek 1
Scott 9
Sioux 4
Story 40
Tama 2
Union 2
Warren 3
Washington 1
Webster 3
Winnebago 1
Winneshiek 2
Woodbury 3
Enrollment
1,0003501005025101
Office of Institutional Research (Source: e-Data warehouse)Last updated: Nov 3, 2015
Veterinary Medicine Enrollment Iowa Resident 237 U.S., Non-Iowa Resident 343 International (in Non-Iowa) 4 Total 584

Enrollment Residency Maps: Veterinary Medicine by State
Year: 2015 College: All CollegesTerm: Fall Department: All Departments
Level: Vet Med
State Enrollment
Arizona 5
California 19
Colorado 8
Connecticut 37
Florida 5
Georgia 1
Hawaii 1
Illinois 8
Indiana 2
Iowa 237
State Enrollment
Maine 2
Maryland 1
Massachusetts 4
Michigan 6
Minnesota 28
Missouri 1
Nebraska 100
New Hampshire 3
New Jersey 2
New Mexico 1
New York 9
Non-U.S. 4
North Carolina 2
North Dakota 19
Ohio 2
Oregon 1
State Enrollment
Pennsylvania 11
Rhode Island 1
South Dakota 35
Tennessee 1
Texas 3
Vermont 1
Virginia 2
Washington 1
Wisconsin 21
Enrollment
5,0001,00020010025101
Office of Institutional Research (Source: e-Data warehouse)Last updated: Nov 3, 2015
Veterinary Medicine Enrollment Iowa Resident 237 U.S., Non-Iowa Resident 343 International (Non-U.S.) 4 Total 584

Retention and Graduation Rates, Freshmen and TransfersFull-Time Fall Entries and Summer Entries Who Continued in Fall
ENTRY TYPE NUMBER AVERAGE ACTAND YEAR ENTERED COMPOSITE 1-YEAR 2-YEAR 3-YEAR 4-YEAR 2-YEAR 3-YEAR 4-YEAR 5-YEAR 6-YEAR 10-YEAR
Freshmen
2003 3,860 24.7 84.7% 77.8% 73.8% 72.7% 1.3% 35.3% 65.1% 69.3% 71.5%2004 3,674 24.7 85.8% 78.0% 75.7% 73.9% 1.0% 36.7% 65.8% 70.2% 72.7%2005 3,745 24.5 83.4% 76.0% 72.8% 70.6% 1.1% 33.3% 62.9% 67.4% 69.8%2006 3,952 24.5 84.9% 77.1% 74.5% 72.5% 1.2% 38.6% 65.6% 70.4%2007 4,316 24.6 83.5% 75.3% 72.6% 71.6% 1.5% 37.6% 63.2% 68.0%2008 4,528 24.8 84.0% 76.3% 73.9% 72.1% 1.6% 39.5% 64.5% 68.9%2009 4,321 25.0 86.0% 78.2% 76.1% 74.1% 1.6% 40.7% 67.7% 71.3%2010 4,532 25.0 87.7% 80.3% 75.8% 75.9% 2.2% 43.2% 68.8%2011 5,023 25.0 85.8% 79.4% 76.9% 74.1% 1.8% 43.6%2012 5,352 25.0 87.1% 80.6% 76.5% 2.2%2013 6,064 25.0 86.4% 79.4%2014 6,010 25.1 87.1%ISU Average 4,615 24.8 85.5% 78.0% 74.9% 73.1% 1.6% 38.7% 65.5% 69.4% 71.3%
Transfers
2003 1,341 77.2% 71.3% 67.8% 66.8% 14.5% 43.8% 59.4% 63.9% 65.5% 66.6%2004 1,369 77.5% 70.6% 69.1% 67.9% 13.7% 43.1% 59.8% 65.7% 67.2% 68.0%2005 1,313 79.1% 72.2% 68.8% 68.3% 12.6% 43.3% 60.4% 64.9% 66.5% 67.6%2006 1,395 78.3% 73.8% 72.0% 71.5% 16.2% 46.5% 63.6% 69.1% 70.3%2007 1,417 80.4% 73.6% 71.5% 71.0% 17.7% 48.7% 63.3% 68.7% 70.0%2008 1,477 80.0% 71.5% 68.4% 55.0% 16.7% 44.8% 60.1% 66.4% 67.3%2009 1,550 80.2% 72.7% 69.1% 67.7% 14.3% 44.4% 59.6% 64.3% 65.8%2010 1,589 80.4% 74.5% 70.8% 69.2% 14.9% 46.1% 62.4% 66.8%2011 1,692 82.2% 75.7% 72.1% 70.7% 15.6% 47.9% 64.8%2012 1,744 80.7% 73.8% 69.6% 15.1%2013 1,945 82.7% 75.2% 14.9%2014 1,892 81.3%ISU Average 1,560 80.0% 73.2% 69.9% 67.6% 15.1% 45.4% 61.5% 66.2% 67.5% 67.4%
1 Retention rate includes students who graduated.
Office of Institutional Research
Last Updated: 9/23/2015
––––––––– RETENTION RATE1––––––––– –––––––––CUMULATIVE GRADUATION RATE––––––––
0.0%
10.0%
20.0%
30.0%
40.0%
50.0%
60.0%
70.0%
80.0%
90.0%
100.0%
2003 2004 2005 2006 2007 2008 2009 2010 2011 2012 2013 2014
Percent
Year
Retention and Graduation Rates for First-Time Full-Time Freshman
1-YEAR RETENTION RATE
4-YEAR CUMULATIVEGRADUATION RATE
5-YEAR CUMULATIVEGRADUATION RATE
6-YEAR CUMULATIVEGRADUATION RATE

1 National average for selective public 4 year Universities: 1 year retention is 82.7%, 4 year graduation is 38%, 6 year graduation is 62.4%. Averages obtained from: ACT (2015). National Collegiate Retention and Persistence to Degree Rates. Retrieved from http://www.act.org/research/policymakers/reports/graduation.html
0%
20%
40%
60%
80%
100%
1-YEAR RETENTION RATE 4-YEAR GRADUATION RATE 6-YEAR GRADUATION RATE
Retention and Graduation by Residency
with National Average Reference Point1
Iowa Resident
U.S., Non-Iowa
Resident
International
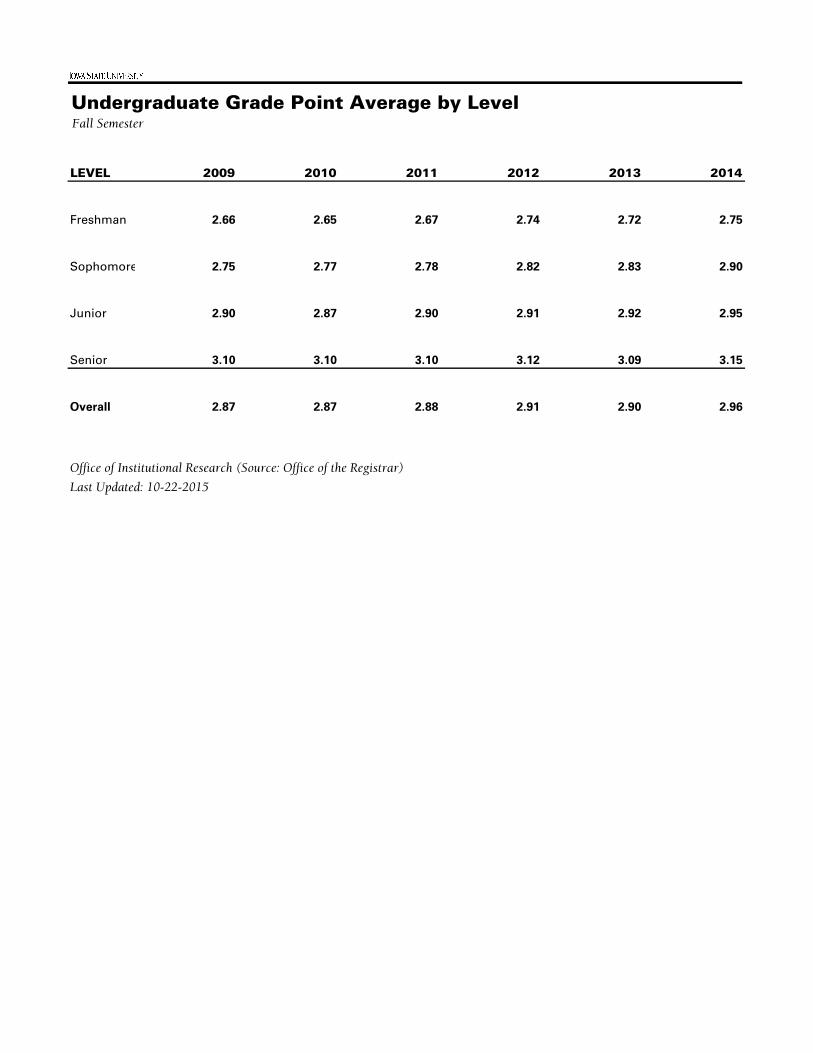
Undergraduate Grade Point Average by LevelFall Semester
LEVEL 2009 2010 2011 2012 2013 2014
Freshman 2.66 2.65 2.67 2.74 2.72 2.75
Sophomore 2.75 2.77 2.78 2.82 2.83 2.90
Junior 2.90 2.87 2.90 2.91 2.92 2.95
Senior 3.10 3.10 3.10 3.12 3.09 3.15
Overall 2.87 2.87 2.88 2.91 2.90 2.96
Office of Institutional Research (Source: Office of the Registrar)
Last Updated: 10-22-2015

Undergraduate Grade Point Average: CumulativeFall 2015
COLLEGE AND GENDER FRESHMAN SOPHOMORE JUNIOR SENIOR TOTAL
Agriculture and Life Sciences 2.66 2.85 2.83 2.98 2.90
Female 2.79 2.94 2.94 3.06 2.99
Male 2.52 2.75 2.73 2.91 2.82
Business 2.67 2.88 2.94 2.97 2.93
Female 2.85 3.05 3.11 3.11 3.09
Male 2.59 2.79 2.84 2.88 2.84
Design 2.74 2.99 3.13 3.15 3.10
Female 2.96 3.04 3.15 3.24 3.17
Male 2.52 2.93 3.10 3.06 3.02
Engineering 2.70 2.93 2.99 3.09 3.01
Female 2.97 3.10 3.06 3.13 3.10
Male 2.65 2.90 2.98 3.08 3.00
Human Sciences 2.82 2.98 3.03 3.14 3.07
Female 2.92 3.06 3.12 3.20 3.14Male 2.47 2.69 2.71 2.92 2.80
Liberal Arts and Sciences 2.60 2.87 2.94 3.06 2.96
Female 2.79 3.00 3.05 3.15 3.07
Male 2.43 2.75 2.83 2.96 2.85
University Total 2.69 2.92 2.97 3.07 2.99
Female 2.88 3.03 3.07 3.15 3.10
Male 2.57 2.83 2.88 3.00 2.91
Office of Institutional Research (Source: Office of the Registrar)Last Updated: 10-22-2015

Learning Communities EnrollmentFall Semester
GROUP 2011 2012 2013 2014 2015Total Enrollment 4,747 4,909 5,434 5,682 5,978Type of Learning Community
Course-Based Only 3,273 3,767 3,685 3,940 3,926Residential Only 19 134 0 0 38Course-Based and Residential 1,105 934 1,289 1,365 1,645Other 350 74 460 377 369
College at Time of Participation
Agriculture 948 937 980 1,135 1,219Business 534 455 435 447 469Design 480 437 515 492 421Engineering 1,454 1,655 1,909 1,926 2,182Human Sciences 651 747 868 924 815Liberal Arts and Sciences 679 677 725 757 872Interdisciplinary 1 0 1 0 0Veterinary Medicine 0 1 1 1 0
Race/Ethnicity
American Indian/Alaskan Native 8 16 13 13 14Asian 136 149 170 179 210Black or African American 138 114 136 141 158Hispanic or Latino of Any Race 261 250 300 280 306Native Hawaiian/Other Pacific Islander 3 7 6 5 8Two or More Races 102 111 134 157 156White 3,816 3,991 4,221 4,396 4,608International 154 139 193 206 166Unknown 129 132 261 305 352
GenderFemale 2,149 2,223 2,462 2,538 2,693Male 2,598 2,686 2,872 3,144 3,285
Office of Institutional Research (Source: Office of the Registrar)

Learning Communities Retention and Graduation Rates
YEAR OF NUMBER AVERAGEADMITTANCE ADMITTED ACT 1-YEAR 2-YEAR 4-YEAR 5-YEAR 6-YEAR
2007 Learning Community 2,366 25.4 87.4% 80.8% 40.2% 69.1% 73.9%
Non-Learning Community 1,588 23.9 78.7% 68.7% 34.4% 55.9% 60.7%
2008 Learning Community 2,931 25.2 86.7% 79.5% 40.3% 67.5% 72.2%
Non-Learning Community 1,596 23.9 79.0% 70.3% 37.9% 58.9% 62.9%
2009 Learning Community 2,902 25.4 88.6% 81.1% 41.2% 70.6% 74.6%
Non-Learning Community 1,408 24.1 80.5% 72.2% 39.5% 61.8% 64.7%
2010 Learning Community 3,225 25.4 89.8% 83.0% 43.7% 71.5%
Non-Learning Community 1,307 23.8 82.7% 73.4% 41.9% 62.4%
2011 Learning Community 3,574 25.3 87.3% 81.7% 45.3%
Non-Learning Community 1,453 23.9 82.0% 73.7% 39.4%
2012 Learning Community 3,691 25.4 88.4% 82.4%
Non-Learning Community 1,662 24.0 84.3% 76.5%
2013 Learning Community 4,191 25.4 88.1% 81.3%
Non-Learning Community 1,872 24.1 82.5% 75.3%
2014 Learning Community 4,338 25.4 88.7%
Non-Learning Community 1,672 24.2 82.7%
2015 Learning Community 4,231 25.6
Non-Learning Community 1,799 24.3
Office of Institutional Research (Source: Office of the Registrar)
–––––––RETENTION RATE–––––– –––––––––GRADUATION RATE–––––––––

Study AbroadFiscal Year 2015 (Summer 2014 through Spring 2015)
Undergraduate Graduate TotalCollege
Enrollment
% of Enrollment
Abroad CountryNumber
Visiting Country
Agriculture & Life Sciences 391 13 404 5,375 7.5% Italy 320
Business 181 27 208 4,485 4.6% United Kingdom 199
Design 241 15 256 1,984 12.9% Spain 162
Engineering 230 2 232 9,312 2.5% multi-destination 111
Human Sciences 205 16 221 4,987 4.4% China 93
Graduate College 0 1 1 404 0.2% Costa Rica 85
Liberal Arts & Sciences 280 3 283 8,437 3.4% Australia 53
Veterinary Medicine 0 54 54 146 37.0% Germany 48
Total1 1,528 131 1,659 35,130 4.7% New Zealand 48
Ireland 43
Participation by Gender: Female = 66.8%; Male = 33.2%
Total Number of Countries Visited: 58
1Total does not include Post Docs in this table.
Last Updated: 10/5/2015
Office of Institutional Research (Source: Study Abroad Center)
–––––––TOP 10 COUNTRIES VISITED–––––––––––––––––––––––––––––––––––––––––––––––PARTICIPATION BY COLLEGE–––––––––––––––––––––––––––––––––––––––––

Degrees Awarded by Level
1 Bachelor's degrees are counted only once for undergraduate students with more than one major.
Office of Institutional Research (Source: Office of the Registrar)
rev 9-24-2015
106 113144 147
893
810
926878
281 316376
321
0
100
200
300
400
500
600
700
800
900
1,000
2005-2006 2008-2009 2011-2012 2014-2015
DE
GR
EE
S
Master's
Doctorate
Vet Med
4,614
4,129
4,881
5,682
0
1,000
2,000
3,000
4,000
5,000
6,000
2005-2006 2008-2009 2011-2012 2014-2015
DE
GR
EE
S
Bachelor's1
Bachelor's1
81%
Vet Med2%
Master's12%
Doctorate 5%
2014-2015

Degrees Awarded by Levelcontinued
YEAR BACHELOR'S1 VET MED MASTER'S SPECIALIST
2DOCTORATE TOTAL
3
1872-1983 103,622 4,021 17,676 23 7,685 133,027
1983-1984 3,876 116 593 4 228 4,817
1984-1985 4,050 114 660 3 245 5,072
1985-1986 4,195 108 597 4 256 5,160
1986-1987 4,301 119 643 1 296 5,360
1987-1988 4,159 113 669 6 309 5,256
1988-1989 4,041 106 676 3 267 5,093
1989-1990 3,891 101 718 4 282 4,996
1990-1991 3,906 90 744 3 297 5,040
1991-1992 3,837 65 725 3 278 4,908
1992-1993 3,948 71 785 3 322 5,129
1993-1994 3,938 73 793 4 307 5,115
1994-1995 3,795 86 785 2 318 4,986
1995-1996 3,817 99 773 2 287 4,978
1996-1997 3,845 91 769 2 255 4,962
1997-1998 3,876 100 827 2 300 5,105
1998-1999 3,818 94 774 2 257 4,945
1999-2000 4,039 99 758 2 238 5,136
2000-2001 4,019 97 769 3 232 5,120
2001-2002 4,163 98 802 239 5,302
2002-2003 4,481 96 805 228 5,610
2003-2004 4,523 104 818 228 5,673
2004-2005 4,679 93 858 246 5,876
2005-2006 4,614 106 893 281 5,894
2006-2007 4,269 97 752 296 5,414
2007-2008 4,404 105 787 308 5,604
2008-2009 4,129 113 810 316 5,368
2009-2010 4,429 120 800 301 5,650
2010-2011 4,540 144 873 358 5,915
2011-2012 4,881 144 926 376 6,327
2012-2013 5,047 142 783 349 6,321
2013-2014 5,385 147 837 347 6,716
2014-2015 5,682 147 878 321 7,028
All Years 240,199 7,419 42,356 76 16,853 299,875
1 Bachelor's degrees are counted only once for undergraduate students with more than one major.
2 Specialist degree was added in 1978-1979 and discontinued in 2001-2002.
3 Honorary degrees are not included.
Office of Institutional Research (Source: Office of the Registrar)
rev 9-24-2015

Degrees Awarded by Gender
2010-2011 2011-2012 2012-2013 2013-2014 2014-2015
Bachelor's1 4,540 4,881 5,047 5,385 5,682
Females 2,125 2,292 2,344 2,517 2,640Percent 46.8% 47.0% 46.4% 46.7% 46.5%
Males 2,415 2,589 2,703 2,868 3,042
Master's 873 926 783 837 878Females 398 401 357 396 394
Percent 45.6% 43.3% 45.6% 47.3% 44.9%Males 475 525 426 441 484
Doctorate 358 376 349 347 321Females 151 138 137 140 121
Percent 42.2% 36.7% 39.3% 40.3% 37.7%Males 207 238 212 207 200
Vet Med 144 144 142 147 147Females 110 104 93 105 110
Percent 76.4% 72.2% 65.5% 71.4% 74.8%Males 34 40 49 42 37
Total 5,915 6,327 6,321 6,716 7,028
Females 2,784 2,935 2,931 3,158 3,265
Percent 47.1% 46.4% 46.4% 47.0% 46.5%
Males 3,131 3,392 3,390 3,558 3,763
1 Bachelor's degrees are counted only once for undergraduate students with more than one major.
Office of Institutional Research (Source: Office of the Registrar)
rev. 9-23-2015
46.8%
47.0%
46.4%
46.7%
46.5%
53.2%
53.0%
53.6%
53.3%
53.5%
0% 20% 40% 60% 80% 100%
2010-2011
2011-2012
2012-2013
2013-2014
2014-2015
Females MalesBachelor's1
45.6%
43.3%
45.6%
47.3%
44.9%
54.4%
56.7%
54.4%
52.7%
55.1%
0% 20% 40% 60% 80% 100%
2010-2011
2011-2012
2012-2013
2013-2014
2014-2015
Females MalesMaster's
42.2%
36.7%
39.3%
40.3%
37.7%
57.8%
63.3%
60.7%
59.7%
62.3%
0% 20% 40% 60% 80% 100%
2010-2011
2011-2012
2012-2013
2013-2014
2014-2015
Females MalesDoctorate
76.4%
72.2%
65.5%
71.4%
74.8%
23.6%
27.8%
34.5%
28.6%
25.2%
0% 20% 40% 60% 80% 100%
2010-2011
2011-2012
2012-2013
2013-2014
2014-2015
Females MalesVet Med
47.1%
46.4%
46.4%
47.0%
46.5%
52.9%
53.6%
53.6%
53.0%
53.5%
0% 20% 40% 60% 80% 100%
2010-2011
2011-2012
2012-2013
2013-2014
2014-2015
Females MalesTotal

Degrees Awarded by Race/Ethnicity1, 2
NUMBER % NUMBER % NUMBER % NUMBER % NUMBER %
Bachelor's3
4,540 4,881 5,047 5,385 5,682
Black or African American 95 2.1% 90 1.8% 100 2.0% 107 2.0% 116 2.0%American Indian/Alaskan Native 7 0.2% 5 0.1% 18 0.4% 5 0.1% 6 0.1%Asian 150 3.3% 133 2.7% 126 2.5% 128 2.4% 151 2.7%Hispanic or Latino of Any Race 131 2.9% 127 2.6% 148 2.9% 154 2.9% 203 3.6%Native Hawaiian/Other Pacific Islander 0 0.0% 0 0.0% 3 0.1% 3 0.1% 5 0.1%Two or More Races 17 0.4% 25 0.5% 41 0.8% 58 1.1% 100 1.8%
Total Minority 400 8.8% 380 7.8% 436 8.6% 455 8.4% 581 10.2%White 3,767 83.0% 4,028 82.5% 4,034 79.9% 4,291 79.7% 4,471 78.7%International 212 4.7% 297 6.1% 420 8.3% 439 7.7% 459 8.1%Prefer Not to Respond 161 3.5% 176 3.6% 157 3.1% 200 3.5% 171 3.0%
Master's 873 926 783 837 878
Black or African American 19 2.2% 27 2.9% 18 2.3% 23 2.7% 22 2.5%American Indian/Alaskan Native 0 0.0% 2 0.2% 1 0.1% 1 0.1% 0 0.0%Asian 22 2.5% 24 2.6% 10 1.3% 13 1.6% 23 2.6%Hispanic or Latino of Any Race 17 1.9% 19 2.1% 17 2.2% 27 3.2% 29 3.3%Native Hawaiian/Other Pacific Islander 0 0.0% 0 0.0% 0 0.0% 1 0.1% 0 0.0%Two or More Races 5 0.6% 3 0.3% 6 0.8% 4 0.5% 9 1.0%
Total Minority 63 7.2% 75 8.1% 52 6.6% 69 8.2% 83 9.5%White 571 65.4% 586 63.3% 501 64.0% 523 62.5% 504 57.4%International 202 23.1% 225 24.3% 191 24.4% 219 24.9% 257 29.3%Prefer Not to Respond 37 4.2% 40 4.3% 39 5.0% 26 3.0% 34 3.9%
Doctorate 358 376 349 347 321
Black or African American 6 1.7% 9 2.4% 10 2.9% 11 3.2% 7 2.2%American Indian/Alaskan Native 0 0.0% 0 0.0% 1 0.3% 0 0.0% 1 0.3%Asian 3 0.8% 6 1.6% 5 1.4% 6 1.7% 7 2.2%Hispanic or Latino of Any Race 10 2.8% 1 0.3% 4 1.1% 5 1.4% 9 2.8%Native Hawaiian/Other Pacific Islander 0 0.0% 0 0.0% 0 0.0% 0 0.0% 0 0.0%Two or More Races 0 0.0% 3 0.8% 1 0.3% 0 0.0% 3 0.9%
Total Minority 19 5.3% 19 5.1% 21 6.0% 22 6.3% 27 8.4%White 132 36.9% 165 43.9% 145 41.5% 125 36.0% 119 37.1%International 182 50.8% 174 46.3% 162 46.4% 185 57.6% 161 50.2%Prefer Not to Respond 25 7.0% 18 4.8% 21 6.0% 15 4.7% 14 4.4%
Veterinary Medicine 144 144 142 147 147
Black or African American 0 0.0% 0 0.0% 0 0.0% 1 0.7% 0 0.0%American Indian/Alaskan Native 0 0.0% 1 0.7% 0 0.0% 0 0.0% 1 0.7%Asian 1 0.7% 0 0.0% 0 0.0% 3 2.0% 2 1.4%Hispanic or Latino of Any Race 6 4.2% 1 0.7% 2 1.4% 1 0.7% 4 2.7%Native Hawaiian/Other Pacific Islander 0 0.0% 0 0.0% 0 0.0% 0 0.0% 0 0.0%Two or More Races 1 0.7% 1 0.7% 0 0.0% 0 0.0% 0 0.0%
Total Minority 8 5.6% 3 2.1% 2 1.4% 5 3.4% 7 4.8%White 123 85.4% 112 77.8% 129 90.8% 124 84.4% 128 87.1%International 0 0.0% 2 1.4% 2 1.4% 0 0.0% 1 0.7%Prefer Not to Respond 13 9.0% 27 18.8% 9 6.3% 18 12.2% 11 7.5%
Total 5,915 6,327 6,321 6,716 7,028
Black or African American 120 2.0% 126 2.0% 128 2.0% 142 2.1% 145 2.1%
American Indian/Alaskan Native 7 0.1% 8 0.1% 20 0.3% 6 0.1% 8 0.1%
Asian 176 3.0% 163 2.6% 141 2.2% 150 2.2% 183 2.6%
Hispanic or Latino of Any Race 164 2.8% 148 2.3% 171 2.7% 187 2.8% 245 3.5%
Native Hawaiian/Other Pacific Islander 0 0.0% 0 0.0% 3 0.0% 4 0.1% 5 0.1%
Two or More Races 23 0.4% 32 0.5% 48 0.8% 62 0.9% 112 1.6%
Total Minority 490 8.3% 477 7.5% 511 8.1% 551 8.2% 698 9.9%
White 4,593 77.7% 4,891 77.3% 4,809 76.1% 5,063 75.4% 5,222 74.3%
International 596 10.1% 698 11.0% 775 12.3% 843 12.0% 878 12.5%
Prefer Not to Respond 236 4.0% 261 4.1% 226 3.6% 259 3.7% 230 3.3%
2 'Prefer Not to Respond' is included with 'White' in prior years.
3 Bachelor's degrees are counted only once for undergraduate students with more than one major.
Office of Institutional Research (Source: Office of the Registrar)
Last Updated: 9-24-2015
––––2013-2014––––––––2012-2013––––––––2010-2011––––
1 Beginning in 2009-2010, the ethnic group 'Asian or Pacific Islander' was split into two groups; the group 'Two or More Races' was added and the
names of several ethnic groups were revised. Hispanic or Latino includes students that may have been previously counted in other groups.
––––2014-2015––––––––2011-2012––––
5.8%7.4% 8.0% 8.8%
0%
5%
10%
2003-2005 2007-2009 2011-2013
Academic Years
Percent Total Minority, Three-Year Rolling Average
2013-2015

Tuition and Mandatory Fees Academic Year
2011-2012 2012-2013 2013-2014 2014-2015 2015-2016
Undergraduate Resident1
$ 6,408 $ 6,648 $ 6,648 $ 6,648 $ 6,648
AST/I Tech--Upper Division $ 6,992 $ 7,838 $ 8,422 $ 8,814 $ 8,814Architecture $ 7,048 $ 7,448 $ 7,848 $ 7,848Business--Upper Division $ 7,990 $ 8,290 $ 8,290 $ 8,290 $ 8,290Engineering--Upper Division $ 8,494 $ 8,814 $ 8,814 $ 8,814 $ 8,814
Undergraduate Non-Resident $18,280 $18,760 $19,200 $19,534 $19,768
AST/I Tech--Upper Division $18,864 $19,944 $20,996 $21,654 $21,914Architecture $19,160 $20,010 $20,758 $21,008Business--Upper Division $19,844 $20,364 $20,842 $21,204 $21,458Engineering--Upper Division $20,264 $20,796 $21,284 $21,654 $21,914
Graduate Resident $ 7,476 $ 7,756 $ 7,848 $ 7,990 $ 8,130
Architecture $ 8,156 $ 8,654 $ 9,210 $ 9,372Business $ 9,076 $ 9,416 $ 9,528 $ 9,700 $ 9,870Engineering $ 8,616 $ 8,940 $ 9,046 $ 9,210 $ 9,372Seed Tech. & Business $ 9,774 $10,134 $ 9,528 $ 9,700 $ 9,870
Graduate Non-Resident $19,192 $19,696 $20,158 $20,804 $21,054
Architecture $20,096 $20,968 $22,038 $22,302Business $20,792 $21,338 $21,840 $22,538 $22,808Engineering $20,280 $20,814 $21,304 $21,986 $22,250Seed Tech. & Business $21,492 $22,074 $21,840 $22,538 $22,808
Veterinary Medicine Resident $17,456 $18,504 $19,152 $20,014 $20,654
Veterinary Medicine--4th year2 $25,803 $27,351 $28,308 $29,583 $30,531
Veterinary Medicine Non-Resident $39,990 $41,390 $42,840 $44,768 $46,200
Veterinary Medicine--4th year2 $48,039 $49,719 $51,459 $53,775 $55,494
Undergraduate and Veterinary Medicine $ 1,078 $ 1,078 $ 1,078 $ 1,083 $ 1,088
Graduate $ 1,032 $ 1,032 $ 1,032 $ 1,037 $ 1,042
Undergraduate Resident1
$ 7,486 $ 7,726 $ 7,726 $ 7,736 $ 7,736
AST/I Tech--Lower Division $ 7,702 $ 7,942 $ 7,942 $ 7,952 $ 7,952AST/I Tech--Upper Division $ 8,286 $ 9,132 $ 9,716 $10,118 $10,118Architecture $ 8,126 $ 8,526 $ 8,931 $ 8,936Business--Lower Division $ 7,526 $ 7,766 $ 7,766 $ 7,771 $ 7,776Business--Upper Division $ 9,108 $ 9,408 $ 9,408 $ 9,413 $ 9,418Engineering--Lower Division $ 7,702 $ 7,942 $ 7,942 $ 7,947 $ 7,952Engineering--Upper Division $ 9,788 $10,108 $10,108 $10,113 $10,118
Total Tuition and Mandatory Fees1, 3
Tuition1
Mandatory Fees3

Tuition and Mandatory Feescontinued
2011-2012 2012-2013 2013-2014 2014-2015 2015-2016
Undergraduate Non-Resident $19,358 $19,838 $20,278 $20,617 $20,856
AST/I Tech--Lower Division $19,574 $20,054 $20,494 $20,833 $21,072AST/I Tech--Upper Division $20,158 $21,238 $22,290 $22,953 $23,218Architecture $20,238 $21,088 $21,841 $22,096Business--Lower Division $19,398 $19,878 $20,318 $20,657 $20,896Business--Upper Division $20,962 $21,482 $21,960 $22,327 $22,586Engineering--Lower Division $19,574 $20,054 $20,494 $20,833 $21,072Engineering--Upper Division $21,558 $22,090 $22,578 $22,953 $23,218
Graduate Resident $ 8,508 $ 8,788 $ 8,880 $ 9,027 $ 9,172
Architecture $ 9,188 $ 9,686 $10,247 $10,414Business $10,148 $10,488 $10,600 $10,777 $10,952Engineering $ 9,910 $10,234 $10,340 $10,509 $10,676Seed Tech. & Business $10,806 $11,166 $10,600 $10,777 $10,952
Graduate Non-Resident $20,224 $20,728 $21,190 $21,841 $22,096
Architecture $21,128 $22,000 $23,075 $23,344Business $21,864 $22,410 $22,912 $23,615 $23,890Engineering $21,574 $22,108 $22,598 $23,285 $23,554Seed Tech. & Business $22,524 $23,106 $22,912 $23,615 $23,890
Veterinary Medicine Resident $18,534 $19,582 $20,230 $21,097 $21,742
Veterinary Medicine--4th year2 $27,093 $28,641 $29,598 $30,880 $31,834
Veterinary Medicine Non-Resident $41,068 $42,468 $43,918 $45,851 $47,288
Veterinary Medicine--4th year2 $49,329 $51,009 $52,749 $55,072 $56,797
ADDITIONAL RESOURCES:
1 An undergraduate resident tuition increase for Spring 2016 was approved in September 2015 by the Board of Regents. This special tuition increase is not included in the rates listed above. Increase amount by discipline: general undergraduate, $100; Business upper division, $125; Engineering upper division, $133; AST/I Tech upper division, $133; Architecture, $118.
2 Academic Year for Veterinary Medicine 4th year students consists of Summer, Fall, and Spring terms.3 The following majors are charged additional computer fees.
2011-2012 2012-2013 2013-2014 2014-2015 2015-2016
Business (ugrad and grad) $ 40 $ 40 $ 40 $ 40 $ 40Computer Science (ugrad) $216 $216 $216 $216 $216Engineering, AST, & I Tech (ugrad) $216 $216 $216 $216 $216Computer Science (grad) $262 $262 $262 $262 $262Engineering (grad) $262 $262 $262 $262 $262
Mandatory fees for 2015-2016: building, $55; technology, $230 (ugrad) or $184 (grad); health, $196; health facilities, $16; student activities, $73; student services, $196; and recreation , $322; for a total of $1,088 (ugrad) or $1,042 (grad). Pre-Business students pay the standard technology fee. A fee refund of $89.95 (for full-time students)was issued during Fall 2011 term as an adjustment for delayed availability of new/remodeled recreation facilities. The Vet Med Mobile Computing fee ($2,550), charged to all first year Vet Med students, is not included above.
Office of Institutional ResearchLast Updated: 12-01-2015
Tuition & Fees, Office of the Registrar
Total Tuition and Mandatory Fees3 (continued)

Estimated Cost of Attendance for Undergraduate Residents Academic Year
Tuition and Fees2 $7,486 $7,726 $7,726 $7,731 $7,736
Room Rates $3,993 $4,093 $4,093 $4,154 $4,279
Double Room/Double Occupancy
Board Rates $3,628 $3,628 $3,628 $3,676 $3,791
Books and Supplies $1,044 $1,043 $1,043 $1,043 $1,034
Transportation3 $400 $401 $400 $400 $400
Medical and Dental3 $235 $242 $240 $240 $240
Miscellaneous/Personal3 $1,735 $1,787 $1,790 $1,790 $1,790
Estimated Total $18,521 $18,920 $18,920 $19,034 $19,270
ADDITIONAL RESOURCES:
2 An undergraduate resident tuition increase for Spring 2016 was approved in September 2015 by the Board of Regents. This special tuition increase is not included in the rates listed above. Increase amount by discipline: general undergraduate, $100; Business upper division, $125; Engineering upper division, $133; AST/I Tech upper division, $133; Architecture, $118.
Office of Institutional Research (Source: Department of Residence, ISU Dining, Office of Student Financial Aid)
Last updated: 12-1-2015
2013-2014
ISU Dining
225 Meals per semester (ave. 14/week) and $200 Dining Dollars
2012-2013 2011-20121
3 Amounts are based in part on a survey conducted by the Financial Aid Office. Miscellaneous/Personal includes clothing, laundry, meals not covered in dining contract, personal items and other miscellaneous expenses that are used to calculate need for Financial Aid purposes.
1 A fee refund of $89.95 (not reflected in this report) was issued during Fall 2011 term as an adjustment for delayed availability of new/remodeled recreation facilities.
2015-2016
Tuition & Fees, Office of the Registrar
Department of Residence
2014-2015
$7,486 $7,726 $7,726 $7,731 $7,736
$18,521 $18,920 $18,920 $19,034 $19,270
$0
$5,000
$10,000
$15,000
$20,000
$25,000
2011-2012 2012-2013 2013-2014 2014-2015 2015-2016
Tuition and Fees
Estimated Total

Student Financial Aid ProgramsAcademic Year Awards by Type
NUMBER AVERAGE NUMBER AVERAGE
STUDENT AID PROGRAM OF AWARDS AMOUNT AWARD OF AWARDS AMOUNT AWARD
Scholarships 49,710 $126,004,932 $2,534 50,572 $133,970,045 $2,649
Institutional Need Based Scholarships 22,074 $48,139,590 $2,180 22,400 $50,603,100 $2,259
Institutional Academic and Talent Scholarships 10,660 $43,145,132 $4,047 11,526 $46,310,946 $4,017
Federal Graduate Fellowships and Assistantships 975 $4,365,407 $4,477 989 $4,235,204 $4,282
Corporate/Private Scholarships 15,925 $29,857,817 $1,874 15,589 $32,379,406 $2,077
Robert D. Blue Scholarship 0 $0 $0 0 $0 $0
Bureau of Indian Affairs 0 $0 $0 2 $7,459 $3,729
All Iowa Opportunity Scholarships 76 $496,986 $6,539 66 $433,930 $6,574
Grants 9,919 $35,686,709 $3,597 10,864 $38,010,533 $3,498
Federal Pell Grant 6,373 $24,286,248 $3,810 6,466 $25,017,731 $3,869
Other Federal Grant/Scholarship Programs 708 $3,594,433 $5,076 1,069 $4,562,738 $4,268
Federal Supplemental Education Opportunity Grant 1,358 $634,431 $467 1,800 $640,900 $356
IMAGES Grant 482 $2,734,861 $5,673 486 $2,770,837 $5,701
Iowa Grant 145 $126,505 $872 148 $126,240 $852
Vocational Rehabilitation 278 $687,345 $2,472 281 $976,210 $3,474
Commission for the Blind 3 $11,141 $3,713 5 $23,181 $4,636
Reserve Officer Training Corp (ROTC) 110 $1,575,934 $14,326 108 $1,634,812 $15,137
Other State Grants 127 $445,920 $3,511 141 $550,783 $3,906
National Guard Tuition Aid Program 225 $1,220,082 $5,422 236 $1,275,338 $5,403
All Iowa Foster Care Grant 6 $15,267 $2,544 8 $27,440 $3,430
Federal Teach Grant 104 $354,542 $3,409 116 $404,323 $3,485
Loans 33,512 $181,175,483 $5,406 34,742 $187,411,818 $5,394
ISU Long-term 80 $182,801 $2,285 159 $289,659 $1,821
Federal Perkins 3,126 $3,434,963 $1,098 3,095 $3,506,897 $1,133
Federal Health Professions 165 $552,650 $3,349 167 $725,300 $4,343
Federal Loans for Disadvantaged Students 35 $34,000 $971 29 $29,000 $1,000
Direct Loans 27,969 $157,544,410 $5,632 28,866 $161,090,714 $5,580
Alternative Loans 2,137 $19,426,659 $9,090 2,426 $21,770,248 $8,973
Employment 16,163 $71,743,553 $4,438 17,194 $78,289,803 $4,553
Federal Graduate Fellowships and Assistantships 1,167 $13,918,574 $11,926 1,191 $14,291,868 $11,999
Federal Work Study 1,421 $1,344,951 $946 1,579 $1,201,135 $760
ISU Graduate Teaching and Research Assistantships 2,550 $34,416,485 $13,496 2,733 $39,163,540 $14,329
ISU Employment 11,025 $22,063,543 $2,001 11,691 $23,633,260 $2,021
TOTAL 109,304 $414,610,677 $3,793 113,372 $437,682,199 $3,860
Office of Institutional Research (Source: Office of Student Financial Aid)
Last Updated: 11-23-2015
–––––––––––––––––2014-2015––––––––––––––––––––––––––––––––––2013-2014–––––––––––––––––
$347,128,984 $362,496,018 $382,482,149 $396,092,553
$414,610,677 $437,682,199
$-
$50,000,000
$100,000,000
$150,000,000
$200,000,000
$250,000,000
$300,000,000
$350,000,000
$400,000,000
$450,000,000
$500,000,000
2010 2011 2012 2013 2014 2015
Total Financial Aid Dollars Awarded to ISU Students

Fact Book 2015‐2016
ALUMNI

Alumni by College Fall 2015 Living Alumni
COLLEGE NUMBER1
PERCENT
Agriculture and Life Sciences 45,266 17.5%
Business 34,417 13.3%
Design 16,328 6.3%
Engineering 44,663 17.2%
Human Sciences2 42,881 16.6%
Liberal Arts and Sciences 66,865 25.8%
Vet Med 4,762 1.8%
Interdisciplinary 3,911 1.5%
Total 259,093 100.0%
1 Alumni are counted in the college of their first degree. Alumni receiving degrees in two or more colleges in the year of their first degree are counted in each college.
2 Includes College of Education and College of Family and Consumer Sciences graduates.
Office of Institutional Research (Source: ISU Foundation)Last Updated: 9-21-2015
45,266
34,417
16,328
44,66342,881
66,865
4,762 3,911
0
20,000
40,000
60,000
80,000

Alumni by StateFall 2015 Living Alumni
Last Updated: 9-22-2015Offi ce of Institutional Research (Source: ISU Foundation)
Totals:Iowa 99,716U.S. excluding Iowa 129,865 Alaska 332 Hawaii 341U.S. Armed Forces 229U.S. Territories 220Foreign Countries 5,505Unknown address 7,332 Grand Total 242,867
-2,000 14,000
Count
Map based on Longitude (generated) and Latitude (generated). Color shows sum of Count. Details are shown for State. The view is filtered on State, which excludes Alaska and Hawaii.

Alumni Outside the United StatesFall 2015 Living Alumni
Afghanistan 1 Colombia 36 Ireland 15 Oman 4 Togo 1
Algeria 4 Congo 2 Israel 24 Pakistan 87 Trinidad and Tobago 12
Anguilla 1 Costa Rica 31 Italy 12 Panama 17 Tunisia 10
Argentina 44 Croatia 1 Jamaica 4 Peru 35 Turkey 65
Armenia 1 Cyprus 28 Japan 146 Philippines 29 Uganda 3
Australia 92 Czech Republic 10 Jordan 29 Poland 6 Ukraine 4
Austria 10 Denmark 12 Kazakhstan 4 Portugal 9 United Arab Emirates 25
Bahamas 9 Dominica 1 Kenya 36 Qatar 3 United Kingdom of Great
Bahrain 3 Dominican Republic 2 Korea, South 398 Romania 4 Britain and Northern Ireland
Bangladesh 11 Ecuador 9 Kuwait 11 Russia 7 England 110
Barbados 3 Egypt 55 Krygyzstan 1 Rwanda 1 Northern Ireland 2
Belgium 12 El Salvador 5 Latvia 1 Saudi Arabia 38 Scotland 11
Belize 1 Ethiopia 5 Lebanon 5 Senegal 2 Wales 5
Bermuda 2 Finland 8 Lesotho 1 Serbia and Monteneg 4 Uruguay 18
Bolivia 22 France 31 Libya 1 Singapore 141 Uzbekistan 2
Botswana 15 Gambia 3 Luxembourg 2 Slovakia 2 Venezuela 73
Brazil 65 Germany 76 Malawi 4 Slovenia 1 Vietnam 3
Bulgaria 1 Ghana 12 Malaysia 767 Solomon Islands 1 Yemen 2
Burkina Faso 3 Greece 41 Mali 0 South Africa 12 Zambia 8
Burundi 1 Grenada 1 Mauritius 5 Spain 25 Zimbabwe 13
Cambodia 1 Guatemala 23 Mexico 98 Sri Lanka 11 Total
Cameroon 5 Guinea 1 Moldova 1 St. Kitts and Nevis 1 Countries 131
Canada 418 Guyana 6 Morocco 9 Sudan 10 Living Alumni 5,505
Cape Verde 4 Honduras 15 Namibia 4 Swaziland 5
Cayman Islands 1 Hungary 2 Netherlands 25 Sweden 15
Chile 15 Iceland 1 Netherlands Antille 1 Switzerland 29
China India 187 New Zealand 25 Syria 7
People's Rep. of 366 Indonesia 344 Nicaragua 7 Taiwan 460 Hong Kong 169 Iran 19 Nigeria 70 Tanzania 9
Macau 1 Iraq 1 Norway 48 Thailand 160
Office of Institutional Research (Source: ISU Foundation)Last Updated: 9-21-2015
COUNTRY AND NUMBER OF LIVING ALUMNI WITH KNOWN ADDRESSES

Post-Graduation Status of 2013-2014 Bachelor's Degree Recipients1
FURTHER NOT
COLLEGE EMPLOYED2
IN IOWA3
PROF.4
EDUCATION5
PLACED6
SEEKING7 SEEKING
Agriculture and Life Sciences 906 884 97.6% 690 495 644 180 870 10 4Percent Respondents 78.1% 71.7% 93.3% 20.4% 98.4% 1.1% 0.5%
Business 872 796 91.3% 657 327 617 86 743 45 8Percent Respondents 82.5% 49.8% 93.9% 10.8% 93.3% 5.7% 1.0%
Design 342 285 83.3% 242 118 221 33 275 8 2Percent Respondents 84.9% 48.8% 91.3% 11.6% 96.5% 2.8% 0.7%
Engineering 1,122 791 70.5% 618 225 617 151 769 22 0Percent Respondents 78.1% 36.4% 99.8% 19.1% 97.2% 2.8% 0.0%
Human Sciences 865 809 93.5% 580 360 528 157 737 71 1Percent Respondents 71.7% 62.1% 91.0% 19.4% 91.1% 8.8% 0.1%
Liberal Arts and Sciences 1,193 964 80.8% 637 368 592 258 895 57 12Percent Respondents 66.1% 57.8% 92.9% 26.8% 92.8% 5.9% 1.2%
Total 5,300 4,529 85.5% 3,424 1,893 3,219 865 4,289 213 27
Percent Respondents 75.6% 55.3% 94.0% 19.1% 94.7% 4.7% 0.6%
1 Summary of graduates' first destinations; information from college Career Services offices' follow-up surveys conducted within six months after graduation.
2 Graduates responding to survey who had obtained full-time or part-time/temporary positions.3 Some non-Iowa employment locations may be for initial training but position assignments to be in Iowa.4 Employed graduates securing professional or major-related employment regardless of location. 5 Graduates responding to survey who were pursuing further education.6 Graduates responding to survey who were either employed or pursuing further education (excludes non-respondents).7 Graduates responding to survey who were seeking major-related positions.
Office of Institutional Research (Source: Career Planning and Placement Services)
Last Updated: 9-23-2015
––––EMPLOYED––––NUMBER OF
GRADUATES
SURVEY
RESPONDENTS
0
200
400
600
800
1,000
1,200
Agriculture and
Life Sciences
Business Design Engineering Human
Sciences
Liberal Arts and
Sciences
Number of Graduates by Category
Further Education
Employed
No Informaton

Fact Book 2015‐2016
FACULTY & STAFF

Employee Headcount and FTE1 by Classification October Payroll
EMPLOYEE CLASSIFICATION 2006 2007 2008 2009 2010 2011 2012 2013 2014 2015
Headcount
Faculty 1,709 1,676 1,723 1,746 1,740 1,766 1,845 1,869 1,892 1,973
Academic/Administrative 10 3 8 6 2 2 6 4 1 2 without Faculty Rank2
Professional and Scientific 2,458 2,540 2,598 2,606 2,445 2,522 2,599 2,701 2,795 2,908
Contract3 95 96 97 90 92 95 95 98 100 99
Merit 1,784 1,768 1,742 1,673 1,513 1,470 1,458 1,445 1,431 1,406
Pre/Post Doctoral 260 283 278 300 308 331 307
Graduate Assistants 2,733 2,784 2,738 2,538 2,515 2,470 2,477 2,559 2,748 2,827
Temp Hourly (Student & Non-student) 5,054 5,062 5,468 5,520 5,430 5,824 6,431 6,670 6,970 7,125
All Employees 13,843 13,929 14,374 14,439 14,020 14,427 15,211 15,654 16,268 16,647
Full-Time Equivalent (FTE)
Faculty 1,583 1,554 1,603 1,628 1,609 1,629 1,694 1,725 1,766 1,849
Academic/Administrative 8 2 8 6 1 2 6 4 1 2 without Faculty Rank3
Professional and Scientific 2,378 2,455 2,515 2,523 2,370 2,441 2,515 2,622 2,712 2,834
Contract3 76 76 76 75 78 80 80 82 85 88
Merit 1,699 1,691 1,668 1,613 1,457 1,424 1,408 1,395 1,380 1,361
Pre/Post Doctoral 296 318 293
Graduate Assistants 1,444 1,470 1,444 1,487 1,495 1,462 1,479 1,239 1,317 1,354
Temp Hourly (Student & Non-student) 2 1,317 1,326 1,278 1,277 1,310 1,431 1,597 1,568 1,615 1,656
All Employees 8,505 8,574 8,592 8,609 8,320 8,469 8,780 8,931 9,195 9,4371 FTE is based on the appointment fraction of each employee.
2 FTE for non-hourly employees is based on annual fractional appointment and is not based on funding source. FTE for hourly employeesis based on the pay periods, Sept. 16-30 and Oct. 1-15. Hours worked for both pay periods are summed and divided by the total hours in the pay periods.
3 These employees include visiting scientists and an administrator with faculty classification but no academic rank.
Office of Institutional Research
Last Updated 11/16/2015
0
2,000
4,000
6,000
8,000
10,000
12,000
14,000
16,000
18,000
2006 2007 2008 2009 2010 2011 2012 2013 2014 2015
Headcount and FTE of ISU Employees
Headcount FTE

Employee Headcount and FTE by College1,2
October Payroll
COLLEGE AND EMPLOYEE TYPE Count FTE Count FTE Count FTECollege of Agriculture & Life Sciences 1,151 923.76 1,204 946.41 1,202 971.40
Tenured & Tenure Eligible Faculty 249 245.93 259 240.65 258 253.65Non Tenure Eligible Faculty 57 46.21 61 52.16 65 57.59Professional & Scientific 314 302.27 320 306.12 342 332.26Contract 2 0.50 4 1.75 2 1.17Merit 49 47.92 43 41.92 39 38.42Post Doctoral Research Associates 80 79.25 92 88.50 85 82.37Graduate Assistants 400 201.68 425 215.31 411 205.94
College of Business 216 166.91 250 184.78 269 199.00Tenured & Tenure Eligible Faculty 77 75.25 83 80.25 85 83.25Non Tenure Eligible Faculty 24 18.43 24 20.58 31 25.25Professional & Scientific 42 41.55 40 38.90 46 45.45Contract 0 0.00 0 0.00 0 0.00Merit 8 7.80 8 7.80 6 5.80Post Doctoral Research Associates 0 0.00 0 0.00 0 0.00Graduate Assistants 65 23.88 95 37.25 101 39.25
College of Design 280 189.34 311 201.94 315 206.59Tenured & Tenure Eligible Faculty 84 81.17 90 88.19 97 95.27Non Tenure Eligible Faculty 46 38.13 39 32.07 39 29.85Professional & Scientific 32 28.84 33 30.18 36 33.72Contract 0 0.00 0 0.00 0 0.00Merit 3 3.00 4 4.00 4 4.00Post Doctoral Research Associates 2 1.70 1 1.00 2 2.00Graduate Assistants 113 36.50 144 46.50 137 41.75
College of Engineering 1,078 741.31 1,229 847.92 1,341 923.21Tenured & Tenure Eligible Faculty 187 183.60 197 194.63 209 206.53Non Tenure Eligible Faculty 52 45.93 58 50.42 64 55.63
Professional & Scientific 150 147.34 210 202.16 220 212.18Contract 4 1.78 4 1.73 3 2.60Merit 21 21.00 23 22.50 28 26.50Post Doctoral Research Associates 47 44.62 52 50.70 56 51.72Graduate Assistants 617 297.04 685 325.78 761 368.05
College of Human Sciences 679 503.61 614 453.64 632 472.30Tenured & Tenure Eligible Faculty 111 110.14 120 119.00 131 130.50Non Tenure Eligible Faculty 77 49.66 76 55.59 74 53.56Professional & Scientific 176 166.03 122 115.46 134 128.33Contract 4 1.93 2 1.47 0 0.00Merit 41 34.18 22 19.65 21 19.10Post Doctoral Research Associates 5 4.25 8 7.30 7 6.75Graduate Assistants 265 137.42 264 135.17 265 134.06
College of Liberal Arts and Sciences 1,872 1,333.77 1,921 1,365.78 1,996 1,432.76Tenured & Tenure Eligible Faculty 437 430.15 435 431.50 456 451.67Non Tenure Eligible Faculty 221 163.94 233 179.46 235 184.67Professional & Scientific 166 160.73 176 169.17 220 211.95Contract 4 0.86 4 0.96 7 5.49Merit 56 53.25 55 52.75 55 53.17Post Doctoral Research Associates 75 71.60 70 67.17 55 52.50Graduate Assistants 913 453.24 948 464.77 968 473.31
Continued on Next Page
20152013 2014

Employee Headcount and FTE by College1,2
October Payroll
COLLEGE AND EMPLOYEE TYPE Count FTE Count FTE Count FTECollege of Veterinary Medicine 529 479.28 536 484.14 576 519.43
Tenured & Tenure Eligible Faculty 110 107.48 104 101.42 112 109.65Non Tenure Eligible Faculty 76 70.25 76 70.40 73 69.00Professional & Scientific 144 140.00 151 146.97 166 159.88Contract 2 2.00 1 1.00 1 0.20Merit 105 97.65 112 103.95 116 109.45Post Doctoral Research Associates 35 33.65 32 30.40 36 33.75Graduate Assistants 57 28.25 60 30.00 72 37.50
Library 122 118.55 117 113.25 117 113.63Tenured & Tenure Eligible Faculty 21 21.00 17 16.60 16 15.60Non Tenure Eligible Faculty 1 1.00 0 0.00 0 0.00Professional & Scientific 39 38.25 43 42.35 47 46.35Contract 0 0.00 1 1.00 0 0.00Merit 61 58.30 56 53.30 54 51.68Post Doctoral Research Associates 0 0.00 0 0.00 0 0.00Graduate Assistants 0 0.00 0 0.00 0 0.00
Total Academic Units2
5,927 4,456.53 6,182 4,597.86 6,448 4,838.32Tenured & Tenure Eligible Faculty 1,276 1,254.72 1,305 1,272.24 1,364 1,346.12Non Tenure Eligible Faculty 554 434 567 460.68 581 475.55Professional & Scientific 1,063 1,025.01 1,095 1,051.31 1,211 1,170.12Contract 16 7.07 16 7.91 13 9.46Merit 344 323.10 323 305.87 323 308.12Post Doctoral Research Associates 244 235.07 255 245.07 241 229.09Graduate Assistants 2,430 1,178.01 2,621 1,254.78 2,715 1,299.86
3These employees include visiting scientists and an adminstrator with faculty classification but no academic rank.
Office of Institutional Research
Last Updated 11/20/2015
1 Beginning in 2013 counts include all faculty and other employees in the college where they work (home department - where their primary office is located). For 2013, FTE is based on the fraction of each person's annual appointment in their home department and includes all employees whether or not they were paid in October. This matches data found in the e-Data warehouse.For more information on headcount and FTE calculations, contact Sandra Gahn in the Office of Institutional Research.
2FTE and headcount reported elsewhere in the Fact Book does not match the total here because this page excludes non-college units, e.g., President, Extension, Ames Lab, etc.
––––2014––––––––2013–––– ––––2014––––

Employee Age by Classification October Payroll 2015
EMPLOYEE CLASSIFICATION UNDER 2020-29
YEARS30-39
YEARS40-49
YEARS50-59
YEARS60-69
YEARS70 or MORE Total
Headcount
Faculty 0 52 486 495 480 395 65 1,973
Academic/Administrative 0 0 1 0 0 0 1 2 without Faculty Rank1 0
Professional and Scientific 0 370 769 614 729 413 13 2,908
Contract 0 18 35 17 8 12 9 99
Merit 1 107 182 208 525 371 12 1,406
Pre/Post Doctoral 0 49 219 32 5 2 0 307
Graduate Assistants 0 2,141 584 77 20 3 2 2,827
Temp Hourly (Student & Non-student) 1,423 5,383 95 48 51 85 39 7,124
All Employees 1,424 8,120 2,371 1,491 1,818 1,281 141 16,6461
These employees include visiting scientists and an administrator with faculty classification but no academic rank.
Office of Institutional Research
Last Updated 11/25/2015
0%
10%
20%
30%
40%
50%
60%
70%
80%
90%
100%
Faculty Professionaland Scientific
Contract Merit Pre/PostDoctoral
GraduateAssistants
Percent of Employee Category by Age Group
70+ YEARS
60-69 YEARS
50-59 YEARS
40-49 YEARS
30-39 YEARS
20-29 YEARS

Employees: Full-Time and Part-Time1
October Payroll Headcount and Percent
EMPLOYEE GROUP NUMBER % NUMBER % NUMBER % NUMBER % NUMBER %
Faculty
Tenured 1,007 1,028 1,013 1,003 1,020
Full-Time 951 962 960 963 979Part-Time 56 5.6% 66 6.4% 53 5.2% 40 4.0% 41 4.0%
Tenure Eligible 286 303 293 315 369
Full-Time 283 301 291 314 368Part-Time 3 1.0% 2 0.7% 2 0.7% 1 0.3% 1 0.3%
Total Tenured and Tenure Eligible 1,293 1,331 1,306 1,318 1,389
Full-Time 1,234 1,263 1,251 1,277 1,347Part-Time 59 4.6% 68 5.1% 55 4.2% 41 3.1% 42 3.0%
Non Tenure Eligible 473 514 563 574 584
Full-Time 248 269 297 321 333Part-Time 225 47.6% 245 47.7% 266 47.2% 253 44.1% 251 43.0%
Total Faculty 1,766 1,845 1,869 1,892 1,973
Full-Time 1,482 1,532 1,548 1,598 1,680Part-Time 284 16.1% 313 17.0% 321 17.2% 294 15.5% 293 14.9%
Academic/Administrative
without Faculty Rank3
2 6 4 1 2
Full-Time 2 6 4 1 2Part-Time 0 0.0% 0 0.0% 0 0.0% 0 0.0% 0 0.0%
Professional and Scientific 2,522 2,599 2,701 2,795 2,908
Full-Time 2,307 2,365 2,505 2,596 2,736Part-Time 215 8.5% 234 9.0% 196 7.3% 199 7.1% 172 5.9%
Contract 95 95 98 100 99
Full-Time 71 68 74 77 81Part-Time 24 25.3% 27 28.4% 24 24.5% 23 23.0% 18 18.2%
Merit 1,470 1,458 1,445 1,431 1,406
Full-Time 1,293 1,287 1,349 1,342 1,330Part-Time 177 12.0% 171 11.7% 96 6.6% 89 6.2% 76 5.4%
Pre/Post Doc Research Associates 278 300 308 331 307Full-Time 249 269 277 301 274Part-Time 29 10.4% 31 10.3% 31 10.1% 30 9.1% 33 10.7%
Student and Part-Time Employees
Graduate Teaching Assistant 745 774 871 948 995
Graduate Research Assistant 1,504 1,463 1,413 1,509 1,494
Combination Graduate Teachingand Research Assistant and Other 221 240 275 291 338
Total Graduate Assistants 2,470 2,477 2,559 2,748 2,827
Student Hourly Employee 5,379 5,990 6,219 6,648 6,784
Non-Student Hourly Employee 445 441 451 322 341
Total University Employees 14,427 15,211 15,654 16,268 16,647
N/A 4 5
1 Part-time employees have employment bases of less than 100% in the month of October.2 Beginning in 2013, data match the numbers reported in the eData warehouse.3 These employees include visiting scientists and an administrator with faculty classification but no academic rank.
4 Employees listed as N/A in eData are counted in eData reports but never completed the hiring process and therefore should be excluded from totals.
Office of Institutional ResearchLast Updated: 11/25/2015
––––2014–––– ––––2015–––– ––––2013 2–––– ––––2012–––– ––––2011––––

Employees by Gender and Race/Ethnicity October 2015 Headcount
Faculty & Acad./Admin.
Without Rank1Professional& Scientific Contract Merit Post Doctoral
GraduateAssistants Total
Women
Minority2 147 157 3 50 54 530 941
White 637 1,449 28 748 50 612 3,524
Total Women 784 1,606 31 798 104 1,142 4,465
Men
Minority2 300 168 13 32 137 930 1,580
White 891 1,134 55 576 66 755 3,477
Total Men 1,191 1,302 68 608 203 1,685 5,057
Total
Minority2 447 325 16 82 191 1,460 2,521
White 1,528 2,583 83 1,324 116 1,367 7,001
Grand Total 1,975 2,908 99 1,406 307 2,827 9,522
1Academic & Administrative without rank include visiting scientists and administrators with faculty classification but no academic rank.2Minority include all non-white races and ethnicities including international employees.
Office of Institutional Research
Last Updated 12/7/2015
0
200
400
600
800
1,000
1,200
1,400
1,600
Faculty Professional& Scientific
Contract Merit Post Doctoral GraduateAssistants
Employees by Race/Ethnicity, Gender & Employment Type, 2015
Minority Women
White Women
Minority Men
White Men

Employees by Gender October Payroll Headcount and Percent
EMPLOYEE GROUP NUMBER % NUMBER % NUMBER % NUMBER % NUMBER %Faculty
Tenured 1,007 1,028 1,013 1,003 1,020
Female 265 26.3% 282 27.4% 283 27.9% 277 27.6% 287 28.1%Male 742 746 730 726 733
Tenure Eligible 286 303 293 315 369
Female 116 40.6% 133 43.9% 124 42.3% 143 45.4% 167 45.3%Male 170 170 169 172 202Total Tenured and Tenure Eligible 1,293 1,331 1,306 1,318 1,389
Female 381 29.5% 415 31.2% 407 31.2% 420 31.9% 454 32.7%Male 912 916 899 898 935
Non Tenure Eligible 473 514 563 574 584
Female 273 57.7% 286 55.6% 310 55.1% 324 56.4% 330 56.5%Male 200 228 253 250 254
Total Faculty 1,766 1,845 1,869 1,892 1,973
Female 654 37.0% 701 38.0% 717 38.4% 744 39.3% 784 39.7%Male 1,112 1,144 1,152 1,148 1,189
Academic/Administrative
without Faculty Rank1
2 6 4 1 2
Female 0 0.0% 1 16.7% 1 25.0% 0 0.0% 0 0.0%Male 2 5 3 1 2
Professional and Scientific 2,522 2,599 2,701 2,795 2,908
Female 1,384 54.9% 1,427 54.9% 1,488 55.1% 1,554 55.6% 1,606 55.2%Male 1,138 1,172 1,213 1,241 1,302
Contract 95 95 98 100 99
Female 30 31.6% 30 31.6% 31 31.6% 31 31.0% 31 31.3%Male 65 65 67 69 68
Merit 1,470 1,458 1,445 1,431 1,406
Female 875 59.5% 852 58.4% 832 57.6% 824 57.6% 798 56.8%Male 595 606 613 607 608
1 These employees include visiting scientists and an administrator with faculty classification but no academic rank.
Office of Institutional Research
Last Updated 11/19/2015
––––––––2015–––––––– ––––––––2011–––––––– ––––––––2012–––––––– ––––––––2013–––––––– ––––––––2014––––––––
0%
10%
20%
30%
40%
50%
60%
70%
80%
90%
100%
Tenured & Tenure-Eligible Faculty
Non-TenuredFaculty
Professional &Scientific
Merit Contract
Employee Groups by Gender, 2015
Male
Female

Employees by Race/Ethnicity October Payroll Headcount and Percent
EMPLOYEE GROUP NUMBER % NUMBER % NUMBER % NUMBER % NUMBER %
Faculty
Tenured 1,007 1,028 1,013 1,003 1,020
African American 15 1.5% 18 1.8% 17 1.7% 16 1.6% 17 1.7%American Indian/Alaskan Native 5 0.5% 5 0.5% 4 0.4% 3 0.3% 2 0.2%Asian 153 15.2% 165 16.1% 170 16.8% 178 17.7% 180 17.6%Hispanic 17 1.7% 20 1.9% 21 2.1% 22 2.2% 26 2.5%Native Hawaiian/Pacific Islander 0 0.0% 0 0.0% 0 0.0% 1 0.1% 1 0.1%Two or More Races 1 0.1% 0 0.0% 0 0.0% 0 0.0% 0 0.0%
Total Minority 191 19.0% 208 20.2% 212 20.9% 220 21.9% 226 22.2%White 816 81.0% 820 79.8% 801 79.1% 783 78.1% 794 77.8%
Tenure Eligible 286 303 293 315 369
African American 8 2.8% 8 2.6% 8 2.7% 13 4.1% 15 4.1%American Indian/Alaskan Native 0 0.0% 0 0.0% 1 0.3% 1 0.3% 1 0.3%Asian 62 21.7% 62 20.5% 60 20.5% 71 22.5% 89 24.1%Hispanic 13 4.5% 13 4.3% 11 3.8% 14 4.4% 16 4.3%Native Hawaiian/Pacific Islander 1 0.3% 1 0.3% 1 0.3% 0 0.0% 0 0.0%Two or More Races 2 0.7% 2 0.7% 1 0.3% 2 0.6% 4 1.1%
Total Minority 86 30.1% 86 28.4% 82 28.0% 101 32.1% 125 33.9%White 200 69.9% 217 71.6% 211 72.0% 214 67.9% 244 66.1%
Total Tenured and Tenure Eligible 1,293 1,331 1,306 1,318 1,389
African American 23 1.8% 26 2.0% 25 1.9% 29 2.2% 32 2.3%American Indian/Alaskan Native 5 0.4% 5 0.4% 5 0.4% 4 0.3% 3 0.2%Asian 215 16.6% 227 17.1% 230 17.6% 249 18.9% 269 19.4%Hispanic 30 2.3% 33 2.5% 32 2.5% 36 2.7% 42 3.0%Native Hawaiian/Pacific Islander 1 0.1% 1 0.1% 1 0.1% 1 0.1% 1 0.1%Two or More Races 3 0.2% 2 0.2% 1 0.1% 2 0.2% 4 0.3%
Total Minority 277 21.4% 294 22.1% 294 22.5% 321 24.4% 351 25.3%White 1,016 78.6% 1,037 77.9% 1,012 77.5% 997 75.6% 1,038 74.7%
Non Tenure Eligible 473 514 563 574 584
African American 12 2.5% 13 2.5% 14 2.5% 14 2.4% 14 2.4%American Indian/Alaskan Native 1 0.2% 2 0.4% 1 0.2% 2 0.3% 1 0.2%Asian 40 8.5% 39 7.6% 46 8.2% 48 8.4% 51 8.7%Hispanic 17 3.6% 20 3.9% 20 3.6% 22 3.8% 25 4.3%Native Hawaiian/Pacific Islander 0 0.0% 0 0.0% 0 0.0% 0 0.0% 0 0.0%Two or More Races 3 0.6% 2 0.4% 3 0.5% 4 0.7% 4 0.7%
Total Minority 73 15.4% 76 14.8% 84 14.9% 90 15.7% 95 16.3%White 400 84.6% 438 85.2% 479 85.1% 484 84.3% 489 83.7%
Total Faculty 1,766 1,845 1,869 1,892 1,973
African American 35 2.0% 39 2.1% 39 2.1% 43 2.3% 46 2.3%American Indian/Alaskan Native 6 0.3% 7 0.4% 6 0.3% 6 0.3% 4 0.2%Asian 255 14.4% 266 14.4% 276 14.8% 297 15.7% 320 16.2%Hispanic 47 2.7% 53 2.9% 52 2.8% 58 3.1% 67 3.4%Native Hawaiian/Pacific Islander 1 0.1% 1 0.1% 1 0.1% 1 0.1% 1 0.1%Two or More Races 6 0.3% 4 0.2% 4 0.2% 6 0.3% 8 0.4%
Total Minority 350 19.8% 370 20.1% 378 20.2% 411 21.7% 446 22.6%White 1,416 80.2% 1,475 79.9% 1,491 79.8% 1,481 78.3% 1,527 77.4%
Academic/Administrative
without Faculty Rank1
2 6 4 1 2
African American 0 0.0% 0 0.0% 0 0.0% 0 0.0% 0 0.0%American Indian/Alaskan Native 0 0.0% 0 0.0% 0 0.0% 0 0.0% 0 0.0%Asian 1 50.0% 3 50.0% 2 50.0% 0 0.0% 1 50.0%Hispanic 0 0.0% 0 0.0% 0 0.0% 0 0.0% 0 0.0%Native Hawaiian/Pacific Islander 0 0.0% 0 0.0% 0 0.0% 0 0.0% 0 0.0%Two or More Races 0 0.0% 0 0.0% 0 0.0% 0 0.0% 0 0.0%
Total Minority 1 50.0% 3 50.0% 2 50.0% 0 0.0% 1 50.0%White 1 50.0% 3 50.0% 2 50.0% 1 100.0% 1 50.0%
Continued on the next page
––––2015–––– ––––2012–––– ––––2014–––– ––––2013–––– ––––2011––––

Employees by Race/Ethnicity continued
EMPLOYEE GROUP NUMBER % NUMBER % NUMBER % NUMBER % NUMBER %
Professional and Scientific 2,522 2,599 2,701 2,795 2,908
African American 45 1.8% 47 1.8% 53 2.0% 61 2.2% 63 2.2%American Indian/Alaskan Native 3 0.1% 4 0.2% 1 0.0% 3 0.1% 3 0.1%Asian 158 6.3% 166 6.4% 174 6.4% 176 6.3% 185 6.4%Hispanic 52 2.1% 57 2.2% 50 1.9% 49 1.8% 58 2.0%Native Hawaiian/Pacific Islander 0 0.0% 1 0.0% 1 0.0% 1 0.0% 1 0.0%Two or More Races 2 0.1% 5 0.2% 10 0.4% 11 0.4% 15 0.5%
Total Minority 260 10.3% 280 10.8% 289 10.7% 301 10.8% 325 11.2%White 2,262 89.7% 2,319 89.2% 2,412 89.3% 2,494 89.2% 2,583 88.8%
Contract 95 95 98 100 99
African American 9 9.5% 9 9.5% 9 9.2% 11 11.0% 11 11.1%American Indian/Alaskan Native 0 0.0% 0 0.0% 0 0.0% 0 0.0% 0 0.0%Asian 1 1.1% 0 0.0% 1 1.0% 0 0.0% 0 0.0%Hispanic 2 2.1% 2 2.1% 1 1.0% 1 1.0% 2 2.0%Native Hawaiian/Pacific Islander 0 0.0% 0 0.0% 0 0.0% 1 1.0% 2 2.0%Two or More Races 1 1.1% 0 0.0% 0 0.0% 0 0.0% 0 0.0%
Total Minority 13 13.7% 11 11.6% 11 11.2% 13 13.0% 15 15.2%White 82 86.3% 84 88.4% 87 88.8% 87 87.0% 84 84.8%
Merit 1,470 1,458 1,445 1,431 1,406
African American 20 1.4% 20 1.4% 23 1.6% 24 1.7% 22 1.6%American Indian/Alaskan Native 6 0.4% 6 0.4% 6 0.4% 9 0.6% 7 0.5%Asian 23 1.6% 22 1.5% 22 1.5% 24 1.7% 26 1.8%Hispanic 20 1.4% 20 1.4% 21 1.5% 24 1.7% 23 1.6%Native Hawaiian/Pacific Islander 0 0.0% 0 0.0% 0 0.0% 0 0.0% 1 0.1%Two or More Races 3 0.2% 3 0.2% 2 0.1% 1 0.1% 3 0.2%
Total Minority 72 4.9% 71 4.9% 74 5.1% 82 5.7% 82 5.8%White 1,398 95.1% 1,387 95.1% 1,371 94.9% 1,349 94.3% 1,324 94.2%
Total 5,855 6,003 6,117 6,219 6,388
African American 109 1.9% 115 1.9% 124 2.0% 139 2.2% 142 2.2%American Indian/Alaskan Native 15 0.3% 17 0.3% 13 0.2% 18 0.3% 14 0.2%Asian 438 7.5% 457 7.6% 475 7.8% 497 8.0% 532 8.3%Hispanic 121 2.1% 132 2.2% 124 2.0% 132 2.1% 150 2.3%Native Hawaiian/Pacific Islander 1 0.0% 2 0.0% 2 0.0% 3 0.0% 5 0.1%Two or More Races 12 0.2% 12 0.2% 16 0.3% 18 0.3% 26 0.4%
Total Minority 696 11.9% 735 12.2% 754 12.3% 807 13.0% 869 13.6%White 5,159 88.1% 5,268 87.8% 5,363 87.7% 5,412 87.0% 5,519 86.4%
1 These employees include visiting scientists and an administrator with faculty classification but no academic rank.
Office of Institutional ResearchLast Updated: 11-11-2015See next page for charts
––––2015–––– ––––2012–––– ––––2014–––– ––––2013–––– ––––2011––––

0
100
200
300
400
500
600
2005 2006 2007 2008 2009 2010 2011 2012 2013 2014 2015
Headcount of Minority Employees, 2005-2015
African American
Amer Indian/Alaska Native
Asian
Hispanic
Native Hawaiian/PacificIslander

0
1000
2000
3000
4000
5000
6000
2005 2006 2007 2008 2009 2010 2011 2012 2013 2014 2015
Headcount of Minority Employees, 2005-2015
Minority
White

Faculty by Highest Degree October Payroll Headcount
NUMBER % NUMBER % NUMBER % NUMBER % NUMBER %Tenured 1,007 1,028 1,013 1,003 1,020
Doctorate 892 88.6% 915 89.0% 906 89.4% 907 90.4% 944 92.5%Master's 82 8.1% 81 7.9% 78 7.7% 71 7.1% 71 7.0%Professional 31 3.1% 30 2.9% 27 2.7% 23 2.3% 3 0.3%Bachelor's 2 0.2% 2 0.2% 2 0.2% 2 0.2% 2 0.2%Not Available 0 0.0% 0 0.0% 0 0.0% 0 0.0% 0 0.0%
Tenure Eligible 286 303 293 315 369
Doctorate 263 92.0% 277 91.4% 266 90.8% 275 87.3% 342 92.7%Master's 15 5.2% 18 5.9% 16 5.5% 28 8.9% 25 6.8%Professional 8 2.8% 8 2.6% 11 3.8% 10 3.2% 2 0.5%Bachelor's 0 0.0% 0 0.0% 0 0.0% 2 0.7% 0 0.0%Not Available 0 0.0% 0 0.0% 0 0.0% 0 0.0% 0 0.0%
Total Tenured and Tenure Eligible 1,293 1,331 1,306 1,318 1,389
Doctorate 1,155 89.3% 1,192 89.6% 1,172 89.7% 1,182 89.7% 1,286 92.6%Master's 97 7.5% 99 7.4% 94 7.2% 99 7.5% 96 6.9%Professional 39 3.0% 38 2.9% 38 2.9% 33 2.5% 5 0.4%Bachelor's 2 0.2% 2 0.2% 2 0.2% 4 0.3% 2 0.1%Not Available 0 0.0% 0 0.0% 0 0.0% 0 0.0% 0 0.0%
Non Tenure Eligible 473 514 563 574 584
Doctorate 186 39.3% 198 38.5% 224 39.8% 234 40.8% 297 50.9%Master's 212 44.8% 239 46.5% 257 45.6% 261 45.5% 268 45.9%Professional 62 13.1% 64 12.5% 69 12.3% 60 10.5% 4 0.7%Bachelor's 10 2.1% 12 2.3% 11 2.0% 14 2.4% 15 2.6%Not Available 3 0.6% 1 0.2% 2 0.4% 5 0.9% 0 0.0%
Total Faculty 1,766 1,845 1,869 1,892 1,973
Doctorate 1,341 75.9% 1,390 75.3% 1,396 74.7% 1,416 74.8% 1,583 80.2%
Master's 309 17.5% 338 18.3% 351 18.8% 360 19.0% 364 18.4%
Professional 101 5.7% 102 5.5% 107 5.7% 93 4.9% 9 0.5%
Bachelor's 12 0.7% 14 0.8% 13 0.7% 18 1.0% 17 0.9%
Not Available 3 0.2% 1 0.1% 2 0.1% 5 0.3% 0 0.0%
Office of Institutional ResearchLast Updated: 11-17-2015
––––––––2015––––––––––––––––2012––––––––––––––––2011–––––––– ––––––––2013–––––––– ––––––––2014––––––––
0%
10%
20%
30%
40%
50%
60%
70%
80%
90%
100%
Doctorate Master's Professional Bachelor's
Per
cen
t of
Fac
ult
y
Highest Degree by Tenure Status, 2015
Tenured & Tenure-Eligible
Non-Tenure Eligible

Faculty by Rank and Tenure October Payroll Headcount
2006 2007 2008 2009 2010 2011 2012 2013 2014 2015
Tenured 985 984 987 1,018 1,008 1,007 1,028 1,013 1,003 1,020
Distinguished Professor1 39 39 38 39 41 40 41 41 42 44
University Professor2 40 38 39 40 41 40 40 39 37 37
Morrill Professor3 0 0 0 0 0 0 0 3 6 9
Professor 483 491 498 504 499 503 518 502 486 494
Associate Professor 408 404 401 425 418 416 422 423 427 431
Assistant Professor 15 12 11 10 9 8 7 5 5 5
Tenure Eligible 328 308 327 328 300 286 303 293 315 369
Professor 1 1 1 1 1 0 0 0 0 0
Associate Professor 14 16 14 10 8 6 8 7 6 7
Assistant Professor 313 291 312 317 291 280 295 286 309 362
Total Tenured and Tenure Eligible 1,313 1,292 1,314 1,346 1,308 1,293 1,331 1,306 1,318 1,389
Distinguished Professor 39 39 38 39 41 40 41 41 42 44University Professor 40 38 39 40 41 40 40 39 37 37Morrill Professor 0 0 0 0 0 0 0 3 6 9
Professor 484 492 499 505 500 503 518 502 486 494
Associate Professor 422 420 415 435 426 422 430 430 433 438
Assistant Professor 328 303 323 327 300 288 302 291 314 367
Non Tenure Eligible 396 384 409 400 432 473 514 563 574 584
Professor 9 4 5 5 10 7 10 13 9 7
Associate Professor 10 7 7 9 9 9 9 10 13 21
Assistant Professor 27 25 26 24 40 47 46 48 51 47
Instructor 38 37 42 40 39 37 38 39 34 34
Lecturer/Clinician 312 311 329 322 334 373 411 453 467 475
Total Faculty 1,709 1,676 1,723 1,746 1,740 1,766 1,845 1,869 1,892 1,973
Distinguished Professor 39 39 38 39 41 40 41 41 42 44
University Professor 40 38 39 40 41 40 40 39 37 37
Morrill Professor 0 0 0 0 0 0 0 3 6 9
Professor 493 496 504 510 510 510 528 515 495 501
Associate Professor 432 427 422 444 435 431 439 440 446 459
Assistant Professor 355 328 349 351 340 335 348 339 365 414
Instructor 38 37 42 40 39 37 38 39 34 34
Lecturer/Clinician 312 311 329 322 334 373 411 453 467 475
Office of Institutional ResearchLast Updated: 11-17-2015
1The Distinguished Professorship is bestowed on faculty members who have outstanding accomplishments in their research and/or creative activities that have had a significant impact on their fields of expertise. 2The University Professorship is bestowed on faculty members who have made outstanding contributions to ISU that have significantly changed and improved ISU.3The Morrill Professorship is bestowed on faculty members who have demonstrated outstanding and sustained success in teaching and learning in undergraduate, graduate and/or Extension/outreach programs.
200
400
600
800
1,000
1,200
2006 2007 2008 2009 2010 2011 2012 2013 2014 2015
Number of Faculty by Tenure Status
Tenured Tenure-Eligible Non-Tenure Eligible

Professional and Scientific Employees by Grade1, Contract Employees, and Merit Employees by Category October Payroll Headcount
EMPLOYEE GROUP 2010 2011 2012 2013 2014 2015
Professional P29 2 8 6 5 8 5
and Scientific P30 135 138 136 127 126 107
P31 130 126 131 132 129 135
P32 419 441 449 484 493 513
P33 416 417 446 472 500 526
P34 332 337 342 339 338 337
P35 360 379 398 429 447 487
P36 237 250 260 265 284 297
P37 231 248 241 253 265 280
P38 98 90 96 97 108 127
P39 41 44 48 51 48 49
P40 34 34 35 36 38 36
P41 10 10 11 11 11 9
Total P& S 2,445 2,522 2,599 2,701 2,795 2,908
Number with Faculty Rank 116 110 106 109 124 108
Contract 92 95 95 98 100 99
Number with Faculty Rank 15 7 13 13 17 10
Merit Blue Collar 612 633 661 669 670 668
Clerical 557 548 511 484 469 448
Security 33 30 35 35 38 38
Technical 180 170 167 178 181 185
Non-Organized 131 89 84 79 73 67
Total Merit 1,513 1,470 1,458 1,445 1,431 1,406
1P&S pay grades were changed in 2010 from P11-P20 to P29-P41. To see previous years data go to this site:
Office of Institutional Research
Last updated 12-7-2015
http://www.ir.iastate.edu/FBArchive.html

50 100 150 200 250 300 350 400 450 500 550
P29 P30 P31 P32 P33 P34 P35 P36 P37 P38 P39 P40 P41
P & S Employees by Grade
2011
2012
2013
2014
2015
100
200
300
400
500
600
700
Blue Collar Clerical Security Technical Non-Organized
Merit Employees by Category
2011
2012
2013
2014
2015

Faculty Salaries: Average by RankBased on Headcount for October Payroll
TOTAL UNIVERSITY 2011-2012 2012-2013 2013-2014 2014-2015 2015-2016
Nine-Month
Professor $117,999 $122,422 $126,117 $128,775 $129,639
Associate Professor 82,864 85,445 88,629 91,157 92,738
Assistant Professor 76,599 77,393 79,621 82,910 82,723
All Ranks $94,235 $97,215 $100,735 $103,089 $103,207
Twelve-Month
Professor $131,913 $139,120 $140,004 $143,011 $144,208
Associate Professor 93,927 98,020 101,785 106,773 108,419
Assistant Professor 88,578 93,138 101,426 105,633 106,993
All Ranks $115,760 $121,787 $124,697 $128,197 $128,900
Nine-Month and Twelve-Month1
Professor $114,695 $119,726 $122,702 $125,625 $126,535
Associate Professor 81,711 84,476 87,733 90,601 92,183
Assistant Professor 76,072 77,245 80,033 83,294 83,318
All Ranks $94,347 $97,762 $101,008 $103,427 $103,627
1 Twelve-month salaries are converted to nine-month equivalents using a 9/11 conversion factor.
Office of Institutional Research
Last updated 11/25/2015
$0
$20,000
$40,000
$60,000
$80,000
$100,000
$120,000
$140,000
2012 2013 2014 2015 2016
Average Faculty Salaries by Rank
Professor
AssociateProfessor
AssistantProfessor
All Ranks
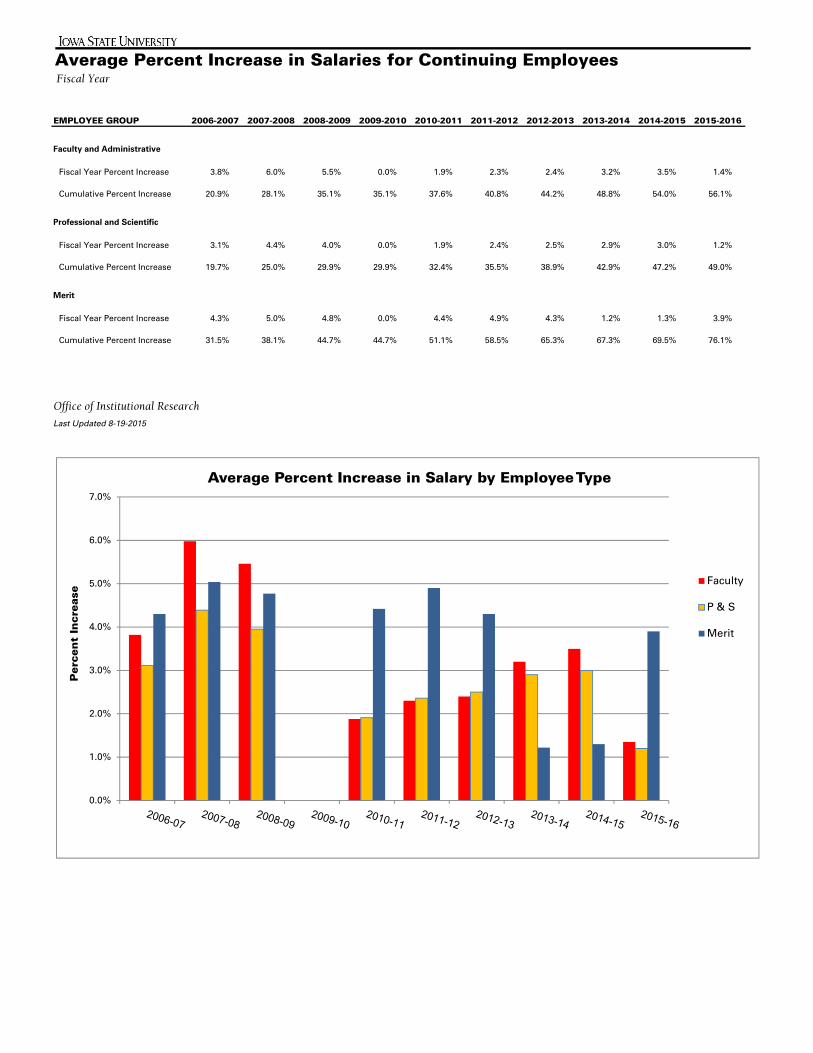
Average Percent Increase in Salaries for Continuing Employees Fiscal Year
EMPLOYEE GROUP 2006-2007 2007-2008 2008-2009 2009-2010 2010-2011 2011-2012 2012-2013 2013-2014 2014-2015 2015-2016
Faculty and Administrative
Fiscal Year Percent Increase 3.8% 6.0% 5.5% 0.0% 1.9% 2.3% 2.4% 3.2% 3.5% 1.4%
Cumulative Percent Increase 20.9% 28.1% 35.1% 35.1% 37.6% 40.8% 44.2% 48.8% 54.0% 56.1%
Professional and Scientific
Fiscal Year Percent Increase 3.1% 4.4% 4.0% 0.0% 1.9% 2.4% 2.5% 2.9% 3.0% 1.2%
Cumulative Percent Increase 19.7% 25.0% 29.9% 29.9% 32.4% 35.5% 38.9% 42.9% 47.2% 49.0%
Merit
Fiscal Year Percent Increase 4.3% 5.0% 4.8% 0.0% 4.4% 4.9% 4.3% 1.2% 1.3% 3.9%
Cumulative Percent Increase 31.5% 38.1% 44.7% 44.7% 51.1% 58.5% 65.3% 67.3% 69.5% 76.1%
Office of Institutional Research
Last Updated 8-19-2015
0.0%
1.0%
2.0%
3.0%
4.0%
5.0%
6.0%
7.0%
Per
cent
Incr
ease
Average Percent Increase in Salary by Employee Type
Faculty
P & S
Merit

Fact Book 2015‐2016
COURSES

Average Section1 Size by College and Course LevelFall Semester
COLLEGE 2011 2012 2013 2014 2015Agriculture and Life Sciences 29.6 31.4 33.6 34.8 34.3
Undergraduate 35.0 36.5 39.1 39.8 40.6Graduate 9.2 10.0 10.8 11.1 9.8
Business 53.0 51.7 52.1 50.0 49.9Undergraduate 59.1 57.8 56.6 53.8 54.7Graduate 20.7 17.3 20.0 24.3 21.8
Design 24.9 24.1 25.5 26.8 24.7Undergraduate 29.5 28.6 30.4 32.4 29.7Graduate 8.3 8.1 9.0 10.5 9.7
Engineering 32.0 32.7 33.5 38.0 35.5Undergraduate 36.3 37.0 37.7 42.7 39.8Graduate 13.2 14.1 14.6 16.6 16.5
Human Sciences 32.9 34.7 36.4 37.9 36.5Undergraduate 40.8 43.1 44.8 45.7 44.9Graduate 10.1 9.3 9.4 10.9 8.4
Liberal Arts and Sciences 34.2 33.5 35.3 35.8 36.2Undergraduate 36.4 35.7 37.4 37.8 38.1Graduate 12.7 11.8 12.4 13.8 14.5
Total 33.6 33.4 35.1 36.4 36.0Undergraduate 37.4 37.2 38.9 40.1 39.8Graduate 11.7 11.4 12.0 13.6 12.9
1 Section size based on sections taught as lecture, recitation, discussion, laboratory, combination, and studio. College of Veterinary Medicine excluded from calculations.2 Beginning Fall 2014, all data are sourced from the e-Data warehouse.
Office of Institutional Research
Last Updated: 12-23-2015
10
20
30
40
50
60
70
20
11
20
12
20
13
20
14
20
15
20
11
20
12
20
13
20
14
20
15
20
11
20
12
20
13
20
14
20
15
20
11
20
12
20
13
20
14
20
15
20
11
20
12
20
13
20
14
20
15
20
11
20
12
20
13
20
14
20
15
20
11
20
12
20
13
20
14
20
15
CALS BUS DSN ENGR HS LAS ISU TOTAL
NU
MB
ER
OF S
TU
DE
NT
S
Average Undergraduate Section Size
2

Student Credit Hours by College and Course Level1
Fiscal Year
COLLEGE2 2010-2011 2011-2012 2012-2013 2013-2014 2014-20153
Agriculture and Life Sciences
Lower Undergraduate 33,971 34,612 40,548 41,482 48,929Upper Undergraduate 30,751 34,557 37,520 40,526 47,629Professional 34Graduate 11,272 9,536 10,222 10,905 12,642Total 75,994 78,705 88,290 92,913 109,235
Business
Lower Undergraduate 14,110 16,879 20,146 21,618 21,214Upper Undergraduate 41,637 42,319 42,367 45,081 47,623Graduate 4,626 4,483 3,987 4,173 4,905Total 60,373 63,681 66,500 70,872 73,743
Design
Lower Undergraduate 19,197 19,763 19,108 19,317 19,525Upper Undergraduate 17,903 18,578 18,419 18,920 18,725Graduate 5,725 5,565 6,642 7,204 6,836Total 42,825 43,906 44,169 45,441 45,086
Engineering
Lower Undergraduate 29,591 33,454 36,546 39,931 40,899Upper Undergraduate 45,993 50,529 54,838 57,950 61,215Professional 13Graduate 17,181 15,487 17,484 18,520 20,741Total 92,765 99,470 108,868 116,401 122,869
Human Sciences
Lower Undergraduate 39,183 42,289 46,977 49,602 50,985Upper Undergraduate 37,357 39,914 42,387 47,117 51,046Graduate 13,050 14,374 14,088 14,170 14,907Total 89,590 96,577 103,452 110,889 116,938
Liberal Arts and Sciences
Lower Undergraduate 258,204 270,391 276,551 302,558 318,665Upper Undergraduate 103,762 109,405 110,489 113,461 118,477Professional 3Graduate 25,117 22,729 22,156 22,000 22,033Total 387,083 402,525 409,196 438,019 459,178
Veterinary Medicine
Lower Undergraduate 0 0 0 0 0Upper Undergraduate 0 0 0 0 529Professional 23,480 23,944 23,989 24,304 25,748Graduate 1,945 1,731 1,957 2,485 684Total 25,425 25,675 25,946 26,789 26,962
Other4
Lower Undergraduate 7,051 8,614 13,500 15,653 8,282Upper Undergraduate 2,324 2,537 2,752 3,019 690Graduate 1,753 2,964 1,637 1,739 2Total 11,128 14,115 17,889 20,411 8,974
University Total
Lower Undergraduate 401,307 426,002 453,376 490,161 508,500
Upper Undergraduate 279,727 297,839 308,772 326,074 345,935
Professional 23,480 23,944 23,989 24,304 25,798
Graduate 80,669 76,869 78,173 81,196 82,751
Total 785,183 824,654 864,310 921,735 962,984
1 Student credit hours are calculated by multiplying the course credit by the number of students enrolled in the course.2 Colleges are organized for all years by the college structure existing on June 30, 2015.3 Beginning FY2014-2015, all SCH are sourced from the e-Data warehouse and assigned to departments and
colleges using course splits designated by teaching departments.4 Includes Library and interdepartmental courses taught by faculty not funded in the colleges.
Office of Institutional ResearchLast Updated: 12-16-2015

Student Credit Hours (SCH) per Full-Time Equivalent (FTE) Instructor by College1
Fall and Spring Semesters
FALL SPRING FALL SPRING FALL SPRING FALL2 SPRING2 FALL3 SPRING3
COLLEGE 2010 2011 2011 2012 2012 2013 2013 2014 2014 2015Agriculture and Life Sciences
SCH 39,089 32,014 39,330 35,143 43,655 41,092 47,967 40,708 52,899 48,750FTE Instructor 111.20 103.59 111.44 103.57 111.67 114.08 110.71 109.22 159.94 168.77SCH/FTE 352 309 353 339 391 360 405 351 331 289
Business
SCH 27,919 27,840 29,626 29,236 30,300 31,095 30,538 32,774 30,590 33,186FTE Instructor 81.62 81.70 82.75 83.02 84.17 85.33 78.64 77.66 96.85 102.27SCH/FTE 342 341 358 352 360 364 388 422 316 325
Design
SCH 21,238 19,960 21,789 20,764 21,551 20,780 22,344 21,241 22,440 20,781FTE Instructor 109.89 105.62 119.38 121.64 132.48 131.05 136.14 131.07 141.88 142.34SCH/FTE 193 189 183 171 163 159 164 162 158 146
Engineering
SCH 44,848 41,707 48,843 45,896 52,158 50,665 56,942 53,088 57,606 55,577FTE Instructor 235.23 223.75 248.60 249.49 269.54 271.26 277.69 278.77 288.06 302.44SCH/FTE 191 186 196 184 194 187 205 190 200 184
Human Sciences
SCH 40,652 40,575 44,107 44,902 47,354 47,859 50,658 51,822 54,390 53,535FTE Instructor 136.48 125.06 133.91 131.19 169.40 168.55 156.82 152.35 187.15 188.43SCH/FTE 298 324 329 342 280 284 291 304 291 284
Liberal Arts and Sciences
Division of HumanitiesSCH 62,191 56,041 63,296 58,765 64,913 61,463 67,841 64,545 73,631 69,305FTE Instructor 224.21 229.02 236.85 232.58 246.55 244.95 255.09 249.00 281.53 283.84SCH/FTE 277 245 267 253 263 251 266 259 262 244
Division of Science and MathematicsSCH 90,228 77,568 95,531 80,562 100,067 85,801 109,268 93,390 112,566 97,621FTE Instructor 387.78 370.20 404.30 389.87 424.37 408.50 424.58 419.54 483.17 459.79SCH/FTE 233 210 236 207 236 210 257 223 233 212
Division of Social SciencesSCH 38,789 37,660 42,065 36,538 39,893 33,185 41,372 36,512 42,791 38,242FTE Instructor 129.53 127.74 127.79 127.93 127.90 130.33 131.13 131.64 135.45 134.35SCH/FTE 299 295 329 286 312 255 316 277 316 285
Liberal Arts and Sciences Total
SCH 191,208 171,269 200,892 175,865 204,873 180,449 218,481 194,447 228,988 205,167FTE Instructor 741.52 726.96 768.94 750.38 798.82 783.78 810.80 800.18 900.14 877.99SCH/FTE 258 236 261 234 256 230 269 243 254 234
Total - All Colleges (excluding Veterinary Medicine)
SCH 364,954 333,365 384,587 351,806 399,891 371,940 426,930 394,080 446,912 416,996
FTE Instructor 1,415.94 1,366.68 1,465.02 1,439.29 1,566.08 1,554.05 1,592.62 1,571.59 1,774.02 1,782.24
SCH/FTE 258 244 263 244 255 239 268 251 252 234
STUDENT CREDIT HOURS NOT INCLUDED IN ABOVE RATIOS
Veterinary Medicine
SCH 11,352 12,156 11,411 12,215 11,546 12,284 11,825 13,037 11,998 12,847FTE Instructor 101.52 97.91 118.83 115.77 110.75 107.42 109.64 109.97 116.06 116.49SCH/FTE 112 124 96 106 104 114 108 119 103 110
Other (Interdisciplinary, Library, and
Military Sciences) SCH 8,863 7,790 9,768 11,077 12,200 11,327 15,097 13,630 16,224 11,617
University Total SCH 385,169 353,311 405,766 375,098 423,637 395,551 453,852 420,747 475,134 441,460
1 Student credit hours (SCH) are calculated by multiplying the course credit by the number of students enrolled in the course.Full-time equivalent (FTE) instructors include faculty and teaching assistants paid from general university funds. October payroll is used for fall semester; March payroll is used for spring semester. Colleges are organized for all years by the college structure existing on June 30, 2015.
2 College of Agriculture and Life Sciences and College of Human Sciences FTE and SCH/FTE data for Fall 2013 and Spring 2014 do not include Food Science and Human Nutrition (FSHN). FSHN data is included in the Total - All Colleges FTE and SCH/FTE. FSHN total FTE: Fall 2013=21.82; Spring 2014=22.34, and SCH/FTE: Fall 2013=374; Spring 2014=351.
3 Beginning FY2014-2015, all data are sourced from the e-Data warehouse, which assigns SCH to departments
and colleges using course splits designated by teaching departments.
Office of Institutional ResearchLast Updated: 12-18-2015

SCH1 Taught by Faculty and Teaching Assistants
Through Spring 2014, SCH shown here do not include contributed service. Beginning in Fall 2014, SCH data are sourced from the e-Data warehouse and represent all SCH taught by faculty and teaching assistants without regard to funding source.
Office of Institutional Research
Last Updated: 12-16-2015
1 Student credit hours (SCH) are calculated by multiplying the course credit by the number of students enrolled in the course.
0
50,000
100,000
150,000
200,000
250,000
300,000
350,000
400,000
450,000
500,000
FALL
2010
SPRING
2011
FALL
2011
SPRING
2012
FALL
2012
SPRING
2013
FALL
2013
SPRING
2014
FALL
2014
SPRING
2015
ST
UD
EN
T C
RE
DIT
HO
UR
S
SEMESTER
Tenured and Tenure Eligible Non Tenure Eligible Teaching Assistants
31%
54% 54%56%
32%
33%
12%
11%
28%
58%
11%
61%
34%
12%
56%
13%
11%
33%
52%
36%
36%
8%
8%
52%
11%
27%
59%
30%
11%
62%
12%
12%

Undergraduate Section1 Size Frequency Distribution Fall Semester
NUMBER OFSTUDENTS IN SECTION NUMBER % NUMBER % NUMBER % NUMBER % NUMBER %
1-9 438 10.0% 490 10.7% 424 9.0% 424 8.7% 421 8.6%
10-19 955 21.9% 1,026 22.3% 1,022 21.6% 1,166 24.0% 1,155 23.5%
20-29 1,358 31.1% 1,437 31.3% 1,504 31.8% 1,385 28.5% 1,429 29.1%
Total 1-29 Students 2,751 63.1% 2,953 64.3% 2,950 62.3% 2,975 61.2% 3,005 61.2%
30-39 562 12.9% 563 12.3% 626 13.2% 599 12.3% 598 12.2%
40-49 339 7.8% 313 6.8% 310 6.5% 357 7.3% 349 7.1%
50-99 462 10.6% 484 10.5% 540 11.4% 578 11.9% 646 13.1%
100-199 160 3.7% 184 4.0% 199 4.2% 227 4.7% 192 3.9%
200+ 86 2.0% 94 2.0% 109 2.3% 128 2.6% 124 2.5%
Total All Sections 4,360 4,591 4,734 4,864 4,914
1 Section size based on sections taught as lecture, recitation, discussion, laboratory, combination, and studio.
College of Veterinary Medicine excluded from calculations.2 Beginning Fall 2014, all data are sourced from the e-Data warehouse.
Office of Institutional Research
Last Updated: 12-23-2015
2011 20152012 2013 2014–––SECTIONS––– –––SECTIONS––––––SECTIONS––– –––SECTIONS––– –––SECTIONS–––
2

Distance Education Course Registrations
TYPE/COLLEGE 2010-2011 2011-2012 2012-2013 2013-2014 2014-2015Off-Campus Credit Course Registrations
Agriculture and Life Sciences 1,822 2,326 2,900 3,183 3,642Business 580 558 474 566 551Design 117 88 78 30 146Engineering 1,070 1,487 1,991 1,829 1,591Human Sciences 4,274 4,891 5,395 5,446 5,694Liberal Arts and Sciences 2,549 4,306 5,292 5,437 7,591Veterinary Medicine 4 9 9 16 15Interdisciplinary 1,210 1,663 1,378 2,126 2,083
Total 11,626 15,328 17,517 18,633 21,313
Off-Campus Credit Courses: Mode of Delivery
Face-to-Face 12.3% 9.6% 7.1% 5.1% 3.7%Mailed Media (video/audio/tape, etc.) 0.9% 0.5% 0.3% 0.4% 0.3%World Wide Web 82.6% 86.5% 90.2% 92.5% 94.8%Other 4.2% 3.4% 2.5% 2.0% 1.3%
Mode of Delivery
ADDITIONAL RESOURCES:
1Use of Iowa Communications Network was discontinued in 2009-2010.
Office of Institutional Research (Source: Office of the Registrar)
Last Updated: 10/14/15
Online and Distance Learning
Face-to-Face
World Wide Web
Other
0%
20%
40%
60%
80%
100%
2005-2006 2006-2007 2007-2008 2008-2009 2009-2010 2010-2011 2011-2012 2012-2013 2013-2014 2014-2015
Mailed Media

Extension Continuing Education and Professional DevelopmentCourse Registrations
TYPE/COLLEGE 2010-2011 2011-2012 2012-2013 2013-2014 2014-2015
Noncredit Course and Conference Registrations
Agriculture and Life Sciences 82,288 178,533 171,501 158,909 177,050
Business 835 2,200 3,248 2,131 5,300
Design 11,328 12,037 14,569 13,057 14,879
Engineering 13,334 12,947 13,339 3,036 2,837
Human Sciences 199,439 123,150 102,555 97,513 87,490
Liberal Arts and Sciences 108,609 1,126 1,928 354 670
Interdisciplinary1 914 103,988 110,055 105,128 102,888
Total 416,747 433,981 417,195 380,128 391,114
ADDITIONAL RESOURCES:
Extension and Outreach
1 Interdisciplinary includes 4-H youth registrations that were categorized as Liberal Arts and Sciences prior to 2011-2012.
Office of Institutional Research (Source: Office of Vice President for Extension and Outreach)
Last Updated: 12-16-2015
Agriculture and Life Sciences177,05045.3%
Business5,3001.4%
Design14,8793.8%
Engineering2,8370.7%
Human Sciences87,49022.4%
Liberal Arts and Sciences
6700.2%
Interdisciplinary102,88826.3%
2014-2015

Fact Book 2015‐2016
ACADEMIC DEPTS & PROGRAMS

Degree Programs by CollegeAcademic Year 2015-2016
COLLEGE OF DESIGN
Architecture, B.Arch.Art and Design, B.A.Biological/Pre-Medical Illustration
(BPMI)* B.A.Community and Regional Planning, B.S.Design, B. Des.Graphic Design, B.F.A.Industrial Design, B.I.D.Interior Design, B.F.A.Integrated Studio Arts, B.F.A.Landscape Architecture, B.L.A.
COLLEGE OF ENGINEERING
Aerospace Engineering, B.S.Agricultural Engineering, B.S.Biological Systems Engineering, B.S.Chemical Engineering, B.S.Civil Engineering, B.S.Computer Engineering, B.S.Construction Engineering, B.S.Electrical Engineering, B.S.Industrial Engineering, B.S.Materials Engineering, B.S.Mechanical Engineering, B.S.Software Engineering, B.S.
COLLEGE OF HUMAN SCIENCES
Apparel Merchandising and Design, B.S.Athletic Training, B.S.Child, Adult and Family Services, B.S.Culinary Science, B.S.Diet and Exercise, B.S./M.S.Dietetics, B.S.Early Childhood Education, B.S.Elementary Education, B.S.Event Management, B.S.Family Finance, Housing and Policy, B.S. Food Science, B.S.Hospitality Management, B.S.Kinesiology and Health, B.S.Nutritional Science, B.S.
The university is organized into eight colleges, including the Graduate
College. These colleges offer a total of more than 100 Bachelors degree programs, one Professional degree (Doctor of Veterinary Medicine), over 100 Masters programs, and over 80 Ph.D. programs. Listed below are the degrees awarded. Undergraduate degrees are listed by college. Programs which are administered jointly by more than one college are listed in each college. Programs which are secondary majors only are identifi ed with an asterisk. Graduate degrees are all listed under the Graduate College.
COLLEGE OF AGRICULTURE AND LIFE SCiENCES
Agricultural Biochemistry, B.S.Agricultural Business, B.S.Agricultural and Life Sciences Education, B.S.Agricultural Studies, B.S.Agricultural Systems Technology, B.S.Agriculture and Society, B.S.Agronomy, B.S.Animal Ecology, B.S.Animal Science, B.S.Biology, B.S.Culinary Science, B.S.Dairy Science, B.S.Diet and Exercise, B.S.Dietetics, B.S.Environmental Science, B.S.Environmental Studies,* B.S.Food Science, B.S.Forestry, B.S.Genetics, B.S.Global Resource Systems, B.S.Horticulture, B.S.Industrial Technology, B.S.International Agriculture,* B.S.Microbiology, B.S.Nutritional Science, B.S.Seed Science,* B.S.
COLLEGE OF BUSINESS
Accounting, B.S.Business Economics, B.S.Finance, B.S.Management, B.S.Management Information Systems, B.S.Marketing, B.S.Supply Chain Management, B.S.
COLLEGE OF LIBERAL ARTS AND SCIENCES
Advertising, B.A.Anthropology, B.A., B.S.Biochemistry, B.S.Bioinformatics and Computational Biology, B.S.Biological/Pre-Medical Illustration, B.A.Biology, B.S.Biophysics, B.S.Chemistry, B.A., B.S.Communication Studies, B.A.Computer Science, B.S.Earth Science, B.A., B.S.Economics, B.S.English, B.A., B.S.Environmental Science, B.S.Environmental Studies,* B.A., B.S.Genetics, B.S.Geology, B.S.History, B.A., B.S.Interdisciplinary Studies, B.A., B.S.International Studies,* B.A., B.S. Journalism and Mass Communication,
B.A., B.S.Liberal Studies, B.L.S.Linguistics, B.A.Mathematics, B.S.Meteorology, B.S.Music, B.A., B.Mus.Performing Arts, B.A.Philosophy, B.A.Physics, B.S.Political Science, B.A.Psychology, B.A., B.S.Public Relations, B.S.Religious Studies, B.A.Sociology, B.A., B.S.Software Engineering, B.S.Speech Communication, B.A., B.S.Statistics, B.S.Technical Communication, B.S.Women’s Studies, B.A., B.S.World Languages and Cultures, B.A.*French*German*Spanish
COLLEGE OF VETERINARY MEDICINE
Veterinary Medicine, D.V. M.
*A secondary major must be taken in conjunction with a primary major.
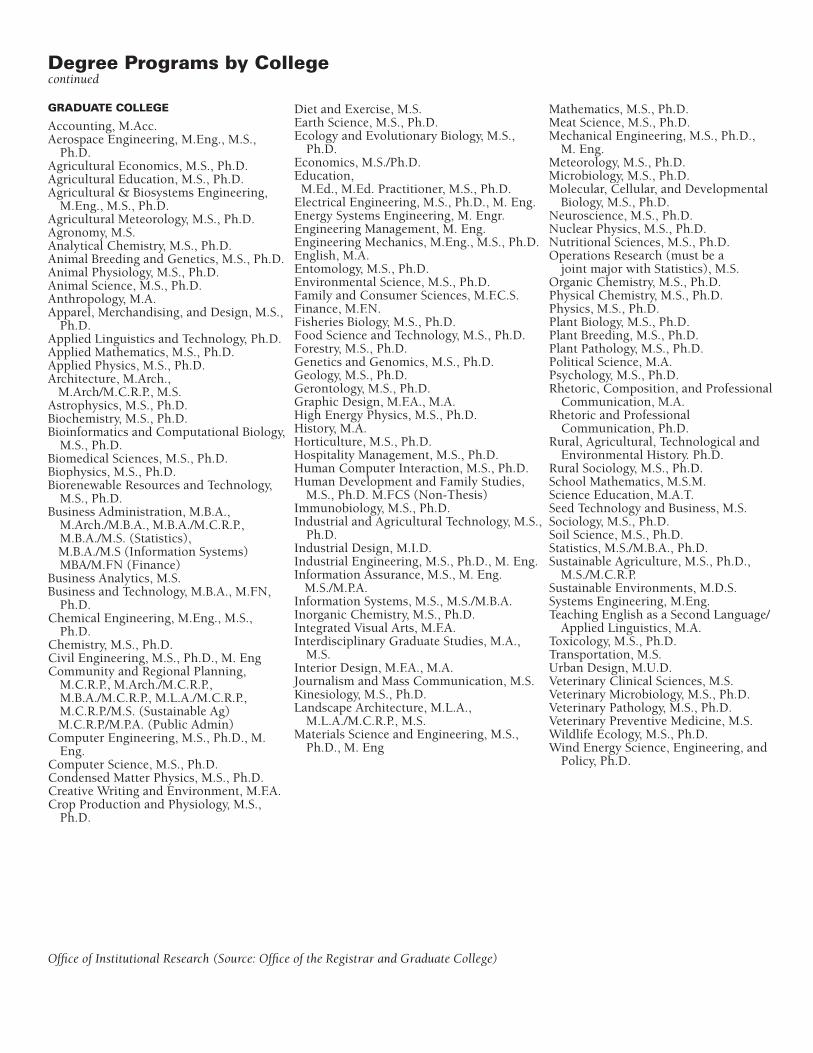
Degree Programs by Collegecontinued
GRADUATE COLLEGE
Accounting, M.Acc.Aerospace Engineering, M.Eng., M.S.,
Ph.D.Agricultural Economics, M.S., Ph.D.Agricultural Education, M.S., Ph.D.Agricultural & Biosystems Engineering,
M.Eng., M.S., Ph.D.Agricultural Meteorology, M.S., Ph.D.Agronomy, M.S.Analytical Chemistry, M.S., Ph.D.Animal Breeding and Genetics, M.S., Ph.D.Animal Physiology, M.S., Ph.D.Animal Science, M.S., Ph.D.Anthropology, M.A.Apparel, Merchandising, and Design, M.S.,
Ph.D.Applied Linguistics and Technology, Ph.D.Applied Mathematics, M.S., Ph.D.Applied Physics, M.S., Ph.D.Architecture, M.Arch., M.Arch/M.C.R.P., M.S.Astrophysics, M.S., Ph.D.Biochemistry, M.S., Ph.D.Bioinformatics and Computational Biology,
M.S., Ph.D.Biomedical Sciences, M.S., Ph.D.Biophysics, M.S., Ph.D.Biorenewable Resources and Technology,
M.S., Ph.D.Business Administration, M.B.A., M.Arch./M.B.A., M.B.A./M.C.R.P., M.B.A./M.S. (Statistics), M.B.A./M.S (Information Systems)
MBA/M.FN (Finance)Business Analytics, M.S.Business and Technology, M.B.A., M.FN,
Ph.D.Chemical Engineering, M.Eng., M.S.,
Ph.D.Chemistry, M.S., Ph.D.Civil Engineering, M.S., Ph.D., M. EngCommunity and Regional Planning,
M.C.R.P., M.Arch./M.C.R.P., M.B.A./M.C.R.P., M.L.A./M.C.R.P., M.C.R.P./M.S. (Sustainable Ag) M.C.R.P./M.P.A. (Public Admin)Computer Engineering, M.S., Ph.D., M.
Eng.Computer Science, M.S., Ph.D.Condensed Matter Physics, M.S., Ph.D.Creative Writing and Environment, M.F.A.Crop Production and Physiology, M.S.,
Ph.D.
Mathematics, M.S., Ph.D.Meat Science, M.S., Ph.D.Mechanical Engineering, M.S., Ph.D.,
M. Eng.Meteorology, M.S., Ph.D.Microbiology, M.S., Ph.D.Molecular, Cellular, and Developmental
Biology, M.S., Ph.D.Neuroscience, M.S., Ph.D.Nuclear Physics, M.S., Ph.D.Nutritional Sciences, M.S., Ph.D.Operations Research (must be a joint major with Statistics), M.S.Organic Chemistry, M.S., Ph.D.Physical Chemistry, M.S., Ph.D.Physics, M.S., Ph.D.Plant Biology, M.S., Ph.D.Plant Breeding, M.S., Ph.D.Plant Pathology, M.S., Ph.D.Political Science, M.A.Psychology, M.S., Ph.D.Rhetoric, Composition, and Professional
Communication, M.A.Rhetoric and Professional Communication, Ph.D.Rural, Agricultural, Technological and
Environmental History. Ph.D.Rural Sociology, M.S., Ph.D.School Mathematics, M.S.M. Science Education, M.A.T.Seed Technology and Business, M.S.Sociology, M.S., Ph.D.Soil Science, M.S., Ph.D.Statistics, M.S./M.B.A., Ph.D.Sustainable Agriculture, M.S., Ph.D.,
M.S./M.C.R.P.Sustainable Environments, M.D.S.Systems Engineering, M.Eng.Teaching English as a Second Language/
Applied Linguistics, M.A.Toxicology, M.S., Ph.D.Transportation, M.S.Urban Design, M.U.D.Veterinary Clinical Sciences, M.S.Veterinary Microbiology, M.S., Ph.D.Veterinary Pathology, M.S., Ph.D.Veterinary Preventive Medicine, M.S.Wildlife Ecology, M.S., Ph.D.Wind Energy Science, Engineering, and
Policy, Ph.D.
Diet and Exercise, M.S.Earth Science, M.S., Ph.D.Ecology and Evolutionary Biology, M.S.,
Ph.D.Economics, M.S./Ph.D.Education, M.Ed., M.Ed. Practitioner, M.S., Ph.D.Electrical Engineering, M.S., Ph.D., M. Eng.Energy Systems Engineering, M. Engr.Engineering Management, M. Eng.Engineering Mechanics, M.Eng., M.S., Ph.D.English, M.A.Entomology, M.S., Ph.D.Environmental Science, M.S., Ph.D.Family and Consumer Sciences, M.F.C.S.Finance, M.F.N.Fisheries Biology, M.S., Ph.D.Food Science and Technology, M.S., Ph.D.Forestry, M.S., Ph.D.Genetics and Genomics, M.S., Ph.D.Geology, M.S., Ph.D.Gerontology, M.S., Ph.D.Graphic Design, M.F.A., M.A.High Energy Physics, M.S., Ph.D.History, M.A. Horticulture, M.S., Ph.D.Hospitality Management, M.S., Ph.D.Human Computer Interaction, M.S., Ph.D.Human Development and Family Studies,
M.S., Ph.D. M.FCS (Non-Thesis)Immunobiology, M.S., Ph.D.Industrial and Agricultural Technology, M.S.,
Ph.D.Industrial Design, M.I.D.Industrial Engineering, M.S., Ph.D., M. Eng.Information Assurance, M.S., M. Eng. M.S./M.P.A.Information Systems, M.S., M.S./M.B.A.Inorganic Chemistry, M.S., Ph.D.Integrated Visual Arts, M.F.A.Interdisciplinary Graduate Studies, M.A.,
M.S.Interior Design, M.F.A., M.A.Journalism and Mass Communication, M.S.Kinesiology, M.S., Ph.D.Landscape Architecture, M.L.A., M.L.A./M.C.R.P., M.S.Materials Science and Engineering, M.S.,
Ph.D., M. Eng
Offi ce of Institutional Research (Source: Offi ce of the Registrar and Graduate College)
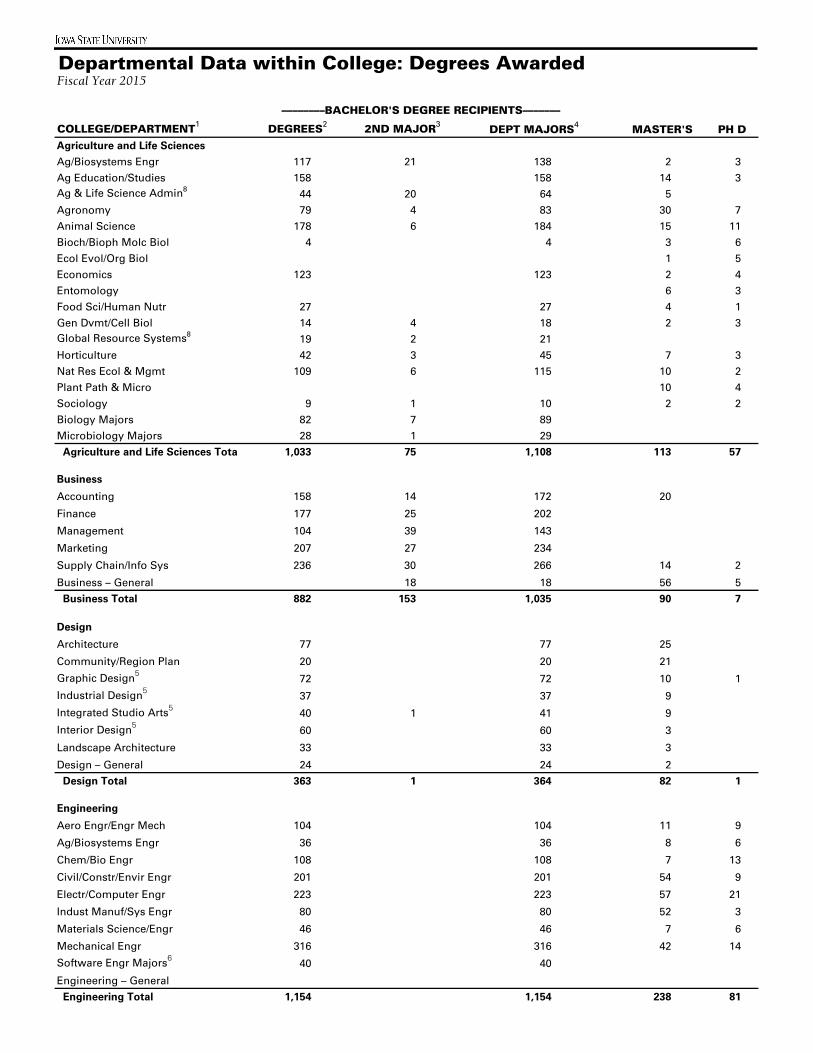
Departmental Data within College: Degrees AwardedFiscal Year 2015
COLLEGE/DEPARTMENT1 DEGREES2 2ND MAJOR3 MASTER'S PH DAgriculture and Life Sciences
Ag/Biosystems Engr 117 21 138 2 3
Ag Education/Studies 158 158 14 3Ag & Life Science Admin8 44 20 64 5
Agronomy 79 4 83 30 7
Animal Science 178 6 184 15 11
Bioch/Bioph Molc Biol 4 4 3 6
Ecol Evol/Org Biol 0 1 5
Economics 123 123 2 4
Entomology 6 3
Food Sci/Human Nutr 27 27 4 1
Gen Dvmt/Cell Biol 14 4 18 2 3Global Resource Systems8 19 2 21
Horticulture 42 3 45 7 3
Nat Res Ecol & Mgmt 109 6 115 10 2
Plant Path & Micro 0 10 4
Sociology 9 1 10 2 2
Biology Majors 82 7 89
Microbiology Majors 28 1 29
Agriculture and Life Sciences Total 1,033 75 1,108 113 57
Business
Accounting 158 14 172 20
Finance 177 25 202
Management 104 39 143
Marketing 207 27 234
Supply Chain/Info Sys 236 30 266 14 2
Business – General 18 18 56 5
Business Total 882 153 1,035 90 7
Design
Architecture 77 77 25
Community/Region Plan 20 20 21
Graphic Design5 72 72 10 1
Industrial Design5 37 37 9
Integrated Studio Arts5 40 1 41 9
Interior Design5 60 60 3
Landscape Architecture 33 33 3
Design – General 24 24 2
Design Total 363 1 364 82 1
Engineering
Aero Engr/Engr Mech 104 104 11 9
Ag/Biosystems Engr 36 36 8 6
Chem/Bio Engr 108 108 7 13
Civil/Constr/Envir Engr 201 201 54 9
Electr/Computer Engr 223 223 57 21
Indust Manuf/Sys Engr 80 80 52 3
Materials Science/Engr 46 46 7 6
Mechanical Engr 316 316 42 14
Software Engr Majors6 40 40
Engineering – General
Engineering Total 1,154 0 1,154 238 81
––––––––BACHELOR'S DEGREE RECIPIENTS––––––––––
DEPT MAJORS4

Departmental Data within College: Degrees AwardedFiscal Year 2015, continued
COLLEGE/DEPARTMENT1 DEGREES2 2ND MAJOR3 MASTER'S PH DHuman Sciences
App/Events/Hosp Mgmt 211 1 212 14 9
Food Sci/Human Nutr 102 102 13 3
Human Dvmt/Fam St 160 2 162 24 4
Kinesiology 254 254 7 1
School of Education 183 183 116 22
Diet/Exercise Majors 7 7
Early Childhd Ed Majors 32 32
Human Sci – General 0
Human Sci Total 949 3 952 174 39
Liberal Arts and Sciences
Division of Humanities
English 70 3 73 24 9
Greenlee Journ/Comm 161 9 170 14 1
History 89 7 96 3
Music/Theatre 32 32
Philosophy/Religious St 16 2 18 1
World Lang/Cultures 23 25 48
Humanities Total 391 46 437 41 11
Bioch/Bioph Molc Biol 21 1 22 3 5
Chemistry 23 23 5 40
Computer Science 37 2 39 15 5
Ecol Evol/Org Biol 0 3 7
Gen Dvmt/Cell Biol 14 14 3 5
Geological/Atmosph Sci 31 31 6 1
Mathematics 51 19 70 11 10
Physics/Astronomy 14 1 15 2 17
Statistics 24 1 25 22 12
Biology Majors 87 87
Bioinf/Comp Bio Majors 2 2
Software Engr Majors6 40 40
Sci Math Total 344 24 368 70 102
Division of Social Sciences
Anthropology 20 5 25 2 1
Economics 28 16 44 4 4
Political Science 61 9 70 5
Psychology 150 6 156 8 7
Sociology 47 21 68 7 4
Social Sci Total 306 57 363 26 16
Lib Arts/Sci – Gen 300 66 366
Lib Arts/Sci – Total 1,341 193 1,534 137 129
––––––––BACHELOR'S DEGREE RECIPIENTS––––––––––
DEPT MAJORS4
Division of Science and Mathematics

Departmental Data within College: Degrees AwardedFiscal Year 2015, continued
COLLEGE/DEPARTMENT1 DEGREES2 2ND MAJOR3 DEPT MAJORS4 DVM MASTER'S PH DVeterinary Medicine
Veterinary Medicine (D.V.M. Program) 0 147
Biomedical Sciences 0 27 0
Vet Clinical Sciences 0
Vet Diag/Prod An Med 0 7
Vet Micro/Prev Med 0 4 4
Vet Pathology 0 3
Vet Med – General 0
Vet Medicine Total 0 0 0 147 38 7
All Colleges Total 5,682 425 6,107 147 872 321
32 32 6 0
University Total 5,682 457 6,139 147 878 321
8 Prior to 2015, Ag & Life Science Administration and Global Resource Systems were classified together as Agriculture - General.
Office of Institutional Research (Source: Office of the Registrar)
Last Updated: 10-1-2015
–––––––––BACHELOR'S DEGREE RECIPIENTS––––
6 Software Engineering (jointly administered in Electrical & Computer Engineering and Computer Science): degrees are listed separately in both Engineering and Liberal Arts & Sciences colleges. They are counted only once in the All Colleges and University totals.
7 Undergraduate interdepartmental degrees are listed by second (2nd) Major only.
Interdepartmental Units/
Graduate Undeclared7
1 Data for departments administered by two colleges are shown separately for each administering college. Departments administered by Agriculture and Life Sciences and Liberal Arts and Sciences: Biochemistry, Biophysics and Molecular Biology; Economics; Ecology, Evolution and Organismal Biology; Genetics, Development and Cell Biology; and Sociology. Department administered by Agriculture and Life Sciences and Engineering: Agricultural and Biosystems Engineering. Department administered by Agriculture and Life Sciences and Human Sciences: Food Science and Human Nutrition.
2 Number of Bachelor's degrees awarded; summarized by the college and/or academic department administering the degree recipient's primary major.
3 Number of Bachelor's degree recipients that declared a second (2nd) Major; summarized by the college and/or academic department administering the 2nd Major.
4 Dept. Majors is the total number of Bachelor's degree recipients that carried a primary or 2nd Major administered by the specified college and/or academic department.
5 Effective FY 2013: Art and Design changed to four separate departments.

Departmental Data within College: InstructionFall 2014
COLLEGE/ SCH/ FACULTY
DEPARTMENT1 T/TE3 NTE3 FACULTY TA TOTAL SCH4 FTE HEADCOUNT5
Agriculture and Life Sciences
Ag/Biosystems Engr 12.51 3.75 16.26 2.22 18.48 6,220 337 30Ag Education/Studies 5.97 3.00 8.97 2.50 11.47 2,097 183 13Agronomy 13.72 3.84 17.57 0.53 18.10 7,693 425 59Animal Science 16.33 7.60 23.93 1.50 25.43 9,488 373 52Bioch/Bioph Molc Biol 5.83 0.00 5.83 2.50 8.33 1,861 223 11Ecol Evol/Org Biol 3.15 0.00 3.15 0.00 3.15 3,031 963 6Economics 8.35 4.02 12.36 10.38 22.74 5,726 252 31Entomology 3.88 0.00 3.88 0.00 3.88 854 220 12Food Sci/Human Nutr 5.71 0.50 6.21 0.00 6.21 3,850 620 19Gen Dvmt/Cell Biol 6.20 1.50 7.70 0.00 7.70 2,598 337 14Horticulture 6.14 4.73 10.87 1.12 11.99 1,483 124 20Nat Res Ecol & Mgmt 5.81 4.19 10.00 3.25 13.25 4,663 352 23Plant Path & Micro 5.24 1.00 6.24 0.00 6.24 1,462 234 20Sociology 2.46 0.00 2.46 0.50 2.96 1,872 633 10Agriculture – General 1.01 1.01 1,842
Agriculture Total2,6
101.30 34.14 135.44 25.51 160.94 54,741 331 320
Business
Accounting 12.76 6.24 18.99 0.00 18.99 9,512 501 21Finance 16.94 2.25 19.19 0.00 19.19 4,542 237 21Management 14.52 5.42 19.94 0.00 19.94 5,490 275 24Marketing 12.79 1.75 14.54 0.00 14.54 4,590 316 15Supply Chain/Info Sys 20.94 3.25 24.19 0.00 24.19 6,456 267 26Business – General 3.00 3.00 3,593
Business Total6
77.95 18.90 96.85 3.00 99.85 34,183 316 107
Design
Architecture 22.79 10.28 33.07 9.25 42.32 6,580 155 37Community/Region Plan 6.25 1.50 7.75 2.85 10.60 1,405 133 13Graphic Design 10.50 3.00 13.50 3.50 17.00 2,067 122 14Industrial Design 7.00 2.30 9.30 2.25 11.55 1,554 135 10Art/Visual Culture 19.00 10.17 29.17 2.50 31.67 5,952 188 31Interior Design 8.00 2.79 10.79 2.50 13.29 2,426 182 11Landscape Architecture 10.80 3.40 14.20 0.75 14.95 1,933 129 16Design Studies 0.00 0.00 0.00 0.50 0.50 523 1,046Design – General 453
Design Total6
84.34 33.44 117.77 24.10 141.88 22,893 158 132
Engineering
Aero Engr/Engr Mech 24.98 7.58 32.56 6.63 39.19 11,206 286 38Ag/Biosystems Engr 1.46 1.00 2.46 0.50 2.96 655 221 3Chem/Bio Engr 19.10 4.00 23.10 5.00 28.10 4,567 163 24Civil/Constr/Envir Engr 25.66 6.46 32.11 5.63 37.74 7,605 202 45Electr/Computer Engr 43.67 4.04 47.70 18.01 65.72 13,481 205 54Indust Manuf/Sys Engr 16.89 2.17 19.06 6.00 25.06 4,461 178 20Materials Science/Engr 16.77 4.84 21.61 1.50 23.11 4,434 192 32Mechanical Engr 38.59 8.00 46.59 19.60 66.19 11,198 169 50Engineering – General 0.38 0.38 3,530
Engineering Total6
187.11 38.08 225.19 63.24 288.44 61,136 200 266
––––––––INSTRUCTIONAL FTE2––––––––

Departmental Data within College: InstructionFall 2014, continued
COLLEGE/ SCH/ FACULTY
DEPARTMENT1 T/TE3 NTE3 FACULTY TA TOTAL SCH4 FTE HEADCOUNT5
Human Sciences
App/Events/Hosp Mgmt 21.09 11.00 32.09 6.25 38.34 12,278 320 35Food Sci/Human Nutr 10.17 8.45 18.62 0.00 18.62 5,199 279 28Human Dvmt/Fam St 17.67 7.70 25.37 6.26 31.63 13,005 411 35Kinesiology 18.50 8.91 27.41 8.63 36.04 11,983 333 32School of Education 38.94 17.53 56.47 6.06 62.53 11,924 191 68Human Sci – General 2.25 2.25 84
Human Sci Total2,6
106.36 53.60 159.96 29.44 189.40 54,474 291 198
Liberal Arts and Sciences
Division of Humanities
English 43.01 51.13 94.14 42.77 136.90 31,556 231 119Greenlee Journ/Comm 13.67 9.50 23.17 2.00 25.17 7,899 314 30History 16.25 3.50 19.75 7.75 27.50 7,184 261 22Music/Theatre 19.85 11.17 31.02 0.00 31.02 6,994 225 38Philosophy/Religious St 22.00 4.50 26.50 0.00 26.50 10,907 412 30World Lang/Cultures 18.82 14.36 33.18 1.25 34.43 9,092 264 39 Humanities Total 133.60 94.16 227.76 53.77 281.53 73,631 262 278
Bioch/Bioph Molc Biol 13.96 0.00 13.96 1.00 14.96 1,832 122 14Chemistry 23.60 4.48 28.08 64.93 93.01 23,208 250 30Computer Science 28.00 4.00 32.00 35.88 67.88 12,235 180 32Ecol Evol/Org Biol 18.00 4.00 22.00 32.13 54.13 7,038 130 23Gen Dvmt/Cell Biol 14.68 1.44 16.11 1.50 17.61 5,559 316 18Geological/Atmosph Sci 15.00 2.90 17.90 6.75 24.65 5,110 207 19Mathematics 36.00 16.38 52.38 34.25 86.63 33,581 388 59Physics/Astronomy 31.78 6.31 38.09 25.98 64.08 12,841 200 48Statistics 26.85 2.00 28.85 31.38 60.22 11,162 185 37 Sci Math Total 207.87 41.50 249.37 233.80 483.17 112,566 233 280
Division of Social Sciences
Anthropology 5.45 1.98 7.43 2.25 9.68 2,730 282 9Economics 15.46 2.65 18.11 14.22 32.33 9,835 304 22Political Science 11.00 5.60 16.60 3.00 19.60 4,880 249 21Psychology 27.29 10.15 37.44 17.13 54.56 16,839 309 42Sociology 12.65 2.38 15.03 4.25 19.28 8,507 441 19 Social Sci Total 71.86 22.75 94.61 40.84 135.45 42,791 316 113
Military Sciences7
Air Force Aerospace St 369Military Science/Tactics 706Naval Science/Tactics 256 Military Sci Total 1,331
Lib Arts/Sci – Gen 0.00 3.76 3.76 495
Lib Arts/Sci – Total6
413.33 158.40 571.73 332.16 903.90 230,814 254 671
All Colleges Total2
970.39 336.56 1,306.94 477.46 1,784.41 458,241 252 1,875
––––––––INSTRUCTIONAL FTE2––––––––
Division of Science and Mathematics

Departmental Data within College: InstructionFall 2014, continued
COLLEGE/ SCH/ FACULTY
DEPARTMENT1 T/TE3 NTE3 FACULTY TA TOTAL SCH4 FTE HEADCOUNT5
SCH and Instructional FTE Not Included in All Colleges or University SCH/FTE Ratios 6
Veterinary Medicine
Biomedical Sciences 16.55 3.15 19.69 1.75 21.44 2,925 136 27Vet Clinical Sciences 27.22 12.41 39.62 0.00 39.62 4,580 116 71Vet Diag/Prod An Med 17.67 7.46 25.13 0.00 25.13 1,923 77 49Vet Micro/Prev Med 15.22 0.00 15.22 0.00 15.22 1,083 71 17Vet Pathology 13.13 1.52 14.65 0.00 14.65 1,487 102 17Vet Med – General 50
Vet Medicine Total6
89.78 24.53 114.31 1.75 116.06 12,048 103 181
0.00 0.00 0.00 5.50 5.50 756
University Total2,6 1,074.17 361.09 1,435.26 484.71 1,919.97 475,134 1,892
Jointly Administered Department Totals 1
Ag/Biosystems Engr 13.97 4.75 18.72 2.72 21.44 6,875 321 33Bioch/Bioph Molc Biol 19.79 0.00 19.79 3.50 23.29 3,693 159 25Ecol Evol/Org Biol 21.15 4.00 25.15 32.13 57.28 10,069 176 29Economics 23.81 6.67 30.48 24.60 55.07 15,561 283 53Food Sci/Human Nutr 15.88 8.95 24.83 0.00 24.83 9,049 364 47Gen Dvmt/Cell Biol 20.88 2.94 23.81 1.50 25.31 8,157 322 32Sociology 15.11 2.38 17.49 4.75 22.24 10,379 467 29
5 Faculty are counted in department of primary rank (sourced from e-Data warehouse).
Office of Institutional Research
Last Updated: 1-6-2016
4 SCH (student credit hours) are calculated by multiplying the course credit by the number of students enrolled in the course. All SCH data are sourced from the e-Data warehouse which assigns SCH to departments and colleges using course splits designated by teaching departments.
6 The SCH per FTE ratios for the colleges exclude SCHs with no associated instructor FTEs as well as SCH and FTEs not assigned to academic departments. The University ratio also excludes Veterinary Medicine, Library, and Interdepartmental Units.7 Military Sciences SCH are not included in the college or university SCH/FTE ratios.
1 Data for departments administered by two colleges are shown separately for each administering college. Departments administered by Agriculture and Life Sciences and Liberal Arts and Sciences: Biochemistry, Biophysics and Molecular Biology; Economics; Ecology, Evolution and Organismal Biology; Genetics, Development and Cell Biology; and Sociology. Department administered by Agriculture and Life Sciences and Engineering: Agricultural and Biosystems Engineering. Department administered by Agriculture and Life Sciences and Human Sciences: Food Science and Human Nutrition.
3 "Faculty" is comprised of T/TE (tenured and tenure eligible) plus NTE (non tenure eligible) faculty. NTE faculty includes Continuous Adjuncts.
2 Instructional FTE (full-time equivalent) is the portion of salary paid from departmental General University funds; used in the SCH/FTE ratio. All FTE data are sourced from the e-Data warehouse and organized by IR Count Department (same as Rank Department for faculty).
––––––––INSTRUCTIONAL FTE2––––––––
Interdepartmental Units/
Graduate Undeclared

Departmental Data within College: Majors and Assigned SpaceFall 2015
COLLEGE/DEPARTMENT1
1ST
MAJOR2
2ND
MAJOR3 GRADUATE
NET ASSIGNABLE
SQUARE FEET5
Agriculture and Life Sciences
Ag/Biosystems Engr 473 51 524 25 75,560
Ag Education/Studies 571 13 584 74 7,862
Agronomy 324 23 347 316 144,999
Animal Science 1,112 21 1,133 80 216,077
Bioch/Bioph Molc Biol 26 1 27 23 21,100
Ecol Evol/Org Biol 0 19 23,022
Economics 512 10 522 34 15,316
Entomology 3 3 17 34,404
Food Sci/Human Nutr 148 3 151 22 39,087
Gen Dvmt/Cell Biol 74 26 100 21 23,101
Horticulture 120 11 131 20 32,209
Nat Res Ecol & Mgmt 459 23 482 42 49,107
Plant Path & Micro 126 9 135 49 53,330
Sociology 35 11 46 13 5,637
Biology Majors 291 18 309
Agriculture – General 338 99 437 8 69,307
Agriculture Total 4,612 319 4,931 763 810,118
Business
Accounting 405 34 439 39 2,598
Finance 466 76 542 12 2,533
Management 210 95 305 2,501
Marketing 445 88 533 2,281
Supply Chain/Info Sys 564 78 642 112 3,362
Business – General 2,071 97 2,168 161 39,344
Business Total 4,161 468 4,629 324 52,619
Design
Architecture 505 505 56 26,171
Art & Visual Culture 114 6 120 18 14,624
Community/Region Plan 77 8 85 43 4,922
Graphic Design 324 3 327 34 7,335
Industrial Design 221 221 14 9,158
Interior Design 218 218 16 9,766
Landscape Architecture 146 146 25 10,822
Design – General 166 3 169 7 55,206
Design Total 1,771 20 1,791 213 138,004
Engineering
Aero Engr/Engr Mech 800 3 803 100 59,627
Ag/Biosystems Engr 318 2 320 65 32,090
Chem/Bio Engr 824 3 827 70 42,873
Civil/Constr/Envir Engr 1,031 8 1,039 209 60,984
Electr/Computer Engr 1,566 11 1,577 380 69,250
Indust Manuf/Sys Engr 514 3 517 196 23,967
Materials Science/Engr 266 2 268 75 48,096
Mechanical Engr 2,047 6 2,053 257 54,976
Engineering – General 583 583 11 124,615
Engineering Total 7,949 38 7,987 1,363 516,478
––––––––––––––––––––MAJORS––––––––––––––––––––
–––––UNDERGRADUATE––––––––––
1ST AND 2ND
MAJORS4
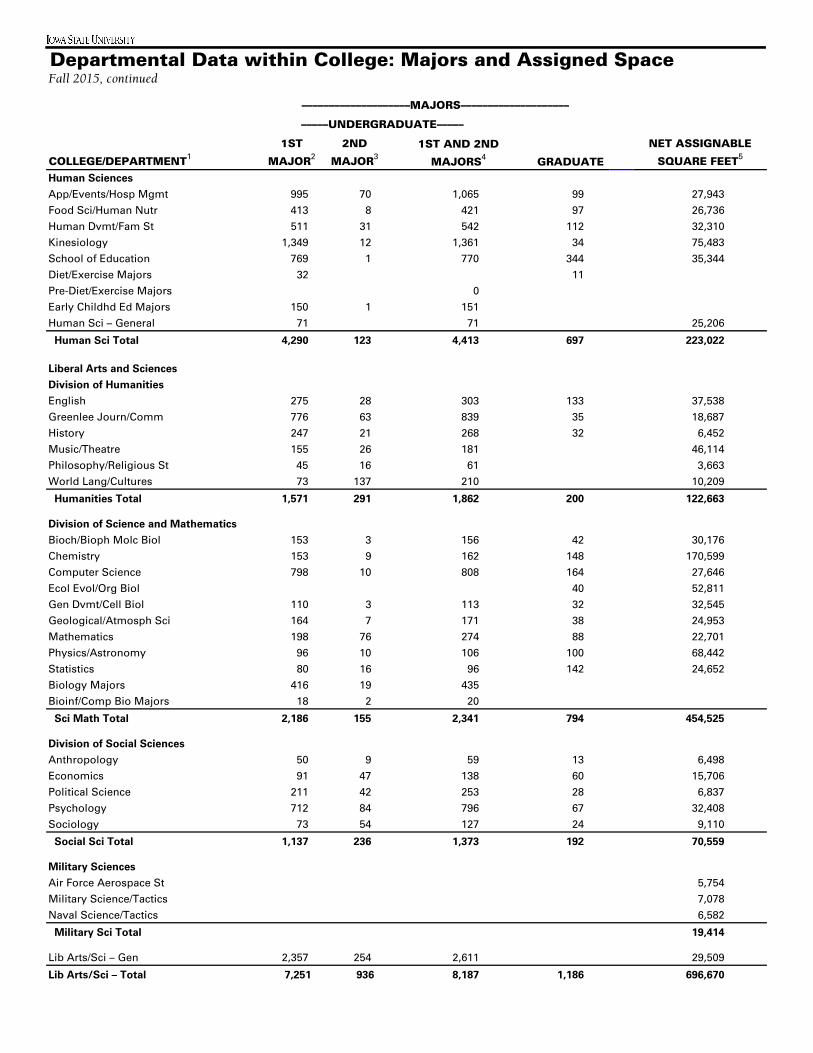
Departmental Data within College: Majors and Assigned SpaceFall 2015, continued
COLLEGE/DEPARTMENT1
1ST
MAJOR2
2ND
MAJOR3 GRADUATE
NET ASSIGNABLE
SQUARE FEET5
Human Sciences
App/Events/Hosp Mgmt 995 70 1,065 99 27,943
Food Sci/Human Nutr 413 8 421 97 26,736
Human Dvmt/Fam St 511 31 542 112 32,310
Kinesiology 1,349 12 1,361 34 75,483
School of Education 769 1 770 344 35,344
Diet/Exercise Majors 32 32 11
Pre-Diet/Exercise Majors 0
Early Childhd Ed Majors 150 1 151
Human Sci – General 71 71 25,206
Human Sci Total 4,290 123 4,413 697 223,022
Liberal Arts and Sciences
Division of Humanities
English 275 28 303 133 37,538
Greenlee Journ/Comm 776 63 839 35 18,687
History 247 21 268 32 6,452
Music/Theatre 155 26 181 46,114
Philosophy/Religious St 45 16 61 3,663
World Lang/Cultures 73 137 210 10,209
Humanities Total 1,571 291 1,862 200 122,663
Bioch/Bioph Molc Biol 153 3 156 42 30,176
Chemistry 153 9 162 148 170,599
Computer Science 798 10 808 164 27,646
Ecol Evol/Org Biol 0 40 52,811
Gen Dvmt/Cell Biol 110 3 113 32 32,545
Geological/Atmosph Sci 164 7 171 38 24,953
Mathematics 198 76 274 88 22,701
Physics/Astronomy 96 10 106 100 68,442
Statistics 80 16 96 142 24,652
Biology Majors 416 19 435
Bioinf/Comp Bio Majors 18 2 20
Sci Math Total 2,186 155 2,341 794 454,525
Division of Social Sciences
Anthropology 50 9 59 13 6,498
Economics 91 47 138 60 15,706
Political Science 211 42 253 28 6,837
Psychology 712 84 796 67 32,408
Sociology 73 54 127 24 9,110
Social Sci Total 1,137 236 1,373 192 70,559
Military Sciences
Air Force Aerospace St 5,754
Military Science/Tactics 7,078
Naval Science/Tactics 6,582
Military Sci Total 19,414
Lib Arts/Sci – Gen 2,357 254 2,611 29,509
Lib Arts/Sci – Total 7,251 936 8,187 1,186 696,670
Division of Science and Mathematics
––––––––––––––––––––MAJORS––––––––––––––––––––
–––––UNDERGRADUATE––––––––––
1ST AND 2ND
MAJORS4

Departmental Data within College: Majors and Assigned SpaceFall 2015, continued
COLLEGE/DEPARTMENT1
1ST
MAJOR2
2ND
MAJOR3
1ST AND 2ND
MAJORS4 DVM GRADUATE
NET ASSIGNABLE
SQUARE FEET5
Veterinary Medicine
Veterinary Medicine (D.V.M. Program) 584 38,211
Biomedical Sciences 71 46,543
Vet Clinical Sciences5 4 178,530
Vet Diag/Prod An Med 17 15,921
Vet Micro/Prev Med 41 35,986
Vet Pathology 13 20,853
Vet Med – General 137,548
Vet Medicine Total 0 584 146 473,592
All Colleges Total 30,034 1,904 31,938 584 4,692 2,910,503
404
287
University Total 30,034 1,904 31,938 584 5,383 2,910,503
Office of Institutional Research (Source: Office of the Registrar; Facilities, Planning and Management)
Last Updated: 1-11-2016
5 Net Assignable Square Feet (NASF) includes space assigned to centers within a specific department or college. In Veterinary Medicine, Vet Clinical Sciences includes Veterinary Medical Center NASF.6 Post Docs not enrolled in classes are included in the University Total, but are not included in individual college totals or the All Colleges Total.
2 Number of undergraduate students enrolled; summarized by the college and/or academic department administering the student's primary (1st) Major.
3 Number of undergraduate students who declared a second (2nd) Major; summarized by the college and/or academic department administering the second (2nd) Major.
4 Total number of students who carried a primary (1st) or second (2nd) Major administered by the specified college and/or academic department.
––––––––––––––––––––MAJORS––––––––––––––––––––
–––––UNDERGRADUATE–––––
Interdepartmental Units/
Graduate Undeclared
Post Docs6
1 Data for departments administered by two colleges are shown separately for each administering college. Departments administered by Agriculture and Life Sciences and Liberal Arts and Sciences: Biochemistry, Biophysics and Molecular Biology; Economics; Ecology, Evolution and Organismal Biology; Genetics, Development and Cell Biology; and Sociology. Department administered by Agriculture and Life Sciences and Engineering: Agricultural and Biosystems Engineering. Department administered by Agriculture and Life Sciences and Human Sciences: Food Science and Human Nutrition.

Fact Book 2015‐2016
FINANCES & FACILITIES

Revenues by Source (in thousands) Fiscal Year
DOLLARS % DOLLARS % DOLLARS % DOLLARS % DOLLARS %
Revenues
State Appropriations 236,194 21.8% 225,143 20.0% 231,002 19.5% 248,633 19.9% 250,354 19.2%
Federal Appropriations 13,471 1.2% 12,485 1.1% 12,886 1.1% 12,541 1.0% 12,730 1.0%
Tuition and Fees 298,985 27.6% 334,034 29.7% 363,870 30.7% 401,418 32.2% 428,932 32.8%
Contracts and Grants 262,000 24.2% 252,903 22.5% 252,410 21.3% 251,681 20.2% 259,827 19.9%
Auxiliary Enterprises 146,615 13.5% 161,033 14.3% 179,371 15.1% 191,304 15.3% 207,932 15.9%
Independent Operations 38,369 3.5% 40,863 3.6% 40,299 3.4% 40,659 3.3% 48,100 3.7%
Other 87,413 8.1% 100,035 8.9% 104,342 8.8% 102,103 8.2% 98,268 7.5%
Total $1,083,047 $1,126,496 $1,184,180 $1,248,339 $1,306,143
1 Auxiliary Enterprises: activities that exist to furnish goods and services to students and staff, essentially self-supporting, e.g., Iowa State Center,
Residence System, University Bookstore.2
Independent Operations: operations that are independent of but may enhance the mission of the university: Ames Laboratory.3 Other: includes miscellaneous revenue, e.g., sales of educational activities, interest income from investments, sales of equipment.
Office of Institutional Research (Source: Office of Controller)
Last Updated 12/16/2015
–––2014-2015––––––2012-2013––––––2010-2011––– –––2011-2012––– –––2013-2014–––
$0
$100,000
$200,000
$300,000
$400,000
$500,000
2011 2012 2013 2014 2015
Revenue by Source
Revenues by Source
State Appropriations
Federal Appropriations
Tuition and Fees
Contracts and Grants
Auxiliary Enterprises
Independent Operations
Other
2
3
1
2
3
1

Expenditures and Transfers by Object (in thousands) Fiscal Year
DOLLARS % DOLLARS % DOLLARS % DOLLARS % DOLLARS %
Expenditures and Transfers
Salaries and Wages $449,803 42.6% $466,578 42.8% $490,118 42.3% $505,818 41.7% $532,320 41.0%
Benefits 140,311 13.3% 143,692 13.2% 146,771 12.7% 150,177 12.4% 157,897 12.1%
General 253,261 24.0% 278,736 25.6% 300,044 25.9% 316,164 26.1% 356,611 27.4%
Scholarships 106,321 10.1% 114,689 10.5% 117,747 10.2% 129,691 10.7% 138,042 10.6%
Capital 20,420 1.9% 19,081 1.8% 19,803 1.7% 16,934 1.4% 26,219 2.0%
Mandatory Transfers 31,714 3.0% 33,458 3.1% 36,244 3.1% 39,011 3.2% 41,265 3.2%
Non-Mandatory Transfers 53,809 5.1% 33,846 3.1% 46,610 4.0% 54,328 4.5% 47,371 3.6%
Total $1,055,639 $1,090,080 $1,157,337 $1,212,123 $1,299,7251 General includes expenditures and transfers not classified under other categories, e.g., supplies and services.
2 Mandatory Transfers: transfers from operating funds to non-operating funds arising out of binding legal agreements related to the financing of capital assets,
e.g., debt retirement, interest, and grant agreements with federal agencies and other organizations to match gifts and grants.3 Non-Mandatory Transfers: transfers from operating funds to non-operating funds made at the discretion of management to serve various objectives,
e.g., additions to endowment funds, capital asset additions, and the renewal and replacement of capital assets.
Office of Institutional Research (Source: Office of Controller)
Last Updated 12/16/2015
––––––2014-2015–––––––––––2011-2012–––––––––––2010-2011––––– ––––––2012-2013––––– ––––––2013-2014–––––
$
$100,000
$200,000
$300,000
$400,000
$500,000
$600,000
2011 2012 2013 2014 2015
Exp
end
itu
res
& T
ran
sfer
s b
y O
bje
ct
Expenditures and Transfers by Object
Salaries and Wages
Benefits
General
Scholarships
Capital
Mandatory Transfers
Non-Mandatory Transfers
2
3
1

Expenditures and Transfers by Function (in thousands) Fiscal Year
DOLLARS % DOLLARS % DOLLARS % DOLLARS % DOLLARS %
Expenditures and Transfers
Instruction $213,742 20.2% $219,629 20.1% $228,861 19.8% $242,906 20.0% $263,854 20.3% Research 179,395 17.0% 171,024 15.7% 172,511 14.9% 171,785 14.2% 174,300 13.4% Public Service 71,949 6.8% 75,236 6.9% 72,568 6.3% 73,764 6.1% 74,037 5.7% Academic Support 115,916 11.0% 143,866 13.2% 159,651 13.8% 167,969 13.9% 192,778 14.8% Student Services 27,517 2.6% 29,422 2.7% 28,425 2.5% 30,664 2.5% 34,613 2.7% Institutional Support 40,036 3.8% 39,572 3.6% 48,651 4.2% 41,472 3.4% 57,265 4.4% Operations and Maintenance 53,895 5.1% 52,471 4.8% 55,487 4.8% 59,547 4.9% 60,440 4.7% Scholarship 106,321 10.1% 114,689 10.5% 117,747 10.2% 129,691 10.7% 138,042 10.6% Other 246,868 23.4% 244,171 22.4% 273,436 23.6% 294,325 24.3% 304,396 23.4%
Total $1,055,639 $1,090,080 $1,157,337 $1,212,123 $1,299,725
Other includes the following: Auxiliary Enterprises 143,407 157,616 174,303 182,046 193,052 Independent Operations 38,488 41,327 40,287 41,039 47,725 Mandatory Transfers Out (Educ. & Gen.) 11,164 11,382 12,236 16,912 16,248 Non-Mandatory Transfers Out 53,809 33,846 46,610 54,328 47,371
Office of Institutional Research (Source: Office of Controller)
Last Updated 12/16/2015
–––2014-2015––––––2010-2011––– –––2011-2012––– –––2012-2013––– –––2013-2014–––
$
$ 50,000
$100,000
$150,000
$200,000
$250,000
$300,000
$350,000
2011 2012 2013 2014 2015
Ex
pe
nd
itu
res &
Tra
nsfe
rs b
y F
un
cti
on
Expenditures and Transfers by Function
Instruction
Research
Public Service
Academic Support
Student Services
Institutional Support
Operations and Maintenance
Scholarship
Other

Endowment Funds (in thousands) June 30 Balances
2006 2007 2008 2009 2010 2011 2012 2013 2014 2015
University $134,043 $149,124 $133,379 $100,539 $104,586 $120,391 $119,788 $127,267 $145,136 $142,837
ISU Foundation 361,975 443,244 435,295 351,670 404,289 491,892 485,109 546,248 631,882 643,368
Total $496,018 $592,368 $568,674 $452,209 $508,875 $612,283 $604,897 $673,515 $777,018 $786,205
PEER LAND GRANT UNIVERSITIES 1
2010 2011 2012 2013 2014
Michigan State University 1,148,265 1,400,380 1,407,483 1,637,164 2,145,424
University of California-Davis (excludes system funds 162,569 201,135 211,056 240,391 313,876
Texas A&M Univ System & Foundations $5,738,289 $6,999,517 $7,638,555 $8,732,010 $11,103,880
University of Arizona & Foundation 480,239 552,351 563,655 611,746 760,679
University of Illinois & Foundation 1,289,676 1,600,603 1,649,346 1,925,949 2,277,932
Univ. of Wisconsin Foundation 1,551,384 1,872,933 1,812,056 2,020,019 2,332,185
Iowa State University & Foundation 508,875 612,283 604,897 673,515 777,018
North Carolina State Univ Endwmnt & Fndtn 503,110 617,632 635,326 769,404 885,055
University of Minnesota & Affiliated Foundations 2,195,742 2,503,305 2,494,050 2,757,476 3,164,792
Ohio State University & Foundation 1,869,312 2,120,714 2,366,033 3,149,169 3,547,566
Purdue University 1,633,034 2,001,601 1,916,968 2,182,171 2,443,4941 Source: NACUBO-Commonfund Study of Endowments.
Office of Institutional Research (Sources: ISU Foundation, Office of the Treasurer, Chronicle of Higher Education)Last Updated: 11-10-2015
––––––––––––––––JUNE 30 BALANCES––––––––––––––––––––
12.0%
CHANGE FROM
2013 TO 2014
15.5%
15.4%
15.0%
14.8%
12.7%
31.0%
30.6%
27.2%
24.3%
18.3%
$
$100,000
$200,000
$300,000
$400,000
$500,000
$600,000
$700,000
$800,000
$900,000
2006 2007 2008 2009 2010 2011 2012 2013 2014 2015
ISU Endowment Funds

Gift Activity (in thousands) Fiscal Year
2012-2013 2013-2014 2014-2015Receipts
Outright Gifts and Payments
on Previous Commitments1
$55,088 $69,995 $76,226 $64,878 $59,681 $63,378 $61,132 $61,815 $65,377 $106,021
Trust and Annuity Gifts 1,945 1,201 2,312 1,996 2,192 3,175 2,039 2,018 1,081 287
University Gifts2
8,654 1,759 2,649 1,105 956 790 0
Total Gift Receipts $ 57,033 $ 71,196 $ 78,538 $ 75,528 $ 63,632 $ 69,202 $ 64,276 $ 64,789 $ 67,248 $106,308
New Commitments
Pledge Commitments 20,596 34,467 57,064 29,936 30,826 23,236 27,655 20,795 40,290 40,105
Bequests and InsuranceCommitments 37,700 45,645 45,658 60,189 41,545 48,040 47,531 62,461 46,000 66,328
Less Payments on Previous Commitments (23,333) (45,200) (45,876) (37,904) (34,921) (37,203) (37,566) (35,368) (34,624) (47,946)
Total Gift Income $103,275 $101,896 $112,677 $118,914 $164,795
By Donor Designation 2014-2015
Individuals $128,148 77.8% Student Financial Aid $46,448 28.2%
Corporations 30,737 18.6% Faculty and Staff Support 26,547 16.1%
Foundations 5,910 3.6% Colleges/Admin. Support 52,252 31.7%
Buildings/Maintenance 39,548 24.0%
$164,795 100.0% Total $164,795 100.0%
1 Beginning in 2005, gifts received directly by the University are included in the Foundation’s reporting of gift activity.
Office of Institutional Research (Source: ISU Foundation)Last Updated: 11-10-2015
2006-20072005-2006 2011-20122010-2011
$101,082
2009-2010
$135,384
2007-2008
$106,108 $127,749
2008-2009
$91,996
Student Financial Aid28%
Faculty and Staff Support
16%Colleges/Admin.
Support32%
Buildings/Maintenance…
Donor Designation for Gifts2014-2015
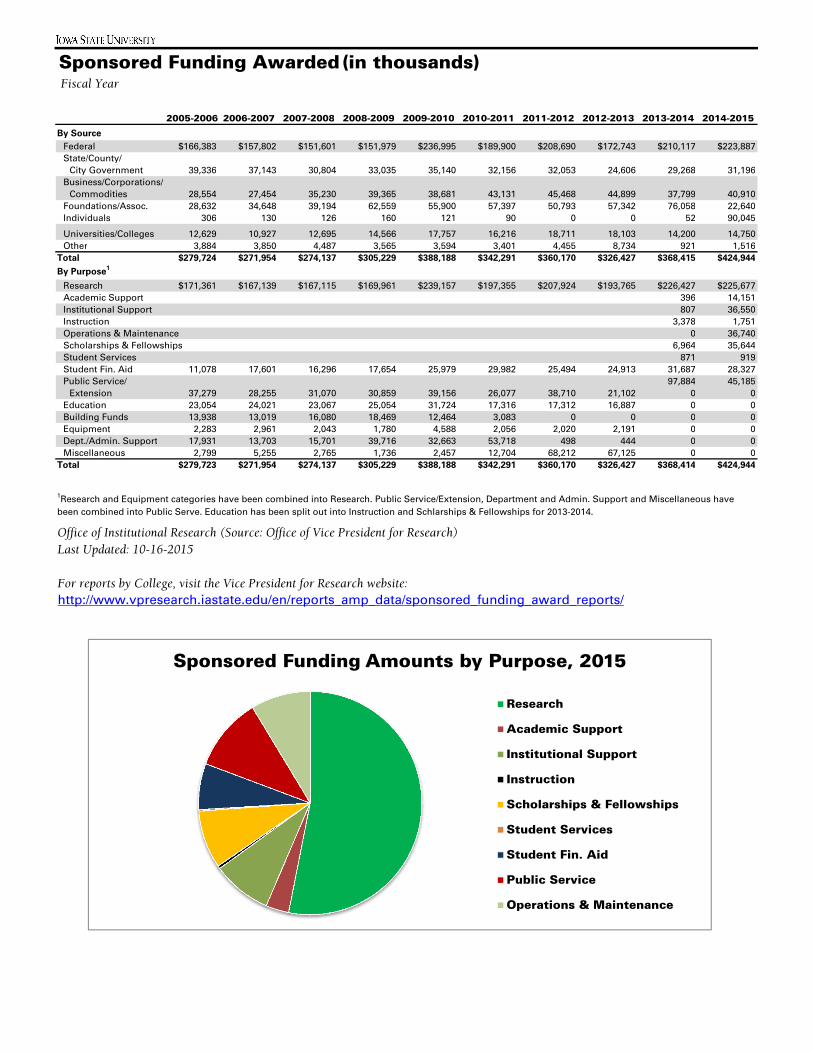
Sponsored Funding Awarded (in thousands) Fiscal Year
By Source
Federal $166,383 $157,802 $151,601 $151,979 $236,995 $189,900 $208,690 $172,743 $210,117 $223,887State/County/
City Government 39,336 37,143 30,804 33,035 35,140 32,156 32,053 24,606 29,268 31,196Business/Corporations/
Commodities 28,554 27,454 35,230 39,365 38,681 43,131 45,468 44,899 37,799 40,910Foundations/Assoc. 28,632 34,648 39,194 62,559 55,900 57,397 50,793 57,342 76,058 22,640Individuals 306 130 126 160 121 90 0 0 52 90,045
Universities/Colleges 12,629 10,927 12,695 14,566 17,757 16,216 18,711 18,103 14,200 14,750Other 3,884 3,850 4,487 3,565 3,594 3,401 4,455 8,734 921 1,516
Total $279,724 $271,954 $274,137 $305,229 $388,188 $342,291 $360,170 $326,427 $368,415 $424,944
By Purpose1
Research $171,361 $167,139 $167,115 $169,961 $239,157 $197,355 $207,924 $193,765 $226,427 $225,677Academic Support 396 14,151Institutional Support 807 36,550Instruction 3,378 1,751Operations & Maintenance 0 36,740Scholarships & Fellowships 6,964 35,644Student Services 871 919Student Fin. Aid 11,078 17,601 16,296 17,654 25,979 29,982 25,494 24,913 31,687 28,327Public Service/ 97,884 45,185
Extension 37,279 28,255 31,070 30,859 39,156 26,077 38,710 21,102 0 0Education 23,054 24,021 23,067 25,054 31,724 17,316 17,312 16,887 0 0Building Funds 13,938 13,019 16,080 18,469 12,464 3,083 0 0 0 0Equipment 2,283 2,961 2,043 1,780 4,588 2,056 2,020 2,191 0 0Dept./Admin. Support 17,931 13,703 15,701 39,716 32,663 53,718 498 444 0 0Miscellaneous 2,799 5,255 2,765 1,736 2,457 12,704 68,212 67,125 0 0
Total $279,723 $271,954 $274,137 $305,229 $388,188 $342,291 $360,170 $326,427 $368,414 $424,944
Office of Institutional Research (Source: Office of Vice President for Research)Last Updated: 10-16-2015
2012-2013
1Research and Equipment categories have been combined into Research. Public Service/Extension, Department and Admin. Support and Miscellaneous have been combined into Public Serve. Education has been split out into Instruction and Schlarships & Fellowships for 2013-2014.
2013-2014
http://www.vpresearch.iastate.edu/en/reports_amp_data/sponsored_funding_award_reports/
2014-2015
For reports by College, visit the Vice President for Research website:
2011-20122010-20112009-20102008-20092007-20082006-20072005-2006
Sponsored Funding Amounts by Purpose, 2015
Research
Academic Support
Institutional Support
Instruction
Scholarships & Fellowships
Student Services
Student Fin. Aid
Public Service
Operations & Maintenance
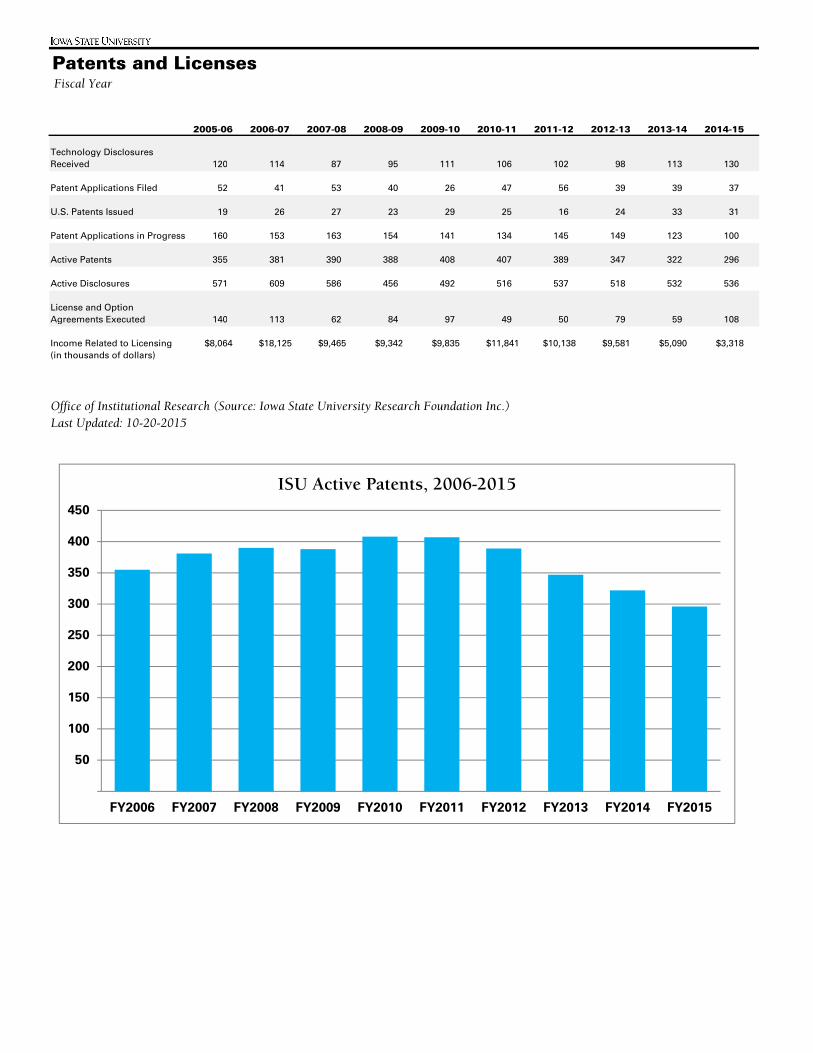
Patents and Licenses Fiscal Year
2005-06 2006-07 2007-08 2008-09 2009-10 2010-11 2011-12 2012-13 2013-14 2014-15
Technology DisclosuresReceived 120 114 87 95 111 106 102 98 113 130
Patent Applications Filed 52 41 53 40 26 47 56 39 39 37
U.S. Patents Issued 19 26 27 23 29 25 16 24 33 31
Patent Applications in Progress 160 153 163 154 141 134 145 149 123 100
Active Patents 355 381 390 388 408 407 389 347 322 296
Active Disclosures 571 609 586 456 492 516 537 518 532 536
License and Option Agreements Executed 140 113 62 84 97 49 50 79 59 108
Income Related to Licensing $8,064 $18,125 $9,465 $9,342 $9,835 $11,841 $10,138 $9,581 $5,090 $3,318(in thousands of dollars)
Office of Institutional Research (Source: Iowa State University Research Foundation Inc.)Last Updated: 10-20-2015
50
100
150
200
250
300
350
400
450
FY2006 FY2007 FY2008 FY2009 FY2010 FY2011 FY2012 FY2013 FY2014 FY2015
ISU Active Patents, 2006-2015
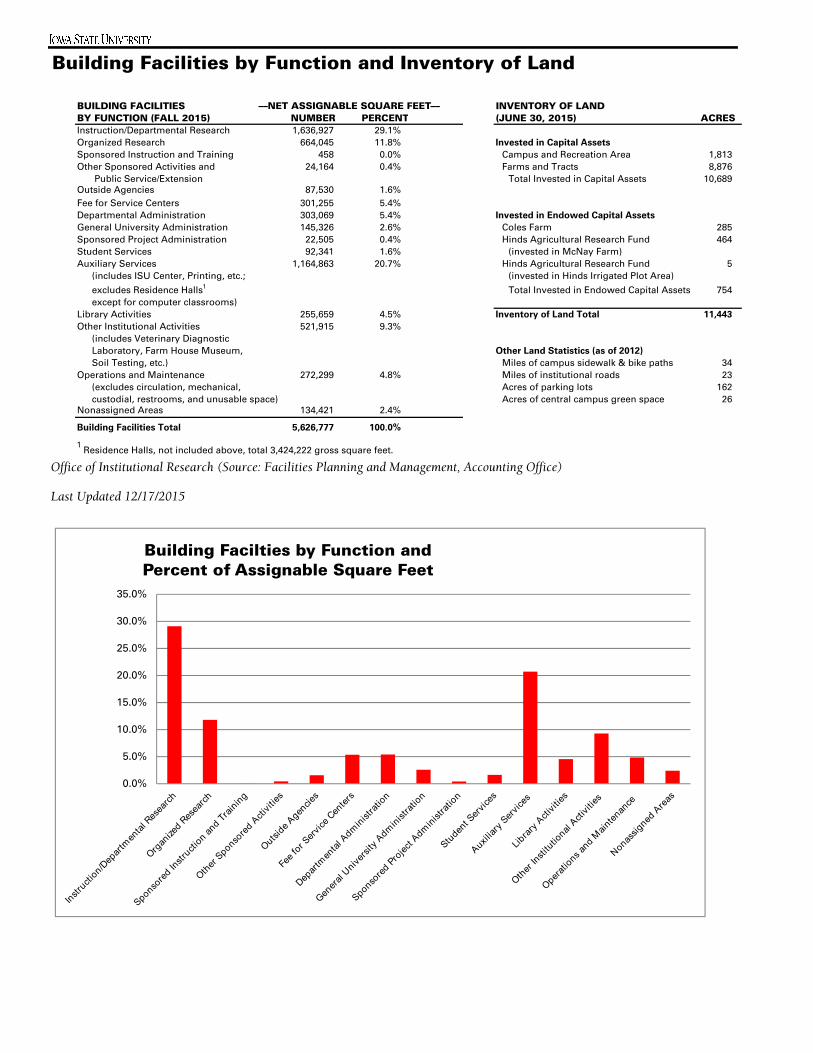
Building Facilities by Function and Inventory of Land
BUILDING FACILITIES INVENTORY OF LAND BY FUNCTION (FALL 2015) NUMBER PERCENT (JUNE 30, 2015) ACRESInstruction/Departmental Research 1,636,927 29.1%Organized Research 664,045 11.8% Invested in Capital Assets
Sponsored Instruction and Training 458 0.0% Campus and Recreation Area 1,813Other Sponsored Activities and 24,164 0.4% Farms and Tracts 8,876
Public Service/Extension Total Invested in Capital Assets 10,689Outside Agencies 87,530 1.6%Fee for Service Centers 301,255 5.4%Departmental Administration 303,069 5.4% Invested in Endowed Capital Assets
General University Administration 145,326 2.6% Coles Farm 285Sponsored Project Administration 22,505 0.4% Hinds Agricultural Research Fund 464Student Services 92,341 1.6% (invested in McNay Farm)Auxiliary Services 1,164,863 20.7% Hinds Agricultural Research Fund 5
(includes ISU Center, Printing, etc.; (invested in Hinds Irrigated Plot Area)
excludes Residence Halls1 Total Invested in Endowed Capital Assets 754except for computer classrooms)
Library Activities 255,659 4.5% Inventory of Land Total 11,443
Other Institutional Activities 521,915 9.3%(includes Veterinary DiagnosticLaboratory, Farm House Museum, Other Land Statistics (as of 2012)
Soil Testing, etc.) Miles of campus sidewalk & bike paths 34Operations and Maintenance 272,299 4.8% Miles of institutional roads 23
(excludes circulation, mechanical, Acres of parking lots 162custodial, restrooms, and unusable space) Acres of central campus green space 26
Nonassigned Areas 134,421 2.4%
Building Facilities Total 5,626,777 100.0%
1 Residence Halls, not included above, total 3,424,222 gross square feet.
Office of Institutional Research (Source: Facilities Planning and Management, Accounting Office)
Last Updated 12/17/2015
––NET ASSIGNABLE SQUARE FEET––
0.0%
5.0%
10.0%
15.0%
20.0%
25.0%
30.0%
35.0%
Building Facilties by Function and Percent of Assignable Square Feet