instituto nacional de pesquisas espaciais/ centro de

1
MC Forti ([email protected]), SP Crispim, RLM Alcaide, NL Garcia, M Almeida, JR Chagas, WMG Andrade, JC Santos. Instituto Nacional de Pesquisas Espaciais/ Centro de Ciência do Sistema Terrestre INPE/CCST Study the chemical composition of the São Paulo state atmosphere using a system of low cost based on sampling denuder 1 and implementing a strategy for quantifying the concentration of various chemical species especially reactive nitrogen (Nr). Here it is presented the preliminary results for São José dos Campos (SJC) and Cachoeira Paulista (CP) respectively, sites 3 and 2 on figure 1. The content of nitrogen reactive forms in excess in the atmosphere negatively influences the environment, human health and climate leading to severe environmental changes. This study presents the preliminary results of a study conducted at São Paulo State to characterize chemically the apportionment between the particulate and gaseous phases examining some inorganic chemical species. Figure1 – Sites location of DELTA* systems in São Paulo State where: 1: Cunha; 2: Cachoeira Paulista; 3: São José dos Campos ; 4:São Paulo; 5: São Carlos; 6: Assis e 7: Teodoro Sampaio * DEnuder for Long-Term Atmospheric sampling – Figure 1 and Table 1 presents time evolution and the statistics, respectively for the sites considered in this study. As the SFU system samples a larger particle spectrum as well as the product of gas-particle conversion, the volumetric concentrations are, as expected, larger than the ones obtained with the DELTA, which collects a narrow particle size spectrum as well as the apportionment between the gas phase from the particle ones. Both phases presents lower concentration during rainfall events, however, particle- NH 4 + concentration has a peak after rainfall period probably due to soil emission. Unexpected is the fact that the gas-phase in CP is higher than in SJC reflecting the presence of sources of gases such as SO 2 , NO x and NH 3 which can be confirmed by the results obtained with the SFU system whose values for the fine and coarse particles presents no statistically significant differences being the fine ones mainly derived from gas-particle conversion. Fapesp Proc. 2012/06416-1, INCT-MC and IAI/5-CRN3 for financial support, MCTI through the PCI program, and E.Honda, M.Ranzini, F.C.S. Arcova, J.B.A. dos Santos, R.R.Cardoso, S.Souza, G.Pedrosa, A.P.Barbassa and J.B. Rosa for field support. 1 Sutton M.A., Tang Y.S., Miners B. e D. Fowler, Water, Air and Soil Pollution. Focus, 2001, 1(5/6), 1456. This study presents results from São José dos Campos/SP-Br: SJC – urban site and Cachoeira Paulista/SP-Br: CP-rural site. Studied period: August 2013 until July 2014. Sampling technique: train of denuders and stacked filters 1 for gas-particles phase on active substrate (DELTA*) and dichotomous stacked filter unit (SFU) for PM 2.5 and PM 2.5-10 on neutral substrate. Gas phase chemicals: HNO 3 , NO x as NO 3 - ; SO 2 as SO 4 2- , HCl as Cl - and NH 3 as NH 4 + . Particulate phase: NH 4 + , NO 3 - , SO 4 2- and Cl - ionic soluble forms. Table 1 – Statistics for the observed values for the DELTA (g-gas and p-particle phases) and SFU (fine - MP 2.5-10 and coarse - MP 10 fractions) systems in ng.m -3 , where AVG: mean values, STD: standard deviation, Count: observation number, Min: minimum value and Max: maximum value. Underlined pair presents statically significant difference. 0 10 20 30 40 50 60 70 80 90 0,00 1,00 2,00 3,00 4,00 5,00 6,00 7,00 1 2 3 4 5 6 7 8 9 10 11 12 13 14 15 16 17 18 mm g.m -3 Título do Eixo São José dos Campos Gas phase SJCl-g SJNO3-g SJSO4-g SJNH4-g SJC-Pre 0 20 40 60 80 100 120 140 160 180 0 10 20 30 40 50 60 70 1 2 3 4 5 6 7 8 9 10 11 12 13 14 15 16 17 18 mm g.m -3 Título do Eixo Cachoeira Paulista Gas phase CPCl-g CPNO3-g CPSO4-g CPNH4-g CP-Prec 0 10 20 30 40 50 60 70 80 90 0,00 1,00 2,00 3,00 4,00 5,00 6,00 7,00 8,00 1 2 3 4 5 6 7 8 9 10 11 12 13 14 15 16 17 18 mm g.m -3 Título do Eixo São José dos Campos Particle phase SJCl-p SJN03-p SJS04-p SJNH4-p SJC-Pre 0 20 40 60 80 100 120 140 160 180 0,00 0,50 1,00 1,50 2,00 2,50 3,00 3,50 4,00 1 2 3 4 5 6 7 8 9 10 11 12 13 14 15 16 17 18 mm g.m -3 Título do Eixo Cachoeira Paulista Particle phase CPCl-p CPN03-p CPS04-p CPNH4-p CP-Prec Figure 1 – Concentration time evolution (ng.m -3 ) for the gas and particle phase for both sites: Aug2013- Jul2014 The results indicate an effective contribution from industrial sources as well as from combustion of fossil fuel for SJC while in CP although with characteristics of a region with livestock sources seems to have another important sources that must be better investigated to allow its identification. In addition, it is observed that the active substrates are more efficient in collecting PM than that of the neutral ones and that the latter may underestimate the contribution of gaseous phase for the formation of the particulate matter (PM). São José dos Campos Cachoeira Paulista DELTA Gas phase Count AVG STD Min Max Count AVG STD Min Max g.m -3 g.m -3 Cl- 17 0.207 0.217 0.000 0.811 17 8.90 17.7 0.003 61.5 NO 3 - 17 0.531 0.506 0.001 1.56 17 5.50 7.59 0.012 29.4 SO 4 2- 17 1.08 1.53 0.004 5.91 17 7.35 6.77 0.051 18.6 NH 4 + 17 0.374 0.370 0.001 1.06 17 1.74 1.66 0.004 5.49 Particle phase Cl- 18 0.396 0.462 0.000 1.99 18 0.085 0.088 0.000 0.323 NO 3 - 18 1.42 1.21 0.000 4.69 18 0.280 0.212 0.050 0.723 SO 4 2- 18 1.53 1.86 0.000 6.81 18 0.178 0.140 0.001 0.411 NH 4 + 18 1.08 0.765 0.113 3.56 18 0.768 0.977 0.146 3.71 SFU Count AVG STD Min Max Count AVG STD Min Max g.m -3 g.m -3 MP 2.5 Cl- 43 0.166 0.137 0.0048 0.396 34 0.083 0.076 0.0025 0.271 NO 3 - 43 0.393 0.310 0.003 1.288 34 0.442 0.456 0.0059 1.478 SO 4 2- 43 0.621 0.472 0.052 2.283 34 0.762 0.547 0.067 2.263 NH 4 + 43 0.330 0.217 0.094 0.817 34 0.277 0.176 0.0081 0.684 MP 2.5-10 Cl- 38 0.247 0.214 0.0019 0.750 38 0.167 0.268 0.0019 1.544 NO 3 - 38 0.549 0.457 0.00259 1.488 38 0.429 0.393 0.023.3 1.958 SO 4 2- 38 0.278 0.214 0.0478 1.035 38 0.192 0.175 0.00 0.892 NH 4 + 38 0.153 0.212 0.0000 0.830 38 0.109 0.136 0.0052 0.511

Upload: others

Post on 23-Mar-2022

2 views

Category:

Documents


0 download

TRANSCRIPT

MC Forti ([email protected]), SP Crispim, RLM Alcaide, NL Garcia, M Almeida, JR Chagas, WMG Andrade, JC Santos.Instituto Nacional de Pesquisas Espaciais/ Centro de Ciência do Sistema Terrestre – INPE/CCST

Study the chemical composition of the São Paulo state atmosphereusing a system of low cost based on sampling denuder1 and implementing astrategy for quantifying the concentration of various chemical species especiallyreactive nitrogen (Nr). Here it is presented the preliminary results for São José dosCampos (SJC) and Cachoeira Paulista (CP) respectively, sites 3 and 2 on figure 1.

The content of nitrogen reactive forms in excess in the atmospherenegatively influences the environment, human health and climate leading to severeenvironmental changes. This study presents the preliminary results of a studyconducted at São Paulo State to characterize chemically the apportionmentbetween the particulate and gaseous phases examining some inorganic chemicalspecies.

Figure1 – Sites location of DELTA* systems in São Paulo State where: 1: Cunha; 2: Cachoeira Paulista; 3: São José dos Campos; 4:São Paulo; 5: São Carlos; 6: Assise 7: Teodoro Sampaio* DEnuder for Long-Term Atmospheric sampling

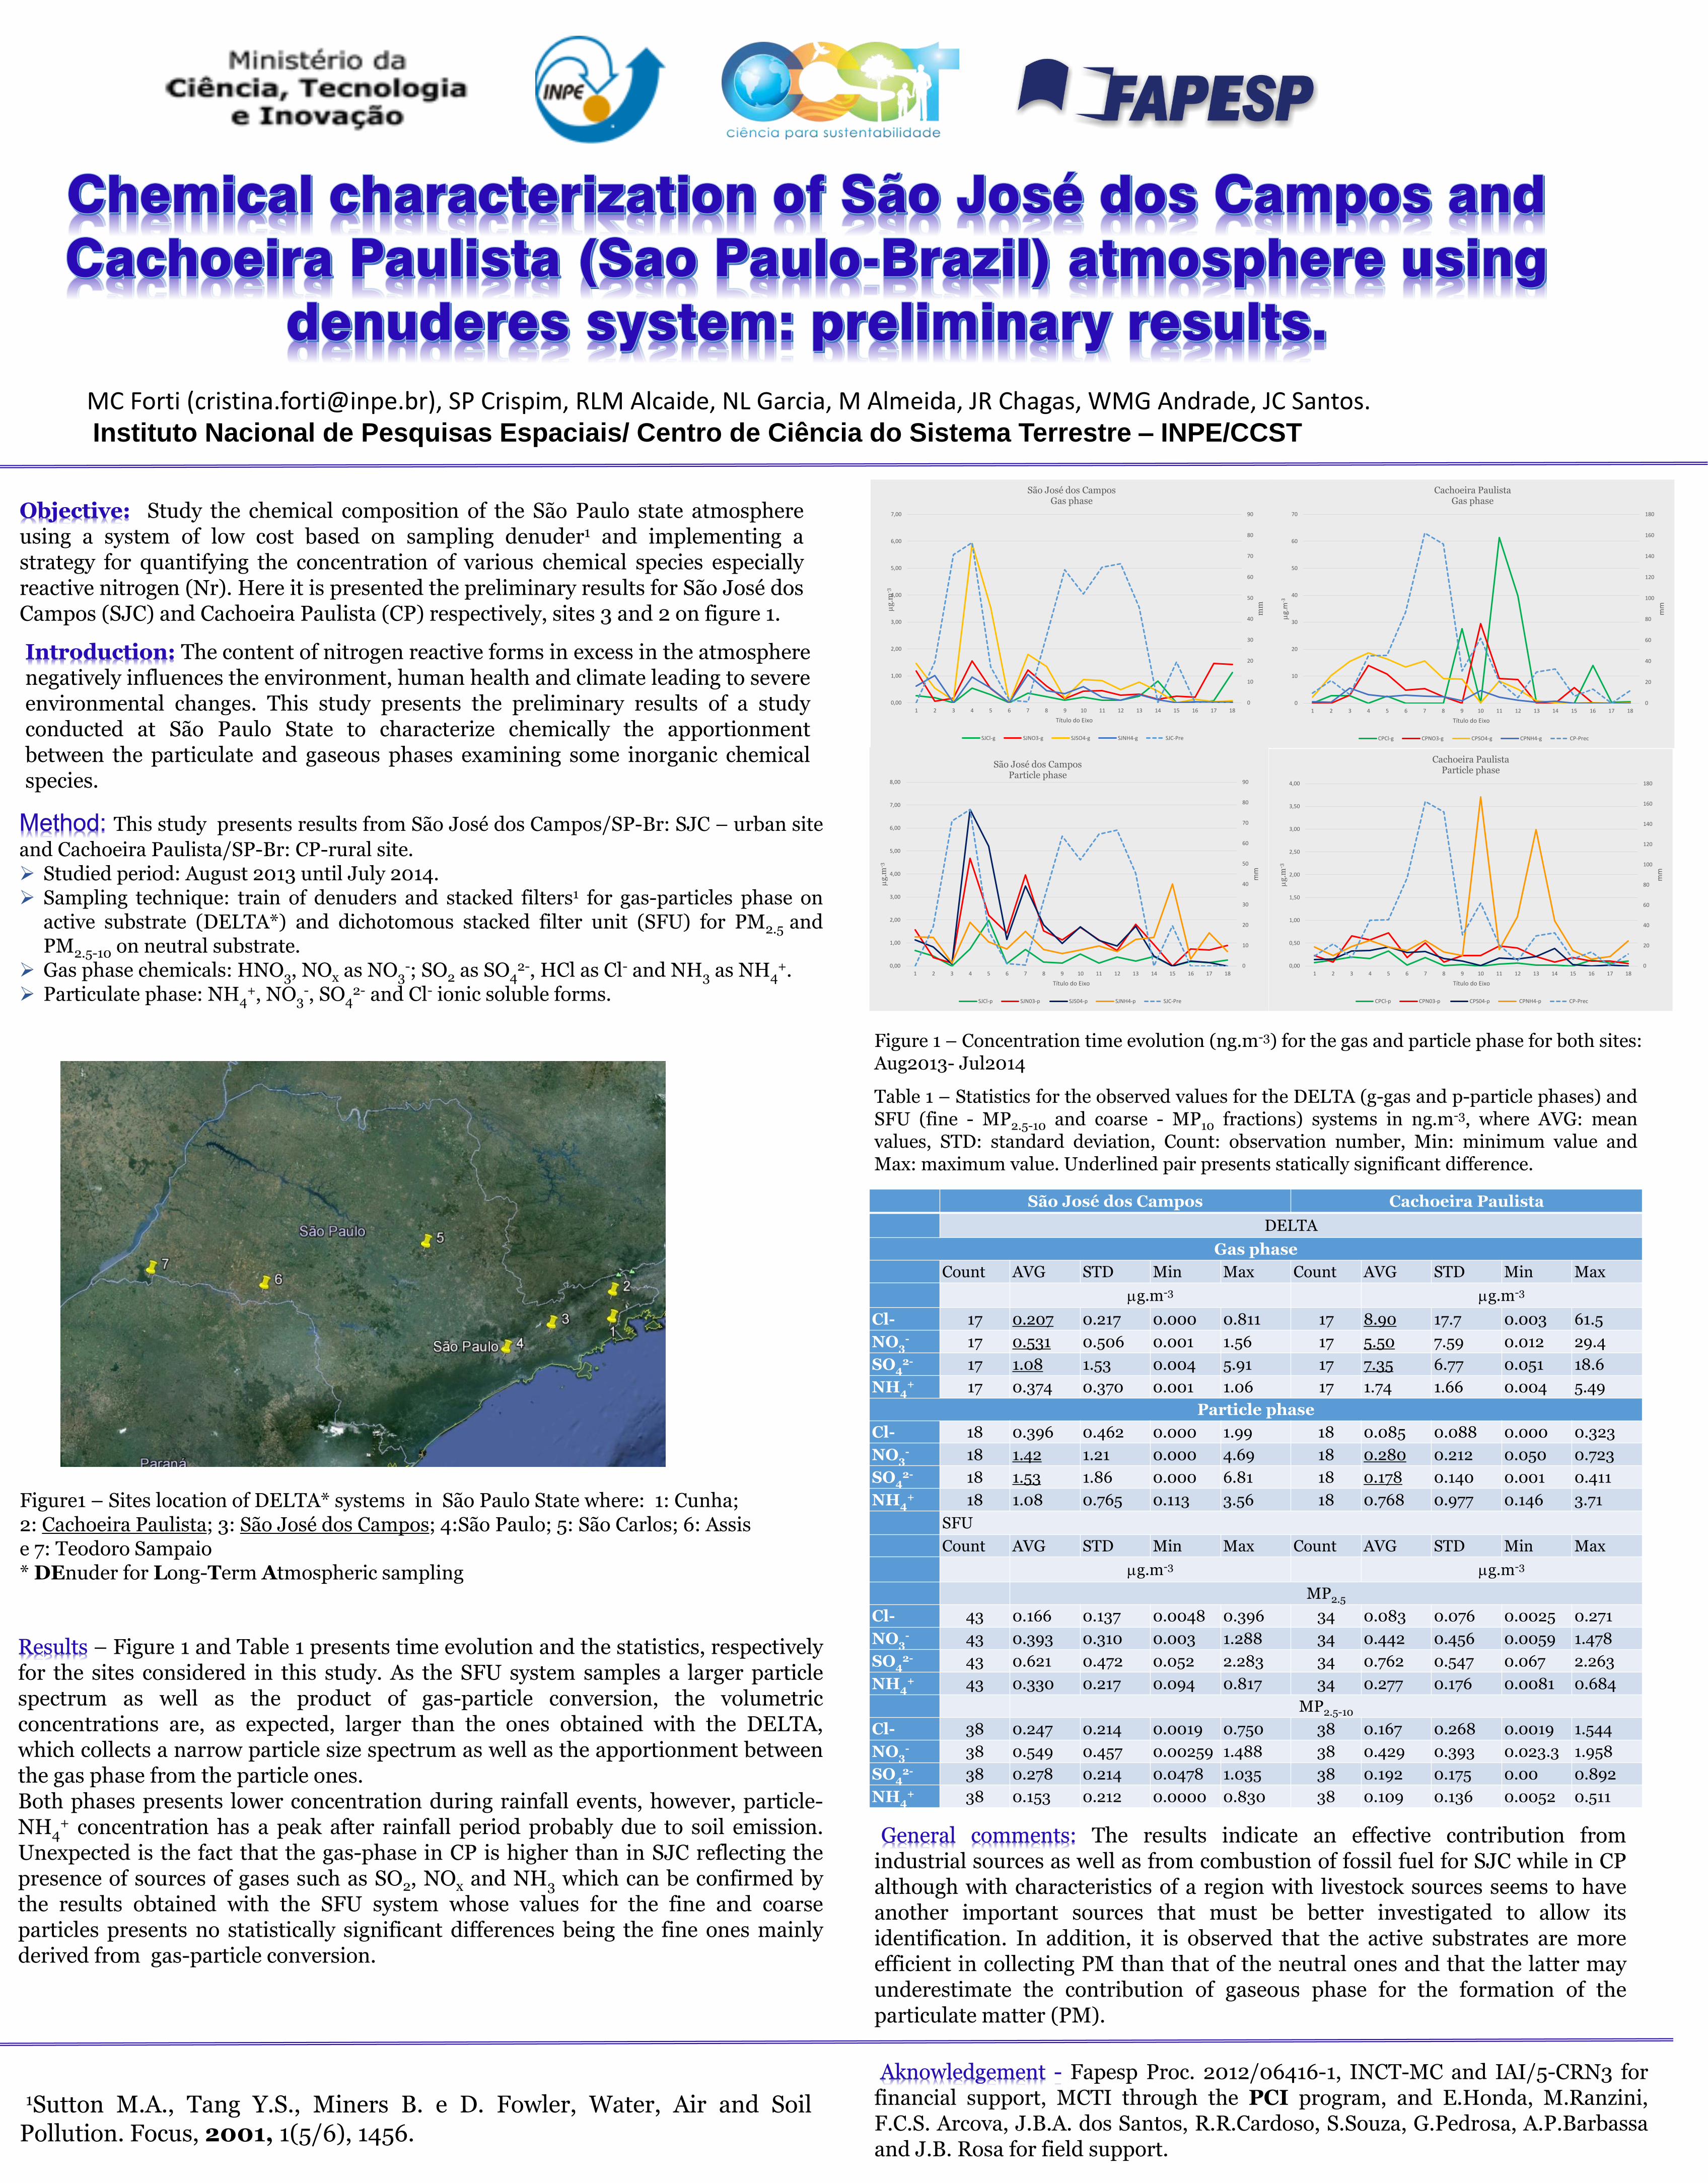
– Figure 1 and Table 1 presents time evolution and the statistics, respectivelyfor the sites considered in this study. As the SFU system samples a larger particlespectrum as well as the product of gas-particle conversion, the volumetricconcentrations are, as expected, larger than the ones obtained with the DELTA,which collects a narrow particle size spectrum as well as the apportionment betweenthe gas phase from the particle ones.Both phases presents lower concentration during rainfall events, however, particle-NH4

+ concentration has a peak after rainfall period probably due to soil emission.Unexpected is the fact that the gas-phase in CP is higher than in SJC reflecting thepresence of sources of gases such as SO2, NOx and NH3 which can be confirmed bythe results obtained with the SFU system whose values for the fine and coarseparticles presents no statistically significant differences being the fine ones mainlyderived from gas-particle conversion.

Fapesp Proc. 2012/06416-1, INCT-MC and IAI/5-CRN3 forfinancial support, MCTI through the PCI program, and E.Honda, M.Ranzini,F.C.S. Arcova, J.B.A. dos Santos, R.R.Cardoso, S.Souza, G.Pedrosa, A.P.Barbassaand J.B. Rosa for field support.

1Sutton M.A., Tang Y.S., Miners B. e D. Fowler, Water, Air and SoilPollution. Focus, 2001, 1(5/6), 1456.

This study presents results from São José dos Campos/SP-Br: SJC – urban site

and Cachoeira Paulista/SP-Br: CP-rural site. Studied period: August 2013 until July 2014. Sampling technique: train of denuders and stacked filters1 for gas-particles phase on

active substrate (DELTA*) and dichotomous stacked filter unit (SFU) for PM2.5 andPM2.5-10 on neutral substrate.

Gas phase chemicals: HNO3, NOx as NO3-; SO2 as SO4

2-, HCl as Cl- and NH3 as NH4+.

Particulate phase: NH4+, NO3

-, SO42- and Cl- ionic soluble forms.

Table 1 – Statistics for the observed values for the DELTA (g-gas and p-particle phases) andSFU (fine - MP2.5-10 and coarse - MP10 fractions) systems in ng.m-3, where AVG: meanvalues, STD: standard deviation, Count: observation number, Min: minimum value andMax: maximum value. Underlined pair presents statically significant difference.

0

10

20

30

40

50

60

70

80

90

0,00

1,00

2,00

3,00

4,00

5,00

6,00

7,00

1 2 3 4 5 6 7 8 9 10 11 12 13 14 15 16 17 18

mmg

.m-3

Título do Eixo

São José dos CamposGas phase

SJCl-g SJNO3-g SJSO4-g SJNH4-g SJC-Pre

0

20

40

60

80

100

120

140

160

180

0

10

20

30

40

50

60

70

1 2 3 4 5 6 7 8 9 10 11 12 13 14 15 16 17 18

mm

g.

m-3

Título do Eixo

Cachoeira PaulistaGas phase

CPCl-g CPNO3-g CPSO4-g CPNH4-g CP-Prec

0

10

20

30

40

50

60

70

80

90

0,00

1,00

2,00

3,00

4,00

5,00

6,00

7,00

8,00

1 2 3 4 5 6 7 8 9 10 11 12 13 14 15 16 17 18

mm

g

.m-3

Título do Eixo

São José dos CamposParticle phase

SJCl-p SJN03-p SJS04-p SJNH4-p SJC-Pre

0

20

40

60

80

100

120

140

160

180

0,00

0,50

1,00

1,50

2,00

2,50

3,00

3,50

4,00

1 2 3 4 5 6 7 8 9 10 11 12 13 14 15 16 17 18

mm

g

.m-3

Título do Eixo

Cachoeira PaulistaParticle phase

CPCl-p CPN03-p CPS04-p CPNH4-p CP-Prec

Figure 1 – Concentration time evolution (ng.m-3) for the gas and particle phase for both sites: Aug2013- Jul2014

The results indicate an effective contribution fromindustrial sources as well as from combustion of fossil fuel for SJC while in CPalthough with characteristics of a region with livestock sources seems to haveanother important sources that must be better investigated to allow itsidentification. In addition, it is observed that the active substrates are moreefficient in collecting PM than that of the neutral ones and that the latter mayunderestimate the contribution of gaseous phase for the formation of theparticulate matter (PM).

São José dos Campos Cachoeira Paulista

DELTA

Gas phase

Count AVG STD Min Max Count AVG STD Min Max

g.m-3 g.m-3

Cl- 17 0.207 0.217 0.000 0.811 17 8.90 17.7 0.003 61.5

NO3- 17 0.531 0.506 0.001 1.56 17 5.50 7.59 0.012 29.4

SO42- 17 1.08 1.53 0.004 5.91 17 7.35 6.77 0.051 18.6

NH4+ 17 0.374 0.370 0.001 1.06 17 1.74 1.66 0.004 5.49

Particle phase

Cl- 18 0.396 0.462 0.000 1.99 18 0.085 0.088 0.000 0.323

NO3- 18 1.42 1.21 0.000 4.69 18 0.280 0.212 0.050 0.723

SO42- 18 1.53 1.86 0.000 6.81 18 0.178 0.140 0.001 0.411

NH4+ 18 1.08 0.765 0.113 3.56 18 0.768 0.977 0.146 3.71

SFU

Count AVG STD Min Max Count AVG STD Min Max

g.m-3 g.m-3

MP2.5

Cl- 43 0.166 0.137 0.0048 0.396 34 0.083 0.076 0.0025 0.271

NO3- 43 0.393 0.310 0.003 1.288 34 0.442 0.456 0.0059 1.478

SO42- 43 0.621 0.472 0.052 2.283 34 0.762 0.547 0.067 2.263

NH4+ 43 0.330 0.217 0.094 0.817 34 0.277 0.176 0.0081 0.684

MP2.5-10

Cl- 38 0.247 0.214 0.0019 0.750 38 0.167 0.268 0.0019 1.544

NO3- 38 0.549 0.457 0.00259 1.488 38 0.429 0.393 0.023.3 1.958

SO42- 38 0.278 0.214 0.0478 1.035 38 0.192 0.175 0.00 0.892

NH4+ 38 0.153 0.212 0.0000 0.830 38 0.109 0.136 0.0052 0.511