instruction manual - testo · instrument configuration ... 5.8.1. graphic view ... operating system...
TRANSCRIPT
testo Comfort Software Professional 4
Instruction manual

2
1 Contents
3
1 Contents 1 Contents ................................................................................................... 3 2 About this document ............................................................................... 5 3 Specifications .......................................................................................... 6
3.1. Use .................................................................................................. 6 3.2. System requirements ....................................................................... 6
4 First steps ................................................................................................ 7 4.1. Installing the software/driver ............................................................ 7 4.2. Starting the software ........................................................................ 7
5 Using the product .................................................................................... 9 5.1. User interface .................................................................................. 9 5.2. Menus ............................................................................................ 10
5.2.1. Start ............................................................................................................... 10 5.2.2. Edit ................................................................................................................ 12 5.2.3. Axes............................................................................................................... 15 5.2.4. Template ........................................................................................................ 15 5.2.5. Options .......................................................................................................... 16 5.2.6. Style template ................................................................................................ 17
5.3. Setting up a connection ................................................................. 17 5.3.1. Automatic connection ..................................................................................... 17 5.3.2. Setting up a connection manually .................................................................. 18
5.4. Configuring the data loggers testo 175 and testo 176 ................... 18 5.4.1. Opening a connection .................................................................................... 18 5.4.2. Performing settings ........................................................................................ 19 5.4.3. Instrument configuration ................................................................................ 25 5.4.4. Disconnecting the connection ........................................................................ 25
5.5. Configuring the instrument testo x35 ............................................. 26 5.5.1. Opening a connection .................................................................................... 26 5.5.2. Instrument control .......................................................................................... 26 5.5.3. Disconnecting the connection ........................................................................ 32 5.5.4. Online measurement ...................................................................................... 32
5.6. Configuring the testo 184 data logger ............................................ 33 5.6.1. Opening a connection .................................................................................... 33 5.6.2. Making settings .............................................................................................. 33 5.6.3. Saving settings .............................................................................................. 35 5.6.4. Loading saved settings .................................................................................. 35 5.6.5. Disconnecting the connection ........................................................................ 35
5.7. Reading out measurement data .................................................... 35
1 Contents
4
5.8. Analyzing series of measurements ............................................... 37 5.8.1. Graphic view .................................................................................................. 37
5.8.1.1. Enlarging the view ........................................................................... 37 5.8.1.2. Information on a reading (crosshairs) .............................................. 37 5.8.1.3. Text field .......................................................................................... 38 5.8.1.4. Characteristics of a curve ................................................................ 38 5.8.1.5. Settings for the axes in the diagram ................................................ 43
5.8.2. Table view ..................................................................................................... 46 5.8.2.1. Marking readings ............................................................................. 46 5.8.2.2. Dropping the marking ...................................................................... 47 5.8.2.3. Determining largest reading ............................................................ 47 5.8.2.4. Determining the smallest reading .................................................... 47 5.8.2.5. Add rows ......................................................................................... 47 5.8.2.6. Compress ........................................................................................ 47 5.8.2.7. Drop compression ........................................................................... 47
5.9. Creating evaluations ..................................................................... 48 5.9.1. Printing measurement data ............................................................................ 48
6 Tips and assistance .............................................................................. 49 6.1. Questions and answers ................................................................ 49

2 About this document
5
2 About this document
Use > Please read this documentation through carefully and
familiarize yourself with the product before putting it to use. Pay particular attention to the safety instructions and warning advice in order to prevent injuries and damage to the products.
> Keep this document to hand so that you can refer to it when necessary.
> Hand this documentation on to any subsequent users of the product.
Knowledge of Windows® operating systems is required when working with the software.
Symbols and writing standards
Representa-tion
Explanation
Note: Basic or further information.
1. ... 2. ...
Action: more steps, the sequence must be followed.
> ... Action: a step or an optional step.
- ... Result of an action.
Menu Elements of the program interface.
[OK] Buttons of the program interface.
... | ... Functions/paths within a menu.
“...” Example entries
3 Specifications
6
3 Specifications
3.1. Use
The testo Comfort Software Professional 4 serves the purpose of saving, reading out and analysing individual readings and measurement series. The graphical presentation of readings is the main task of this program. Readings are measured with Testo measuring instruments and transmitted to the PC via a interface. Reading out data is accomplished with the testo Comfort Software Professional 4, which activates the interfaces and provides all functions. For each Testo instrument / system there is a matching device driver that is especially adapted to the capabilities of the instrument hardware and its control. Measured readings are recorded with date and time. In case of ONLINE measurements the values are permanently updated.
3.2. System requirements
Operating system The software can be run on the following operating systems: • Windows® 7 • Windows® 8.1 • Windows® 10
Computer The computer must meet the requirements of the corresponding operating system. The following requirements must additionally be fulfilled: • Interface USB 2.0 or higher • Internet Explorer 9.0 or higher
Date and time settings will be automatically accepted by the PC. The administrator must make sure that the system time is regularly compared with a reliable time source and adjusted, if necessary, to ensure authenticity of the measurement data.
4 First steps
7
4 First steps
4.1. Installing the software/driver
Administrator rights are required for installation.
1. Insert the program CD into the CD-ROM drive of the computer. - Installation program starts automatically > If the installation program does not start automatically:
Open CD drive in Windows Explorer | Start Setup.exe (double-click on left mouse button).
2. Follow the directions of the installation wizard. 3. To complete the software installation: Click on [Finish]. - The software was installed successfully on the computer After completion of the software installation, the instrument must be connected to the PC to continue with the driver installation. 4. Connect the instrument to the PC using the USB cable. - The connection will be established. - The driver installation will be executed automatically. 5. To complete the driver installation: Click on [Finish]. - The driver for Comfort Software Professional 4 was installed
successfully on the computer.
4.2. Starting the software
Starting the Comfort software
The user interface of the software is opened in the language of the operating system, if it is supported. If the operating system language is not supported, the user interface will be in English.
Windows program menu 1. Windows® 7 > Click on [Start] | All Programs | Testo | Comfort Software
Professional 4 (double-click on left mouse button).
Windows® 8 > [Start] | Right mouse button | Search | Enter the application
name in the search field | Click on Comfort Software Professional 4 (double-click on left mouse button).
Windows® 10
4 First steps
8
> Click on [Start] | All Apps | Testo | Click on Comfort Software Professional 4 (double-click on left mouse button).
2. When the User Account Control window opens: Click on [Yes].
- The user name and password prompt opens.
Please take note of the following information regarding the user name and password: • User name and password are not linked. • The password serves the purpose of protecting the
adjustment data within the probe to prevent unauthorised changes. The password is saved to the probe, and each probe is issued an individual password.
3. Enter the user name. 4. Enter the password. If you have not yet issued an individual
password: Enter “testo”. 5. Click on [OK]. - Comfort Software Professional 4 will start.
5 Using the product
9
5 Using the product
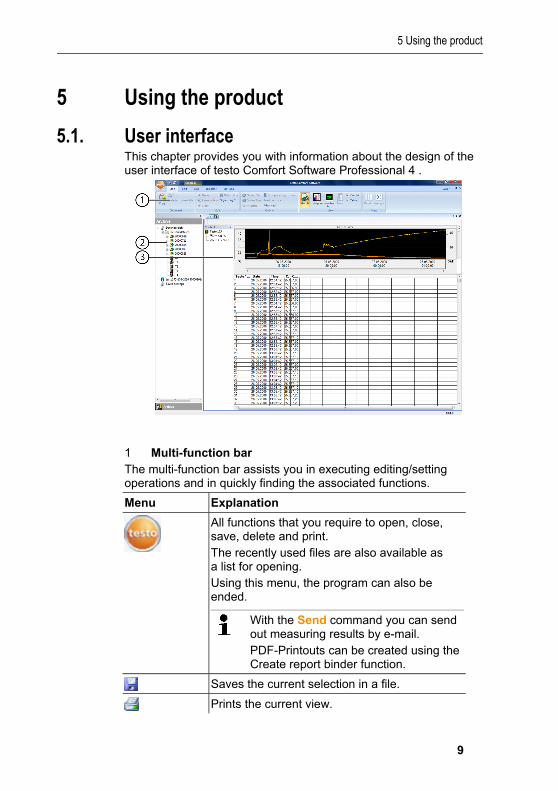
5.1. User interface This chapter provides you with information about the design of the user interface of testo Comfort Software Professional 4 .
1 Multi-function bar The multi-function bar assists you in executing editing/setting operations and in quickly finding the associated functions.
Menu Explanation
All functions that you require to open, close, save, delete and print. The recently used files are also available as a list for opening. Using this menu, the program can also be ended.
With the Send command you can send out measuring results by e-mail. PDF-Printouts can be created using the Create report binder function.
Saves the current selection in a file.
Prints the current view.
5 Using the product
10
Menu Explanation
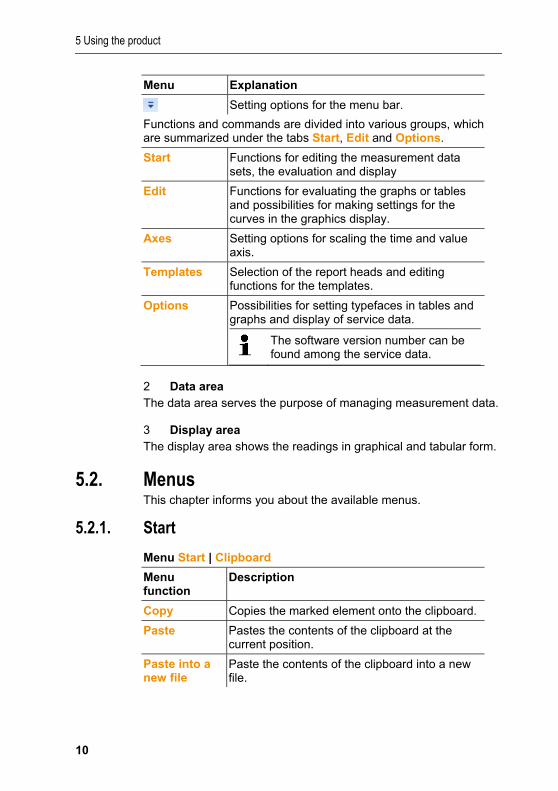
Setting options for the menu bar.
Functions and commands are divided into various groups, which are summarized under the tabs Start, Edit and Options.
Start Functions for editing the measurement data sets, the evaluation and display
Edit Functions for evaluating the graphs or tables and possibilities for making settings for the curves in the graphics display.
Axes Setting options for scaling the time and value axis.
Templates Selection of the report heads and editing functions for the templates.
Options Possibilities for setting typefaces in tables and graphs and display of service data.
The software version number can be found among the service data.
2 Data area The data area serves the purpose of managing measurement data.
3 Display area The display area shows the readings in graphical and tabular form.
5.2. Menus This chapter informs you about the available menus.
5.2.1. Start
Menu Start | Clipboard
Menu function
Description
Copy Copies the marked element onto the clipboard.
Paste Pastes the contents of the clipboard at the current position.
Paste into a new file
Paste the contents of the clipboard into a new file.

5 Using the product
11
Menu Start | Create reports
Menu function
Description
Create report Create a report in pdf format.
Graphic Enable/disable graphic display of data.
Table Enable/disable tabular display of data.
Alarms Enable/disable display of alarms.
Portrait / Landscape
Sets the orientation of the PDF.
Menu Start | Edit
Menu function
Description
Open Opens the marked element; e.g. the data from a group.
Rename Renames the marked element.
Delete item Deletes the marked element.
Close Closes the marked element; e.g. the data of a group.
Organizing Set up a new instrument, new folder/location.
Menu Start | Online
Menu function
Description
Set up a storage device
The configuration page associated with the selected instrument is displayed. This is adapted to the corresponding instruments and provides the settings options that are available.
Online start Start Online measurement. The measurement data are automatically displayed in the display area.
Online stop Stop a progressing online measurement.
Cycle control Set the meas. rate for the Online measurement. The minimum adjustable meas. rate depends on the instrument and is checked accordingly.
Read out data Saves a resultant report to hard disk and opens it in the display area.
5 Using the product
12
Menu function
Description
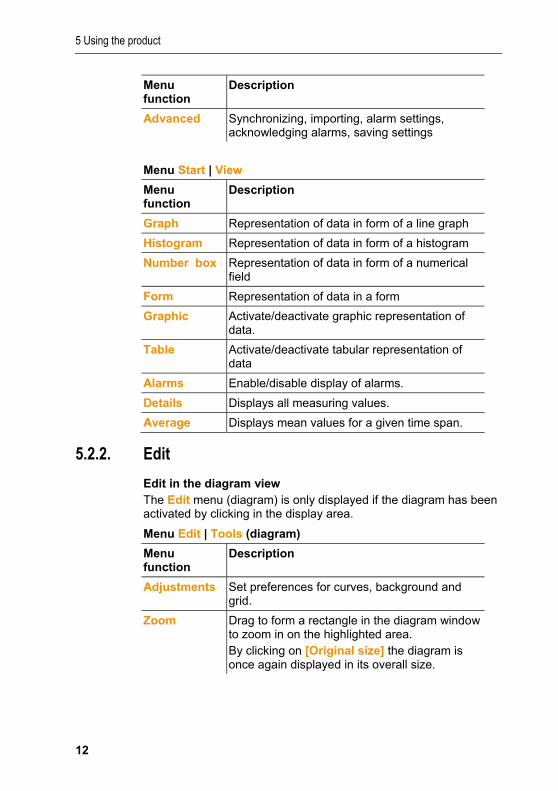
Advanced Synchronizing, importing, alarm settings, acknowledging alarms, saving settings
Menu Start | View
Menu function
Description
Graph Representation of data in form of a line graph
Histogram Representation of data in form of a histogram
Number box Representation of data in form of a numerical field
Form Representation of data in a form
Graphic Activate/deactivate graphic representation of data.
Table Activate/deactivate tabular representation of data
Alarms Enable/disable display of alarms.
Details Displays all measuring values.
Average Displays mean values for a given time span.
5.2.2. Edit
Edit in the diagram view The Edit menu (diagram) is only displayed if the diagram has been activated by clicking in the display area.
Menu Edit | Tools (diagram)
Menu function
Description
Adjustments Set preferences for curves, background and grid.
Zoom Drag to form a rectangle in the diagram window to zoom in on the highlighted area. By clicking on [Original size] the diagram is once again displayed in its overall size.
5 Using the product
13
Menu function
Description
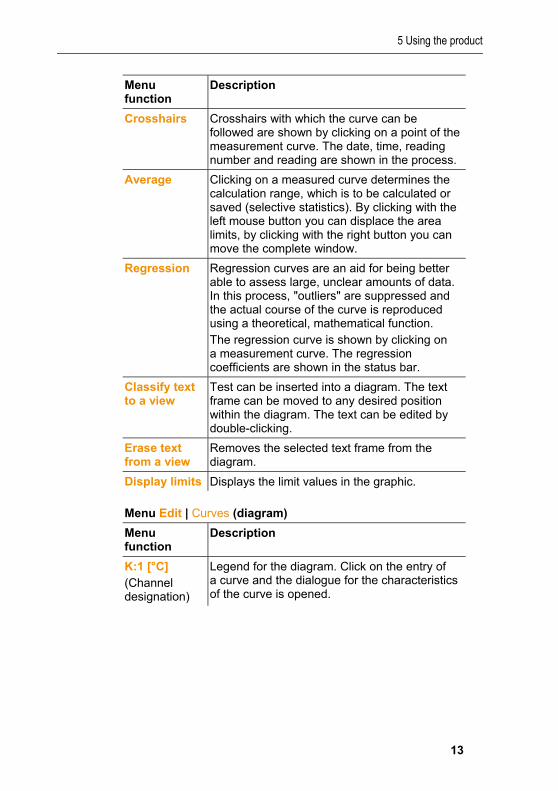
Crosshairs Crosshairs with which the curve can be followed are shown by clicking on a point of the measurement curve. The date, time, reading number and reading are shown in the process.
Average Clicking on a measured curve determines the calculation range, which is to be calculated or saved (selective statistics). By clicking with the left mouse button you can displace the area limits, by clicking with the right button you can move the complete window.
Regression Regression curves are an aid for being better able to assess large, unclear amounts of data. In this process, "outliers" are suppressed and the actual course of the curve is reproduced using a theoretical, mathematical function. The regression curve is shown by clicking on a measurement curve. The regression coefficients are shown in the status bar.
Classify text to a view
Test can be inserted into a diagram. The text frame can be moved to any desired position within the diagram. The text can be edited by double-clicking.
Erase text from a view
Removes the selected text frame from the diagram.
Display limits Displays the limit values in the graphic.
Menu Edit | Curves (diagram)
Menu function
Description
K:1 [°C] (Channel designation)
Legend for the diagram. Click on the entry of a curve and the dialogue for the characteristics of the curve is opened.
5 Using the product
14
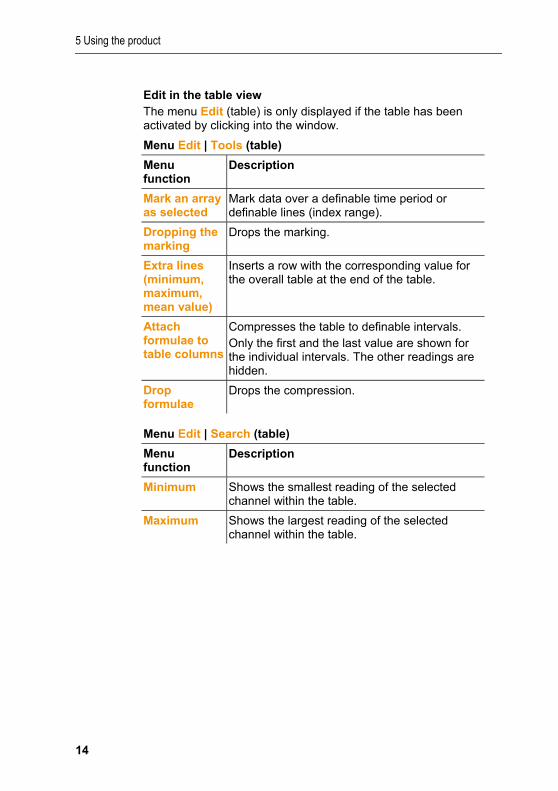
Edit in the table view The menu Edit (table) is only displayed if the table has been activated by clicking into the window.
Menu Edit | Tools (table)
Menu function
Description
Mark an array as selected
Mark data over a definable time period or definable lines (index range).
Dropping the marking
Drops the marking.
Extra lines (minimum, maximum, mean value)
Inserts a row with the corresponding value for the overall table at the end of the table.
Attach formulae to table columns
Compresses the table to definable intervals. Only the first and the last value are shown for the individual intervals. The other readings are hidden.
Drop formulae
Drops the compression.
Menu Edit | Search (table)
Menu function
Description
Minimum Shows the smallest reading of the selected channel within the table.
Maximum Shows the largest reading of the selected channel within the table.

5 Using the product
15
5.2.3. Axes
Edit in the diagram view Menu Edit | Axes (diagram)
Menu function
Description
Upper limit Maximum of the shown range of values.
Lower limit Minimum of the shown range of values.
Division Scaling of the value axis.
Menu Edit | Time axis (diagram)
Menu function
Description
Division Scaling of the time axis.
5.2.4. Template
Template in diagram and table view
Menu Template | Template (diagram and table view) Select a standard template in this menu into which the data that are to be saved or printed are integrated. The templates differ in the protocol header, meaning in the company logo, the address field or the specification of statistical values.
Menu Template | Edit
Menu function
Description
Edit template Enables the editing of an existing template.
New template Enables the creation of a new template.
5 Using the product
16
5.2.5. Options
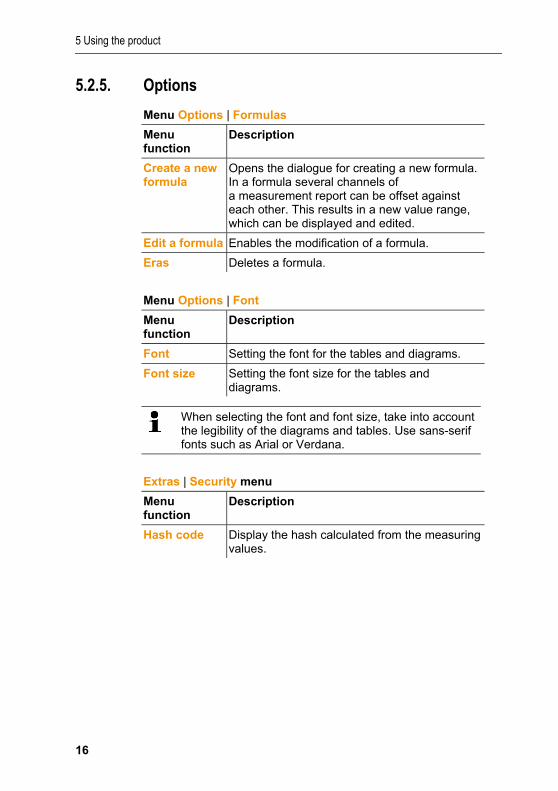
Menu Options | Formulas
Menu function
Description
Create a new formula
Opens the dialogue for creating a new formula. In a formula several channels of a measurement report can be offset against each other. This results in a new value range, which can be displayed and edited.
Edit a formula Enables the modification of a formula.
Eras Deletes a formula.
Menu Options | Font
Menu function
Description
Font Setting the font for the tables and diagrams.
Font size Setting the font size for the tables and diagrams.
When selecting the font and font size, take into account the legibility of the diagrams and tables. Use sans-serif fonts such as Arial or Verdana.
Extras | Security menu
Menu function
Description
Hash code Display the hash calculated from the measuring values.
5 Using the product
17
Menu Options | Service
Menu function
Description
Display service data
Creates a text file with the required information, e.g. the software version number, for Customer Service if servicing is required.
If the service data cannot be displayed under Windows® Vista, start the WordPad program and save, for example, an empty file of your choice in *.wri format. To do so, manually enter the file extension behind the file name. A link is thus formed between the file and the service data and WordPad.
5.2.6. Style template Selection of the colour scheme for the program window.
5.3. Setting up a connection
5.3.1. Automatic connection
Instruments from the product ranges
• testo 175 and testo 176 • x35 • testo 184
establish a connection automatically.
✓ testo Comfort Software Professional 4 is installed, see
Installing the software/driver page 7.
✓ Instrument is connected to the PC, see separate instruction
manual for the instrument. > Start testo Comfort Software Professional 4. - Instruments from the product ranges testo 175 and testo 176,
x35, testo 184 now connect automatically. A name for the connection is automatically created.

5 Using the product
18
5.3.2. Setting up a connection manually ✓ testo Comfort Software Professional 4 has been installed, see
Installing the software/driver page 7.
✓ Instrument is connected to the PC, see separate operating
instructions for the instrument. 1. Start testo Comfort Software Professional 4. 2. Select Start > Organise > New device. - The window New instrument setup wizard opens. 3. Select the desired instrument from the instrument selection list
and click on Next. 4. Enter the name for the connection and click on Finish. - The connection to the instrument has been set up. The name of
the connection appears in the window Archive. 5. Press OK to confirm.
5.4. Configuring the data loggers testo 175 and testo 176
5.4.1. Opening a connection > Double-click into the window Archive on the connection that is
to be opened.
- If a measurement report is stored in the data logger, the saved
data will be transferred and report icon together with the abridged name of the report log will appear under the opened connection.
Using a connection for several data loggers
You can connect different data loggers using an established connection. When changing the data logger the connection must be disconnected and subsequently set up again for the new data logger, as otherwise it may not be identified by the software (see Instrument configuration , page25)
5 Using the product
19
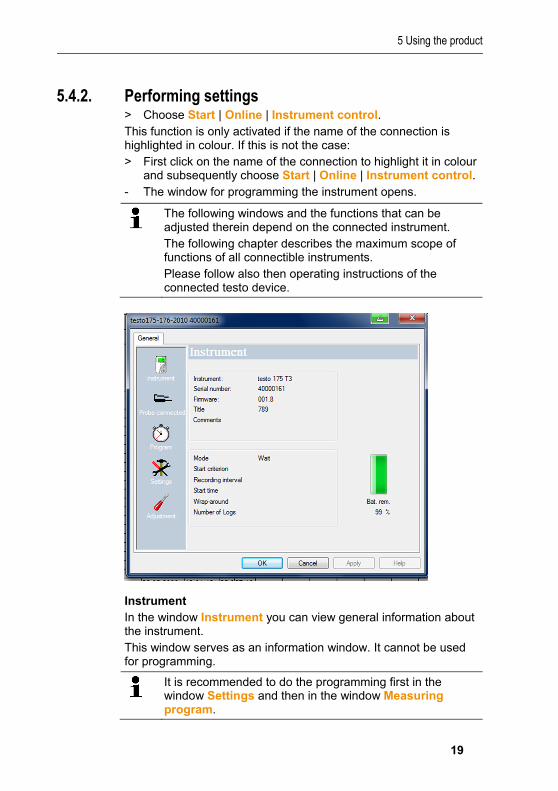
5.4.2. Performing settings > Choose Start | Online | Instrument control. This function is only activated if the name of the connection is highlighted in colour. If this is not the case: > First click on the name of the connection to highlight it in colour
and subsequently choose Start | Online | Instrument control. - The window for programming the instrument opens.
The following windows and the functions that can be adjusted therein depend on the connected instrument. The following chapter describes the maximum scope of functions of all connectible instruments. Please follow also then operating instructions of the connected testo device.
Instrument In the window Instrument you can view general information about the instrument. This window serves as an information window. It cannot be used for programming.
It is recommended to do the programming first in the window Settings and then in the window Measuring program.
5 Using the product
20
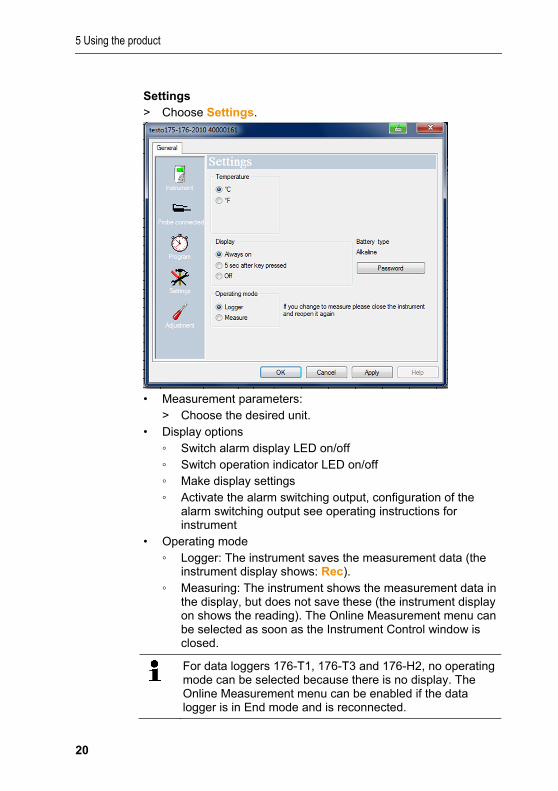
Settings > Choose Settings.
• Measurement parameters:
> Choose the desired unit. • Display options
◦ Switch alarm display LED on/off ◦ Switch operation indicator LED on/off ◦ Make display settings ◦ Activate the alarm switching output, configuration of the
alarm switching output see operating instructions for instrument
• Operating mode ◦ Logger: The instrument saves the measurement data (the
instrument display shows: Rec). ◦ Measuring: The instrument shows the measurement data in
the display, but does not save these (the instrument display on shows the reading). The Online Measurement menu can be selected as soon as the Instrument Control window is closed.
For data loggers 176-T1, 176-T3 and 176-H2, no operating mode can be selected because there is no display. The Online Measurement menu can be enabled if the data logger is in End mode and is reconnected.
5 Using the product
21
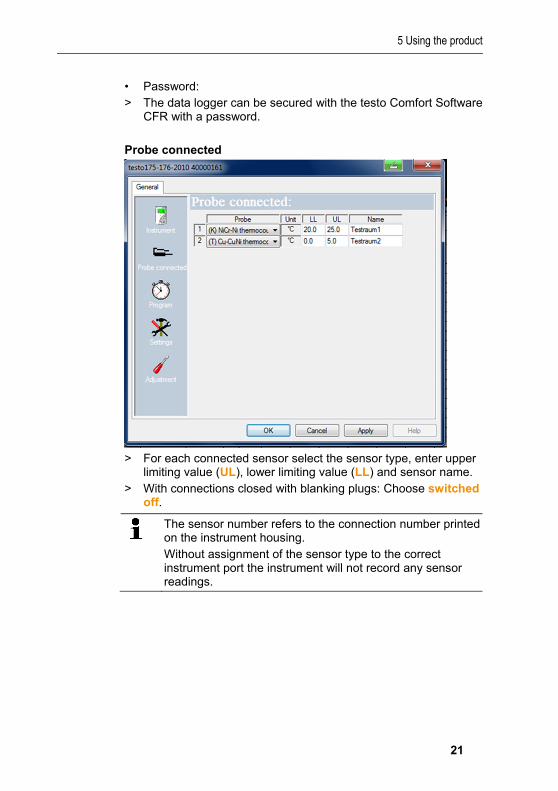
• Password: > The data logger can be secured with the testo Comfort Software
CFR with a password.
Probe connected
> For each connected sensor select the sensor type, enter upper
limiting value (UL), lower limiting value (LL) and sensor name. > With connections closed with blanking plugs: Choose switched
off.
The sensor number refers to the connection number printed on the instrument housing. Without assignment of the sensor type to the correct instrument port the instrument will not record any sensor readings.
5 Using the product
22
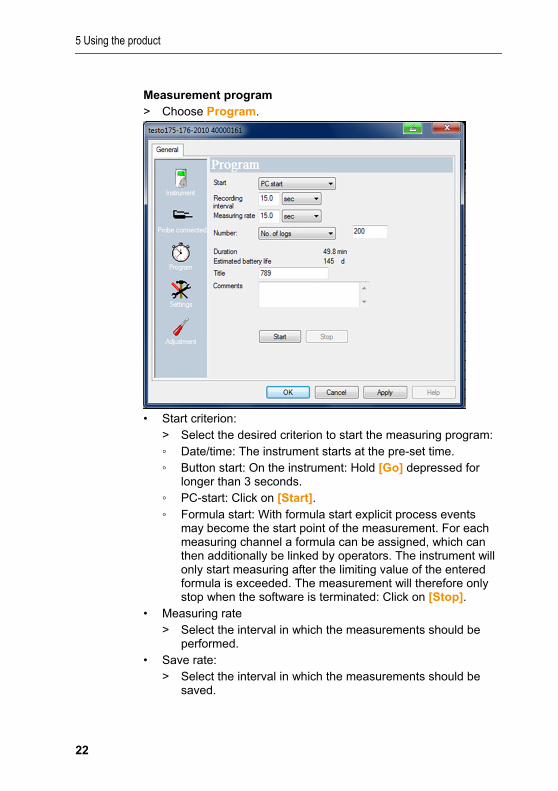
Measurement program > Choose Program.
• Start criterion:
> Select the desired criterion to start the measuring program: ◦ Date/time: The instrument starts at the pre-set time. ◦ Button start: On the instrument: Hold [Go] depressed for
longer than 3 seconds. ◦ PC-start: Click on [Start]. ◦ Formula start: With formula start explicit process events
may become the start point of the measurement. For each measuring channel a formula can be assigned, which can then additionally be linked by operators. The instrument will only start measuring after the limiting value of the entered formula is exceeded. The measurement will therefore only stop when the software is terminated: Click on [Stop].
• Measuring rate > Select the interval in which the measurements should be
performed. • Save rate:
> Select the interval in which the measurements should be saved.
5 Using the product
23
The save rate must be a multiple of the meas. rate.
• Stop criterion: > Select the desired criterion to stop the measuring program: ◦ Memory full: The instrument stops the measurement as
soon as the instrument memory is full. ◦ Number of measurements: The instrument stops the
measurement as soon as the defined number of readings has been obtained.
◦ Circular buffer memory: If the memory is full, the instrument will first overwrite the "oldest" readings. The measurement will therefore only stop when the software is terminated: Click on [Stop].
• Channel designation: > Enter the name for the measuring channels.
• LL: > Enter the lower limiting value.
• UL: > Enter the upper limiting value.
• Duration: Specifies the runtime of the measuring program, which has been calculated on the basis of the values start criterion, meas. rate and stop criterion. When selecting the stop criterion "circular buffer memory" the duration is calculated until the memory is full once.
• Battery life: Specifies the presumable battery life.
The expected battery life shown is calculated on the basis of the set measuring/memory cycle.
• Abridged title: > Enter the abridged title for the measuring program
(maximum 15 characters). The abridged title of the measuring program is taken on by the software testo Comfort Software Professional 4 when the data logger is read out.
• Info: > Enter additional information to the measuring program
(maximum 70 characters). • Send to:
> Enter the e-mail address.
5 Using the product
24
The PC must have access to the Internet to be able to send the e-mail.
• Start and Stop: > Click on Start to start a measuring program.
This function is only available for selection if the start criterion PC-start has been selected and the measuring program has been transferred to the data logger (see following section: Finish programming).
> Click on Stop to quit a measuring program.
This function is only available for selection when a measurement is in progress (data logger in operating status Rec).
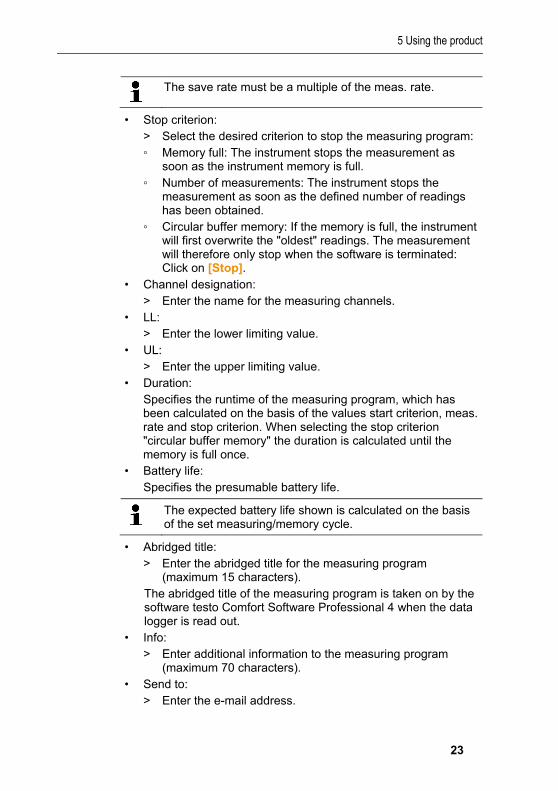
Measurement protocol
The window Protocol only appears if a measuring program has been performed and has been saved in the instrument. The window Protocol is a sole information window. It cannot be used for programming.
5 Using the product
25
Finish programming
✓ The data logger is in operating status Wait or End.
1. Click on Accept to transfer the measuring program to the data logger.
If a measurement is in progress (status Rec): > Quit the measurement: Click on Stop. - The window Programming data pops up to confirm the
programming that has taken place. 2. Click on OK. - Programming has been completed.
5.4.3. Instrument configuration
Save
✓ The data logger is in operating status Wait or End.
✓ The configuration is complete and has been stored.
1. Click Start | Online | Advanced | Save settings to save the instrument configuration created.
2 Enter a name to save it under and press [OK]. - The instrument configuration is stored with the specified name
under Saved settings.
Load
✓ The data logger is correctly connected to the PC and is
displayed. 1. Click on the saved setting and drag onto the name of the data
logger. 2 Confirm the information window that appears with [OK]. 3 In the subsequent input window enter the abridged title, info
and starting time, check the box if the instrument is to be restarted and confirm with [OK].
- The saved settings have been transferred to the data logger.
5.4.4. Disconnecting the connection 1. In the window Archive click on the connection that is to be
disconnected. 2. Choose Close. - The connection to the data logger is disconnected.
5 Using the product
26
Kt.becker
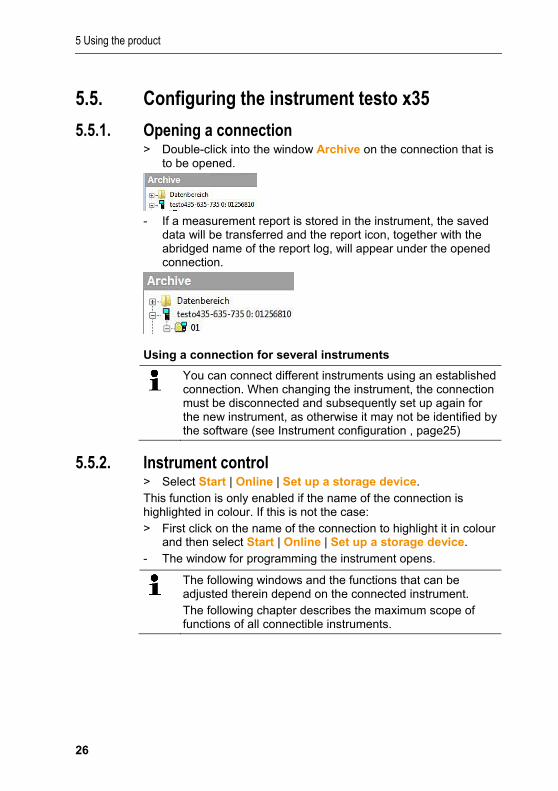
5.5. Configuring the instrument testo x35
5.5.1. Opening a connection > Double-click into the window Archive on the connection that is
to be opened.
- If a measurement report is stored in the instrument, the saved
data will be transferred and the report icon, together with the abridged name of the report log, will appear under the opened connection.
Using a connection for several instruments
You can connect different instruments using an established connection. When changing the instrument, the connection must be disconnected and subsequently set up again for the new instrument, as otherwise it may not be identified by the software (see Instrument configuration , page25)
5.5.2. Instrument control > Select Start | Online | Set up a storage device. This function is only enabled if the name of the connection is highlighted in colour. If this is not the case: > First click on the name of the connection to highlight it in colour
and then select Start | Online | Set up a storage device. - The window for programming the instrument opens.
The following windows and the functions that can be adjusted therein depend on the connected instrument. The following chapter describes the maximum scope of functions of all connectible instruments.
5 Using the product
27
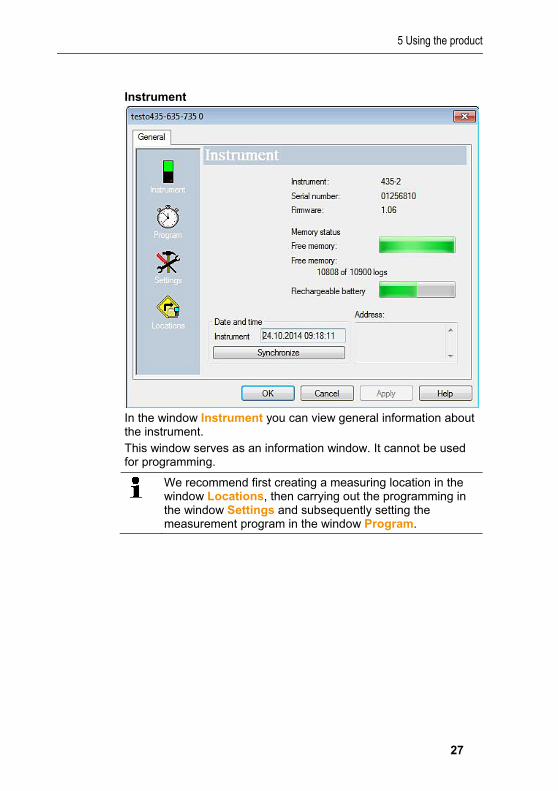
Instrument
In the window Instrument you can view general information about the instrument. This window serves as an information window. It cannot be used for programming.
We recommend first creating a measuring location in the window Locations, then carrying out the programming in the window Settings and subsequently setting the measurement program in the window Program.
5 Using the product
28
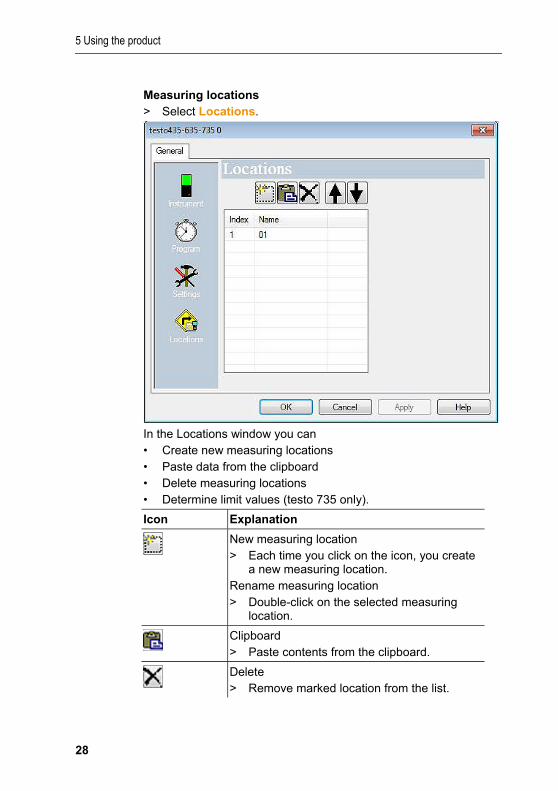
Measuring locations > Select Locations.
In the Locations window you can • Create new measuring locations • Paste data from the clipboard • Delete measuring locations • Determine limit values (testo 735 only).
Icon Explanation
New measuring location > Each time you click on the icon, you create
a new measuring location. Rename measuring location > Double-click on the selected measuring
location.
Clipboard > Paste contents from the clipboard.
Delete > Remove marked location from the list.
5 Using the product
29
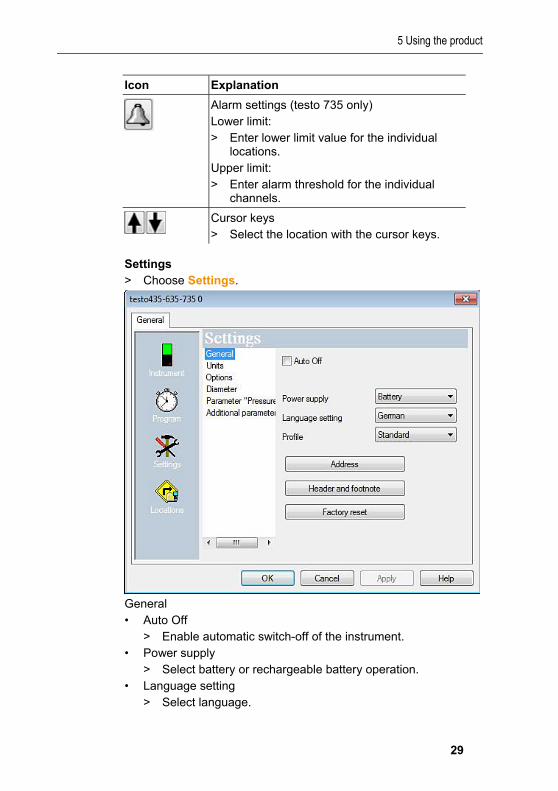
Icon Explanation
Alarm settings (testo 735 only) Lower limit: > Enter lower limit value for the individual
locations. Upper limit: > Enter alarm threshold for the individual
channels.
Cursor keys > Select the location with the cursor keys.
Settings > Choose Settings.
General • Auto Off
> Enable automatic switch-off of the instrument. • Power supply
> Select battery or rechargeable battery operation. • Language setting
> Select language.

5 Using the product
30
• Profile > Set standard, tour, long-term measurement.
• Address ◦ Create customer address ◦ Enter information on the measuring location.
• Header and footer > The header and footer for printout on the protocol printer
can be adapted • Factory reset
The instrument is reset to the factory settings.
Units > Select units for the individual measurement parameters.
Options > Enable/disable volumetric flow measurement. Cross-section (testo 435 only) > Select cross-section. “Pressure” parameter > Carry out density calculation. Other parameters (testo 635 only) > Set heat transfer coefficient. Material characteristic curves (testo 635 only) > Edit existing material characteristic curves. Calibration data (testo 735 only) > Display stored calibration data.
5 Using the product
31
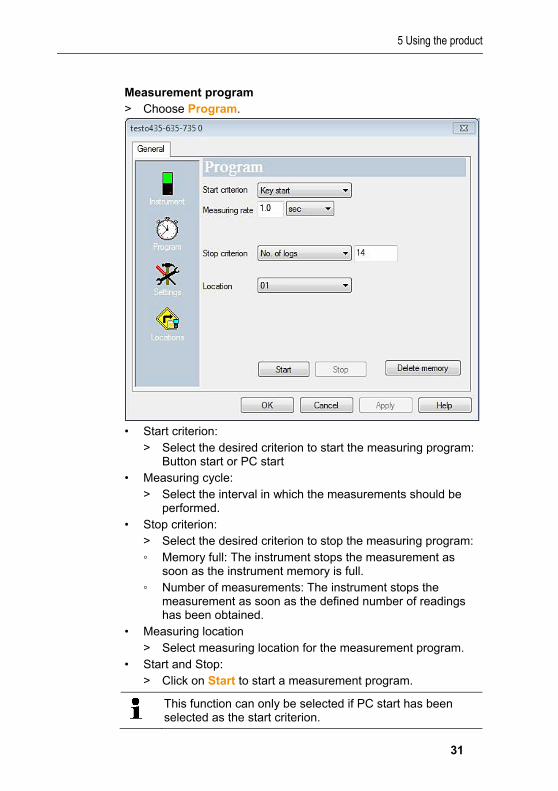
Measurement program > Choose Program.
• Start criterion:
> Select the desired criterion to start the measuring program: Button start or PC start
• Measuring cycle: > Select the interval in which the measurements should be
performed. • Stop criterion:
> Select the desired criterion to stop the measuring program: ◦ Memory full: The instrument stops the measurement as
soon as the instrument memory is full. ◦ Number of measurements: The instrument stops the
measurement as soon as the defined number of readings has been obtained.
• Measuring location > Select measuring location for the measurement program.
• Start and Stop: > Click on Start to start a measurement program.
This function can only be selected if PC start has been selected as the start criterion.

5 Using the product
32
> Click on Stop to quit a measuring program.
This function can only be selected if a measurement is being performed.
• Delete memory: > All data stored in the instrument is deleted. > Click on Start to start a measurement program.
Finish programming
✓ Instrument is in the operating status Slave mode.
> Click on Apply to transfer the measurement program to the instrument.
5.5.3. Disconnecting the connection 1. In the window Archive click on the connection that is to be
disconnected. 2. Choose Close. - The instrument is disconnected.
5.5.4. Online measurement Online start > Start online measurement: Online-Start - The measurement data is automatically displayed in the work
area. Online stop > Stop online measurement: Online-Stop - The resulting log in the work area can now also be saved on the
hard drive. Control measurement > Set the measuring cycle for the online measurement:
Cycle control
The minimum adjustable measuring cycle depends on the instrument and is checked accordingly.
- The data is stored in a temporary file on the hard drive. Kt.becker
5 Using the product
33
5.6. Configuring the testo 184 data logger
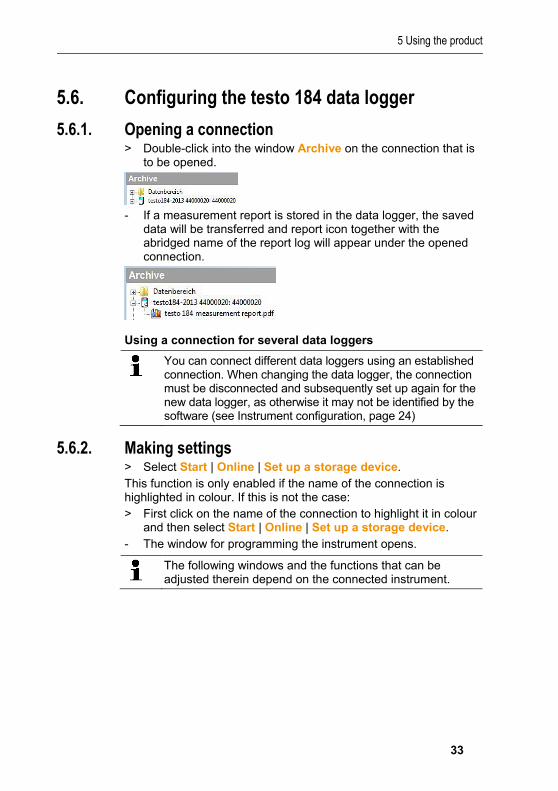
5.6.1. Opening a connection > Double-click into the window Archive on the connection that is
to be opened.
- If a measurement report is stored in the data logger, the saved
data will be transferred and report icon together with the abridged name of the report log will appear under the opened connection.
Using a connection for several data loggers
You can connect different data loggers using an established connection. When changing the data logger, the connection must be disconnected and subsequently set up again for the new data logger, as otherwise it may not be identified by the software (see Instrument configuration, page 24)
5.6.2. Making settings > Select Start | Online | Set up a storage device. This function is only enabled if the name of the connection is highlighted in colour. If this is not the case: > First click on the name of the connection to highlight it in colour
and then select Start | Online | Set up a storage device. - The window for programming the instrument opens.
The following windows and the functions that can be adjusted therein depend on the connected instrument.

5 Using the product
34
Limit values and PDF report The data logger can be configured on the Limits and Report tab. The same functions are available as in the configuration via the PDF file saved on the data logger testo 184 configuration pdf in Expert mode.
Finish programming
✓ The data logger is in operating status Wait or End.
1. Click on Apply to transfer the measurement program to the data logger.
If a measurement is in progress (status Rec): > Quit the measurement: Click on [Stop]. 2. Click on OK. - Programming has been completed.
5 Using the product
35
5.6.3. Saving settings
Save
✓ The data logger is in operating status Wait or End.
✓ The configuration is complete and has been stored.
1. Click Start | Online | Advanced | Save settings to save the instrument configuration created.
2. Enter a name to save it under and press [OK]. - The instrument configuration is stored with the specified name
under Save settings.
5.6.4. Loading saved settings
Load
✓ The data logger is correctly connected to the PC and is
displayed. 1. Click on Save settings and drag onto the name of the data
logger. 2. Confirm the information window that appears with [OK]. 3. In the subsequent input window enter the abridged title, info
and starting time, check the box if the instrument is to be restarted and confirm with [OK].
- The saved settings have been transferred to the data logger.
5.6.5. Disconnecting the connection 1. > In the window Archive click on the connection that is to be
disconnected. 2. Choose Close. - The connection to the data logger is disconnected.
5.7. Reading out measurement data
Depending on the volume of data the representation of measurement data may take a few minutes. The status bar at the bottom of the display area informs about the progress of data transfer.
From the instrument
✓ Set up the connection to the instrument, see Setting up a connection page 17.
> In the data area double-click on the report to be opened.
5 Using the product
36
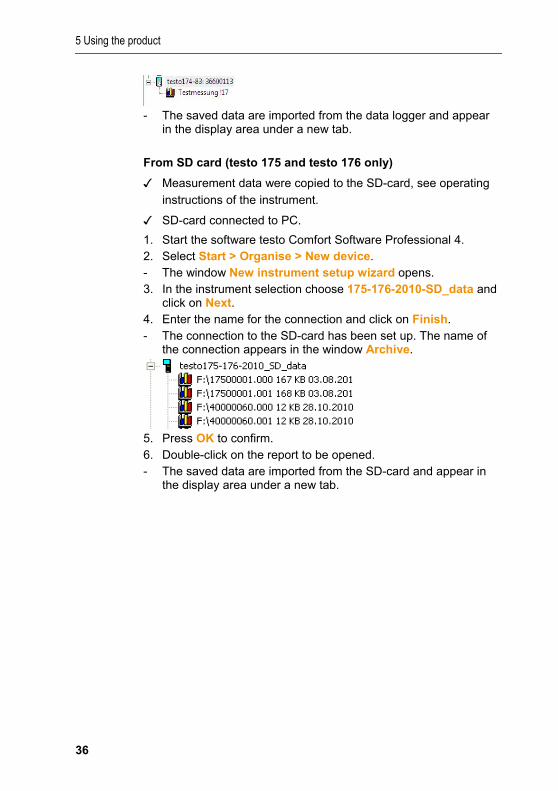
- The saved data are imported from the data logger and appear
in the display area under a new tab.
From SD card (testo 175 and testo 176 only)
✓ Measurement data were copied to the SD-card, see operating
instructions of the instrument.
✓ SD-card connected to PC.
1. Start the software testo Comfort Software Professional 4. 2. Select Start > Organise > New device. - The window New instrument setup wizard opens. 3. In the instrument selection choose 175-176-2010-SD_data and
click on Next. 4. Enter the name for the connection and click on Finish. - The connection to the SD-card has been set up. The name of
the connection appears in the window Archive.
5. Press OK to confirm. 6. Double-click on the report to be opened. - The saved data are imported from the SD-card and appear in
the display area under a new tab.
5 Using the product
37
5.8. Analyzing series of measurements You can represent series of measurements as a diagram or a table. > In the Start | View menu, select the
• Activate Graphic if the data is to be displayed graphically or • Activate Table if the data is to be displayed in tabular form.
5.8.1. Graphic view In this view, the readings are shown as line diagrams. In the Start | View menu, the Graphics command is activated.
> If necessary, deactivate channels via the checkboxes for the display.
You can show or hide the gridlines for the corresponding axis by clicking on the time axis or the value axis.
5.8.1.1. Enlarging the view Zoom in on a detail of the diagram to check the behavior of the readings within a specific time span, for example. 1. Click on Edit | Tools | Zoom in. 2. In the diagram, use the left mouse button, pressed and held, to
highlight the area that should be shown enlarged.
Click on [Original size] and the entire diagram is shown again.
5.8.1.2. Information on a reading (crosshairs) If you move your crosshairs along a curve, you will quickly receive detailed information on the individual readings. 1. Click on Edit | Tools | Crosshairs. 2. In the diagram, click on the point for which the details should be
shown. - A dialogue with the following information on the reading is
shown: • date on which the reading was recorded, • time at which the reading was recorded,
5 Using the product
38
• number of the reading and • reading.
You can move along the curve with the left mouse button pressed and held and thereby see the individual information for the readings. In doing this, it is not necessary to exactly follow the course of the curve; the crosshairs does this automatically if you move the mouse to the right or left.
5.8.1.3. Text field Insert a text field to enter comments and additional information in the curve.
Insert text field
The text field may potentially cover parts of the curve. In this event, the text field must be positioned in such a way to ensure that the curve is not concealed.
1. Click on Edit | Tools | Insert text. - A text field is displayed in the diagram. 2. Fill the text field with the required content. 3. Click on the border of the text field and move it so that the curve
is not concealed.
Delete text field 1. Click on the text field and remove all the contents. - The text field is deleted.
5.8.1.4. Characteristics of a curve You can adapt the representation of a measurement series to your requirements. For example, you can change the line weight of a curve or the representation of the limit values in the diagram. 1. Change to the diagram view of the measurement series, the
characteristics of which are to be displayed. 2. Click in the Edit | Curves menu on the entry of the curve, the
characteristics of which are to be displayed. - The Characteristics of (name of curve) dialogue is opened. The following tabs are available in the dialogue: • Curve tab • Range limits tab • Statistical computation tab. • Data sequence tab
5 Using the product
39
Buttons of the dialogue
Button Explanation
[OK] Applies the changed settings. The dialogue is closed.
[Cancel] Closes the dialogue without applying the changes.
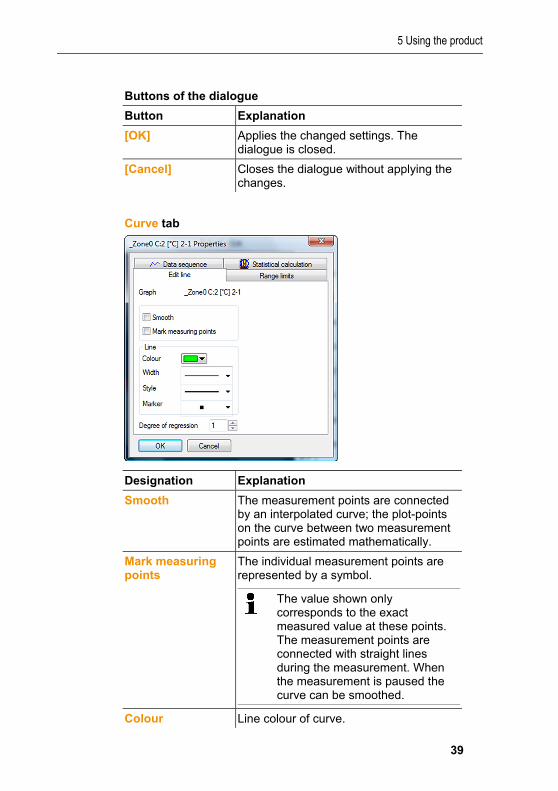
Curve tab
Designation Explanation
Smooth The measurement points are connected by an interpolated curve; the plot-points on the curve between two measurement points are estimated mathematically.
Mark measuring points
The individual measurement points are represented by a symbol.
The value shown only corresponds to the exact measured value at these points. The measurement points are connected with straight lines during the measurement. When the measurement is paused the curve can be smoothed.
Colour Line colour of curve.

5 Using the product
40
Designation Explanation
Width Line weight of curve.
Style Line pattern of curve.
Marker Symbol for the measurement points.
Degree of regression
Possible values "0" to "7". The "0" degree represents a pure mean calculation, the "1" degree of regression the linear trend, a higher value helps in the event of curves with several extreme values.
Range limits tab
Designation Explanation
Display area limit Specification as to whether the limit values should be shown in the diagram.
Add limit labels Specification as to whether the limit values should be labelled (Upper/Lower limit value: name of curve).
Area fill Specification as to whether the areas outside of the limit values should be marked by means of an area fill.
Selection list for area fill
Selection of the fill.
Line fill Specification as to whether the limit values should by means of horizontal
5 Using the product
41
Designation Explanation
lines.
Selection lists for line fill
Selection lists for line type and line thickness.
Overshoot Colour selection for the fill of the area above the upper limit value.
Undershoot Colour selection for the fill of the area below the lower limit value.
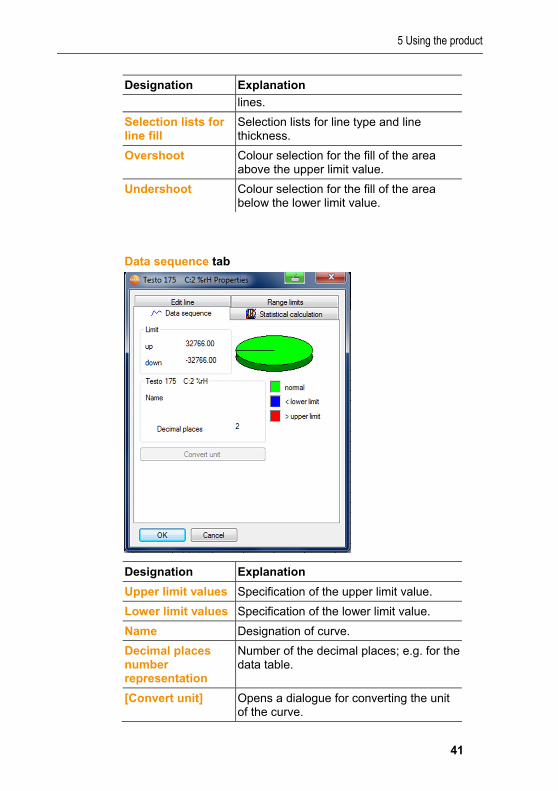
Data sequence tab
Designation Explanation
Upper limit values Specification of the upper limit value.
Lower limit values Specification of the lower limit value.
Name Designation of curve.
Decimal places number representation
Number of the decimal places; e.g. for the data table.
[Convert unit] Opens a dialogue for converting the unit of the curve.
5 Using the product
42
Designation Explanation
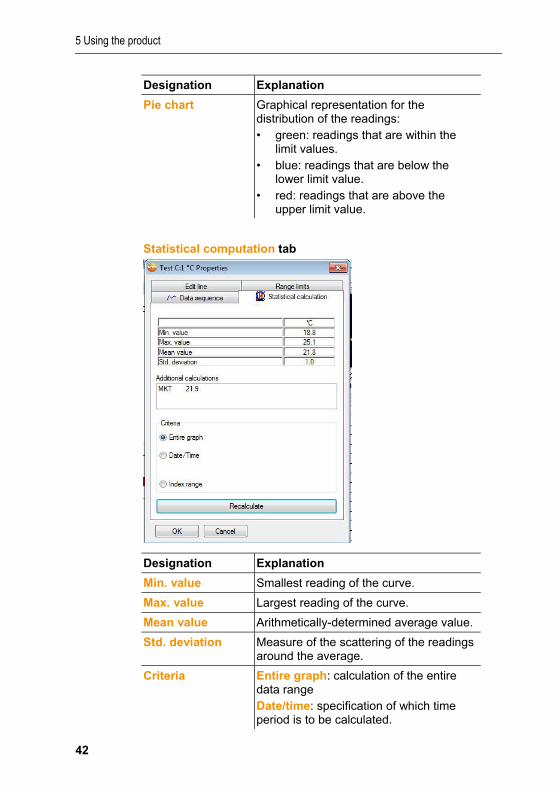
Pie chart Graphical representation for the distribution of the readings: • green: readings that are within the
limit values. • blue: readings that are below the
lower limit value. • red: readings that are above the
upper limit value.
Statistical computation tab
Designation Explanation
Min. value Smallest reading of the curve.
Max. value Largest reading of the curve.
Mean value Arithmetically-determined average value.
Std. deviation Measure of the scattering of the readings around the average.
Criteria Entire graph: calculation of the entire data range Date/time: specification of which time period is to be calculated.
5 Using the product
43
Designation Explanation
Index range: select measuring points to be used for the calculation.
Recalculate Curve is recalculated.
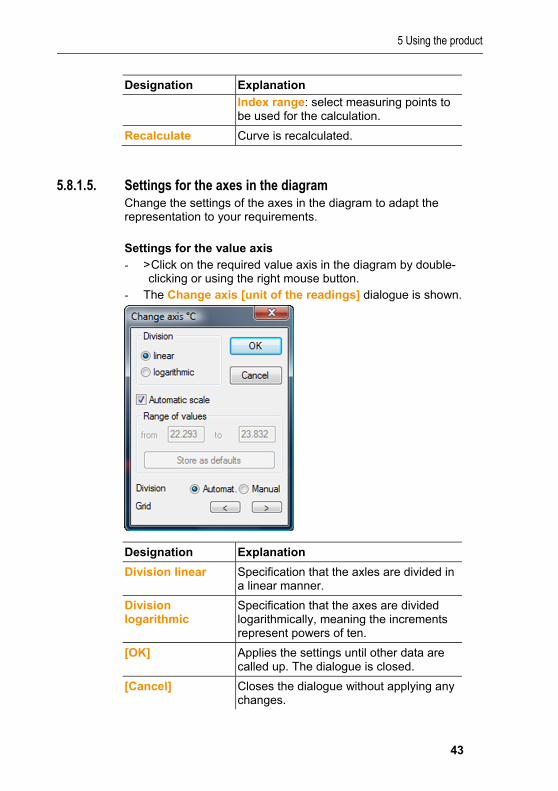
5.8.1.5. Settings for the axes in the diagram Change the settings of the axes in the diagram to adapt the representation to your requirements.
Settings for the value axis - > Click on the required value axis in the diagram by double-
clicking or using the right mouse button. - The Change axis [unit of the readings] dialogue is shown.
Designation Explanation
Division linear Specification that the axles are divided in a linear manner.
Division logarithmic
Specification that the axes are divided logarithmically, meaning the increments represent powers of ten.
[OK] Applies the settings until other data are called up. The dialogue is closed.
[Cancel] Closes the dialogue without applying any changes.
5 Using the product
44
Designation Explanation
Automatic scale Specification as to whether the program should perform the scaling of the value axis.
Range of values from ... to
Manual entry of the range of values if the Automatic scale is deactivated.
[Store as defaults] Saves the current settings as the default setting.
Division Automat. Specification that the program should perform the division of the axis.
Division Manual Specification that the division of the axis should be performed manually.
Grid [<], [>] (if automatic division is activated)
Decrease or increase the division of the axis by clicking on [<] or [>].
Interval (if manual division is activated)
Manual entry of the grid.
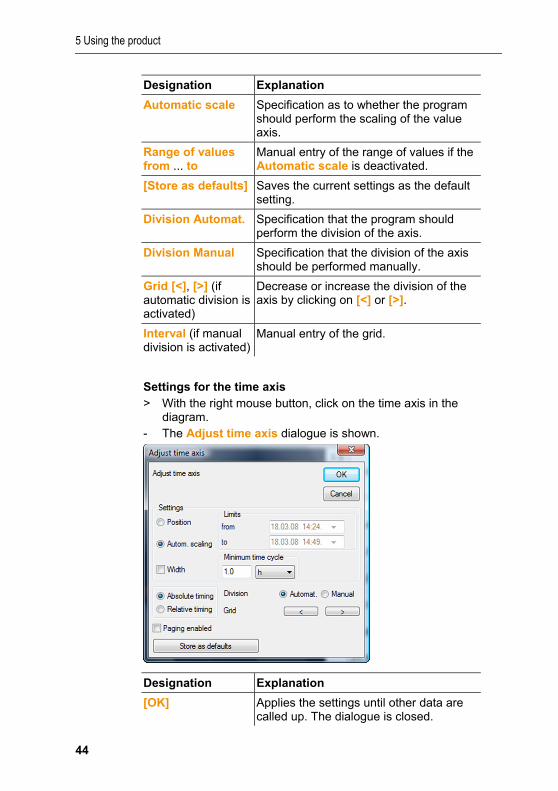
Settings for the time axis > With the right mouse button, click on the time axis in the
diagram. - The Adjust time axis dialogue is shown.
Designation Explanation
[OK] Applies the settings until other data are called up. The dialogue is closed.
5 Using the product
45
Designation Explanation
[Cancel] Closes the dialogue without applying any changes.
Position Shows a freely-definable extract of the diagram.
Autom. scaling... Shows the entire diagram in the window.
Extract Shows a fixed, defined extract that can be moved over the time axis.
Limits from ... to (if Position view is activated)
Limits for the Position view.
Minimum time cycle (if Extract view is activated)
Specification of which time period should at least be shown.
Selection list for the unit (if Extract view is activated)
Unit of the time axis in the minimum time cycle: • sec (second) • min (minute) • h (hour)
• d (day).
Absolute All times are the real times at which the readings were recorded.
Relative Sets the starting time to 00:00; the time the runs relative to this starting point.
Paging enabled The function associated with this is not available in the Small Business Edition.
Division Automat. Specification that the program should perform the division of the axis.
Division Manual Specification that the division of the axis should be performed manually.
Grid [<], [>] (if automatic division is activated)
Decrease or increase the division of the axis by clicking on [<] or [>].
Interval (if manual division is activated)
Manual entry of the grid.
5 Using the product
46
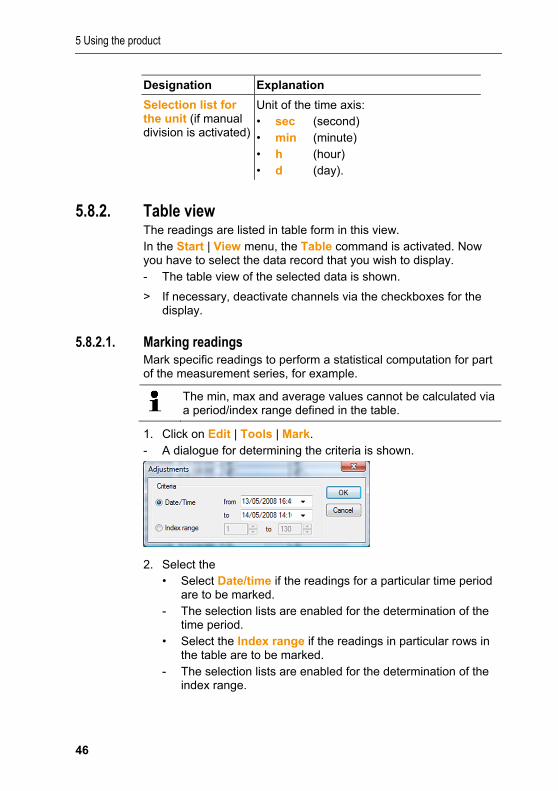
Designation Explanation
Selection list for the unit (if manual division is activated)
Unit of the time axis: • sec (second) • min (minute) • h (hour) • d (day).
5.8.2. Table view The readings are listed in table form in this view. In the Start | View menu, the Table command is activated. Now you have to select the data record that you wish to display. - The table view of the selected data is shown.
> If necessary, deactivate channels via the checkboxes for the display.
5.8.2.1. Marking readings Mark specific readings to perform a statistical computation for part of the measurement series, for example.
The min, max and average values cannot be calculated via a period/index range defined in the table.
1. Click on Edit | Tools | Mark. - A dialogue for determining the criteria is shown.
2. Select the • Select Date/time if the readings for a particular time period
are to be marked. - The selection lists are enabled for the determination of the
time period. • Select the Index range if the readings in particular rows in
the table are to be marked. - The selection lists are enabled for the determination of the
index range.
5 Using the product
47
3. Determine time period or index range. 4. Click on [OK]. - The dialogue is closed and the corresponding readings are
marked in the table.
The selected readings can be copied and further edited using suitable software (e.g. with Microsoft® Excel®).
5.8.2.2. Dropping the marking > Click on Edit | Tools | Drop marking. - The marking of the readings is deleted.
5.8.2.3. Determining largest reading > In the Edit | Find | Maximum menu click on the curve for which
the largest reading should be determined. - The largest reading is shown marked in the table.
5.8.2.4. Determining the smallest reading > In the Edit | Find | Minimum menu click on the curve for which
the smallest reading should be determined. - The smallest reading is shown marked in the table.
5.8.2.5. Add rows > In the Edit | Tools | Add rows menu, activate the selection that
is to be displayed in extra rows. - The extra rows are displayed in the table.
5.8.2.6. Compress Tabular values are displayed in compressed format. The limits for the compression range and the additional Min, Max and Mean values are displayed. > Click in the Edit | Tools | Compress menu, a selection window
appears. > Set the calculation and extract and confirm with OK. - The table display is reduced to the selected Min, Max and Mean
values, and the entered time period.
5.8.2.7. Drop compression The table compression is removed. > Click in the Edit | Tools | Drop compression menu. - The table is displayed with all the individual values once again.
5 Using the product
48
5.9. Creating evaluations You can print out series of measurements.
5.9.1. Printing measurement data Measurement data can be printed in diagram or table form. > In the Start | View menu, select the
• Select Graph if the table view is activated but the graphic view should be printed.
• Select Table if the graphic view is activated but the table view should be printed.
1. Select the type of report head in the Template | Template menu.
Open the preview of the report using the File (Testo logo) | Print preview command. Use portrait format for printing a table and landscape format for printing a diagram. You can determine the format under File | Page Setup....
2. Select the Print command in the File menu. - The Print dialogue for selecting the printing options is shown.
3. Change printing options, if needed, and click on [OK]. - The report is printed.
6 Tips and assistance
49
6 Tips and assistance
6.1. Questions and answers
Question Possible causes/solution
Instrument is not responding...
This message appears if the PC program cannot communicate with the connected measuring instrument or if the measuring instrument does not respond. • Make sure that the instrument is
switched on. • Check the connecting cable. • Does the instrument have
sufficient power? • Is the connecting cable connected
to the correct COM port?
Instrument has signalled no functional probes. Measurement not possible.
• You try to obtain an online measurement using an instrument with no probes connected to it.
• Connect the corresponding probes.
• Not all input variables for the "..." function are contained in the measurement protocol. You have selected a predefined function that requires more or different parameters than those that are contained in the measuring protocol in order to perform the calculation, e.g. if you wish to calculate the dewpoint but provide only the temperature, the humidity parameter is missing.
Invalid name: The symbols: !,?,*,:,\ cannot be used in location and folder names.
Rename it and do not use these characters.
An instrument setting with this name already exists: Please select a new name.
Different names should be used when setting up new instruments. The same name should not be used for different instruments.

6 Tips and assistance
50


0970 0470 en 05 V04.5 en-GB