instrumentation for underground powerhouse of sardar ... · the underground powerhouse (210 m...
TRANSCRIPT

Instrumentation for Underground Powerhouse of Sardar Sarovar Project, Gujarat
Rajbal Singh R.K. Mathur
S.L. Gupta
Central Soil and Materials Research Station Olof Palme Marg, New Delhi-110016, India
Tel: 011-26581772; Fax: 011- 26853108 E mail: [email protected]
ABSTRACT The Central Soil and Materials Research Station (CSMRS), is involved with Sardar Sarovar Project for instrumentation work in underground powerhouse cavern since 1992 viz. from construction stage to operation stage and doing instrumentation work for monitoring of cracks deformation, rock movement and pore water pressure. The CSMRS has installed various instruments on different locations like upstream wall, down stream wall, bus gallery and crown of powerhouse. This paper deals with the instrumentation in underground powerhouse of Sardar Sarovar Project (Gujarat), including installation of various kinds of instruments for long term monitoring along with results and conclusions. The relative deformations show stability trend of the cavern finally inspite of shear zones. Keywords: Instrumentation; Underground powerhouse; 3D crack monitor; MPBX;
Piezometer 1. INTRODUCTION When an excavation is not stable, underground safety and integrity of nearby structures become a major concern. When an excavation is marginally stable, early detection of instability is possible through use of instrumentation and remedial measures such as supplemental support work can be implemented on a timely basis to stabilise the structure. The efficacy of remedial measures can also be measured with same set of instruments. Basic purpose of instrumentation is to provide input data for designing robust structures and also to suggest remedial measures. A program of instrumentation and monitoring can play a major role in evaluating the stability of an underground excavation. It is rightly said that every instrument installed on a project should be to assist in answering a specific question. Instrumentation plays an important role in defining site conditions

J. of Rock Mechanics and Tunnelling Tech., Vol. 16, No. 1, 2010 48
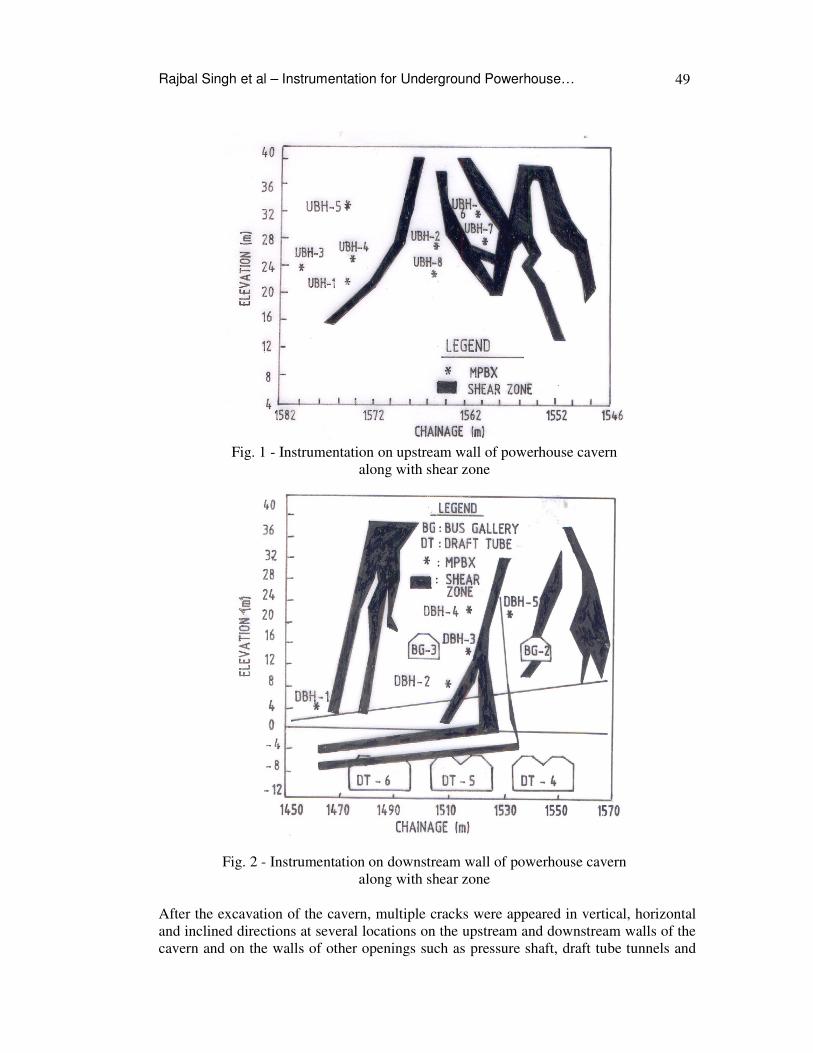
during design and construction of a project as discussed by Hanna (1985), Dunnicliff (1993), Sinha (1989), Mathur and Singh (2007), Sharma et al. (1994) and CSMRS (2009). The changes reflected in underground structures may be of displacements, stresses, strains and pressure, which can be measured using appropriate instruments. Early detection of such changes can be of great importance, not only in identification of potential hazardous zones but in devising remedial measures and confirming their effectiveness by the same set of instruments. The use of proper instrument at appropriate time can give very valuable information, which can help to prevent a likely major mishap. Field instrumentation includes selection of site and instruments, installation, monitoring, maintenance, analysis and report preparation. This paper deals with the instrumentation in underground powerhouse of Sardar Sarovar Project (Gujarat), including installation of various kinds of instruments for long term monitoring along with results and conclusions. 2. SARDAR SAROVAR PROJECT, GUJARAT 2.1 The Project Sardar Sarovar Project is an inter-state multi-purpose joint venture for four states of Gujarat, Madhya Pradesh, Maharashtra and Rajasthan with a terminal major dam on river Narmada near village Navgam in Bharuch District of Gujarat. The height of the concrete dam is 163 m. The project on full completion will create additional irrigation potential of 17.92 lakh hectares and serve 12 districts and 62 talukas of the state. Power benefits of 1450 MW will be shared among Madhya Pradesh, Maharashtra and Gujarat in the ratio of 57:27:16. Project has a 163 m high concrete gravity dam with a length of 1210 m (at top RL of 146.50 m). The dam has a reservoir of 214 km length with an average width of 16.1 km. The underground powerhouse (210 m length x 22 m width x 58 m height) has generation capacity of 1200 MW through 6 units of 200 MW each and a canal head surface powerhouse of 250 MW from 5 units of 50 MW each. Total generation capacity of the project is 1450 MW. 2.2 Distress Zone in Powerhouse Cavern The underground powerhouse cavern of Sardar Sarovar project mainly consists of hard and competent sub-horizontal basalt flow, separated by pockets of hard and compact agglomerate. The basalt is intruded by vertical/inclined dolerite dykes and sills. Faults of small magnitude displace the dolerite dykes and sills. The shear zones along with instrumentation on upstream and downstream walls of underground powerhouse have been shown in Figs. 1 & 2 respectively. Multi position borehole extensometers (MPBX) have been marked by ‘*’ from UBH1 to UBH8 (UBH: upstream bore hole) in Fig. 1 and DBH1 to DBH5 (DBH: downstream bore hole) in Fig. 2. Shear zones on upstream and downstream walls have been shown by black colour in Figs. 1 & 2.
Rajbal Singh et al – Instrumentation for Underground Powerhouse… 49
Fig. 1 - Instrumentation on upstream wall of powerhouse cavern
along with shear zone
Fig. 2 - Instrumentation on downstream wall of powerhouse cavern along with shear zone
After the excavation of the cavern, multiple cracks were appeared in vertical, horizontal and inclined directions at several locations on the upstream and downstream walls of the cavern and on the walls of other openings such as pressure shaft, draft tube tunnels and

J. of Rock Mechanics and Tunnelling Tech., Vol. 16, No. 1, 2010 50
the bus galleries. The deformation in crack was initially observed in March 1991. Majority of cracks observed in the cavern were vertical and were developed in a direction parallel or perpendicular to long axis of cavern. These cracks cut across not only different basalt flows but also some of the shear zones. 2.3 Instrumentation by CSMRS Initially, monitoring of cracks was started by Project authority themselves by means of glass strips embedded with cement mortar padding at both ends of the crack. After some time, some of the glass plates were found broken, which confirmed the continued deformation of cracks. Project authorities then approached CSMRS to take up the instrumentation work for long term monitoring of crack deformation and rock mass deformation in the powerhouse cavern. CSMRS has initially installed instruments in 1992 and thereafter at various locations as given in Table 1. All the working instruments have been monitored regularly for variation in deformations of cracks and rock mass. However, monitoring at some locations was discontinued due to removal of trestles.
Table 1 - Instruments installed by CSMRS during 1992-93
3. DESCRIPTION OF INSTRUMENTS 3.1 Demec Gauge/Vernier Digital Gauge This instrument is used for monitoring of crack deformation in two directions viz. along the crack and across the crack. Figure 3 shows six numbers of (A, B, C, D, E and F) specially designed stainless steel pins which are embedded in the rock mass on both sides of crack at mutually 60 degree angle. Using demec gauge, measurement is taken between pins A and D. Deformation with respect to time across the crack can be taken by observing subsequent readings. Similarly, deformation along the crack can be measured by taking average of reading between pins B-E and C-F initially and subsequently, by regular readings.
Instruments installed S. No.
Location
3-D Crack Monitor
Demec Gauge/ Vernier Gauge pins
MPBX SPBX Total
1 Upstream wall 2 10 8 - 20 2 Pressure shafts (2&3) - 4 - - 4 3 Downstream wall 1 2 5 - 8 4 Bus gallery (2&3) 1 11 - 12 5 D&G gallery - - - 7 7 Total 4 27 13 7 51
Rajbal Singh et al – Instrumentation for Underground Powerhouse… 51
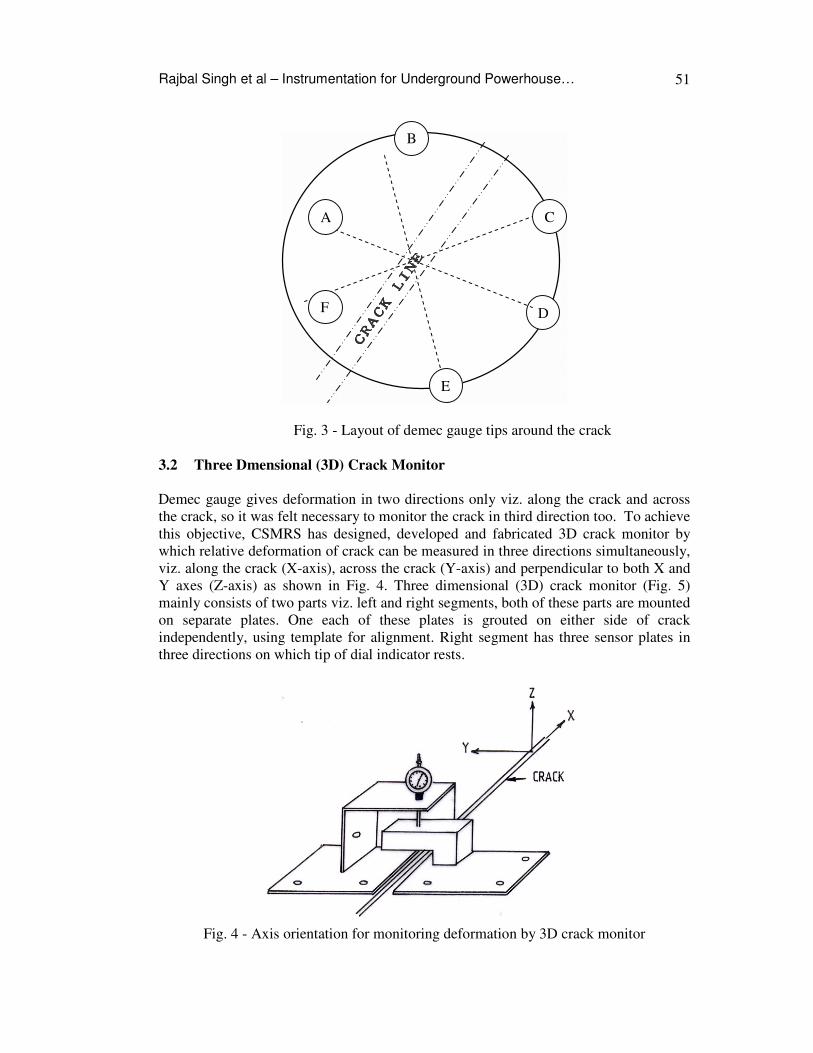
Fig. 3 - Layout of demec gauge tips around the crack
3.2 Three Dmensional (3D) Crack Monitor Demec gauge gives deformation in two directions only viz. along the crack and across the crack, so it was felt necessary to monitor the crack in third direction too. To achieve this objective, CSMRS has designed, developed and fabricated 3D crack monitor by which relative deformation of crack can be measured in three directions simultaneously, viz. along the crack (X-axis), across the crack (Y-axis) and perpendicular to both X and Y axes (Z-axis) as shown in Fig. 4. Three dimensional (3D) crack monitor (Fig. 5) mainly consists of two parts viz. left and right segments, both of these parts are mounted on separate plates. One each of these plates is grouted on either side of crack independently, using template for alignment. Right segment has three sensor plates in three directions on which tip of dial indicator rests.
Fig. 4 - Axis orientation for monitoring deformation by 3D crack monitor
E
D
C
B
A
F

J. of Rock Mechanics and Tunnelling Tech., Vol. 16, No. 1, 2010 52
Fig. 5 – Three dimensional (3D) crack monitor Dial indicator can be screwed on left segment of the instrument which has provisions for mounting and screwing the dial indicators in three directions corresponding to the sensors in the right segments. Readings are taken in all three directions by using same dial gauge indicator in all three directions. Difference of two successive readings of any particular direction gives relative deformation in that direction for that period of successive readings. Obviously difference of final reading and initial readings in a particular direction gives cumulative relative deformation for entire period in that particular direction. 3.3 Multi Position Borehole Extensometer (MPBX) Disturbances in rock and soil masses may be influenced by geological or structural factors beyond the periphery of a tunnel. Simple measurements, such as convergence, may detect the disturbance but fail to provide much information on its exact nature at depth, or on its causes and potential precautionary or remedial measures. In such instances, instruments installed in boreholes can be used to test ground movement at different depths into a rock mass, and to provide good sample distribution and data redundancy even under conditions of limited site accessibility. Figure 6 shows one such instrument, the multiple position borehole extensometer (MPBX). A typical borehole extensometer consists of an instrument head, usually mounted at the collar of a drillhole, and one or more in-hole anchors, each fixed in position at a known initial depth in the hole (Fig. 7). Each anchor is connected by means of a rod or wire to an individual transducer in the instrument head. As the rock or soil mass is deformed, the distance between each in-hole anchor and the instrument head changes, and the changes are measured by the individual transducers. Various types of transducers can be used, ranging from mechanical devices such as vernier calipers and depth micrometers to electronic sensors such as bonded and weldable strain gauges, potentiometer, and linear variable differential transformers (LVDT). Mechanical

Rajbal Singh et al – Instrumentation for Underground Powerhouse… 53
transducers have the advantage of simplicity and low cost. Electronic transducers permit remote readout, the use of automatic and semi-automatic data systems, and simple interfacing with computers. Extensometers provide direct measurements of displacement magnitude, usually noted in relation to time. Its Changes with time and magnitude are used to calculate deformation rate (time rate of change of magnitude) and acceleration (time rate of change of the deformation rate). Extensometers measure only that component of displacement which is occurring parallel to the axis of the borehole.
Fig. 6 - Multi position borehole extensometer (MPBX) 3.3.1 Selection of extensometer instruments The selection of an extensometer for a particular application requires consideration of the site geology, depth of influence, probable deformation magnitude, required sensitivity and readout mode (mechanical or electronic).
Fig. 7 - MPBX installation in borehole

J. of Rock Mechanics and Tunnelling Tech., Vol. 16, No. 1, 2010 54
3.3.2 Data representation and interpretation of MPBX instrument Extensometer measurements are in the form of displacement magnitude, usually noted in relation to time at different depth from the face of excavation. Time is generally the most useful independent variable, and it facilitates the comparison of extensometer data with information from other sources. The information necessary for at least a preliminary evaluation of safety and stability can usually be extracted quite easily from the raw (field book) data, or from simple graphs of displacement versus time. Hazards are usually reflected in unprocessed data in stepwise or exponential changes in successive readings, and all data should be scanned routinely for any such indications. It is needless to say that early detection is extremely important in providing a maximum amount of time for precautionary or remedial actions. To prepare displacement graphs, a reference datum must be identified and a format selected. In most extensometer applications, the instrument head is located in the part of the geologic mass, which is being most actively deformed. If possible, extensometer holes should, therefore, be drilled deep enough to place the deepest in-hole anchor well beyond the z̀one of influence of the deformation. The farthermost anchor or anchors are then in locations, which are least comparatively fixed in space. The graph showing displacement of the deepest anchor can then be plotted as a straight line and used as a reference datum of ordinate for the calculation of total displacements measured at successively shallow anchor depths. 3.4 Vibrating Wire Type Piezometers Vibrating wire type piezometers (Fig. 8) are used to measure the ground water pressure. It consists of a vibrating wire pressure transducer and signal cable.
Fig. 8 - Vibrating wire type piezometers
It can be installed in a borehole, embedded in fill, or suspended in a standpipe. Readings are obtained with a portable readout or a data logger. Advantages include easy to read, very accurate; good response time in all soils; easy to automate; reliable remote

Rajbal Singh et al – Instrumentation for Underground Powerhouse… 55
readings. However, these instruments must be protected from electrical transients. These instruments were installed by M/s SME, Lucknow.
4. PRESENT STATUS OF INSTRUMENTATION Present status of instrumentation being monitored by CSMRS, is given in Table 2. Some of the instruments installed earlier, have become unapproachable due to removal of trestles, while some other instruments got embedded during construction work. Out of 60 instruments installed as given in Table 2, 29 instruments are in working order and being monitored continuously since installation in January 1993. These instruments are being monitored nowadays on yearly basis.
Table 2 - Present status of instrumentation being monitored by CSMRS
Number of instruments
S. No.
Instrument Location
Installed Working
1 Demec gauge/ vernier digital gauge pins
Upstream wall of PH Pressure shaft on upstream side of PH Bus gallery/downstream wall of PH Downstream wall of PH
10 4
11 2
nil nil 8
nil 2 3-D crack monitors Upstream wall of PH
Down stream side of PH 2 2
Nil 1
3 Multi position borehole extensometers
Upstream wall of PH Downstream side of PH Crown of powerhouse
8 6 4
1 5 4
4. Single point borehole extensometer
Drainage and grouting gallery 7 6
5 Piezometers Downstream side of dam 4 4 Total Number of Instruments 60 29
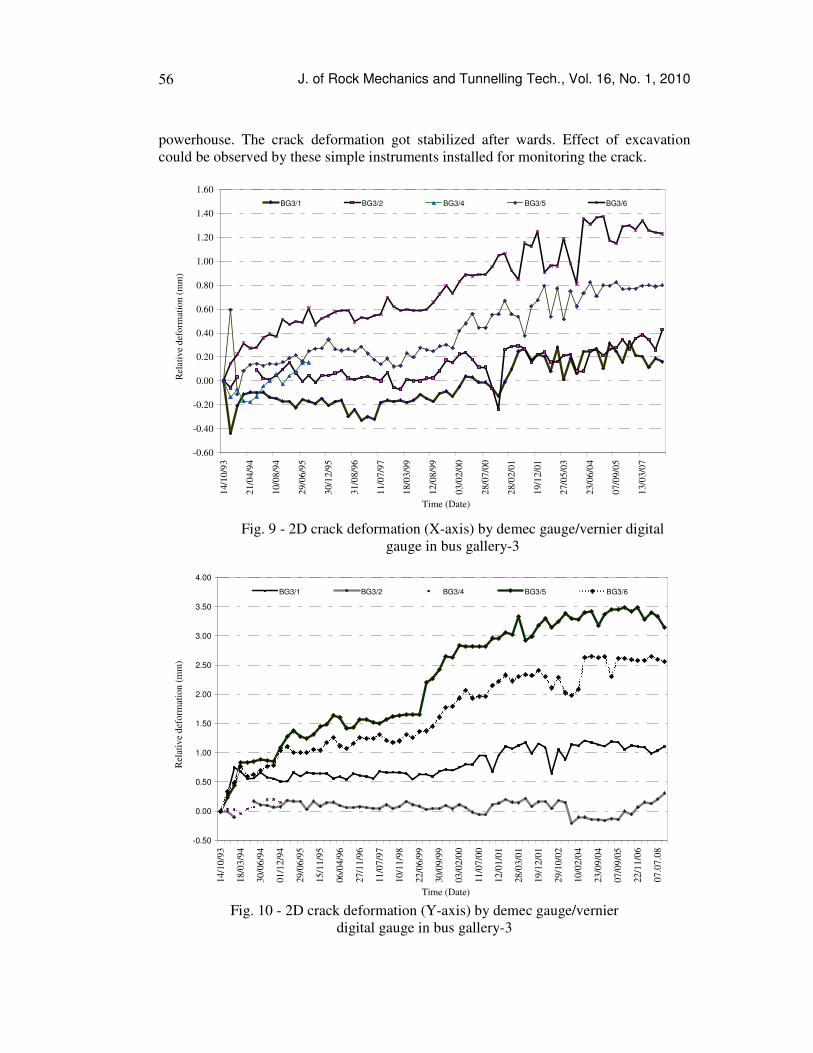
5. MONITORING OF INSTRUMENTS The instruments were monitored regularly and data was analyzed and communicated to the project by CSMRS Report (2009). Figures 9 to 16 show graphs of relative deformation versus time for data taken by demec gauge/vernier digital gauge and 3-D crack monitors up to September 2007. Figures 17 to 20 show the movement above the crown of powerhouse using MPBX. Figure 21 shows pore water pressure variation monitoring by vibrating wire piezometers installed at different locations. 5.1 2D Crack Deformation Monitoring by Demec Gauge/Vernier Digital Gauge For comparison, Figs. 9 and 10 give trend of crack deformations, along the crack (X- axis) and across the crack (Y-axis) respectively in bus gallery - 3, and Figs. 11 and 12 show crack deformations in bus gallery - 2 on downstream side in the powerhouse cavern. These graphs showed stabilizing trend in the cavity up to Sep.1999. However, maximum movement occurred during 1999-2000 due to excavation activities in
J. of Rock Mechanics and Tunnelling Tech., Vol. 16, No. 1, 2010 56
powerhouse. The crack deformation got stabilized after wards. Effect of excavation could be observed by these simple instruments installed for monitoring the crack.
-0.60
-0.40
-0.20
0.00
0.20
0.40
0.60
0.80
1.00
1.20
1.40
1.60
14/1
0/93
21/0
4/94
10/0
8/94
29/0
6/95
30/1
2/95
31/0
8/96
11/0
7/97
18/0
3/99
12/0
8/99
03/0
2/00
28/0
7/00
28/0
2/01
19/1
2/01
27/0
5/03
23/0
6/04
07/0
9/05
13/0
3/07
Time (Date)
Rel
ativ
e de
form
atio
n (m
m)
BG3/1 BG3/2 BG3/4 BG3/5 BG3/6
Fig. 9 - 2D crack deformation (X-axis) by demec gauge/vernier digital
gauge in bus gallery-3
-0.50
0.00
0.50
1.00
1.50
2.00
2.50
3.00
3.50
4.00
14/1
0/93
18/0
3/94
30/0
6/94
01/1
2/94
29/0
6/95
15/1
1/95
06/0
4/96
27/1
1/96
11/0
7/97
10/1
1/98
22/0
6/99
30/0
9/99
03/0
2/00
11/0
7/00
12/0
1/01
28/0
3/01
19/1
2/01
29/1
0/02
10/0
2/04
23/0
9/04
07/0
9/05
22/1
1/06
07.0
7.08
Time (Date)
Rel
ativ
e de
form
atio
n (m
m)
BG3/1 BG3/2 BG3/4 BG3/5 BG3/6
Fig. 10 - 2D crack deformation (Y-axis) by demec gauge/vernier
digital gauge in bus gallery-3

Rajbal Singh et al – Instrumentation for Underground Powerhouse… 57
-1.00
0.00
1.00
2.00
3.00
4.00
5.00
14/1
0/93
18/0
3/94
30/0
6/94
01.1
2.94
29/0
6/95
15/1
1/95
06/0
4/96
27/1
1/96
11/0
7/97
10/1
1/98
22/0
6/99
30/0
9/99
03/0
2/00
11/0
7/00
12/0
1/01
28/0
3/01
19/1
2/01
29/1
0/02
10/0
2/04
23/0
9/04
07/0
9/05
22/1
1/06
07.0
7.08
Time (date)
Rel
ativ
e de
form
atio
n (m
m)
2d/1 2d/2 2d/3 2d/4 2d/5
Fig. 11 - 2D crack deformation (X-axis) in bus gallery-2
-1.00
0.00
1.00
2.00
3.00
4.00
5.00
6.00
7.00
8.00
9.00
14/1
0/93
21/0
4/94
10/0
8/94
29/0
6/95
30/1
2/95
31/0
8/96
11/0
7/97
18/0
3/99
12/0
8/99
03/0
2/00
28/0
7/00
28/0
2/01
19/1
2/01
27/0
5/03
23/0
6/04
07/0
9/05
13/0
3/07
Time (Date)
Rel
ativ
e de
form
atio
n (m
m)
2d/1 2d/2 2d/3 2d/4 2d/5
Fig. 12 - 2D crack deformation (Y-axis) in bus gallery-2
5.2 Crack Deformation Monitoring by 3D Crack Monitor The deformation recorded along X-axis (along the crack) and Z-axis (perpendicular to both X and Y axes) are relative, whereas in ‘Y’ direction (across the crack), it gives closing or widening of crack as shown in Fig. 13 at location 3D/4. After initial deformation, almost stabilizing trend was visibly continued up to 2869 days (till

J. of Rock Mechanics and Tunnelling Tech., Vol. 16, No. 1, 2010 58
23.11.2000) in all the directions. The deformation trend afterwards has shown some erratic behaviour, due to disturbances owing to the construction activities. Total deformations of (-) 2.38 mm (X-axis), 1.78 mm (Y-axis; which denotes opening of crack) and (-) 1.88 mm (Z-axis) were recorded up to February 2009 in 5610 days.
-5
-4
-3
-2
-1
0
1
2
3
13/1
0/93
18/0
3/94
30/0
6/94
01/1
2/94
29/0
6/95
15/1
1/95
06/0
4/96
11/0
4/97
27/0
6/98
13/0
5/99
12/0
8/99
28/1
2/99
25/0
5/00
23/1
1/00
28/0
2/01
17/1
0/01
07/0
9/02
30/0
7/03
24/0
6/04
26/0
4/05
02/0
8/06
27.0
9.07
Time (Date)
Rel
ativ
e de
form
atio
n (m
m)
X- axis Y- axis Z- axis
Fig. 13 - 3D crack deformation (3D/4) at EL 17.5 m; Ch. 2.6m in bus gallery-3
-3
-2.5
-2
-1.5
-1
-0.5
0
0.5
1
11.0
1.93
23.0
3.93
17.0
8.93
19/1
1/93
21/0
4/94
22/0
7/94
04/0
2/95
02/0
8/95
30/1
2/95
20/0
6/96
11/0
7/97
10/1
1/98
22/0
6/99
30/0
9/99
03/0
2/00
11/0
7/00
12/0
1/01
28/0
3/01
19/1
2/01
29/1
0/02
10/0
2/04
23/0
9/04
07/0
9/05
22/1
1/06
07/0
7/08
Time (Date)
Rel
ativ
e d
efor
mat
ion
(mm
)
3d-3 3d-4
Fig. 14 - 3D crack deformation (X- axis)

Rajbal Singh et al – Instrumentation for Underground Powerhouse… 59
Figures 14 to 16 show comparisons of crack deformations in 3 directions (viz. X, Y and Z) along with reservoir water level at two locations viz. 3D/3 and 3D/4 on downstream side of power house. Monitoring of crack deformation at location 3D/3 was discontinued after 18.03.99 due to removal of trestles. Figure 14 shows clearly the widening of crack during 2000 perhaps due to full fledge construction work. Crack movement was also shown in 2D crack movement during approximate same period as shown in Figs. 9 to 12. This confirms proper working of instruments. Thereafter, there is little deformation of crack which shows a stabilizing trend in the cavity.
-2
-1.5
-1
-0.5
0
0.5
1
1.5
2
11.0
1.93
23.0
3.93
17.0
8.93
19/1
1/93
21/0
4/94
22/0
7/94
04/0
2/95
02/0
8/95
30/1
2/95
20/0
6/96
11/0
7/97
10/1
1/98
22/0
6/99
30/0
9/99
03/0
2/00
11/0
7/00
12/0
1/01
28/0
3/01
19/1
2/01
29/1
0/02
10/0
2/04
23/0
9/04
07/0
9/05
22/1
1/06
07/0
7/08
TIME (DATE)
Rel
ativ
e de
form
atio
n (m
m)
3d-3 3d-4
Fig. 15 - 3D crack deformation (Y- axis)
-5
-4
-3
-2
-1
0
1
11.0
1.93
23.0
3.93
17.0
8.93
19/1
1/93
21/0
4/94
22/0
7/94
04/0
2/95
02/0
8/95
30/1
2/95
20/0
6/96
11/0
7/97
10/1
1/98
22/0
6/99
30/0
9/99
03/0
2/00
11/0
7/00
12/0
1/01
28/0
3/01
19/1
2/01
29/1
0/02
10/0
2/04
23/0
9/04
07/0
9/05
22/1
1/06
07/0
7/08
Time (date)
Rel
ativ
e de
form
atio
n (m
m)
3d-3 3d-4
Fig. 16 - 3D crack deformation (Z-axis)
J. of Rock Mechanics and Tunnelling Tech., Vol. 16, No. 1, 2010 60
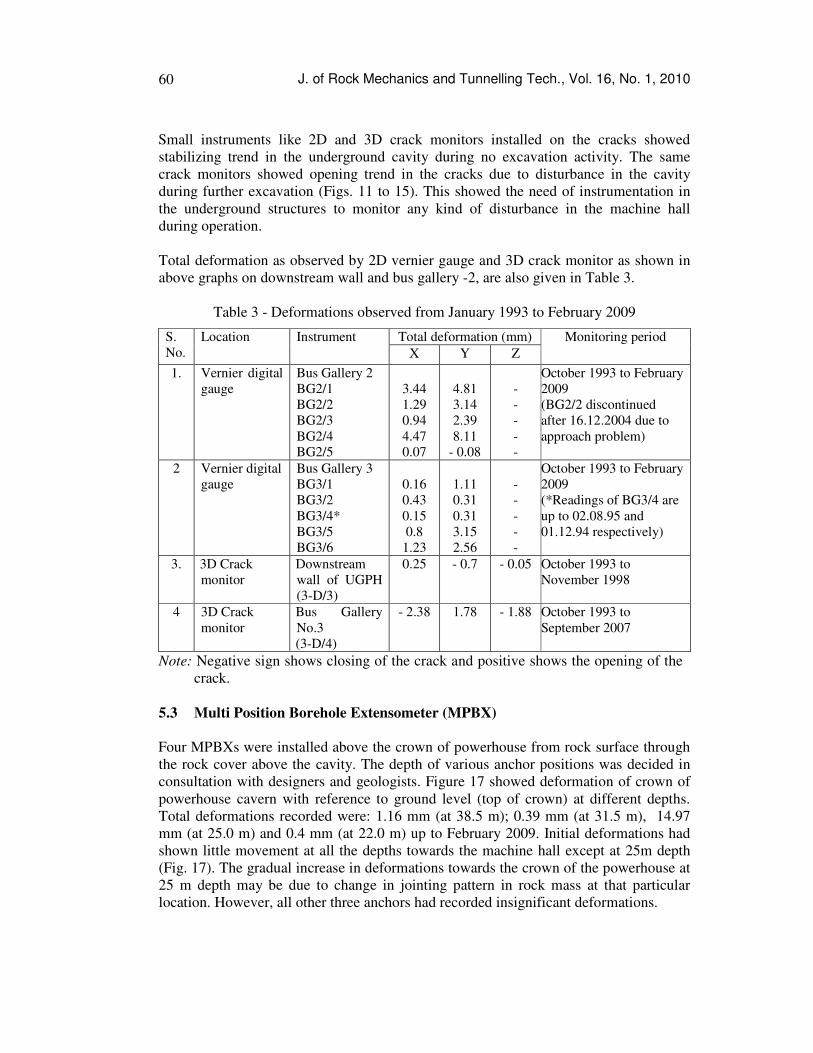
Small instruments like 2D and 3D crack monitors installed on the cracks showed stabilizing trend in the underground cavity during no excavation activity. The same crack monitors showed opening trend in the cracks due to disturbance in the cavity during further excavation (Figs. 11 to 15). This showed the need of instrumentation in the underground structures to monitor any kind of disturbance in the machine hall during operation. Total deformation as observed by 2D vernier gauge and 3D crack monitor as shown in above graphs on downstream wall and bus gallery -2, are also given in Table 3.
Table 3 - Deformations observed from January 1993 to February 2009
Total deformation (mm) S. No.
Location Instrument X Y Z
Monitoring period
1. Vernier digital gauge
Bus Gallery 2 BG2/1 BG2/2 BG2/3 BG2/4 BG2/5
3.44 1.29 0.94 4.47 0.07
4.81 3.14 2.39 8.11
- 0.08
- - - - -
October 1993 to February 2009 (BG2/2 discontinued after 16.12.2004 due to approach problem)
2 Vernier digital gauge
Bus Gallery 3 BG3/1 BG3/2 BG3/4* BG3/5 BG3/6
0.16 0.43 0.15 0.8
1.23
1.11 0.31 0.31 3.15 2.56
- - - - -
October 1993 to February 2009 (*Readings of BG3/4 are up to 02.08.95 and 01.12.94 respectively)
3. 3D Crack monitor
Downstream wall of UGPH (3-D/3)
0.25 - 0.7 - 0.05 October 1993 to November 1998
4 3D Crack monitor
Bus Gallery No.3 (3-D/4)
- 2.38 1.78 - 1.88 October 1993 to September 2007
Note: Negative sign shows closing of the crack and positive shows the opening of the crack.
5.3 Multi Position Borehole Extensometer (MPBX) Four MPBXs were installed above the crown of powerhouse from rock surface through the rock cover above the cavity. The depth of various anchor positions was decided in consultation with designers and geologists. Figure 17 showed deformation of crown of powerhouse cavern with reference to ground level (top of crown) at different depths. Total deformations recorded were: 1.16 mm (at 38.5 m); 0.39 mm (at 31.5 m), 14.97 mm (at 25.0 m) and 0.4 mm (at 22.0 m) up to February 2009. Initial deformations had shown little movement at all the depths towards the machine hall except at 25m depth (Fig. 17). The gradual increase in deformations towards the crown of the powerhouse at 25 m depth may be due to change in jointing pattern in rock mass at that particular location. However, all other three anchors had recorded insignificant deformations.

Rajbal Singh et al – Instrumentation for Underground Powerhouse… 61
Similarly, Figs. 18, 19 and 20 showed the relative deformation being monitored by MPBXs at other locations above crown of powerhouse cavern and showed alternate movement within limits.
0
2
4
6
8
10
12
14
1628
/07/
00
23/1
1/00
08/0
2/01
28/0
3/01
17/1
0/01
26/0
2/02
30/1
0/02
30/0
7/03
23/0
3/04
23/0
9/04
27/0
4/05
31/0
1/06
21/1
1/06
27/0
9/07
24.0
2.09
Time (Date)
Rel
ativ
e de
form
atio
n (m
m)
38.5 m 31.5 m 25.0 m 22.0 m
Fig. 17- Rock deformation with time for MPBX location: CMX-1
at crown of powerhouse (EL 82.0 m; Ch. 1482.0 m)
0
0.5
1
1.5
2
2.5
3
3.5
4
4.5
5
13/0
5/99
22/0
7/99
30/0
9/99
28/1
2/99
14/0
3/00
11/0
7/00
23/1
1/00
08/0
2/01
28/0
3/01
17/1
0/01
26/0
2/02
30/1
0/02
30/0
7/03
23/0
3/04
23/0
9/04
27/0
4/05
31/0
1/06
21/1
1/06
27.0
9.07
TIME (Date)
Rel
ativ
e de
form
atio
n (m
m)
47.5 m 43.5 m 33.0 m
Fig. 18- Rock deformation with time for MPBX location: CMX-2
at crown of powerhouse (EL 93.0 m; Ch. 1508m)

J. of Rock Mechanics and Tunnelling Tech., Vol. 16, No. 1, 2010 62
-1
0
1
2
3
4
5
28/0
7/00
23/1
1/00
08/0
2/01
28/0
3/01
17/1
0/01
26/0
2/02
30/1
0/02
30/0
7/03
23/0
3/04
23/0
9/04
27/0
4/05
31/0
1/06
21/1
1/06
27/0
9/07
24.0
2.09
Time (Date)
Rel
ativ
e de
form
atio
n (m
m)
45.9 m 38.4 m 28.4 m 25.4 m
Fig. 19 - Rock deformation with time for MPBX location: CMX-3
at crown of powerhouse (EL 95.0 m; Ch. 1518.0 m)
0
0.5
1
1.5
2
2.5
3
3.5
4
4.5
5
13/0
5/99
30/0
9/99
14/0
3/00
23/1
1/00
28/0
3/01
26/0
2/02
30/0
7/03
23/0
9/04
31/0
1/06
27/0
9/07
Time (Date)
Rel
ativ
e de
form
atio
n (m
m)
38.0 m 30.0 m 23.0 m
Fig. 20 - Rock deformation with time for MPBX location: CMX-4
at crown of powerhouse (EL 90.0 m; Ch. 1497.0 m)

Rajbal Singh et al – Instrumentation for Underground Powerhouse… 63
5.4 Vibrating Wire Type Piezometer Figure 21 shows the graph of pore water pressure and reservoir water level with time. Minimum and maximum pore pressures have been shown in Table 4. Pore water pressure was monitored by vibrating wire piezometers at 4 different locations. Out of four, one piezometer (pore pressure meter, PPM1) was abandoned due to fault in electronic system. There were variations in pore pressures at two locations of PPM3 and PPM4. This may be due to fluctuations in reservoir water level. Total variations were 4.2 kg/cm² (0.42MPa) and 3.4 kg/cm² (0.34MPa) in PPM3 and PPM4, respectively. PPM2 (EL 111.7 m; Ch. 1538.69m) showed continuous decrease trend in pore pressure which may be due to isolation from reservoir water level and release of pore pressure through seepage at this particular location.
Table 4 - Minimum and maximum pore pressure monitored by piezometers
Instrument Location Minimum pore pressure (kg/cm²)*
Maximum pore pressure (kg/cm²)*
Reservoir water level variation (m) from 16.11.2000 to 07.07.08
PPM 2 EL: 111.7 m; CH: 1538.69m
0.87 on 24.02.09
1.72 on 29.09.2000
88.63m to 112.64 m
PPM 3 EL:109.87; CH: 1610 m
3.54 on 20.06.2001
5.23 on 29.10.2002
88.63m to 112.64 m
PPM 4 EL:66.10; CH: 1454 m
1.4 on 29.10.02 4.02 on 06.09.05
88.63m to 112.64 m
* 1 kg/cm² = 0.1MPa.
-0.5
0.5
1.5
2.5
3.5
4.5
5.5
29/0
9/00
23/1
1/00
08/0
2/01
28/0
3/01
17/1
0/01
26/0
2/02
29/1
0/02
30/0
7/03
22/0
3/04
23/0
9/04
27/0
4/05
31/0
1/06
21/1
1/06
27.0
9.07
24.0
2.09
TIME (DATE)
Pore
wat
er p
ress
ure
(Kg/
cm2)
0
20
40
60
80
100
120
140
Res
ervo
ir w
ater
leve
l (m
)
ppm2 ppm3 ppm4 water reservoir level (m)
Fig. 21 - Pore water pressure monitoring by piezometer
J. of Rock Mechanics and Tunnelling Tech., Vol. 16, No. 1, 2010 64
6. DATA ANALYSIS 6.1 Upstream Wall of the Powerhouse Cavern Rock deformation monitoring using multi position borehole extensometers (MPBXs): • Rock deformations on upstream wall were monitored at two locations by MPBXs,
upgraded from mechanical sensors to vibrating wire sensors. However, both these instruments were showing erratic and unstable readings.
• Out of seven single position borehole extensometers (SPBXs) installed in drainage and grouting (D&G) gallery, one instrument was not working due to damage. Total maximum deformation in case of other six instruments was 2.2 mm from D&G gallery.
6.2 Downstream Wall of the Powerhouse Cavern Rock deformation analysis by using Multi Position Borehole Extensometers (MPBXs): • Rock movements on downstream wall were being monitored at five locations by
MPBXs, upgraded from mechanical sensors to vibrating wire sensors. However these upgraded MPBXs were also showing erratic and unstable readings.
Crack deformation monitoring by 2D vernier digital gauge (bus gallery 2 and 3): • No significant deformations were observed. Maximum observed movement was
about 3 mm in bus gallery 3 and about 7 mm in bus gallery 2 during 1999-2000 due to excavation activities in powerhouse, after wards there was very slow rate of crack deformation. It has stabilized now.
Crack deformation monitoring by 3D crack monitor (bus gallery 3): • No significant deformations were noticed except maximum movement of about 2
mm during 1999-2000 due to excavation activities in powerhouse. However, total deformations monitored by 2D and 3D were 3.15 (varying from 0.31 to 3.15) and 1.78 in bus gallery 3, respectively (Table 3). Both 2D and 3D crack monitors can be compared only when these are installed on the same crack and very near to each other. Hence, the deformations on the cracks were location oriented.
6.3 Above Crown of Powerhouse Cavern Four MPBXs were installed up to the crown of powerhouse from rock surface through the rock cover above the cavity. Among these, the anchor rod of 25 m length i.e. CMX 1 (EL 82.0 m; Ch. 1482.0 m) showed continuous downwards movement locally towards crown till June 2005 thereafter the rate of movement is very less. Rest of MPBXs showed up and down movement at other depths.

Rajbal Singh et al – Instrumentation for Underground Powerhouse… 65
6.4 Pore Water Pressure Monitoring Pore water pressure was monitored by vibrating wire piezometers at 4 different locations. Pore water pressure showed pressure variation due to fluctuations in reservoir water level or due to seepage. 7. REMEDIAL MEASURES Based on the instrumentation in underground powerhouse of Sardar Sarovar Project, whenever the problem of excess deformation of shear zone was reported, the project authorities has promptly taken the remedial measures like rock bolting, epoxy grouting and cable anchoring in consultation with design consultant viz. Central Water Commission. The same instrumentation was further utilized to confirm the efficacy of remedial measures. 8. CONCLUSIONS Based on instrumentation work in the powerhouse of Sardar Sarovar project in Gujarat, the following conclusions are drawn: • Total deformation monitored by 3D crack monitor (3D/4) in bus gallery-3 were -
2.38 mm, 1.78 mm and -1.88 mm in X, Y, Z directions respectively in around 5610 days. Similarly, maximum deformation monitored by digital vernier gauge in same bus gallery 3 was 3.15 mm (BG-3/5) in 5610 days. The difference between 2D and 3D monitoring was due to installation at different cracks.
• Maximum deformation monitored by SPBX was 2.2 mm (DGX-5) in 4905 days from the instruments installed on upstream wall of powerhouse in D &G gallery.
• Maximum local movement of rock mass as monitored by MPBX (CMX-1) above crown of power house was 14.97 mm (25.0 m rod) which may be due to some loose strata in the borehole as other MPBXs like CMX-2 was showing maximum deformation of 1.63 mm only in 3377days.
• During instrumentation work in underground powerhouse of Sardar Sarovar Project, whenever there were any problem like deformation of shear zone, the remedial measures like rock bolting, epoxy grouting, cable rock anchoring etc were implemented promptly. The efficacy of the remedial measures was further monitored by the same set of instruments as deformations had stabilized with time indicating stability of the cavern.
• Small instruments like 2-D and 3-D crack monitors installed on the cracks showed stabilizing trend in the underground cavity during no excavation activity. The same crack monitors showed opening trend in the cracks due to temporary disturbance in the cavity during further excavation. This showed the need of instrumentation in the underground structures.
• The present trend showed stabilized behavior in the powerhouse cavern finally. However, long term monitoring is further continued to monitor the effect of post commissioning of project.

J. of Rock Mechanics and Tunnelling Tech., Vol. 16, No. 1, 2010 66
Acknowledgements We acknowledge with thanks the significant contributions made by Dr. V. M. Sharma, Dr. A.K. Dhawan (Retired Directors, CSMRS) and Mr. S.K. Verma, (Retired Chief Research Officer) during instrumentation work to this project. We also acknowledge the dedicated services and support provided by all members of instrumentation team of CSMRS including Dr. S.N. Sharma, Mr. N. K. Gupta, Mr. N. K. Khoth, Mr. U.C. Gupta, Mr. Vipin Kumar and Mr. V. K. Gupta and also dedicated instrumentation team from Sardar Sarovar Project since 1993. References CSMRS (2009). Interim Report on Instrumentation of Sardar Sarovar Project (Gujarat),
Central Soil and Materials Research Station, New Delhi, 43 p. Dunnicliff John (1993). Geotechnical Instrumentation for Monitoring Field Performance, A
Wiley-Interscience Publication, John Wiley & Sons, Inc., 577 p. Hanna T.H. (1985). Field Instrumentation in Geotechnical Engineering, Trans Tech
Publication, 843p. Mathur R.K. and Singh Rajbal (2007), A Case Study of Instrumentation for Underground
Powerhouse of Sardar Sarovar Project (Gujarat), Workshop on Rock Mechanics and Tunnelling Techniques, Gangtok, Sikkim, pp. 117-131.
Sharma S.N., Mathur R.K, Verma S. K, Singh R. B., Dhawan A K, and Sharma V.M. (1994). Instrumentation for Underground Powerhouse of Sardar Sarovar Project (Gujarat), Indian Geotechnical Conference, pp. 377-380.
Sinha R.S. (1989). Underground Structures Design and Instrumentation, Elsevier, 480 p.