int. j. electrochem. sci., 13 (2018) 6426 6435, doi: 10
TRANSCRIPT

Int. J. Electrochem. Sci., 13 (2018) 6426 – 6435, doi: 10.20964/2018.07.48
International Journal of
ELECTROCHEMICAL SCIENCE
www.electrochemsci.org
Synthesis, Characterization and Electrochemical Properties of
α-MnO2 Nanowires as Electrode Material for Supercapacitors
Hidayat Ullah Shah
1, Fengping Wang
1,*, Muhammad Sufyan Javed
2,3, Rabia Saleem
4, Muhammad
Shahzad Nazir5, Jinbing Zhan
1, Zia Ul Haq Khan
6, Muhammad Umer Farooq
7, Shujaat Ali
1
1
Department of Physics, School of Mathematics and Physics, University of Science and Technology
Beijing, Beijing 100083, P. R. China 2
Siyuan Laboratory, Guangzhou Key Laboratory of Vacuum Coating Technologies and New Energy
Materials, Guangdong Provincial Engineering Technology Research Center of Vacuum Coating
Technologies and New Energy Materials, Department of Physics, Jinan University, Guangzhou
510632, People's Republic of China 3
Department of Physics, COMSATS University, Lahore 54000, Pakistan 4 Department of Mathematics, COMSATS University, Lahore 54000, Pakistan
5 Energy Research Institute, School of Electrical Power, South China University of Technology,
Guangzhou 510640, People's Republic of China
6 Department of Environmental Sciences, COMSATS University, Vehari 61100, Pakistan
7 School of Materials Science and Engineering, University of Science and Technology Beijing, Beijing
100083, China *E-mail: [email protected]
Received: 5 March 2018 / Accepted: 6 May 2018 / Published: 5 June 2018
High purity α-MnO2 rectangular nanowires are synthesized by a facile one-step hydrothermal method.
The morphology and composition of α-MnO2 nanowires are characterized by X-ray diffraction,
energy-dispersive X-ray spectroscopy (EDX), Field emission scanning electron microscopy (FESEM),
X-ray photoelectron spectroscopy (XPS) and Fourier transform infrared (FTIR) spectral techniques.
The electrochemical properties of α-MnO2 nanowires have been studied as electrode material for
supercapacitors. The α-MnO2 nanowires exhibit a high specific capacitance of 362 Fg-1
at a current
density of 1.0 Ag-1
with a good cycling stability (maintained 83% after 5000 cycles). These results
indicate its promising applications as a high-performance electrode material for electrochemical energy
storage.
Keywords: Hydrothermal; MnO2; Nanowires; Supercapacitors: Electrodes
1. INTRODUCTION
Global warming is the biggest threats human facing in the 21st century, and sea levels are
continuing to rise at alarming scales. The pollution produced due to ignition of fossil fuel has created
Int. J. Electrochem. Sci., Vol. 13, 2018
6427
major environmental problems across the globe [1]. Cleaned renewable energy sources are highly
necessary for our modern society [2]. Energy storage creates new ideas to use energy cleanly and
efficiently. Electrochemical capacitors (ECs) also known as supercapacitors (SCs) are a new type of
energy storage/conversion device. Recently, SCs have received massive attention due to their longer
cycle life, higher power density, quick charging compared to conventional batteries and higher energy
density than typical electrical double-layer capacitors (EDLC) [3]. In general, SCs possess several
desirable features, including environmental friendliness, good efficiency, high safety, and can be used
in a high-temperature range with almost infinite long cycle life and low maintenance [4]. Thus, SCs
have been applied in transportation, electronics, communications, aviation, and associated technologies
in and have shown potential applications [5,6].
Manganese dioxides (MnO2) have been regarded as the best electrode material because of its
low cost, natural abundance, low toxicity and wide voltage range [7,8]. MnO2 exists in different
crystalline forms, such as α, β, γ and δ-types, made of the basic unit [MnO6] octahedron [9]. Among
these crystallographic structures, α-MnO2 appears to be the most favourable electrode materials for
supercapacitor applications because of its wide tunnel size of 0.46 nm which enhanced its diffusion
and capacitance capabilities. As supercapacitors mostly depend on either the interlayer separations
between sheets of MnO6 octahedral or the sizes of the tunnels, different tunnel structures have distinct
proficiencies for ion transmission, α-MnO2 2 x 2 (4.6 x 4.6 Å) tunnels constructed from double chains
of octahedral [MnO6] structure have appropriate gaps to accommodate these ions [10]. The electrode
materials with proper nanostructures greatly depend and enhance the rate capability and stability upon
repeated charge/ discharge of the SCs [11]. One-dimensional (1-D) nanostructures having controlled
sizes and crystalline structure offer extra active sites for electrochemical reactions, shorten the
diffusion paths for both electrons and ions in the presence of oxides, and then enhance electrochemical
properties of the electrodes [12,13].
In this study, we have synthesized 1-D α-MnO2 nanowires material via a simple hydrothermal
method. These 1-D thin-walled α-MnO2 nanowires have higher specific capacitance of 362 Fg-1
at a
current density of 1.0 Ag-1
. The results given below will be able to understand the detailed synthesis,
morphology, structural and electrochemical properties of α-MnO2.
2. EXPERIMENTAL DETAILS
2.1. Chemical
All the chemical used were of analytical grade and used without any additional refinement.
Potassium permanganate (KMnO4), nitric acid (HNO3) and tin oxide (SiO2) were purchased from local
Beijing market.
2.2. Material syntheses
In order to study the growth mechanism of α-MnO2 nanowires, 3 g of pure KMnO4 was added
to 45 ml of deionized water (DI) and magnetically stirred for 15 minutes. During the stirring process,

Int. J. Electrochem. Sci., Vol. 13, 2018
6428
0.5 ml HNO3 and 0.2 g of SiO2 were added and further stirred for another 20 minutes. The final
solution was transferred to a stainless autoclave and heated at 180 °C in electric oven for 24 hours (h).
After the reaction, the as-prepared samples were washed, filtered and dried at 120 °C for 4 h in an
oven. SiO2 was used as a catalyst. The final product was collected for further characterizations. The
growth mechanism of the synthesis process is shown figure 1.
Figure 1. Schematic diagram showing the synthesis process of α-MnO2 nanowires
2.3. Characterizations
XRD data was taken with X-ray diffractometer (X’Pert MPD-XRD) with Cu-Kα radiation (λ=
0.154nm). The morphological investigation of the samples was carried out by field emission scanning
electron microscope (FESEM, ZEISS 55), transmission electron microscope (TEM), high-resolution
transmission electron microscopy (HRTEM), selected area electron diffraction (SAED JEM 2010),
energy dispersive spectroscopy (EDS, OXFORD 51-XMX) and selected area electron diffraction
(SAED JEM 2010). X-ray photoelectron spectroscopy (XPS) was carried out by AXIS ULTRADLD
. A
Fourier transform infrared (FTIR) spectrum was recorded on a Bruker Vector 33 spectrometer.
2.4. Electrode preparation and electrochemical characterization
The working electrode was prepared by mixing 75 wt% active material (α-MnO2 powder), 15
wt % conducting filler of acetylene black and 10 wt % polyvinylidene fluoride (PVDF) in the presence
of few drops of water. The final slurry was pasted onto a nickel foam (width x length = 1 × 2 cm2)
current collector.
The electrochemical properties of the α-MnO2 electrode were measured on the CHI660C
electrochemical workstation. The cyclic voltammetry (CV) and galvanostatic charging/discharging
(GCD) techniques were used to study the electrochemical performance of the electrode. The CV was
recorded in a potential window range from -0.1 V to 0.9 V at different scan rates. The GCD
experiment was recorded at different current densities between a potential range from 0.0 V and 0.5 V.
The mass loading density of the active material in the electrode was about 1.5 mg cm-2
.
The specific capacitance was calculated by the following equation [14].
Cs = (1)

Int. J. Electrochem. Sci., Vol. 13, 2018
6429
Where Cs stand for specific capacitance (F g-1
), I is the discharge current, Δt is the discharge
time (s), ΔV is the potential drop (V), and m is the active mass of the active electrode (g).
3. RESULTS AND DISCUSSION
Figure 2. (a) Typical XRD and (b) EDX spectra of the as-prepared α-MnO2 products.
Figure 3. (a-c) FESEM; (d,e) TEM and (f) HRTEM images of the α-MnO2 nanowires; the inset shows
the related SAED pattern of the individual α-MnO2 nanowires.

Int. J. Electrochem. Sci., Vol. 13, 2018
6430
The phase purity and crystalline structure of the samples have been characterized by XRD,
presented in Figure 2(a). All the peaks are well indexed to the standard value (JCPDS: 44 - 0141) [15].
The diffraction peaks can be absolutely indexed as the tetragonal α-MnO2, and no other peaks were
observed from impurities. The sharp and narrow diffraction peaks indicate the high crystallinity of α-
MnO2 material. EDX analysis of the sample depicted in Figure 2(b) exhibits that the final product
comprises of only Mn and O, suggesting that the nanowires are made of pure α-MnO2. There is carbon
(C) peak in the EDX spectra which comes from Ethanol, during the sample preparations.
The morphological properties of the as-prepared α-MnO2 nanowires were studied by FESEM,
TEM and HRTEM as shown in Figure 3. Figure 3 (a-c) shows the FESEM micrograph of α-MnO2
nanowires, all the images confirm the uniform formation of α-MnO2. The TEM images are shown
Figure 3(d,e), which exhibits single-crystal structure of α-MnO2 nanowires. Figure 3(f) shows the
HRTEM image of the nanowires. This figure shows clear lattice fringes, verifying the single-
crystalline nature of the as-synthesized material. The interplanar spacing (d) of 0.24 nm corresponds to
the [211] plane of tetragonal α-MnO2.
Figure 4. FTIR spectra of the as-prepared α-MnO2 nanowires
FTIR technique was used for the samples shown in Figure 4. The spectrum was recorded in the
range of 500-4000 cm-1
. The absorption bands were found at 532, 572, 750, 1060, 1636 and 3425 cm-
1. The broad absorption bands at 3425 cm-1
and 1060 cm-1
represent O–H stretching vibration and

Int. J. Electrochem. Sci., Vol. 13, 2018
6431
bending vibration absorption peaks of residual water on MnO2 surface. The band around 1636 cm-1
assigned to vibrations in carbonyl groups (C–O) [16]. The bands at about 532 and 572 cm−1
can be
ascribed to the Mn–O stretching mode of the octahedral layers in MnO2. This result is consistent with
the previous results in the literature [17,18].
XPS is a surface analytical technique with a sampling depth of around 10 nm. The XPS study
investigates the oxidation state of Mn within the α-MnO2, shown in Figure 5, exhibiting signals from
Mn, C, and O elements, corresponds to the EDX results. The existence of MnO is proved by Mn 3s,
Mn 2p and O 1s peaks. The Mn 2p peak shown in Figure 5(b) further consists of the spin-orbit doublet
of Mn 2p1/2 and Mn 2p3/2 located at 653.3 and 641.5 eV, respectively. The spin-energy separation of
11.8 eV suggests the formation of MnO2 [19,20]. Figure 5 (c,d) further explains C and O peaks.
Figure 5. (a) XPS spectrum (survey scan) of the α-MnO2; magnified view of the (b) Mn 2p (c) O 1s
and (d) C 1s levels.
3.1. Electrochemical characterization
To investigate the potential applications of α-MnO2 as electrode materials for supercapacitor,
CV curves, GCD curves and EIS spectra are tested by a three-electrode system in 1 M Na2SO4 aqueous

Int. J. Electrochem. Sci., Vol. 13, 2018
6432
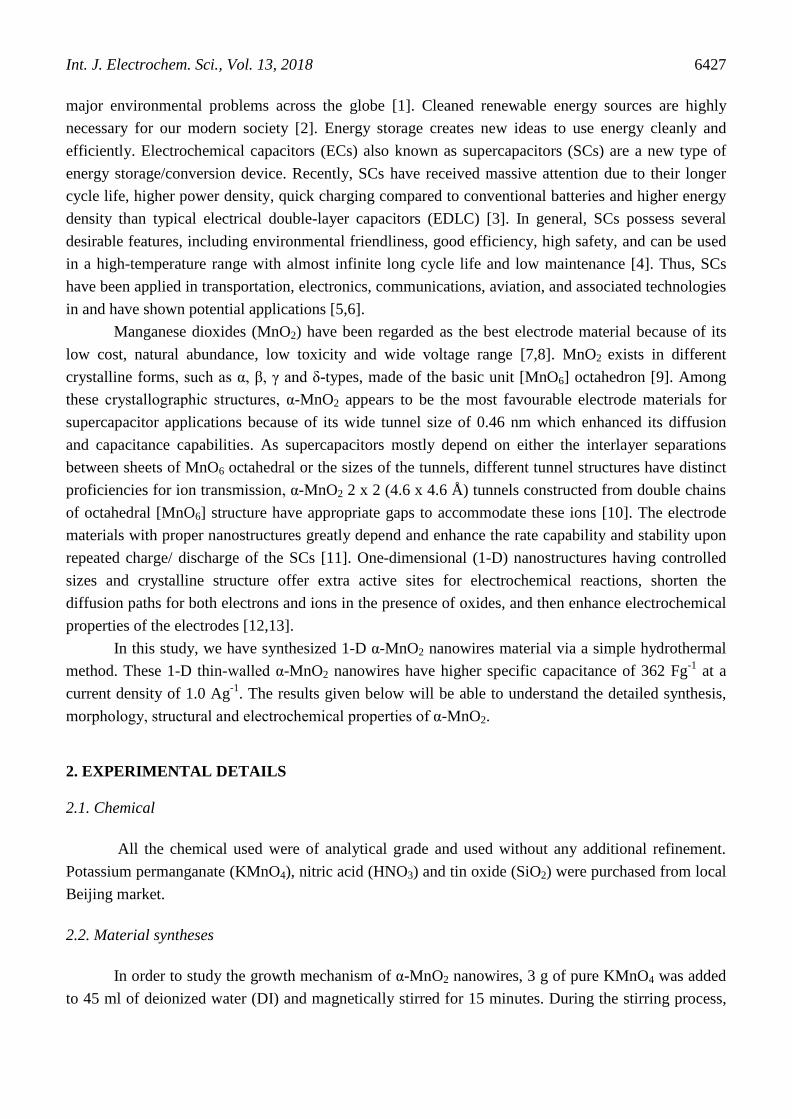
electrolyte and the results are shown in Figure 6, in which platinum wire and Ag/AgCl electrodes were
used as the counter and reference electrodes, respectively. The curves of α-MnO2 SCs electrode are
measured at different scan rates within a voltage windows ranging from 0 to 0.8 V. The CV curves are
composed of a rectangular and symmetric shape, showing its typical pseudo-capacitive nature with fast
charge/discharge reaction. CV curves of the α-MnO2 are measured at a scan rate ranging from 10 to
200 mV s-1
are shown in Figure 6(a-b). The curves exhibit rectangular shapes even at higher scan rate
(200 mV s-1
) without seeing any additional redox peaks. Figure 6(c) shows GCD results of the
electrode at different current densities (1, 1.5, 2, 2.5, 3 and 4 Ag-1
) in the potential range of 0.0 to 0.5 V
versus Ag/AgCl. The specific capacitance as function of current densities is shown in Figure 6(d). The
specific capacitances of 362, 263, 175, 131, 79 and 40 Fg-1
were evaluated at a current density of 1,
1.5, 2, 2.5, 3 and 4 Ag-1
, respectively. The specific capacitance decreased from 362 to 40 Fg-1
when the
current density increased from 1 to 4 Ag-1
. The specific capacitance had a lower value at a higher
current density because the electrolyte ions did not have sufficient time to diffuse in and out of the
interior surface of the active material [21]. The obtained capacitance is higher than other reported
MnO2 supercapacitors electrodes shown in Table I.
Table I. Specific capacitances (Cs) of MnO2 materials and other related reports under different
morphology electrodes.
Materials Electrolyte Cs (F.g-1
)
Current
density or
scan rate
Ref.
1 α-MnO2 nanowires 1.0 M Na2SO4 362 1.0 Ag-1
This
work
2 MnO2 /GO 1.0 M Na2SO4 360 2.5 Ag-1
[11]
3 MnO2/exfoliated graphite 1.0 M Na2SO4 358 2 mV s-1
[22]
4 MnO2 nanoparticles 1.0 M Ca(NO3)2 282 0.5 mA cm
-
2
[23]
5 hierarchical MnO2 1.0 M Na2SO4 202.6 0.25 Ag-1
[24]
6 α-MnO2 nanorods 1.0 M Na2SO4 198 1.0 Ag-1
[9]
7 amorphous MnO2 1.0 M NaCl 110 5 mV s-1
[25]
The cycling stability of the α-MnO2 electrodes was investigated by subjecting them to repeated
charge-discharge process. The cycling process was performed at a current density of 2 A/g for 5000
Int. J. Electrochem. Sci., Vol. 13, 2018
6433
cycles. The variation of specific capacitance as a function of cycle number is shown in Figure 6(e). It
can be noticed that the specific capacitance of α-MnO2 electrodes maintains about 83 % of its initial
value after 5000 cycles.
Figure 6. (a-b) CV curves at various scan rates; (c) GCD curves at different current densities ranging
from 1 to 4 Ag-1
; (d) specific capacitances at different current densities; (e) cycling life of
electrode; (f) Impedance spectra of the as-prepared α-MnO2 electrode.

Int. J. Electrochem. Sci., Vol. 13, 2018
6434
The EIS analysis has been shown in shown in Fig. 6(f). The impedance spectrum consists of
semicircle at higher frequencies, representing the interfacial Faradic charge transfer resistance (Rct),
showing the resistance of the electrochemical reactions at the surface of electrode. The vertical line
ensures the better capacitive performance of α-MnO2 electrode. The straight sloping Rct line indicates
the pure capacitive behaviour. The α-MnO2 nanowires electrode has smaller Rct value 1.4 Ω. The low
values of Rct show superior charge transfer performance of electrode [26].
4. CONCLUSIONS
In summary, α-MnO2 nanowires have been successfully synthesized via simple hydrothermal
method. The capacitive performances of α-MnO2 nanowires electrode show the higher specific
capacitance of 362 Fg-1
at a current density of 1.0 Ag-1
, excellent rate capability and long-term cycling
stability. Based on the investigation of the chemical structure, morphology, and electrochemical
behaviour of α-MnO2 nanowires, we achieved higher specific capacitance. These results suggest that
this material will have potential applications in sensors, power sources, and other nano-devices, etc.
ACKNOWLEDGEMENTS
We appreciate the financial support of the National Natural Science Foundation of China (Grant No.
61373072).
References
1. M. Huang, Y. Zhang, F. Li, L. Zhang, R.S. Ruoff, Z. Wen, Sci. Rep., 4 (2014) 3878.
2. M. Armand, J.-M. Tarascon, Nature., 451 (2008) 652.
3. P. Simon, Y. Gogotsi, Nat. Mater.,7 (2008) 845.
4. A.S. Aricò, P. Bruce, B. Scrosati, J.-M. Tarascon, Nat. Mater., 4 (2005) 366.
5. S. Hussain, T. Liu, M.S. Javed, N. Aslam, N. Shaheen, Ceram. Int., 42 (2016) 11851.
6. C. Choi, K.M. Kim, K.J. Kim, X. Lepró, G.M. Spinks, Nat. Commun., 7 (2016) 13811.
7. H.U. Shah, F. Wang, M.S. Javed, N. Shaheen, M. Saleem, Ceram. Int., 44 (2017) 3580.
8. Y. Yuan, C. Zhan, K. He, H. Chen, W. Yao, S. Sharifi-Asl, Nat. Commun., 7 (2016) 13374.
9. W. He, W. Yang, C. Wang, X. Deng, B. Liu, Phys. Chem. Chem. Phys., 18 (2016) 15235.
10. N. Kijima, T. Ikeda, K. Oikawa, F. Izumi, J. Solid State Chem., 177 (2004) 1258.
11. Y. Haldorai, K. Giribabu, S.K. Hwang, C.H. Kwak, Electrochim. Acta., 222 (2016) 717.
12. H.U. Shah, F. Wang, M. Sufyan, M.A. Ahmad, M. Saleem, J. Energy Storage., 17 (2018) 318.
13. L. Li, C. Nan, J. Lu, Q. Peng, Y. Li., Chem. Commun., 48 (2012) 6945.
14. H. U. Shah, F.P.Wang, Int. J. Electrochem. Sci., 11 (2016) 8155.
15. W. Li, R. Zeng, Z. Sun, D. Tian, S. Dou, Sci. Rep., 4 (2014) 6641.
16. Y. Jiang, X. Ling, Z. Jiao, L. Li, Q. Ma, M. Wu, Y. Chu, Electrochim. Acta., 153 (2015) 246.
17. L. Bao, X. Li, Adv. Mater., 24 (2012) 3246.
18. M. Tian, M. Du, L. Qu, K. Zhang, H. Li, S. Zhu, D. Liu, J. Power Sources., 326 (2016) 428.
19. M. Huang, Y. Zhang, F. Li, Z. Wang, Alamusi, N. Hu, Sci. Rep., 4 (2014) 4518.
20. X. Zhao, Y. Du, L. Jin, Y. Yang, S. Wu, W. Li, Y. Yu, Sci. Rep., 5 (2015) 14146.
21. C.Z. Yuan, B. Gao, L.F. Shen, S.D. Yang, L. Hao, Nanoscale., 3 (2011) 529.
22. H.R. Naderi, H.R. Mortaheb, A. Zolfaghari, J. Electroanal. Chem., 719 (2014) 98.
23. B. Gnana Sundara Raj, A.M. Asiri, A.H. Qusti, Ultrason. Sonochem., 21 (2014) 1933.

Int. J. Electrochem. Sci., Vol. 13, 2018
6435
24. Y.X. Zhang, M. Huang, F. Li, X.L. Wang, Z.Q. Wen, J. Power Sources., 246 (2014) 449.
25. R.N. Reddy, R.G. Reddy., J. Power Sources., 132 (2004) 315.
26. H.U. Shah, F. Wang, M.S. Javed, N. Shaheen, Y. Ye, J. Alloys Compd., 725 (2017) 1223.
© 2018 The Authors. Published by ESG (www.electrochemsci.org). This article is an open access
article distributed under the terms and conditions of the Creative Commons Attribution license
(http://creativecommons.org/licenses/by/4.0/).