integrated 2013report - adcock ingramc adcock ingram integrated report2013 area of risk this icon...
TRANSCRIPT

Adcock Ingram
Integrated Reportt 2013
INTEGRATED REPORT
2013Heritage | Quality | Integrity

ABOUT THIS REPORTAdcock Ingram has continued the journey towards providing a more comprehensive picture of the Group in one document and continues to make changes to the way it reports, working towards producing a more integrated report as recommended in the revised King Code on Governance Principles for South Africa (King III).
Adcock Ingram regards this process as a valuable opportunity to engage with its stakeholder groups and to respond to issues that have been raised. The focus has therefore been on the issues most material to our stakeholders as highlighted in the stakeholder engagement section on pages 48 and 49.
The other issues we report on in our integrated report are considered by leadership throughout the year as being vital to the sustainability of the Group and include all material aspects up to 29 November 2013.
A detailed strategy has not been presented as the Independent Board-led process to respond to expressions of interest for control of the Group necessitated very significant effort and resources and also required that certain other strategic growth initiatives be suspended as current and possible future partners await the outcome of this process.
Based on feedback received from our stakeholders and more specifically our shareholders and others in the investor community, we continue to include a full set of annual financial statements with the integrated report. A summary of the financial highlights is presented on pages 4 to 7.
REPORTING PRINCIPLESAdcock Ingram is a public company incorporated in South Africa in accordance with the provisions of the Companies Act 71 of 2008 (Companies Act) and complies with the principles of King III, unless otherwise stated, the Companies Act, the JSE Limited Listings Requirements and other legislative requirements. The Group subscribes to high ethical standards and principles of corporate governance. For more details, and an overview of the Group governance and structure, please see the corporate governance section on pages 13 to 15.
In addition to the above, the Group adheres to International Financial Reporting Standards (IFRS) in compiling its annual financial statements. For reporting on sustainability issues it also complies with Global Reporting Initiative 3 (GRI) standards to facilitate comparability with the reports of other organisations.
INTEGRATED REPORT
2013FOR THE YEAR ENDED 30 SEPTEMBER 2013
SCOPE AND BOUNDARY OF THIS REPORTAdcock Ingram’s integrated report covers the financial year 1 October 2012 to 30 September 2013. The report is released at least 15 business days prior to its Annual General Meeting to be held on 31 January 2014.
The report provides a general narrative on the performance of the Group which includes the holding company and its subsidiaries, joint ventures and associates across all territories, but focuses its detailed commentary on the operational performance of its main business in South Africa, as the performance in this territory has a material impact on the overall sustainability of the Group. Reports are given, where relevant, about our businesses in Kenya, Ghana, Zimbabwe and India. Comparatives are included where available.
The Group’s consolidated annual financial statements are included in this report and include details regarding all subsidiaries, joint ventures and associates as detailed on page 122.
ASSURANCEIn line with its responsibility, the Board of directors ensures the integrity of the integrated report. The Board has accordingly applied its mind to the integrated report and, in its opinion, the report presents fairly the integrated performance of the Group.
ANNUAL FINANCIAL STATEMENTS 2013The annual financial statements for the year ended 30 September 2013 were approved by the Board of directors on 26 November 2013. Ernst & Young Inc., the independent auditors, have audited the annual financial statements as disclosed in their unqualified report.
SUSTAINABILITY INFORMATIONThe sustainability information has not been assured in 2013.
BBBEE STATUSThe Group’s BBBEE status has been assured by Empowerlogic, an independent verification agency, for the 2013 financial year. Through the external assurance received from the agency, the Group has been assessed as a Level 3 contributor in terms of the BBBEE Act.
GRI: 2.6, 3.1 – 3.3, 3.5 – 3.11, 3.13

ADCOCK INGRAM INTEGRATED REPORT 2013
CON
TEN
TS
GROUP OVERVIEW 1 2013 Highlights 2 Business model
4 Financial summary8 Executive Committee
10 Board and governance structure13 Corporate governance16 Leadership statement22 Drug management and development23 Operational overview – Southern Africa24 OTC26 Prescription28 Hospital30 Supply chain – Manufacturing32 Supply chain – Distribution34 Operational overview – India38 – Rest of Africa42 Sustainability48 Stakeholder engagement50 Remuneration report60 Risk management62 GRI table
ANNUAL FINANCIAL STATEMENTS64 Directors’ responsibility for and approval of the
annual financial statements64 Certificate by Company Secretary65 Independent auditor’s report to the members of
Adcock Ingram Holdings Limited66 Audit Committee report68 Directors’ report70 Consolidated statements of comprehensive income71 Consolidated statement of changes in equity72 Consolidated statements of financial position73 Consolidated statements of cash flows74 Accounting policy elections75 Notes to the Group annual financial statements98 Company statements of comprehensive income99 Company statement of changes in equity100 Company statements of financial position101 Company statements of cash flows102 Notes to the Company annual financial statements108 Annexure A: Segment report110 Annexure B: Share-based payment plans113 Annexure C: Defined benefit plan114 Annexure D: Post-retirement medical liability115 Annexure E: Financial instruments120 Annexure F: Interest in joint ventures122 Annexure G: Interest in subsidiary companies,
joint ventures and associates124 Annexure H: Accounting policies139 Annexure I: Equity-accounted joint ventures
SHAREHOLDER INFORMATION142 Shareholder analysis144 Shareholders’ diary145 Notice of Annual General Meeting147 Annual General Meeting – explanatory notes149 Form of proxy
OTHER152 Glossary
Company details – inside back cover
This icon indicates more information is available online at www.adcock.com
Get more information online
This icon indicates more information can be cross-referenced on pages within this report
Cross-reference information
This icon indicates the adjacent information contains GRI compliance elements
Information contains GRI compliant information
This icon indicates where we have not yet achieved our goals
Area of riskThis icon indicates an area indicated as a risk to the Group?
Have we succeeded in our 2012/2013 strategic objectives?
This icon indicates where we succeeded in our objectives

c
ADCOCK INGRAM INTEGRATED REPORT 2013
Area of riskThis icon indicates an area indicated as a risk to the Group
OUR VISIONTo be recognised as a leading world-class branded healthcare company.
OUR HERITAGE Adcock Ingram has a proud heritage which spans more than 120 years. The business started as a small Krugersdorp pharmacy. Its founders branched out into new product development, manufacturing, distribution, and sales and marketing.
Adcock Ingram was first listed on the Johannesburg Stock Exchange (JSE) in 1950 and enjoyed blue chip status. In 2000 Tiger Brands (then the majority shareholder) acquired the minority shares, and Adcock Ingram was delisted from the JSE and operated as a wholly-owned subsidiary of Tiger Brands. On 25 August 2008, Adcock Ingram was unbundled from Tiger Brands and relisted on the JSE.
2012 Integrated Report Rated “Excellent” in the Ernst & Young Excellence in Corporate Reporting Survey as well as merit certificate for referencing and usability.
2013 Icon TGI Brand Survey
Panado is rated No. 1 in the OTC category.
Consumer’s stamp of approval
GynaGuard Ultimate wash and TLC deep cleansing facial wipes won 2013 product of the year award.
Frost & Sullivan Middle-Eastern and African pharmaceuticals and healthcare emerging market innovation 2013.
Productivity SA For outstanding innovation in productivity improvement initiative at Critical Care.
South African Graduates Development Association
Gold award for serving as a pioneer in the absorption of unemployment graduates and interns to increase employment of graduates and youth in South Africa.
RECOGNISED IN OUR INDUSTRY
OUR PROFILE Adcock Ingram is a leading South African manufacturer, marketer and
distributor of healthcare products with a market capitalisation of more than R12 billion. The Group enjoys almost 10% share
of the private pharmaceutical market in South Africa with a strong presence in Over the Counter (OTC) brands.
The Group is South Africa’s largest supplier of hospital and critical care products. Its footprint extends to
other territories in sub-Saharan Africa and India.
The extensive product portfolio includes branded and generic prescription
medicines, OTC/fast moving consumer goods (FMCG) brands, intravenous
solutions, blood collection products and renal dialysis systems.
Sustainability is core to our business to add value to peoples’ lives. This includes those of our shareholders, customers, employees, suppliers, partners and the communities in which we operate. We aim to reduce our environmental footprint through continuous improvement. We have remained Level 3 Broad Based Black Economic Empowerment (BBBEE) status within the business.
For more information on our history, visit our website: www.adcock.com
GRI: 2.1,2.10, 4.8

c d
ADCOCK INGRAM INTEGRATED REPORT 2013
COM
PAN
Y D
ETAI
LS
AdCOCk iNgrAM hOldiNgs liMited(Registration number 2007/016236/06)(Incorporated in the Republic of South Africa)JSE Share Code: AIP ISIN: ZAE000123436
direCtOrsKDK Mokhele (Chairman)*, JJ Louw (Chief Executive Officer), AG Hall (Deputy Chief Executive and Financial Director), M Haus* ✓, T Lesoli*, PM Makwana*, CD Raphiri*, LE Schönknecht*, RI Stewart*, AM Thompson**Independent non-executive✓German
COMPANY seCretArYNE Simelane
registered OffiCe1 New Road, Midrand, 1682
POstAl AddressPrivate Bag X69, Bryanston, 2021
trANsfer seCretAriesComputershare Investor Services (Pty) Limited70 Marshall Street, Johannesburg, 2001PO Box 61051, Marshalltown, 2107
AuditOrsErnst & Young Inc.102 Rivonia Road, Sandton, 2196
sPONsOrDeutsche Securities (SA) (Pty) Limited3 Exchange Square, 87 Maude Street, Sandton, 2146
BANkersNedbank Limited135 Rivonia Road, Sandown, Sandton, 2146
Rand Merchant Bank1 Merchant Place, corner Fredman Drive and Rivonia Road, Sandton, 2196
AttOrNeYsRead Hope Phillips30 Melrose Boulevard, Melrose Arch, 2196
For more information please visit www.adcock.com
ethiCs hOtliNeemail: [email protected]: www.tip-offs.comfree Post: KZN 138, Umhlanga Rocks, 4320
sOuth AfriCAtoll free land lines: 0800212762toll free fax: 0800007788
ZiMBABWetoll free land lines: 0800 4100/1/3/4/5/6 and 0800 4161toll free cell phone lines: 0808 5500 and 0808 4146
keNYAtoll free cell phone: 0800722626 (Safaricom)

FINANCIAL ShARe statistics
SOCIALBBBee SCOReCARD
LEVEL 3TRAINING
95% spent on previously disadvantaged employees
eMPLOYeeS
4 841
2013: 7 200 CeNTS
2012: 6 630 CeNTS
2013: 5 100 CeNTS
2012: 5 151 CeNTS
2013: 6 855 CeNTS
2012: 5 939 CeNTS
increased
18% to
R5,446 MILLIONTU
RNO
VER
decreased
17% to
350,5 CENTSH
EPS
HIG
H F
OR
THE
YEAR
LOW
FO
R TH
E YE
ARCL
OSI
NG
PR
ICE
eNeRGY USAGe (KWh)
2013: 52 423 9682012: 36 193 507
WATeR USAGe (KILOLITReS)
2013: 400 3292012: 404 846
CARBON eMISSIONS (TONNeS)
2013: 112 5982012: 94 843
CARBON eMISSIONS (SCOPe 1 AND 2) PeR FULL-TIMe eMPLOYee (TONNeS)
2013: 24,652012: 22,19
2013
H
IGH
LIG
HTS
eNVIRONMeNTAL
EBIT
DA
increased
11% to
R1,096 MILLION
1
ADCOCK INGRAM INTEGRATED REPORT 2013
GRI: 2.8, EN 1, EN 3 – 8

2
ADCOCK INGRAM INTEGRATED REPORT 2013
RESEARCH AND DEVELOPMENT SOURCE MANUFACTURING
Buy intellectual property
Develop intellectual property
REGISTRATION
Raw materials sourced internationally or locally
Finished goods from third party suppliers
Own factories
Outsourcedmanufacturing
Manufacturing capacities and accreditation details of the various facilities are disclosed on pages 30 – 31
PRODUCTSOTC
RX
For OTC category performance refer to pages 24 – 25
Prescription performance is discussed on pages 26 – 27
HOSPITALFor Hospital performance refer to pages 28 and 29
BusiNess MODEL2
Details regarding Research and Development, Quality assurance,Regulatory affairs andMedical affairs, can be found on page 22

ADCOCK INGRAM INTEGRATED REPORT 2013
LOGISTICS CUSTOMERS FOOTPRINT
Own distribution centres
3rd Party distribution centres
SOUTHERN AFRICA
INDIA
REST OF AFRICA
Doctors
Hospitals
Pharmacies
Wholesalers
Governments
In-sourcing
For details of the Southern Africa business refer to pages 23 – 29
Healthcare in India is discussed on pages 34 – 37
Performance of the Rest of Africa segment is discussed on pages 38 – 41
3
The location and capacity details of our warehouses are disclosed on pages 32 – 33
FMCG retailers

4
ADCOCK INGRAM INTEGRATED REPORT 2013
CONSOLIDATED STATEMENTS OF COMPREHENSIVE INCOME FOR THE YEAR ENDED 30 SEPTEMBER
fiNANCiAl SUMMARY
TURNOVeRThe acquisition of Cosme, a mid-sized Indian pharmaceutical sales and marketing business, was concluded in January 2013. This acquisition, together with South African tender awards and the effect of multinational (MNC) contracts concluded towards the end of 2012, supported turnover growth of 18.4% to R5,446 million (2012: R4,599 million).
Volumes increased 10,1%, influenced by the South African tender awards and new business in the product mix accounted for 5,4% of the overall increase. Price increases across the business averaged only 2,9% for the year but an improvement from the figure of 1,9% at the half-year. The Single Exit Price (SEP) increase of 5,8% granted by the State was implemented in March 2013.
GROSS PROFITGross profit for the year increased by 6,8% to R2,237 million (2012: R2,094 million) with the margin declining from 45,5% to 41,1%. Gross margin as a percentage of sales was adversely impacted by the change in mix with higher volumes of low-margin MNC and tender sales, and the significantly weaker Rand, which affected imported costs of raw materials and finished products.
OPeRATING eXPeNSeSOperating expenses increased by 9,9% to R1,346 million (2012: R1,225 million). The increase includes Cosme operating expenses not in the base (including amortisation of R33,4 million) of R137,8 million, a foreign exchange gain of R42,4 million and M&A-related project costs of R35 million relating to the CFR transaction.
OPeRATING PROFITOperating profit increased by 2,5% to R891 million (2012: R869 million) with the percentage on sales reducing from 18,9% to 16,4%. Finance costs, net of investment income, were R45,4 million, compared to the R18,5 million income realised in the prior year as the average cash position turned into a net overdraft position following the acquisition of Cosme.
PROFIT BeFORe TAXATIONAfter net finance costs, equity-accounted earnings and dividends received, profit before tax decreased 4,4% to R848 million (2012: R887 million). The effective tax rate for the year normalised at 29,1% (2012: 19,0%). The previous year’s tax rate benefitted from Strategic Industrial Project (SIP) allowance for capital projects, which reduced that year’s tax charge by R86 million.
heADLINe eARNINGSDespite improved turnover and good cost control, weaker gross margins, increased borrowings and expiry of tax allowances, all combined, delivered headline earnings for the year ended 30 September 2013 of R591,0 million. This represents a 17,2% decrease over the comparable figure for 2012 of R713,4 million and translates into a decrease of 17,0% in headline earnings per share.
2013 2012R’000 R’000
Revenue 5 482 783 4 644 406
Turnover 5 445 639 4 599 249 Cost of sales (3 208 798) (2 505 167)
Gross profit 2 236 841 2 094 082 Selling and distribution expenses (699 635) (571 500)Marketing expenses (211 930) (208 625)Research and development expenses (104 941) (81 601)Fixed and administrative expenses (329 530) (363 535)
Operating profit 890 805 868 821 Finance income 24 531 18 285 Finance costs (82 504) (26 637)Dividend income 12 613 26 872 Equity-accounted earnings 2 663 –
Profit before taxation 848 108 887 341 Taxation (246 878) (168 265)
Profit for the year 601 230 719 076
Other comprehensive income which will subsequently be recycled to profit or loss 370 (37 896)
Exchange differences on translation of foreign operations (772) (26 181)Net profit on available-for-sale asset, net of tax 247 –Movement in cash flow hedge accounting reserve, net of tax 895 (11 715)
Total comprehensive income for the year, net of tax 601 600 681 180
Profit attributable to:Owners of the parent 587 844 705 641 Non-controlling interests 13 386 13 435
601 230 719 076
Total comprehensive income attributable to:Owners of the parent 587 203 670 434 Non-controlling interests 14 397 10 746
601 600 681 180
Basic earnings per ordinary share (cents) 348,6 417,8 Diluted basic earnings per ordinary share (cents) 348,3 417,2 Headline earnings per ordinary share (cents) 350,5 422,4 Diluted headline earnings per ordinary share (cents) 350,2 421,8 Net asset value per share (cents) 2 160,1 2 028,8
For more details on currency bought during the year, refer to Annexure E.
For more details regarding the CFR transaction, refer to the Leadership Statement on page 16.

5
ADCOCK INGRAM INTEGRATED REPORT 2013
CONSOLIDATED STATEMENTS OF FINANCIAL POSITIONAT 30 SEPTEMBER
PROPeRTY, PLANT AND eqUIPMeNTR344 million was invested in property, plant and equipment, including upgrading of the distribution facility (R80 million), as well as the construction of the central laboratory at the high-volume liquids facility at Clayville (R72 million). Wadeville invested almost R50 million with the addition of two new granulation suites.
INTANGIBLe ASSeTSIntangible assets of R1,4 billion increased by R725 million, due to the acquisition of intangibles in India. Amortisation of R51 million has been expensed against intangible assets which have a finite life, with Cosme representing two-thirds (R33 million) of that amount.
INVeNTORIeSInventory of R1,5 billion is R602 million higher than last year. Apart from the effect of the weak Rand on the carrying cost of inventory (R123 million), the balance includes inventory relating to new MNC and tender business of R127 million, and R54 million relating to the inclusion of new business (Cosme and Datlabs). The increase in inventory experienced during the year is a function of a deliberate decision to grow the business and improve service levels, but stringent focus will be placed on normalising these inventory levels in the coming year.
TRADe AND OTheR ReCeIVABLeSTrade and other receivables have increased by R299 million, but days in trade receivables improved to 62 days (2012: 65 days). There were no bad debts in the period. 85% of the trade receivables are due from private customers.
TRADe AND OTheR PAYABLeS, AND PROVISIONSTrade and other payables, and provisions have increased by R367 million, including R128 million relating to Cosme (R96 million) and Datlabs (R32 million), and R74 million due to new MNC partners.
BORROWINGSAside from the overdraft of R1,15 billion, other borrowings total R141 million of which R136 million are short-term. R100 million remains outstanding on the capex facilities, R64 million bearing interest at JIBAR + 265 basis points and R36 million at JIBAR + 180 basis points. The final instalment is due in December 2013. The overnight loans and overdraft bear interest at rates between 6,25% and 7%. The debt/equity ratio at year end was 34,0%, and net debt:EBITDA is 1,2 times.
2013 2012 R’000 R’000
ASSeTSProperty, plant and equipment 1 766 464 1 560 177 Intangible assets 1 435 716 710 960 Deferred tax 14 507 5 097 Other financial assets 139 646 139 751 Other non-financial asset 36 987 – Investment in associates 2 663 – Loans receivable 16 489 27 060
Non-current assets 3 412 472 2 443 045
Inventories 1 558 467 956 164 Trade and other receivables 1 618 947 1 320 191 Cash and cash equivalents 163 070 492 716 Taxation receivable 65 871 70 170
Current assets 3 406 355 2 839 241
Total assets 6 818 827 5 282 286
eqUITY AND LIABILITIeSCapital and reservesIssued share capital 16 832 16 872 Share premium 504 064 547 400 Non-distributable reserves 364 996 356 229 Retained income 2 750 097 2 502 510
Total shareholders’ funds 3 635 989 3 423 011 Non-controlling interests 144 878 137 684
Total equity 3 780 867 3 560 695
Long-term borrowings 5 172 104 625 Post-retirement medical liability 15 108 15 341 Deferred tax 139 066 101 910
Non-current liabilities 159 346 221 876
Trade and other payables 1 340 333 983 589 Bank overdraft 1 307 993 – Short-term borrowings 135 507 431 368 Cash-settled options 39 150 39 983 Provisions 55 631 44 775
Current liabilities 2 878 614 1 499 715
Total equity and liabilities 6 818 827 5 282 286
Full annual financial statements can be found from page 63.
GRI: EC1

6
ADCOCK INGRAM INTEGRATED REPORT 2013
CONSOLIDATED STATEMENTS OF CASH FLOWS FOR THE YEAR ENDED 30 SEPTEMBER
fiNANCiAl SUMMARY CONTINUED
2013 2012 R’000 R’000
Cash flows from operating activitiesOperating profit before working capital changes 1 204 899 1 077 581 Working capital changes (630 598) (292 138)
Cash generated from operations 574 301 785 443 Finance income, excluding receivable 21 720 19 369 Finance costs, excluding accrual (73 715) (22 672)Dividend income, excluding receivable 12 613 27 035 Dividends paid (347 118) (155 356)Taxation paid (216 090) (196 158)
Net cash (outflow)/inflow from operating activities (28 289) 457 661
Cash flows from investing activitiesDecrease in other financial assets 409 457 Acquisition of Cosme business, net of cash (821 593) – Purchase of property, plant and equipment – Expansion (65 262) (276 401) – Replacement (279 111) (235 392)Purchase of intangible assets – (13 109)Proceeds on disposal of property, plant and equipment 377 1 732 Increase in loans receivable – (11 221)
Net cash outflow from investing activities (1 165 180) (533 934)
Cash flows from financing activitiesAcquisition of non-controlling interests in Ayrton Drug Manufacturing Limited (342) (11 060)Proceeds from issue of share capital 5 099 7 068 Purchase of treasury shares (48 475) (45 683)Share issue expenses incurred by subsidiary (3 669) – Distribution out of share premium – (179 289)Increase in borrowings 31 339 16 503 Repayment of borrowings (426 995) (321 777)
Net cash outflow from financing activities (443 043) (534 238)
Net decrease in cash and cash equivalents (1 636 512) (610 511)Net foreign exchange difference on cash and cash equivalents (1 127) (355)Cash and cash equivalents at beginning of year 492 716 1 103 582
Cash and cash equivalents at end of year (1 144 923) 492 716
CASh GeNeRATeD FROM OPeRATIONSCash generated from operations was R574 million (2012: R785 million) after working capital increased by R631 million (2012: R292 million). Although receivables increased by R311 million, trade accounts receivable days at the end of the year of 62 days improved on the 65 days reported in 2012.
Inventory increased by R602 million, including inventory relating to new MNC and tender business of R127 million and R54 million relating to Datlabs in Zimbabwe and the Cosme business in India. The overall inventory holding cost also increased (R123 million) due to the exchange rate impact.
The increase in accounts receivable and inventory was partly offset by the increase in payables of R356 million. After net finance income, equity-accounted earnings, dividends of R347 million (2012: R155 million) and taxation, the cash outflow was R28 million (2012: R458 million inflow).
INVeSTING ACTIVITIeSTotal capital expenditure for the year amounted to R344 million (2012: R512 million) which includes upgrading the distribution facility (R80 million), as well as the construction of the central laboratory at the high-volume liquids facility in Clayville (R72 million). Wadeville invested almost R50 million in the addition of two new granulation suites.
FINANCING ACTIVITIeS During the year, R400 million was repaid on the loan facility for the factory upgrades. The remaining balance of R100 million will be paid in December 2013.
CASh AND CASh eqUIVALeNTSFollowing the acquisition of the Cosme business for R821 million, cash decreased by R1,6 billion, leaving the business in a year-end overdraft position of R1,1 billion (2012: R493 million net cash position).
Cash and cash
equivalents at the
beginning of the year
Operating pro�t before
working capital
changes
Working capital
changes
Dividend paid
Taxation paid
Acquistition of Cosme business
Purchase of Property, plant and
equipment
Repayment of
borrowings
Other Overdaraft at the end of
the year
2 000
1 500
1 000
500
(500)
(1 000)
(1 500)
0
R493m
R1,205m
(R631)
(R347)(R216)
(R822)
(R344)(R427)
(R56)
(R1,145m)
Movements in cash and cash equivalentsR’m

7
SEGMENT REPORT FOR THE YEAR ENDED 30 SEPTEMBER
TURNOVeROverall, the Southern Africa region posted a sales increase of 13,4%, despite consumer spending remaining under pressure. Volumes were boosted by increased tender awards and we expect to see further increases in volumes of ARV’s supplied in terms of the current ARV tender award.
OTC sales increased by 12% to R2,002 million (2012: R1,792 million), with a good performance from economy brands in pharmacy and schedule 0 brands in the FMCG channel. Premium brands remain under pressure but are showing growth relative to the market. The core brands – Panado, Corenza, Citro-Soda and Allergex – have managed to hold or improve their market positions despite aggressive competition.
Turnover in the Prescription business increased by 21,9% to R1,853 million (2012: R1,520 million). This was impacted by new multi-national collaborations and success in the most recent ARV and other oral dosage tender awards.
hospital turnover increased by 4,6% over the comparable year to R1,176 million (2012: R1,124 million) with increased tender volumes. However, the change in mix impacted margins negatively. The Renal portfolio reflects continued growth through peritoneal dialysis, haemodialysis and Continuous Renal Replacement Technology (CRRT).
Turnover growth in the Rest of Africa was 42% over the last year.
In Ghana, Adcock Ingram product sales continue to grow due to expansion in territorial coverage and increased marketing activities, but the core Ayrton brands’ performance was almost flat.
In east Africa, sales increased by 60% compared to the same period last year, driven by expansion in the OTC therapeutic areas, increased marketing activities and the re-introduction of Dawanol.
In Zimbabwe, sales growth was supported by efficiencies in the supply chain and the introduction of CamphaCare which has received country-wide acceptance.
India recorded total sales of R386 million (2012: R140 million), with the Cosme business contributing R169 million since its acquisition in January 2013. These sales were adversely impacted during a six-week transition phase when sales force union activity reduced productivity. These union related issues were subsequently resolved and the business is well placed to provide satisfactory growth next year.
CONTRIBUTION AFTeR MARKeTING eXPeNSeSMargins in Southern Africa have been negatively impacted by the weakening of the Rand, competitive trading conditions, inflation-plus cost increases, and the change in mix, with higher proportions of MNC and tender business at lower margins, resulting in the contribution after marketing expenses decreasing almost 6% to R1,177 million (2012: R1,246 million).
ADCOCK INGRAM INTEGRATED REPORT 2013
2013R’000
2012R’000
TurnoverSouthern Africa 5 030 767 4 435 938
OTC 2 002 279 1 791 875 Prescription 1 852 759 1 520 219
Generics 865 444 640 694 Branded 987 315 879 525
Hospital 1 175 729 1 123 844
Rest of Africa 220 635 155 112 India 386 331 140 433
5 637 733 4 731 483 Less: Inter-company sales (192 094) (132 234)
5 445 639 4 599 249
Contribution after marketing expenses Southern Africa 1 177 249 1 245 746
OTC 707 403 660 492 Prescription 321 704 371 801
Generics 145 029 205 568 Branded 176 675 166 233
Hospital 148 142 213 453
Rest of Africa 48 253 27 315 India 108 968 48 388
1 334 470 1 321 449Less: Inter-company (9 194) (7 492)
1 325 276 1 313 957
Less: Other operating expenses (434 471) (445 136)
Research and development (104 941) (81 601) Fixed and administrative (329 530) (363 535)
Operating profit 890 805 868 821
OTC (35%)Prescription (33%) Hospital (21%) Rest of Africa (4%) India (7%)
turnover 2013

8
ADCOCK INGRAM INTEGRATED REPORT 2013
Dr Jonathan LouwChief exeCutive OffiCer
• See page 10 for abridged Cv
Kofi AmegashieBSc (hons) Chemical engineering, MSc Management (uK)
COMMerCiAL exeCutive – reSt Of AfriCA
• Appointed in October 2011
• Previously CeO of Alexander forbes business on the African continent outside of South Africa
• Joined Coca-Cola in Nigeria in 2006 as Director Consumer Marketing, Strategy and Business Planning for Nigeria and equatorial Africa
• 20 years’ broad business experience in emerging and developed markets including Commercial head of Pharmaceuticals
reSPONSiBiLitieS
• Growth in sub-Saharan Africa
• Drive regional exports in Africa
Andrew hallDePuty Chief exeCutive AND fiNANCiAL DireCtOr
• See page 10 for abridged Cv
Pravin iyerBCom, AiCWA, CMA
COMMerCiAL exeCutive – iNDiA
• Joined Adcock ingram in June 2011
• Director of Adcock ingram healthcare Private Limited, india
• Previously CeO of the Medreich Group, Adcock ingram’s joint venture manufacturing partner in india
• CfO of Medreich for five years
• 21 years’ experience in the pharmaceutical industry
reSPONSiBiLitieS
• Growth in india following acquisition of the Cosme business
• Manage indian transactional and regulatory support for Africa
Colin SheenMBA, PDBA, Btech, N. Dip. Marketing
COMMerCiAL exeCutive
• Joined Adcock ingram in June 2008
• Previously held various roles at Schering-Plough including Divisional Director, Marketing Director and head of the South African commercial business
• Spent 10 years at 3M Corporation in various commercial roles including Commercial head of Pharmaceuticals
reSPONSiBiLitieS
• Specialised therapies
• Strategic alliances
viral Desai BPharm, BCom
COMMerCiAL exeCutive
• Joined Adcock ingram in March 1999
• Served in various senior commercial and technical roles including corporate and business strategy development
reSPONSiBiLitieS
• Pharmacy and hospital Generics
• Government tenders
Craig St John-AyreBSc hons, MSc
COMMerCiAL iNteLLiGeNCe exeCutive
• Joined Adcock ingram in August 2013
• Previously Managing Director of the Business Practice
• held positions in Marketing and Business intelligence with several multi-national pharmaceutical companies, including Pfizer, GSK and AstraZeneca
• 20 years’ pharmaceutical industry experience
reSPONSiBiLitieS
• Customer relationship and contract management
• Cross-functional business analysis
Ashley PearceDip. Pharm, BCom
COMMerCiAL exeCutive – SOutherN AfriCA
• Joined Adcock ingram in October 2012 as Customer relationship executive
• Appointed into current role on 1 April 2013
• Previously CeO of MSD in South Africa
• Over 28 years’ experience within the pharmaceutical industry, in Production, r&D, Business Development, and Sales and Marketing
• has led both the Pharmaceutical industry Association of South Africa (PiASA) and the Pharmaceutical task Group (PtG)
reSPONSiBiLitieS
• Growth in Southern Africa
eXeCutiVe COMMITTEE
Full CV’s available on the website www.adcock.com
Refer to page 75 for details regarding the Cosme acquisition
GRI: 2.3, 4.1 – 4.3, 4.9

9
ADCOCK INGRAM INTEGRATED REPORT 2013
Werner van rensburgMeng (Mechanical engineering), MBA, eMLog, GCC (ML & OhS)
Chief OPerAtiNG OffiCer
• Joined Adcock ingram in May 2013
• Previously Managing Director at formex
• Pharmaceutical experience gained at Aspen Pharmacare, as Group Operations Director
reSPONSiBiLitieS
• Manufacturing
• Supply chain management
• Procurement
• Logistics
• it
Mahendra ChibabhaiBPharm, Management Advancement Programme
MANufACturiNG exeCutive
• Joined Adcock ingram in January 1979
• 35 years’ experience in pharmaceutical manufacturing in South Africa, Africa and india
• Started his career as a production pharmacist
• Overall responsibility for the recapitalisation of the manufacturing facilities
reSPONSiBiLitieS
• Manufacturing
• Group procurement
tobie KrigeBeng (industrial engineering), MBA
LOGiStiCS exeCutive
• Joined Adcock ingram in January 2012
• More than 15 years’ experience in supply chain and logistics
• Worked in extended geographical areas in europe, Middle east and Africa
• Worked for various other organisations, including Nampak and DhL
reSPONSiBiLitieS
• Logistics
• Planning
• third party procurement
frans CronjeBSc, N. Dip. ind. eng.
iNfOrMAtiON teChNOLOGy exeCutive
• Joined Adcock ingram in December 2007
• Previously held a variety of it executive roles at tiger Brands over a period of 10 years
• Worked for an international it company as an Applications Consulting and Project Manager
• More than 25 years it experience in a variety of industries
reSPONSiBiLitieS
• information technology (it)
Dr Abofele KhoeleMB ChB, MBA
MeDiCAL exeCutive
• Joined Adcock ingram in August 2010
• Previously Medical Director and Chief Scientific Officer at Novartis South Africa
• held various positions in medical affairs and clinical operations at Novartis
• Prior to joining the industry he was a clinician in the field of general surgery
reSPONSiBiLitieS
• Medical affairs
• regulatory affairs
• Group quality assurance
• research and development
Ntando SimelaneB. Juris, LLB
COMPANy SeCretAry
• Joined Adcock ingram in April 2009 as the Group’s Legal and Compliance Manager
• Appointed as Company Secretary on 1 April 2011
• Spent nine years at the SABC in various legal roles
• Spent four years at the Advertising Standards Authority of SA (ASA) as a dispute resolution consultant
reSPONSiBiLitieS
• Company secretariat
• Legal affairs
• Legal / risk compliance
• risk control
Basadi Letsoalohons Psych, CLDP, MPsych, MLPC
huMAN CAPitAL exeCutive
• Joined Adcock ingram in January 2008
• Previously head of transformation at Standard Bank SA
• head of hr information Management at ABSA
• Serves as a member of the university of KwaZulu-Natal Council
reSPONSiBiLitieS
• transformation
• talent acquisition and management
• Learning and development
• remuneration
Doreen KosiMSc, Management Advancement Programme
GOverNMeNt reLAtiONS exeCutive
• Joined Adcock ingram in May 2013
• Worked in the Presidency (republic of South Africa) for 14 years
• Occupied various senior management positions in Government administration for more than 10 years
reSPONSiBiLitieS
• Government relations
• Stakeholder engagement
• Corporate affairs and CSi
• internal and external communications
Mohamed MangelCA (SA)
OPerAtiONAL fiNANCe exeCutive
• Joined Adcock ingram as a project accountant in June 1992
• held various roles in finance over 20 years at Adcock ingram
reSPONSiBiLitieS
• South Africa
• east Africa
• Ghana
• Zimbabwe
Dorette NeethlingCA (SA), MCom (taxation)
GrOuP fiNANCe exeCutive
• Joined Adcock ingram in August 2007
• Previously financial Director at Quintiles South Africa
• financial Manager in fMCG environment in Namibia
reSPONSiBiLitieS
• financial reporting
• taxation
• treasury
• Payroll
10
ADCOCK INGRAM INTEGRATED REPORT 2013
Jonathan J Louw (44)MB ChB, MBAChief executive OfficerAppointed: 15 July 2008Appointed in 2008, overseeing the relisting of the Company on the JSe. Prior to this was head of pharmaceutical business since 2002. Joined Adcock ingram in 2001 as New Business Development executive.
PreviOuS exPerieNCe• Joined Astra Zeneca in South Africa in 1999• Practiced as an anaesthetist at St. Mary’s hospital in London in the 1990s
BOArD: MemberBOArD MeetiNG AtteNDANCe: 5/5SPeCiAL BOArD MeetiNG AtteNDANCe: 2/2AuDit COMMittee: inviteeMeetiNG AtteNDANCe: 3/3riSK AND SuStAiNABiLityCOMMittee: inviteeMeetiNG AtteNDANCe: 2/2SOCiAL, ethiCS AND trANSfOrMAtiONCOMMittee: MemberMeetiNG AtteNDANCe: 2/2
COMMittee Of the iNDePeNDeNt BOArD: inviteeMeetiNG AtteNDANCe: 21/23iNDePeNDeNt BOArD: inviteeMeetiNG AtteNDANCe: 1/1huMAN reSOurCeS, reMuNerAtiON AND NOMiNAtiONS COMMittee: inviteeMeetiNG AtteNDANCe: 2/3reMuNerAtiON2013: r6 368 2502012: r3 949 342
Andrew G hall (51)CA (SA), BPharmDeputy Chief executive and financial DirectorAppointed: 15 July 2008Oversees Group finance, Business Development, investor relations, and the Legal and Company Secretariat. Joined Adcock ingram in 2007 as Chief financial Officer.
PreviOuS exPerieNCe• Partner in charge of health sciences at ernst & young• CfO of a listed pharmaceutical company in South Africa• Sales and marketing at Pfizer, and retail pharmacy
BOArD: MemberBOArD MeetiNG AtteNDANCe: 5/5SPeCiAL BOArD MeetiNG AtteNDANCe: 2/2AuDit COMMittee: inviteeMeetiNG AtteNDANCe: 3/3riSK AND SuStAiNABiLityCOMMittee: inviteeMeetiNG AtteNDANCe: 2/2SOCiAL, ethiCS AND trANSfOrMAtiONCOMMittee: MemberMeetiNG AtteNDANCe: 2/2
COMMittee Of the iNDePeNDeNt BOArD: inviteeMeetiNG AtteNDANCe: 22/23iNDePeNDeNt BOArD: inviteeMeetiNG AtteNDANCe: 1/1reMuNerAtiON2013: r5 140 9502012: r3 188 221
Khotso DK Mokhele (58)PhD Microbiology, MSc food Science, BSc Agricultureindependent non-executive ChairmanAppointed: 15 July 2008
Chancellor of the university of the free State. Chancellor of the university of Pretoria. Chairman of impala Platinum holdings Limited. Serves on the boards of tiger Brands Limited, hans Merensky holdings, Zimplats holdings Limited and African Oxygen Limited, amongst others.
PreviOuS exPerieNCe• founder President of the National research foundation• founder President of the Academy of Science of South Africa• Served as Chairperson of the National Skills Authority and of the Premier’s
economic Advisory Council for the free State Province• Served on the executive Board of the united Nations education, Science and
Culture Organisation (uNeSCO)
BOArD: ChairmanBOArD MeetiNG AtteNDANCe: 5/5SPeCiAL BOArD MeetiNG AtteNDANCe: 2/2SOCiAL, ethiCS AND trANSfOrMAtiONCOMMittee: MemberMeetiNG AtteNDANCe: 2/2COMMittee Of the iNDePeNDeNt BOArD: ChairmanMeetiNG AtteNDANCe: 23/23
iNDePeNDeNt BOArD: ChairmanMeetiNG AtteNDANCe: 1/1huMAN reCOurCeS, reMuNerAtiON AND NOMiNAtiONS COMMittee: MemberMeetiNG AtteNDANCe: 3/3reMuNerAtiON2013: r1 168 8752012: r967 500
Matthias haus (64)MB ChB, MD, DCh, fCfP, ffPM, Dip Obstindependent non-executive directorAppointed: 1 June 2012
Adjunct Professor in Medicine, university of Cape town. extraordinary Professor in Medicine, university of Pretoria. Partner at Gateways Business Consulting Group. trustee of the Colleges of Medicine of South Africa. editor in chief at Current Allergology and Clinical immunology. executive at the Allergy Society of South Africa.
PreviOuS exPerieNCe• executive vice President, AstraZeneca (sub-Saharan Africa and China)• Non-executive chairman, Professional Provident Society of South Africa• Senator, Colleges of Medicine of South Africa
BOArD: MemberBOArD MeetiNG AtteNDANCe: 5/5SPeCiAL BOArD MeetiNG AtteNDANCe: 2/2riSK AND SuStAiNABiLityCOMMittee: MemberMeetiNG AtteNDANCe: 2/2
COMMittee Of the iNDePeNDeNt BOArD: MemberMeetiNG AtteNDANCe: 20/23iNDePeNDeNt BOArD: MemberMeetiNG AtteNDANCe: 1/1reMuNerAtiON2013: r497 5582012: r109 519
tlalane Lesoli (63)MB BS, Dip of Child healthindependent non-executive directorAppointed: 15 July 2008Qualified as a medical doctor at the university of London. Non-executive director of Woman investment Africa Network and Zawadi investments. registered practitioner with the health Professions Council of South Africa as well as the British General Medical Council.
PreviOuS exPerieNCe• Co-founded and managed Mother earth Distributors and Nature Plan• Non-executive director of Global Africa resources• research in Neonatal Paediatrics at John radcliffe hospital Oxford uK• Medical Director for transmed Medical Aid
BOArD: MemberBOArD MeetiNG AtteNDANCe: 4/5SPeCiAL BOArD MeetiNG AtteNDANCe: 2/2SOCiAL, ethiCS AND trANSfOrMAtiONCOMMittee: MemberMeetiNG AtteNDANCe: 1/2
iNDePeNDeNt BOArD: MemberMeetiNG AtteNDANCe: 1/1reMuNerAtiON2013: r305 8982012: r298 088
BOA
rd A
Nd
gO
Ver
NA
NCe
STR
UCT
URE
ChANGeS DuriNG the yeAreric K Diack resigned as director on 22 March 2013.
For more details regarding executive and non-executive remuneration, refer to page 54.

11
ADCOCK INGRAM INTEGRATED REPORT 2013
Clifford D raphiri (50)BSc (Mechanical engineering), Grad Dip engineering, MBAindependent non-executive directorAppointed: 15 July 2008
Manufacturing and technical Director of SA Breweries. Serves on the boards of various SA Breweries Limited subsidiaries.
PreviOuS exPerieNCe• Design mechanical consulting engineer at BKS inc• Project engineer at Metal Box• Consulting engineer at Andersen Consulting
BOArD: MemberBOArD MeetiNG AtteNDANCe: 4/5SPeCiAL BOArD MeetiNG AtteNDANCe: 1/2iNDePeNDeNt BOArD: MemberMeetiNG AtteNDANCe: 1/1
huMAN reCOurCeS, reMuNerAtiON AND NOMiNAtiONS COMMittee: Chairman MeetiNG AtteNDANCe: 3/3reMuNerAtiON2013: r335 6372012: r315 795
Andrew M thompson (56)BSc (Civil engineering), MBAindependent non-executive directorAppointed: 15 July 2008
experienced industrial executive. Non-executive director of MPact Limited (previously Mondi Packaging).
PreviOuS exPerieNCe• CeO of Mondi South Africa• Non-executive director of tongaat hulett Group
BOArD: MemberBOArD MeetiNG AtteNDANCe: 5/5SPeCiAL BOArD MeetiNG AtteNDANCe: 1/2AuDit COMMittee: Member/ChairmanMeetiNG AtteNDANCe: 3/3SOCiAL, ethiCS AND trANSfOrMAtiONCOMMittee: MemberMeetiNG AtteNDANCe: 2/2
COMMittee Of the iNDePeNDeNt BOArD: MemberMeetiNG AtteNDANCe: 22/23iNDePeNDeNt BOArD: MemberMeetiNG AtteNDANCe: 1/1huMAN reCOurCeS, reMuNerAtiON AND NOMiNAtiONS COMMittee: MemberMeetiNG AtteNDANCe: 3/3reMuNerAtiON2013: r662 5952012: r431 656
roger i Stewart (61)MB ChB, PhD (Med), Grad Dip Comp Dir. f inst Directorsindependent non-executive directorAppointed: 15 July 2008
Director and shareholder of Business Sculptors (Pty) Limited.
PreviOuS exPerieNCe• Associate professor of Physiology at the university of Stellenbosch• fellow of the American College of Chest Physicians• Group executive at the South African Medical research Council
BOArD: MemberBOArD MeetiNG AtteNDANCe: 5/5SPeCiAL BOArD MeetiNG AtteNDANCe: 2/2AuDit COMMittee: MemberMeetiNG AtteNDANCe: 3/3riSK AND SuStAiNABiLityCOMMittee: ChairmanMeetiNG AtteNDANCe: 2/2
COMMittee Of the iNDePeNDeNt BOArD: MemberMeetiNG AtteNDANCe: 15/16iNDePeNDeNt BOArD: MemberMeetiNG AtteNDANCe: 1/1reMuNerAtiON2013: r696 0282012: r541 839
P Mpho Makwana (43)BAdmin (honours), Post-Grad Dip (retailing Management)independent non-executive directorAppointed: 1 february 2012
Non-executive director of Nedbank and Biotherm energy (Pty) Limited. Chairman of Arcelormittal SA Limited, Chairman of the board of trustees at the New LoveLife trust. trustee of the Business trust, vodacom foundation trust, the transaction Advisory fund and World Wildlife fund South Africa. Chairman of itNA, an it company.
PreviOuS exPerieNCe• Chairman of eskom holdings• Member of the group executive of edcon
BOArD: MemberBOArD MeetiNG AtteNDANCe: 5/5SPeCiAL BOArD MeetiNG AtteNDANCe: 2/2riSK AND SuStAiNABiLityCOMMittee: MemberMeetiNG AtteNDANCe: 2/2SOCiAL, ethiCS AND trANSfOrMAtiONCOMMittee: ChairmanMeetiNG AtteNDANCe: 2/2
COMMittee Of the iNDePeNDeNt BOArD: MemberMeetiNG AtteNDANCe: 16/23iNDePeNDeNt BOArD: MemberMeetiNG AtteNDANCe: 1/1reMuNerAtiON2013: r553 0302012: r260 888
Leon e Schönknecht (60)BCompt (hons), CA (SA)independent non-executive directorAppointed: 15 July 2008
Chairman of New teltron (Pty) Limited.
PreviOuS exPerieNCe• CeO of united Pharmaceutical Distributors (uPD)• Non-executive Chairman of uPD and director of the Premier Group
BOArD: MemberBOArD MeetiNG AtteNDANCe: 5/5SPeCiAL BOArD MeetiNG AtteNDANCe: 2/2AuDit COMMittee:MeetiNG AtteNDANCe: 2/2riSK AND SuStAiNABiLityCOMMittee: MemberMeetiNG AtteNDANCe: 2/2
COMMittee Of the iNDePeNDeNt BOArD: MemberMeetiNG AtteNDANCe: 23/23iNDePeNDeNt BOArD: MemberMeetiNG AtteNDANCe: 1/1reMuNerAtiON2013: r567 6142012: r334 359
Full CV’s available on the website www.adcock.com

12
ADCOCK INGRAM INTEGRATED REPORT 2013
Composition Three independent non-executive directors
Three independent non-executive directors
Four independent non-executive directorsTwo executive directors
Four independent non-executive directors
Members AM Thompson (Chairman)RI StewartLE Schönknecht
CD Raphiri (Chairman) AM ThompsonKDK Mokhele
PM Makwana (Chairman)T Lesoli KDK MokheleAM ThompsonJJ LouwAG Hall
RI Stewart (Chairman)LE SchönknechtPM MakwanaM Haus
Responsibilities Review annual financial statements and recommend their approval to the Board
Review accounting policies
Nominate for appointment independent auditor in accordance with the Companies Act
Determine the fees to be paid to auditors and engagement terms and ensure that the appointment of the auditors complies with the provisions of the Companies Act and other relevant legislation
Provide assurances to the Board as to the integrity and appropriateness of the financial management systems
Assist the Board in determining remuneration and performance measures of executive and senior management
Determine remuneration policy and appropriate human capital management policies
Review terms and conditions of key executive service agreements at least annually
Oversee annual performance evaluation of the Board
Assist the Board to ensure that the Board is appropriately constituted for it to execute its role and duties effectively and that directors are appointed through a formal, transparent process; and that induction and ongoing training and development of directors takes place
Monitor the Company’s activities having regard to relevant legislation and codes of best practice
Draw matters within its mandate to the attention of the Board and report to the shareholders at the Annual General Meeting
Ensure Adcock Ingram’s equity ownership and the demographic profile of its employees is representative in the South African context
Establish, implement and monitor the framework for the Company’s transformation plan
Ensure an appropriate and effective control environment and clear parameters within which risk is managed
Oversee issues relating to sustainability
Oversee the conducting of a business risk assessment to identify the most significant commercial, financial, compliance and sustainability risks and implement processes to mitigate these risks
Assist the Board in setting the risk strategy and policies in determining the Company’s tolerance for risk
Attendance by invitation
Executive directors, Finance executives, internal and external auditors
CEO and Human Capital executive
Human Capital executive,Group Finance executive and Government Relations executive
Executive directors, internal and external auditors, insurance and risk advisors and relevant members of management
Audit Committee1
Human Resources, Remuneration and Nominations Committee
2Social, Ethics and Transformation Committee3
Risk and Sustainability Committee4
BOARDBO
Ard
AN
d g
OV
erN
AN
Ce S
TRU
CTU
RE CO
NTI
NU
ED
CHIEF EXECUTIVE OFFICER
EXECUTIVE COMMITTEE

13
ADCOCK INGRAM INTEGRATED REPORT 2013
Corporate governance includes the structures, processes and practices that the Board uses to direct and manage the operations of Adcock Ingram Holdings Limited and subsidiaries within the Adcock Group. These structures, processes and practices help to ensure that authority is exercised and decisions are taken, within an ethical framework that promotes the responsible consideration of all stakeholders and ensures that decision-makers are held appropriately accountable.
Adcock Ingram Holdings Limited is committed to the principles of good corporate governance as set out in the King III Report on Corporate Governance for South Africa (King III Report), the JSE Listings Requirements and the Companies Act, 71 of 2008 (Companies Act).
eThICSEthics are the cornerstone of Adcock Ingram’s
business and an unequivocal commitment to fairness, transparency and integrity underlies all facets of the Group’s operations.
Adcock Ingram’s Board, assisted by its various committees, is responsible for setting the ethical tone “at the top” and monitors its implementation, including training of
employees regarding the Code of Ethics, to ensure that business is conducted in a manner that is beyond reproach at all levels in the Group.
ADCOCK INGRAM IS COMMITTeD TO:• • Achieving the highest standards of transparency, accountability and integrity in all aspects of its operations
and in its dealings with stakeholders and the community at large;
• Providing stakeholders and the investor community with clear, meaningful and timely information about Adcock Ingram’s operations and results;
• Conducting its business on the basis of fair commercial and competitive practice;
• Building business relationships with suppliers and customers who endorse ethical business practices and who comply with the laws of the jurisdictions where they operate;
• Actively pursuing transformation and ensuring employment practices which are non-discriminatory and which seek to maximise the potential of all its employees through training and skills development; and
• Proactively accepting responsibility for, and managing the environmental and sustainability issues associated with its business.
The King III Report provides clear guidance on acceptable business practices and ethical standards by which Adcock Ingram directors, employees, suppliers and business partners are expected to conduct themselves in their business relationships.
Training initiatives relating to ethics include training of employees on ethics by one of the two Certified Ethics Officers employed by the Group, one also being a certified fraud examiner. Employees are encouraged to report any suspected
inappropriate, unethical, illegal activity or misconduct through an independently operated Speak Up line (Tip-Offs Anonymous). This whistle-blowing facility is available 24 hours per day, 365 days per year. All complaints lodged
through this service are investigated and where appropriate, disciplinary action is instituted and reported to the Board of directors through the Human Resources, Remuneration and Nominations Committee.
VALUeSOur corporate values are aimed at building and maintaining a culture which
promotes teamwork, achievement of financial results, respect, learning and development, commitment, professionalism, integrity, and a
focus on business ethics, creative thinking and open and honest communication.
COrPOrAte GOVERNANCE
RePORTS ReCeIVeD
34 for unethical behaviour, dishonest conduct, human capital complaints, governance complaints
NUMBeR OF CALLS UNDeR INVeSTIGATION
5UNFOUNDeD RePORTS
4
INSUFFICIeNT eVIDeNCe
14PROVeN ALLeGATIONS
11
A register setting out compliance with King III principles on an “apply or explain” basis can be found on www.adcock.com

COrPOrAte GOVERNANCE CONTINUED
INFORMATION TeChNOLOGY (IT)Adcock Ingram subscribes to the King III statement that IT governance can be considered as a framework that supports effective and efficient management of IT resources to facilitate the achievement of the Group’s strategic objectives.
Adcock Ingram has implemented a number of projects with a view to improve its business processes and continues to improve these processes to achieve compliance. The implemented processes include:
� Business driven IT strategy;� Standardisation of systems and processes to improve business
operations and reporting;� Replacement of outdated and obsolete systems with the Oracle ERP
suite of products running on modern energy efficient servers;� Centralisation of IT facilities and upgrades to the IT infrastructure;� Information security systems; and� Disaster recovery systems and procedures.
INTeRNAL AUDITThe internal audit function forms an integral part of the governance structure of the Group and its key responsibility is to evaluate the Group’s governance processes and associated controls, amongst others, as set out in the King III Report.
In performing its functions the internal audit function provides reasonable assurance to the Board, through the Audit Committee, regarding the effectiveness of the Group’s network of governance, risk management and internal control processes and systems.
The internal audit function is outsourced to an independent audit firm and the responsibility to oversee, manage, inform and take accountability for the effective operation of this function lies with the Company’s Deputy Chief Executive and Financial Director. The internal audit function has adopted a risk-based methodology to ensure appropriate coverage of governance, risk and control processes which are crucial to the realisation of strategic goals. The internal audit plan is therefore informed by strategic plans, key risks, input from management, the Board and external audit, compliance requirements and a comprehensive assessment of the risk universe as it applies to the Group. The internal audit function has a formally defined charter which is approved by the Board.
There has been extensive co-ordination and sharing of information with the Group’s external auditor, who continues to place substantial reliance on the work of internal audit.
The BOARD OF DIReCTORSAPPOINTMeNT AND ReTIReMeNTAdcock Ingram is led by a diverse board of 10 directors, eight of whom are independent non-executives. Adcock Ingram’s Memorandum of Incorporation (MOI), which was approved by shareholders in January 2013, sets out a formal process for the appointment of directors to the Board. Criteria used in the selection of the directors of the Company includes leadership qualities, depth of experience, skills, independence, business acumen and personal integrity beyond reproach. The directors collectively bring to the Group a wide range of skills and experience which include industry-specific knowledge as well as broader business flair. The Board is led by a Chairman who is an independent non-executive director. A clear separation of power exists between the Chairman of the Board and the Chief Executive Officer.
As required by the Company’s MOI, an Annual General Meeting is held each year. In accordance with the MOI, one-third of the independent non-executive directors retire by rotation every year and, if eligible,
may offer themselves for re-election by shareholders. Thus, each independent non-executive director is rotated at least once every three years in accordance with the MOI. Retiring independent non-executive directors who offer themselves for re-election are evaluated by fellow directors before a recommendation on their re-election is made by the Board to shareholders. There is no term or age limit imposed in respect of a director’s appointment; however, tenure is informed by a regular, formal evaluation of the suitability, contribution and independence of each of the directors. The terms and conditions applicable to the appointment of independent non-executive directors are contained in a letter of appointment which, together with the Board Charter, forms the basis of the director’s appointment. The Human Resources, Remuneration and Nominations Committee plays an important role in the identification and removal of under-performing or unsuitable directors.
Brief curricula vitae of each of the directors appear on pages 10 and 11 of this report.
ReSPONSIBILITIeS AND PROCeSSeSThe Board is ultimately accountable to shareholders for the performance of the Group. The Board broadly gives strategic direction to the Group; approves and regularly reviews business plans, budgets and policies; appoints the Chief Executive Officer and ensures that power and authorities delegated to management are clearly and comprehensively documented and regularly reviewed, and that the governance framework and strategic direction of the Group remain appropriate and relevant. The Board retains control over the Group, monitors risk and oversees the implementation of approved strategies through a structured approach to reporting and accountability. The Board, through the Risk and Sustainability Committee, monitors the Group’s risk tolerance and appetite and approved the enterprise risk management plan which is in the process of being implemented by management. In order to provide the Board with a perspective on its robustness as required in the King III Report on Governance for South Africa 2009 (King III), a high-level review of the enterprise risk management arrangements as implemented at Adcock Ingram was performed by the internal auditors. This confirmed a credible process of risk management and has been rated as “satisfactory”, which recognises that, whilst deficiencies within the risk management process exist, these continue to be addressed through the recommended interventions.
BOARD ChARTeRThe Board is governed by a Board Charter which sets out, inter alia, the principles and process in terms of which directors are appointed, and the duties and responsibilities of the Board. Issues of conflicts of interest are regulated and dealt with regularly in terms of the Board Charter and section 75 of the Companies Act. The directors’ register of interests is circulated at the scheduled meetings of the Board for directors to confirm its contents and the subject matter is a standing item on the Board agenda. In line with the Board’s commitment to implementing the highest practicable standards of corporate governance within the Company, the Board Charter incorporates the principles of the King III Report wherever appropriate.
The meetings of the Board and its committees are scheduled annually in advance. In addition to regular consideration of the Group’s operational and financial performance at each of its meetings, the Board’s annual work-plan aims to ensure that the Board deals with each of the matters reserved for its consideration during the course
14
ADCOCK INGRAM INTEGRATED REPORT 2013

of its scheduled annual meetings. The number of meetings held during the year under review (including meetings of Board-appointed committees) and the attendance of each director appear on pages 10 and 11 of this report. The Board strives to ensure that non-attendance by directors at scheduled Board meetings is an exception rather than the norm, and directors who are unable to attend meetings are required to communicate their reasons for non-attendance in advance to the Company Secretary for formal notification to the Board through the Chairman. Directors are also required to sign an attendance register at all the meetings of the Board.
Board papers are provided to directors in a timely manner, in advance of meetings, and directors are afforded ample opportunity to study the material presented and to request additional information from management where necessary. All directors may propose further matters for inclusion on the agenda of Board meetings. The Board is given unrestricted access to all Group information, records, documents and facilities through the office of the Company Secretary. The Company Secretary is the secretary to all committees of the Board and ensures that the committees operate within the limits of their respective mandates and in terms of an agreed annual work plan. There is a formal reporting procedure to enable the Board to stay abreast of the activities of each committee. In terms of the Board Charter, the directors may obtain independent professional advice, at the Group’s expense, should they deem it necessary for the proper execution of their directorial role.
Directors are kept appropriately informed of key developments affecting the Group between Board meetings.
Non-executive directors have full access to management and may meet separately with management, without the attendance of executive directors, where necessary. Arrangements for such meetings are facilitated through the office of the Company Secretary. At least twice annually, the non-executive directors meet without the executive directors or other members of management being present to discuss issues relevant to the Board and the Group.
The Company Secretary attends all Board and committees’ meetings and provides the Board and the directors, collectively and individually, with guidance on the execution of their governance role and compliance with the required statutory procedures.
ChANGeS TO DIReCTORS’ ReSPONSIBILITIeS AND STATUSMr Eric Diack resigned as an independent non-executive director of Adcock Ingram, as well as Chairman of the Audit Committee and as member of the Company’s Risk and Sustainability Committee with effect from 22 March 2013.
Mr Andrew Thompson was appointed as the Chairman of the Audit Committee with effect from 12 April 2013 and Mr Leon Schönknecht was appointed as a member of the Audit Committee with effect from 15 May 2013.
BOARD eDUCATION AND TRAININGAll directors are required to attend a formal annual governance training session, which is formally scheduled in the Board’s annual calendar, to ensure their knowledge of governance remains relevant. In addition, all directors are provided with an induction file containing important legislation and the Group’s governance framework (including the Board committee governance structure, the Board Charter, terms of reference of all Board committees and key Company policies). Ongoing director training sessions are held where changes in the legislative, regulatory
or business environment of the Group warrant specific focus. Finally, all directors are encouraged to attend external director development and training programmes, at the cost of the Group. In the year under review it was accepted that formal training be suspended, because of the extraordinary additional time commitments required of directors due to the Independent Board activities.
BOARD eVALUATIONA formal process to evaluate the performance of the Board, its committees, the Chairman, and three retiring Board members was instituted. The Board and its Chairman as well as three retiring directors were evaluated in 2011. In 2012 the performance of the committees and their respective chairmen; the retiring directors; the CEO and the Company Secretary were evaluated. In the year under review the performance of the retiring directors and Company Secretary were evaluated. The evaluation criteria included the following areas: composition, authority and functionality, effectiveness of meetings, relationship between the independent non-executive directors and management, risk management and control. The evaluation forms completed by directors were submitted to an independent assessor for evaluation and compilation of a report. The results of the evaluation were discussed at the meeting of the Board in November 2013.
BOARD MeeTINGSFollowing the receipt of an unsolicited letter from the Bidvest Group Limited, proposing a scheme of arrangement to acquire 60% of the entire issued share capital of Adcock Ingram, the Board of directors constituted the Independent Board, which excluded executive directors and management, in accordance with regulation 108(9) of the Companies Regulations. In turn, the Independent Board constituted a working committee of the Independent Board, which comprised six members of the Independent Board, with authority to act for the Independent Board but to report to the Independent Board from time to time.
Of the six scheduled Board meetings, five were held during the year. In addition, there were two special Board meetings, 23 Independent Board Committee meetings and one Independent Board meeting (also designated as special Board meetings), 15 of which lasted more than three hours. Refer to pages 10 and 11 for the attendance by directors at all Board meetings.
COMPANY SeCReTARYMr Ntando Simelane is the Company Secretary of the Group. All directors have unlimited access to the Company Secretary for advice to enable them to properly discharge their responsibilities and duties in the best interests of Adcock Ingram, with particular emphasis on supporting the independent non-executive directors and the Chairman. The Company Secretary works closely with the Chairman and executive directors, to ensure the proper and effective functioning of the Board and the integrity of the Board governance processes.
The Board of directors can confirm that it has considered and satisfied itself with regard to the competence, qualifications and experience of the Company Secretary. The Company Secretary was evaluated by all of the directors and some of his internal and external colleagues. The evaluation questionnaires were collated and analysed by independent advisors and the results thereof shared with the Board of directors. Based on the results of the evaluation, the Board of directors can confirm that the Company Secretary is competent and has relevant experience to discharge his duties. Furthermore, the Company Secretary is suitably qualified for this role, maintains an arm’s length relationship with the Board of directors and is not a director.
15
ADCOCK INGRAM INTEGRATED REPORT 2013
GRI: 4.4, 4.6, 4.7, 4.10

16
leAdershiP STATEMENT
Khotso Mokhele – Chairman
Andrew hall – Deputy Chief executive and Financial Director
Jonathan Louw – Chief executive Officer
DeAR STAKehOLDeR,2013 has been a milestone year for the Group which has been well positioned to resume its traditional path of growth. This contributed to the interest shown by various parties to acquire control of the Group.
The Independent Board (IB) (which excluded executive directors and management) ran a rigorous eight month process, in accordance with its fiduciary and legal responsibilities to evaluate all bona fide proposals. The IB reviewed all proposals and determined that the offer received from CFR Pharmaceuticals S.A. (CFR) is in the best interests of shareholders and all other stakeholders, in terms of value, feasibility and potential synergies, CFR is a multinational emerging market pharmaceutical company based in Chile and listed on the Santiago Stock Exchange.
Following the completion of reciprocal due diligences of both CFR and Adcock Ingram, a joint announcement was issued on 15 November 2013 regarding the firm intention by CFR to make an offer to acquire 100% of the issued share capital of Adcock Ingram by way of a scheme of arrangement.
The offer price of R73.51 per share represents a considerable premium of 31% to the unaffected Adcock Ingram share price of R56.20 as at 20 March 2013, the day prior to the unsolicited approach from the Bidvest Group Limited.
As this proposed transaction has been on the forefront of many of our stakeholders’ minds, it is regarded necessary that the Chairman of the IB deals with the most frequently asked questions.
For all the details on this proposed transaction and the IB process, stakeholders are also referred to: cfrtransaction.adcock.com
ADCOCK INGRAM INTEGRATED REPORT 2013

17
ADCOCK INGRAM INTEGRATED REPORT 2013
INVeSTORSq: Why was CFR selected as the preferred offer?
A: The IB believes that the combination of Adcock Ingram and CFR would create a leading, diversified emerging markets pharmaceutical company. The proposed transaction would unlock synergies and represents significant value and growth potential for Adcock Ingram.
It combines both attractive valuation parameters for Adcock Ingram shareholders and substantial synergies from combining the businesses. The business similarities also mitigate much of the execution risk, while the proposed transaction offers a compelling strategic rationale.
The combined group will create a substantial and uniquely diversified emerging markets pharmaceuticals company that is well positioned to explore other attractive markets.
q: Why has this transaction taken so long to finalise?
A: This is a highly complex cross-border transaction – the first of its kind between Chile and SA, between two listed companies that conduct business in 23 countries in a highly regulated space. Deals of this nature do take time, given the detailed financial, legal and regulatory processes that need to be followed. These include ensuring all legal and regulatory requirements are fulfilled and interacting with the Group’s many multi-national partners.
q: What is the proposed structure of the CFR offer?
A: The potential offer price of R73,51 per Adcock Ingram share would be settled in a combination of cash (a minimum of 51,0% and a maximum of 64,3%) and new CFR ordinary shares (a minimum of 35,7% and a maximum of 49,0%).
The final mix of cash and shares has not yet been finalised because the issue of shares is subject to completion by CFR of a capital increase process in Chile. Under Chilean law, CFR shareholders must be given a pre-emptive right to subscribe for any new shares.
Whilst Adcock Ingram shareholders will not influence the final split of cash and shares, they will be able to elect a greater proportion of either shares or cash through a mix-and-match facility, subject to the aggregate amount of cash and new CFR shares available in the CFR offer.
The combined Group would benefit from a broader global investor base with listings in both Santiago and Johannesburg.
q: What are the expected synergies and benefits to stakeholders?
A: CFR is of the view that Adcock Ingram’s world-class manufacturing facilities will strategically position the combined group to export South African manufactured products to Latin America and South East Asia. Through its strong local presence, CFR today targets a market of over 500 million patients, representing a commercial opportunity of approximately US$25 billion in Latin American pharmaceuticals alone.
The combination should unlock significant value through complementary product portfolios, business structures, geographical presence and manufacturing footprints. CFR estimates total synergies arising from the combination of at least US$440 million (approximately ZAR4.5 billion) on a net present value basis.
• Potential cost synergies: CFR aims to consolidate its manufacturing footprint and will benefit from the excess capacity available in the combined group to optimise factory utilisation rates, resulting in manufacturing efficiencies and costs reductions. Overall, CFR estimates that the new manufacturing footprint should generate
savings of approximately US$150 million on a net present value basis before factoring in Adcock Ingram’s likely lower production costs, the likely increase in CFR’s gross margins, and the lower unit production costs Adcock Ingram estimates should eventuate by increasing the volume and utilisation of its factories.
• Potential revenue synergies: The combined group will benefit from a highly complementary and diversified product portfolio. In particular, CFR believes that significant opportunities exist in the following areas:
– Anti-retrovirals (ARV): Over 1.6 million people are infected with HIV in Latin America. CFR sees an opportunity to introduce Adcock Ingram’s ARV portfolio in Latin America. Based on current prices in Latin America, it is anticipated that Adcock Ingram’s ARV products would potentially generate considerable gross margins and that FDA-approved products would achieve increased pricing, thus generating even higher gross margins. CFR estimates that this potential business opportunity represents a net present value in excess of approximately US$120 million in Latin America;
– OTC: CFR is of the view that the Latin American market represents a unique opportunity for Adcock Ingram’s OTC portfolio. The OTC market in Latin America is a US$12 billion market growing at a compound annual growth rate of 12% for the period 2007 to 2012. Mid to lower income consumers represent the majority of the overall market and 95% of total consumers. The mid to lower income market segment is characterised by low prices and mass distribution. CFR’s OTC portfolio is currently positioned towards higher income consumers and does not target the mid-to-lower end of the market. Adcock Ingram’s OTC portfolio is cost competitive and could become a compelling commercial opportunity. CFR estimates this potential opportunity represents a net present value of approximately US$80 million; and
– Pipeline contribution: CFR could provide Adcock Ingram with access to new therapeutic areas, particularly Oncology, Anaesthesia, Hospital Injectable products (Anti-Infectives), Biologics and Biosimilars. Conversely, Adcock Ingram could help CFR grow its presence in Diabetes, Dermatology and Ophthalmic categories. CFR estimates the pipeline contribution opportunity represents a net present value of at least US$80 million.
• Additional synergies from sourcing: CFR believes that through the combination of the respective active pharmaceutical ingredient sourcing of Adcock Ingram and CFR, the combined group could potentially realise efficiencies representing a net present value of between US$10 million and US$20 million.
SUPPLIeRSq: Please provide more detail on CFR’s agreement with Baxter,
with reference to the change of control clause in the supply agreement.
A: CFR has ensured support from a key multi-national partner – namely Baxter Healthcare, which provides products to Adcock Ingram’s Hospital division, allowing for the change of control and ensuring that their agreements with the Group remain effective.
q: has CFR received similar assurances from Adcock Ingram’s other suppliers?
A: CFR has concluded a final agreement with Medreich Limited, the Group’s Indian joint venture partner, to continue with the joint venture agreement governing Adcock Ingram India.

ADCOCK INGRAM INTEGRATED REPORT 2013
18
q: Will there be any impact on current supply agreements and will there be any disruption to our supply of product while negotiations are ongoing?
A: We do not envisage any disruption. If anything, we anticipate a significantly stronger company as a result of this combination – a company better able to serve the diversified needs of the markets in which it operates.
ReGULATORY AUThORITIeS AND GOVeRNMeNTSq: how has the South African Government reacted to the offer
and is the deal likely to get Regulatory approval?
A: The Group has engaged with the appropriate Government ministries to explain the rationale for the proposed transaction and how it would serve the interests of all stakeholders and South Africa as a whole. There was understanding and support for this transaction, which we strongly believe will have positive spinoffs for the country.
The deal would represent significant foreign direct investment in South Africa and would include a secondary listing of CFR on the JSE in a first of its kind transaction in South Africa. The deal would raise South Africa’s profile as an investment destination. The transaction would also provide other positive benefits including exports, long-term employment and job creation opportunities.
q: What impact will there be on Adcock Ingram’s portion of the ARV tender fulfilment? Will public sector contracts continue to be honoured?
A: There should be a positive impact due to improved manufacturing efficiencies and potential other markets. Both Adcock Ingram and CFR are committed to continue delivering affordable ARVs to the SA government in a timely manner.
q: how will the proposed transaction impact on Adcock Ingram’s Bee ratings and transformation objectives?
A: CFR understands the importance of BBBEE and is committed to the principles of transformation and ensuring that Adcock Ingram remains appropriately empowered and meets BBBEE targets.
CFR has signed memoranda of understanding with Adcock Ingram’s BBBEE partners, comprising both strategic shareholders and qualifying staff to remain invested in the Group.
CUSTOMeRS/CONSUMeRSq: Does this mean the end of the Adcock Ingram brand?
A: CFR has indicated that it intends to preserve and grow the Adcock Ingram brand in and beyond South Africa.
eMPLOYeeSq: What are the benefits to staff?
A: Long-term employment, development opportunities and further job creation. In addition, participants in Adcock Ingram’s share scheme would benefit from the acceleration of their share options.
q: Will there be retrenchments as a result?
A: CFR is committed to growing Adcock Ingram’s business in South Africa and Africa and transferring manufacturing capacity to South Africa, while preserving and growing jobs. There will be no retrenchments as a direct result of the transaction.
The Adcock Ingram IB therefore supports the scheme and recommended that its shareholders vote in favour of the proposed transaction and believe that it is important that, in considering the CFR offer, Adcock Ingram shareholders should carefully consider the benefits of a combination of CFR and Adcock Ingram against the default position in the event that the transaction is not implemented. JPMorgan Chase Bank has confirmed that, in its opinion, the offer from CFR is fair and reasonable.
PeRFORMANCeSatisfactory operating results were achieved in difficult and competitive trading conditions, exacerbated by a 14% devaluation of the Rand over a basket of hard currencies and a Single Exit Price (SEP) increase of 5,8% granted in March 2013 (2,1% in April 2012).
The Specialised Therapies, Generics and OTC divisions recorded satisfactory revenue growth. However, the Hospital business was impacted by challenges experienced following completion of the major factory upgrade. This, combined with disruptions caused during the implementation of Oracle technology, impacted on service delivery and resulted in market share declines in the private hospital market and under-recoveries in the factory.
Factors that influenced the Group’s performance included the delay in the launch of new OTC products and a change in the product mix towards low margin generics and tender products.
The East African business performed well and made inroads into regional export markets. Demand creation activities have been accelerated in SADC countries.
Supply bottlenecks and the temporary closure of the Oral Solid Dosage factory inhibited performance in Ghana.
eCONOMIC OVeRVIeWSouth Africa’s GDP growth for 2013 is estimated at approximately 2% and is forecast to increase to 3% in 2014. The Reserve Bank has noted that the South African economy needed to grow at least 5% for a meaningful reduction in unemployment. The sharp devaluation of the Rand against major currencies has impacted on the cost of imports and contributed to the fuel price increases. These factors, together with inflation, conservatively estimated at 6%, and the much publicised strike action, have taken their toll on the economy. The Government is under pressure to improve service delivery, reduce crime and corruption, lower inflation and create jobs with a national election scheduled in 2014.
The National Development Plan (NDP) is a vision that sets out a solid growth strategy. Although some aspects of this plan have drawn criticism from various quarters, the risks to economic growth require urgent action. Implementation of the NDP will help to stimulate confidence in the country and, in turn, international investment. The latter will boost job creation.
The International Monetary Fund estimates of economic growth in emerging markets were reduced to 5% for 2013 and 5,5% in 2014. Sub-Saharan Africa is expected to show growth of nearly 6%. GDP growth has slowed to an estimated 5% in India.
ReGULATORY ISSUeSOne of the most important issues facing the pharmaceutical manufacturing industry in South Africa is the methodology of calculating the Single Exit Price (SEP) increase. This increase has
leAdershiP STATEMENT CONTINUED

ADCOCK INGRAM INTEGRATED REPORT 2013
19not adequately compensated for the impact of the Rand devaluation which commenced at the beginning of 2013 and continued until September 2013.
The industry is dependent on imported ingredients which must be purchased in hard currencies. Our opinion is that a different methodology to calculate the SEP is required to deal with factors such as currency fluctuations. This matter is being discussed with the Department of Health through the Pharmaceutical Task Group.
The Department of Trade and Industry has issued a draft policy document on intellectual property with the intention of creating a cohesive policy across all ministries. The Intellectual Property Policy intends to further explore the flexibilities of patent rights under The Agreement on Trade Related Aspects of Intellectual Property Rights (TRIPS) after the DOHA declaration.
The Group believes that flexibility allowed under TRIPS should be a last resort approach for public health purposes. South Africa needs to encourage multi-national companies to maintain a presence in South Africa to ensure continued access to the latest technological advances in medicine which can save lives and reduce costs in other areas of healthcare.
The Pharmaceutical Marketing Code Authority has been established and the Marketing Code has been finalised. The next phase involves training for sales and marketing personnel.
The proposed National Health Insurance System has been progressed with the publication of a white paper which has been placed before the Cabinet for comment. The Deputy Minister of Health indicated in a healthcare forum that private healthcare and insurance will remain part of the health system in the foreseeable future.
Other issues such as the intention to cap logistics fees and international benchmarking remain on the Health Department’s agenda.
CORPORATe AFFAIRSThe Group has adopted a proactive strategy to strengthen relationships with various Government departments. This has included fruitful dialogue with the MCC about the problems and concerns of both parties regarding the new product registration process. These discussions contributed to an improved flow of new product registrations in 2013.
2013 MILeSTONeSCOSMeThe R780 million acquisition of Cosme in India was finalised in January 2013. This business is ranked by IMS as No. 72 out of 5 000 pharmaceutical companies operating in a primarily branded generics market in the world’s second most populous country.
The acquisition has provided a strong base in India which can be boosted with the introduction of branded generics from Adcock Ingram’s portfolio.
ReST OF AFRICAEfforts in sub-Saharan Africa are beginning to pay dividends with the Group having established a presence in key markets. The presence in Zimbabwe complements export initiatives to SADC territories.
BRAND DeVeLOPMeNTThe OTC division maintained market leadership in the Pharmacy market with a 19% value share and retained the No. 2 position in the FMCG market with a value share of 17%. Core brands exceeded market growth.
A new alliance established with Lundbeck Pharmaceuticals, a global leader in the Central Nervous System market, has boosted the Group’s position in this category.
The Generics division successfully launched several new products and is expected to benefit from further new product introductions in 2014.
Strategies are in place to improve service delivery and recoup market share in the private hospital market.
FACILITIeS UPGRADe PROGRAMMeThe R2 billion upgrade to the supply chain has increased capacity and created a world-class infrastructure.
Distribution is core to the business, in line with the Group’s direct-to-customer distribution strategy. The new facilities can manage a higher level of complexity, shorter lead times, improved accuracy in picking and packing, as well as increased throughput in a cost-efficient manner.
2013 ChALLeNGeSSOUTh AFRICAConsumer spending power is impacting on premium brands in the OTC market. It is therefore essential to maintain a balanced portfolio spanning premium brands and economy products.
Margin protection is a significant challenge against the background of unfavourable exchange rates with a material portion of active ingredients and finished goods being imported.
ReST OF AFRICAPoverty and unemployment are rife so affordability is an issue. However, an emerging middle class in most of the targeted markets offers good growth potential.
Increasing competition, infrastructural weaknesses and counterfeit medicines are some of the major challenges in parts of Africa.
INDIAIndia is a vast market offering huge growth potential despite the recent decline in GDP growth. However, there are many challenges including: an under-developed health system with vast regional disparities; regulatory issues, including price control on essential medicines; complex distribution networks stemming from a regional tax system; and skills shortages in the sales area.
WheRe We hAVe SUCCeeDeD IN OUR OBJeCTIVeS• Marketing and sales base established in India with the
acquisition of Cosme Pharma
• Extension of the MNC partnerships
• Market leadership in the OTC pharmacy market
• Significant supplier to Government
• Board recommended Scheme of Arrangement proposed to shareholders
WheRe We DID NOT AChIeVe OUR GOALS• Performance of hospital products
• Protection of margins
• Expansion into Rest of Africa
GRI: 1.1, 4.8

20
ADCOCK INGRAM INTEGRATED REPORT 2013
leAdershiP STATEMENT CONTINUED
GOVeRNANCeThe Board recognises that a corporate culture which promotes ethical behaviour supported by honest and open communication with all stakeholders is integral to good governance. Considerable attention is therefore given to the development of the Group’s culture and communication on expected ethical standards.
The Risk and Sustainability Committee has instituted a legislative compliance programme to ensure the Group conforms to all applicable South African laws. 21 Acts and regulations have been prioritised. The process commenced with a pilot project, the formation and training of Compliance teams and the installation of appropriate software to facilitate communication across all areas of the business.
A comprehensive report on Corporate Governance is featured on pages 13 to 15.
eThICSEthical behaviour, accountability and transparency are integral to building stakeholder confidence in the Group. The Social, Ethics and Transformation Committee acts as the social conscience of the business across its entire spectrum. A comprehensive strategy and blueprint were approved by the Board and responsibilities allocated to key executives. These teams will be fully operational by the beginning of 2014. More information can be found on page 13.
The Group’s employees are regularly reminded of the ethical culture through dedicated columns in all newsletters, notice boards and ethics training. Staff and suppliers are encouraged to make use of an independently operated “Ethics Speak Up” hotline to report bad practices. They have the option of remaining anonymous.
SUSTAINABILITYeCONOMICBusiness growth is the key to economic sustainability. Growth provides the capital required for further investment which can lead to job creation and secure long-term employment. These activities contribute to the economic growth of the markets in which the Group operates.
CFR’s proposed acquisition of Adcock Ingram will provide foreign direct investment in South Africa of over R12,6 billion. The transaction would enhance South Africa’s standing as an investment destination and provide opportunities for job creation.
eNVIRONMeNTALConsiderable efforts have been made to reduce the Group’s carbon footprint ahead of the introduction of the proposed carbon tax.
SOCIALThe Group
maintained its BBBEE Level 3 status and will focus on
managing transformation in line with the revised codes of good practice which
become applicable in October 2014.
A Department of Labour review noted that good progress had been made in terms of Employment Equity
over a 16-month period, especially in terms of promotion from within and the development of a talent pipeline at the
second level of management.
Talent management aims to ensure that the business is adaptable to changing market conditions by building human capital capabilities at all
levels to ensure the availability of productive and competent people in the right jobs at the right time.
The owner-driver enterprise development project was expanded at Midrand and is scheduled to be implemented at the Critical Care distribution facility
in 2014.
The Group is seeking to align its social investment programme with Government priorities for community upliftment in the most impoverished communities in the
areas of health and education. Several partnerships have been initiated which are planned for 2014.
2013 was a relatively stable year in terms of labour relations, with strike free wage negotiations resulting in a settlement of 7,75%. The Group was fortunate to have zero
days lost due to strike activity in South Africa, during the entire year.
RISK MANAGeMeNTThe Board is satisfied that the executive management team is constantly aware of risk factors and actively seeks ways in which to overcome controllable risks and those that can be influenced, and to minimise the impact of the uncontrollable risks.
A summarised overview of Risk Management is featured on pages 60 to 61.
SUCCeSSION PLANNINGSuccession planning is a key strategic initiative to ensure business sustainability. Retention plans are in place for top leadership. Identified successors are receiving appropriate training and other development initiatives.
DRUG MANAGeMeNT AND DeVeLOPMeNTThe new product pipeline as at 30 September 2013:
2013 2012
Number of products under in-house development
38 62
Number of products submitted for registration
9(50 dossiers)
23
Number of new products approved by the MCC
11(73 dossiers)
14
The approved products were either launched towards the end of the year or are planned for introduction in early 2014.
The transactional support office in India plays an important role in speeding up the preparation
of dossiers for new product applications for the various countries where the Group has
a presence.

21
ADCOCK INGRAM INTEGRATED REPORT 2013
INFORMATION TeChNOLOGYA robust IT platform is in place to facilitate growth locally and expansion into international markets. Priority attention
is given to optimising business processes to reduce transaction costs, validation for compliance to various regulatory authority requirements and reduced risk in terms of business continuity.
Ongoing upgrades to the IT platform for operations in South Africa and India, together with improvements to processes and systems are scheduled for the 2014 timeframe.
Implementation of an integrated IT platform for the Rest of Africa operations is scheduled for 2014/2015.
APPReCIATIONSincere appreciation is extended to all stakeholders who
contributed positively towards the Group in the past year, especially the IB which spent many hours and worked
diligently towards achieving the best outcome for all stakeholders.
We appreciate the support of our management and staff who have been resilient during an unsettling
period.
We are grateful to our shareholders for the amount of interaction and support they
have provided us during the past year, as well as our advisors, who have served us
with distinction.
FUTURe PROSPeCTSCFR’s proposed acquisition of the Group offers an exciting and positive future. In the meantime, we are concentrating on profitable growth in the markets in which we operate through innovation, creative brand strategies, an effective and efficient supply chain, customer satisfaction and motivated employees.
Jonathan LouwChief Executive Officer
Khotso MokheleChairman
Andrew hallDeputy Chief Executive and Financial Director
GRI: 1.1

drug MANAgeMeNt AND DEVELOPMENT
22
This division’s responsibilities span research and development, group quality assurance, regulatory affairs and medical affairs. The division is also responsible for on-site quality control and regulatory compliance as well as cross-divisional project management.
ReSeARCh AND DeVeLOPMeNTAdcock Ingram’s Research and Development (R&D) facility is one of only two laboratories in South Africa to have achieved World Health Organisation (WHO) pre-qualification accreditation. Maintaining a high standard in all processes supported this achievement. The facility was the first stand-alone R&D facility in South Africa to secure Medicines Control Council (MCC) accreditation for the manufacture and testing of pharmaceutical products for human consumption and has been granted site acceptance by the FDA.
AddClin, the wholly-owned dedicated Phase I bioequivalence/bioavailability clinical study site, has expanded its offering to include Phase II – IV clinical studies. It encompasses a 32-bed bioequivalence unit, four of which are equipped as high-care. AddClin offers a one-stop clinical research service through study design, writing of protocols, obtaining necessary regulatory approvals, clinical execution, reports and post-marketing surveillance.
qUALITY ASSURANCeThe new central quality control laboratory at Clayville is the largest of its kind on the African continent. This R80 million facility will absorb the three existing laboratories which are at different sites. Features of the new laboratory include state-of-the-art Ultra Performance Liquid Chromatography (UPLC) technology and eight stability chambers which cater for different temperatures and humidity levels, including tropical conditions. The latter will facilitate registrations for tropical climates. Efforts will be concentrated in 2014 on streamlining activities in this facility.
ReGULATORY AFFAIRSThe concerted effort to develop relationships with the MCC has resulted in a better understanding between both parties and a marked improvement in the number of product registrations received from the MCC. 73 orthodox dossiers, and a further 94 complementary products were approved this year.
The Group submitted its first electronic Common Technical Document (eCTD) successfully as part of a pilot study arranged by the MCC.
Common Technical Document – The agreement to assemble all the Quality, Safety and Efficacy information in a common format is called the CTD and has revolutionised the regulatory review processes, led to harmonised electronic submission that, in turn, enabled implementation of good review practices. For industries, it has eliminated the need to reformat the information for submission to the different International Conference on Harmonisation (ICH) regulatory authorities.
There has not yet been a resolution to the Group’s appeal against the banning of DPP-containing products.
DPP – Dextropropoxyphene
The satellite regulatory office in Bangalore, India is now staffed by over 90 people who provide support to the medical affairs, quality assurance and regulatory functions for the Group’s operations in Africa.
MeDICAL AFFAIRSA new pharmacovigilance database provides several benefits including the integration of drug safety and risk management onto one platform. The system is compliant with international standards and practices implemented by the Group’s multi-national partners. It is expected to be fully operational in 2014. During the current year, a total of 206 adverse events were reported to the Group of which it was necessary to report 95 to the MCC.
Pharmacovigilance, also known as drug safety, is the pharmacological science relating to the collection, detection, assessment, monitoring, and prevention of adverse effects with pharmaceutical products.
ADCOCK INGRAM INTEGRATED REPORT 2013
GRI: PR2

OPe
rAti
ON
Al
OVe
rVie
W –
SO
UTH
ERN
AFR
ICA
MARKeT OVeRVIeWThe South African pharmaceutical market, as measured by IMS is worth R32,4 billion with 2,6% growth (September 2013 MAT).
The private sector accounts for 86,7% of this with 3,5% growth in value terms and 66,9% in volume (0,3% growth). Adcock Ingram’s share is 9,4% in value terms (0,3% decline) and 30,1% in volume (0,6% growth).
The public sector which accounts for 13,3% of the total market, declined 2,7% in value terms, and accounts for 33,1% of the volume, which declined 5,4%. Adcock Ingram’s share is 4,3% in value terms (25,4% growth) and 12,7% in volume (45,1% growth).
For further commentary regarding the OTC, Prescription and Hospital segments, please refer to pages 24 to 29.
Durban
JohannesburgPretoria
Polokwane
Cape town Port elizabeth
KimberleyBloemfontein Maseru
LESOTHO
Mmabatho
South Africa
Swaziland
Namibia
BotswanaWindhoek
Gaborone
Mbabane
KeY INFORMATIONOFFICe: Midrand in South Africa, serving as the head office for the Group
ACTIVITIeS: Research and development, manufacturing, distribution, and sales and marketing
CUSTOMeRS: Wholesale, FMCG retail, independent pharmacies, hospitals, doctors and Government
2 317 eMPLOYeeS
TURNOVeR
R5 031
MILLION
(2012: R4 436 MILLION)AdCOCk iNgrAM AIMS TO BE THE MARKET LEADING SUPPLIER OF AFFORDABLE BRANDED AND GENERIC PRESCRIPTION AND OTC MEDICINES, AND HOSPITAL PRODUCTS.
R1 177
MILLION
CONTRIBUTION AFTER MARKETING EXPENSES
23
MARKeT SHARES (total market)
PRIVATe SeCTOR
9,4% value
30,1% volume
PUBLIC SeCTOR
4,3% value
12,7% volume
ADCOCK INGRAM INTEGRATED REPORT 2013

24
ADCOCK INGRAM INTEGRATED REPORT 2013
SOUTHERN AFRICA CONTINUED
OVeR The COUNTeR (OTC)
Pain
Pharmacy Rank #1FMCG Rank #2
• Panado
• Compral
• Betapyn
• Betagesic
• Lotem
• Spasmend
• Adcodol
• Syndol
• Pynstop
• Mypaid
Pharmacy Rank #1FMCG Rank #7
Colds and Flu
• Corenza C
• Grippon
• Alcophyllex
• Cepacol
• Medi-Keel
• Dilinct
• Expigen
• LCC
• Adco Sinal
• DPH
• Adco Linctopent
Pharmacy Rank #3
Allergy
• Allergex
• Allergex ND
• Allergex eye drops
• Mepyramal Cream
• Adco-cetirizine
• Adco-Destoratadine
• Mizallen
Pharmacy Rank #2FMCG Rank #1
Digestive Wellbeing
• Citro-Soda
• Freshen
• Scopex
• Pectrolyte
• Inteflora
• ProbiFlora
• LP299V
• Adco-Loperamide
• Medigel
• Mayogel
• Vomifene
Personal Care
Pharmacy Rank #2
• TLC
• Topicals
• GynaGuard
• ISDIN
• Ureadin
• Nutratopic
• Betalfatrus
• Iralforis
MARKeT TReNDS• Market growth driven by the global trend
towards self-care and a growing middle class
• Innovation is an important growth driver
• Rate of innovation has slowed in registered pharmaceuticals
• Economic factors are causing a shift from premium brands to economy and house brands
• Consolidation of customers and backward integration into wholesaling to increase buying power
• Mergers, acquisitions and joint ventures within the industry
• Growth of house brands/private labels by the major retail chains
Adcock Ingram competes in the following three core areas of the OTC self-medication and wellness market:
• Curative (analgesics, colds and flu, and allergy)
• Wellbeing (supplements, digestive wellbeing and energy)
• Personal care (wipes, facial care, hand and body topical creams and ointments and feminine care) with the core target market *LSM 5 to 10
* LSM – Living Standards Measures
Pharmacy Rank #4FMCG Rank #2
Supplements
• Unique
• ViralGuard
• ArthroGuard
• Bestum
• Bioplus
• Vita-thion
• Gummyvites
• ADDvance
• Spirulina
• Pro-oxiden
• Liviton
revenue 2013
Non-SeP49%
SeP51%
FMCG31%
Pharmacy69%
Source: IMS TPM MAT/9/2013 Aztec Sep 2013 MAT
BUSINeSS FOCUS• Organic growth in the categories in which
the Group operates
• Enter new categories and enhance the product pipeline, through innovation, acquisitions and strategic relationships
• Brand development, line extensions and umbrella branding
• Mutually beneficial relationships with customers

25
ADCOCK INGRAM INTEGRATED REPORT 2013
Adcock Ingram competes in the self-medication Pharmacy and FMCG markets with affordable branded, premium and economy products.
TURNOVeR R2 002 MILLIONTOP 10 BRANDS’ TURNOVeR
R956 MILLIONCONTRIBUTION AFTeR MARKeTING eXPeNSeS
R707 MILLIONhIGhLIGhTSThe OTC division maintained market leadership in the R8 billion Pharmacy market with 19,0% value and 35,4% volume shares. Adcock Ingram retained its No. 2 position in the R3 billion FMCG market, with 16,3% value and 22% volume shares (Sources: Aztec retail MAT September 2013 and IMS TPM MAT September 2013).
Pain – despite strong competition in the FMCG market, key brands Panado and Compral achieved satisfactory growth. Panado registered a ‘first’ with the introduction of Braille on packaging. The pharmacy portfolio continued to uphold share with Adcock Ingram’s leader Adco-dol retaining a number 1 position, showing solid 8% growth ahead of the market growth of 5,4%.
Panado was rated the winner of the OTC category in the 2013/2104 ICON Brands Survey.
Colds, Flu and Allergy – Adcock Ingram maintained its leadership position in the Pharmacy colds and flu market. Key brands including Corenza and Alcophyllex have shown growth in excess of 20%.
The launch of the Expigen Herbal Cough Syrup capitalised on the general growth seen in herbal non-scheduled products.
Growth of 6% in the R355 million Allergy market can be attributed largely to an increase in the incidence of allergies. Allergex benefitted from line extensions, recording 24% value growth.
Digestive Wellbeing – Adcock Ingram’s digestive wellbeing portfolio growth was driven by a continuing demand for probiotics with strong brands like Probiflora achieving sales in excess of R80 million and Citro-Soda which achieved 16% growth on the prior year. Adcock Ingram holds an 18% market share in this category.
Supplements – the Unique range of vitamin, minerals and (VMS) supplements benefitted from a packaging revamp in addition to the launch of five new products. Innovation in the VMS category also included Bioplus apple-flavoured syrup and jellies (chews), and bulk packs for Gummy Vites, resulting in achieving a 10% market share in the VMS category.
Personal Care – the GynaGuard feminine healthcare range was extended to include pH-balanced tampons and resulted in growth of 10% over the prior year.
pH scale – a measure of acidity or alkalinity of water soluble substances pH – for potential of Hydrogen
OPPORTUNITIeSKey opportunities lie in innovation and leveraging the Group’s strength in brand equity through umbrella branding, line extensions, and entry into new categories.
Consumer education offers an important opportunity to assist consumers in making responsible self-medication decisions.
The further development of strategic relationships with key customers will be mutually beneficial.
ChALLeNGeSConsumer spending power is under pressure which impacts premium brands. It is therefore essential that the Group has a balanced portfolio across premium brands and economy products to maintain leadership.
The amendment to the General Regulations Made in Terms of the Medicines and Related Substances Act 101 of 1965, was published in the Government Gazette on 15 November 2013. The amendment is largely aimed at bringing complementary medicines into the ambit of Act 101. Complementary medicines will in future be subject to the requirements for safety, efficacy, and quality. Manufactures will have to comply with the prescribed requirements including those relating to labelling, package inserts, and patient information leaflets, which will come in to effect 15th February 2014. The registration of specific categories of complementary medicines will be required against a phased schedule.
In the current economy, a variety of pack sizes and promotional packs for complementary medicines are essential to satisfy the needs of lower income consumers and stimulate brand loyalty.
GRI: 2.2

SOUTHERN AFRICA CONTINUED
PReSCRIPTION
• Stresam
• Cipramil
• Cipralex
• Azilect
• Clopixol
• Ebixa
• Fluanxol
• Celestamine
• Singulair
• Nasonex
• Rinelon
• Solphyllex
• Uniphyl
• Prelone
• Solphyllin
• Activelle
• Dovobet
• Fucidin
• Elidel
• Elocon
• Quadriderm
• Lotriderm
• Dipro range
• Propecia
• Roaccutane
• Acnetane
• Sporazole
• Efavirenz
• Lamivudine
• Zidovudine
• Lamivudine/Zidovudine
• Tenofovir
• Abacavir
• Lamzid
• Trivol
• Nevirapine
• Trivenz
• Betadine
• Activelle
• Evista
• Forteo
• Vagifem
• Estradot
• Estalis
• Estro-pause
• Urispas
• Urizone
• Adco-Fem 35
Deals with drugs and treatment used in conjunction with healthcare professionals only– the drug component reflects medicines prescribed by a registered physician and thereafter dispensed with a prescription
by a licensed professional– the treatment component relates to invasive and non-invasive technologies supporting select and potentially dire morbidities
#1
WOMeN’S heALTh AND UROLOGY
#4
ARV’S
#2
DeRMATOLOGY
#2
CNS
#2
ReSPIRATORY
• Maxalt
• Myprodol
• Mypaid Forte
• Macaine
• Tenston SA
• Stopayne
• Xylotox
• Veltex
• Adco-Tenyl
• Synaleve
• Tenston
• Efemoline
• Fucithalmic
• Zaditen
• Spersadex Comp
• Voltaren Ophtha
• Covomycin
• Covostet
• Teargel
• Cozaar
• Fortzaar
• Innohep
• Xenical
• Nebilet
• Metforal
• Migroben
• Lescol
MARKeT TReNDSBRANDeD
• Highly regulated market
• Global decline in the new product pipeline
• Increasing number of products reaching the end of patent protection
• Funders encourage switching from brands to low cost generics
• Significant HIV disease burden
• Intensely competitive environment creates coalition opportunities
GeNeRICS
• Competitive market focused on price, supply, range, access and promotion
• Positive market growth rate underpinned by increased medical aid memberships
• Ageing population result in increasing demand for chronic medication
• Regulations supporting generic substitution
• Pipeline access to newer therapies as patents expire
BUSINeSS FOCUSBRANDeD
• Capitalise on critical mass in therapeutic areas to support sustained profitable business growth
• Leverage operations to support additional partners, acquisitions and dossiers
• Extend the product line through alliances with MNC’s and acquire “new chemical entity” (NCE) products
GeNeRICS
• Profitable business growth through innovation and early entry generics
#3
OPhThALMIC
#2
CARDIOVASCULAR
#1
PAIN• Adco-Simvastatin
• Adco-Bisocor
• Adco-Atenolol
• Gen-Payne
• Serez
• Adco-Alzam
• Adco-Zolpidem
• Adco-Dapamax
• Adco-Omeprazole
• Adco-Zetomax
• Adco-Atorvastatin
GeNeRICS
SOUTHERN AFRICA CONTINUED
26
ADCOCK INGRAM INTEGRATED REPORT 2013
#4
Source: IMS TPM MAT Sep 2013
# Market position

This division markets and sells a portfolio of owned prescription brands as well as brands from multi-national companies (MNCs) with whom the Group has various alliances. The latter arrangements are based on synergistic and mutually beneficial collaborations supporting the commercialisation and distribution of selected brands in South Africa. This strategy has enabled the Group to build critical mass in defined therapeutic categories and develop targeted therapeutic focus in terms of knowledge, skills and commercial competence. The attendant benefits of this strategy have facilitated the building of resource and investment in world-class marketing, sales and distribution capabilities which supports both our own and MNC portfolios.
PeRFORMANCeGrowth was recorded in all major categories in terms of owned originator brands. The Group’s relationship with MNCs, including Novo Nordisk, Roche, Novartis, MSD, Lilly, and a new partner, Lundbeck Pharmaceuticals, is also bearing fruit. The satisfactory sales results were achieved despite difficult trading conditions and competition from newer technologies and generics.
Our latest MNC partner, Lundbeck Pharmaceuticals, is a global leader in central nervous system and brain disorders markets. Their product range includes a variety of products, including the market leading brand, Cipralex. This collaboration, which became effective in January 2013, has seen a dramatic turn-around in performance with market share gains and sales growth for all Lundbeck brands.
Adco Generics maintained the No. 2 position in the generics market in volume terms. Five new products launched in 2013 contributed to growth, with new products accounting for turnover of approximately R30 million. New products are expected to increase the Group’s value share of the generics market, with six new products planned for launch in 2014.
Profitability was impeded as a result of the Single Exit Price (SEP) increase being limited to only 5,8%, effective March 2013, against an average 14% devaluation of the Rand against the basket of currencies in which the division’s active ingredients and finished products are procured, and the change in mix with higher volumes of low-margin MNC and tender sales.
hIGhLIGhTSWomen’s Health – this portfolio achieved excellent results, bolstered by the relationships established with key partners. The consequent critical mass in this category enabled the Group to extract improved performances on own brands such as Estropause (HRT) and Urispas (UTI).
Marketing strategies included consumer education and interaction with consumers via social media. These strategies have provided a valuable base for brand specific promotions in the future.
An innovative marketing strategy has been initiated for a unique product, Vagifem, for vaginal dryness. The unique technology inherent in the product has created an entirely new market segment for this category. A major consumer education programme was launched at the end of the year which included a full media campaign, incorporating washroom posters and advertorials in leading magazines. This programme will create awareness that this condition is not unusual and that there is a solution.
Dermatology – Dovobet (psoriasis treatment) enjoys market leadership with an 80% share of the psoriasis market. Further penetration in the psoriasis market gained momentum with the introduction of Xamiol (from Leo Pharmaceuticals), a first line treatment for psoriasis of the scalp. This initiative supports our ambitions of market expansion in the categories where we compete. Roaccutane (from Roche) and owned generic Acnetane (acne treatments) recorded impressive share gains and entrenched the Group’s leading position in the anti-acne class.
Respiratory – creative sales initiatives to promote Solphyllex (cough syrup) produced sales in excess of R40 million for this owned brand.
Pain – Myprodol held its position in a highly genericised and competitive environment with Adcock Ingram’s own generic, Gen-payne growing by 28%. Synaleve was relaunched successfully in the moderate to severe pain sector and the business has ambitious hopes for this product as an alternative to previously discontinued DPP-containing products.
Anti-retroviral (ARV) treatments – supply constraints and higher than anticipated demand at the beginning of the year inhibited the Group’s performance in the ARV tender market. The tender, worth an estimated R800 million over two years, continues to the end of 2014, in which Adcock Ingram provides a basket of 13 products. With the launch of Trivenz, the Group already participates in buy-outs for the triple-combination on the current tender.
Generics – Adco-Atorvastatin, a newer generation molecule for the treatment of hypercholesterolaemia, was launched. Despite being seventh to market at launch, Adco-Atorvastatin achieved a 10% market share in the first six months. Script volumes are gaining momentum, with the Adco product being the fourth most prescribed atorvastatin.
Adco-Fem35 (contraceptive) was relaunched successfully, and educational campaigns in the media yielded positive sales growth. Adco-Fem35 is now the fastest growing product in its class.
Renewed focus on customer relationships and tailored strategies to meet specific customer needs, are contributing to growth in this category.
OPPORTUNITIeSExpanding the MNC programme by adding new partners, additional products from existing partners, as well as extending the programme into the Rest of Africa are opportunities for the Group.
New product introductions planned for 2014 include the acquisition of NCE patented products from existing and prospective partners. This will broaden the base of owned brands, offering increasingly exciting opportunities for profitable growth.
The comprehensive basket of ARV’s, including a triple-combination dosage, will facilitate growth in the private market.
The critical mass developed in major therapeutic categories enables the division to develop relationships with health professionals through an extensive continuing professional education programme. Activities include therapeutic category-directed meetings including Adcock Ingram’s successful and highly publicised Healthcare Summit.
Healthcare funders’ efforts to contain medicines costs by encouraging the use of generic medicines and the increasing membership of medical schemes (especially low cost options) will provide market growth in the generics category. Development of further relationships with funders will ensure that the Group’s products are included on healthcare funders’ formularies.
Chronic generic medicines offer significant growth potential as a result of a growing middle class market and an increasing ageing population.
ChALLeNGeSThe increasing trend towards cheaper generic products in the market does pose a threat to certain of the multi-national brands. Adverse currency fluctuations, the cost of compliance with increasing regulatory standards, competition and pressure exerted by healthcare funders to lower prices, impacts margins and profitability. The slow regulatory process affects the Group’s ability to launch new generic products. New product launches with ‘first to market’ status are key strategies to counter margin declines.
27
ADCOCK INGRAM INTEGRATED REPORT 2013
TURNOVeR
R1 853
MILLION
TOP 10 BRANDS’ TURNOVeR
R598
MILLION
CONTRIBUTION AFTeR MARKeTING eXPeNSeS
R322 MILLION

• Blood packs
• AccuVein
• Leucodepletion filters
• T-Sol
• Blood sets
• Anticoagulant solution
• Platelet additive solution
• Oliclinomel N4
• Oliclinomel N6
• Oliclinomel N7
• Oliclinomel N8
• Cernevit
• Potassium Phosphate
• Vitafusal
• TPN filter sets
• Prontosan
• Calgitrol
• Scarban
• Dermanet
• Jetox
• Sofsorb
• Alle
• Draina S
• Askina Sorb
• Flexima
• Adco Granisetron
• Sabax Ciprofloxacin
• Adco Ceftriaxone
• Sabax Metronidazole
• Sabax Intravenous solutions
• Sabax Irrigation solutions
• Sabax Mini-Bags
• Sabax Pour Bottles
MARKeT TReNDS• Patient access improving through low cost medical aid
• Patient access to newer therapies
• Ageing population increasing demand on chronic medication
• SA disease burden (HIV) significant
• General medical aid membership increasing
BUSINeSS FOCUS• Profitable growth through market leadership in the private sector
• Volume gains through successful Government tender awards to drive throughput efficiencies for the Group
MAChINe DeLIVeRY WOUND CARe NUTRITION TRANSFUSION TheRAPIeS
hOSPITALThe Critical Care division is a leading supplier of life-saving products. The portfolio includes intravenous fluids, renal dialysis systems, and products for the storage of blood and blood components, infusion systems and accessories as well as a comprehensive range of wound care and ostomy products.
SOUTHERN AFRICA CONTINUED
• Partnership with Netcare through National Renal Care (NRC)
ReNAL
28
ADCOCK INGRAM INTEGRATED REPORT 2013
TURNOVeR
R1 176
MILLION
TOP 10 BRANDS’ TURNOVeR
R317
MILLION
CONTRIBUTION AFTeR MARKeTING eXPeNSeS
R148 MILLION

hIGhLIGhTSIntravenous Solutions – the Government tender business for large volume intravenous solutions utilised 70% of the capacity of the manufacturing plant. Supply constraints, particularly early in the year due partially to the implementation of the Oracle system, inhibited service delivery to private hospitals. Aggressive marketing and sales strategies are in place to regain the Group’s leading position in the private hospital market.
Nutrition – the OliClinomel range performed well in the Nutrition market, reflecting 18% growth. The MCC recently stopped the sale of intravenous solutions containing Hydroxyethyl starch (HESO) in view of safety issues. These intravenous solutions are used in emergency and intensive care situations for the treatment and prevention of hypovolemia and for volume replacement in cases of shock. The division plans to launch a new product to replace this business which offers significant potential in a R180 million market.
Renal – the Group maintained market leadership in the renal dialysis therapies market across haemodialysis and peritoneal dialysis, and continuous renal replacement therapy (CRRT). A new CRRT product, Prismaflex, the latest technology for unstable haemodialysis patients, was launched successfully at the annual renal congress. Prismaflex is also indicated for the prevention and treatment of acute kidney injury.
National Renal Care (a joint venture with Netcare) is the only private dialysis therapy provider in South Africa that has a national network of 54 dedicated dialysis units with a presence in every major centre throughout the country. Adcock Ingram, through this partnership, is committed to assisting in the education and training of patients, early identification of kidney disease through the Healthy Start Clinics and assisting renal patients to live their lives to the fullest.
Haemophilia – life-saving treatment, Feiba, has recorded sales in excess of R30 million in this niche market as a result of focus on continuing medical education about the disease and the benefits of this unique and effective treatment.
OPPORTUNITIeSNew agencies for technologically advanced products will enhance the product offering to hospitals and the strong pipeline of generic injectables offers growth potential.
ChALLeNGeSThe South Africa Blood Transfusion Service plans to route its purchases via a tender process which is expected to place further pressure on margins.
To regain market leadership in the private market remains a challenge in this very competitive space.
SOUTHERN AFRICA CONTINUED
SOUTheRN AFRICA2013 PRODUCT LAUNCheS• Migroben
• Co-Migroben
• Serez
• Adco-Fem35
• Adco-Prednisolone
OPPORTUNITIeSStrategic priorities include the maintenance of a dynamic new product pipeline and maximising the number of registrations received annually. Special attention is being given to realisation of the benefits of the centralised laboratory and a focus on entrenching a culture of compliance throughout the organisation.
WheRe We hAVe SUCCeeDeD IN OUR OBJeCTIVeS• Maintained leadership in the OTC pharmacy market
• Core OTC brands exceeded market growth
• Specialised therapies performed in line with expectations
• New agreement with Lundbeck boosts share of the CNS market
WheRe We DID NOT AChIeVe OUR GOALS• Service delivery in the private hospital market
• New product introductions in the OTC market
AReAS OF RISK• Economic slow-down impact on consumer
spending
• Drive to reduce medicine prices
• Increasing competition
• Reliance on licensors for growth in the prescription division
• Adverse currency fluctuations impact on margins
• Impact of National Health Insurance system
• Capping of logistics fees
• Increasing cost of compliance with regulatory requirements
• International benchmarking
PeRFORMANCeSeveral factors affected the performance of the Southern Africa business, not least the devaluation of the Rand against major currencies, delays in the launch of new OTC products and a change in the product sales mix, including a move towards economy products and Government tender sales. Profitability was further hampered by supply constraints of hospital products which impacted on service delivery and resulted in share losses in the private hospital market.
29
ADCOCK INGRAM INTEGRATED REPORT 2013
?

30
ADCOCK INGRAM INTEGRATED REPORT 2013
MANUFACTURINGLOCATION CAPACITY PeR ANNUM ACCReDITATION PROGReSS 2013 AChIeVeD TARGeTS 2014
WADeVILLe Liquids: 6 MILLION LITRES Creams/Ointments: 100 000 KILOGRAMS Tablets and capsules: 2 BILLION
South Africa (MCC), Ghana (FDB), Botswana (DRU), Malawi (PMPB) and United States of America (FDA) achieved in 2013
Expansion of tablet manufacturing
Completion of tablet manufacturing expansion
Improved capacity utilisation
CLAYVILLe Effervescents: 28 MILLION TABLETS Effervescent granules and powders: 400 000 KILOGRAMS Liquids: 12 MILLION LITRES
South Africa (MCC), Ghana (FDB), Malawi (PMPB) and Kenya (PPB)
Improved utilisation of high-volume liquids facility
Increase utilisation by moving all outsourced liquid manufacturing and contract manufacturing to this facility
AeROTON Large volume parenterals: 28,5 MILLION UNITS Small volume parenterals: 25 MILLION UNITS Pour bottles: 2,3 MILLION UNITS Blood collection bags: 1 MILLION UNITS
South Africa (MCC), SANS ISO 9001:2008
The only medical-grade plastics manufacturing facility in Africa that allows for primary manufacture of bags for fluids
Service level normalised Increase output and implementation of cost-efficiencies programme
BANGALORe Tablets and capsules: 4,0 BILLION UNITS
UK (MHRA), Australia (TGA), South Africa (MCC), France (ANSES), Tanzania (TFDA), Kenya (PPB), Ghana (FDB), Namibia (NMRC), Uganda (UNDA), Romania (RNAMMD) and Ethiopia (DACAE)
Service levels back to normal after capacity constraints experienced during the first quarter
Achieve service levels above 97%
suPPlY ChAiN

31
ADCOCK INGRAM INTEGRATED REPORT 2013
hIGhLIGhTSThe completion of the R2 billion upgrade to the supply chain infrastructure over the past four years has provided a world-class base from which to take the business to a higher level. Capacity has been increased at all South African factories and distribution centres.
A gap analysis has identified opportunities to improve the integration of the supply chain process, from the procurement of raw materials through to distribution across all countries in which the Group has a presence. Several major projects have been identified to explore these opportunities which will improve efficiencies and provide cost-savings.
WADeVILLeA combination of the complexities of manufacturing a comprehensive range of ARVs and higher than anticipated demand from Government for the new tender led to stock shortages during the first half of the year. These issues were satisfactorily resolved and the facility is now focusing on streamlining efficiencies.
Tablet capacity will be increased by 50% following a further investment of R86 million. This expansion is expected to be completed in the second quarter of 2014 financial year.
CLAYVILLeThe R550 million investment in the automated high-volume liquids facility places the Group at the cutting edge of technology. Capacity has been increased to 12 million litres per annum. The facility was commissioned at the end of the prior year and has been accredited by the MCC. The meticulous process of product validation on a product-by-product basis for the new facility is ongoing.
A state-of-the-art raw materials warehouse with a sophisticated environmental monitoring system was also commissioned at the beginning of the year. The new central quality control laboratory is conveniently located in the same building.
AeROTONThe fully integrated steriles manufacturing facility is unique in Africa. Production activities range across sterile intravenous solutions, renal dialysis solutions, medical-grade plastic sheeting used in the production of IV fluid and blood bags, pour bottles and form-fill-seal technology, which is used to produce small-volume parenterals.
The new facility is fully operational and service delivery issues experienced at the beginning of the year have been resolved. Strategies are in place to regain private sector business are expected to increase volumes and improve factory recoveries.
BANGALOReCapacity at the joint venture Bangalore factory has been increased by 500 million tablets per year through improved efficiencies and additional shifts to meet an increase in demand. A new Laboratory Information Management System (LIMS) has been installed resulting in a significant improvement in turnaround times for the analysis of finished products.
A major focus has been placed on continuous improvement with several initiatives in progress to reduce cost and increase efficiencies. These include larger batch sizes, a reduction in carton sizes for the different packs, an increased number of containers per shipper and automation on certain packing lines.
GRI: 2.9

32
suPPlY ChAiN
LOCATION CAPACITY PeR ANNUM ACCReDITATION PROGReSS 2013 AChIeVeD TARGeTS 2014
GAUTeNG 22 500 PALLETS South Africa (MCC) Improved service levels
Attracted additional multi-national companies
Bulk stock managed closer to factories
Owner-driver scheme fully operational
Bloemfontein warehouse closed
Challenges experienced at start of year with switch of information system
Maintain or improve service levels
Extension of Durban warehouse to handle additional imports
Expansion of owner-driver scheme
Increase direct deliveries and decrease wholesaler intermediaries
Reduce pallet utilisation
DURBAN 4 400 PALLETS South Africa (MCC)
CAPe TOWN 4 800 PALLETS South Africa (MCC)*
PORT eLIZABeTh 1 500 PALLETS South Africa (MCC)*
CLAYVILLe 6 200 PALLETS South Africa (MCC) Bulk stock managed closer to factories
Wholesale bulk deliveries
* Obtained during 2013
LOGISTICS
ADCOCK INGRAM INTEGRATED REPORT 2013

33
ADCOCK INGRAM INTEGRATED REPORT 2013
OVeRVIeWThe upgrade programme ensured that the Group’s logistics facilities in South Africa rate amongst the best in Africa. The R65 million investment in automation during the past year will improve efficiencies. All distribution centres gained the approval of the MCC and the Group’s multi-national partners.
Distribution costs in Southern Africa declined as a percentage of turnover in 2013. Lead times and order fill levels improved significantly in the second half of the year despite a 23% volume growth in unit terms. Order fill levels rose from 80% in the previous year to 91% at year-end with significant strides being made in the last quarter. The target for order fill in 2014 is set at 95%.
An investment of R9,6 million will double capacity at the Durban facility in 2014. This expansion will cater for the streamlined management of imported finished goods.
A bulk stock warehouse was completed at Clayville to provide capacity of 6 200 pallets.
The enterprise development owner-driver initiative is working well and has been extended with an additional two vehicles at Midrand. A similar project is to be launched at the Aeroton facility in 2014.
The Bloemfontein facility was closed, with orders now being supplied from Midrand.
OPPORTUNITIeSThe Group’s direct distribution expertise and breadth of capacity provides an increasing competitive advantage in both the private and public sectors.
Plans are in place to bring cold chain management in-house. This will further consolidate the Group’s distribution activities.
2014 will see a strong focus towards improved service delivery to our customers and more efficient pallet utilisation as a result of a more balanced inventory holding at all sites.
ChALLeNGeSInventory distribution challenges experienced at the beginning of the year, coupled with high inventory levels, proved to be a major challenge, especially for intravenous solutions and anti-retrovirals. However, order fills returned to targeted levels in the second half of the year.
Negative perceptions about service delivery, lead times and order fills in the eyes of both external and internal stakeholders are a challenge and are being addressed.
Rising fuel costs and the introduction of toll roads will impact distribution costs. Higher volumes and cost-cutting in other areas are required to prevent an escalation in distribution costs.
FUTURe FOCUSThe supply chain will direct efforts towards improved service delivery and a focus on balancing and reducing inventory holdings. A focus on cost containment and improved efficiencies will aim to protect margins.
The implementation of a fully integrated warehouse management and transport system as well as an integrated logistics network to sub-Saharan Africa and Rest of Africa are key focus areas for the future.
lead time – number of days that must be allowed for the completion of a process
order fill – number of orders processed within a period without stock outs or need to back order, expressed as a percentage of total number of orders processed within that period
For environmental discussion about the supply chain, please refer to the Environment section on page 46.
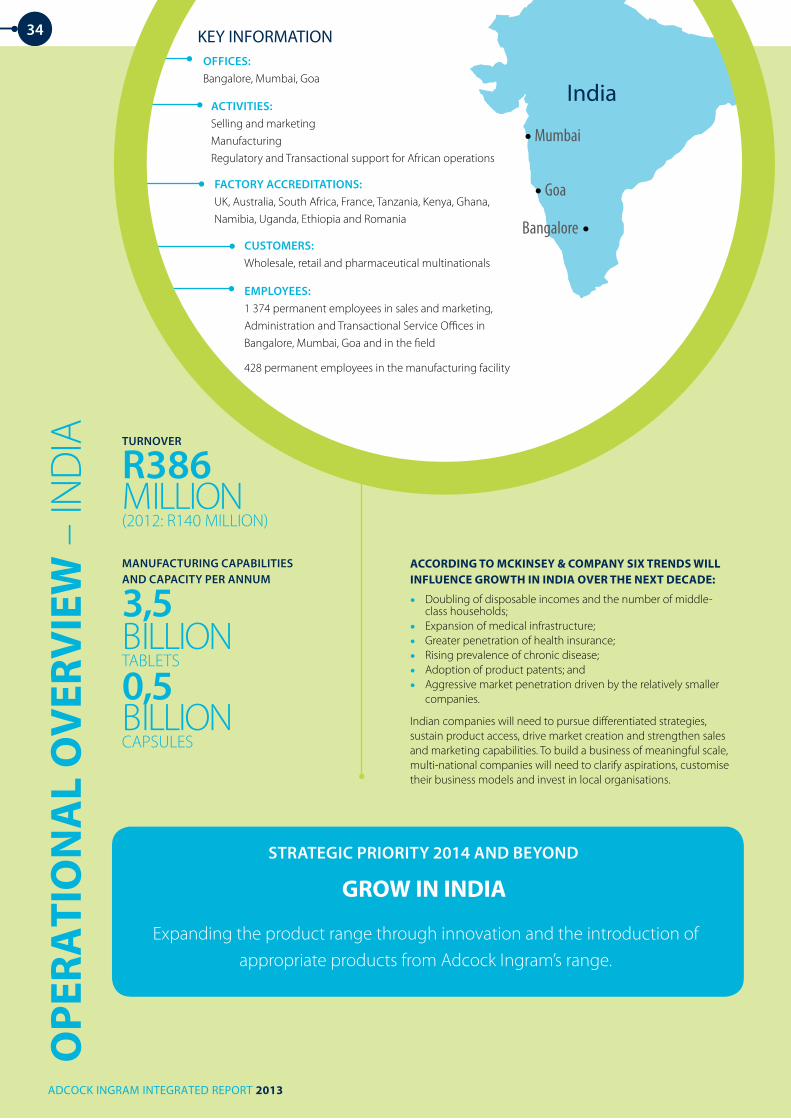
34
Bangalore
India
Mumbai
Goa
OPe
rAti
ON
Al
OV
erV
ieW
– IN
DIA
ACCOrdiNg tO MCkiNseY & COMPANY siX treNds Will iNflueNCe grOWth iN iNdiA OVer the NeXt deCAde:
• Doubling of disposable incomes and the number of middle-class households;
• Expansion of medical infrastructure;• Greater penetration of health insurance;• Rising prevalence of chronic disease;• Adoption of product patents; and• Aggressive market penetration driven by the relatively smaller
companies.
Indian companies will need to pursue differentiated strategies, sustain product access, drive market creation and strengthen sales and marketing capabilities. To build a business of meaningful scale, multi-national companies will need to clarify aspirations, customise their business models and invest in local organisations.
TURNOVeR
R386
MILLION
(2012: R140 MILLION)
MANUFACTURING CAPABILITIeS AND CAPACITY PeR ANNUM
3,5
BILLION
TABLETS
0,5
BILLION
CAPSULES
ADCOCK INGRAM INTEGRATED REPORT 2013
KEY INFORMATIONOFFICeS: Bangalore, Mumbai, Goa
ACTIVITIeS: Selling and marketingManufacturingRegulatory and Transactional support for African operations
FACTORY ACCReDITATIONS: UK, Australia, South Africa, France, Tanzania, Kenya, Ghana, Namibia, Uganda, Ethiopia and Romania
CUSTOMeRS: Wholesale, retail and pharmaceutical multinationals
eMPLOYeeS: 1 374 permanent employees in sales and marketing, Administration and Transactional Service Offices in Bangalore, Mumbai, Goa and in the field
428 permanent employees in the manufacturing facility
STRATeGIC PRIORITY 2014 AND BeYOND
grOW iN iNdiA
Expanding the product range through innovation and the introduction of appropriate products from Adcock Ingram’s range.

35
heALThCARe IN INDIA – MARKeT TReNDSThe Group established a greater presence in India during 2013, and consequently provides a summarised overview of the Indian market below:
eCONOMIC
• Second most populous country in the world.
• Large domestic market, and emerging middle class will be a major driver of growth.
• Vast supply of inexpensive but skilled labour has turned India into the back office of the world.
• One of the biggest recipients of foreign direct investment amongst emerging markets.
• Strategically located in Asia and has strong ties to Europe and the United States.
PhARMACeUTICAL MARKeT
• Different to other pharmaceutical markets in that patients are generally reluctant to self-medicate.
• Essentially a branded generic prescription market.
• There are approximately 500 000 registered physicians with 70% being General Practitioners.
• Companies consider the physician and the identified “key opinion leaders” as key customers.
DISTRIBUTION
• The Federal tax system in India adds complexity to the entire logistics and distribution structure as each state has its own tax regime and rules for free trade, leading to a highly fragmented system.
• A proposal supporting the implementation of general sales tax has been agreed with almost all the states and is pending the government decision on the compensation of tax loss to the smaller states. The proposal will require constitutional amendment at government to be passed by a two-thirds majority. The proposal would enable the free movement of goods between states on a single tariff system and will reduce the administrative compliance burden and procedures. It will be of great advantage to pharmaceutical companies as it can potentially do away with the clearing and forwarding set up in each state, and potentially facilitate the supply the goods directly from their warehouses.
• Geographically diverse country with extreme climates that makes distribution a critical function.
• Companies distribute inventory on consignment to clearing and forwarding agents, who are primarily responsible for distributing to wholesalers.
ReGULATORY
• Prescription drugs cannot be advertised to the public.
• Historically poor intellectual property rights protection.
• Intellectual property protection has improved with the enforcement of new legislation.
• Three licences are required to enable a company to sell drugs and are obtained from the Indian FDA and are not transferable:
– manufacturing licence held by the manufacturing company, and the company selling the goods (if different from the manufacturer) needs to maintain copies of all manufacturing licences from third parties;
– sale and distribution or marketing licence which enables the holder to sell, stock, exhibit or distribute pharmaceutical products. A marketing licence must be obtained in each of the Indian states; and
– a loan licence which is only required if the applicant procures raw materials and supplies these to third party manufacturers for conversion into finished products.
PRICING
• Currently the pricing of 74 bulk drugs is controlled under the Drug Prices Control Order 1995 (DPCO), 47 of which are being manufactured in India.
• The new National Pricing Policy 2013 covering the National List of Essential Medicine (NLEM) covering 342 drugs and its formulations was announced, effective from 1 August 2013 and all companies in India have to issue revised prices for products covered under this Policy.*
• The Government of India has introduced two new policies to curb the irrational and excess use of pharmaceuticals products in the country:(a) Central Drugs Standard Control Organisation (CDSCO) issued
a notice on 1 July 2013 to the State Licensing Authority ordering all manufacturers of new Fixed Dose Combination (FDC) products licensed locally before October 2012 without CDSCO permission, to submit safety and efficacy data before 30 September 2013. Manufacturers who fail to submit the data by the deadline will run the risk of having these products banned from the market.*
(b) The Health Ministry notified an amendment to the Drugs and Cosmetics Rules (DCR), 1945 on 30 August 2013 by implementing Schedule H1 to the DCR. The amendment proposes that drugs which are included in the new Schedule H1, in addition to the regular warning that mentions drugs should be sold only on prescription from a registered medical practitioner, would also now have to include a warning for consumers that there may be some harm associated with the consumption of the drug if not taken in accordance with medical advice. The intention behind introducing this new schedule to the DCR is to check the continuing practice of indiscriminate use of antibiotics in India and a tendency for a large number of prescription products being available over the counter.*
ADCOCK INGRAM INTEGRATED REPORT 2013
* The impact of this on the Adcock Ingram business has been quantified on page 37 under “Challenges”.

36
ADCOCK INGRAM INTEGRATED REPORT 2013
Pravin Iyer Commercial executive – India
INDIA CONTINUED
BUSINeSS OVeRVIeWINTRODUCTIONThe R780 million acquisition of Cosme, a mid-sized Indian pharmaceutical sales and marketing business, was concluded in late January 2013.
Cosme Pharma had marketing and selling operations promoting the product range to 150 000 health professionals in 26 of the 28 states in India. Cosme owned 60 established brands with approximately 120 stock keeping units (SKUs) and was ranked 72nd in the Indian pharmaceutical market in an essentially branded generic prescription market worth $16 billion and a compound annual growth rate of 20% (reference IMS). It is estimated that some 80% of patient spend in this market is out of pocket due to poor healthcare coverage. Doctor visits and medicines are relatively affordable. The administration of the business is in Bangalore and its warehouse in Goa through which all products are received before shipping to regions.
Cosme commenced operations in 1910 and is structured in three divisions focusing in four therapeutic classes: gastro-intestinal, dermatology, gynaecology and orthopaedic.
Cosme was amongst the first companies to join with Astra Zeneca to manufacture an iron sorbitol injection called Jectofar, which is now marketed under the owned brand Jectocos.
Cosme also enjoyed “first mover” advantage in launching Ferose tablets (Ferrous bisglycinate), Flucos gel and lotion (Fluconazole) and Vonder capsules (Benfotiamine) and was able to create a niche position in the prescribing doctors’ minds.
COSMe
MeDICAReGastro Intestinal
SKIN CAReDermatology
MULTI-SPeCIALITYGynaecologyOrthopaedic
Reglan #2 Coslyte #11Lorna
FlucosCosvateCosmelite
Jectocos #1Cosklot #5FeroseMenabol
# Market position
WheRe We MeT OUR OBJeCTIVeS• Successful integration of the Cosme business
• Successful resolution of labour relations issues with the former employees of Cosme
• Supply chain transition from Cosme to Adcock Ingram
• Launch of new products and line extensions
WheRe We DID NOT AChIeVe OUR GOALS• Attrition at the medical representative level
is high, our initiatives to build the team yet to translate into managing attrition
GRI: 2.5, 2.8

INDIA CONTINUED
The business has two types of manufacturing agreements with suppliers, these are principal to principal (P2P) and loan licence (LL) agreements, which cover both technical and commercial terms:
• Principal to principal contracts: Contract manufacturer provides all material and the applicant purchases the finished product in its brand name from the manufacturer; and
• Loan licence contracts: Applicant provides all material required to manufacture the products and the manufacturer charges a conversion cost.
Raw materials are delivered either to the main warehouse in Goa or directly to manufacturers. There are 12 locations throughout India where finished goods are manufactured.
Adcock Ingram’s warehouse in Goa handles raw material, packing material and 120 finished product SKUs and services warehouse distributors in 26 states. There are opportunities to streamline warehouse management and technology as the Group establishes its own distribution infrastructure in the future.
CURReNT YeAR PeRFORMANCeTurnover of R386 million was achieved, with sales adversely impacted over the six-week transition phase during which sales force union activity impacted productivity. These issues were resolved and the business is well placed to provide satisfactory growth next year.
MeDICARe Cosme’s products in the gastro-intestinal market compete in the proton pump inhibitor, anti-emetic, anti-spasmodic and laxative categories. Top performers are Reglan (for nausea and vomiting) and Coslyte (electrolyte for fluid replacement). Chymogram (pain and inflammation) was launched in the latter half of the year.
SKIN CAReThis market of R5 billion recorded 18% growth in 2012. Flucos (anti-fungal), Cosvate (cortico-steroid) and Cosmelite (triple combination therapy for skin scars) compete in this market.
MULTI-SPeCIALITYThis is the leading division and includes iron supplements, Jectocos and Ferose which are frequently prescribed for nutrition deficiencies and during pregnancy. Cosklot (haemostatic) is in the top five etamsylate products in India with a 6% market share, and together with Menabol (anabolic steroid) ranks amongst the leading brands in this category.
TRANSACTIONAL SUPPORTThis office in Bangalore provides services to the Drug Management and Development team in Africa, including stability studies, vendor audits, regulatory services, medical affairs and pharmacovigilance.
OPPORTUNITIeSIndia, with its population of 1,2 billion people, an emerging middle class and a skilled workforce, represents a significant growth opportunity for the Group.
The acquisition of Cosme has provided a sound platform in the Indian pharmaceutical market. The business can be taken forward with innovation and new products from Adcock Ingram’s range.
Field forces play an important role in promoting products to doctors. The introduction of Adcock Ingram’s brand-building and selling expertise will help to capitalise on growth in this market.
ChALLeNGeSThe market presents some challenges:
• GDP growth has slowed to 5% in 2013 accompanied by a sharp devaluation of the Indian Rupee. Poverty, improved infrastructure and job creation should continue to receive attention.
• The healthcare system is under-developed, with vast regional disparities. This impacts access to medicine.
• The introduction of the NLEM necessitated a price reduction on five Cosme brands. The total annual sales of these brands is R21 million with price erosion of 40% (3,5% on the overall business). The NLEM policy does not allow for withdrawal of the products from the market.
• We have identified nine products in our portfolio which are FDCs and have filed the Medical Rationale and Product Safety Update Reports (PSUR) with CDSCO within the due date. We remain confident of the CDSCO approving the products. The process of approval is expected to be completed by 31 December 2014. The annual revenue of these nine products is R40 million.
• Two of our antibiotic products, Bilactam and Bilactam XL, will have to incorporate the additional warnings as required by the implementation of Schedule H1 to the DCR, applicable from February 2014.
• Complex distribution network stemming from a regional tax system.
• Despite high unemployment there is a skills shortage in the sales area. The company’s attrition rate is being addressed through the introduction of talent management programmes and reward systems to attract and retain quality people.
2014 AND BeYONDStrategies are being implemented to enhance the Group’s market share in this very competitive market. These include:
• Attention will be given to developing the Group’s human capital competencies with the introduction of talent management and leadership development programmes. Particular effort will be directed towards improving sales force competencies and motivation to improve doctor call rate outcomes.
• Expanding the product range through innovation and the introduction of appropriate products from Adcock Ingram’s range.
• Distribution and information systems will be given priority attention to streamline Cosme’s operations.
37
ADCOCK INGRAM INTEGRATED REPORT 2013

38
OPe
rAti
ON
Al
OV
erV
ieW
– R
EST
OF
AFR
ICA
173 31
SOUTHERN AFRICA ZIMBABWE
• Citro-Soda
• Myprodol
• Medi-Keel
• Betapyn
• Ferrodex
• Carvo
• Paralex-D
2
• Propain
• Pynstop
• Solphyllex
• Adco Linctopent
• Camphacare
• Teejel
EAST AFRICA KENYA3
• Dawanol
• Betapyn
• Citro-Soda
• Medi-Keel
WEST AFRICA GHANA1
• Locaine
• Myprodol
• Fucicort
Nigeria
LagosCôte d’Ivoire
Abidjan
KEY INFORMATION
518
OFFICeS: Accra (Ghana), Bulawayo (Zimbabwe), Nairobi (Kenya)
ACTIVITIeS: Manufacturing and Distribution (Ghana) Manufacturing (Zimbabwe) Distribution from South Africa (Zimbabwe)Distribution from Kenya into East Africa
CUSTOMeRS: Hospitals, Clinics, Healthcare practitioners, Pharmacies, Wholesalers and Retailers
ADCOCK INGRAM INTEGRATED REPORT 2013
eMPLOYeeS
ACCReDITATION Food and Drugs Board (FDB)
The Economic Community of West African States (ECOWAS)
Medicines Control Authority of Zimbabwe (MCAZ)
Health Professions Authority
Pharmacy and Poisons Board
MANUFACTURING CAPABILITIeS AND CAPACITY PeR ANNUM
695 millionTablets and capsules
2 million litresLiquids
1,2 million sachetsPowders
1,24 million tubesCreams/Ointments
120 millionTablet and capsules
290 000 litresLiquids
1,2 million kgCreams/Ointments
KeY PRODUCTS

39
MARKeT TReNDS• Relative economic stability in the markets in which
the Company has a presence
• Emerging middle class offers attractive growth prospects
• Affordability remains an issue
• Greater health awareness and rise of consumerism
• Currency fluctuations remain a risk
• Growth constrained by sub-optimal infrastructures in most countries
AReAS OF RISK• Regulatory compliance
• Increasing competition
• Counterfeit medicines
• Exchange rate fluctuations
• Political instability in East Africa
• Infrastructure challenges
TURNOVeR
R221 MILLION
(2012: R155 MILLION)
ADCOCK INGRAM INTEGRATED REPORT 2013
CONTRIBUTION AFTeR MARKeTING eXPeNSeS
R48 MILLION
(2012: R27 MILLION)
hIGhLIGhTSThe East African business performed well in terms of revenue and is making inroads into regional export markets. Pharmaceutical prescription products accounted for 80% of turnover in this region. Demand creation activities led to satisfactory growth for Betapyn, Myprodol, Locaine and Medi-Keel. Dawanol was re-introduced to the market with security features to overcome counterfeit competitors. Some success has been achieved with tender awards in Kenya and Rwanda.
Exports into the SADC region benefitted from additional resources and demand creation activities in Zambia and Mozambique. However, supply bottlenecks depressed export performance.
?
STRATeGIC PRIORITY 2014 AND BeYOND
eXPANsiON iNtO rest Of AfriCA
Development of the product range to meet the needs of the markets

40
ADCOCK INGRAM INTEGRATED REPORT 2013
Kofi Amegashie Commercial executive – Rest of Africa
REST
OF
AFR
ICA
CON
TIN
UED
PeRFORMANCeThis segment of the business reflected turnover growth of 42%. Gross margin improvement was however negatively impacted by factory under-recoveries in Ghana and Zimbabwe, and supply constraints in Ghana which inhibited the growth of Over the Counter (OTC) products.
Following a fire in the plant in Ghana, the Oral Solid Dose factory was closed temporarily during the year and an upgrade is planned for the liquid facility in 2014 to meet revised regulatory compliance standards to be introduced by 2015 and to increase capacity.
MARKeT OVeRVIeWGhANAThe medium-term outlook for Ghana remains positive, with projected GDP growth of 8% in 2013, increasing to 9% in 2014. The discovery and production of oil and increasing prices of Ghana’s main exports of gold and cocoa are important contributors to this growth.
However, government over-spending and a reliance on oil revenues to drive the economy could be counter-productive. Investments need to be spread across the broad economy to stimulate job creation in all sectors.
GDP growth is driven largely by commodity exports. The pre-election liquidity crisis continues to impact on consumer purchasing levels and much needs to be done to alleviate poverty.
The reimbursement of OTC medicines has been stopped by the Government Employee’s medical aid scheme. This has resulted in a decline in OTC volumes in Ghana.
GRI: 2.5, 2.8

41
ADCOCK INGRAM INTEGRATED REPORT 2013
KeNYAKenya was characterised by a stable economic environment and peaceful elections. GDP is expected to improve to double-digit figures in the near future, given the discovery of oil. Infrastructure and services have been improved significantly over the past years and the average Kenyan is healthier and better educated. However, poverty remains high.
The recent terrorist attack in Nairobi has dealt a blow to investor confidence in the region in general. The Group continues to adopt a conservative approach to investment in this market in the medium term.
ZIMBABWeThe Zimbabwe economy continues to be bedeviled by the liquidity constraints as limited foreign direct investment is being channeled into the country. Although the mining sector is showing some growth, most other sectors of the economy are suffering, with manufacturing being most affected as capacity utilisation has declined from the level of the last few years to around 39% according to a recent survey by the Confederation of Zimbabwean Industries. Unemployment continues to grow as more and more companies close down, many workers become redundant and this reduces the amount of spending money in the economy.
The government has been working with the IMF to obtain some debt relief which would stimulate the economy.
A new economic recovery blueprint based on revival of agriculture and mining has been unveiled by the government to support the economic revival thrust and it is hoped that, following the current political environment and support from the IMF, the economy could recover in the medium term.
OPPORTUNITIeSGhANAThere are significant growth opportunities following completion of the infrastructure upgrades in this country. The increasing demand for prescription and OTC medicines from the emerging and discerning middle class augurs well for business growth. However, affordability remains an issue in the broader market. A review of pack sizes is required to build brand loyalty and stimulate growth.
KeNYAThis country provides access to the East African market of nearly 150 million consumers. Harmonisation of registration requirements in the EAC (East African Community) facilitates expansion into the EAC to exploit the opportunities that exist in Ethiopia and South Sudan.
The Group is having some success with tenders for hospital products in Uganda and Rwanda. The takeover of the Cosme business in Kenya and Tanzania provides opportunities, especially in Tanzania where nine products enjoy registration from the stringent Tanzania Food and Drug Authority.
ZIMBABWeThere are opportunities for growth in the Zimbabwe market, taking into account the high per capita consumption of pharmaceuticals, which exceeds that of Kenya.
Funding for pharmaceuticals and personal care products is often provided through remittances from five million Zimbabweans living outside the country.
The new CamphaCare (personal skincare) is expected to provide growth and offers export potential to the Rest of Africa and India.
ChALLeNGeSAffordability remains a challenge in most African markets. Customised pack sizes would help to build OTC brands in these markets.
In Ghana, infrastructure upgrades are causing port congestion leading to delays in the delivery of imported raw materials and bulk stock. Order volumes are being increased, with the attendant increase in inventories and impact on working capital.
The factory upgrade has inhibited service delivery and growth. This factory upgrade is scheduled for completion in the new calendar year.
Counterfeit medicines are rife in Kenya and Ghana as there are limited resources to police these activities.
Specialised packaging is a requisite of many tenders to curtail theft.
The withdrawal of the manufacturing and marketing license of Tiger Brands’ Ingram’s Camphor Cream in Zimbabwe at the end of March 2013, which previously contributed at least 53% of turnover, put this business under pressure.
The Zimbabwe Government is an important customer, but the cash crisis in the country often results in late payments.
SOCIAL INVeSTMeNTThe Group supports Operation Smile, a global non-profit volunteer medical services organisation, which provides reconstructive surgery for children and adults with cleft lips/palates. Two hundred children and adults in Malawi received surgery.
A donation of critical hospital medicines to the value of R1 million was made to the Lilongwe Hospital which had no critical hospital supplies on hand.
FOCUS 2014The African business landscape offers significant growth opportunities but this is an intensely competitive environment aggravated by infrastructure challenges and varying regulatory processes.
Key priorities include:
• Improvement in customer service with particular reference to continuity of supply;
• Development of the product range to meet the needs of the markets;
• Capitalise on opportunities in SADC countries;
• Explore acquisition opportunities; and
• Completion of the factory upgrade in Ghana.
An integrated supply chain strategy has been designed with a phased implementation plan over the next five years. This will ensure that infrastructure and equipment in Africa meet the required international quality standards and cater for growth.

sustAiNABilitY42
ADCOCK INGRAM INTEGRATED REPORT 2013
Adcock Ingram has been in the business of value creation for the past 123 years. Sustainable business growth is achieved through robust strategic planning to maintain a competitive edge. Integrated, ethical action steps follow to meet economic goals. These actions are underpinned by stakeholder interaction, social activities and the Group’s responsibility to protect the environment through a process of continuous improvement on our carbon footprint.
The Group’s efforts to ensure long-term sustainability include:
• The provision of sustainable and market-related returns for our shareholders and partners;
• Commitment to, and monitoring of core governance principles;
• The provision of safe and effective medicines and healthcare products;
• Meeting expectations of healthcare professionals, customers and consumers;
• Transformation and empowerment;
• A market-related total reward strategy;
• Continuous improvement in our various employee programmes such as learning and development, talent management and culture development;
• The provision of a safe and healthy working environment;
• The efficient management and use of scarce resources and protection of the environment;
• Stakeholder engagement; and
• Responsible and ethical corporate citizenship.
PeOPLeAdcock Ingram’s success is driven by the contribution of each individual employee, and employee groups working together to achieve a common goal.
The Group treats all employees equally and promotes diversity in the workplace. Clear policies and processes are in place to ensure that the right people are recruited and retained. The Group makes every effort to provide a stimulating work environment in which competent, skilled and experienced individuals are given opportunities for development and personal growth. Reward and recognition is based on high performance levels measured against clear goals aligned to the Group’s strategic objectives.
The race representation in the South African business is as follows:
African (62%)White (15%)Coloured (15%)Indian (8%)
African (62%)White (15%)Coloured (15%)Indian (8%)
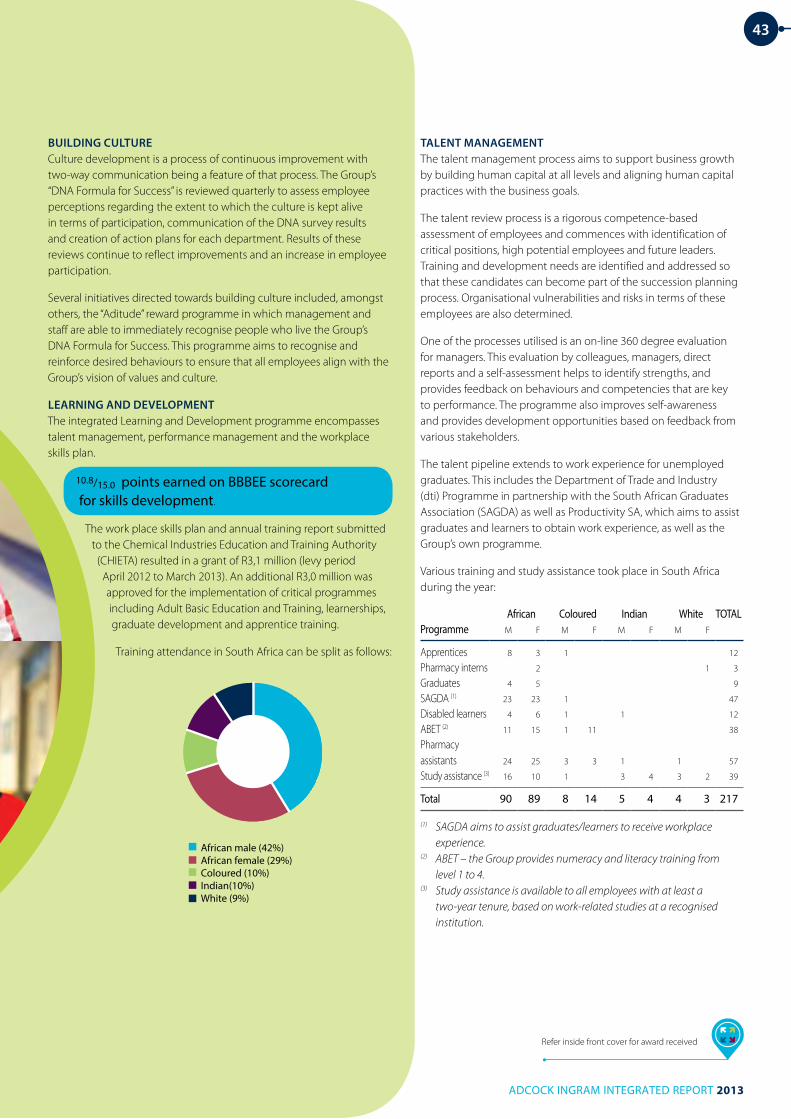
43
ADCOCK INGRAM INTEGRATED REPORT 2013
TALeNT MANAGeMeNTThe talent management process aims to support business growth by building human capital at all levels and aligning human capital practices with the business goals.
The talent review process is a rigorous competence-based assessment of employees and commences with identification of critical positions, high potential employees and future leaders. Training and development needs are identified and addressed so that these candidates can become part of the succession planning process. Organisational vulnerabilities and risks in terms of these employees are also determined.
One of the processes utilised is an on-line 360 degree evaluation for managers. This evaluation by colleagues, managers, direct reports and a self-assessment helps to identify strengths, and provides feedback on behaviours and competencies that are key to performance. The programme also improves self-awareness and provides development opportunities based on feedback from various stakeholders.
The talent pipeline extends to work experience for unemployed graduates. This includes the Department of Trade and Industry (dti) Programme in partnership with the South African Graduates Association (SAGDA) as well as Productivity SA, which aims to assist graduates and learners to obtain work experience, as well as the Group’s own programme.
Various training and study assistance took place in South Africa during the year:
African Coloured Indian White TOTALProgramme M F M F M F M F
Apprentices 8 3 1 12
Pharmacy interns 2 1 3
Graduates 4 5 9
SAGDA (1) 23 23 1 47
Disabled learners 4 6 1 1 12
ABET (2) 11 15 1 11 38
Pharmacy assistants 24 25 3 3 1 1 57
Study assistance (3) 16 10 1 3 4 3 2 39
Total 90 89 8 14 5 4 4 3 217
(1) SAGDA aims to assist graduates/learners to receive workplace experience.
(2) ABET – the Group provides numeracy and literacy training from level 1 to 4.
(3) Study assistance is available to all employees with at least a two-year tenure, based on work-related studies at a recognised institution.
BUILDING CULTUReCulture development is a process of continuous improvement with two-way communication being a feature of that process. The Group’s “DNA Formula for Success” is reviewed quarterly to assess employee perceptions regarding the extent to which the culture is kept alive in terms of participation, communication of the DNA survey results and creation of action plans for each department. Results of these reviews continue to reflect improvements and an increase in employee participation.
Several initiatives directed towards building culture included, amongst others, the “Aditude” reward programme in which management and staff are able to immediately recognise people who live the Group’s DNA Formula for Success. This programme aims to recognise and reinforce desired behaviours to ensure that all employees align with the Group’s vision of values and culture.
LeARNING AND DeVeLOPMeNTThe integrated Learning and Development programme encompasses talent management, performance management and the workplace skills plan.
10.8/15.0 points earned on BBBEE scorecard for skills development.
The work place skills plan and annual training report submitted to the Chemical Industries Education and Training Authority
(CHIETA) resulted in a grant of R3,1 million (levy period April 2012 to March 2013). An additional R3,0 million was approved for the implementation of critical programmes including Adult Basic Education and Training, learnerships, graduate development and apprentice training.
Training attendance in South Africa can be split as follows:
African male (42%) African female (29%) Coloured (10%) Indian(10%) White (9%)
Refer inside front cover for award received
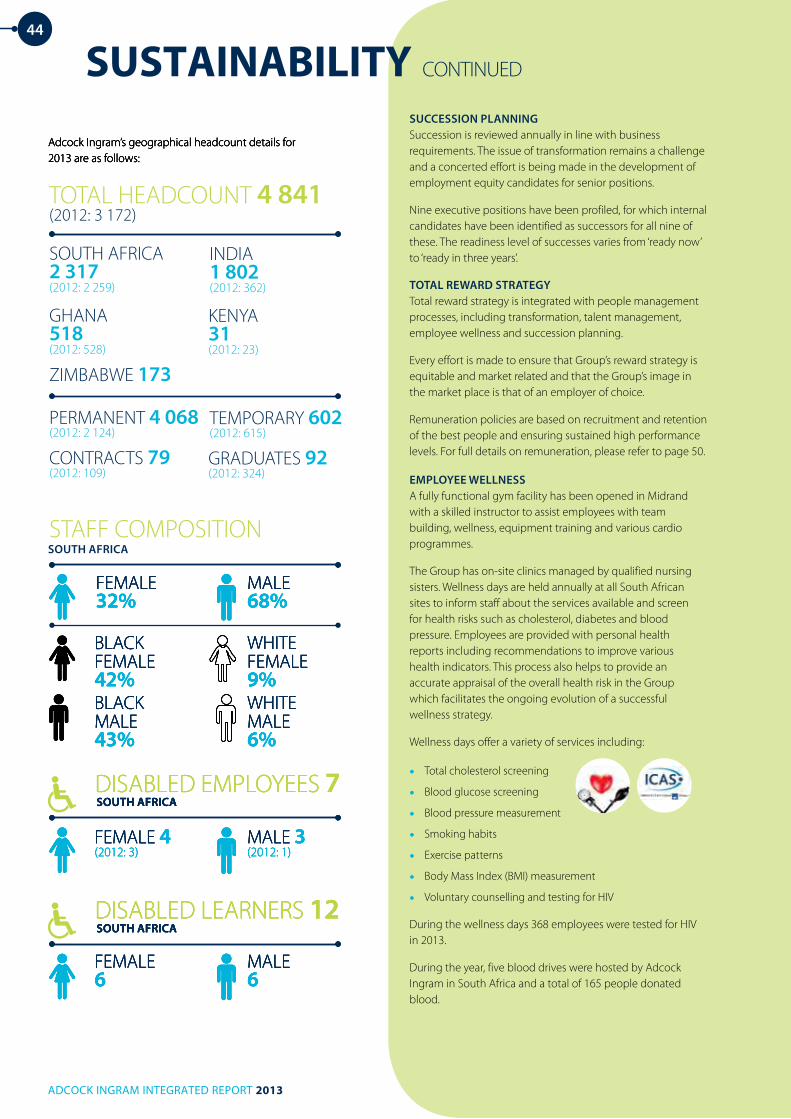
44
ADCOCK INGRAM INTEGRATED REPORT 2013
sustAiNABilitY CONTINUED
SUCCeSSION PLANNINGSuccession is reviewed annually in line with business requirements. The issue of transformation remains a challenge and a concerted effort is being made in the development of employment equity candidates for senior positions.
Nine executive positions have been profiled, for which internal candidates have been identified as successors for all nine of these. The readiness level of successes varies from ‘ready now’ to ‘ready in three years’.
TOTAL ReWARD STRATeGYTotal reward strategy is integrated with people management processes, including transformation, talent management, employee wellness and succession planning.
Every effort is made to ensure that Group’s reward strategy is equitable and market related and that the Group’s image in the market place is that of an employer of choice.
Remuneration policies are based on recruitment and retention of the best people and ensuring sustained high performance levels. For full details on remuneration, please refer to page 50.
eMPLOYee WeLLNeSSA fully functional gym facility has been opened in Midrand with a skilled instructor to assist employees with team building, wellness, equipment training and various cardio programmes.
The Group has on-site clinics managed by qualified nursing sisters. Wellness days are held annually at all South African sites to inform staff about the services available and screen for health risks such as cholesterol, diabetes and blood pressure. Employees are provided with personal health reports including recommendations to improve various health indicators. This process also helps to provide an accurate appraisal of the overall health risk in the Group which facilitates the ongoing evolution of a successful wellness strategy.
Wellness days offer a variety of services including:
• Total cholesterol screening
• Blood glucose screening
• Blood pressure measurement
• Smoking habits
• Exercise patterns
• Body Mass Index (BMI) measurement
• Voluntary counselling and testing for HIV
During the wellness days 368 employees were tested for HIV in 2013.
During the year, five blood drives were hosted by Adcock Ingram in South Africa and a total of 165 people donated blood.
BLACK MALE 43%
BLACK FEMALE 42%
Adcock Ingram’s geographical headcount details for 2013 are as follows:
PERMANENT 4 068
(2012: 2 124)TEMPORARY 602
(2012: 615)
CONTRACTS 79
(2012: 109)GRADUATES 92
(2012: 324)
TOTAL HEADCOUNT 4 841 (2012: 3 172)
FEMALE 32%
MALE 68%
WHITE FEMALE 9%
WHITE MALE 6%
DISABLED EMPLOYEES 7SOUTh AFRICA
FEMALE 4
(2012: 3)MALE 3
(2012: 1)
DISABLED LEARNERS 12SOUTh AFRICA
FEMALE 6
MALE 6
SOUTH AFRICA 2 317
(2012: 2 259)
INDIA 1 802
(2012: 362)
GHANA 518
(2012: 528)
KENYA 31
(2012: 23)
BLACK MALE 43%
BLACK FEMALE 42%
Adcock Ingram’s geographical headcount details for 2013 are as follows:
FEMALE 32%
MALE 68%
WHITE FEMALE 9%
WHITE MALE 6%
DISABLED EMPLOYEES 7SOUTh AFRICA
FEMALE 4
(2012: 3)MALE 3
(2012: 1)
DISABLED LEARNERS 12SOUTh AFRICA
FEMALE 6
MALE 6
BLACK MALE 43%
BLACK FEMALE 42%
Adcock Ingram’s geographical headcount details for 2013 are as follows:
FEMALE 32%
MALE 68%
WHITE FEMALE 9%
WHITE MALE 6%
DISABLED EMPLOYEES 7SOUTh AFRICA
FEMALE 4
(2012: 3)MALE 3
(2012: 1)
DISABLED LEARNERS 12SOUTh AFRICA
FEMALE 6
MALE 6
BLACK MALE 43%
BLACK FEMALE 42%
Adcock Ingram’s geographical headcount details for 2013 are as follows:
STAFF COMPOSITION
FEMALE 32%
MALE 68%
WHITE FEMALE 9%
WHITE MALE 6%
SOUTh AFRICA
DISABLED EMPLOYEES 7SOUTh AFRICA
FEMALE 4
(2012: 3)MALE 3
(2012: 1)
DISABLED LEARNERS 12SOUTh AFRICA
FEMALE 6
MALE 6
ZIMBABWE 173

ADCOCK INGRAM INTEGRATED REPORT 2013
sustAiNABilitY CONTINUED
45
The HIV/AIDS disease management programme offers HIV education and awareness programmes and pre- and post-screening counselling. Employees who are diagnosed with HIV, either through screening or by a private practitioner, are encouraged to enroll in this programme to assist them in the optimal management of their condition.
eMPLOYee heALTh AND SAFeTYTwenty-three cases of disabling injuries have been reported during the past year in South Africa. Critical Care had seven incidents, Wadeville seven, Midrand six, Clayville two and one at R&D. During the current year we had no fatalities.
The following graph provides the Disabling Injury Frequency Rate (DIFR) at Adcock Ingram facilities in South Africa for the 2013 year.
DISABLING INJURY FReqUeNCY RATe (DIFR)
DIFR – the number of deaths and disabling injuries per 200 000 employee hours of exposure. A DIFR of 1.9 means that the Company has 1.9 people injured for every 200 000 man hours worked over a 12-month period.
Disabling injury – a work-related injury that results in death, permanent disability, permanent partial disability or temporary disability. Disabling injuries include lost workday cases, restricted workday cases and noise included hearing loss. These injuries are used in calculating the DIFR.
heALTh AND SAFeTY AT FACILITIeSThe 2013 risk control audit conducted by Alexander Forbes/Marsh, achieved satisfactory results. The overall score for all locations audited was maintained at an average rating of 97%.
The South African manufacturing facilities improved to 97% (2012: 96%) whilst the distribution facilities (98%) and the international operations (96%) maintained their scores. Bangalore and Bulawayo achieving average site ratings of 96% and 95%, respectively.
Factors measured included risk control, fire defence, security, emergency planning, health and safety, and motor fleet and transport vehicle safety.
COMMUNITIeSIn 2013 Adcock Ingram made donations and contributions of R6 million towards corporate social investment (CSI) projects.
Adcock Ingram’s partnership with the Smile Foundation has resulted in reconstructive surgery for 19 children this year, bringing the total number of beneficiaries of this surgery supported by the Group to 90 people in South Africa. ‘Operation Smile’ was extended to Malawi where 200 adults and children underwent reconstructive surgery.
New initiatives this year in the rural areas of the Eastern Cape included support for the Mercy Ships project for cataract surgeries at the Zithulele eye care centre and a new ablution block for Lutshaya High School.
A grant of R350 000 has been made to a new clinical research unit at the Red Cross Children’s Hospital. This clinical outpatient facility will manage children with infectious diseases and functions separately from the Research Centre for Adolescent and Child Health (REACH) at the hospital.
The Generics division’s Community Upliftment Programme (CUPS), is driven by community pharmacy initiatives in their own areas. The programme aims to make a sustainable difference to needy communities and embraces education, health, sport and safety projects.
Seventeen CUPS projects were supported countrywide during 2013. Beneficiaries included a donation of equipment for the 90 children attending the Refilwe School in the impoverished Lesedi community and a soup kitchen in Port Elizabeth that feeds over 250 children daily.
The Group has also made donations in kind to various organisations in South Africa and a donation of critical care products to the Lilongwe Hospital in Malawi.
In Zimbabwe, Datlabs’ employees donated their skills and time to raise funds for HIV/AIDS orphans in a high density area in Bulawayo.
NATURe OF CSI eXPeNDITURe
Critical Care
Clayville Wadeville R&D Midrand
2,0
1,5
1,0
0,5
0,0
0,77 0,75
1,51
1,90
1,08
Community Development (7%)Research (5%)Healthcare (27%)Nutrition and wellbeing (61%)
GRI: LA7,8

ADCOCK INGRAM INTEGRATED REPORT 2013
46
sustAiNABilitY CONTINUED
eNVIRONMeNTThe protection of the environment is central to the Group’s focus on social responsibility to create an awareness of the importance of reducing our carbon footprint and to ensure that our operations are conducted in an environmentally responsible manner.
The recent factory upgrades included a significant investment towards reducing the Group’s carbon footprint in terms of energy and water conservation measures.
In total, energy and water conservation efforts at the South African factories resulted in annual savings estimated at R11 million, with 54% contributed by the Aeroton facility, 27% by Wadeville, and the balance by Midrand and Clayville.
eNeRGYThe first industrial application of geothermal technology in South Africa was implemented at the new high-volume liquids facility at Clayville. This technology reduces energy requirements by using the earth’s constant underground temperature of approximately 16 degrees to warm, cool and ventilate buildings. This investment has resulted in a reduction in annual electricity consumption. Maximum monthly demand declined, reducing annual energy consumption by 528 000 KWA with an annual savings expected. This project was selected as a finalist in the Eskom-sponsored eta Award for innovation in energy conservation. The winner will be announced in 2014.
η(eta) is the Greek symbol for efficiency, hence the name of the Awards. The purpose of the eta Awards is to reward exceptional effort in the more efficient use of energy by individuals, students, companies or other institutions.
Other Group projects include the use of solar energy, low energy lighting and implementation of a regular maintenance programme for cooling towers, use of variable speed motors – thereby reducing energy consumption – and the installation of sensors for lights and air-conditioners in offices.
The Group responded to the dti’s initiative towards greener production in South Africa, driven by the Council for Scientific and Industrial Research’s (CSIR) National Cleaner Production Centre initiative. The CSIR-appointed international consultants conducted audits of Adcock Ingram’s sites during 2013. The recommendations from these audits which would further enhance energy and water conservations and reduce waste are currently being assessed based on a cost-benefit analysis.
WATeRCLAYVILLeIn addition to strides made with utilisation of waste water for domestic use, several initiatives are being implemented to reduce water usage. These include expansion of the reverse osmosis water run-off for domestic applications, the utilisation of run-off water from the reverse osmosis plant for chillers as well as validation of optimised cleaning-in-process (CIP) steps for all product recipes to minimise water usage at each step.
AeROTONThe Aeroton facility uses water as an ingredient (distilled and purified) in most hospital products and in many of the production processes such as sterilisation, cooling and heating. Several projects have been initiated to recover and re-use water in the sterilisation process, distillation water plant and other areas. These activities are expected to yield significant annual savings of up to 20 000 kL.
MIDRANDMetered boreholes have yielded water savings of over 7 million litres. A second borehole is planned in 2014 which will be connected to a chlorinator injection and monitoring system to use borehole water for domestic purposes. A 52 000-litre rain catchment facility is nearing completion which will be connected to the building management system to supplement the water supply to the irrigation system.
BANGALOReThis facility uses borehole water that is processed before use in manufacturing. There is an effluent treatment plant on site.
WADeVILLePlans are in process to implement a water recycling process at Wadeville during 2014.
WASTe MANAGeMeNTMIDRANDThe waste area has been upgraded and will be maintained to a clean environment. Waste is sorted with a separate skip for cardboard, yielding savings in waste removal costs.
Clean environment – an area that contains only a limited number of microorganisms and is free from obvious soil.
Plans include baling cardboard and plastic on site, which will yield further savings.
Baling – to compact recyclables such as aluminum, cardboard, paper, and plastic into blocks which can easily be stacked and transported.
WADeVILLeA waste and recycling management system has been implemented with an estimated 30% decrease in waste sent to landfill sites.
AeROTONSignificant steps have been taken towards the recovery and recycling of all processed scrap and rejected plastic. The waste is reground with the pellets being sold in bulk to plastic convertors for use in the manufacture of PVC products. In one such co-operative venture, a footwear company converts the reground pellets into mass-produced sandals. This initiative has reduced the environmental impact and supported the creation of 10 jobs and saved the Group the cost of destruction.
BANGALOReProduct and printed waste is managed by third parties. Product waste is removed by an environmentally friendly company and printed waste is destroyed by incineration.
eNVIRONMeNTAL AUDITAdcock Ingram undertakes an independent environmental audit as part of its risk management audit. Environmental elements that are measured include the management of water quality, waste, hazardous waste materials, packaging, energy, air quality and land quality management.
Satisfactory results were achieved in the Group’s independent environmental audit. The average rating for the sites audited was 94% (2012: 93%) with the South African manufacturing and distribution facilities achieving averages of 96% and 97%, respectively. The Bangalore facility in India was awarded a 76% rating (2012: 67%).

ADCOCK INGRAM INTEGRATED REPORT 2013
sustAiNABilitY CONTINUED
CARBON FOOTPRINTThe Carbon Footprint results, determined by “Carbon Calculated” are as follows:
Financialyear endedSeptember
2013
Financialyear endedSeptember
2012Tonnes Tonnes
Scope 1Company owned/controlled vehicles 3 684 1 289Stationary fuels 13 177 10 823Fugitive emissions (Kyoto) 33 84
Scope 2Electricity 50 538 34 934
Total Scope 1 and 2 67 432 47 130
Scope 3Business travel 4 684 1 761Employee commute 4 955 6 349Outsourced distribution 11 137 10 552(import and export)Packaging materials 20 612 26 143Paper use 70 83Waste 523 620Water (embedded CO2e) 628 357
Total Scope 3 42 609 45 865
Total Scope 1, 2 and 3 110 041 92 995
Non-Kyoto gas 2 130 1 848
Grand total 112 171 94 843
For the detailed carbon footprint report, refer to www.adcock.com
TRANSFORMATIONAdcock Ingram continues to be socially progressive with initiatives focused on training and development, job creation, enterprise development and community wellbeing to ensure that the Company maintains its leading position in the Pharmaceutical sector with a Level 3 BBBEE rating.
The management of transformation in line with the revised codes of good practice is a challenge. Efforts will be directed towards increasing disability equity through learnerships, strengthening dialogue with strategic BEE partners and alignment of the owner-driver scheme with the new codes. Engagement with key local suppliers and BEE partners will aim to ensure that they are aligned with the revised codes.
eNTeRPRISe DeVeLOPMeNTThe owner-driver enterprise development project has been extended with an additional two vehicles at Midrand. The project will be extended to Aeroton in 2014 by adding approximately 16 vehicles.
PReFeReNTIAL PROCUReMeNTThe proactive approach to increase business with qualifying enterprises yielded 16,20 points on the BBBEE scorecard, an improvement of 81%.
Total qualifying expenditure amounted to R2,1 billion of which 96,7% was spent with qualifying enterprises. Of this spend, 63% was with black-owned enterprises, with enterprises owned by black women accounting for 57%.
2014 FOCUSSustainable business growth is dependent on aligning the management of Human Capital with core business objectives based on a foundation of transformation, leadership effectiveness, total reward strategy, integrated learning and development, and building the culture.
Transformation is a key issue. The revised BBBEE codes are a challenge because the Company is largely reliant on imported raw materials and finished goods. Other issues include the introduction of priority elements based on ownership, skills development, and enterprise and supplier development. Every effort will be directed towards meeting the challenges of the revised Codes of Good Practice to retain our BBBEE status.
Focus must be placed on a continuous improvement process to conserve resources and thereby reduce the Company’s carbon footprint with particular attention to energy, water and waste management.
WheRe We hAVe SUCCeeDeD IN OUR OBJeCTIVeS• Greener production at the Clayville factory• Retained Level 3 BBBEE status• Expansion of the owner-driver programme• Talent management pipeline
WheRe We DID NOT AChIeVe OUR GOALS• Ability to attract highly competent people and meet Employment
Equity targets• The rising cost of attracting and retaining EE candidates• Appointment of people with disabilities• Appointment of black females at Senior Management level• Skills scarcity despite the focus on developing a pool of graduates
and learnerships• Formalised Mentoring and Coaching programmes to ensure the
transfer of skills
Company Name
Registration Number
VAT Number
Address
BBBEE Status Level Level 3
Level Qualification %
26.58% Black Ownership; 6.95% Black Women Ownership 1 100 Points 135%
Yes 2 85 but < 100 125%
138% 3 75 but < 85 110%
Issue Date 01/11/2012 4 65 but < 75 100%
Expiry Date 31/10/2013 5 55 but < 65 80%
Certificate Number ELC3356GENBB 6 45 but < 55 60%
Version Final 7 40 but < 45 50%
Applicable Scorecard Codes - Generic 8 30 but < 40 10%
Applicable BBBEE Codes Generic Codes Gazetted on 9 February 2007 0%
EmpowerLogic (Pty) Ltd
Reg. No. : 1995/000523/07
BBBEE Verification Agency
Per T Lombard
Member - Verification Committee
SANAS Accredited
BVA018
BEE Status
Enquiries
Tel:
EO: 19.63 points; MC: 4.64 points; EE: 6.69 points; SD: 10.81 points;
PP: 16.21 points; ED: 15 points; SED: 5 pointsElement Points Obtained
Black Ownership
Value Adding Vendor
BEE Procurement Recognition
BEE Procurement Recognition
Levels
086 111 4003
Non-Compliant <30
Broad Based Black Economic Empowerment Verification Certificate
A Consolidated Verification Certificate Issued to
Adcock Ingram Holdings Limited and Subsidiaries
Measured Entity (Full List of Entities Listed on Page 2 of Certificate)
2007/016236/07
See Page 2
1 New Road
Fax:
086 505 7284
www.empowerlogic.co.za
This certificate is the result of an independent and impartial verification of the BBBEE status of the measured entity measured against the Codes of Good
Practice on Broad Based Black Economic Empowerment. The objective of our verification is to verify the validity and accuracy of the BBBEE status
represented by the measured entity. EmpowerLogic is not responsible for ensuring completeness of information provided to support the BBBEE status.
Midrand
1685
Adcock Ingram Holdings Limited and Subsidiaries
Level 3 Contributor
Your Logical Empo we r men t Solu tion
Your Logical Empo we r men t Solu tion
47
Refer to www.adcock.com for the report by the Social, Ethics and Transformation Committee.

48
ADCOCK INGRAM INTEGRATED REPORT 2013
stAkehOlder ENGAGEMENT
Adcock Ingram recognises its responsibility to present a balanced and comprehensive assessment of the Group to all of its stakeholders as long-term sustainability objectives are supported through engaging with stakeholders to address matters of mutual interest. Stakeholder support or lack thereof may influence the Group’s performance.
KeY STAKehOLDeRS
hOW We eNGAGe WITh OUR STAKehOLDeRS ReASONS FOR eNGAGeMeNT
KeY TOPICS RAISeD BY STAKehOLDeRS
COMPANY’S ReSPONSe
ShARehOLDeRS AND INVeSTOR COMMUNITY
Media releases, Stock Exchange News Service (SENS)
Presentations subsequent to the interim and annual results publications
Meetings, including regular site tours, with investment analysts, institutional investors and journalists in South Africa, North America and Europe
Investor perception audits
Corporate website
To keep shareholders and the investment community updated on our financial and operational performance, strategy, risks and opportunities in a transparent way
To understand the expectations of the investor community and enhance our communication with it
CFR transaction and corporate activity
Delivering sustainable and market-related returns
Impact of the exchange rate on the business
Product launches
Product pipeline
Strategy
M&A
Page 17
Page 117
Page 29
Page 20
CUSTOMeRS/CONSUMeRS
Daily interaction with many of the Group’s customers through personal visits by our sales team, managers and executives
Annual Healthcare Summit
Continuing Professional Education
Customer surveys
Call Centre
Advertising
Consumer focus groups
Consumer education campaigns
Corporate website
Social media
To solicit feedback on our products and services, promote and provide education on our products, ensure effective product stewardship and obtain feedback on customer and consumer needs
To provide continuing professional education
Product quality and effectiveness
Long-term security of supply
Service delivery
CFR transaction and how it could impact on our relationship with customers
Page 22
Page 30
Page 32
Page 18
ReGULATORY AUThORITIeS AND GOVeRNMeNTS
Regular contact, including personal visits, with regulatory bodies, particularly the MCC
Proactive Government relations engagement strategy is in place for contact at executive and Board level with key Government Ministers and officials in various departments
Membership of various industry associations
To ensure that legislation does not impinge on our ability to provide South Africans with quality, affordable medicine
To facilitate registration of our products in all countries in which we operate
To maintain a viable and sustainable local pharmaceutical industry
CFR transaction
Accessibility and affordability of medicines
Product registrations
Investment in South Africa
Empowerment and transformation
Corporate Social Investment initiatives
Page 18
Page 20
Page 47
Page 45
GRI: 4.14 – 4.17, PR5, SO5

49
ADCOCK INGRAM INTEGRATED REPORT 2013
Key stakeholders have been identified based on their influence on the Group. The ultimate aim is to foster a positive business environment that facilitates business growth while building the Group’s image and brand as an ethical, responsible and concerned corporate citizen.
The Group aims to develop mutually beneficial relationships with its stakeholders, built on a foundation of effective communication strategies tailored to meet the needs of each stakeholder.
KeY STAKehOLDeRS
hOW We eNGAGe WITh OUR STAKehOLDeRS ReASONS FOR eNGAGeMeNT
KeY TOPICS RAISeD BY STAKehOLDeRS
COMPANY’S ReSPONSe
LOCAL COMMUNITIeS AND NGOs
Generics division’s community upliftment projects
Corporate Social Investment programme
To provide social upliftment and improve healthcare
To develop positive relationships with NGOs in the communities
Community Upliftment programmes Page 45
eMPLOYeeS AND UNIONS
Intranet, big-screens, newsletters, presentations and briefings, performance reviews, internal staff surveys
Performance Management system
Training and development initiatives
Site management/shop steward meetings
National Transformation Forum/site transformation forums
To communicate effectively on Group strategy, performance and developments
To develop a positive working relationship
To facilitate negotiations on conditions of employment for industry with direct influence on the workplace
To discuss, drive and monitor Employment Equity and skills development objectives and initiatives
To address operational issues affecting production and employees
To motivate staff and influence workplace performance
Provision of market-related remuneration and benefits
Job security
Ongoing training and development
Centralised bargaining
Workforce transformation
Page 50
Page 18
Page 43
Page 50
Page 44
SUPPLIeRS AND SeRVICe PROVIDeRS
Personal contact at executive and management level
To understand and address their concerns and ensure they adopt and adhere to required standards and service levels
Sustained demand and long-term relationships
Page 17
MULTI-NATIONAL PARTNeRS AND LICeNSORS
Personal contact and annual road shows
Ad hoc meetings
To ensure that the Group retains a high profile with existing and prospective business partners
Cost-effective sales and marketing
Regulatory and distribution capabilities
Page 32
MeDIA Distribution of press releases
Personal interviews with key executives and Board members
To build positive relationships with the media
To maintain a positive profile in the media
CFR transaction
Engagement on topical issues affecting the industry and the Company
Page 17
INDUSTRY GROUPS
Interaction and participation on PTG, SMASA and SAMED
To contribute to an industry viewpoint on regulatory issues and health policy to all healthcare stakeholders
CFR transaction
Sustainability and viability of the local pharmaceutical industry
Page 17
ADCOCK INGRAM INTEGRATED REPORT 2013
reMuNerAtiON REPORT50
ReMUNeRATION PhILOSOPhY AND POLICYWe recognise that we operate in a globally competitive environment and that our performance depends on the quality of our people. Adcock Ingram seeks to provide a level of remuneration that attracts, retains and motivates employees of the highest calibre. In order to attract, retain and motivate top level skills, it is necessary to acknowledge that such talent is in high demand, and that the cost is dependent on the supply and demand of these skills. Thus, to be competitive, monetary benefits must be in line with those offered in the market place.
Through the reward strategy, Adcock Ingram strives to provide employees with a remuneration package that is in line with our strategy and values, through a combination of benefits. The principle of “performance-based remuneration” is one of the cornerstones of our reward philosophy. Adcock Ingram’s reward philosophy is underpinned by sound remuneration management and governance principles that are promoted throughout the business to ensure consistent application.
SUMMARY OF KeY ReWARD PhILOSOPhIeSPerformance conditions are designed to:
• Align with the business strategy to maximise shareholder value;
• Ensure remuneration arrangements are equitable;
• Be consistent across the Group;
• Be fair and transparent; and
• Encourage long-term performance and sustainability.
Our total reward approach is integrated into our people management processes such as transformation, performance management, recognition, employee wellness and talent management. Rewards are set at levels that are relevant and competitive within the specific market.
Adcock Ingram promotes a total remuneration philosophy, where employees are rewarded through a mix of financial rewards, comprising elements such as remuneration (fixed and variable), benefits, employee wellness programmes, performance and recognition, development and career opportunity.
FIXeD ReMUNeRATIONPeRMANeNT eMPLOYeeSThe levels of basic remuneration are reviewed and revised annually. The criteria that have been adopted for determining pay increases are as follows:
• Experience and skills related to the position;
• Strategic impact of the position on the business;
• CPI (inflation);
• Market comparison/salary survey;
• Other market factors affecting our employees;
• Individual Performance Agreement (IPA) scores;
• Affordability; and
• Company performance.
Across the Group, employment positions are assessed using recognised evaluation systems in order to ensure the remuneration of a job is aligned to the relative value as compared to other jobs. Salary scales are determined using a unified pay structure which identifies a minimum and maximum range for each position and are reviewed annually. Movement along the salary scale within a job grade is driven by individual performance.
BARGAINING UNIT eMPLOYeeS42% of employees in South Africa, 65% in Zimbabwe and 22% of employees in the Indian Joint Venture belong to bargaining units. Remuneration for employees forming part of the bargaining unit is based on annual negotiations between the Company and unions. Salary increments are in accordance with the relevant settlement agreements for the given period. Bargaining unit staff members in South Africa were allocated a 7,75% increase, with effect from 1 July 2013, 5% effective 1 October 2012 for Zimbabwe employees and those in India were allocated a 9% increase, with effect from 1 April 2013. The Human Capital executive is responsible for wage negotiations in South Africa.
FIXeD TeRM CONTRACT ReMUNeRATIONEmployees who join the Company on a fixed term contract are remunerated at a total remuneration package (TRP) value equivalent to a permanent employee of the same grade and job title, based on the premise that such employment will be on the same terms as a permanent employee (with reference to working hours per month/shift). In India it is customary to remunerate an individual under a fixed term contract at approximately 80% of a permanent employee.
TeMPORARY WORKeR ReMUNeRATIONThe Company does employ temporary workers, mainly in the South African and Indian manufacturing plants, to provide flexibility to its workforce capacity as a result of fluctuations in demand, upgrades to facilities, tender awards and market volatility. Employees who join the Company on a temporary basis are remunerated on an hourly basis.
GRI: LA4

51
ADCOCK INGRAM INTEGRATED REPORT 2013
reMuNerAtiON REPORT
Remuneration consists of the following guaranteed components and is applicable to all levels in the organisation:
COMPONeNT OBJeCTIVe SOUTh AFRICA INDIA ReST OF AFRICA
Basic salary To align salaries with roles/performance
For comparative roles, ensure internal pay equity. Salaries are benchmarked against the market
Annual salary increases are approved by the Remuneration Committee
Management is given discretion to apply increases within the stipulated range to staff members dependent on individual performance
The average increase for 2013 was: 6% 13% 5%
Salary increases for the forthcoming financial year (2014) will range as follows:
From 0% to 11,5% dependent upon individual performance
From 4% to 15% dependent upon individual performance
From 0% to 15% dependent upon individual performance
The intended overall increase: 7,2% 9% 12,5%
Provident fund
To ensure financial security and dignity to employees and their beneficiaries.
The fund covers group life, disability cover and funeral benefits
For bargaining unit employees, contributions by employees vary between 7% and 7,5% and the contribution by the employer from 10% to 11% of the basic salary, as negotiated with the unions
For non-bargaining unit employees, contributions are currently 18% of retirement funding income, which is set at not less than 75% of the total remuneration package
This is governed by statutory requirements in India
Contributions are currently 12% of the basic salary at all levels
In Kenya, employer contributions amount to 10% of basic pay and employees can contribute voluntarily
In Zimbabwe, employer contributions amount to 15% and employee contributions to 7% of the basic salary
In Ghana, equal contributions (5% of the basic salary) are made by the employer and employees. There is also a provision for the statutory pension scheme where employees contribute 5,5% and the company 13% of basic salary
Medical aid fund
To cater for ill-health and hospitalisation
Optional, but highly encouraged
Adcock Ingram offers a range of independent medical aid schemes as choices for employees
Compulsory
Employees are covered under Group Personal Accident and Group Medi-claim
Compulsory
Zimbabwe and Kenya have contributory medical schemes. In Ghana employees rely on a statutory scheme (National Health Insurance)

reMuNerAtiON REPORT CONTINUED
52
ADCOCK INGRAM INTEGRATED REPORT 2013
VARIABLe ReMUNeRATIONThe purpose of variable remuneration is to maximise the performance of people, promote a culture of excellence and provide rewards that attract and retain staff. This includes:
• Short-term incentives
• Commission
• Recognition programme
• Long-term incentives
ShORT-TeRM INCeNTIVeSAnnual incentive bonuses are paid if key performance targets, including but not limited to financial targets, are met. These targets are directly linked to the achievement of the Group’s targets and the goals of individual employees.
All employees, excluding those in the bargaining units and sales staff, participate in the Group’s incentive bonus scheme. Bonuses are conditional and are paid annually, subject to the achievement of Group and divisional targets combined with key performance indicators agreed to between the CEO and the Remuneration Committee.
For the year ended 30 September 2013, no short-term incentive will be paid, as the Group failed to meet the financial targets set. This was also the case in the previous year.
COMMISSIONSEmployees in sales are incentivised through sales target arrangements and receive incentives if certain sales targets are achieved during the year.
ReCOGNITION PROGRAMMeDuring June 2013, the “Aditude” rewards and recognitions programme was launched in South Africa which encourages more immediate rewarding of excellent performance and achievement. The system is creative, flexible and meaningful and includes once-off rewards which are convertible into cash awards for significant and outstanding performance. Expansion of the programme into the other territories is planned for the future.
Basic salary and benefits (compulsory and non-compulsory)
Fixed remuneration
COMPONeNTS OF TOTAL ReMUNeRATION FOR PeRMANeNT eMPLOYeeS
Incentives are based on Group and individual performance
criteria (paid if targets are met)
Long-term incentives are aimed at retention of critical
employees and empowerment
Basic salaries are aligned to roles/performance
Short-term incentive plan Long-term incentive plan
TOTAL REMUNERATION
Variable remuneration

53
ADCOCK INGRAM INTEGRATED REPORT 2013
LONG-TeRM INCeNTIVeSShARe OPTION SCheMeAdcock Ingram has a share option scheme in place for executives, key management and other critical employees in the Group. It was introduced in 2008. Long-term share incentive participation helps to facilitate alignment between the interests of management and shareholders.
In terms of the rules of the scheme, the grant price of an option is determined using the weighted average closing price of the previous 30 trading days. The cash settlement amount of an option is equal to the difference between the closing price of Adcock Ingram’s shares on the date upon which an option is exercised and the offer price. The participants receive the amount due as a cash payment, net of taxation.
The Remuneration Committee recommends the granting of options for critical or key talent in January of each year, for approval by the Board of Adcock Ingram.
This scheme is “cash settled” with one-third of the options becoming vested on each of the third, fourth and fifth anniversaries of the relevant grant date. The options expire six years from the grant date if not exercised. For example:
BLACK MANAGeRS ShARe TRUSTIn terms of the Tiger Brands Limited BEE transaction implemented in 2005, vested rights were issued to black managers of the Tiger Brands Group (including the Adcock Ingram Group).
The allocation of vested rights entitles beneficiaries to receive shares after making capital contributions to the Trust at any time after the defined lock-in period, i.e. from 1 January 2015. These vested rights are non-transferable.
MPhO eA BOPheLOAdcock Ingram implemented its Black Economic Empowerment staff scheme in South Africa during 2011. Initial share unit allocations totalling 5 159 000 were made to qualifying staff in March 2011, in accordance with the scheme rules and the respective trust deed. Additional allocations of 321 300 units were made during March 2013 (March 2012: 403 200) to qualifying employees. For the next three years, additional tranches will be issued to qualifying employees on the anniversary date.
This scheme is “equity settled” and although some share option allocations vested on 31 March 2013, they can only be exercised from 31 March 2018 onwards.
January 2013 Award
January 2016 Vesting Date 1/3
January 2017 Vesting Date 2/3
January 2018 Vesting Date 3/3
January 2019 Options expire
31 March 2011 1st Tranche grant
31 March 2012 2nd Tranche grant 1/5 1st Tranche vest
31 March 2013 3rd Tranche grant2/5 1st Tranche vest1/4 2nd Tranche vest
31 March 2014 4th Tranche grant 3/5 1st Tranche vest 2/4 2nd Tranche vest 1/3 3rd Tranche vest
31 March 2015 5th Tranche grant4/5 1st Tranche vest 3/4 2nd Tranche vest2/3 3rd Tranche vest1/2 4th Tranche vest
31 March 2016 All Options Vest
31 March 2018 Exercise Date
For more details on the share schemes, refer to Annexure B.

ADCOCK INGRAM INTEGRATED REPORT 2013
reMuNerAtiON REPORT CONTINUED
54
NON-eXeCUTIVe DIReCTORS’ ReMUNeRATIONBoard fees paid to non-executive directors are based on various market surveys conducted by Adcock Ingram to ensure that they are market related, based amongst others on the directors’ skills, years of experience, etc. The survey is conducted on annual basis and reviewed by the Remuneration Committee.
The recommendation of the Remuneration Committee on the proposed fees is submitted to the Board for consideration before being proposed to shareholders for consideration and approval at the Annual General Meeting, currently held in January of each year. If approved, the fees become effective on 1 February.
During 2013, the Independent Board was constituted in terms of the Companies Act, following the submission of an unsolicited letter from the Bidvest Group proposing a scheme of arrangement to acquire 60,0% of the entire issued share capital of the Group. The independent Board constituted a working committee of six independent directors with the authority to act for the Independent Board and to brief the Independent Board from time to time. The meetings of the Independent Board and its working committee are considered to be special board meetings and members were paid R13 000 per meeting for meetings which lasted in excess of three hours.
ReMUNeRATION
2013R’000
2013R’000
2013R’000
2012R’000
Regularboard
meetings
Independentand special
boardmeetings Total Total
Mokhele 974 195 1 169 967Lesoli 267 39 306 298Raphiri 310 26 336 316Schönknecht 373 195 568 334Thompson 480 182 662 432Diack* 270 – 270 542Stewart 540 156 696 542Makwana 410 143 553 261Haus 328 169 497 109
3 952 1 105 5 057 3 801
* Resigned 22 March 2013.
Non-executive directors receive no benefits from their office other than fees and do not participate in the Group’s incentive bonus plan or any of its share option schemes.
CURReNT FeeSCurrent annual fees paid are as follows:
R*
Board Chairman 973 875Member 222 823
Audit Committee Chairman 211 470Member 105 735
Risk Committee Chairman 211 470 Member 105 735
RemunerationCommittee Chairman 86 814
Member 55 094
Social, ethics and Transformation Committee Chairman 81 472 Member 44 075
Special meeting** Attendee 13 000
* The fees have remained unchanged since 1 February 2012.** The fee for special meetings is only paid for meetings exceeding three hours
in duration.
No proposal to increase the fees will be tabled at the Annual General Meeting in January 2014.
TeRMS FOR NON-eXeCUTIVe DIReCTORSAll non-executive directors have been elected or appointed on fixed terms of three years, subject to at least one-third of the directors retiring by rotation at the Annual General Meeting held in each year and being eligible for re-election at the same meeting. Between AGM’s the Board may make interim appointments either to fill a casual vacancy or to appoint additional members to the Board. Any person so appointed to fill a casual vacancy or as an addition to the Board shall retain office only until the next Annual General Meeting of the Company and shall then retire and be eligible for re-election. There is no limitation on the number of times a non-executive director may stand for re-election. Proposals for the re-elections are based on individual performance and contribution.
ShARehOLDINGS There were no direct or indirect beneficial holdings in the current or prior year.
For more details about meeting attendance, refer to pages 10 and 11.

ADCOCK INGRAM INTEGRATED REPORT 2013
55
SeRVICe CONTRACTSThe Company policy is to employ each executive director, senior manager and
employee in a critical position under a service contract which is subject to a one or two months’ notice period. The contract provides for salary to be paid for any unexpired period of notice. All other employees are on a 30-day notice period.
ReTeNTION AGReeMeNTSAs part of the Group’s strategy to retain highly mobile and talented employees,
the Group selectively, under exceptional circumstances, enters into agreements in terms of which retention payments are made. Retention payments must be repaid
if the individual concerned leaves within a stipulated period. Both the executive directors and certain critical employees are currently subject to retention
agreements, expiring on the earlier of June 2014 or the completion of a potential transaction, including all regulatory approvals, which will result in a change
of control of the Group.
eXeCUTIVe AND KeY MANAGeMeNT ReMUNeRATIONThe executive and key management’s remuneration is structured to include guaranteed remuneration, and short-term and long-term incentives to drive performance. The level of guaranteed remuneration aims to competitively attract high calibre leadership.
The short-term incentive component rewards employees for achieving key performance targets, based on Group and individual performance criteria, as agreed upon at the start of each financial year.
The long-term share incentive scheme is a retention mechanism for key employees only, as well as linking executive reward with the Group’s performance.
eXeCUTIVe DIReCTORS’ ReMUNeRATIONThe Group aims to adhere to the broad guidelines of executive remuneration set out in King III. The overall principles applied comprise:
• Establishment of an appropriate and competitive balance between fixed and variable remuneration structure to achieve performance excellence;
• Establishment of a performance-oriented culture with a pay-for-performance approach that aligns with sustainable shareholder value;
• Appropriate use of market and industry benchmarks to ensure competitive remuneration aligned to the market median; and
• Drive sustainable business results through short-term and long-term performance-based incentives.
The executive directors are currently regarded as the only prescribed officers of the Group.
VARIABLe ReMUNeRATIONShORT-TeRM INCeNTIVeSFor the 2013 financial year, executive directors could earn up to 115% of their total annual guaranteed remuneration. This remains unchanged for the 2014 financial year.
In respect of the year under review no short-term incentive will be paid to the executive directors as financial targets set at the start of the year have not been met. Similarly no incentives were paid in relation to the 2012 financial year.
OTheR FeeSNo fees for services as directors, consulting or other fees were paid to the executive directors in the current or prior year. Directors do not participate in any commission, gain or profit-sharing arrangements.

56
ADCOCK INGRAM INTEGRATED REPORT 2013
JJ LOUWReMUNeRATION
2013R’000
2012R’000
Increase%
Salary 3 587 3 297Contributions to defined benefit contribution plan 658 652
Gross remuneration 4 245 3 949 7,5
JJ Louw received a retention bonus to the amount of R2 122 750 during the year, of which two-thirds has been expensed through profit or loss.
LONG-TeRM INCeNTIVeSDetails of share options in Adcock Ingram granted are as follows:
Offer dateOffer price
R
Balance at the beginning
of the year
exercisedduring
the year
Grantedduring
the year
Balanceat the end
of the year
equity-settled options 29/01/2004 13,62 7 700 – – 7 70025/01/2005 19,96 11 400 – – 11 400
19 100 – – 19 100
Cash-settled phantom options 22/01/2008 34,69 25 729 – – 25 72901/04/2008 28,27 63 212 – – 63 21201/10/2008 34,78 101 799 – – 101 79902/01/2009 33,38 106 099 – – 106 09904/01/2010 51,12 134 969 – – 134 96903/01/2011 62,29 119 627 – – 119 62703/01/2012 60,15 131 316 – – 131 31602/01/2013 53,52 – – 158 651 158 651
682 751 – 158 651 841 402
OPTIONS eXeRCISeDDetails of options exercised are as follows:
Offer dateOffer price
R
exerciseprice
RNumber
of options
Gain realisedon exercising
of options(1)
R
2012 26/01/2006 31,38 61,98 64 323 1 968 36122/01/2007 35,43 62,39 70 994 1 913 65722/01/2008 34,69 62,59 51 459 1 435 78301/04/2008 28,27 61,98 31 605 1 065 32201/10/2008 34,78 61,98 50 800 1 381 76002/01/2009 33,38 63,20 52 900 1 577 478
322 081 9 342 361
(1) Amounts are shown before taxation.
ChARGe IN ReSPeCT OF LONG-TeRM INCeNTIVe SCheMe AWARDS*The following charges were expensed in the statement of comprehensive income during the year under review, in terms of IFRS 2:
2013R’000
2012R’000
IFRS 2 charges 2 344 1 164
ShARehOLDINGSNumber of shares
2013 2012
Direct and indirect 39 300 39 300
All shares held by JJ Louw are subject to loans.
reMuNerAtiON REPORT CONTINUED
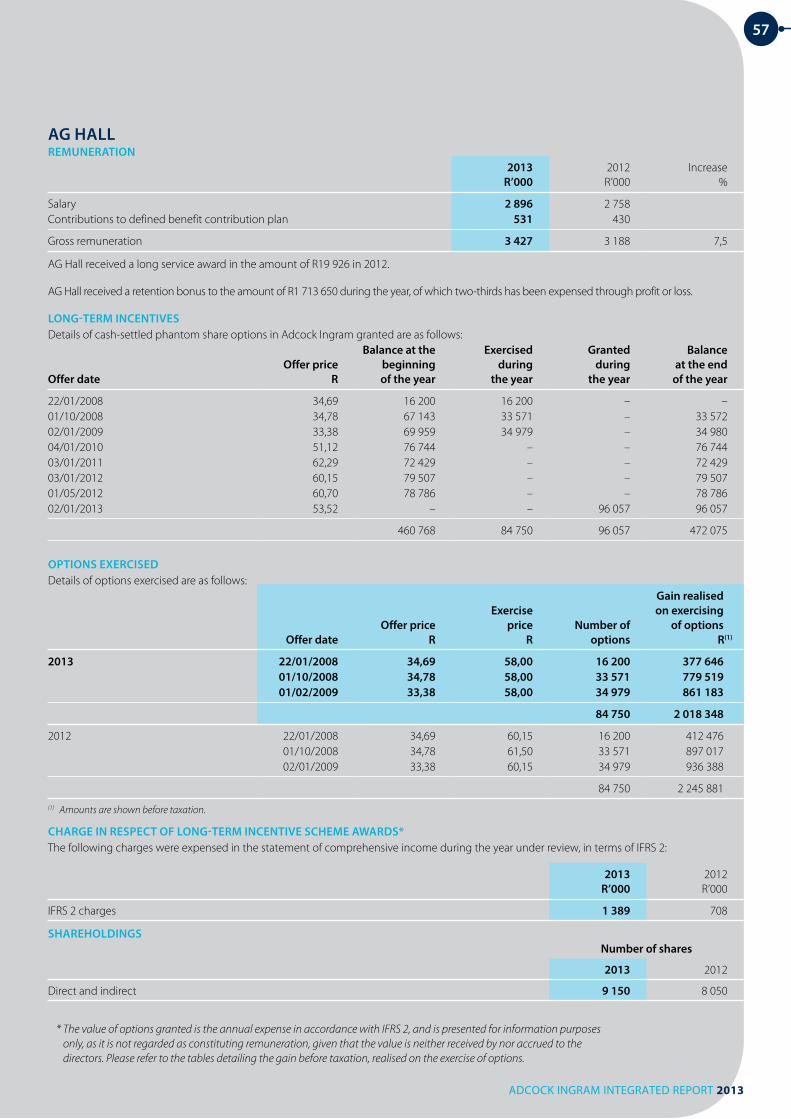
57
ADCOCK INGRAM INTEGRATED REPORT 2013
AG hALLReMUNeRATION
2013R’000
2012R’000
Increase%
Salary 2 896 2 758Contributions to defined benefit contribution plan 531 430
Gross remuneration 3 427 3 188 7,5
AG Hall received a long service award in the amount of R19 926 in 2012.
AG Hall received a retention bonus to the amount of R1 713 650 during the year, of which two-thirds has been expensed through profit or loss.
LONG-TeRM INCeNTIVeSDetails of cash-settled phantom share options in Adcock Ingram granted are as follows:
Offer dateOffer price
R
Balance at thebeginningof the year
exercisedduring
the year
Grantedduring
the year
Balanceat the end
of the year
22/01/2008 34,69 16 200 16 200 – –01/10/2008 34,78 67 143 33 571 – 33 57202/01/2009 33,38 69 959 34 979 – 34 98004/01/2010 51,12 76 744 – – 76 74403/01/2011 62,29 72 429 – – 72 42903/01/2012 60,15 79 507 – – 79 50701/05/2012 60,70 78 786 – – 78 78602/01/2013 53,52 – – 96 057 96 057
460 768 84 750 96 057 472 075
OPTIONS eXeRCISeDDetails of options exercised are as follows:
Offer dateOffer price
R
exercise price
RNumber of
options
Gain realisedon exercising
of optionsR(1)
2013 22/01/2008 34,69 58,00 16 200 377 64601/10/2008 34,78 58,00 33 571 779 51901/02/2009 33,38 58,00 34 979 861 183
84 750 2 018 348
2012 22/01/2008 34,69 60,15 16 200 412 47601/10/2008 34,78 61,50 33 571 897 01702/01/2009 33,38 60,15 34 979 936 388
84 750 2 245 881(1) Amounts are shown before taxation.
ChARGe IN ReSPeCT OF LONG-TeRM INCeNTIVe SCheMe AWARDS*The following charges were expensed in the statement of comprehensive income during the year under review, in terms of IFRS 2:
2013R’000
2012R’000
IFRS 2 charges 1 389 708
ShARehOLDINGSNumber of shares
2013 2012
Direct and indirect 9 150 8 050
* The value of options granted is the annual expense in accordance with IFRS 2, and is presented for information purposes only, as it is not regarded as constituting remuneration, given that the value is neither received by nor accrued to the directors. Please refer to the tables detailing the gain before taxation, realised on the exercise of options.

58
ADCOCK INGRAM INTEGRATED REPORT 2013
KeY MANAGeMeNTKey management comprises the Executive Committee of the Group including the executive directors. As the executive directors’ details have been disclosed separately, they are excluded from the figures below. The Executive Committee in 2013 reflects the salaries of 18 executives, compared to 6 executives up to July 2012, which expanded to 15 executives in August 2012.
The details below show the annual remuneration of key management for the period the incumbents held the position during the year and might therefore not be comparable:
FIXeD ReMUNeRATION2013
R’0002012R’000
Salary 26 152 12 209Contributions to defined benefit contribution plan 3 894 1 733
Gross remuneration 30 046 13 942
Certain members of key management received retention bonuses to the amount of R8 503 175 during the year, of which two-thirds has been expensed through profit or loss.
VARIABLe ReMUNeRATIONShort-term incentivesFor the 2013 financial year, key management could earn up to 74% of their total annual guaranteed remuneration as a short-term incentive. This remains the same for the 2014 financial year.
In respect of the year under review, as with the 2012 financial year, no short-term incentive will be paid to key management as financial targets set at the start of these years were not met.
Long-term incentivesKey management does not have any equity-settled options outstanding.
Details of cash-settled share options in Adcock Ingram granted to key management are set out below:
Offer dateOffer price
R
Balance at thebeginningof the year
Grantedduring
the year
exercisedduring
the year
Forfeitedduring
the year
Balanceat the end
of the year
22/01/2008 34,69 43 517 (23 188) – 20 32901/10/2008 34,78 170 710 (54 109) (8 986) 107 61502/01/2009 33,38 179 063 (45 271) (9 363) 124 42904/01/2010 51,12 197 496 (14 061) (27 547) 155 88801/08/2010 51,12 25 430 – 25 43003/01/2011 62,29 213 422 (27 635) 185 78726/09/2011 60,38 29 811 – 29 81101/10/2011 61,30 39 152 – 39 15203/01/2012 60,15 329 749 (36 909) 292 84001/05/2012 60,70 82 373 – 82 37301/10/2012 59,56 26 666 – 26 66602/01/2013 53,52 516 248 (59 925) 456 32301/05/2013 60,55 79 273 – 79 273
1 310 723 622 187 (136 629) (170 365) 1 625 916
reMuNerAtiON REPORT CONTINUED

59
ADCOCK INGRAM INTEGRATED REPORT 2013
OPTIONS eXeRCISeDDetails of options exercised by key management are as follows:
Offer date Offer priceR
exercise priceR
Number ofoptions
Gain realisedon exercising
of options(1)
R
2013 Cash-settled options 22/01/2008 34,69 60,21 23 188 591 799 01/10/2008 34,78 58,71 54 109 1 294 614 02/01/2009 33,38 59,08 45 271 1 163 489 04/01/2010 51,12 61,73 14 061 149 241
136 629 3 199 143
2012 Cash-settled options 22/01/2007 35,43 62,21 10 641 284 95022/01/2008 34,69 62,21 11 435 314 70801/10/2008 34,78 61,26 31 894 844 463
02/01/2009 33,38 62,74 33 282 930 596
87 252 2 374 717
(1) Amounts are shown before taxation.
ChARGe IN ReSPeCT OF LONG-TeRM INCeNTIVe SCheMe AWARDSThe following charges relating to key management were expensed in the statement of comprehensive income during the year under review, in terms of IFRS 2:
2013R’000
2012R’000
Key Management 5 961 853
TOP ThRee eARNeRSThe following resolution has been taking by the Board:
“The Company will comply with the requirement of section 30(4) of the Companies Act to disclose remuneration of directors (non-executive and executive) in its annual financial statements and in the manner set out in sections 30(4)(b) to (e)
of the Companies Act and with King III to the extent that it requires disclosure of the remuneration for the three most highly paid employees, who are not directors
of the Company.”
In light of the individual remuneration information that is reported and the cost of revealing competitive information, the Board has resolved that it will report on the remuneration of the three highest earning persons (excluding the executive
directors), collectively, rather than individually.
2013R’000
2012R’000
Salary 6 013 5 502Contributions to defined benefit contribution plan 925 917
Gross remuneration 6 938 6 419
The top three earners received retention bonuses to the amount of R3 166 800, of which two-thirds has been expensed through profit or loss.

ADCOCK INGRAM INTEGRATED REPORT 2013
The Group’s key risks are classified based on impact and probability, and categorised as being uncontrollable, able to influence or controllable. An overview of the Group’s key risks and mitigating activities is presented below:
RISK MANAGeMeNT OR CONTROLTRADING/CONSUMeRData indicates that South African consumers are still heavily indebted and trading remains slow
Sales and marketing investment continued behind major brands
Portfolio and geographical diversification
Regular meetings with advisors to assess changes in markets
INDUSTRY CONSOLIDATIONLocal and international industry consolidation can put pressure on the business at a customer, principal and entity level
Regular monitoring of international and local corporate activity, and geographical diversification in emerging markets continues, primarily Africa and India
PORTFOLIO/PRODUCT MANAGeMeNTInvestment in productive and innovative pipelines through in-house development, partnering and acquisition strategies to ensure sustainability
Reliance on licensors and agencies for a significant portion of revenue
Ageing formulations
Long lead times for MCC approval of new product registrations
Stringent regulatory environment
Adcock Ingram continues to interact with multinationals to gain partnership, co-promotion and distribution agreements
Extending our footprint into new markets, e.g. Rest of Africa and India
Diversification in over the counter products, e.g. well-being and personal care
Reformulation programme in place for older formulations
Identifying and assessing international acquisition and partnering opportunities
Innovation is a critical outcome for our research and development facilities, now extended to India
COMPeTING FOR TALeNT AND KeY PeRSONNeL Skills shortages and ability to recruit top talent in certain areas of the business, exacerbated by the drive to employ suitably qualified employment equity candidates, and current corporate activity
Retention of key employees with significant experience and expertise in the industry
Retention strategies have been implemented, including mentorship programmes and comprehensive wellness programmes, a formal talent review process, comprehensive wellness programmes and performance reviews
Graduate development programme implemented to fast-track and enhance depth of managerial talent
PACe OF TRANSFORMATIONParticipation in the meaningful transformation of our society is critical for the sustainability of our business
Customer pressure to do business with transformed entities is increasing in the private sector
Revised Codes of Good Practice
Further staff share allocations made during the year relating to the BEE scheme
Level 3 BBBEE status maintained
Social, Ethics and Transformation Committee of the Board monitors all elements of the scorecard
Central procurement monitors suppliers’ BEE ratings
Employment Equity targets in place
Owner-driver scheme extended during 2013
SAFeTY AND SeCURITYCriminal activity involves monetary risk and the safety of employees and products
Ongoing liaison with SAPS, Ethics hotline, ongoing review and monitoring of safety and security measures
eNVIRONMeNTAL ISSUeSThe need to reduce water and energy use, and carbon emissions
Waste management
Energy audits conducted
Impact on biodiversity being explored
Environmental policy and management system introduced
FACILITIeSPotential disruption in supply
Continuous supply from third party manufacturers
Significant plant upgrade and build programme now completed
Annual review of insurance strategy and portfolio
Increased focus on validation and quality control
ITAdequacy and effectiveness of IT governance, and integration of IT systems
Formal disaster recovery plans and back-up strategies are in place
IT structures are in place to provide support to all operations
risk MANAGEMENT60
COM
MeR
CIA
LSU
STA
INA
BILI
TY

61
ADCOCK INGRAM INTEGRATED REPORT 2013
COM
PLIAN
CeFIN
AN
CIAL
RISK MANAGeMeNT OR CONTROLMeDICINe ReGULATORYThe pharmaceutical industry remains a highly regulated environment and Adcock Ingram must adhere to all relevant quality standards
All facilities have been or are in the process of being upgraded to PIC/S standards
All South African facilities will seek international accreditations
Rigorous quality standards are applied
External audits conducted on regulatory compliance
LeGISLATIVe eNVIRONMeNTPrice controls, including potential international benchmarking and capping of logistics fees
Adcock Ingram is an active participant in industry organisations and proactively engages with Government
The Group actively communicates legislative requirements across the business, conducting training for directors and staff on legislative issues
PRODUCT CONTAMINATION, ReCALL AND LIABILITYConsequences of adverse drug effects, including monetary loss and reputational damage
Product liability insurance is up to date
Crisis management plans developed
Increased focus on quality assurance
Manufacturing complexity reduced at South African sites
SUPPLY AND COST PReSSURe There are a limited number of suppliers of active pharmaceutical ingredients, and most of these supply in a foreign-denominated currency
Product sales mix evolving with reduction in margins
Regulated price increases not keeping pace with input cost increases
Stockholding of strategic active ingredients maintained
Forward cover in place on all imports
Cost reduction and continuous improvement programmes in place
Central procurement function negotiates all significant cost inputs
FOReIGN eXChANGeCurrency volatility and the recent Rand weakness impact on purchase of active ingredients and finished goods sourced internationally
Forward cover taken on all imports
Management performs weekly reviews of the Group’s foreign exchange exposure
Trading/ConsumerPortfolio/Product managementForeign exchangeSupply and cost pressureIndustry consolidation
Safety and security
Facilities Medicine regulatory
ITPace of transformationenvironmental
Legislative environment
Competing for talent
PRO
BABI
LITY
IMPACT
MeDIUM hIGhLOW
Product contamination
hIGh
MeDIUM
LOW
GRI: 1.2

62
ADCOCK INGRAM INTEGRATED REPORT 2013
gri TABLEGRI DeSCRIPTION ReFeReNCe IN RePORTS AND WeBSITeSTRATeGY AND ANALYSIS 1.1 Statement from executive Leadership statement1.2 Key impacts, risks and opportunities Leadership statement, Risk managementORGANISATIONAL PROFILe 2.1 – 2.10 General organisational details About this report, Our profile, Recognition in our industry, 2013 highlights,
Business model, Supply chain, Operational overviews, Financial summary, Executive Committee, Board and governance structure, Annual financial statements
RePORT PARAMeTeRS 3.1 – 3.11 Report scope Scope and boundary of this report, Reporting principles GRI CONTeNT INDeX 3.12 Profile of the report – including
implementation of GRI principlesGRI reference table
ASSURANCe 3.13 External assurance AssuranceGOVeRNANCe4.1 – 4.3 Adcock structure and governance Executive Committee, Board and governance structure4.4 – 4.10 Overarching policies and management
systemsOur vision, Leadership statement, Corporate governance, Sustainability, Stakeholder engagement, Remuneration report, Risk management
COMMITMeNTS TO eXTeRNAL INITIATIVeS 4.11 – 4.13 Memberships and associations Stakeholder engagement, Risk managementSTAKehOLDeR eNGAGeMeNT 4.14 – 4.17 Identification, type and frequency of
stakeholder engagementStakeholder engagement
eNVIRONMeNTAL PeRFORMANCe INDICATORS EN1 – 2 Material use(1) 2013 highlightsEN3 – 10 Energy use, Water use 2013 highlights, Operational overviews, SustainabilityEN11 – 15 Biodiversity Operational overviewsEN16 – 25 Emissions, effluents and waste Sustainability, WebsiteEN26 – 27 Products and services(2)
EN28 – 30 Compliance, transport, overall(3) SustainabilitySOCIAL PeRFORMANCe INDICATORS HuMAn RIGHTS HR1 – 11 Stakeholder engagement, Operational overviews, SustainabilityLABOuR PRACTICES AnD DECEnT wORk COnDITIOnS LA1 – 3 Employment Sustainability, Remuneration reportLA4 – 5 Labour/Management relations Stakeholder engagement, Sustainability, Remuneration reportLA6 – 9 Occupational health and safety Sustainability, WebsiteLA10 – 12 Training and education Sustainability, WebsiteLA13 Diversity and equal opportunity Sustainability, WebsiteLA14 Equal remuneration for women
and menSustainability, Website
SOCIETy SO1, 9 – 10 Local community Sustainability overview, Risk managementSO2 – 4 Corruption(2)
SO5 – 6 Public policy Website (list of policies), Stakeholder engagement, Sustainability SO7 Anti-competitive behaviour(4) Corporate governance, Code of EthicsSO8 Compliance Corporate governancePRODuCT RESPOnSIBILITy PR1 – 2 Customer health and safety Sustainability, Website (Health and wellness), drug management
and developmentPR3 – 5 Product and service labelling Operational overviews, Website (Health and wellness)PR6 – 9 Marketing communications, Customer
privacy, ComplianceOperations overviews, Website (Health and wellness), Website (Brands)
ECOnOMIC PERFORMAnCE InDICATORS EC1 – 4 Economic performance 2013 highlights, Financial summary, Remuneration report, Risk management,
Annual financial statementsEC5 – 7 Market presence Operational overviewsEC8 – 9 Indirect economic impacts Operational overviews, Stakeholder engagement, Sustainability,
Risk management
(1) not all elements are made public(2) Data currently not available
(3) no fines have been received or paid(4) Adcock Ingram has not engaged in anti-competitive behaviour

ADCOCK INGRAM INTEGRATED REPORT 2013
AN
Nu
Al
finan
cial
sta
tem
entsGRI DeSCRIPTION ReFeReNCe IN RePORTS AND WeBSITe
STRATeGY AND ANALYSIS 1.1 Statement from executive Leadership statement1.2 Key impacts, risks and opportunities Leadership statement, Risk managementORGANISATIONAL PROFILe 2.1 – 2.10 General organisational details About this report, Our profile, Recognition in our industry, 2013 highlights,
Business model, Supply chain, Operational overviews, Financial summary, Executive Committee, Board and governance structure, Annual financial statements
RePORT PARAMeTeRS 3.1 – 3.11 Report scope Scope and boundary of this report, Reporting principles GRI CONTeNT INDeX 3.12 Profile of the report – including
implementation of GRI principlesGRI reference table
ASSURANCe 3.13 External assurance AssuranceGOVeRNANCe4.1 – 4.3 Adcock structure and governance Executive Committee, Board and governance structure4.4 – 4.10 Overarching policies and management
systemsOur vision, Leadership statement, Corporate governance, Sustainability, Stakeholder engagement, Remuneration report, Risk management
COMMITMeNTS TO eXTeRNAL INITIATIVeS 4.11 – 4.13 Memberships and associations Stakeholder engagement, Risk managementSTAKehOLDeR eNGAGeMeNT 4.14 – 4.17 Identification, type and frequency of
stakeholder engagementStakeholder engagement
eNVIRONMeNTAL PeRFORMANCe INDICATORS EN1 – 2 Material use(1) 2013 highlightsEN3 – 10 Energy use, Water use 2013 highlights, Operational overviews, SustainabilityEN11 – 15 Biodiversity Operational overviewsEN16 – 25 Emissions, effluents and waste Sustainability, WebsiteEN26 – 27 Products and services(2)
EN28 – 30 Compliance, transport, overall(3) SustainabilitySOCIAL PeRFORMANCe INDICATORS HuMAn RIGHTS HR1 – 11 Stakeholder engagement, Operational overviews, SustainabilityLABOuR PRACTICES AnD DECEnT wORk COnDITIOnS LA1 – 3 Employment Sustainability, Remuneration reportLA4 – 5 Labour/Management relations Stakeholder engagement, Sustainability, Remuneration reportLA6 – 9 Occupational health and safety Sustainability, WebsiteLA10 – 12 Training and education Sustainability, WebsiteLA13 Diversity and equal opportunity Sustainability, WebsiteLA14 Equal remuneration for women
and menSustainability, Website
SOCIETy SO1, 9 – 10 Local community Sustainability overview, Risk managementSO2 – 4 Corruption(2)
SO5 – 6 Public policy Website (list of policies), Stakeholder engagement, Sustainability SO7 Anti-competitive behaviour(4) Corporate governance, Code of EthicsSO8 Compliance Corporate governancePRODuCT RESPOnSIBILITy PR1 – 2 Customer health and safety Sustainability, Website (Health and wellness), drug management
and developmentPR3 – 5 Product and service labelling Operational overviews, Website (Health and wellness)PR6 – 9 Marketing communications, Customer
privacy, ComplianceOperations overviews, Website (Health and wellness), Website (Brands)
ECOnOMIC PERFORMAnCE InDICATORS EC1 – 4 Economic performance 2013 highlights, Financial summary, Remuneration report, Risk management,
Annual financial statementsEC5 – 7 Market presence Operational overviewsEC8 – 9 Indirect economic impacts Operational overviews, Stakeholder engagement, Sustainability,
Risk management
64 Directors’ responsibility for and approval of the annual financial statements
64 Certificate by Company Secretary
65 Independent auditor’s report to the members of Adcock Ingram Holdings Limited
66 Audit Committee report
68 Directors’ report
70 Consolidated statements of comprehensive income
71 Consolidated statement of changes in equity
72 Consolidated statements of financial position
73 Consolidated statements of cash flows
74 Accounting policy elections
75 Notes to the Group annual financial statements
98 Company statements of comprehensive income
99 Company statement of changes in equity
100 Company statements of financial position
101 Company statements of cash flows
102 Notes to the Company annual financial statements
108 Annexure A: Segment report
110 Annexure B: Share-based payment plans
113 Annexure C: Defined benefit plan
114 Annexure D: Post-retirement medical liability
115 Annexure E: Financial instruments
120 Annexure F: Interest in joint ventures
122 Annexure G: Interest in subsidiary companies, joint ventures and associates
124 Annexure H: Accounting policies
139 Annexure I: Equity-accounted joint ventures
CONteNts63

64
ADCOCK INGRAM INTEGRATED REPORT 2013
DIRECTORS’ RESPONSIBILITY FOR AND APPROVAL OF THE ANNUAL FINANCIAL STATEMENTS
CERTIFICATE BY COMPANY SECRETARY
In terms of the Companies Act the directors are required to prepare annual financial statements that fairly present the state of affairs and business of the Company and of the Group at the end of the financial year and the profit for the year then ended.
The directors of Adcock Ingram Holdings Limited are responsible for the integrity of the annual financial statements of the Company and consolidated subsidiaries, joint ventures, associates and special purpose entities, and the objectivity of other information presented in the integrated report.
The fulfilment of this responsibility is discharged through the establishment and maintenance of sound management and accounting systems, the maintenance of an organisational structure which provides for the delegation of authority and clear established responsibility, together with the constant communication and review of operational performance measured against approved plans and budgets.
Management and employees operate in terms of a code of ethics approved by the Board of directors. The code requires compliance with all applicable laws and maintenance of the highest levels of integrity in the conduct of all aspects of the business.
The annual financial statements, prepared in terms of International Financial Reporting Standards and the Companies Act, are examined by the Company’s auditors in conformity with International Standards on Auditing.
The Audit Committee of the Board of directors, composed entirely of independent non-executive directors, meets regularly with the Company’s auditors and management to discuss internal accounting controls, auditing and financial reporting matters. The auditors have unrestricted access to the Audit Committee.
Mr Andrew Hall (CA (SA)), Deputy Chief Executive and Financial Director, is responsible for this set of financial results and has supervised the preparation thereof in conjunction with the Group Finance Executive, Ms Dorette Neethling (CA (SA)).
The annual financial statements for the year ended 30 September 2013, which appear on pages 68 to 138, which are in agreement with the books of account at that date, and the related Group annual financial statements, were approved by the Board of directors on 26 November 2013 and signed on its behalf by:
KDK Mokhele JJ Louw AG HallChairman Chief Executive Officer Deputy Chief Executive and Financial Director
26 November 2013
I, the undersigned, NE Simelane, in my capacity as Company Secretary, certify that the Company has lodged with the Companies and Intellectual Property Commission all such returns as are required of a public company in terms of the Companies Act, and that all such returns are, to the best of my knowledge and belief, true, correct and up to date.
NE SimelaneCompany Secretary
26 November 2013

65
ADCOCK INGRAM INTEGRATED REPORT 2013
INDEPENDENT AUDITOR’S REPORT TO THE MEMBERS OF ADCOCK INGRAM HOLDINGS LIMITED
REPORT ON THE FINANCIAL STATEMENTSWe have audited the Group financial statements and annual financial statements of Adcock Ingram Holdings Limited set out on pages 70 to 138 which comprise the consolidated and separate statements of financial position as at 30 September 2013, the consolidated and separate statements of comprehensive income, statement of changes in equity and statements of cash flows for the year then ended, and the notes, comprising a summary of significant accounting policies and other explanatory information.
DIRECTORS’ RESPONSIBILITY FOR THE FINANCIAL STATEMENTSThe Company’s directors are responsible for the preparation and fair presentation of these financial statements in accordance with the International Financial Reporting Standards and the requirements of the Companies Act of South Africa, and for such internal control as the directors determine is necessary to enable the preparation of the consolidated and separate financial statements that are free from material misstatement, whether due to fraud or error.
AUDITOR’S RESPONSIBILITYOur responsibility is to express an opinion on these consolidated and separate financial statements based on our audit. We conducted our audit in accordance with International Standards on Auditing. Those standards require that we comply with ethical requirements and plan and perform the audit to obtain reasonable assurance about whether the consolidated and separate financial statements are free from material misstatement.
An audit involves performing procedures to obtain audit evidence about the amounts and disclosures in the financial statements. The procedures selected depend on the auditor’s judgement, including the assessment of the risks of material misstatement of the financial statements, whether due to fraud or error. In making those risk assessments, the auditor considers internal control relevant to the entity’s preparation and fair presentation of the financial statements in order to design audit procedures that are appropriate in the circumstances, but not for the purpose of expressing an opinion on the effectiveness of the entity’s internal control. An audit also includes evaluating the appropriateness of accounting policies used and the reasonableness of accounting estimates made by management, as well as evaluating the overall presentation of the financial statements.
We believe that the audit evidence we have obtained is sufficient and appropriate to provide a basis for our audit opinion.
OPINIONIn our opinion, the financial statements present fairly, in all material respects, the consolidated and separate financial position of Adcock Ingram Holdings Limited at 30 September 2013, and its consolidated and separate financial performance and consolidated and separate cash flows for the year then ended in accordance with the International Financial Reporting Standards and the requirements of the Companies Act of South Africa.
OTHER REPORTS REqUIRED BY THE COMPANIES ACT As part of our audit of the consolidated and separate financial statements for the year ended 30 September 2013, we have read the Directors’ Report, the Audit Committee’s Report and the Company Secretary’s Certificate for the purpose of identifying whether there are material inconsistencies between these reports and the audited consolidated and separate financial statements. These reports are the responsibility of the respective preparers. Based on reading these reports we have not identified material inconsistencies between these reports and the audited consolidated and separate financial statements. However, we have not audited these reports and accordingly do not express an opinion on these reports.
Ernst & Young Inc.Director – Warren Kenneth KinnearRegistered AuditorChartered Accountant (SA)
26 November 2013
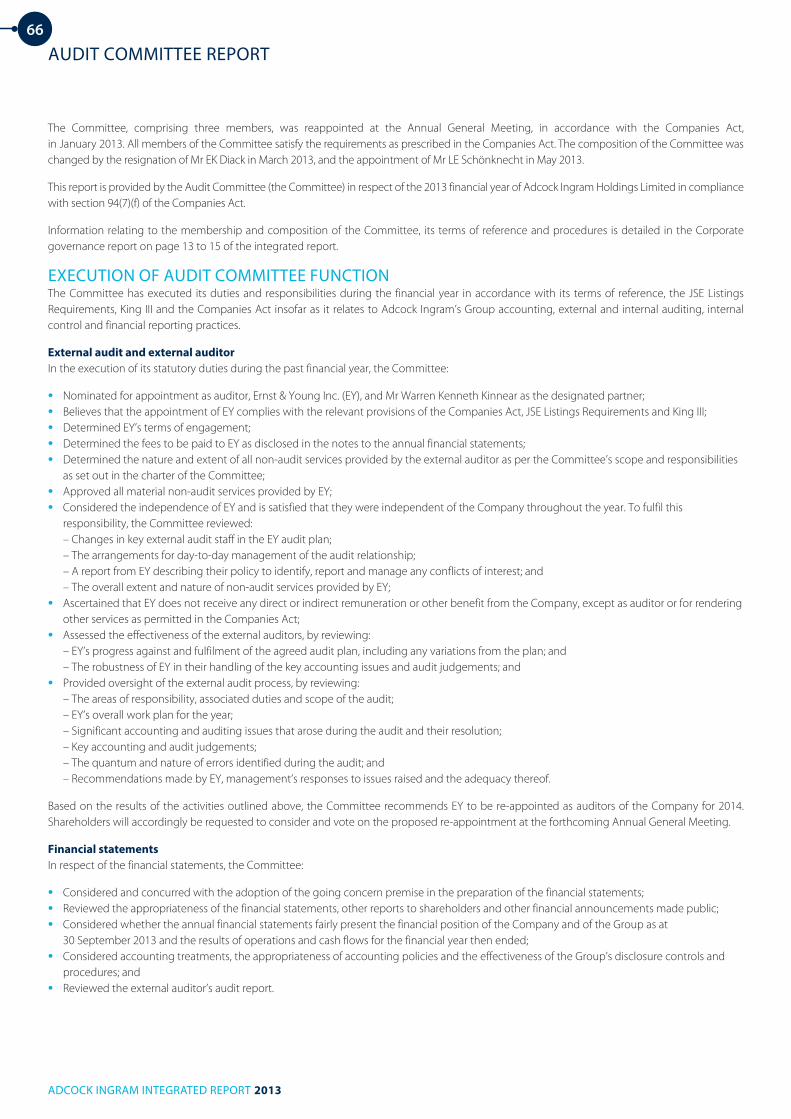
66
ADCOCK INGRAM INTEGRATED REPORT 2013
AUDIT COMMITTEE REPORT
The Committee, comprising three members, was reappointed at the Annual General Meeting, in accordance with the Companies Act, in January 2013. All members of the Committee satisfy the requirements as prescribed in the Companies Act. The composition of the Committee was changed by the resignation of Mr EK Diack in March 2013, and the appointment of Mr LE Schönknecht in May 2013.
This report is provided by the Audit Committee (the Committee) in respect of the 2013 financial year of Adcock Ingram Holdings Limited in compliance with section 94(7)(f) of the Companies Act.
Information relating to the membership and composition of the Committee, its terms of reference and procedures is detailed in the Corporate governance report on page 13 to 15 of the integrated report.
ExECUTION OF AUDIT COMMITTEE FUNCTIONThe Committee has executed its duties and responsibilities during the financial year in accordance with its terms of reference, the JSE Listings Requirements, King III and the Companies Act insofar as it relates to Adcock Ingram’s Group accounting, external and internal auditing, internal control and financial reporting practices.
External audit and external auditorIn the execution of its statutory duties during the past financial year, the Committee:
• Nominated for appointment as auditor, Ernst & Young Inc. (EY), and Mr Warren Kenneth Kinnear as the designated partner;• Believes that the appointment of EY complies with the relevant provisions of the Companies Act, JSE Listings Requirements and King III;• Determined EY’s terms of engagement;• Determined the fees to be paid to EY as disclosed in the notes to the annual financial statements;• Determined the nature and extent of all non-audit services provided by the external auditor as per the Committee’s scope and responsibilities
as set out in the charter of the Committee;• Approved all material non-audit services provided by EY;• Considered the independence of EY and is satisfied that they were independent of the Company throughout the year. To fulfil this
responsibility, the Committee reviewed:– Changes in key external audit staff in the EY audit plan;– The arrangements for day-to-day management of the audit relationship;– A report from EY describing their policy to identify, report and manage any conflicts of interest; and– The overall extent and nature of non-audit services provided by EY;
• Ascertained that EY does not receive any direct or indirect remuneration or other benefit from the Company, except as auditor or for rendering other services as permitted in the Companies Act;
• Assessed the effectiveness of the external auditors, by reviewing:– EY’s progress against and fulfilment of the agreed audit plan, including any variations from the plan; and– The robustness of EY in their handling of the key accounting issues and audit judgements; and
• Provided oversight of the external audit process, by reviewing:– The areas of responsibility, associated duties and scope of the audit;– EY’s overall work plan for the year;– Significant accounting and auditing issues that arose during the audit and their resolution;– Key accounting and audit judgements;– The quantum and nature of errors identified during the audit; and– Recommendations made by EY, management’s responses to issues raised and the adequacy thereof.
Based on the results of the activities outlined above, the Committee recommends EY to be re-appointed as auditors of the Company for 2014. Shareholders will accordingly be requested to consider and vote on the proposed re-appointment at the forthcoming Annual General Meeting.
Financial statementsIn respect of the financial statements, the Committee:
• Considered and concurred with the adoption of the going concern premise in the preparation of the financial statements;• Reviewed the appropriateness of the financial statements, other reports to shareholders and other financial announcements made public;• Considered whether the annual financial statements fairly present the financial position of the Company and of the Group as at
30 September 2013 and the results of operations and cash flows for the financial year then ended;• Considered accounting treatments, the appropriateness of accounting policies and the effectiveness of the Group’s disclosure controls and
procedures; and• Reviewed the external auditor’s audit report.

67
ADCOCK INGRAM INTEGRATED REPORT 2013
AUDIT COMMITTEE REPORT(continued)
Internal financial controls and internal auditThe Committee has:
• Evaluated the effectiveness and performance of KPMG Services (Pty) Limited (KPMG), the outsourced internal audit function, and compliance with its mandate;
• Reviewed the effectiveness of the Group’s system of internal financial control including receiving assurance from management and a written assessment on the effectiveness of internal control and risk management from the internal auditors;
• Reviewed significant issues raised by the internal audit process and the adequacy of the corrective actions in response to significant internal audit findings; and
• Reviewed policies and procedures for preventing and detecting fraud.
Based on the processes outlined above and the assessments obtained from management and KPMG, the Committee believes that the internal financial controls are effective and that there were no material breakdowns in internal controls. Furthermore, the Committee ensures that the internal audit function is subject to an independent quality review as and when the Committee deems appropriate. During the year, KPMG was assessed by an accredited external reviewer in terms of “Conformance to the International Standards for the Professional Practice of Internal Auditing”. This satisfied the Audit Committee requirements for an independent quality review.
Financial functionThe Committee has assessed the competence and experience of Mr Andrew Hall, the Deputy Chief Executive and Financial Director, and believes that he possesses the appropriate expertise and experience to meet his responsibilities in the position as required by the JSE Listings Requirements. Our assessment included making independent observations based on our interaction with him, enquiries of the Chief Executive Officer, the independent non-executive directors, EY and KPMG.
The Committee is satisfied that the financial function of the Group incorporates the necessary expertise, resources and experience to adequately carry out its obligations.
ComplianceThe Committee, in consultation with the Risk and Sustainability Committee and the Company Secretary, has considered the effectiveness of the system for monitoring compliance with laws and regulations and for finding and investigating instances of non-compliance and is satisfied with the effectiveness thereof.
Following our review of the annual financial statements for the year ended 30 September 2013, we are of the opinion that, in all material respects, they comply with the relevant provisions of the Companies Act and International Financial Reporting Standards, and present fairly the results of operations, cash flows and the financial position of the Company and the Group. The Committee therefore recommended the consolidated and separate annual financial statements of Adcock Ingram Holdings Limited for approval to the Board of directors. Shareholders will accordingly be requested to consider and adopt the annual financial statements at the forthcoming Annual General Meeting.
On behalf of the Committee
AM ThompsonChairman
26 November 2013

68
ADCOCK INGRAM INTEGRATED REPORT 2013
DIRECTORS’ REPORT
The directors have pleasure in submitting their report to shareholders, together with the audited annual financial statements for the year ended 30 September 2013.
PRINCIPAL ACTIVITIES AND BUSINESS REVIEwThe Adcock Ingram Group is a leading South African healthcare group, operating in three geographical areas, namely Southern Africa, Rest of Africa and India. The Southern African business consists of three principal divisions; an Over the Counter (OTC) division selling a range of OTC products that can be purchased without a prescription through pharmacies and FMCG retailers; a Prescription division selling a range of branded and generic prescription products; and a Hospital products and services division.
The Companies Act requires that the Company produces a fair review of the business of the Group including a description of the major risks, its development and performance during the year and the financial position of the Group at the end of the financial year. These are set out in the business commentaries on pages 23 to 41 of the integrated report. Other key performance indicators and information relating to sustainability are set out on pages 42 to 47 of the integrated report.
ACqUISITIONS2013During the year under review, the Group acquired the following business as detailed in note 1 to the financial statements on page 75:
• The assets of Cosme, a division of the Cosme Group, based in Goa, India.
2012There was no acquisition of a company or entire business during the prior year.
DISPOSALSThere was no disposal of a business during the current or prior year.
SUBSEqUENT EVENTSDetails about subsequent events are set out in note 30 to the annual financial statements.
SHARE CAPITALDetails of the authorised and issued share capital are set out in note 18 to the annual financial statements and in the statement of changes in equity.
During the year under review:
• the number of shares in issue increased by 392 530 (2012: 579 767) ordinary shares to meet the obligations of the Adcock Ingram Holdings Employee Share Trust (2008); and
• ordinary shares were bought back and held as treasury shares by:
Balance1 October 2012
Movement duringthe year
Balance 30 September 2013
Adcock Ingram Limited 4 285 163 Nil 4 285 163Mpho ea Bophelo Trust 492 000 196 000 688 000Blue Falcon Trading 69 (Pty) Limited 1 290 000 593 000 1 883 000
SHAREHOLDERSPlease refer to the Shareholder analysis on pages 142 and 143 of the integrated report.
DIVIDENDSPolicyThe Board intends to declare a distribution on at least an annual basis, which it currently envisages will be covered between two to three times by headline earnings.
DistributionAn interim distribution of 86 cents per share (2012: 86 cents) was declared based upon the results of the six-month period ended 31 March 2013. No final dividend (2012: 115 cents per share) in respect of the year ended 30 September 2013 was declared by the directors in terms of the conditions of the Scheme of Arrangement, more fully detailed in the combined Circular to shareholders of the Company dated 18 November 2013. This amounts to a departure from the stated dividend policy of paying dividends covered between two and three times by headline earnings.

69
ADCOCK INGRAM INTEGRATED REPORT 2013
GOING CONCERNPage 64 sets out the directors’ responsibilities for preparing the consolidated financial statements. The directors have considered the status of the Company and Group, including the sustainability of their business models, available financial resources at 30 September 2013, the current regulatory environment and potential changes thereto and is satisfied that the Group will be able to continue as a going concern in the foreseeable future, unless fully impaired.
SUBSIDIARIES, jOINT VENTURES AND ASSOCIATESInformation concerning the subsidiaries, joint ventures and associates of Adcock Ingram Holdings Limited is set out in Annexure G to the annual financial statements. Details of joint ventures are given in Annexure F.
DIRECTORSThe names of the directors who presently hold office are set out on pages 10 and 11 of the integrated report. There was one resignation from the Board of directors during the year under review, as well as changes to certain directors’ responsibilities as detailed on page 15.
No director (or his/her associates) holds 1% or more of the ordinary shares of the Company. The directors beneficially hold, directly and indirectly, 48 450 (2012: 47 350) ordinary shares in the Company. There has been no change in the holdings since the end of the financial period and up to the date of approval of the integrated report.
Details of the directors’ shareholdings (direct and indirect) are reflected below:
Director
Number of shares
2013
Number of shares
2012
JJ Louw * 39 300 39 300AG Hall 9 150 8 050
Total 48 450 47 350
* These shares are subject to loans.
SPECIAL RESOLUTIONS
The following special resolutions were passed on 31 January 2013 at the Company’s Annual General Meeting:
Resolution number 1: Financial assistance to (1) related companies, (2) members of related companies, (3) persons related to such companies.Resolution number 2: A new Memorandum of Incorporation in line with the Companies Act.Resolution number 3: General repurchase of the Company’s ordinary shares subject to certain conditions.
Special resolutions have been passed by all wholly-owned subsidiaries (refer to annexure G) to adopt a new Memorandum of Incorporation in line with the Companies Act.
RETIREMENT FUNDSDetails in respect of the retirement funds of the Group are set out in Annexure C.
DIRECTORS’ AND KEY MANAGEMENT REMUNERATIONFull details regarding non-executive and executive directors’ and key management remuneration are set out on pages 54 to 59 of the integrated report, as part of the Remuneration report.

70
ADCOCK INGRAM INTEGRATED REPORT 2013
CONSOLIDATED STATEMENTS OF COMPREHENSIVE INCOMEFOR THE YEAR ENDED 30 SEPTEMBER
2013 2012Note R’000 R’000
Revenue 2 5 482 783 4 644 406
Turnover 2 5 445 639 4 599 249 Cost of sales (3 208 798) (2 505 167)
Gross profit 2 236 841 2 094 082 Selling and distribution expenses (699 635) (571 500)Marketing expenses (211 930) (208 625)Research and development expenses (104 941) (81 601)Fixed and administrative expenses (329 530) (363 535)
Operating profit 890 805 868 821 Finance income 3.1 24 531 18 285 Finance costs 3.2 (82 504) (26 637)Dividend income 2 12 613 26 872 Equity-accounted earnings 13 2 663 –
Profit before taxation 848 108 887 341 Taxation 5 (246 878) (168 265)
Profit for the year 601 230 719 076
Other comprehensive income which will subsequently be recycled to profit or loss 370 (37 896)
Exchange differences on translation of foreign operations (772) (26 181)Net profit on available-for-sale asset, net of tax 247 –Movement in cash flow hedge accounting reserve, net of tax 20 895 (11 715)
Total comprehensive income for the year, net of tax 601 600 681 180
Profit attributable to:Owners of the parent 587 844 705 641 Non-controlling interests 13 386 13 435
601 230 719 076
Total comprehensive income attributable to:Owners of the parent 587 203 670 434 Non-controlling interests 14 397 10 746
601 600 681 180
Basic earnings per ordinary share (cents) 6 348,6 417,8 Diluted basic earnings per ordinary share (cents) 6 348,3 417,2 Headline earnings per ordinary share (cents) 6 350,5 422,4 Diluted headline earnings per ordinary share (cents) 6 350,2 421,8

71
ADCOCK INGRAM INTEGRATED REPORT 2013
CONSOLIDATED STATEMENT OF CHANGES IN EqUITYFOR THE YEAR ENDED 30 SEPTEMBER
Attributable to owners of the parent
Note
Issued share
capitalR’000
Share premium
R’000
Retained income
R’000
Non-distri-
butable reserves
R’000
Total attributable to ordinary
share-holders
R’000
Non-controlling
interestsR’000
TotalR’000
At 1 October 2011 16 888 765 288 1 932 212 371 368 3 085 756 137 624 3 223 380 Share issue 18, 19 57 7 011 7 068 7 068 Movement in treasury shares 18, 19 (73) (45 610) (45 683) (45 683)Share-based payment expense 20 20 068 20 068 20 068 Disposal of non-controlling interests in National Renal Care (Pty) Limited 11 279 11 279 9 108 20 387 Acquisition of non-controlling interests in Ayrton Drug Manufacturing Limited (2 148) (2 148) (8 912) (11 060)Total comprehensive income 705 641 (35 207) 670 434 10 746 681 180
Profit for the year 705 641 705 641 13 435 719 076 Other comprehensive income (35 207) (35 207) (2 689) (37 896)
Dividends 7.1 (144 474) (144 474) (10 882) (155 356)Distribution out of share premium 7.2 (179 289) (179 289) (179 289)
Balance at 30 September 2012 16 872 547 400 2 502 510 356 229 3 423 011 137 684 3 560 695
Share issue 18, 19 39 5 060 5 099 5 099 Movement in treasury shares 18, 19 (79) (48 396) (48 475) (48 475)Movement in share-based payment reserve 20 13 077 13 077 13 077 Acquisition of non-controlling interests in Ayrton Drug Manufacturing Limited (119) (119) (223) (342)Total comprehensive income 587 844 (641) 587 203 14 397 601 600
Profit for the year 587 844 587 844 13 386 601 230 Other comprehensive income (641) (641) 1 011 370
Share issue expenses incurred by subsidiary (3 669) (3 669) (3 669)Dividends 7.1 (340 138) (340 138) (6 980) (347 118)
Balance at 30 September 2013 16 832 504 064 2 750 097 364 996 3 635 989 144 878 3 780 867

72
ADCOCK INGRAM INTEGRATED REPORT 2013
CONSOLIDATED STATEMENTS OF FINANCIAL POSITIONAT 30 SEPTEMBER
2013 2012Note R’000 R’000
ASSETSProperty, plant and equipment 8 1 766 464 1 560 177 Intangible assets 9 1 435 716 710 960 Deferred tax 10 14 507 5 097 Other financial assets 11 139 646 139 751 Other non-financial asset 12 36 987 – Investment in associates 13 2 663 – Loans receivable 14 16 489 27 060
Non-current assets 3 412 472 2 443 045
Inventories 15 1 558 467 956 164 Trade and other receivables 16 1 618 947 1 320 191 Cash and cash equivalents 17 163 070 492 716 Taxation receivable 26.4 65 871 70 170
Current assets 3 406 355 2 839 241
Total assets 6 818 827 5 282 286
EqUITY AND LIABILITIESCapital and reservesIssued share capital 18 16 832 16 872 Share premium 19 504 064 547 400 Non-distributable reserves 20 364 996 356 229 Retained income 2 750 097 2 502 510
Total shareholders’ funds 3 635 989 3 423 011 Non-controlling interests 144 878 137 684
Total equity 3 780 867 3 560 695
Long-term borrowings 21 5 172 104 625 Post-retirement medical liability 22 15 108 15 341 Deferred tax 10 139 066 101 910
Non-current liabilities 159 346 221 876
Trade and other payables 23 1 340 333 983 589 Bank overdraft 17 1 307 993 – Short-term borrowings 21 135 507 431 368 Cash-settled options 24 39 150 39 983 Provisions 25 55 631 44 775
Current liabilities 2 878 614 1 499 715
Total equity and liabilities 6 818 827 5 282 286
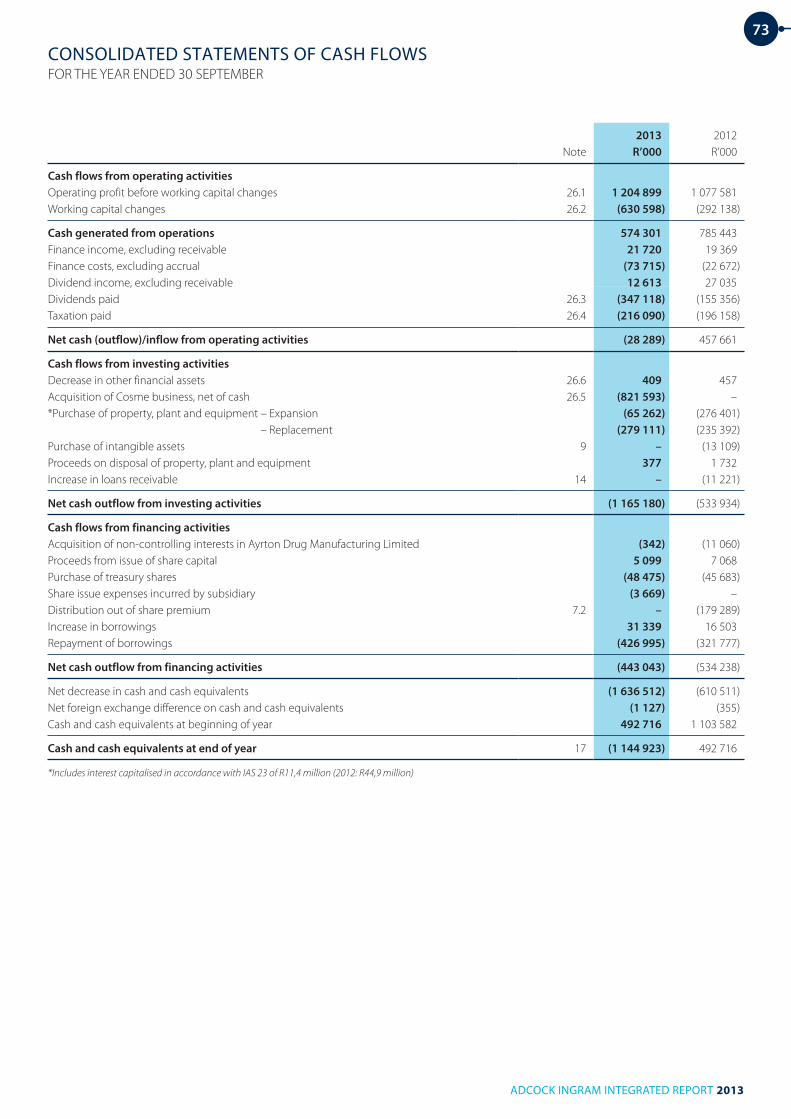
73
ADCOCK INGRAM INTEGRATED REPORT 2013
CONSOLIDATED STATEMENTS OF CASH FLOwSFOR THE YEAR ENDED 30 SEPTEMBER
2013 2012Note R’000 R’000
Cash flows from operating activitiesOperating profit before working capital changes 26.1 1 204 899 1 077 581 Working capital changes 26.2 (630 598) (292 138)
Cash generated from operations 574 301 785 443 Finance income, excluding receivable 21 720 19 369 Finance costs, excluding accrual (73 715) (22 672)Dividend income, excluding receivable 12 613 27 035 Dividends paid 26.3 (347 118) (155 356)Taxation paid 26.4 (216 090) (196 158)
Net cash (outflow)/inflow from operating activities (28 289) 457 661
Cash flows from investing activitiesDecrease in other financial assets 26.6 409 457 Acquisition of Cosme business, net of cash 26.5 (821 593) – *Purchase of property, plant and equipment – Expansion (65 262) (276 401) – Replacement (279 111) (235 392)Purchase of intangible assets 9 – (13 109)Proceeds on disposal of property, plant and equipment 377 1 732 Increase in loans receivable 14 – (11 221)
Net cash outflow from investing activities (1 165 180) (533 934)
Cash flows from financing activitiesAcquisition of non-controlling interests in Ayrton Drug Manufacturing Limited (342) (11 060)Proceeds from issue of share capital 5 099 7 068 Purchase of treasury shares (48 475) (45 683)Share issue expenses incurred by subsidiary (3 669) – Distribution out of share premium 7.2 – (179 289)Increase in borrowings 31 339 16 503 Repayment of borrowings (426 995) (321 777)
Net cash outflow from financing activities (443 043) (534 238)
Net decrease in cash and cash equivalents (1 636 512) (610 511)Net foreign exchange difference on cash and cash equivalents (1 127) (355)Cash and cash equivalents at beginning of year 492 716 1 103 582
Cash and cash equivalents at end of year 17 (1 144 923) 492 716
*Includes interest capitalised in accordance with IAS 23 of R11,4 million (2012: R44,9 million)

74
ADCOCK INGRAM INTEGRATED REPORT 2013
ACCOUNTING POLICY ELECTIONS
CORPORATE INFORMATIONThe consolidated financial statements of Adcock Ingram Holdings Limited (the Company) and Adcock Ingram Holdings Limited and its subsidiaries, joint ventures, associates and special purpose vehicles (the Group) for the year ended 30 September 2013 were authorised for issue in accordance with a resolution of the directors on 26 November 2013. Adcock Ingram Holdings Limited is incorporated and domiciled in South Africa, where its ordinary shares are publicly traded on the Securities Exchange of the JSE Limited.
BASIS OF PREPARATIONThe consolidated and separate annual financial statements (annual financial statements) are presented in South African Rands and all values are rounded to the nearest thousand (R’000), except where otherwise indicated.
The annual financial statements are prepared in accordance with International Financial Reporting Standards (IFRS), its interpretations adopted by the Accounting Standards Board (IASB), the SAICA Financial Reporting Guides as issued by the Accounting Practices Committee, the Financial Reporting Pronouncements as issued by the Financial Reporting Standards Council, and the Companies Act. The annual financial statements have been prepared on the historical cost basis, except for the following items in the statements of financial position:
• Available-for-sale financial assets, financial assets and liabilities at fair value through profit or loss, and liabilities for cash-settled share-based payments that are measured at fair value; and
• Post-employment benefit obligations are measured in terms of the projected unit credit method.
The Group(1) has made the following accounting policy election in terms of IFRS:
• Cumulative gains and losses recognised in other comprehensive income (OCI) in terms of a cash flow hedge relationship are transferred from OCI and included in the initial measurement of the non-financial asset or liability.
(1) All references to Group hereafter include the separate annual financial statements, where applicable.
CHANGES IN ACCOUNTING POLICIESThe accounting policies adopted are consistent with those of the previous financial year, except where the Group has adopted the following new and amended IFRS and IFRIC interpretations during the year. When the adoption of the standard or interpretation is deemed to have an impact on the financial performance or position of the Group, its impact is described below:
IAS 1: Presentation of items of Other Comprehensive Income (amendment to IAS 1)The amendment to IAS 1 requires that items presented in other comprehensive income be grouped separately into those items that will be recycled into profit or loss at a future point in time, and those that will never be recycled. This had no impact on the Group’s financial position or performance when this became applicable from 1 October 2012.

75
ADCOCK INGRAM INTEGRATED REPORT 2013
NOTES TO THE GROUP ANNUAL FINANCIAL STATEMENTSFOR THE YEAR ENDED 30 SEPTEMBER
2013 R’000
1 BUSINESS COMBINATIONCosme Farma Laboratories Limited (Cosme)On 17 January 2013, the Group acquired certain assets of Cosme, a division of the Cosme Group, based in Goa, India. Cosme is a mid-sized sales and marketing pharmaceutical business which has been operating in the Indian domestic pharmaceutical market for the past 40 years. At the time of acquisition it was ranked in the top 70 in India, per IMS Health, and had a sales force of approximately 1 000 staff.
The fair value of the identifiable assets as at the date of acquisition was:
AssetsProperty, plant and equipment 130 Marketing-related intangible assets 618 748 Customer-related intangible assets 87 368 Contract-related intangible assets 13 040 Manufacturing-related intangible assets 1 630
Total identifiable net assets at fair value 720 916 Goodwill arising on acquisition 61 484
Purchase consideration 782 400 VAT recoverable and deposits 39 193
Included in cash flows from investing activities 821 593
The significant factors that contributed to the recognition of goodwill of R61,5 million include, but are not limited to, the establishment of a presence within the domestic Indian market, with local management and expertise to drive the company’s product sales into the various channels and customers that exist within this market.
From the date of acquisition, Cosme contributed R168,8 million towards revenue.
As the assets purchased were fully integrated into the Indian business, it is not possible to determine the exact contribution towards profit before income tax.
Analysis of cash flows on acquisitionTransaction costs of the acquisition (included in cash flows from operating activities) 4 248
Cash outflow on acquisition 4 248
Transaction costs of R4,2 million have been expensed during the year and are included in fixed and administrative expenses.
The purchase consideration includes an amount of R48,1 million which was paid into an escrow account to cover any possible breaches of warranties as per the asset purchase agreement.

76
ADCOCK INGRAM INTEGRATED REPORT 2013
NOTES TO THE GROUP ANNUAL FINANCIAL STATEMENTSFOR THE YEAR ENDED 30 SEPTEMBER (continued)
2013R’000
2012R’000
2 REVENUE Turnover 5 445 639 4 599 249Finance income 24 531 18 285Dividend income 12 613 26 872
Black Managers Share Trust 12 613 8 298 Preference shares – 18 574
5 482 783 4 644 406
3 FINANCE INCOME AND FINANCE COSTS3.1 Finance income
Bank 22 286 18 285Imputed interest 2 064 –Other 181 –
24 531 18 285
3.2 Finance costsBank 64 317 –Borrowings 16 255 17 363Commitment fees 280 2 312Finance leases 435 718Receiver of Revenue 1 177 147Other 40 –Imputed interest – 6 097
82 504 26 637

77
ADCOCK INGRAM INTEGRATED REPORT 2013
NOTES TO THE GROUP ANNUAL FINANCIAL STATEMENTSFOR THE YEAR ENDED 30 SEPTEMBER (continued)
2013R’000
2012R’000
4 PROFIT BEFORE TAxATION4.1 Profit before taxation has been arrived at after charging/(crediting) the following
expenses/(income):External auditors’ remuneration– Audit fees current year 8 961 7 422 – Audit fees under provision prior year 210 442 – Taxation services 447 80 – Other services 1 948 7 920 Internal auditors’ remuneration 2 873 2 553 Depreciation– Freehold land and buildings 20 756 11 342 – Leasehold improvements 8 216 8 729 – Plant, equipment and vehicles 85 024 47 429 – Computers 33 373 26 297 – Furniture and fittings 4 426 5 515 Amortisation of intangible assets 50 524 17 524 Impairment of property, plant and equipment – 929 Impairment of intangibles – 958 Inventories written off 38 283 45 606Royalties paid 25 940 7 010 Share-based payment expense (refer to Annexure B)– Cash-settled scheme 11 748 6 659 – Black Managers Share Trust – equity-settled (70) 3 631 – Black Managers Share Trust – cash-settled 6 720 – – Mpho ea Bophelo Trust – equity-settled 15 080 16 437 Operating lease charges– Equipment 985 2 289 – Property 36 547 32 914 Foreign exchange profit (50 086) (2 498)Loss on disposal of property, plant and equipment 3 877 4 238
4.2 Total staff costs* 977 128 835 773 Included in cost of sales 389 872 345 588
Salaries and wages 351 457 309 026 Employers' contribution to: 38 415 36 562
Medical 13 349 12 276 Retirement 25 066 24 286
Included in operating expenses 587 256 490 185
Salaries and wages 520 646 427 001 Employers' contribution to: 66 610 63 184
Medical 14 630 14 706 Retirement 51 980 48 478
* Total staff costs include costs for executive directors and key management.
4.3 Directors' emolumentsExecutive directors 10 230 7 158 Non-executive directors 5 057 3 801
Total 15 287 10 959
For more details, please refer to pages 54 to 57.

78
ADCOCK INGRAM INTEGRATED REPORT 2013
NOTES TO THE GROUP ANNUAL FINANCIAL STATEMENTSFOR THE YEAR ENDED 30 SEPTEMBER (continued)
2013R’000
2012R’000
4 PROFIT BEFORE TAxATION (continued)4.4 Key management
Salaries 26 152 12 209 Retirement, medical and other benefits 9 563 1 733
Total 35 715 13 942
Key management comprises the Group Executive Committee, other than the executive directors. For more details, please refer to pages 58 and 59.
5 TAxATIONSouth African taxationCurrent income tax– current year 203 739 150 549 – prior year under/(over) provision 2 530 (5 762)Deferred tax– current year 25 261 12 924 – prior year over provision (2 471) (499)– utilisation of tax loss (1 584) (1 765)Secondary Tax on Companies – 938 Dividends tax 2 119 889
229 594 157 274
Foreign taxationCurrent income tax– current year 11 940 10 072 – prior year over provision (662) – Deferred tax– current year 5 376 1 023 – prior year over provision – (104)Dividends tax 630 –
17 284 10 991
Total tax charge 246 878 168 265
In addition to the above, deferred tax amounting to R0,3 million (2012: R4,5 million charge) has been released from other comprehensive income (refer note 20).
% %
Reconciliation of the taxation rate:Effective rate 29,1 19,0 Adjusted for:Exempt income/allowances * 0,4 10,5 Non-deductible expenses (1,5) (2,2)Prior year (under)/over provision 0,1 0,7 Dividends tax/Secondary Tax Companies (0,3) (0,2)Loss utilisation 0,2 0,2
South African normal tax rate 28,0 28,0
* The previous year includes the benefit of the Strategic Industrial Project (SIP) allowance which reduced the tax charge by R86 million.

79
ADCOCK INGRAM INTEGRATED REPORT 2013
NOTES TO THE GROUP ANNUAL FINANCIAL STATEMENTSFOR THE YEAR ENDED 30 SEPTEMBER (continued)
2013R’000
2012R’000
6 EARNINGS PER SHAREHeadline earnings is determined as follows:Earnings attributable to owners of Adcock Ingram 587 844 705 641 Adjusted for:Impairment of leasehold improvements and intangible assets* – 1 887 Tax indemnity on discontinued operation* – 2 355 Loss on disposal of property, plant and equipment 3 877 4 238 Tax effect on loss on disposal of property, plant and equipment (685) (712)
Headline earnings 591 036 713 409
Number of shares
Reconciliation of diluted weighted average number of shares:Weighted average number of ordinary shares in issue:– Issued shares at the beginning of the year 174 791 218 174 211 451 – Effect of ordinary shares issued during the year 264 979 365 174 – Effect of ordinary treasury shares held within the Group (6 438 325) (5 682 827)
Weighted average number of ordinary shares outstanding 168 617 872 168 893 798 Potential dilutive effect of outstanding share options 134 790 237 175
Diluted weighted average number of shares outstanding 168 752 662 169 130 973
*The adjustments had no tax implication.
Basic earnings per share is derived by dividing earnings attributable from continuing operations to owners of Adcock Ingram for the year by the weighted average number of shares in issue.
Diluted earnings per share is derived by dividing earnings attributable from continuing operations to owners of Adcock Ingram for the year by the diluted weighted average number of shares in issue. Diluted earnings per share reflect the potential dilution that could occur if all of the Group's outstanding share options were exercised and the effects of all dilutive potential shares resulting from the Mpho ea Bophelo share transaction are accounted for.
Headline earnings per share is derived by dividing earnings attributable from continuing operations to owners of Adcock Ingram for the year, after appropriate adjustments are made, by the weighted average number of shares in issue.
2013cents
2012cents
Earnings Basic earnings per share 348,6 417,8 Diluted basic earnings per share 348,3 417,2
Headline earnings Headline earnings per share 350,5 422,4 Diluted headline earnings per share 350,2 421,8
Distribution per share Interim 86 86Final* – 115
* Declared subsequent to 30 September and has been presented for information purposes only. No liability regarding the final distribution has thus been recognised
at 30 September.

80
ADCOCK INGRAM INTEGRATED REPORT 2013
NOTES TO THE GROUP ANNUAL FINANCIAL STATEMENTSFOR THE YEAR ENDED 30 SEPTEMBER (continued)
2013R’000
2012R’000
7 DISTRIBUTIONS PAID AND PROPOSED7.1 Dividend distribution
Declared and paid during the yearDividends on ordinary shares Final dividend for 2012: 115 cents 231 941 Interim dividend for 2013: 86 cents 172 947 Interim dividend for 2012: 86 cents 171 719
Total paid to equity holders of parent company 404 888 171 719 Less: Dividends relating to treasury shares (64 750) (27 245)
Total dividends declared and paid to the public 340 138 144 474 Dividends paid to non-controlling shareholders 6 980 10 882
Total dividend declared and paid to the public 347 118 155 356
7.2 Distribution out of share premiumDeclared and paid during the yearDistribution on ordinary shares Final distribution for 2011: 106 cents 212 437 Less: Distribution relating to treasury shares (33 148)
Total distribution declared and paid to the public 179 289
7.3 Proposed for approval at the Annual General MeetingDistribution on ordinary shares Final dividend for 2012: 115 cents per share 194 033
194 033

81
ADCOCK INGRAM INTEGRATED REPORT 2013
NOTES TO THE GROUP ANNUAL FINANCIAL STATEMENTSFOR THE YEAR ENDED 30 SEPTEMBER (continued)
Freehold land and
buildingsR’000
Leasehold improve-
mentsR’000
Plant, equipment
and vehicles
R’000
Computer equip-
ment R’000
Furniture and
fittingsR’000
Work in
progressR’000
TotalR’000
8 PROPERTY, PLANT AND EqUIPMENT2013Carrying value at beginning of yearCost 826 451 84 393 855 010 155 381 34 273 59 155 2 014 663 Accumulated depreciation (50 557) (30 659) (246 885) (105 430) (20 955) – (454 486)
Net book value at beginning of year 775 894 53 734 608 125 49 951 13 318 59 155 1 560 177
Current year movements – costAdditions through business combination – – – 130 – – 130 Additions(1)(2) 92 511 10 497 147 619 38 778 6 350 61 067 356 822 Transfer – 11 174 19 080 4 780 300 (35 334) – Exchange rate adjustments 3 430 77 3 020 (55) (33) – 6 439 Disposals (126) (4 667) (56 988) (2 544) (1 804) – (66 129)
Cost movement for current year 95 815 17 081 112 731 41 089 4 813 25 733 297 262
Current year movements – accumulated depreciationDepreciation (20 756) (8 216) (85 024) (33 373) (4 426) – (151 795)Exchange rate adjustments (131) 1 (908) (25) 8 – (1 055)Disposals 7 4 575 53 970 2 192 1 131 – 61 875
Accumulated depreciation movement for current year (20 880) (3 640) (31 962) (31 206) (3 287) – (90 975)
Carrying value at end of yearCost 922 266 101 474 967 741 196 470 39 086 84 888 2 311 925 Accumulated depreciation (71 437) (34 299) (278 847) (136 636) (24 242) – (545 461)
Net book value at end of year 850 829 67 175 688 894 59 834 14 844 84 888 1 766 464
(1) Additions include interest capitalised in accordance with IAS 23 of R11,4 million. Refer to note 21 for details regarding the capitalisation rate on specific borrowings. (2) Additions include an expansion of plant, equipment and vehicles to the value of R12,4 million for which there was no cash outflow in the current year.
In the previous year property, plant and equipment to the value of R68,9 million in the India joint venture was pledged as security for the long-term liabilities of the Indian operations. Refer to note 21.
The land and buildings were independently valued at 30 September 2013 by Marsh Africa. The basis used for the valuation was depreciated replacement cost. There was no indication of impairment. Land and buildings are carried at cost less accumulated depreciation and accumulated impairment. It is the policy of the Group to perform a revaluation of land and buildings every four years for information purposes.
The information required by the Companies Act in respect of land and buildings and details of valuations are contained in the register of fixed property which is available for inspection by members or their duly authorised agents at the Group’s registered office.

82
ADCOCK INGRAM INTEGRATED REPORT 2013
NOTES TO THE GROUP ANNUAL FINANCIAL STATEMENTSFOR THE YEAR ENDED 30 SEPTEMBER (continued)
Freehold land and buildings
R’000
Leasehold improve-
mentsR’000
Plant and
equipmentR’000
Computer equipment
R’000
Furniture and
fittingsR’000
Work in
progressR’000
TotalR’000
8 PROPERTY, PLANT AND EqUIPMENT (continued)2012Carrying value at beginning of yearCost 408 644 78 377 567 530 117 657 19 407 379 023 1 570 638 Accumulated depreciation (39 096) (22 695) (261 412) (75 446) (10 431) – (409 080)
Net book value at beginning of year 369 548 55 682 306 118 42 211 8 976 379 023 1 161 558
Current year movements – costAdditions(1) 56 423 2 739 56 182 30 419 4 896 361 134 511 793 Transfer 364 028 5 229 293 288 8 040 10 417 (681 002) – Impairments(2) – (1 686) – – – – (1 686)Exchange rate adjustments (2 629) (266) (6 289) (164) (34) – (9 382)Disposals (15) – (55 701) (571) (413) – (56 700)
Cost movement for current year 417 807 6 016 287 480 37 724 14 866 (319 868) 444 025
Current year movements – accumulated depreciationTransfer (365) 1 10 062 (4 331) (5 367) – – Depreciation (11 342) (8 729) (47 429) (26 297) (5 515) – (99 312)Impairments – 757 – – – – 757 Exchange rate adjustments 238 7 2 090 79 5 – 2 419 Disposals 8 – 49 804 565 353 – 50 730
Accumulated depreciation movement for current year (11 461) (7 964) 14 527 (29 984) (10 524) – (45 406)
Carrying value at end of yearCost 826 451 84 393 855 010 155 381 34 273 59 155 2 014 663 Accumulated depreciation (50 557) (30 659) (246 885) (105 430) (20 955) – (454 486)
Net book value at end of year 775 894 53 734 608 125 49 951 13 318 59 155 1 560 177
(1) Additions include interest capitalised in accordance with IAS 23, of R44,9 million. Refer to note 21.(2) Leasehold improvements were impaired as the lease agreement for the Phase 1 clinical trial facility was terminated.

83
ADCOCK INGRAM INTEGRATED REPORT 2013
NOTES TO THE GROUP ANNUAL FINANCIAL STATEMENTSFOR THE YEAR ENDED 30 SEPTEMBER (continued)
GoodwillR’000
Trademarks and market-
related intangibles
R’000
Customer-related
intangibles and licence
agreements R’000
Manu-facturing-
related intangibles
R’000Total
R’000
9 INTANGIBLE ASSETS2013Carrying value at beginning of yearCost 258 102 358 631 140 381 – 757 114 Accumulated amortisation – (22 321) (23 833) – (46 154)
Net balance at beginning of year 258 102 336 310 116 548 – 710 960
Current year movements – costBusiness combination (note 1) 61 484 618 748 100 408 1 630 782 270 Exchange rate adjustments 1 808 (8 171) (1 001) (25) (7 389)
Cost movement for the year 63 292 610 577 99 407 1 605 774 881
Current year movements – accumulated amortisationCharge for the year – (37 080) (12 285) (1 159) (50 524)Exchange rate adjustments – 227 143 29 399
Accumulated amortisation movement for the year – (36 853) (12 142) (1 130) (50 125)
Carrying value at end of yearCost 321 394 969 208 239 788 1 605 1 531 995 Accumulated amortisation – (59 174) (35 975) (1 130) (96 279)
Net balance at end of year 321 394 910 034 203 813 475 1 435 716
2012Carrying value at beginning of yearCost 265 935 349 404 142 549 – 757 888 Accumulated amortisation – (7 851) (21 563) – (29 414)
Net balance at beginning of year 265 935 341 553 120 986 – 728 474
Current year movements – costAdditions – 13 109 – – 13 109 Impairment(1) – – (958) – (958)Exchange rate adjustments (7 833) (3 882) (1 210) – (12 925)
Cost movement for the year (7 833) 9 227 (2 168) – (774)
Current year movements – accumulated amortisationCharge for the year – (15 039) (2 485) – (17 524)Exchange rate adjustments – 569 215 – 784
Accumulated amortisation movement for the year – (14 470) (2 270) – (16 740)
Carrying value at end of yearCost 258 102 358 631 140 381 – 757 114 Accumulated amortisation – (22 321) (23 833) – (46 154)
Net balance at end of year 258 102 336 310 116 548 – 710 960
(1) An intangible asset has been impaired as the Group does not expect the asset to generate any future economic benefit.

84
ADCOCK INGRAM INTEGRATED REPORT 2013
NOTES TO THE GROUP ANNUAL FINANCIAL STATEMENTSFOR THE YEAR ENDED 30 SEPTEMBER (continued)
9 INTANGIBLE ASSETS (continued)Amortisation is included in fixed and administrative expenses in the statement of comprehensive income.
Impairment testing of goodwill and other intangible assetsGoodwill acquired through business combinations and other intangible assets have been allocated to the following individual reportable segments for impairment testing. These segments represent the lowest level within the entity at which intangible assets are monitored for internal management purposes.
The carrying amount of goodwill and other intangible assets allocated to each of the segments:
Pharmaceuticals Hospital Southern Africa India and
Rest of Africa Total
2013R’000
2012R’000
2013R’000
2012R’000
2013R’000
2012R’000
2013R’000
2012R’000
2013R’000
2012R’000
Carrying amount of goodwill 196 225 196 225 12 580 12 580 208 805 208 805 112 589 49 297 321 394 258 102 Carrying amount of other intangibles with indefinite useful lives 248 647 248 647 – – 248 647 248 647 154 722 – 403 369 248 647 Carrying amount of other intangibles with finite useful lives 166 061 179 598 – – 166 061 179 598 544 892 24 613 710 953 204 211
Total 610 933 624 470 12 580 12 580 623 513 637 050 812 203 73 910 1 435 716 710 960
The average remaining useful life for intangible assets with finite useful lives ranges between four months and 16 years.
The recoverable amount of the indefinite life intangible assets has been determined based on a value in use calculation using cash flow projections from financial budgets approved by senior management covering a ten-year period as management believes that products have a value in use of more than ten years and that these projections, based on past experience, are reliable.
The discount rate applied to cash flow projections is at 16,5% for intangible assets relating to the Cosme acquisition, included in India and Rest of Africa, and 10,1% (2012: 11,0%) for the remainder of the intangible assets. The cash flows beyond the ten-year period are extrapolated using a 0,5% growth rate (2012: 0,5%).
Key assumptions used in value in use calculationsThe calculation of value in use for both segments is sensitive to the following assumptions:
• gross margin;
• discount rates;
• raw materials price inflation;
• market share during the budget period; and
• growth rate used to extrapolate cash flows beyond the budget period.
Gross marginGross margins are based on average values achieved in the three years preceding the start of the budget period. These are changed over the budget period for anticipated efficiency improvements, and estimated changes to cost of production and raw material, and selling prices.
Discount ratesDiscount rates reflect management's estimate of the risks. This is the benchmark used by management to assess operating performance and to evaluate future investment proposals. In determining appropriate discount rates, regard has been given to the yield on a ten-year Government bond at the beginning of the budgeted period.
Raw materials price inflationEstimates are obtained from published indices for the countries from which materials are sourced, as well as data relating to specific commodities. Forecast figures are used if data is publicly available, otherwise past actual raw material price movements have been used as an indicator of the future price movements.
Market share assumptionsThese assumptions are important because, as well as using industry data for growth rates, management assesses how the Group's position, relative to its competitors, might change over the budget period. Management expects the Group's share of the market to be relatively stable over the budget period.
Growth rate estimatesThe growth rate used beyond the next ten-year period is management's best estimate taking market conditions into account.
Sensitivity to changes in assumptionsWith regard to the assessment of value in use, management believes that no reasonably foreseeable change in any of the above key assumptions would cause the carrying value of the intangibles to materially exceed their recoverable amounts.

85
ADCOCK INGRAM INTEGRATED REPORT 2013
NOTES TO THE GROUP ANNUAL FINANCIAL STATEMENTSFOR THE YEAR ENDED 30 SEPTEMBER (continued)
2013R’000
2012R’000
10 DEFERRED TAxBalance at beginning of year (96 813) (90 109)Movement through profit or loss (26 582) (11 579)Exchange rate adjustments (759) 319 Revaluations of foreign currency contracts (cash flow hedges) to fair value (348) 4 556 Revaluation of available-for-sale asset to fair value (57) –
Balance at end of year (124 559) (96 813)
Analysis of deferred taxThis balance comprises the following temporary differences:Trademarks (29 167) (48 027)Property, plant and equipment (134 598) (81 575)Pre-payments (3 561) (1 875)Provisions 33 565 29 555 Revaluations of foreign currency contracts (cash flow hedges) to fair value 885 1 233 Other 8 317 3 876
(124 559) (96 813)
Disclosed as follows:Deferred tax asset 14 507 5 097 Deferred tax liability (139 066) (101 910)
11 OTHER FINANCIAL ASSETS11.1 Long-term receivable (at amortised cost)
Black Managers Share Trust (BMT)*Balance at 1 October 137 430 137 430Proceeds from sale (118) –
137 312 137 430
* The maturity of the receivable from the BMT depends on how beneficiaries exercise their options from 1 January 2015 until
30 September 2024 when the scheme is due to end or when any beneficiary dies. Refer to note B in Annexure B for further
details of the capital contribution.
11.2 InvestmentGroup Risk Holdings (Pty) LimitedBalance at 1 October 2 321 1 582(Disposal)/acquisition of shares (291) 739 Revaluation of investment 304 –
Directors' valuation of unlisted investments 2 334 2 321
12 OTHER NON-FINANCIAL ASSETVAT recoverable 36 987 –
The non-financial asset relates to the acquisition of Cosme and will not be recovered within the next 12 months. Refer note 1.

86
ADCOCK INGRAM INTEGRATED REPORT 2013
NOTES TO THE GROUP ANNUAL FINANCIAL STATEMENTSFOR THE YEAR ENDED 30 SEPTEMBER (continued)
2013R’000
2012R’000
13 INVESTMENT IN ASSOCIATES13.1 Batswadi Biotech (Pty) Limited
Cost of investment 12 200 12 200 Impairment of investment (12 200) (12 200)
– –
The investment in Batswadi Biotech (Pty) Limited is impaired as there is still significant uncertainty as to the extent and probability of future cash flows.
13.2 Melomed Renal Care (Pty) LimitedCost of investment * * Equity accounted profit 2 663 *
2 663 *
This is an associate of National Renal Care (Pty) Limited.
*Less than R1 000.
14 LOANS RECEIVABLELoans to National Renal Care doctors(1) 16 489 16 489 Owner driver loans(2) – 11 221 Less: Current portion included in other receivables – (650)
16 489 27 060
(1) These loans bear no interest and will be repaid through dividends earned by the doctors. These loans are not expected to be repaid within the next 12 months. The carrying value of the loans approximates the fair value at the reporting date.
(2) These loans bear no interest and will be repaid in monthly instalments over five years. The borrowers have pledged vehicles as security. During the current year, these vehicles were included in property, plant and equipment resulting in the elimination of the Owner-driver loans at Group level. Refer note 8. The carrying value of the loans approximated the fair value at 30 September 2012.
The maximum credit exposure amounts to R16,5 million (2012: R27,7 million).
15 INVENTORIESRaw materials 323 396 266 405 Work-in-progress 143 703 30 214 Finished goods 1 091 368 659 545
Inventory value, net of provisions 1 558 467 956 164
Inventories are written off if aged, damaged or stolen. Inventories are written down to the lower of cost and net realisable value.
The amount of inventories written down recognised as an expense in profit or loss. 38 283 45 606

87
ADCOCK INGRAM INTEGRATED REPORT 2013
NOTES TO THE GROUP ANNUAL FINANCIAL STATEMENTSFOR THE YEAR ENDED 30 SEPTEMBER (continued)
2013R’000
2012R’000
16 TRADE AND OTHER RECEIVABLESTrade receivables 1 437 138 1 113 572 Less: Provision for credit notes (17 035) (6 823) Provision for impairment (15 764) (5 847)
1 404 339 1 100 902 Derivative asset at fair value 6 012 962 Other receivables 126 510 86 888
Bank interest receivable 4 325 3 578 Sundry receivables 122 185 83 310
The maximum exposure to credit risk in relation to trade and other receivables 1 536 861 1 188 752 Pre-payments 59 286 95 512 VAT recoverable 22 800 35 927
1 618 947 1 320 191
Details in respect of the Group’s credit risk management policies are set out in Annexure E. The directors consider that the carrying amount of the trade and other receivables approximates their fair value due to the short period to maturity.
No trade receivables were impaired in both the reporting periods. Trade debtors are impaired when the event of recoverability is highly unlikely.
Movements in the provisions for impairment and credit notes were as follows:
Individually impaired
R’000
Credit notes R’000
Total R’000
Balance at 1 October 2011 (2 582) (4 094) (6 676)Charge for the year (3 265) (5 657) (8 922)Utilised during the year – 2 928 2 928
At 30 September 2012 (5 847) (6 823) (12 670)
Charge for the year (9 917) (17 550) (27 467)Utilised during the year – 7 338 7 338
At 30 September 2013 (15 764) (17 035) (32 799)

88
ADCOCK INGRAM INTEGRATED REPORT 2013
NOTES TO THE GROUP ANNUAL FINANCIAL STATEMENTSFOR THE YEAR ENDED 30 SEPTEMBER (continued)
2013R’000
2012R’000
16 TRADE AND OTHER RECEIVABLES (continued)The maturity analysis of trade and other receivables is as follows:Trade receivablesNeither past due nor impaired <30 days 947 995 687 617 31 – 60 days 356 227 352 769 61 – 90 days 69 825 45 740 Past due after impairments 91 – 180 days 14 143 7 381 >180 days 16 149 7 395
Total 1 404 339 1 100 902
Sundry receivablesNeither past due nor impaired <30 days 54 791 54 224 31 – 60 days 10 677 6 992 61 – 90 days 10 256 10 049 >90 days 46 462 12 045
Total 122 186 83 310
VAT recoverable and bank interest receivable will be received within one month.
56% (2012: 73%) of pre-payments will be recycled to other assets in the statement of financial position and the balance to profit or loss over the next 12 months.
17 CASH AND CASH EqUIVALENTSCash at banks 163 070 292 716 Preference share investments – 200 000
163 070 492 716 Bank overdraft (1 307 993) –
(1 144 923) 492 716
Cash at banks earns interest at floating rates based on daily bank deposit rates. Overdraft balances incur interest at rates varying between 6,25% and 7,0%.
Preference share investments earned dividend income at rates varying between 4,6% and 5,1% in the previous year.
The fair value of the net bank overdraft is R1 144,9 million (2012: The fair value of net cash and cash equivalents was R492,7 million).
There are no restrictions over any of the cash balances and all balances are available for use.

89
ADCOCK INGRAM INTEGRATED REPORT 2013
NOTES TO THE GROUP ANNUAL FINANCIAL STATEMENTSFOR THE YEAR ENDED 30 SEPTEMBER (continued)
2013R’000
2012R’000
18 SHARE CAPITAL18.1 Authorised
Ordinary share capital250 000 000 ordinary shares of 10 cents each 25 000 25 000 19 458 196 A shares of 10 cents each 1 946 1 946 6 486 065 B shares of 10 cents each 649 649
18.2 Issued(1)
Ordinary share capitalOpening balance of 168 724 055 ordinary shares (2012: 168 883 988) of 10 cents each 16 872 16 888 Issue of 392 530 ordinary shares (2012: 579 767) of 10 cents each 39 57 Movement in ordinary treasury shares (79) (73)
16 832 16 872
Number of shares
18.3 Treasury shares(3)
Shares held by the BEE participants – number of A shares 19 458 196 19 458 196 – number of B shares 6 486 065 6 486 065 – number of ordinary shares 2 571 000 1 782 000 Shares held by Group company – number of ordinary shares 4 285 163 4 285 163
32 800 424 32 011 424
18.4 Reconciliation of issued sharesNumber of shares in issue 201 128 009 200 735 479 Number of A and B shares held by the BEE participants (25 944 261) (25 944 261)Number of ordinary shares held by the BEE participants (2 571 000) (1 782 000)Number of ordinary shares held by the Group company (4 285 163) (4 285 163)
Net shares in issue 168 327 585 168 724 055
(1) Issued share capitalThe following ordinary shares were issued and bought back during the year:(i) In various tranches, 392 530 (2012: 579 767) ordinary shares were issued to meet the obligations of the Adcock Ingram Holdings
Limited Employees Share Trust (2008), refer to Annexure B; and(ii) 789 000 ordinary shares were bought back by the Group (2012: 739 700).
Terms and conditions of the A and B ordinary shares as per sections 43 and 44 of the Memorandum of Incorporation:
A and B ordinary shares rank pari passu with the ordinary shares, save that:
(i) these A and B ordinary shareholders shall not participate in any special dividends declared or paid by the Company, unless the respective notional outstanding loan balances become zero at any time prior to the respective release dates, in which event these A and B ordinary shares shall be entitled to participate in all special dividends declared or paid by the Company;
(ii) A and B ordinary shares shall remain certificated and shall not be listed on any stock exchange;(iii) for so long as the ordinary shares are listed on the JSE, the rights attaching to these A and B ordinary shares may not be amended
in any material respect without the prior written approval of the JSE;(iv) these terms and conditions may only be amended as prescribed by sections 43 and 44 of the Memorandum of Incorporation of
the Company.

90
ADCOCK INGRAM INTEGRATED REPORT 2013
NOTES TO THE GROUP ANNUAL FINANCIAL STATEMENTSFOR THE YEAR ENDED 30 SEPTEMBER (continued)
18 SHARE CAPITAL (continued)(2) Unissued shares
The unissued shares are under the control of the directors subject to a limit of 5% of issued ordinary share capital, in terms of a general authority granted by the shareholders at the last Annual General Meeting (AGM) to allot and issue them on such terms and conditions and at such times as they deem fit. This authority expires at the forthcoming AGM of the Company.
The Group has a share incentive trust in terms of which shares were issued and share options were granted. Refer to Annexure B. As required by IFRS and the JSE Limited, the share incentive trust is consolidated into the Group's annual financial statements.
(3) Treasury sharesAs required by IFRS, both Blue Falcon Trading 69 (Pty) Limited and the Mpho ea Bophelo Trust have been consolidated into the Group's annual financial statements and all A, B and ordinary shares held by them are accounted for as treasury shares. Shares bought back and held by a Group company are also regarded as treasury shares.
2013R’000
2012R’000
19 SHARE PREMIUM Balance at the beginning of the year 547 400 765 288 Issue of 392 530 ordinary shares (2012: 579 767) 5 060 7 011 Movement in ordinary treasury shares (48 396) (45 610)Distribution out of share premium in 2012: 106 cents per share – refer note 7.2 – (179 289)
504 064 547 400
20 NON-DISTRIBUTABLE RESERVES
Share-based
payment reserve
R’000
Cash flow hedge
account-ing
reserveR’000
Capitalredemption
reserve R’000
Foreign currency
translation reserve
R’000
Legal reserves
and otherR’000
TotalR’000
Balance at 1 October 2011 332 809 12 162 3 919 (3 895) 26 373 371 368 Movement during the year, net of tax 20 068 (11 715) – (23 492) – (15 139)
Movement for the year 20 068 (16 271) – (23 492) – (19 695)Tax effect of net movement on cash flow hedge 4 556 4 556
Balance at 30 September 2012 352 877 447 3 919 (27 387) 26 373 356 229
Movement during the year, net of tax 13 077 895 – (1 783) (3 422) 8 767
Movement for the year 15 010 1 243 – (1 783) 304 14 774 Accelerated Bophelo payment (1 933) (1 933)Movement due to share issue costs (3 669) (3 669)Tax effect of net movement on cash flow hedge and revaluation surplus on investment (348) (57) (405)
Balance at 30 September 2013 365 954 1 342 3 919 (29 170) 22 951 364 996
Share-based payment reserveThe share-based payment reserve represents the accumulated charge for share options in terms of IFRS 2. The share option plans are equity settled and include an ordinary equity scheme and the BEE scheme. During the year there was an accelerated payment made to employees in terms of the Bophelo scheme. Refer Annexure B.
Cash flow hedge accounting reserveThe cash flow hedge accounting reserve comprises the portion of the cumulative net change in the fair value of derivatives designated as effective cash flow hedging relationships where the hedged item has not yet affected inventory and ultimately cost of sales in the statement of comprehensive income.
Capital redemption reserveThe capital redemption reserve was created as a result of revaluation of shares in subsidiaries.
Foreign currency translation reserveThe foreign currency translation reserve comprises all foreign exchange differences arising from the translation of the financial statements of foreign operations.
Legal reserves and otherThis represents an unutilised merger reserve when Premier Pharmaceuticals and Adcock Ingram merged. This also includes share issue expenses incurred by Adcock Ingram Healthcare Private Limited (India) and a fair value adjustment on the Group's investment in Group Risk Holdings (Pty) Limited.

91
ADCOCK INGRAM INTEGRATED REPORT 2013
NOTES TO THE GROUP ANNUAL FINANCIAL STATEMENTSFOR THE YEAR ENDED 30 SEPTEMBER (continued)
2013R’000
2012R’000
21 LONG-TERM BORROwINGSUnsecuredLoans bearing interest at fixed rates of 8% – 9%(1) 5 679 10 294 Loan bearing interest at a fixed rate of 9%(2) 3 925 – SecuredLoan bearing interest at 1,25% below the bank's lending rate(3) – 7 402 Loan bearing interest at 2,75% below the bank’s lending rate(4) 2 227 13 995Loan bearing interest at 3,8%(5) 27 450 –Loan bearing interest at JIBAR* + 265 basis points(6) 63 750 318 750 Loan bearing interest at JIBAR* + 180 basis points(7) 36 250 181 250 Finance leases 1 398 4 302
140 679 535 993 Less: Current portion included in short-term borrowings (135 507) (431 368)
5 172 104 625
(1) These unsecured loans bear interest at fixed rates of 8% to 9% per annum. These loans are repayable in 36 instalments with the first instalment paid on 1 August 2010 and the final instalment payable on 1 February 2015. This aggregate loan balance comprises numerous individual loans.
(2) This unsecured loan bears interest at a fixed rate of 9% per annum and is repayable on termination of the contract with C&F Agency in India.
(3) This secured loan in the India Joint Venture bore interest at 1,25% below the State bank of Hyderabad's lending rate, currently at a rate of 12,25% (2012: 12,75%), repaid in quarterly instalments over five years with the first instalment paid in December 2008 and the final instalment was paid in September 2013. Prior to full settlement, the loan was secured by fixed assets and to the extent that fixed assets could not cover the liability, current assets. Refer to note 8.
(4) This secured loan in the India Joint Venture, bearing interest at 2,75% below the State bank of Hyderabad's lending rate currently at a rate of 10,75% (2012:11,25%) and does not have any fixed repayment terms. The loan is secured by fixed assets and to the extent that fixed assets cannot cover the liability, current assets. Refer to note 8.
(5) This secured loan in the India Joint Venture is linked to the LIBOR** rate and does not have any fixed repayment terms. The loan is secured by fixed assets and, to the extent that fixed assets cannot cover the liability, current assets. Refer to note 8.
(6) A secured loan bearing interest at JIBAR* plus 265 basis points. Interest is payable quarterly in arrears and the capital is being repaid in quarterly instalments from March 2012 with the final instalment due in December 2013. During the year, interest of R3,8 million (2012: R33,3 million) has been capitalised to property, plant and equipment as the definition of a qualifying asset per IAS 23 has been met.
(7) A secured loan, bearing interest at JIBAR* plus 180 basis points. During the year interest of R7,6 million (2012: R11,6 million) has been capitalised to property, plant and equipment as the definition of a qualifying asset per IAS 23 has been met.
Financial covenants, including a debt service cover ratio, Net debt: EBITDA ratio and interest cover ratio are applicable over loans (6) and (7). Following the Cosme acquisition (note 1), there was a technical breach of the debt service ratio. This was condoned by the lenders.
The shares in Group companies were pledged as security for loans (6) and (7).
The directors consider that the carrying amount of the long-term borrowings approximates their fair value.
* JIBAR – Johannesburg Interbank Agreed Rate. On 30 September 2013: 5.1330% (2012: 5.0625%).
** LIBOR – London Interbank Offered Rate.

92
ADCOCK INGRAM INTEGRATED REPORT 2013
NOTES TO THE GROUP ANNUAL FINANCIAL STATEMENTSFOR THE YEAR ENDED 30 SEPTEMBER (continued)
21 LONG-TERM BORROwINGS (continued)The undiscounted maturity profile of the Group's borrowings is as follows:
Unsecured loans at fixed interest rate
R’000
Secured loans at variable
interest ratesR’000
Finance lease
R’000 Total R’000
2013Capital repayment on loans– payable within 12 months 5 347 129 677 483 135 507 – payable within 12 – 24 months 332 – 915 1 247 – payable thereafter 3 925 – – 3 925
9 604 129 677 1 398 140 679
Interest repayment on loans*– payable within 12 months 457 2 506 124 3 087 – payable within 12 – 24 months 356 – 96 452 – payable thereafter 706 – – 706
1 519 2 506 220 4 245
2012Capital repayment of loans– payable within 12 months 7 067 421 397 2 904 431 368 – payable within 12 – 24 months 2 662 100 000 483 103 145 – payable thereafter 565 – 915 1 480
10 294 521 397 4 302 535 993
Interest repayment on loans*– payable within 12 months 544 26 880 431 27 855 – payable within 12 – 24 months 146 1 851 124 2 121 – payable thereafter 9 – 235 244
699 28 731 790 30 220
*Interest repayments have been calculated using the interest rates at the reporting dates.

93
ADCOCK INGRAM INTEGRATED REPORT 2013
NOTES TO THE GROUP ANNUAL FINANCIAL STATEMENTSFOR THE YEAR ENDED 30 SEPTEMBER (continued)
2013R’000
2012R’000
22 POST-RETIREMENT MEDICAL LIABILITYBalance at beginning of year 15 341 13 987 (Released)/Charged to operating profit (233) 1 354
Balance at end of year 15 108 15 341
For more details refer to Annexure D.
23 TRADE AND OTHER PAYABLESTrade accounts payable 805 995 634 501 Other payables 486 384 345 097
Accrued expenses 363 679 231 546 Deferred portion of purchase price of business combination 1 250 2 500 Sundry payables 121 455 111 051
VAT payable 38 497 3 323 Interest accrued 9 457 668
1 340 333 983 589
The directors consider that the carrying amount of the trade and other payables approximates their fair value due to the short-term maturity.
The maturity analysis of trade and other payables is as follows:Trade payables<30 days 433 591 376 807 31 – 60 days 116 973 131 310 61 – 90 days 160 187 31 726 >90 days 95 244 94 658
Total 805 995 634 501
Other payables<30 days 222 822 130 496 31 – 60 days 42 765 72 190 61 – 90 days 41 445 40 463 >90 days 179 352 101 948
Total 486 384 345 097
24 CASH-SETTLED OPTIONSOpening balance 39 983 64 036 Charged to operating profit 11 748 6 659 Payments made (12 581) (30 712)
39 150 39 983

94
ADCOCK INGRAM INTEGRATED REPORT 2013
NOTES TO THE GROUP ANNUAL FINANCIAL STATEMENTSFOR THE YEAR ENDED 30 SEPTEMBER (continued)
2013R’000
2012R’000
25 PROVISIONSLeave pay 55 631 44 775 Bonus and incentive scheme – –
55 631 44 775
Made up as follows:Leave pay provision Balance at beginning of year 44 775 40 551 Arising during the year 48 060 44 944 Utilised during the year (33 025) (31 872)Unused amounts reversed (4 236) (8 848)Exchange rate adjustments 57 –
Balance at end of year 55 631 44 775
Bonus and incentive schemeBalance at beginning of year – 2 308 Unused amounts reversed – (2 308)
Balance at end of year – –
Leave pay provisionIn terms of the Group policy, employees in South Africa are entitled to accumulate leave benefits not taken within a leave cycle, up to a maximum of three times the employee's annual leave allocation, limited to a maximum of 60 days. The obligation is reviewed annually. The timing of the cash flow, if any, is uncertain. In excess of 95% of the balance represents the liability for employees in South Africa.
Bonus and incentive provisionSome employees in the service of the Group participate in a performance-based incentive scheme and provision is made for the estimated liability in terms of set performance criteria. No provision was made for incentives, normally paid in December, as performance criteria in the current financial year have not been met.

95
ADCOCK INGRAM INTEGRATED REPORT 2013
NOTES TO THE GROUP ANNUAL FINANCIAL STATEMENTSFOR THE YEAR ENDED 30 SEPTEMBER (continued)
2013R’000
2012R’000
26 NOTES TO THE STATEMENTS OF CASH FLOwS 26.1 Operating profit before working capital changes
Profit before taxation 848 108 887 341 Adjusted for:– amortisation of intangibles 50 524 17 524 – depreciation 151 795 99 312 – loss on disposal of property, plant and equipment 3 877 4 238 – dividend income (12 613) (26 872)– net finance income 57 973 8 352 – equity-accounted earnings (2 663) – – share-based payment expenses 33 478 26 727– inventories written off 38 283 45 606 – provision for accounts receivable impairment and credit notes 20 129 5 994 – increase in provisions and post-retirement medical liability 10 550 3 450 – straight-lining of leases 7 391 4 022 – impairment of leasehold improvements and intangible assets – 1 887 – accelerated Bophelo payment (1 933) –
1 204 899 1 077 581
26.2 Working capital changesIncrease in inventories (636 782) (140 845)Increase in trade and other receivables (310 535) (128 142)Increase/(Decrease) in trade and other payables 316 719 (23 151)
(630 598) (292 138)
26.3 Dividends paidDividends paid to equity holders of the parent (340 138) (144 474)Dividends paid to non-controlling shareholders (6 980) (10 882)
(347 118) (155 356)
26.4 Taxation paidAmounts overpaid at beginning of year 70 170 30 143 Amounts charged to profit or loss (246 878) (168 265)Movement in deferred tax 26 582 11 579 Exchange rate adjustments (93) 555 Amounts overpaid at end of year (65 871) (70 170)
(216 090) (196 158)
26.5 Acquisition of business, net of cashProperty, plant and equipment (130) Intangible assets (720 786) VAT recoverable and deposits (39 193)
Fair value of net assets (760 109) Goodwill acquired (61 484)
Cash outflow on business combination (821 593)
26.6 Decrease in other financial assetsDecrease in Fairbairn Capital Investments – 1 196 Proceeds from sale/(Cost of acquisition) of additional interest in Group Risk Holdings (Pty) Limited 291 (739)Decrease in Black Managers Share Trust 118 –
409 457

96
ADCOCK INGRAM INTEGRATED REPORT 2013
27 CONTINGENT LIABILITIESThe Group provides surety for the obligations of Adcock Ingram Healthcare (Pty) Limited and Adcock Ingram Critical Care (Pty) Limited.
28 COMMITMENTS AND CONTINGENCIES28.1 Operating lease commitments
The Group has entered into the following material lease agreements in South Africa and India for premises used as offices and distribution centres for pharmaceutical products. These leases represent more than 95% of the lease commitments of the Group.
Lease 1New Road
Lease 2Durban
Lease 3 Cape Town
Lease 4 Bangalore
(Ground and 1st floors)
Lease 5 Bangalore (2nd and 3rd floors)
Lease 6 Goa
Initial lease period (years) 10 12 10 8 9 5 Ending 30 November 2021 31 October 2022 31 August 2022 15 April 2021 30 November 2020 9 April 2018
Renewal option period (years) 10 10 5 By mutual consensus
By mutual consensus
By mutual consensus
Ending 30 November 2031 31 October 2032 31 August 2027 n/a n/a n/a Escalation 7,3% 8,5% 7% 16,3% after 3 years 16,3% after 3 years 15% after 3 years
Future minimum rentals payable under all non-cancellable operating leases as at 30 September are as follows:
2013R’000
2012R’000
Within one year 27 909 26 522 After one year but not more than five years 127 672 119 114 More than five years 137 163 173 034
292 744 318 670
28.2 Capital commitmentsCommitments contracted for
Within one year 34 737 64 632
Approved but not contracted for 117 342 143 403
Within one year 117 342 115 526 Between one and two years – 27 877
152 079 208 035
These commitments relate to property, plant and equipment.
28.3 GuaranteesThe Group has provided guarantees to the amount of R13,5 million at 30 September 2013 (2012: R106,0 million).
NOTES TO THE GROUP ANNUAL FINANCIAL STATEMENTSFOR THE YEAR ENDED 30 SEPTEMBER (continued)
97
ADCOCK INGRAM INTEGRATED REPORT 2013
29 RELATED PARTIESRelated party transactions exist between the Company, subsidiaries, joint ventures, associates and key management. All purchasing and selling transactions with related parties are concluded at arm's length and are eliminated for Group purposes.
Payments to directors and key management are disclosed in notes 4.3 and 4.4.
30 SUBSEqUENT EVENTS30.1 Bank overdraft
Subsequent to year-end, a secured term loan of R1 billion was agreed with Nedbank, replacing a portion of the current bank overdraft. The secured loan will bear interest at JIBAR +176 points. Interest will be payable quarterly in arrears and the capital will be repaid in December 2018.
30.2 CFR Pharmaceuticals S.A. (CFR)In announcements released by the Company on the JSE Limited’s Stock Exchange News Service (SENS) on 3 July 2013, 15 August 2013, 11 September 2013 and 30 October 2013, the Company notified Adcock Ingram shareholders of a potential offer, to acquire control of the Company, by CFR, incorporated in Chile. On 15 November 2013, the Company announced on SENS:
• CFR’s firm intention to make an offer for the Company;
• the Adcock Ingram Board’s agreement to propose and recommend a Scheme of Arrangement (Scheme) in relation to the offer;
• certain arrangements with the Company’s black economic empowerment partners and participants in the Company’s employee incentive schemes; and
• if the Scheme is implemented, the delisting from the JSE of the Company’s shares and the listing of CFR on the JSE by way of a secondary listing.
NOTES TO THE GROUP ANNUAL FINANCIAL STATEMENTSFOR THE YEAR ENDED 30 SEPTEMBER (continued)

98
ADCOCK INGRAM INTEGRATED REPORT 2013
COMPANY STATEMENTS OF COMPREHENSIVE INCOMEFOR THE YEAR ENDED 30 SEPTEMBER
2013 2012Note R’000 R’000
Revenue A 464 590 233 106
Operating expenses (266) (2 463)Finance income B.1 47 213 58 106 Finance costs B.2 (39 532) (57 636)Dividend income A 417 377 175 000
Profit before taxation 424 792 173 007 Taxation C (2 203) (784)
Profit for the year 422 589 172 223 Other comprehensive income which will subsequently be recycled to profit or loss Net profit on available-for-sale asset, net of tax 247 –
Total comprehensive income for the year, net of tax 422 836 172 223

99
ADCOCK INGRAM INTEGRATED REPORT 2013
COMPANY STATEMENT OF CHANGES IN EQUITYFOR THE YEAR ENDED 30 SEPTEMBER
Issued share
capitalShare
premiumAccumulated
loss
Non-distributable
reserves Total Note R’000 R’000 R’000 R’000 R’000
As at 1 October 2011 20 016 1 141 373 (189 949) 269 286 1 240 726 Share issue I.2, J 57 7 011 7 068 Total comprehensive income 172 223 172 223
Profit for the year 172 223 172 223 Other comprehensive income – –
Dividends D.1 (171 719) (171 719)Distribution out of share premium D.2 (212 437) (212 437)
Balance at 30 September 2012 20 073 935 947 (189 445) 269 286 1 035 861
Share issue I.2, J 39 5 060 5 099 Total comprehensive income 422 589 247 422 836
Profit for the year 422 589 422 589 Other comprehensive income – 247 247
Dividends D.1 (404 888) (404 888)
Balance at 30 September 2013 20 112 941 007 (171 744) 269 533 1 058 908

100
ADCOCK INGRAM INTEGRATED REPORT 2013
COMPANY STATEMENTS OF FINANCIAL POSITIONAT 30 SEPTEMBER
2013 2012Note R’000 R’000
ASSETSInvestments E 3 369 220 3 369 207 Amounts owing by Group companies G.1 – 100 000
Non-current assets 3 369 220 3 469 207
Amounts owing by Group companies G.1 511 928 400 000 Other receivables H 1 042 –Taxation receivable O.3 505 817
Current assets 513 475 400 817
Total assets 3 882 695 3 870 024
EQUITY AND LIABILITIESCapital and reservesIssued share capital I.2 20 112 20 073 Share premium J 941 007 935 947 Non-distributable reserves K 269 533 269 286 Accumulated loss (171 744) (189 445)
Total equity 1 058 908 1 035 861
Long-term borrowings L – 100 000 Amounts owing to Group companies G.2 2 155 994 2 155 994 Deferred tax M 57 –
Non-current liabilities 2 156 051 2 255 994
Short-term borrowings L 100 000 400 000 Bank overdraft F 567 010 176 456 Other payables N 726 974 Amounts owing to Group companies G.2 – 739
Current liabilities 667 736 578 169
Total equity and liabilities 3 882 695 3 870 024

101
ADCOCK INGRAM INTEGRATED REPORT 2013
COMPANY STATEMENTS OF CASH FLOWSFOR THE YEAR ENDED 30 SEPTEMBER
2013 2012Note R’000 R’000
Cash flows from operating activitiesOperating profit before working capital changes O.1 (266) (2 463)Working capital changes O.2 (248) 148
Cash utilised in operations (514) (2 315)Finance income, excluding receivable 46 171 59 187 Finance costs (39 532) (57 680)Dividend income A 417 377 175 000 Dividends paid D.1 (404 888) (171 719)Taxation paid O.3 (1 891) (1 493)
Net cash inflow from operating activities 16 723 980
Cash flows from investing activitiesDecrease/(Increase) in investments O.4 291 (739)Net (increase)/decrease in amounts owing by Group companies (11 928) 294 158
Net cash (outflow)/inflow from investing activities (11 637) 293 419
Cash flows from financing activitiesProceeds from issue of share capital 5 099 7 068 Distribution out of share premium D.2 – (212 437)(Decrease)/Increase in amounts owing to Group companies (739) 816 Increase in borrowings – 5 842 Repayment of borrowings (400 000) (300 000)
Net cash outflow from financing activities (395 640) (498 711)
Net decrease in cash and cash equivalents (390 554) (204 312)Cash and cash equivalents at beginning of year (176 456) 27 856
Cash and cash equivalents at end of year F (567 010) (176 456)

102
ADCOCK INGRAM INTEGRATED REPORT 2013
NOTES TO THE COMPANY ANNUAL FINANCIAL STATEMENTSFOR THE YEAR ENDED 30 SEPTEMBER
2013 2012R’000 R’000
A REVENUEFinance income 47 213 58 106 Dividend income 417 377 175 000
464 590 233 106
B FINANCE INCOME AND FINANCE COSTSB.1 Finance income
Bank 7 681 499 Inter-Group interest 39 532 57 607
47 213 58 106
B.2 Finance costsBorrowings 39 532 57 607 Other – 29
39 532 57 636
C TAXATIONSouth African taxationCurrent income tax– current year 2 203 96 Secondary Tax on Companies – 688
Total tax charge 2 203 784
Reconciliation of the taxation rate: % %Effective rate 0,5 0,5Adjusted for:Exempt income 27,5 28,3 Non-deductible expenses – (0,4)Secondary Tax on Companies – (0,4)
South African normal tax rate 28,0 28,0
D DISTRIBUTIONS PAID AND PROPOSEDD.1 Dividends
Declared and paid during the year Dividends on ordinary shares Interim dividend for 2012: 86 cents 171 719 Final dividend for 2012: 115 cents 231 941 Interim dividend for 2013: 86 cents 172 947
Total declared and paid 404 888 171 719
D.2 Distribution out of share premiumDeclared and paid during the year Distribution on ordinary shares Final distribution for 2011: 106 cents 212 437
Total declared and paid 212 437
D.3 Proposed for approval at the Annual General Meeting Dividend on ordinary shares Final dividend for 2012: 115 cents per share 230 846
230 846

103
ADCOCK INGRAM INTEGRATED REPORT 2013
NOTES TO THE COMPANY ANNUAL FINANCIAL STATEMENTSFOR THE YEAR ENDED 30 SEPTEMBER (continued)
2013 Effective holding
%
2012 Effective holding
% 2013
R’0002012R’000
E INVESTMENTSAdcock Ingram Limited 100 100 2 130 587 2 130 587 Adcock Ingram Healthcare (Pty) Limited 100 100 815 390 815 390 Adcock Ingram Intellectual Property (Pty) Limited 100 100 104 000 104 000 Adcock Ingram Critical Care (Pty) Limited 100 100 284 979 284 979 Adcock Ingram Limited India 49,9 49,9 31 930 31 930 Adcock Ingram International (Pty) Limited 100 100 * * Thembalami Pharmaceuticals (Pty) Limited 50 50 * * Group Risk Holdings (Pty) Limited1 7,0 8,0 2 334 2 321
3 369 220 3 369 207
*Less than R1 000.1 For more details refer to note 11.2.
F CASH AND CASH EQUIVALENTSBank overdraft (567 010) (176 456)
G AMOUNTS OWING BY/(TO) GROUP COMPANIESG.1 Amounts owing by Group companies
Included in current assets 511 928 400 000
Adcock Ingram Critical Care (Pty) Limited 36 250 145 000 Adcock Ingram Healthcare (Pty) Limited 308 175 255 000 Adcock Ingram International (Pty) Limited 167 154 – Adcock Ingram Holdings Limited Employee Share Trust (2008) 339 – Mpho ea Bophelo Trust 10 –
Included in non-current assets – 100 000
Adcock Ingram Critical Care (Pty) Limited – 36 250 Adcock Ingram Healthcare (Pty) Limited – 63 750
Adcock Ingram Critical Care (Pty) LimitedA secured loan of R36,25 million, bearing interest at JIBAR(1) plus 180 basis points. Interest is payable quarterly in arrears and the capital is repaid in quarterly instalments from March 2012, with the final instalment due in December 2013.
Adcock Ingram Healthcare (Pty) Limited(a) A secured loan of R63,75 million bearing interest at JIBAR(1) plus 265 basis points. Interest is payable
quarterly in arrears and the capital is being repaid in quarterly instalments from March 2012 with the final instalment due in December 2013.
(b) An unsecured loan of R244,43 million which bears interest at a prime less 1,5% and has no fixed terms of repayment.
Adcock Ingram International (Pty) LimitedThe loan is unsecured, interest free, and has no fixed terms of repayment.
The undiscounted maturity profile of the Company’s borrowings are as follows:
Capital repayment on loans with fixed terms of repayment– payable within 12 months 100 000 400 000 – payable within 12 – 24 months – 100 000
100 000 500 000
Interest repayment on loans (2)
– payable within 12 months 1 884 25 915 – payable within 12 – 24 months – 1 851
1 884 27 766
(1) JIBAR – Johannesburg Interbank Agreed Rate. On 30 September 2013: 5.1330% (2012: 5.0625%).(2) Interest repayments have been calculated using the interest rates at the reporting dates.

104
ADCOCK INGRAM INTEGRATED REPORT 2013
NOTES TO THE COMPANY ANNUAL FINANCIAL STATEMENTSFOR THE YEAR ENDED 30 SEPTEMBER (continued)
2013 2012R’000 R’000
G AMOUNTS OWING BY/(TO) GROUP COMPANIES (continued)G.2 Amounts owing to Group companies
Included in non-current liabilities:Adcock Ingram Limited* (2 155 994) (2 155 994)
Included in current liabilities:Adcock Ingram Healthcare (Pty) Limited – (739)
The loan is unsecured, interest free and has no fixed term of repayment.
* It is not expected that the subsidiary would call on payment within the next 12 months.
H OTHER RECEIVABLESBank interest receivable 1 042 –
I SHARE CAPITALI.1 Authorised
Ordinary share capital 250 000 000 ordinary shares of 10 cents each 25 000 25 000 19 458 196 A shares of 10 cents each 1 946 1 946 6 486 065 B shares of 10 cents each 649 649
Terms and conditions of the A and B ordinary shares as per sections 43 and 44 of the Memorandum of Incorporation:A and B ordinary shares rank pari passu with the ordinary shares, save that:
(i) these A and B ordinary shareholders shall not participate in any special dividends declared or paid by the Company, unless the respective notional outstanding loan balances become zero at any time prior to the respective release dates, in which event these A and B ordinary shares shall be entitled to participate in all special dividends declared or paid by the Company;
(ii) A and B ordinary shares shall remain certificated and shall not be listed on any stock exchange;(iii) for so long as the ordinary shares are listed on the JSE Limited (JSE), the rights attaching to these A and B ordinary shares may not be
amended in any material respect without the prior written approval of the JSE; and(iv) these terms and conditions may only be amended as prescribed by sections 43 and 44 of the Memorandum of Incorporation of the
Company.
2013 2012R’000 R’000
I.2 IssuedOrdinary share capitalOpening balance of 200 735 481 (2012: 200 155 714) ordinary shares of 10 cents each 20 073 20 016 Issue of 392 530 (2012: 579 767) ordinary shares of 10 cents each 39 57
20 112 20 073
The following ordinary shares were issued during the year:(i) In various tranches, 392 530 (2012: 579 767) ordinary shares were issued to meet the obligations of the Adcock Ingram Holdings
Limited Employees Share Trust (2008).
I.3 Unissued shares The unissued shares are under the control of the directors subject to a limit of 5% of issued ordinary share capital, in terms of a general authority granted by the shareholders at the last annual general meeting (AGM) to allot and issue them on such terms and conditions and at such times as they deem fit. This authority expires at the forthcoming AGM of the Company.

105
ADCOCK INGRAM INTEGRATED REPORT 2013
NOTES TO THE COMPANY ANNUAL FINANCIAL STATEMENTSFOR THE YEAR ENDED 30 SEPTEMBER (continued)
2013 2012R’000 R’000
J SHARE PREMIUMBalance at beginning of the year 935 947 1 141 373 Issues of 392 530 (2012: 579 767) ordinary shares 5 060 7 011 Distribution out of share premium in 2012: 106 cents per share – (212 437)
941 007 935 947
Share-based payment
reserveOther
reserves TotalR’000 R’000 R’000
K NON-DISTRIBUTABLE RESERVESBalance at 1 October 2011 269 000 286 269 286 Movement during the year – – –
Balance at 30 September 2012 269 000 286 269 286
Movement during the year – 247 247
Balance at 30 September 2013 269 000 533 269 533
2013 2012 R’000 R’000
L LONG-TERM BORROWINGSA secured loan, bearing interest at JIBAR plus 180 basis points. Interest is payable quarterly in arrears and the capital is repaid in quarterly instalments from March 2012, with the final instalment due in December 2013. 36 250 181 250
A secured loan bearing interest at JIBAR plus 265 basis points. Interest is payable quarterly in arrears and the capital will be repaid in quarterly instalments from March 2012 with the final instalment due in December 2013. 63 750 318 750
100 000 500 000 Less: Current portion included in short-term borrowings (100 000) (400 000)
– 100 000
Capital repayments on loans– payable within 12 months 100 000 400 000 – payable within 12 – 24 months – 100 000
100 000 500 000
Interest repayments on loans*– payable within 12 months 1 884 25 915 – payable within 12 – 24 months – 1 851
1 884 27 766
* Interest repayments have been calculated using the interest rates at the reporting dates.
M DEFERRED TAXBalance at beginning of year – –Other comprehensive income movement (57) –
Balance at end of year (57) –
Analysis of deferred taxThis balance comprises the following temporary difference:Revaluations of available-for-sale financial asset (57) –

106
ADCOCK INGRAM INTEGRATED REPORT 2013
NOTES TO THE COMPANY ANNUAL FINANCIAL STATEMENTSFOR THE YEAR ENDED 30 SEPTEMBER (continued)
2013 2012R’000 R’000
N OTHER PAYABLESInterest accrued – 417 Other 726 557
726 974
O NOTES TO THE STATEMENTS OF CASH FLOWSO.1 Operating profit before working capital changes
Profit before taxation 424 792 173 007 Adjusted for:– dividend income (417 377) (175 000)– net finance income (7 681) (470)
(266) (2 463)
O.2 Working capital changes(Decrease)/Increase in other payables (excluding accrual) (248) 148
O.3 Taxation paidAmounts overpaid at beginning of the year 817 108 Amounts charged to the statement of comprehensive income (2 203) (784)Amount overpaid at end of the year (505) (817)
(1 891) (1 493)
O.4 Increase in investmentsProceeds on sale of 1,0% interest in Group Risk Holdings (Pty) Limited 291 –Cost of acquisition of additional 2.7% interest in Group Risk Holdings (Pty) Limited – (739)
291 (739)
P RELATED PARTIESRelated party transactions exist between the Company and other subsidiaries within the Adcock Ingram Group. All transactions with related parties are concluded at arm’s length.
The following related party transactions occurred during the years ended 30 September:
Interest receivedAdcock Ingram Healthcare (Pty) Limited 30 740 37 989 Adcock Ingram Critical Care (Pty) Limited 8 792 19 618
Dividends receivedAdcock Ingram Limited 300 000 175 000 Adcock Ingram Healthcare (Pty) Limited 110 000 –Adcock Ingram Limited (India) 7 377 –
Dividends paidAdcock Ingram Limited 8 612 3 685 Blue Falcon Trading 69 (Pty) Limited 42 009 17 630 Mpho ea Bophelo Trust 14 127 5 930
Refer to Annexure G for nature of the relationships of related parties.

107
ADCOCK INGRAM INTEGRATED REPORT 2013
NOTES TO THE COMPANY ANNUAL FINANCIAL STATEMENTSFOR THE YEAR ENDED 30 SEPTEMBER (continued)
2013 2012R’000 R’000
Q FINANCIAL INSTRUMENTSFair value hierarchyClassification of financial instruments and fair value hierarchy is as follows:
Financial instruments Classification per IAS 39
Investment in Group Risk Holdings (Pty) Limited(1) Available for sale 2 334 2 321 Amounts owing by Group companies Loans and receivables 511 928 500 000 Amounts owing to Group companies Loans and borrowings 2 155 994 2 156 733 Long-term borrowings Loans and borrowings – 100 000 Other payables Loans and borrowings 726 974 Short-term borrowings Loans and borrowings 100 000 400 000 Bank overdraft Loans and borrowings 567 010 176 456
(1) Level 3: Fair value based on latest available selling price.
The Company used the following hierarchy for determining and disclosing the fair value of financial instruments measured at fair value by valuation technique:
Level 1: quoted prices in active markets; Level 2: other techniques for which all inputs which have a significant effect on the recorded fair value are observable, either directly or
indirectly; and Level 3: techniques which use inputs which have a significant effect on the recorded fair value that are not based on observable
market data.
Financial risk management objectives and policies The Company’s principal financial liabilities comprise borrowings, bank overdraft and other payables. The main purpose of these financial
liabilities is to raise finance for the Group’s operations.
The financial instruments’ carrying values approximates their fair values.
The main risks arising from the Company’s financial instruments are interest rate, credit and liquidity. The Board reviews and agrees policies for managing each of these risks, which are summarised in Annexure E.
Interest rate sensitivity The following table demonstrates the sensitivity to a reasonably possible change in interest rates, with all other variables held constant, of
the Company’s profit before tax (through the impact on balances subject to floating rates):
Change in rate
Decrease in profit before tax
2013 2012% R’000 R’000
Cash and cash equivalentsBank overdraft +1 5 670 1 765
No sensitivity analysis is performed on the borrowings as terms of these and amounts owed by Group companies are linked.
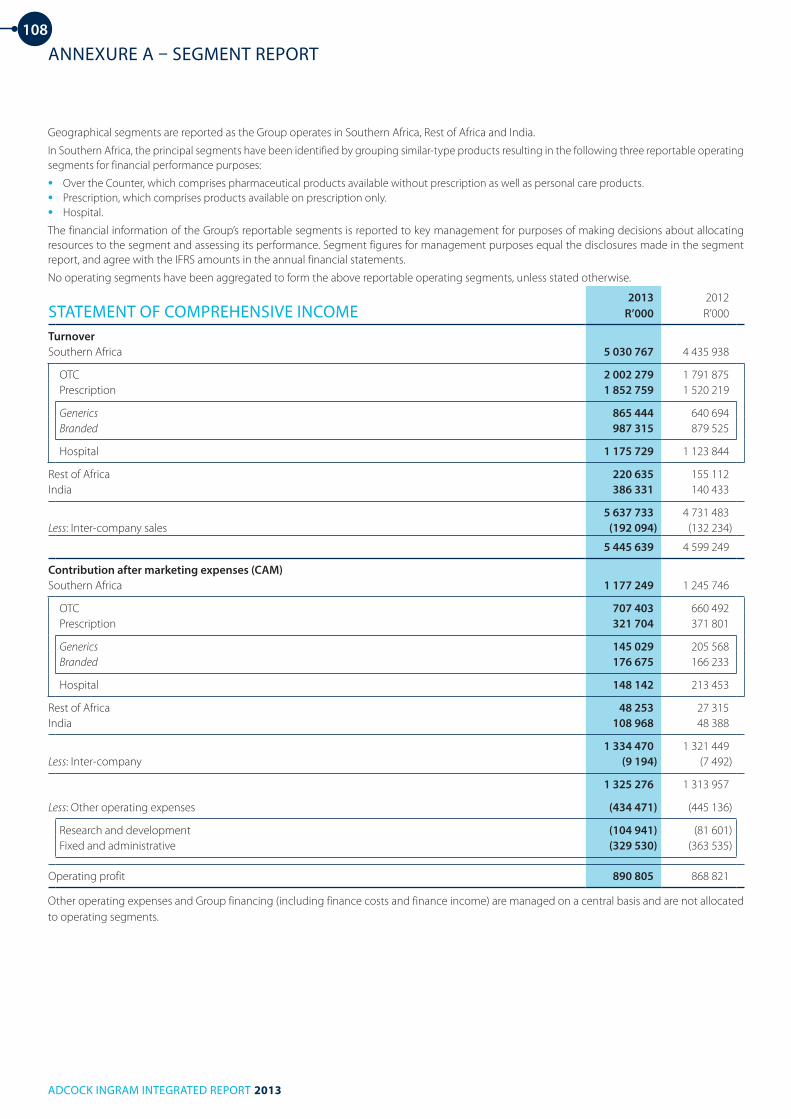
108
ADCOCK INGRAM INTEGRATED REPORT 2013
ANNEXURE A – SEGMENT REPORT
Geographical segments are reported as the Group operates in Southern Africa, Rest of Africa and India.
In Southern Africa, the principal segments have been identified by grouping similar-type products resulting in the following three reportable operating segments for financial performance purposes:
• Over the Counter, which comprises pharmaceutical products available without prescription as well as personal care products.• Prescription, which comprises products available on prescription only.• Hospital.
The financial information of the Group’s reportable segments is reported to key management for purposes of making decisions about allocating resources to the segment and assessing its performance. Segment figures for management purposes equal the disclosures made in the segment report, and agree with the IFRS amounts in the annual financial statements.
No operating segments have been aggregated to form the above reportable operating segments, unless stated otherwise.
STATEMENT OF COMPREHENSIVE INCOME2013
R’0002012R’000
TurnoverSouthern Africa 5 030 767 4 435 938
OTC 2 002 279 1 791 875 Prescription 1 852 759 1 520 219
Generics 865 444 640 694 Branded 987 315 879 525
Hospital 1 175 729 1 123 844
Rest of Africa 220 635 155 112 India 386 331 140 433
5 637 733 4 731 483 Less: Inter-company sales (192 094) (132 234)
5 445 639 4 599 249
Contribution after marketing expenses (CAM)Southern Africa 1 177 249 1 245 746
OTC 707 403 660 492 Prescription 321 704 371 801
Generics 145 029 205 568 Branded 176 675 166 233
Hospital 148 142 213 453
Rest of Africa 48 253 27 315 India 108 968 48 388
1 334 470 1 321 449Less: Inter-company (9 194) (7 492)
1 325 276 1 313 957
Less: Other operating expenses (434 471) (445 136)
Research and development (104 941) (81 601)Fixed and administrative (329 530) (363 535)
Operating profit 890 805 868 821
Other operating expenses and Group financing (including finance costs and finance income) are managed on a central basis and are not allocated to operating segments.
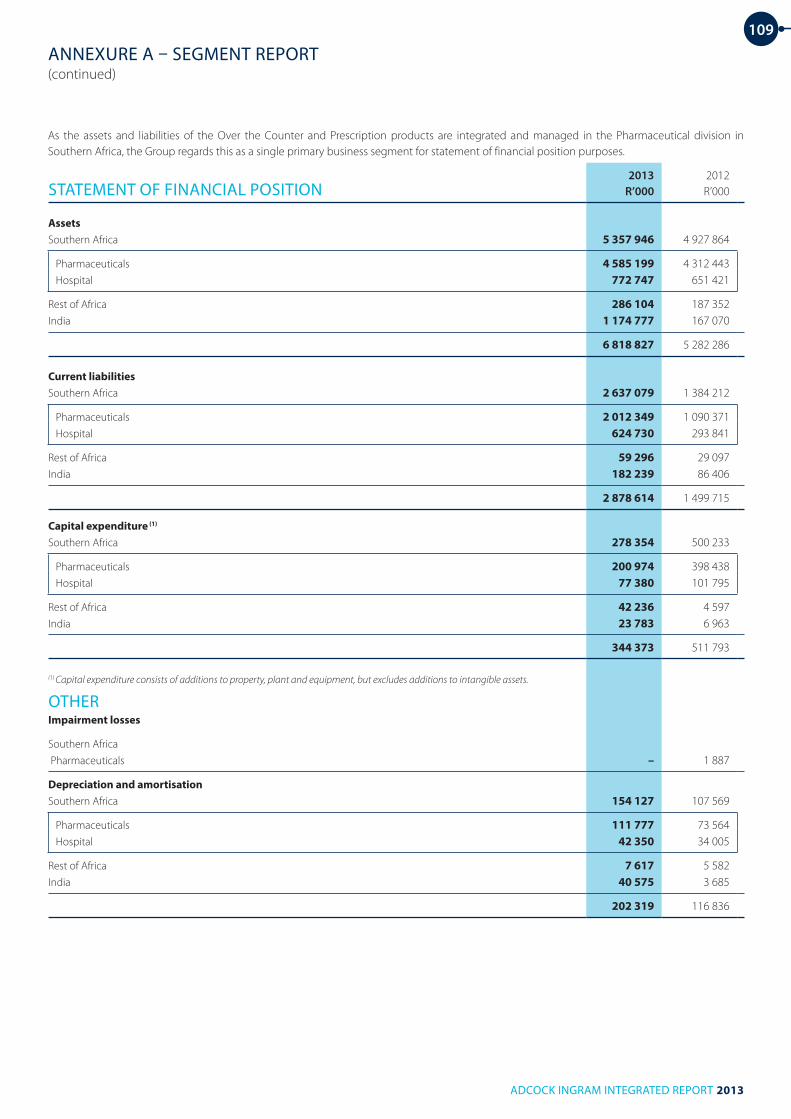
109
ADCOCK INGRAM INTEGRATED REPORT 2013
ANNEXURE A – SEGMENT REPORT(continued)
As the assets and liabilities of the Over the Counter and Prescription products are integrated and managed in the Pharmaceutical division in Southern Africa, the Group regards this as a single primary business segment for statement of financial position purposes.
STATEMENT OF FINANCIAL POSITION2013
R’0002012R’000
AssetsSouthern Africa 5 357 946 4 927 864
Pharmaceuticals 4 585 199 4 312 443Hospital 772 747 651 421
Rest of Africa 286 104 187 352India 1 174 777 167 070
6 818 827 5 282 286
Current liabilitiesSouthern Africa 2 637 079 1 384 212
Pharmaceuticals 2 012 349 1 090 371Hospital 624 730 293 841
Rest of Africa 59 296 29 097India 182 239 86 406
2 878 614 1 499 715
Capital expenditure (1)
Southern Africa 278 354 500 233
Pharmaceuticals 200 974 398 438Hospital 77 380 101 795
Rest of Africa 42 236 4 597India 23 783 6 963
344 373 511 793
(1) Capital expenditure consists of additions to property, plant and equipment, but excludes additions to intangible assets.
OTHERImpairment losses
Southern Africa Pharmaceuticals – 1 887
Depreciation and amortisationSouthern Africa 154 127 107 569
Pharmaceuticals 111 777 73 564Hospital 42 350 34 005
Rest of Africa 7 617 5 582India 40 575 3 685
202 319 116 836

110
ADCOCK INGRAM INTEGRATED REPORT 2013
ANNEXURE B – SHARE-BASED PAYMENT PLANS
A GENERAL EMPLOYEE SHARE-OPTION PLANCertain employees were entitled to join the general employee share-option plan, based on merit. The offer price was determined in accordance with the rules of the scheme. Options vest as follows:
• a third after three years;
• a third after four years; and
• a third after five years.
From January 2006, the option plan rules were changed from being an equity-settled scheme to a cash-settled scheme. Options under the cash-settled scheme have been issued at least annually by the Adcock Ingram Board of directors.
The expense recognised for employee services received during the year to 30 September 2013 is R11,7 million (2012: R6,7 million).
Equity settledThe following table illustrates the number and weighted average offer prices (WAOP) of and movements in Adcock Ingram share options during the year. No additional equity options were granted during the year.
2013 2012
Number WAOP Number WAOP
Outstanding at the beginning of the year 944 630 14,87 1 524 397 13,82 Reinstatement 18 200 16,63 – –Exercised and paid in full(1) (392 530) 12,99 (579 767) 12,12 Outstanding at the end of the year 570 300 16,20 944 630 14,87
Exercisable at the end of the year 570 300 16,20 944 630 14,87
(1) The weighted average share price at the date of exercise, for the options exercised is R56.57 (2012: R61.27).
2013 2012
Weighted average remaining contractual life for the share options outstanding at year-end 0 years 0.88 yearsRange of offer prices for options outstanding at the end of the year R13,62 – R28,33 R11,77 – R28,33
Share options are fair valued using a Black-Scholes model. The observable volatility in the market was the basis upon which the options were valued.
Loans to the amount of R433 756 relating to an Adcock Ingram employee and a former Adcock Ingram employee were outstanding at the end of the year (2012: R512 298).
Cash settledThe following table illustrates the number and weighted average offer prices (WAOP) of and movements in Adcock Ingram share options during the year:
2013 2012
Number WAOP Number WAOP
Outstanding at the beginning of the year 3 463 690 49,62 4 159 381 42,67 Granted during the year 1 327 148 53,99 1 038 271 60,24 Forfeited during the year (394 880) 54,56 (635 746) 50,53 Exercised during the year (527 444) 36,58 (1 098 216) 34,05
Outstanding at the end of the year 3 868 514 52,06 3 463 690 49,62
Vested and exercisable at the end of the year 515 710 38,37 114 793 33,28

111
ADCOCK INGRAM INTEGRATED REPORT 2013
ANNEXURE B – SHARE-BASED PAYMENT PLANS(continued)
A GENERAL EMPLOYEE SHARE-OPTION PLAN (continued)2013 2012
Weighted average remaining contractual life for the share options outstanding at year-end 3,52 years 3,74 years
Range of offer prices for options outstanding at the end of the year R28,27 – R62,29 R28,27 – R62,29
Carrying amount of the liability relating to the cash-settled options at year-end (R million) 39,15 39,98
Given the limited trading history of Adcock Ingram, long dated volatility is calculated as a weighted average of historical volatility of shares in the Pharmaceuticals and Biotechnology sectors for terms matching the remaining life of each option. Shorter dated volatility is based on the historical volatility of the Adcock Ingram share price matching the remaining life of each option. The valuation is measured at fair value (excluding any non-market vesting conditions) and is the sum of the intrinsic value plus optionality. The fair value of each option is estimated using an explicit finite-difference option pricing model. All options are valued with an European expiry profile, i.e. with a single exercise date at maturity.
B BLACK MANAGERS SHARE TRUSTIn terms of the Tiger Brands Limited BEE transaction implemented on 17 October 2005, 4 381 831 Tiger Brands shares were acquired by the Tiger Brands Black Managers Share Trust. Allocation of vested rights to these shares was made to black managers. The allocation of vested rights entitles beneficiaries to receive Tiger Brands and Adcock Ingram shares (after making capital contributions to the Black Managers Share Trust) at any time after the defined lock-in period, i.e. from 1 January 2015. These vested rights are non-transferable.
From 1 January 2015, the beneficiaries may exercise their vested rights, in which event the beneficiary may:
• instruct the trustees to sell all of their shares and distribute the proceeds to them, net of the funds required to pay the capital contributions, taxation (including employees' tax), costs and expenses;
• instruct the trustees to sell sufficient shares to fund the capital contributions, pay the taxation (including employees' tax), costs and expenses and distribute to them the remaining shares to which they are entitled; or
• fund the capital contributions, taxation (including employees' tax), costs and expenses themselves and receive the shares to which they are entitled.
2013 2012
Expense recognised for employee services received during the year (R million) 6,7 3,6Number of participation rights allocated to Adcock Ingram employees at year-end 1 068 982 1 135 900 Weighted average remaining contractual life for the share options outstanding at year-end 1,55 years 2,86 years
No weighted average exercise price has been calculated as there were no options exercised.
Participation rights were valued using the Monte-Carlo simulation approach to estimate the average, optimal pay-off of the participation rights using 5 000 permutations. The pay-off of each random path was based on:
• the projected Tiger Brands/Adcock Ingram share price;
• outstanding debt projections; and
• optimal early exercise conditions.
C BLACK ECONOMIC EMPOWERMENT (BEE) TRANSACTION Adcock Ingram entered into a BEE transaction on 9 April 2010 as part of its efforts to achieve the objectives set out in the broad-based Black Economic Empowerment Codes of Good Practice with the intention to embrace broad-based equity participation as a key transformation initiative.
BEE participantsThe entities which participated in the transaction are:
• The strategic partners, who collectively participate through a single investment vehicle, namely Blue Falcon Trading 69 (Pty) Limited (Blue Falcon); and
• Qualifying employees, who participate through the Mpho ea Bophelo Trust (Bophelo Trust).
Blue Falcon's shareholders are as follows:
• Kagiso Strategic Investments III (Pty) Limited (62,9%);
• Kurisani Youth Development Trust (26,6%); and
• Mookodi Pharma Trust (10,5%)

112
ADCOCK INGRAM INTEGRATED REPORT 2013
ANNEXURE B – SHARE-BASED PAYMENT PLANS(continued)
C BLACK ECONOMIC EMPOWERMENT (BEE) TRANSACTION (continued)Estimated economic costsThe total value of the transaction was R1,321 billion, based on the 10-day VWAP of R50,91 per ordinary share on the JSE as at the close of trade on Thursday, 19 November 2009, being the date when the Memorandum of Understanding was signed.
IFRS 2 sets out the basis for calculating the economic cost shown above and the valuation uses the following key inputs or assumptions:
• The Black-Scholes model for valuing options;
• The actual or likely conversion dates attached to the A and B ordinary shares; and
• Using available open-market data, estimated expected future ordinary share prices as determined using option pricing models and an estimation of the future dividends at given dates.
These calculations derive an expected future cost associated with the transaction that is then discounted to the present.
The expense recognised for employee services during the year amounts to R15,1 million (2012: R16,4 million) after allocations were made to staff on 31 March 2013 at a fair value of R13,72 per option.
The following table illustrates the movement in units issued to employees during the year:
Equity-settled2013 2012
Number Number
Outstanding at the beginning of the year 4 979 100 4 977 000 Granted during the year 321 300 403 200 Forfeited during the year (203 000) (401 100) Paid out during the year(1) (461 300) –
Outstanding at the end of the year 4 636 100 4 979 100
Vested at the end of the year 1 698 900 1 305 500
Exercisable at the end of the year(2) 100 100 433 300
Available for future distribution to qualifying employees 1 388 665 1 506 965
1) Paid out options that became exercisable as a result of death, disability, retirement or retrenchment.2) Became exercisable as a result of death, disability, retirement or retrenchment.
Key terms and contractual obligationsThe key terms of the A and B ordinary shares and the key contractual obligations of the holders of A and B ordinary shares are as follows:
• Adcock Ingram has the right to repurchase all or some of these shares at the end of the respective transaction terms in accordance with a call option formula;
• These shares will not be listed but will be considered in determining a quorum and will be entitled to vote on any or all resolutions proposed at general/annual meetings;
• The shares will automatically convert into ordinary shares at the end of the respective transaction terms;
• The shares will be entitled to ordinary dividends and dividends in specie pari passu with the ordinary shares;
• During the lock-in period, Blue Falcon will be entitled to retain 15% of the ordinary dividends received by it in respect of the A ordinary shares. The Bophelo Trust will not be entitled to retain any of the ordinary dividends received in respect of the B ordinary shares;
• The balance of the ordinary dividends received by Blue Falcon and all ordinary dividends received by the Bophelo Trust, will on a compulsory basis be used, within a period of 30 business days after receipt, to purchase ordinary shares;
• 100% of the dividends received on the ordinary shares compulsorily acquired by Blue Falcon and the Bophelo Trust must likewise be utilised to purchase ordinary shares;
• All such ordinary shares compulsorily acquired will also be subject to the call option, to the extent required;
• Blue Falcon may deal with any dividends in specie received as it deems fit while the Bophelo Trust will hold any in specie dividends received for the benefit of the beneficiaries;
• A and B ordinary shares and compulsorily acquired ordinary shares will not be entitled to receive special dividends until such time as the notional loan outstanding has reduced to zero; and
• An equivalent amount of any special dividends which would otherwise have been received by the BEE participants shall be offset against the notional outstanding loan with effect from the date on which such special dividends are paid to ordinary shareholders.

113
ADCOCK INGRAM INTEGRATED REPORT 2013
ANNEXURE C – DEFINED BENEFIT PLAN
The Company and its subsidiaries contribute to a retirement contribution plan for employees in South Africa. These contributions are expensed. In addition, the Company and its subsidiaries contribute to a retirement benefit fund in respect of certain retirees. The defined benefit plan is funded. The assets of the funds are held in independent trustee administered funds, administered in terms of the Pension Funds Act of 1956 (Act 24), as amended. Funds must, in terms of the Pension Fund Act, be valued at least every three years. The last full actuarial valuation was performed on 30 September 2013.
For purposes of production of these disclosures, and in order to comply with the requirements of IAS 19, valuations have been performed by independent actuaries, using the projected unit method. Where valuations were not possible due to the limited availability of complete data, roll forward projections of prior completed actuarial valuations were used, taking account of actual subsequent experience.
The disclosure of the funded status is for accounting purposes only, and does not necessarily indicate any assets available to the Group.
2013 2012 2011 2010 2009R'000 R'000 R'000 R'000 R'000
Net benefit expenseCurrent service cost 68 346 65 605 57 711 64 347 49 768 Interest cost on benefit obligation 376 543 597 694 683 Expected return on plan assets (645) (988) (1 169) (1 455) (8 504) Effect of paragraphs 58 and 58A 269 540 (911) 24 170 5 134 Settlement costs – 767 – – –
Net benefit expense 68 346 66 467 56 228 87 756 47 081
Actual return on plan assets 1 690 2 709 1 978 (2 514) 32 491
Benefit liabilityDefined benefit obligation (2 612) (5 226) (8 278) (7 283) (7 581) Fair value of plan assets 9 765 11 772 15 317 17 369 20 145
7 153 6 546 7 039 10 086 12 564 Unrecognised actuarial gains (7 153) (6 546) (7 039) (10 086) (7 411)
– – – – 5 153
Changes in the present value of the defined benefit obligation are as follows:Defined benefit obligation at 1 October (5 226) (8 278) (7 283) (7 581) (7 453) Interest cost (376) (543) (597) (694) (683) Contribution 68 346 65 605 57 711 64 347 49 768 Current service cost (68 346) (65 605) (57 711) (64 347) (49 768) Benefits paid 317 69 74 100 143 Settlement liability – 4 325 – – – Actuarial gains/(losses) on obligation 2 673 (799) (472) 892 412
Defined benefit obligation at 30 September (2 612) (5 226) (8 278) (7 283) (7 581)
Changes in the fair value of the defined benefit plan assets are as follows:Fair value of plan assets at 1 October 11 772 15 317 17 369 20 145 92 007 Expected return 645 988 1 169 1 455 8 504 Utilisation of asset from defined contribution fund – – – (5 190) (29 650) Benefits paid (317) (69) (74) (100) (143) Amount settled – (4 325) – – – Actuarial (loss)/gain (2 335) (139) (3 147) 1 059 (50 573)
Fair value of plan assets at 30 September 9 765 11 772 15 317 17 369 20 145
Asset coverage over liabilities (times) 3,7 2,3 1,9 2,4 2,7
The assumptions used in the valuations are as follows:% % % % %
Discount rate 8,50 7,25 8,75 8,25 9,25Expected rate of return on assets 8,50 5,50 8,75 6,75 9,25Future salary increases 7,10 6,25 6,75 6,25 6,75Future pension increases 6,10 5,25 3,57 3,10 4,05
Estimated asset compositionCash 72,80 81,10 43,14 61,61 Equity – – 33,97 – Bonds 27,20 18,90 6,13 38,39 Property – – 6,37 – International – – 10,39 –
Total 100,00 100,00 100,00 100,00

114
ADCOCK INGRAM INTEGRATED REPORT 2013
ANNEXURE D – POST-RETIREMENT MEDICAL LIABILITY
The Company and its subsidiaries operate a post-employment medical benefit scheme that covers certain retirees and one employee still in service. The liabilities are valued annually using the projected unit credit method prescribed by IAS 19. The latest full actuarial valuation was performed on 30 September 2013.
The following table summarises the components of net benefit expense recognised in the statement of comprehensive income, the funded status and amounts recognised in the statement of financial position:
2013 2012 2011 2010 2009R’000 R’000 R’000 R’000 R’000
Net benefit expenseCurrent service cost 27 – – – 27 Interest cost on benefit obligation 1 068 1 169 1 356 1 230 1 211 Effect of paragraphs 58 and 58A – – – – –
1 095 1 169 1 356 1 230 1 238
Defined benefit obligation at 1 October (15 341) (13 987) (15 808) (14 298) (13 698) Interest cost (1 068) (1 169) (1 356) (1 230) (1 211) Current service cost (27) – – – (27) Benefits paid 1 138 1 162 1 287 1 168 994 Actuarial gains/(losses) on obligation 190 (1 347) 1 890 (1 448) (356)
Defined benefit obligation at 30 September (15 108) (15 341) (13 987) (15 808) (14 298)
The assumptions used in the valuations are as follows:% % % % %
Discount rate 8,60 7,25 8,75 8,25 9,25CPI increase 6,00 5,00 5,75 6,75 7,25Healthcare cost inflation 8,00 7,00 7,75 7,25 7,25
Post-retirement mortality table PA(90) ultimate
table
PA(90) ultimate
table
PA(90) ultimate
table
PA(90) ultimate
table
PA(90) ultimate
table
R’000 R’000 R’000 R’000 R’000
SensitivityA one percentage point increase in the assumed rate of healthcare cost inflation would have the following effects on the post-retirement medical aid liability:
Increase of the interest cost 136 124 113 121 120 Increase of the liability 1 500 1 613 1 288 1 474 1 320
A one percentage point decrease in the assumed rate of healthcare cost inflation would have the following effects on the post-retirement medical aid liability:
Decrease of the interest cost 116 105 97 105 102 Decrease of the liability 1 277 1 363 1 110 1 268 1 142

115
ADCOCK INGRAM INTEGRATED REPORT 2013
ANNEXURE E – FINANCIAL INSTRUMENTS
FAIR VALUE HIERARCHYClassification of financial instruments and fair value hierarchy
Financial instruments Classification per IAS 39Statement of financial position line item
2013R'000
2012R'000
Investments(1) Available for sale Other financial assets 2 334 2 321 Black Managers Share Trust Loans and receivables Other financial assets 137 312 137 430 Loans receivable Loans and receivables Loan receivable 16 489 27 060 Trade and other receivables Loans and receivables Trade and other receivables 1 526 524 1 184 212 Foreign exchange contracts – derivative asset(2) Fair value cash flow hedge Trade and other receivables 6 012 962 Cash and cash equivalents Loans and receivables Cash and cash equivalents 163 070 492 716 Long-term borrowings Loans and borrowings Long-term borrowings 5 172 104 625 Trade and other payables Loans and borrowings Trade and other payables 1 292 379 979 598 Short-term borrowings Loans and borrowings Short-term borrowings 135 507 431 368 Bank overdraft Loans and borrowings Bank overdraft 1 307 993 –(1) Level 3. Fair value based on latest available selling price.(2) Level 2. Fair value based on the ruling market rate at year-end.
The Group uses the following hierarchy for determining and disclosing the fair value of financial instruments measured at fair value by valuation technique:Level 1 – quoted prices in active markets;Level 2 – other techniques for which all inputs which have a significant effect on the recorded fair value are observable, either directly or
indirectly; andLevel 3 – techniques which use inputs which have a significant effect on the recorded fair value that are not based on observable market data.
FINANCIAL RISK MANAGEMENT OBJECTIVES AND POLICIESThe Group’s principal financial liabilities comprise borrowings, bank overdrafts and trade payables. The main purpose of these financial liabilities is to raise finance for the Group’s operations. The Group has various financial assets such as trade and other receivables, loans receivable and cash which arise directly from its operations. The Group also enters into derivative transactions via forward currency contracts. The purpose is to manage the currency risks arising from the Group’s operations.
It is, and has been throughout 2013, the Group’s policy that no trading in derivatives shall be undertaken.
The main risks arising from the Group’s financial instruments are interest rate, credit, liquidity and foreign currency. The Board of directors reviews and agrees policies for managing each of these risks which are summarised below:
Interest rate riskThe Group is exposed to interest rate risk as the following assets and liabilities carry interest at rates that vary in response to the lending rates in South Africa, India, Ghana and Zimbabwe:
• Cash balances which are subject to movements in the bank deposit rates; and• Long-term and short-term debt obligations with floating interest rates linked to the Johannesburg Interbank Agreed Rate, the South African prime
and Indian bank lending rates.
The Group’s policy is to manage its interest rate risk through both fixed and variable, long-term and short-term instruments at various approved financial institutions.
No financial instruments are entered into to mitigate the risk of interest rates.
The following table demonstrates the sensitivity to a reasonably possible change in interest rates, with all other variables held constant, of the Group’s profit before tax (through the impact on balances subject to floating rates):
Change in rate(Decrease)/Increase in profit before tax
%2013
R’0002012R’000
LiabilitiesIndian Rupee loans +1 (297) (214)South African loans at variable rates +1 (1 014) (5 043)
Cash balancesCash and cash equivalents +1 1 631 4 927 Bank overdraft +1 (13 080) –

116
ADCOCK INGRAM INTEGRATED REPORT 2013
ANNEXURE E – FINANCIAL INSTRUMENTS(continued)
FINANCIAL RISK MANAGEMENT OBJECTIVES AND POLICIES (continued)Credit riskFinancial assets of the Group which are subject to credit risk consist mainly of cash resources, loans receivables and trade receivables. The maximum exposure to credit risk is set out in the respective cash, loans receivable and accounts receivable notes. The Group’s exposure to credit risk arises from default of the counterparty, with a maximum exposure equal to the carrying amount of these instruments.
Cash resources are placed with various approved financial institutions subject to approved limits. All these institutions are credit worthy.
The Group trades only with recognised, credit worthy third parties. It is the Group’s policy that all customers who wish to trade on credit terms are subject to credit verification procedures. In addition, receivable balances are monitored on an ongoing basis with the result that the Group’s historical exposure to bad debts is not significant. For transactions that do not occur in the country of the relevant operating unit, the Group does not offer credit terms without the approval of the Corporate office. Apart from the South African Government, which comprises 12,5% (R175 million) of trade receivables, there are no significant concentrations of credit risk within the Group arising from the financial assets of the Group.
Substantially all debtors are non-interest-bearing and repayable within 30 to 90 days.
Debtors are disclosed net of a provision for impairment.
Liquidity riskAlthough the Group is in a net debt position it has limited exposure to liquidity risk as all obligations in the foreseeable future will be met.
The Group manages its risk to a shortage of funds using planning mechanisms. This considers the maturity of both its financial liabilities and financial assets and projected cash flows from operations. The Group’s objective is to maintain a balance between continuity of funding and flexibility through the use of bank overdrafts and bank loans.
The maturity profile of the Group’s long-term financial liabilities at 30 September 2013, based on contractual undiscounted payments, is shown in note 21 and the maturity profile of the trade and other payables in note 23.
Foreign currency riskAs the Group operates in various countries and undertakes transactions denominated in foreign currencies, exposures to foreign currency fluctuations arise. Exchange rate exposures on transactions are managed within approved policy parameters utilising forward exchange contracts in conjuction with external consultants who provide financial services to Group companies as well as contributing to the management of the financial risks relating to the Group’s operations.
Foreign operationsIn translating the foreign operations, the following exchange rates were used:
2013 2013 2012 2012
Income/Expenses
Assets/Liabilities
Income/Expenses
Assets/Liabilities
Average (Rand)
Spot (Rand)
Average (Rand)
Spot (Rand)
Kenyan Shilling 0.1069 0.1168 0.0927 0.0972Ghanaian Cedi 4.6638 4.6125 4.4949 4.3687United States Dollar 9.3092 10.0505 – – Indian Rupee 0.1647 0.1605 0.1539 0.1569
Foreign assets/liabilitiesIn converting foreign denominated assets and liabilities, the following exchange rates were used:
AssetsRand
LiabilitiesRand
AverageRand
2013US Dollar 10.05 10.05 10.05 Euro 13.61 13.59 13.60
2012US Dollar 8.31 8.27 8.29 Euro 10.71 10.66 10.69
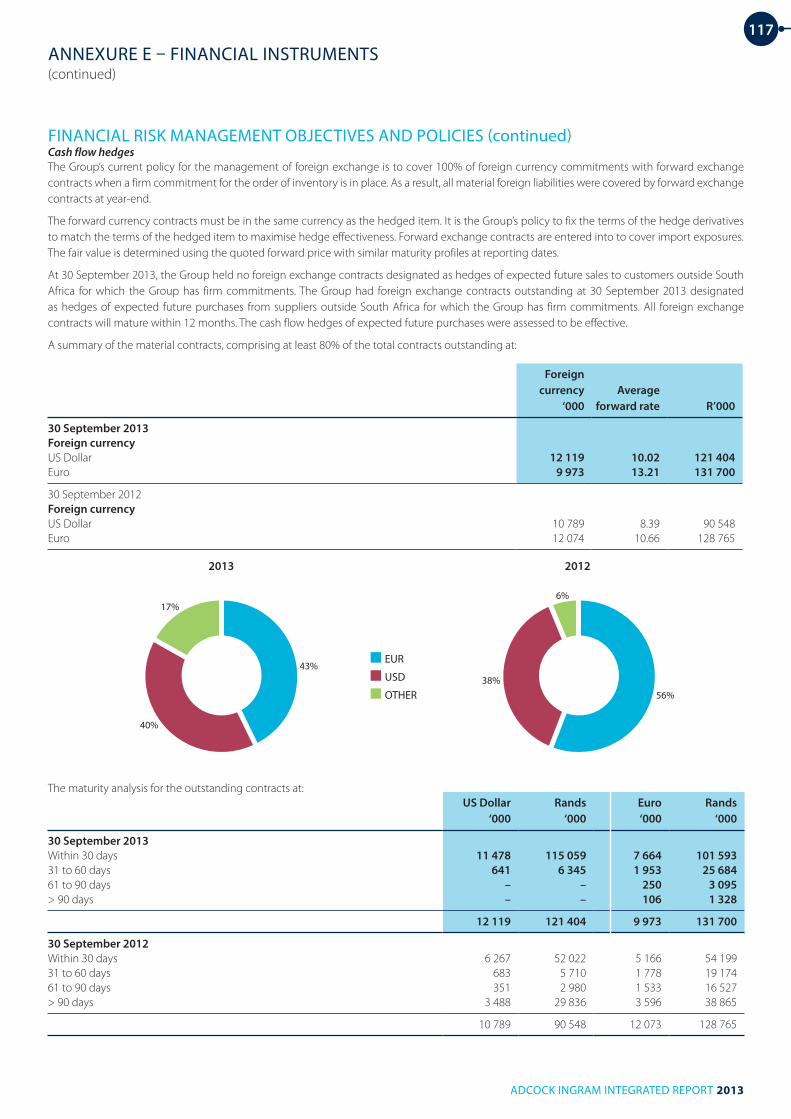
117
ADCOCK INGRAM INTEGRATED REPORT 2013
ANNEXURE E – FINANCIAL INSTRUMENTS(continued)
FINANCIAL RISK MANAGEMENT OBJECTIVES AND POLICIES (continued)Cash flow hedgesThe Group’s current policy for the management of foreign exchange is to cover 100% of foreign currency commitments with forward exchange contracts when a firm commitment for the order of inventory is in place. As a result, all material foreign liabilities were covered by forward exchange contracts at year-end.
The forward currency contracts must be in the same currency as the hedged item. It is the Group’s policy to fix the terms of the hedge derivatives to match the terms of the hedged item to maximise hedge effectiveness. Forward exchange contracts are entered into to cover import exposures. The fair value is determined using the quoted forward price with similar maturity profiles at reporting dates.
At 30 September 2013, the Group held no foreign exchange contracts designated as hedges of expected future sales to customers outside South Africa for which the Group has firm commitments. The Group had foreign exchange contracts outstanding at 30 September 2013 designated as hedges of expected future purchases from suppliers outside South Africa for which the Group has firm commitments. All foreign exchange contracts will mature within 12 months. The cash flow hedges of expected future purchases were assessed to be effective.
A summary of the material contracts, comprising at least 80% of the total contracts outstanding at:
Foreign currency
‘000Average
forward rate R’000
30 September 2013Foreign currencyUS Dollar 12 119 10.02 121 404Euro 9 973 13.21 131 700
30 September 2012Foreign currencyUS Dollar 10 789 8.39 90 548 Euro 12 074 10.66 128 765
The maturity analysis for the outstanding contracts at:US Dollar
‘000Rands
‘000Euro‘000
Rands‘000
30 September 2013Within 30 days 11 478 115 059 7 664 101 59331 to 60 days 641 6 345 1 953 25 68461 to 90 days – – 250 3 095> 90 days – – 106 1 328
12 119 121 404 9 973 131 700
30 September 2012Within 30 days 6 267 52 022 5 166 54 19931 to 60 days 683 5 710 1 778 19 17461 to 90 days 351 2 980 1 533 16 527> 90 days 3 488 29 836 3 596 38 865
10 789 90 548 12 073 128 765
■ EUR
■ USD
■ OTHER
43%
17%
40%
6%
38%56%
2013 2012

118
ADCOCK INGRAM INTEGRATED REPORT 2013
ANNEXURE E – FINANCIAL INSTRUMENTS(continued)
FINANCIAL RISK MANAGEMENT OBJECTIVES AND POLICIES (continued)A summary of the material contracts settled during the year ended:
Foreign currency
'000Average
forward rate R'000
30 September 2013Foreign currencyUS Dollar 72 013 9.20 662 650 Euro 41 762 11.71 489 050 Swedish Krona (SEK) 77 767 1.36 105 951
30 September 2012Foreign currencyUS Dollar 48 574 7.85 381 483 Euro 27 542 10.50 289 294 Swedish Krona (SEK) 67 445 1.17 78 935
■ 2013
■ 2012
USD EUR SEK
12.00
10.00
8.00
6.00
4.00
2.00
0
USD EUR SEK
700 000
600 000
500 000
400 000
300 000
200 000
100 000
0
■ 2013
■ 2012
USD EUR SEK
12.00
10.00
8.00
6.00
4.00
2.00
0
USD EUR SEK
700 000
600 000
500 000
400 000
300 000
200 000
100 000
0
■ 2013
■ 2012
USD EUR SEK
12.00
10.00
8.00
6.00
4.00
2.00
0
USD EUR SEK
700 000
600 000
500 000
400 000
300 000
200 000
100 000
0
R’00
0 se
ttle
d
Ave
rage
forw
ard
rate

119
ADCOCK INGRAM INTEGRATED REPORT 2013
ANNEXURE E – FINANCIAL INSTRUMENTS(continued)
FINANCIAL RISK MANAGEMENT OBJECTIVES AND POLICIES (continued)The following table demonstrates the sensitivity to change in foreign currencies, with all other variables held constant, of the Group’s profit before tax (due to changes in the fair value of monetary assets and liabilities) and the Group’s equity (due to changes in the fair value of open forward exchange contracts and net investments hedges):
Change in rate
%
Increase/ (Decrease)
in profit before tax
R’000
Increase/ (Decrease)
in other comprehensive
incomeR’000
2013US Dollar
+10 2 218 8 783 -10 (2 218) (8 783)
Euro+10 6 107 9 794 -10 (6 107) (9 794)
2012US Dollar
+10 878 6 494 -10 (878) (6 494)
Euro+10 1 607 9 368 -10 (1 607) (9 368)
Capital managementThe primary objective of the Group’s capital management is to ensure that it maintains a strong credit rating and healthy capital ratios, in order to support its business and maximise shareholder value. The Group manages its capital structure and makes adjustments to it, in light of changes in economic conditions. To maintain or adjust the capital structure, the Group may adjust the dividend payment to shareholders, return capital to shareholders, issue new shares or repurchase shares.
The Group monitors its capital using gearing and interest cover ratios. The primary methods of measurement used are interest-bearing debt to total equity and annualised EBITDA, and interest cover. The Group is currently well within acceptable industry norms on all of these measures.
2013R’000
2012R’000
Interest-bearing loans and borrowings 1 448 672 535 993 Less: Cash and short-term deposits (163 070) (492 716)
Net debt 1 285 602 43 277 Equity 3 780 867 3 560 695
Gearing ratio % 34 1

120
ADCOCK INGRAM INTEGRATED REPORT 2013
ANNEXURE F – INTEREST IN JOINT VENTURES
1 ADCOCK INGRAM LIMITED (INDIA)Adcock Ingram Holdings Limited has a 49,9% interest in Adcock Ingram Limited (India), a jointly controlled entity which is a manufacturer of pharmaceutical products.
The Group’s share of the assets, liabilities, income and expenses of the jointly controlled entity at 30 September and for the years then ended, which are included in the consolidated financial statements, before eliminating inter-company transactions, are as follows:
2013R’000
2012R’000
Non-current assets 74 945 68 884 Current assets 119 041 90 468
Total assets 193 986 159 352
Non-current liabilities 17 502 8 798 Current liabilities 82 411 85 755
Total liabilities 99 913 94 553
Revenue 208 810 133 083
Turnover 208 290 132 942 Cost of sales (148 781) (91 831)
Gross profit 59 509 41 111 Selling and distribution expenses (127) (215)Administrative expenses (3 906) (15 197)
Operating profit 55 476 25 699 Finance income 520 141 Finance costs (2 128) (3 143)
Profit before taxation 53 868 22 697 Taxation (17 241) (7 447)
Profit for the year 36 627 15 250

121
ADCOCK INGRAM INTEGRATED REPORT 2013
ANNEXURE F – INTEREST IN JOINT VENTURES(continued)
2 NATIONAL RENAL CARE (PTY) LIMITEDAdcock Ingram Critical Care (Pty) Limited has a 100% interest in Dilwed Investments (Pty) Limited, which in turn has a 50% interest in National Renal Care (Pty) Limited, a jointly controlled entity which supplies renal healthcare services.
The Group’s share of the assets, liabilities, income and expenses of the jointly controlled entity at 30 September and for the years then ended, which are included in the consolidated financial statements, before eliminating inter-company transactions, are as follows:
2013R’000
2012R’000
Non-current assets 68 640 40 484 Current assets 84 019 79 746
Total assets 152 659 120 230
Non-current liabilities 2 919 3 221 Current liabilities 52 615 65 615
Total liabilities 55 534 68 836
Revenue 347 164 289 762
Turnover 344 663 287 977 Cost of sales (271 030) (249 058)
Gross profit 73 633 38 919 Administrative expenses (21 586) (11 910)
Operating profit 52 047 27 009 Finance income 2 501 1 785 Finance costs (358) (4 902)Profit attributable to an associate 2 663 –
Profit before taxation 56 853 23 892 Taxation (16 510) (8 190)
Profit for the year 40 343 15 702
3 THEMBALAMI PHARMACEUTICALS (PTY) LIMITEDAdcock Ingram Holdings Limited has a 50% interest in Thembalami Pharmaceuticals (Pty) Limited, a jointly controlled entity which is dormant. At September 2013 and 2012 the shareholders’ deficit was R2 698 642, of which R1 349 321 relates to the Group.
There are no contingent liabilities or other commitments relating to the joint ventures.
Please refer to Annexure I which discloses the details should the joint ventures be equity accounted.

122
ADCOCK INGRAM INTEGRATED REPORT 2013
ANNEXURE G – INTEREST IN SUBSIDIARY COMPANIES, JOINT VENTURES AND ASSOCIATES
Share-holding
2013%
Share-holding
2012%
SubsidiariesAdcock Ingram Limited 100 100Adcock Ingram Healthcare (Pty) Limited 100 100Adcock Ingram Intellectual Property (Pty) Limited 100 100Adcock Ingram Critical Care (Pty) Limited 100 100Adcock Ingram International (Pty) Limited 100 100Tender Loving Care – Hygienic, Cosmetic and Baby Products (Pty) Limited 100 100
Joint venturesThembalami Pharmaceuticals (Pty) Limited 50 50Adcock Ingram Limited (India) 49,9 49,9
Indirect holdingsAdcock Ingram Pharmaceuticals (Pty) Limited 100 100Premier Pharmaceutical Company (Pty) Limited 100 100Metamorphosa (Pty) Limited 50 50Menarini SA (Pty) Limited 49 49Novartis Ophthalmics (Pty) Limited 49 49Batswadi Biotech (Pty) Limited 45 45Bioswiss (Pty) Limited 51 51Addclin Research (Pty) Limited 100 100Adcock Ingram Intellectual Property No 1 (Pty) Limited 100 100Dilwed Investments (Pty) Limited 100 100Adcock Ingram Namibia (Pty) Limited 100 100National Renal Care (Pty) Limited 50 50Pharmalabs (Jersey) Limited 100 50Datlabs (Private) Limited 100 50Adcock Ingram Healthcare Private Limited (India) 100 100Adcock Ingram East Africa Limited 100 100Ayrton Drug Manufacturing Limited (Ghana) 78,32 78,14Ayrton Drug Manufacturing Limited (Sierra Leone) 78,32 78,14
Trusts and special purpose entitiesAdcock Ingram Holdings Limited Employee Share Trust (2008)Mpho ea Bophelo TrustBlue Falcon Trading 69 (Pty) LimitedOwner-driver companies (12 entities)

123
ADCOCK INGRAM INTEGRATED REPORT 2013
ANNEXURE G – INTEREST IN SUBSIDIARY COMPANIES, JOINT VENTURES AND ASSOCIATES(continued)
Premier Pharmaceutical
Company (Pty) Ltd
Metamorphosa (Pty) Ltd
Adcock Ingram Pharmaceuticals
(Pty) Ltd
Adcock Ingram Ltd
Adcock Ingram Holdings Ltd
Adcock Ingram Ltd (India)
Datlabs (Private) Ltd
Adcock Ingram Intellectual
Property No 1 (Pty) Ltd
Adcock Ingram Intellectual
Property (Pty) Ltd
Addclin Research (Pty) Ltd
Adcock Ingram Healthcare Private Ltd
(India)
Bioswiss (Pty) Ltd
Adcock Ingram Healthcare
(Pty) Ltd
Thembalami Pharmaceuticals
(Pty) Ltd
Pharmalabs (Jersey) Ltd
Menarini SA (Pty) Ltd
Novartis Ophthalmics
(Pty) Ltd
Batswadi Biotech (Pty) Ltd
Tender Loving Care – Hygienic,
Cosmetic and Baby Care Products
(Pty) Ltd
Dilwed Investments
(Pty) Ltd
National Renal Care (Pty) Ltd
Adcock Ingram (Namibia) (Pty) Ltd
Adcock Ingram Critical Care
(Pty) Ltd
Ayrton Drug Manufacturing Ltd
(Ghana)
Ayrton Drug Manufacturing Ltd
(Sierra Leone)
Adcock Ingram East Africa Ltd
(Kenya)
Adcock Ingram International
(Pty) Ltd
Blue Falcon Trading 69
(Pty) Ltd
Adcock Ingram Holdings Limited Employee Share
Trust (2008)
Owner driver
companies*
Mpho ea Bophelo Trust
Trusts and special purpose entities
100%
100%
100%
49.9%
100%
100%
100%
50%
100%
45%
100%
100%
51%
49% 10%
51% 90%
100%
49%
100%
100%
78.32%
50%
100%
50%
49% 100%100%
* Consists of 12 entities

124
ADCOCK INGRAM INTEGRATED REPORT 2013
ANNEXURE H – ACCOUNTING POLICIES
The principal accounting policies applied in the preparation and presentation of the annual financial statements are set out below:
BASIS OF CONSOLIDATIONThe consolidated financial statements include the financial statements of the Company and its subsidiaries, joint ventures, associates and special purpose entities deemed to be controlled by the Group. The financial results of the subsidiaries are prepared for the same reporting period using consistent accounting policies.
Investments in subsidiaries in the Company’s financial statements are accounted for at cost less any impairments.
The results of subsidiaries acquired are included in the consolidated financial statements from the date of acquisition, being the date on which the Group obtains control, and continue to be consolidated until the date such control ceases.
Subsidiaries acquired with the intention of disposal within 12 months are consolidated in line with the principles of IFRS 5 Non-current Assets Held for Sale and Discontinued Operations and disclosed as held for sale. All intra-Group transactions, balances, income and expenses are eliminated on consolidation. Non-controlling interests represent the equity in a subsidiary not attributable, directly or indirectly, to the parent. These interests are presented separately in the consolidated statement of comprehensive income, and in the consolidated statement of financial position, separately from own shareholders’ equity.
A change in the ownership interest of a subsidiary, without a change of control, is accounted for as an equity transaction. Losses are attributed to any relevant non-controlling interest even if that results in a deficit balance.
If the Group loses control over a subsidiary, it:
• derecognises the assets (including goodwill) and liabilities of the subsidiary;
• derecognises the carrying amount of any non-controlling interest;
• derecognises the cumulative translation differences recorded in equity;
• recognises the fair value of the consideration received;
• recognises the fair value of any investment retained;
• recognises any surplus or deficit in profit or loss; and
• reclassifies the parent’s share of components previously recognised in other comprehensive income to profit or loss, or retained earnings, as appropriate.
UNDERLYING CONCEPTSThe financial statements are prepared on the going-concern basis, which assumes that the Group will continue in operation for the foreseeable future.
The financial statements are prepared using the accrual basis of accounting whereby the effects of transactions and other events are recognised when they occur, rather than when the cash is received or paid.
Assets and liabilities and income and expenses are not offset unless specifically permitted by an accounting standard. Financial assets and financial liabilities are only offset when there is a legally enforceable right to offset, and the intention is either to settle on a net basis or to realise the asset and settle the liability simultaneously.
Accounting policies are the specific principles, bases, conventions, rules and practices applied in preparing and presenting financial statements. Changes in accounting policies are accounted for in accordance with the transitional provisions in the standard. If no such guidance is given, they are applied retrospectively. If after making every reasonable effort to do so, it is impracticable to apply the change retrospectively, it is applied prospectively from the beginning of the earliest period practicable.
Changes in accounting estimates are adjustments to assets or liabilities or the amounts of periodic consumption of assets that result from new information or new developments. Such changes are recognised in profit or loss in the period they occur.
Prior period errors are omissions or misstatements in the financial statements of one or more prior periods. They may arise from a failure to use, or misuse of reliable information that was available at the time or could reasonably be expected to have been obtained. Where prior period errors are material, they are retrospectively restated. If it is impracticable to do so, they are corrected prospectively from the beginning of the earliest period practicable.
FOREIGN CURRENCIESThe consolidated financial statements are presented in South African Rands (Rands), which is the Group’s functional and presentational currency. Each foreign entity in the Group determines its own functional currency.
Foreign currency transactionsTransactions in foreign currencies are recorded at the rates of exchange ruling at the transaction date.

125
ADCOCK INGRAM INTEGRATED REPORT 2013
ANNEXURE H – ACCOUNTING POLICIES (continued)
Foreign currency balancesMonetary assets and liabilities denominated in foreign currencies are translated at the functional currency rate of exchange ruling at the reporting date. Exchange differences are taken to profit or loss, except for differences arising on foreign currency borrowings that provide a hedge against a net investment in a foreign entity. These are taken directly to other comprehensive income until the disposal of the net investment, at which time they are recognised in profit or loss. Tax charges and credits attributable to such exchange differences are also accounted for in other comprehensive income.
If non-monetary items measured in a foreign currency are carried at historical cost, the exchange rate used is the rate applicable at the initial transaction date. If they are carried at fair value, the rate used is the rate at the date when the fair value was determined.
The gain or loss arising on retranslation of non-monetary items is treated in line with the recognition of gain or loss on change in fair value of the item (i.e. translation differences on items whose fair value gain or loss is recognised in other comprehensive income or profit or loss is also recognised in other comprehensive income or profit or loss, respectively).
Foreign operationsAt the reporting date, the assets and liabilities of the foreign operations are translated into the presentation currency of the Group (Rands) at the exchange rate ruling at the date of the statement of financial position. Items of profit or loss are translated at the weighted average exchange rate for the year. Exchange differences are taken directly to a separate component of other comprehensive income. On disposal of a foreign operation, the deferred cumulative amount recognised in other comprehensive income relating to that particular foreign operation is recognised in the profit or loss.
Goodwill and fair value adjustments relating to the carrying amounts of assets and liabilities arising on the acquisition of a foreign operation are treated as assets and liabilities of that foreign operation, and are translated at the closing rate. The functional currencies of the foreign operations are as follows:
• Joint venture, Adcock Ingram Limited in India, the Indian Rupee;
• Subsidiary, Adcock Ingram Healthcare Private Limited in India, the Indian Rupee;
• Subsidiary, Datlabs (Private) Limited in Zimbabwe, the United States Dollar;
• Subsidiary, Adcock Ingram East Africa Limited in Kenya, the Kenyan Shilling; and
• Subsidiary, Ayrton Drug Manufacturing Limited in Ghana, the Ghanaian Cedi.
INTEREST IN GROUP COMPANIESBusiness combinationsBusiness combinations are accounted for using the acquisition method. The cost of an acquisition is measured as the aggregate of the consideration transferred, measured at acquisition date fair value and the amount of any non-controlling interest in the acquiree.
For each business combination, the Group measures the non-controlling interest in the acquiree either at fair value or at the proportionate share of the acquiree’s identifiable net assets. Acquisition costs incurred are expensed.
When the Group acquires a business, it assesses the financial assets and liabilities assumed for appropriate classification and designation in accordance with the contractual terms, economic circumstances and pertinent conditions as at the acquisition date. This includes the separation of embedded derivatives in host contracts of the acquiree.
The excess of the consideration transferred, the amount of any non-controlling interest in the acquiree and the acquisition date fair value of any previous equity interest in the acquiree over the fair value of the Group’s share of the identifiable net assets acquired is recorded as goodwill. If this is less than the fair value of the net assets of the subsidiary acquired in the case of a bargain purchase, the difference is recognised directly in profit or loss. In instances where the contingent consideration does not fall within the scope of IAS 39, it is measured in accordance with the appropriate IFRS.
If the business combination is achieved in stages, the acquisition date fair value of the acquirer’s previously held equity interest in the acquiree is remeasured to fair value as at the acquisition date through profit or loss or other comprehensive income, as appropriate.
Any contingent consideration to be transferred by the acquirer will be recognised at fair value at the acquisition date. Subsequent changes to the fair value of the contingent consideration, which is deemed to be an asset or liability, will be recognised in accordance with IAS 39 either in profit or loss or as a charge to other comprehensive income, as appropriate. If the contingent consideration is classified as equity, it is not remeasured until it is finally settled within equity.

126
ADCOCK INGRAM INTEGRATED REPORT 2013
Joint venturesA joint venture is a contractual arrangement whereby the Group and other parties undertake an economic activity in a separate entity that is subject to joint control. The strategic, financial and operating policy decisions of the joint venture require the unanimous consent of the parties sharing control.
The Company carries its investment in joint ventures at cost less any impairments.
The Group reports its interests in joint ventures using the proportionate consolidation method until the date on which the Group ceases to have joint control over the joint venture. The Group’s share of the assets, liabilities, income and expenses of joint ventures are combined with the equivalent items in the consolidated financial statements on a line-by-line basis. Where the Group transacts with its joint ventures, unrealised profits and losses and intra-Group balances are eliminated to the extent of the Group’s interest in the joint venture.
Any goodwill arising on the acquisition of a joint venture is accounted for in accordance with the Group’s policy for goodwill. The financial results of the joint venture are prepared for the same reporting period as the Group, using consistent accounting policies.
Where an investment in a joint venture is classified as held for sale in terms of IFRS 5, proportionate consolidation is discontinued, and the investment is held at the lower of its carrying value and fair value less costs to sell.
Upon loss of joint control and provided the former jointly controlled entity does not become a subsidiary or associate, the Group measures and recognises its remaining investment at fair value. Any difference between the carrying amount of the former jointly controlled entity upon loss of joint control and the fair value of the remaining investment and proceeds from disposal is recognised in profit or loss. When the remaining investment constitutes significant influence, it is accounted for as an investment in an associate.
ASSOCIATEAn associate is an entity over which the Group has significant influence through participation in the financial and operating policy decisions. The entity is neither a subsidiary nor a joint venture.
The Company carries its investment in associates at cost less any impairments.
Associates are accounted for using the equity method of accounting. Under this method, investments in associates are carried in the statement of financial position at cost, plus post-acquisition changes in the Group’s share of the net assets of the associate. Goodwill relating to an associate is included in the carrying amount of the investment and is not tested separately for impairment.
The statement of comprehensive income reflects the Group’s share of the associate’s profit or loss. However, an associate’s losses in excess of the Group’s interest are not recognised. Where an associate recognises an entry directly in other comprehensive income, the Group in turn recognises its share as other comprehensive income in the consolidated statement of comprehensive income. Profits and losses resulting from transactions between the Group and associates are eliminated to the extent of the interest in the underlying associate.
After application of the equity method, each investment is assessed for indicators of impairment. If applicable, the impairment is calculated as the difference between the carrying value and the higher of its value in use or fair value less costs to sell. Impairment losses are recognised in the statement of comprehensive income in profit or loss.
Where an investment in an associate is classified as held for sale in terms of IFRS 5, equity accounting is discontinued, and the investment is held at the lower of its carrying value and fair value less costs to sell.
Where an associate’s reporting date differs from the Group’s, the associate prepares financial statements as of the same date as the Group. If this is impracticable, financial statements are used where the date difference is no more than three months. Adjustments are made for significant transactions between the relevant dates. Where the associate’s accounting policies differ from those of the Group, appropriate adjustments are made to conform to the accounting policies of the Group.
Upon loss of significant influence over the associate, the Group measures and recognises any retaining investment at its fair value. Any difference between the carrying amount of the associate upon loss of significant influence and the fair value of the retained investment and proceeds from disposal is recognised in profit or loss.
ANNEXURE H – ACCOUNTING POLICIES(continued)

127
ADCOCK INGRAM INTEGRATED REPORT 2013
PROPERTY, PLANT AND EQUIPMENTProperty, plant and equipment is stated at cost, excluding the costs of day-to-day servicing, less accumulated depreciation and accumulated impairment losses.
Where an item of property, plant and equipment comprises major components with different useful lives, the components are accounted for as separate assets. Expenditure incurred on major inspection and overhaul, or to replace an item is also accounted for separately if the recognition criteria are met. All other repairs and maintenance expenditures are charged to profit or loss during the financial period in which they are incurred. Each part of an item of property, plant and equipment with a cost that is significant is depreciated separately.
Depreciation is calculated on a straight-line basis, on the difference between the cost and residual value of an asset, over its useful life. Depreciation starts when the asset is available for use. An asset’s residual value, useful life and depreciation method are reviewed at least at each financial year-end. Any adjustments are accounted for prospectively.
The following useful lives have been estimated:Freehold land Not depreciatedFreehold buildings – general purpose 40 years – specialised 20 – 50 yearsLeasehold improvements The lease term or useful life, whichever is the shorter periodPlant, equipment and vehicles 3 – 15 years Furniture and fittings 3 – 15 years Computer equipment 3 years
An item of property, plant and equipment is derecognised upon disposal or when no future economic benefits are expected from its use. Any gain or loss arising on derecognition of the asset (calculated as the difference between the net disposal proceeds and the carrying amount of the asset) is included in the statement of comprehensive income through profit or loss in the year the asset is derecognised.
Exchanges of assets are measured at fair value unless the exchange transaction lacks commercial substance or the fair value of neither the asset received nor the asset given up is reliably measurable. The cost of the acquired asset is measured at the fair value of the asset given up, unless the fair value of the asset received is more clearly evident. Where fair value is not used, the cost of the acquired asset is measured at the carrying amount of the asset given up. The gain or loss on derecognition of the asset given up is recognised in profit or loss.
GOODWILL AND INTANGIBLE ASSETSGoodwillGoodwill is initially measured at cost, being the excess of the consideration transferred, the amount of any non-controlling interest and in a business combination achieved in stages, the acquisition date fair value of any previously held equity interest in the acquiree, over the fair value of the Group’s net identifiable assets acquired and liabilities assumed. If this consideration is lower than the fair value of the net assets of the subsidiary acquired, the difference is recognised in profit or loss. Goodwill relating to subsidiaries and joint ventures is recognised as an asset and is subsequently measured at cost less accumulated impairment losses.
Goodwill is tested bi-annually for impairment or more frequently if there is an indicator of impairment. Goodwill is allocated to cash-generating units expected to benefit from the synergies of the combination. When the recoverable amount of a cash-generating unit is less than its carrying amount, an impairment loss is recognised. The impairment loss is allocated first to any goodwill assigned to the unit, and then to other assets of the unit pro rata on the basis of their carrying values. Impairment losses recognised for goodwill cannot be reversed in subsequent periods.
Where goodwill forms part of a cash-generating unit and part of the operation within that unit is disposed of, the goodwill associated with the operation disposed of is included in the carrying amount of the operation when determining the gain or loss on disposal of the operation. Goodwill disposed of in this circumstance is measured based on the relative values of the operation disposed of and the portion of the cash-generating unit retained.
Intangible assetsIntangible assets acquired separately are measured on initial recognition at cost. The cost of an intangible asset acquired in a business combination is the fair value at the date of acquisition. Subsequently, intangible assets are carried at cost less any accumulated amortisation and accumulated impairment losses. Internally generated intangible assets, excluding capitalised development costs, are not capitalised and expenditure is charged to the statement of comprehensive income through profit or loss in the year in which the expense is incurred.
The useful lives of intangible assets are either finite or indefinite.
Intangible assets with finite lives are amortised over their useful life and assessed for impairment when there is an indication that the asset may be impaired. The amortisation period and the amortisation method are reviewed at each financial year-end. Changes in the expected useful life or the expected pattern of consumption of future economic benefits embodied in the asset are accounted for by changing the amortisation period or method, as appropriate, and are treated as changes in accounting estimates.
ANNEXURE H – ACCOUNTING POLICIES(continued)

128
ADCOCK INGRAM INTEGRATED REPORT 2013
The following useful lives have been estimated:Trademarks 15 years or indefiniteCustomer, supplier and licence-related intangibles 1 – 15 years
Amortisation is recognised in the statement of comprehensive income through profit or loss in fixed and administrative expenses. Intangible assets with indefinite useful lives are not amortised but are tested bi-annually for impairment either individually or at the cash-generating level. The useful lives are also reviewed in each period to determine whether the indefinite life assessment continues to be supportable. If not, the change in the useful life assessment to a finite life is accounted for prospectively.
Certain trademarks have been assessed to have indefinite useful lives, as presently there is no foreseeable limit to the period over which the assets can be expected to generate cash flows for the Group.
An intangible asset is derecognised on disposal or when no future economic benefits are expected from its use or disposal.
Gains or losses arising from derecognition of an intangible asset are measured as the difference between the net disposal proceeds and the carrying amount of the asset and are recognised in the statement of comprehensive income through profit or loss when the asset is derecognised.
Research and development costsResearch costs, being costs from the investigation undertaken with the prospect of gaining new knowledge and understanding, are recognised in profit or loss as they are incurred.
Development costs arise on the application of research findings to plan or design for the production of new or substantially improved materials, products or services, before the start of commercial production. Development costs are only capitalised when the Group can demonstrate the technical feasibility of completing the project, its intention and ability to complete the project and use or sell the materials, products or services flowing from the project, how the project will generate future economic benefits, the availability of sufficient resources and the ability to measure reliably the expenditure during development. Otherwise development costs are recognised in profit or loss.
During the period of development, the asset is tested annually for impairment. Following the initial recognition of the development costs, the asset is carried at cost less accumulated amortisation and accumulated impairment losses. Amortisation begins when development is complete and the asset is available for use. The capitalised development costs are amortised over the useful life of the intangible asset.
IMPAIRMENTThe Group assesses property, plant and equipment and intangible assets, with finite useful lives, and investments in subsidiaries, joint ventures and associates for the Company, at least at each reporting date for an indication that an asset may be impaired. If such an indication exists, or when annual impairment testing is required, as is the case with goodwill and intangible assets with indefinite useful lives, the recoverable amount is estimated as the higher of the fair value less costs to sell and the value in use. If the carrying value exceeds the recoverable amount, the asset is impaired and is written down to the recoverable amount. Where it is not possible to estimate the recoverable amount of an individual asset, the recoverable amount of the cash-generating unit to which the asset belongs is estimated.
In assessing value in use, the estimated future cash flows are discounted to their present value using a pre-tax discount rate that reflects current market assessments of the time value of money and the risks specific to the asset. In determining fair value less costs to sell, the hierarchy is firstly a binding arm’s length sale, then the market price if the asset is traded in an active market, and lastly recent transactions for similar assets.
Impairment losses of continuing operations are recognised in the statement of comprehensive income through profit or loss in those expense categories consistent with the function of the impaired asset.
For assets excluding goodwill, an assessment is made at each reporting date as to whether there is any indication that previously recognised impairment losses may no longer exist or may have decreased. If such an indication exists, the Group estimates the asset’s or cash-generating unit’s recoverable amount. A previously recognised impairment loss is reversed only if there has been a change in the assumptions used to determine the asset’s recoverable amount since the last impairment loss was recognised. The reversal is limited so that the carrying amount of the asset does not exceed its recoverable amount, nor exceed the carrying amount that would have been determined, net of depreciation or amortisation, had no impairment loss been recognised for the asset in prior years. Such reversal is recognised in profit or loss.
FINANCIAL ASSETSInitial recognition and measurementFinancial assets within the scope of IAS 39 are classified as financial assets through profit or loss, loans and receivables, held-to-maturity investments, available-for-sale financial assets, or as derivatives designated as hedging instruments in an effective hedge, as appropriate. The Group determines the classification of its financial assets at initial recognition.
ANNEXURE H – ACCOUNTING POLICIES(continued)

129
ADCOCK INGRAM INTEGRATED REPORT 2013
The Group’s classification of financial assets is as follows:
Description of asset ClassificationAmounts owing by Group companies Loans and receivablesTrade and other receivables Loans and receivablesCash and cash equivalents Loans and receivablesInvestments Available-for-saleOther financial assets Loans and receivables/Available-for-sale
All financial assets are recognised initially at fair value plus, in the case of instruments not at fair value through profit or loss, directly attributable transaction costs.
Subsequent measurementThe subsequent measurement of financial assets depends on their classification, as follows:
Loans and receivablesLoans and receivables are non-derivative financial assets with fixed or determinable payments that are not quoted in an active market. After initial measurement, such financial assets are subsequently measured at amortised cost using the effective interest rate method, less impairment. Amortised cost is calculated by taking into account any discount or premium on acquisition and fees or costs that are an integral part of the effective interest rate. The effective interest rate amortisation is included in finance income in the statement of comprehensive income. The losses arising from impairment are recognised in the statement of comprehensive income in fixed and administrative expenses.
Available-for-sale financial assetsAvailable-for-sale financial assets could include equity investments. Equity investments classified as available-for-sale are those which are neither classified as held for trading nor designated at fair value through profit or loss.
After initial measurement, available-for-sale financial assets are subsequently measured at fair value with unrealised gains and losses recognised as other comprehensive income until the investment is derecognised, at which time the cumulative gain or loss is recognised in other operating income, or determined to be impaired, at which time the cumulative loss is reclassified from the available-for-sale reserve to profit or loss in the statement of comprehensive income.
When a decline in the fair value of an available-for-sale financial asset has been recognised in other comprehensive income and there is objective evidence that the asset is impaired by a significant amount or for a prolonged period of time, the cumulative impairment loss that had been recognised in other comprehensive income is reclassified from equity to profit or loss even though the financial asset has not been derecognised.
DerecognitionFinancial assets or parts thereof are derecognised when:
• the right to receive the cash flows has expired; or
• the Group transfers the right to receive the cash flows, and also transfers either all the risks and rewards, or control over the asset.
When the Group has transferred its rights to receive cash flows from an asset and has neither transferred nor retained substantially all the risks and rewards of the asset nor transferred control of the asset, the asset is recognised to the extent of the Group’s continuing involvement in the asset. In that case, the Group also recognises an associated liability. The transferred asset and the associated liability are measured on a basis that reflects the rights and obligations that the Group has retained.
Continuing involvement that takes the form of a guarantee over the transferred asset is measured at the lower of the original carrying amount of the asset and the maximum amount of consideration that the Group could be required to repay.
Impairment of financial assetsThe Group assesses at each reporting date whether there is any objective evidence that a financial asset or a group of financial assets is impaired.
A financial asset or a group of financial assets is deemed to be impaired if, and only if, there is objective evidence of impairment as a result of one or more events that has occurred after the initial recognition of the asset (an incurred “loss event”) and the loss event has an impact on the estimated future cash flows of the financial asset or the group of financial assets that can be reliably estimated. Evidence of impairment may include indications that the debtor or a group of debtors is experiencing significant financial difficulty, default or delinquency in interest or principal payments, the probability that they will enter bankruptcy or other financial reorganisation and where observable data indicate that there is a measurable decrease in the estimated future cash flows, such as changes in arrears or economic conditions that correlate with defaults.
Loans and receivablesThe Group assesses whether objective evidence of impairment exists individually for financial assets that are individually significant, or collectively for financial assets that are not individually significant. If the Group determines that no objective evidence of impairment exists for an individually assessed financial asset, whether significant or not, it includes the assets in a group of financial assets with similar credit risk characteristics and collectively assesses them for impairment. Assets that are individually assessed for impairment and for which an impairment loss is, or continues to be, recognised are not included in a collective assessment of impairment.
ANNEXURE H – ACCOUNTING POLICIES(continued)

130
ADCOCK INGRAM INTEGRATED REPORT 2013
If there is objective evidence that an impairment loss has been incurred, the amount of the loss is measured as the difference between the asset’s carrying amount and the present value of estimated future cash flows (excluding future expected credit losses that have not yet been incurred). The present value of the estimated future cash flows is discounted at the financial asset’s original effective interest rate. If a loan has a variable interest rate, the discount rate for measuring any impairment loss is the current effective interest rate.
The carrying amount of the assets is reduced through the use of an allowance account and the amount of the loss is recognised in profit or loss. Interest income continues to be accrued on the reduced carrying amount and is accrued using the rate of interest used to discount the future cash flows for the purpose of measuring the impairment loss. The interest income is recorded as part of finance income in the statement of comprehensive income. Loans together with the associated allowance are written off when there is no realistic prospect of future recovery and all collateral has been realised or has been transferred to the Group. If, in a subsequent year, the amount of the estimated impairment loss increases or decreases because of an event occurring after the impairment was recognised, the previously recognised impairment loss is increased or reduced by adjusting the allowance account. If a future write off is later recovered, the recovery is credited to finance costs in the statement of comprehensive income.
Available-for-sale financial assetsFor available-for-sale financial assets, the Group assesses at each reporting date whether there is objective evidence that an investment or a group of investments is impaired.
In the case of equity investments classified as available-for-sale, objective evidence would include a significant or prolonged decline in the fair value of the investment below its cost. ‘Significant’ is to be evaluated against the original costs of the investment and ‘prolonged’ against the period in which the fair value has been below its original cost. Where there is evidence of impairment, the cumulative loss – measured as the difference between the acquisition cost and the current fair value, less an impairment loss on that investment previously recognised in the statement of comprehensive income – is reclassified from other comprehensive income to profit or loss. Increases in fair value after impairment are recognised directly in other comprehensive income. Impairment losses on available-for-sale equity instruments are not reversed through profit or loss.
FINANCIAL LIABILITIESInitial recognition and measurementFinancial liabilities within the scope of IAS 39 are classified as financial liabilities at fair value through profit or loss, loans and borrowings, or as derivatives designated as hedging instruments in an effective hedge, as appropriate. The Group determines the classification of its financial liabilities at initial recognition.
All financial liabilities are recognised initially at fair value and, in the case of loans and borrowings, plus directly attributable transaction costs. The Group has classified financial liabilities, as follows:
Description of liability ClassificationLoans payable and borrowings Loans and borrowingsTrade and other payables Loans and borrowingsLoans from subsidiaries Loans and borrowingsBank overdraft Loans and borrowingsAmounts owing to Group companies Loans and borrowings
Subsequent measurementLOANS AND BORROWINGSAfter initial recognition, interest-bearing loans and borrowings are subsequently measured at amortised cost using the effective interest rate method. Gains and losses are recognised in the statement of comprehensive income through profit or loss when the liabilities are derecognised as well as through the effective interest rate method amortisation process.
Amortised cost is calculated by taking into account any discount or premium on acquisition and fees or costs that are an integral part of the effective interest rate. The effective interest rate amortisation is included in finance costs in the statement of comprehensive income.
DERECOGNITIONA financial liability is derecognised when the obligation under the liability is discharged, cancelled or expires. When an existing financial liability is replaced by another from the same lender on substantially different terms, or the terms of an existing liability are substantially modified, such an exchange or modification is treated as a derecognition of an existing liability and a recognition of a new financial liability. The difference in the respective carrying amounts is recognised in the statement of comprehensive income through profit or loss.
FAIR VALUE OF FINANCIAL INSTRUMENTSThe fair value of financial instruments that are traded in active markets at each reporting date is determined by reference to quoted market prices or dealer price quotations (bid price for long positions and offer price for short positions), without any deduction for transaction costs.
For financial instruments not traded in an active market, the fair value is determined using appropriate valuation techniques. Such techniques may include using recent arm’s length transactions, reference to the current fair value of another instrument that is substantially the same, discounted cash flow analysis or other valuation models.
ANNEXURE H – ACCOUNTING POLICIES(continued)

131
ADCOCK INGRAM INTEGRATED REPORT 2013
CASH AND CASH EQUIVALENTSCash and cash equivalents consists of cash on hand and at banks, short-term deposits with an original maturity of three months or less and highly liquid investments.
For the purpose of the statement of cash flows, cash and cash equivalents consist of cash and short-term deposits as detailed above, net of outstanding bank overdrafts.
DERIVATIVE INSTRUMENTSDerivatives are financial instruments whose value changes in response to an underlying factor, require no initial or little net investment and are settled at a future date. Derivatives, other than those arising on designated hedges, are measured at fair value with changes in fair value being recognised in profit or loss.
Hedge accountingAt the inception of a hedge relationship, the Group formally designates and documents the hedge relationship to which the Group wishes to apply hedge accounting and the risk management objective and strategy for undertaking the hedge. The documentation includes identification of the hedging instrument, the hedged item or transaction, the nature of the risk being hedged and how the entity will assess the hedging instrument’s effectiveness in offsetting the exposure to changes in the hedged item’s fair value or cash flows attributable to the hedged risk. Such hedges are expected to be highly effective in achieving offsetting changes in fair value or cash flows and are assessed on an ongoing basis to determine that they actually have been highly effective throughout the financial reporting periods for which they were designated.
Fair value hedgesFair value hedges cover the exposure to changes in the fair value of a recognised asset or liability, or an unrecognised firm commitment (except for foreign currency risk). Foreign currency risk of an unrecognised firm commitment is accounted for as a cash flow hedge.
The gain or loss on the hedged item adjusts the carrying amount of the hedged item and is recognised immediately in profit or loss. The gain or loss from remeasuring the hedging instrument at fair value is also recognised in profit or loss.
When an unrecognised firm commitment is designated as a hedged item, the change in the fair value of the firm commitment is recognised as an asset or liability with a corresponding gain or loss recognised in profit or loss. The change in the fair value of the hedging instrument is also recognised in profit or loss.
The Group discontinues fair value hedge accounting if the hedging instrument expires or is sold, terminated or exercised, the hedge no longer meets the criteria for hedge accounting or the Group revokes the designation.
Cash flow hedgesCash flow hedges cover the exposure to variability in cash flows that are attributable to a particular risk associated with:
• a recognised asset or liability; or
• a highly probable forecast transaction; or
• the foreign currency risk in an unrecognised firm commitment.
The portion of the gain or loss on the hedging instrument that is determined to be an effective hedge is recognised directly in other comprehensive income, while any ineffective portion is recognised in profit or loss.
Amounts taken to other comprehensive income are transferred to profit or loss when the hedged transaction affects profit or loss, such as when the hedged income or financial asset or liability is recognised or when the forecast sale or purchase occurs. Where the hedged item is the cost of a non-financial asset or liability, the amount deferred in other comprehensive income is transferred to the initial carrying amount of the non-financial asset or liability.
If the forecast transaction is no longer expected to occur, amounts previously recognised in other comprehensive income are transferred to profit or loss. If the hedging instrument expires or is sold, terminated or exercised without replacement or rollover, or if its designation is revoked, amounts previously recognised in equity remain in equity until the forecast transaction occurs. If the related transaction is not expected to occur, the amount is taken to profit or loss.
HEDGES OF A NET INvESTMENTHedges of a net investment in a foreign operation, including a hedge of a monetary item that is accounted for as part of the net investment, are accounted for similarly to cash flow hedges. Gains or losses on the hedging instrument relating to the effective portion of the hedge are recognised in other comprehensive income, while any gains or losses relating to the ineffective portion are recognised in profit or loss. On disposal of the foreign operation, the cumulative gains or losses recognised in other comprehensive income are transferred to profit or loss.
ANNEXURE H – ACCOUNTING POLICIES(continued)

132
ADCOCK INGRAM INTEGRATED REPORT 2013
Current versus non-current classificationDerivative instruments that are not designated and effective hedging instruments are classified as current or non-current or separated into a current and non-current portion based on an assessment of the facts and circumstances (i.e. the underlying contracted cash flows):
• Where the Group will hold a derivative as an economic hedge (and does not apply hedge accounting) for a period beyond 12 months after the reporting date, the derivative is classified as non-current (or separated into current and non-current portions) consistent with the classification of the underlying item;
• Embedded derivatives that are not closely related to the host contract are classified consistent with the cash flows of the host contract; and
• Derivative instruments that are designated as, and are effective hedging instruments, are classified consistent with the classification of the underlying hedged item. The derivative instrument is separated into a current portion and non-current portion only if a reliable allocation can be made.
NON-CURRENT ASSETS HELD FOR SALE AND DISCONTINUED OPERATIONSAn item is classified as held for sale if its carrying amount will be recovered principally through a sale transaction rather than through continuing use. This condition is regarded as met only when the sale is highly probable and the asset or disposal group is available for immediate sale in its present condition. Management must be committed to the sale, which should be expected to qualify for recognition as a completed sale within one year from the date of classification.
Assets classified as held for sale are not subsequently depreciated and are held at the lower of their carrying value and fair value less costs to sell.
A discontinued operation is a separate major line of business or geographical area of operation that has been disposed of, or classified as held for sale, as part of a single co-ordinated plan. Alternatively, it could be a subsidiary acquired exclusively with a view to resale.
In the consolidated statement of comprehensive income of the reporting period, and of the comparable period of the prior year, income and expenses from discontinued operations are reported separately from income and expenses from continuing activities, down to the level of profit after taxes, even when the parent retains a non-controlling interest in the subsidiary after the sale. The resulting profit or loss (after taxes) is reported separately in profit or loss and other comprehensive income.
INVENTORIESInventories are stated at the lower of cost and net realisable value. Costs incurred in bringing each product to its present location and condition are accounted for as follows:Raw materials Purchase cost on a first-in, first-out basis
Finished goods and work in progress Cost of direct material and labour and a proportion of manufacturing overheads based on normal operating capacity
Consumables are written down with regard to their age, condition and utility.
Costs of inventories include the transfer from other comprehensive income of gains and losses on qualifying cash flow hedges in respect of the purchases of raw materials.
Net realisable value is the estimated selling price in the ordinary course of business, less estimated completion and selling costs.
PROVISIONSProvisions are recognised when the Group has a present legal or constructive obligation, as a result of past events, for which it is probable that an outflow of economic benefits will be required to settle the obligation, and a reliable estimate can be made of the amount of the obligation.
Where the Group expects some or all of a provision to be reimbursed, for example under an insurance contract, the reimbursement is recognised as a separate asset, but only when the reimbursement is virtually certain. The expense relating to any provision is presented in the statement of comprehensive income through profit or loss net of any reimbursement.
If the effect of the time value of money is material, provisions are discounted using a current pre-tax rate that reflects the risks specific to the liability. Where discounting is used, the increase in the provision due to the passage of time is recognised as a finance cost.
LEASESAt inception date an arrangement is assessed to determine whether it is, or contains, a lease. An arrangement is accounted for as a lease where it is dependent on the use of a specific asset and it conveys the right to use that asset.
Leases are classified as finance leases where substantially all the risks and rewards associated with ownership of an asset are transferred from the lessor to the Group as lessee. Finance lease assets and liabilities are recognised at the lower of the fair value of the leased property or the present value of the minimum lease payments. Finance lease payments are allocated, using the effective interest rate method, between the lease finance cost, which is included in financing costs, and the capital repayment, which reduces the liability to the lessor.
ANNEXURE H – ACCOUNTING POLICIES(continued)

133
ADCOCK INGRAM INTEGRATED REPORT 2013
Capitalised lease assets are depreciated in line with the Group’s stated depreciation policy. If there is no reasonable certainty that the Group will obtain ownership by the end of the lease term, the asset is depreciated over the shorter of its estimated useful life and lease term.
Operating leases are those leases which do not fall within the scope of the above definition. Operating lease rentals are charged against trading profit on a straight-line basis over the lease term.
REVENUERevenue comprises turnover, dividend income and finance income. Revenue is recognised to the extent that it is probable that the economic benefits will flow to the Group and the revenue can be reliably measured. Revenue is measured at the fair value of the consideration received/receivable excluding value-added tax, normal discounts, rebates, settlement discounts, promotional allowances, and internal revenue which is eliminated on consolidation.
The Group assesses its revenue arrangements against specific criteria in order to determine if it is acting as principal or agent. The Group has concluded that it is acting as a principal in all of its revenue arrangements.
Turnover from the sale of goods is recognised when the significant risks and rewards of ownership have passed to the buyer. Dividend income is recognised when the Group’s right to receive payment is established. Finance income is accrued on a time basis recognising the effective rate applicable on the underlying assets.
BORROWING COSTSBorrowing costs directly attributable to the acquisition, construction or production of an asset that necessarily takes a substantial period of time to get ready for its intended use or sale are capitalised as part of the cost of the respective assets. All other borrowing costs are expensed in the period they occur. Borrowing costs consist of interest and other costs that an entity incurs in connection with the borrowing of funds.
INCOME TAXESThe income tax expense represents the sum of current tax, deferred tax, Secondary Taxation on Companies and Dividends Tax.
Current income taxCurrent income tax assets and liabilities for the current and prior periods are measured at the amount expected to be recovered from or paid to the taxation authorities. The current tax is based on taxable profit for the year. Taxable profit differs from profit as reported in the statement of comprehensive income because it excludes items of income or expense that are taxable or deductible in other years, and it further excludes items that are never taxable or deductible. The Group’s liability for current tax is calculated using tax rates that have been enacted or substantively enacted at the reporting date.
Current tax relating to items recognised outside profit or loss is recognised in other comprehensive income and not in profit or loss. Current tax items are recognised in correlation to the underlying transaction either in other comprehensive income or directly in equity.
Deferred taxDeferred tax is provided using the liability method on all temporary differences at the reporting date. Temporary differences are differences between the carrying amounts of assets and liabilities for financial reporting purposes and their tax base.
Deferred tax liabilities are recognised for taxable temporary differences:
• except where the liability arises from the initial recognition of goodwill or an asset or liability in a transaction that is not a business combination and, at the time of the transaction, affects neither the accounting profit nor taxable profit or loss; and
• except in respect of taxable temporary differences associated with investments in subsidiaries, associates and interests in joint ventures, where the timing of the reversal of the temporary differences can be controlled, and it is probable that the temporary differences will not reverse in the foreseeable future.
Deferred tax assets are recognised for all deductible temporary differences, carry forward of unused tax credits and unused tax losses, where it is probable that the asset will be utilised in the foreseeable future:
• except where the asset arises from the initial recognition of an asset or liability in a transaction that is not a business combination and, at the time of the transaction, affects neither the accounting profit nor taxable profit or loss; and
• except in respect of deductible temporary differences associated with investments in subsidiaries, associates and interests in joint ventures, only to the extent that it is probable that the differences will reverse in the foreseeable future, and taxable profit will be available against which these differences can be utilised.
The carrying amount of deferred tax assets is reviewed at each reporting date and reduced to the extent that it is no longer probable that sufficient taxable profits will be available to allow all or part of the asset to be recovered. Unrecognised deferred tax assets are re-assessed at each reporting date and recognised to the extent it has become probable that future taxable profit will allow the asset to be utilised.
ANNEXURE H – ACCOUNTING POLICIES(continued)

134
ADCOCK INGRAM INTEGRATED REPORT 2013
Deferred tax is calculated at the tax rates that are expected to apply in the period when the liability is settled or the asset realised based on tax rates and laws that have been enacted or substantively enacted by the reporting date.
Deferred tax is charged to profit or loss, except to the extent that it relates to a transaction that is recognised outside profit or loss or a business combination that results from an acquisition. In this case, the deferred tax items are recognised in correlation to the underlying transaction either in other comprehensive income or directly in equity.
Deferred tax assets and liabilities are offset when there is a legally enforceable right to offset and they relate to income taxes levied by the same taxation authority.
Secondary Tax on CompaniesSecondary Tax on Companies (STC) on dividends declared is accrued in the period in which the dividend is declared for all dividends declared before 1 April 2012.
Dividends TaxA Dividends Tax of 15% of dividend distributions is withheld from shareholders and paid to the South African Revenue Service for dividends paid on or after 1 April 2012, where applicable.
Value-Added Tax (VAT)Revenues, expenses and assets are recognised net of the amount of VAT, except:
• where the VAT incurred on a purchase of assets or services is not recoverable from the taxation authority, in which case the VAT is recognised as part of the cost of acquisition of the asset or as part of the expense item as applicable; and
• receivables and payables are stated with the amount of VAT included.
The net amount of VAT recoverable from, or payable to, the taxation authority is included as part of receivables or payables in the statement of financial position.
EMPLOYEE BENEFITSShort-term employee benefitsAll short-term benefits, including leave pay, are fully provided in the period in which the related service is rendered by the employees.
A liability is recognised when an employee has rendered services for benefits to be paid in the future, and an expense when the entity consumes the economic benefit arising from the service provided by the employee.
Defined contribution plansIn respect of defined contribution plans, the contribution paid by the Group is recognised as an expense. If the employee has rendered the service, but the contribution has not yet been paid, the amount payable is recognised as a liability.
Defined benefit plansThe present value of the defined benefit obligation, the related current service costs and, where applicable, past service costs, are calculated using the projected unit credit method, incorporating actuarial assumptions and a discount rate based on high quality government bonds.
Actuarial gains and losses are recognised in the statement of comprehensive income through profit or loss when the net cumulative unrecognised actuarial gains or losses for each individual plan at the end of the previous reporting period exceed 10% of the higher of the defined benefit obligation and the fair value of plan assets at that date. These gains or losses are recognised over the expected average remaining working lives of the employees participating in the plans.
Past service costs are recognised as an expense on a straight-line basis over the average period until the benefits become vested. If the benefits vest immediately following the introduction of, or changes to, a defined benefit plan, the past service cost is recognised immediately.
The defined benefit asset or liability recognised in the statement of financial position comprises the present value of the defined benefit obligation, plus any unrecognised actuarial gains (minus losses), less unrecognised past service costs and the fair value of plan assets out of which the obligations are to be settled. The value of an asset recognised is restricted to the sum of the unrecognised past service costs and unrecognised actuarial gains or losses and the present value of any economic benefits available in the form of refunds from the plan or reductions in the future contributions.
POST-RETIREMENT MEDICAL OBLIGATIONSThe Group provides post-retirement healthcare benefits to certain of its retirees and one employee still in service. The expected costs of these benefits are accrued over the period of employment, using the projected unit credit method. Valuations are based on assumptions which include employee turnover, mortality rates, discount rate based on current bond yields of appropriate terms and healthcare inflation costs. Valuations of these obligations are carried out by independent qualified actuaries.
Actuarial gains or losses are recognised in the same manner as those of the defined benefit obligation.
ANNEXURE H – ACCOUNTING POLICIES(continued)

135
ADCOCK INGRAM INTEGRATED REPORT 2013
SHARE-BASED PAYMENTSCertain employees of the Group receive remuneration in the form of share-based payment transactions, whereby employees render services as consideration for equity instruments (“equity-settled transactions”) or share appreciation rights (“cash-settled transactions”).
Equity-settled share options granted before 7 November 2002No expense is recognised in the statement of comprehensive income in profit or loss for such awards.
The Group has taken advantage of the voluntary exemption provision of IFRS 1: First-time Adoption of International Financial Reporting Standards in respect of equity-settled awards and has applied IFRS 2: Share-based Payment – only to equity-settled awards granted after 7 November 2002 that had not vested on 1 January 2005.
Equity-settled and cash-settled share options granted after 7 November 2002EqUITy-SETTLED TRANSACTIONSThe cost of equity-settled transactions with employees is measured by reference to the fair value at the date on which they are granted. The fair value is determined by an external valuer using a modified version of the Black-Scholes model, further details of which are given in Annexure B.
The cost of equity-settled transactions is recognised, together with a corresponding increase in equity, over the period in which the service conditions are fulfilled, ending on the date on which the relevant employees become fully entitled to the award (the vesting date). The cumulative expense recognised reflects the extent to which the vesting period has expired and the Group’s best estimate of the number of equity instruments that will ultimately vest. The charge in the statement of comprehensive income in profit or loss for a period represents the movement in the cumulative expense between the beginning and end of that period.
No expense is recognised for awards that do not ultimately vest, except for equity-settled transactions where vesting is conditional upon a market or non-vesting condition, which are treated as vesting irrespective of whether or not the market or non-vesting condition is satisfied, provided that all other performance and/or service conditions are satisfied.
Where the terms of an equity-settled transaction award are modified, the minimum expense recognised is the expense as if the terms had not been modified, if the original terms of the award are met. If at the date of modification, the total fair value of the share-based payment is increased, or is otherwise beneficial to the employee, the difference is recognised as an additional expense.
Where an equity-settled award is cancelled (other than forfeiture), it is treated as if it had vested on the date of cancellation (acceleration of vesting), and any unrecognised expense recognised immediately. Any payment made to the employee on the cancellation or settlement of the grant shall be accounted for as the repurchase of an equity interest, i.e. as a deduction from equity, except to the extent that the payment exceeds the fair value of the equity instruments granted, measured at the repurchase date. Any such excess shall be recognised as an expense. This includes any award where non-vesting conditions within the control of either the entity or the employee are not met. However, if a new award is substituted and designated as a replacement for the cancelled award, the cancelled and new awards are treated as if they were a modification of the original award, as described above.
The dilutive effect of outstanding equity-settled options is reflected as additional share dilution in the computation of diluted earnings and diluted headline earnings per share.
Cash-settled transactionsThe cost of cash-settled transactions is measured initially at fair value at the grant date using a modified version of the Black-Scholes model, taking into account the terms and conditions upon which the instruments were granted (see Annexure B). This fair value is expensed over the period until vesting with recognition of a corresponding liability. The liability is remeasured to its fair value at each reporting date up to and including the settlement date with changes in fair value recognised in profit or loss.
Accounting for BEE transactionsWhere equity instruments are issued to a Black Economic Empowerment (BEE) party at less than fair value, the instruments are accounted for as share-based payments in terms of the stated accounting policy.
Any difference between the fair value of the equity instrument issued and the consideration received is accounted for as an expense in the statement of comprehensive income through profit or loss.
A restriction on the BEE party to transfer the equity instrument subsequent to its vesting is not treated as a vesting condition, but is factored into the fair value determination of the instrument.
BEE transactions are accounted for as equity-settled share-based payments and are treated the same as equity-settled transactions.
ANNEXURE H – ACCOUNTING POLICIES(continued)

136
ADCOCK INGRAM INTEGRATED REPORT 2013
TREASURY SHARESShares in Adcock Ingram Holdings Limited held by the Group, including shares held by special purpose entities deemed to be controlled by the Group, are classified within total equity as treasury shares. Treasury shares are treated as a deduction from the issued and weighted average number of shares for earnings per share and headline earnings per share purposes and the cost price of the shares is reflected as a reduction in capital and reserves in the statement of financial position. Dividends received on treasury shares are eliminated on consolidation. No gain or loss is recognised in the statement of comprehensive income through profit or loss on the purchase, sale, issue or cancellation of treasury shares. The consideration paid or received with regard to treasury shares is recognised in equity.
CONTINGENT ASSETS AND CONTINGENT LIABILITIESA contingent asset is a possible asset that arises from past events and whose existence will be confirmed by the occurrence or non-occurrence of one or more uncertain future events not wholly within the control of the Group. Contingent assets are not recognised as assets.
A contingent liability is a possible obligation that arises from past events and whose existence will be confirmed by the occurrence or non-occurrence of one or more uncertain future events not wholly within the control of the Group. Alternatively it may be a present obligation that arises from past events but is not recognised because an outflow of economic benefits to settle the obligation is not probable, or the amount of the obligation cannot be measured with sufficient reliability. Contingent liabilities are not recognised as liabilities unless they are acquired as part of a business combination.
Recognised amounts in the financial statements are adjusted to reflect significant events arising after the date of the statement of financial position, but before the financial statements are authorised for issue, provided there is evidence of the conditions existing at the reporting date. Events after the reporting date that are indicative of conditions that arose after this date are dealt with by way of a note.
CONSOLIDATION OF SPECIAL PURPOSE ENTITIESThe special purpose entities established in terms of the share options schemes and Black Economic Empowerment (BEE) transaction have been consolidated in the Group results.
The substance of the relationship between the Company and these entities has been assessed, and the decision made is that they are deemed to be controlled entities.
Consolidation of Blue Falcon Trading 69 (Pty) Ltd and Mpho ea Bophelo Trust as special purpose entitiesBlue Falcon Trading 69 (Pty) Ltd and Mpho ea Bophelo Trust are entities incorporated for the purpose of facilitating Adcock Ingram Holdings Limited’s BEE transaction and are consolidated into the Group in accordance with SIC 12: Consolidation – Special Purpose Entities. In substance, the activities of these entities are being conducted on behalf of the Group according to its specific business needs so that the Group obtains benefits from these entities’ operations. In addition, the Group retains the majority of the residual or ownership risks and rewards related to these entities or their assets in order to obtain benefits from their activities in the form of BEE credentials.
SIGNIFICANT ACCOUNTING JUDGEMENTS AND ESTIMATESEstimates, assumptions and judgementsIn the process of applying the Group’s accounting policies, management has made certain judgements, estimates and assumptions, apart from those involving estimations, which have a significant effect on the amounts recognised in the financial statements.
The key assumptions concerning the future and other key sources of estimation uncertainty at the reporting date, that have a significant risk of causing a material adjustment to the carrying amounts of assets and liabilities within the next financial year, are discussed below.
Carrying value of goodwill, property, plant and equipment, and intangible assetsGoodwill and indefinite life intangible assets are tested for impairment bi-annually, while property, plant and equipment and finite life intangible assets are tested at least annually or when there is an indicator of impairment. The calculation of the recoverable amount requires the use of estimates and assumptions concerning the future cash flows which are inherently uncertain and could change over time. In addition, changes in economic factors such as discount rates could also impact this calculation.
Residual values and useful lives of property, plant and equipment, and intangible assetsResidual values and useful lives of property, plant and equipment, and intangible assets are assessed on an annual basis. Estimates and judgements in this regard are based on historical experience and expectations of the manner in which assets are to be used, together with expected proceeds likely to be realised when assets are disposed of at the end of their useful lives. Such expectations could change over time and therefore impact both depreciation and amortisation charges and carrying values of property, plant and equipment, and intangible assets in the future.
Fair value of BEE share allocationsIn calculating the amount to be expensed as a share-based payment, the Group is required to calculate the fair value of the equity instruments granted to the BEE participants in terms of the staff empowerment transactions.
ANNEXURE H – ACCOUNTING POLICIES(continued)
137
ADCOCK INGRAM INTEGRATED REPORT 2013
Share-based paymentsThe Group measures the cost of equity-settled transactions with employees by reference to the fair value of the equity instruments at the date at which they are granted. Estimating fair value requires determining the most appropriate valuation model for a grant of equity instruments, which is dependent on the terms and conditions of the grant. This also requires determining the most appropriate inputs to the valuation model including the expected life of the option, volatility and dividend yield and making assumptions about them. The assumptions and models used are disclosed in Annexure B.
Cash-settled share options granted to employees for services rendered or to be rendered are raised as a liability and recognised in profit or loss over the vesting period. The liability is remeasured to its fair value annually until settled and any changes in value are recognised in profit or loss. Fair value is measured using a Black-Scholes option pricing model.
Deferred tax assetsDeferred tax assets are recognised for all unused tax losses to the extent that it is probable that taxable profit will be available against which the losses can be utilised. Management judgement is required to determine the amount of deferred tax assets that can be recognised, based upon the likely timing and level of future taxable profits.
Pension and other post-employment benefitsThe cost of defined benefit pension plans and post-employment medical benefits is determined using actuarial valuations. The actuarial valuation involves making assumptions about discount rates, expected rates of return on assets, future salary increases, mortality rates and future pension increases. Due to the long-term nature of these plans, such estimates are subject to significant uncertainty.
ProvisionsThe establishment and review of provisions requires significant judgement by management as to whether or not a reliable estimate can be made of the amount of the obligation. Best estimates, being the amount that the Group would rationally pay to settle the obligation, are recognised as provisions at the reporting date.
STANDARDS AND INTERPRETATIONS ISSUED THAT ARE NOT YET EFFECTIVEThe following standards and interpretations have not been applied by the Group as the standards and interpretations are not yet effective. The Group intends to adopt these standards when they become effective.
IFRS 9: Financial Instruments – Recognition and MeasurementIFRS 9 as issued reflects the first phase of the IASB’s work on the replacement of IAS 39 and deals with the classification and measurement of financial instruments. This standard is part of the IASB’s project to replace IAS 39 in its entirety. The Board’s work on the subsequent phases is ongoing and includes impairment, hedge accounting and derecognition. On adoption, the Group will need to consider its financial assets and liabilities in light of its business model or managing such assets and liabilities, as well as the cash flow characteristics of such instruments, in determining the appropriate classification and measurement of these items. IFRS 9 will be effective for the Group from 1 October 2015.
IFRS 10: Consolidated Financial Statements; IAS 27: Consolidated and Separate Financial Statements; IAS 28: Investments in Associates and Joint Ventures; IFRS 11: Joint Arrangements; IFRS 12: Disclosure of Interest in Other EntitiesIFRS 10 replaces the portion of IAS 27 that addresses the accounting for consolidated financial statements. It also includes the issues raised in SIC 12: Consolidation – Special Purpose Entities. IFRS 10 establishes a single control model that applies to all entities. The changes will require management to make significant judgements to determine which entities are controlled and therefore required to be consolidated by the parent. Therefore, IFRS 10 may change which entities are consolidated within a group.
IFRS 11 replaces IAS 31: Interest in Joint Ventures and SIC 13: Jointly Controlled Entities – Non-monetary Contributions by Venturers. IFRS 11 uses some of the terms that were used in IAS 31 but with different meanings which may create some confusion as to whether there are significant changes. IFRS 11 focuses on the nature of the rights and obligations arising from the arrangement compared to the legal form in IAS 31. IFRS 11 uses the principle of control in IFRS 10 to determine joint control which may change whether joint control exists. IFRS 11 addresses only two forms of joint arrangements: joint operations where the entity recognises its assets, liabilities, revenues and expenses and/or its relative share of those items and joint ventures which is accounted for on the equity method (proportional consolidation will no longer be permitted).
IFRS 12 includes all the disclosures that were previously in IAS 27 related to consolidated financial statements as well as all of the disclosures that were previously included in IAS 31 and IAS 28: Investments in Associates. A number of new disclosures are also required.
IAS 28 caters for joint ventures accounted for by applying the equity accounting method as well as prescribing the accounting for investments in associates. The Group will need to consider the new definition of control to determine which entities are controlled or jointly controlled and then to account for them under the new standards. Additional disclosures will also be required.
All of the above will be effective for the Group from 1 October 2013.
ANNEXURE H – ACCOUNTING POLICIES(continued)
Refer Annexure I detailing impact on disclosure of the Group

138
ADCOCK INGRAM INTEGRATED REPORT 2013
IFRS 13: Fair Value MeasurementIFRS 13 establishes a single framework for all fair value measurement when fair value is required or permitted by IFRS. IFRS 13 does not change when an entity is required to use fair value but rather describes how to measure fair value under IFRS when it is permitted or required by IFRS. There are also consequential amendments to other standards to delete specific requirements for determining fair value. The Group will need to consider the new requirements to determine fair values going forward. IFRS 13 will be effective for the Group from 1 October 2013.
IFRS 7: Financial Instruments: Disclosures; IAS 32: Financial Instruments: Presentation: Offsetting of Financial Assets and Financial LiabilitiesIFRS 7 as amended provides additional disclosures, similar to current US GAAP requirements.
IAS 32 as amended clarifies the meaning of the entity currently having a legally enforceable right to set-off financial assets and financial liabilities.
IFRS 7 will be effective for the Group from 1 October 2013 and IAS 32 from 1 October 2014.
IAS 19: Employee BenefitsIAS 19 as revised will be effective for the Group from 1 October 2013. The “corridor approach” currently allowed as an alternative basis in IAS 19 for the recognition of actuarial gains or losses on defined benefit plans has been removed. Actuarial gains or losses in respect of these are now recognised in other comprehensive income when they occur.
The amounts recognised in profit or loss, for defined benefit plans, are limited to current and past service costs, gains or losses on settlements and interest income/expense.
The distinction between short-term and other long-term benefits will be based on the expected timing of the settlement rather than the employee’s entitlement to the benefits. The Group expects this to have an impact on the manner in which leave pay and similar liabilities are currently classified.
ANNEXURE H – ACCOUNTING POLICIES(continued)

139
ADCOCK INGRAM INTEGRATED REPORT 2013
ANNEXURE I – EQUITY-ACCOUNTED JOINT VENTURES
As detailed in Annexure H – Accounting policies, Standards and interpretations issued that are not yet effective, IFRS 11 Joint Arrangements, (page 137), from 1 October 2013, both the National Renal Care and India joint ventures will no longer be permitted to be proportionately consolidated, but required to be equity accounted. The financial information below for both the 2012 and 2013 financial years have been represented accordingly, for illustrative purposes only:
(1) Audited financial information previously published(2) Adjustment relating to India joint venture(3) Adjustment relating to National Renal Care joint venture(4) Revised financial information
CONSOLIDATED STATEMENTS OF COMPREHENSIVE INCOME2013 2012
(1) yearended
30-SepR’ 000
(2) Yearended30-Sep
R’ 000
(3) Yearended30-Sep
R’ 000
(4) Revisedyear ended
30-SepR’ 000
(1) year ended
30-SepR’ 000
(2) Yearended30-Sep
R’ 000
(3) Yearended30-Sep
R’ 000
(4) Revised year ended
30-SepR’ 000
REVENUE 5 482 783 (29 725) (223 750) 5 229 308 4 644 406 (14 613) (182 566) 4 447 227
TURNOVER 5 445 639 (29 205) (221 249) 5 195 185 4 599 249 (14 472) (180 781) 4 403 996 Cost of sales (3 208 798) (30 304) 147 616 (3 091 486) (2 505 167) (26 639) 141 862 (2 389 944)
Gross profit 2 236 841 (59 509) (73 633) 2 103 699 2 094 082 (41 111) (38 919) 2 014 052 Selling and distribution expenses (699 635) 127 – (699 508) (571 500) 215 – (571 285)Marketing expenses (211 930) – – (211 930) (208 625) – – (208 625)Research and development expenses (104 941) – – (104 941) (81 601) – – (81 601)Fixed and administrative expenses (329 530) 3 906 21 586 (304 038) (363 535) 15 197 11 910 (336 428)
Operating profit 890 805 (55 476) (52 047) 783 282 868 821 (25 699) (27 009) 816 113 Finance income 24 531 (520) (2 501) 21 510 18 285 (141) (1 785) 16 359 Finance costs (82 504) 2 128 358 (80 018) (26 637) 3 143 4 902 (18 592)Dividend income 12 613 – – 12 613 26 872 – – 26 872 Equity-accounted earnings 2 663 – (2 663) – – – – – Equity accounted profit attributable to joint ventures – 36 627 35 566 72 193 – 15 250 12 625 27 875
Profit before taxation 848 108 (17 241) (21 287) 809 580 887 341 (7 447) (11 267) 868 627 Taxation (246 878) 17 241 16 510 (213 127) (168 265) 7 447 8 190 (152 628)
Profit for the year 601 230 – (4 777) 596 453 719 076 – (3 077) 715 999
Other comprehensive income 370 370 (37 896) (37 896)
Total comprehensive income for the year, net of tax 601 600 – (4 777) 596 823 681 180 – (3 077) 678 103
Profit attributable to:Owners of the parent 587 844 – – 587 844 705 641 – – 705 641 Non-controlling interests 13 386 – (4 777) 8 609 13 435 – (3 077) 10 358
601 230 – (4 777) 596 453 719 076 – (3 077) 715 999
Total comprehensive income attributable to:Owners of the parent 587 203 – – 582 426 670 434 – – 667 357 Non-controlling interests 14 397 – – 14 397 10 746 – – 10 746
601 600 – – 596 823 681 180 – – 678 103
Basic earnings per ordinary share (cents) 348,6 – – 348,6 417,8 – – 417,8 Diluted basic earnings per ordinary share (cents) 348,3 – – 348,3 417,2 – – 417,2 Headline earnings per ordinary share (cents) 350,5 – – 350,5 422,4 – – 422,4 Diluted headline earnings per ordinary share (cents) 350,2 – – 350,2 421,8 – – 421,8

140
ADCOCK INGRAM INTEGRATED REPORT 2013
ANNEXURE I – EQUITY-ACCOUNTED JOINT VENTURES(continued)
CONSOLIDATED STATEMENTS OF FINANCIAL POSITION2013 2012
(1) yearended
30-SepR’ 000
(2) Yearended30-Sep
R’ 000
(3) Yearended30-Sep
R’ 000
(4) Revisedyear ended
30-SepR’ 000
(1) year ended
30-SepR’ 000
(2) Yearended30-Sep
R’ 000
(3) Yearended30-Sep
R’ 000
(4) Revised year ended
30-SepR’ 000
ASSETSProperty, plant and equipment 1 766 464 (74 945) (42 810) 1 648 709 1 560 177 (68 878) (40 484) 1 450 815 Intangible assets 1 435 716 – – 1 435 716 710 960 (6) – 710 954 Deferred tax 14 507 – (6 678) 7 829 5 097 – – 5 097 Other financial assets 139 646 – – 139 646 139 751 – – 139 751 Other non-financial assets 36 987 – – 36 987 – – – – Investment in associate 2 663 – (2 663) – – – – – Investment in joint venture – 94 073 80 164 174 237 – 64 799 59 598 124 397 Loans receivable 16 489 – (16 489) – 27 060 – (16 489) 10 571
Non-current assets 3 412 472 19 128 11 524 3 443 124 2 443 045 (4 085) 2 625 2 441 585
Inventories 1 558 467 (27 698) (7 693) 1 523 076 956 164 (20 468) (4 547) 931 149 Trade and other receivables 1 618 947 (50 703) (20 185) 1 548 059 1 320 191 (32 225) (32 455) 1 255 511 Cash and cash equivalents 163 070 (9 337) (56 141) 97 592 492 716 (11 986) (46 643) 434 087 Taxation receivable 65 871 – – 65 871 70 170 – – 70 170
Current assets 3 406 355 (87 738) (84 019) 3 234 598 2 839 241 (64 679) (83 645) 2 690 917
Total assets 6 818 827 (68 610) (72 495) 6 677 722 5 282 286 (68 764) (81 020) 5 132 502
EQUITY AND LIABILITIESCapital and reservesIssued share capital 16 832 – – 16 832 16 872 – – 16 872 Share premium 504 064 – – 504 064 547 400 – – 547 400 Non-distributable reserves 364 996 – – 364 996 356 229 – – 356 229 Retained income 2 750 097 – – 2 750 097 2 502 510 – – 2 502 510
Total shareholders' funds 3 635 989 – – 3 635 989 3 423 011 – – 3 423 011 Non-controlling interests 144 878 – (16 961) 127 917 137 684 – (12 184) 125 500
Total equity 3 780 867 – (16 961) 3 763 906 3 560 695 – (12 184) 3 548 511
Long-term borrowings 5 172 – (2 919) 2 253 104 625 – (3 221) 101 404 Post-retirement medical liability 15 108 – – 15 108 15 341 – – 15 341 Deferred tax 139 066 (17 502) – 121 564 101 910 (8 797) – 93 113
Non-current liabilities 159 346 (17 502) (2 919) 138 925 221 876 (8 797) (3 221) 209 858
Trade and other payables 1 340 333 (271) (44 894) 1 295 168 983 589 (26 938) (54 800) 901 851 Bank overdraft 1 307 993 – – 1 307 993 – – – – Short-term borrowings 135 507 (29 677) (2 759) 103 071 431 368 (21 397) (7 049) 402 922 Cash-settled options 39 150 – – 39 150 39 983 – – 39 983 Provisions 55 631 (416) (5 209) 50 006 44 775 (395) – 44 380 Taxation payable – (20 744) 247 (20 497) – (11 237) (3 766) (15 003)
Current liabilities 2 878 614 (51 108) (52 615) 2 774 891 1 499 715 (59 967) (65 615) 1 374 133
Total equity and liabilities 6 818 827 (68 610) (72 495) 6 677 722 5 282 286 (68 764) (81 020) 5 132 502
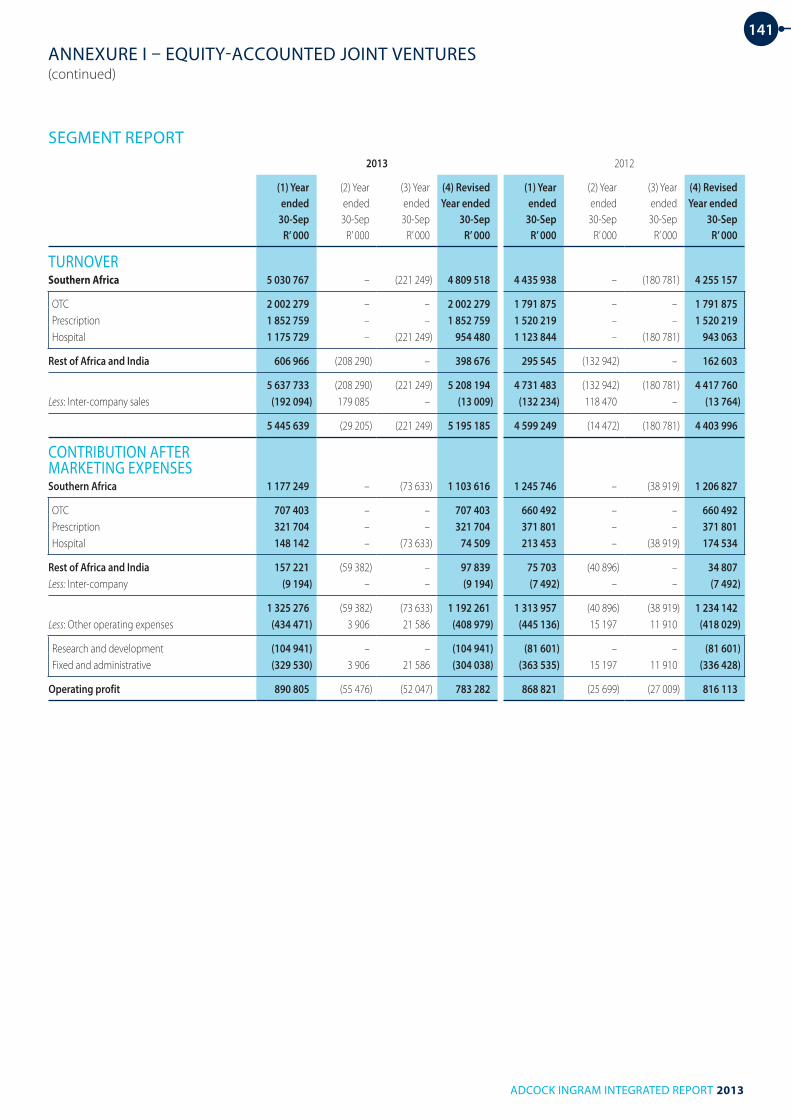
141
ADCOCK INGRAM INTEGRATED REPORT 2013
ANNEXURE I – EQUITY-ACCOUNTED JOINT VENTURES(continued)
SEGMENT REPORT2013 2012
(1) yearended
30-SepR’ 000
(2) Yearended30-Sep
R’ 000
(3) Yearended30-Sep
R’ 000
(4) Revisedyear ended
30-SepR’ 000
(1) yearended
30-SepR’ 000
(2) Yearended30-Sep
R’ 000
(3) Yearended30-Sep
R’ 000
(4) Revised year ended
30-SepR’ 000
TURNOVERSouthern Africa 5 030 767 – (221 249) 4 809 518 4 435 938 – (180 781) 4 255 157
OTC 2 002 279 – – 2 002 279 1 791 875 – – 1 791 875 Prescription 1 852 759 – – 1 852 759 1 520 219 – – 1 520 219 Hospital 1 175 729 – (221 249) 954 480 1 123 844 – (180 781) 943 063
Rest of Africa and India 606 966 (208 290) – 398 676 295 545 (132 942) – 162 603
5 637 733 (208 290) (221 249) 5 208 194 4 731 483 (132 942) (180 781) 4 417 760 Less: Inter-company sales (192 094) 179 085 – (13 009) (132 234) 118 470 – (13 764)
5 445 639 (29 205) (221 249) 5 195 185 4 599 249 (14 472) (180 781) 4 403 996
CONTRIBUTION AFTER MARKETING EXPENSESSouthern Africa 1 177 249 – (73 633) 1 103 616 1 245 746 – (38 919) 1 206 827
OTC 707 403 – – 707 403 660 492 – – 660 492 Prescription 321 704 – – 321 704 371 801 – – 371 801 Hospital 148 142 – (73 633) 74 509 213 453 – (38 919) 174 534
Rest of Africa and India 157 221 (59 382) – 97 839 75 703 (40 896) – 34 807 Less: Inter-company (9 194) – – (9 194) (7 492) – – (7 492)
1 325 276 (59 382) (73 633) 1 192 261 1 313 957 (40 896) (38 919) 1 234 142 Less: Other operating expenses (434 471) 3 906 21 586 (408 979) (445 136) 15 197 11 910 (418 029)
Research and development (104 941) – – (104 941) (81 601) – – (81 601)Fixed and administrative (329 530) 3 906 21 586 (304 038) (363 535) 15 197 11 910 (336 428)
Operating profit 890 805 (55 476) (52 047) 783 282 868 821 (25 699) (27 009) 816 113

142
ADCOCK INGRAM INTEGRATED REPORT 2013
SHAREHOLDER ANALYSIS
1. REGISTERED SHAREHOLDER SPREAD In accordance with the JSE Listings Requirements, the following table confirms the spread of registered shareholders as detailed in the
Integrated Report and Annual Financial Statements dated 30 September 2013:
Shareholder typeNumber
of holders% of total
shareholdersNumber of shares
% of issued capital
1 – 1 000 shares 6 604 68,9 2 458 076 1,21 001 – 10 000 shares 2 416 25,2 7 380 142 3,710 001 – 100 000 shares 361 3,8 11 558 985 5,7100 001 – 1 000 000 shares 164 1,7 56 472 604 28,11 000 001 shares and above 36 0,4 123 258 202 61,3
Total 9 581 100,0 201 128 009 100,0
2. PUBLIC AND NON-PUBLIC SHAREHOLDINGS Within the shareholder base, we are able to confirm the split between public shareholdings and directors/company-related schemes
as being:
Shareholder typeNumber
of holders% of total
shareholdersNumber of shares
% of issued capital
Non-public shareholders* 8 0,08 32 903 074 16,4
Adcock Ingram Holdings Limited Employee Share Trust (2008) 1 0,01 54 200 0,0Adcock Ingram Limited 1 0,01 4 285 163 2,1Blue Falcon Trading 69 (Pty) Limited (A shares) 1 0,01 19 458 196 9,7Blue Falcon Trading 69 (Pty) Limited (ordinary shares) 1 0,01 1 883 000 0,9Mpho ea Bophelo Trust (B shares) 1 0,01 6 486 065 3,2Mpho ea Bophelo Trust (ordinary shares) 1 0,01 688 000 0,3Directors 2 0,02 48 450 0,0
Public shareholders 9 573 99,92 168 224 935 83,6
Total 9 581 100,00 201 128 009 100,0
3. SUBSTANTIAL INVESTMENT MANAGEMENT EQUAL TO OR IN EXCESS OF 5% Through regular analysis of STRATE registered holdings, and pursuant to the provisions of section 56(7)(b) of the Companies Act, the
following shareholders held, directly and indirectly, equal to or in excess of 5% of the issued share capital as at 30 September 2013:
Investment managerTotal
shareholding %
PIC 26 696 649 13,27Blue Falcon Trading 69 (Pty) Limited 21 341 196 10,61Foord Asset Management (Pty) Limited 17 212 817 8,56Prudential Portfolio Managers 12 140 828 6,04
Total 77 391 490 38,48
* Associates of directors do not hold any shares.

143
ADCOCK INGRAM INTEGRATED REPORT 2013
SHAREHOLDER ANALYSIS(continued)
4. GEOGRAPHICAL SPLIT OF BENEFICIAL SHAREHOLDERS
CountryTotal
shareholding% of issued
share capital
South Africa 172 950 685 86,00United States of America and Canada 11 411 646 5,67United Kingdom 5 169 496 2,57Rest of Europe 2 515 266 1,25Rest of the World¹ 9 080 916 4,51
Total 201 128 009 100,00
¹ Represents all shareholdings except those in the above regions.
* Beneficial interest and beneficial shareholder categories are not shown in this report, as agreed with JSE.
5. MONTHLY TRADING HISTORY The high, low and closing price of ordinary shares on the JSE and the aggregated monthly value during the financial year are set out
below:
MonthTotal volume Total value
R’mHigh
RLow
R
Closingprice
R
2012 – October 6 008 100 350,01 60,00 57,07 57,902012 – November 10 914 600 604,33 58,46 52,90 53,502012 – December 14 653 100 774,18 55,51 51,00 54,002013 – January 5 765 700 325,75 58,99 53,17 57,402013 – February 4 993 100 281,29 59,00 54,06 55,882013 – March 29 437 700 1 730,96 63,11 52,70 60,592013 – April 27 002 500 1 629,67 63,48 58,50 61,002013 – May 19 777 300 1 325,68 72,00 61,00 68,502013 – June 9 292 300 607,65 68,75 62,33 65,002013 – July 10 821 600 721,30 70,00 60,00 67,732013 – August 6 339 800 425,80 69,00 65,43 66,102013 – September 7 206 700 488,03 69,55 63,55 68,55
Source: Deutsche Bank
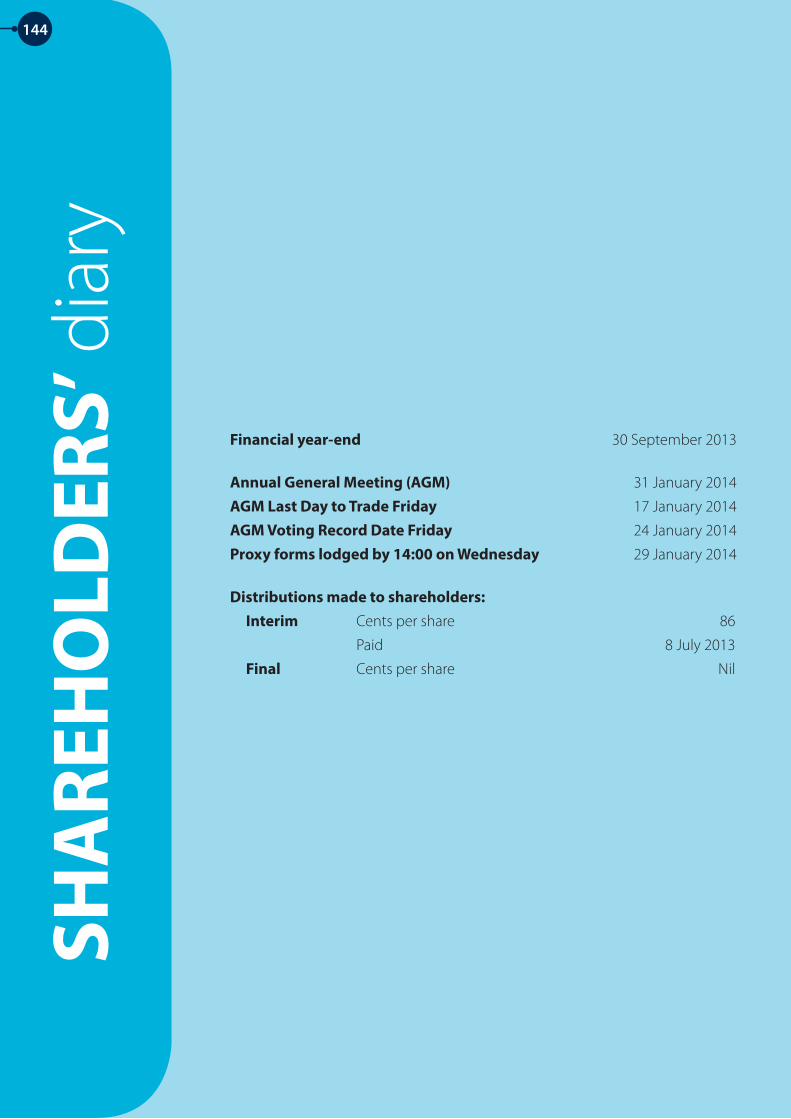
SHA
REH
OLD
ERS’
dia
ry
Financial year-end 30 September 2013
Annual General Meeting (AGM) 31 January 2014
AGM Last Day to Trade Friday 17 January 2014
AGM Voting Record Date Friday 24 January 2014
Proxy forms lodged by 14:00 on Wednesday 29 January 2014
Distributions made to shareholders: Interim Cents per share 86
Paid 8 July 2013
Final Cents per share Nil
144

145
ADCOCK INGRAM INTEGRATED REPORT 2013
NOTICE OF ANNUAL GENERAL MEETING
ADCOCK INGRAM HOLDINGS LIMITED(Incorporated in the Republic of South Africa)
Registration number 2007/016236/06ISIN: ZAE000123436 JSE Share Code: AIP
(“Adcock Ingram” or “the Company”)
Board of directors: Dr KDK Mokhele (Chairman), Mr AG Hall (Deputy CEO and Financial Director), Prof M Haus, Dr T Lesoli, Dr JJ Louw (CEO), Mr PM Makwana, Mr CD Raphiri, Mr LE Schönknecht, Dr RI Stewart, Mr AM Thompson
NOTICE OF ANNUAL GENERAL MEETING OF SHAREHOLDERSNotice is hereby given that the annual general meeting of shareholders of Adcock Ingram will be held at the Company’s premises, 1 New Road, Midrand, Gauteng on Friday, 31 January 2014 at 14:00 (“Annual General Meeting”).
[This document is important and requires your immediate attention. Your attention is drawn to the notes at the end of this notice, which contain important information regarding shareholders’ participation at the Annual General Meeting. For purposes of this Notice of Annual General Meeting and the explanatory notes hereto, the term “shareholder” shall have the meaning ascribed thereto in section 57(1) of the Companies Act 71 of 2008 (“Companies Act”).]
In terms of section 59(1) of the Companies Act the Board of Adcock Ingram (“the Board”) has set the record date to determine which shareholders are entitled to: (a) receive this Notice of Annual General Meeting as being Friday, 13 December 2013 and (b) participate in and vote at the Annual General Meeting as being Friday, 24 January 2014. The last day to trade in the Company’s shares, in order to participate in and vote at the Annual General Meeting is Friday, 17 January 2014. The meeting is convened for the purpose of conducting the following business:
1. PRESENTATION OF ANNUAL FINANCIAL STATEMENTSThe Board hereby presents the audited annual financial statements of the Company and the Group, incorporating, inter alia, the reports of the external Auditors, Audit Committee and the directors for the year ended 30 September 2013.
2. SOCIAL ETHICS AND TRANSFORMATION COMMITTEE REPORTThe Board hereby presents the report of the Social, Ethics and Transformation Committee for the year ended 30 September 2013, as required in terms of Regulation 43(5)(c) of the Companies Regulations, 2011.
3. RE-ELECTION OF DIRECTORSOrdinary resolution 1To elect by way of separate resolutions directors who retire by rotation in accordance with the Company’s Memorandum of Incorporation. The directors retiring are listed below:
1.1 Mr CD Raphiri;1.2 Mr LE Schönknecht; and1.3 Mr A M Thompson.
Mr Raphiri and Mr Thompson, being eligible and available, offer themselves for re-election. Mr LE Schönknecht is not available, and does not offer himself for re-election.
An abbreviated curriculum vitae in respect of each director offering himself for re-election is contained on page 11 of the Integrated Report.
4. ELECTION OF AUDIT COMMITTEE MEMBERSOrdinary resolution 2To elect by way of separate resolutions the Audit Committee members for the ensuing year in accordance with the Companies Act. The proposed Audit Committee members listed below currently serve on the same committee and, accordingly, offer themselves for re-election:
2.1 Prof. M Haus2.2 Dr R I Stewart; and2.2 Mr A M Thompson (Chairman) (subject to being re-elected as a director in terms of resolution number 1.3 above).
Prof. Haus is eligible and is nominated by the Board for election to the Audit Committee.
An abbreviated curriculum vitae in respect of each Audit Committee member offering himself for election or re-election is contained on pages 10 and 11 of the Integrated Report.
146
ADCOCK INGRAM INTEGRATED REPORT 2013
NOTICE OF ANNUAL GENERAL MEETING(continued)
5. RE-APPOINTMENT OF EXTERNAL AUDITORSOrdinary resolution 3To re-appoint Ernst & Young as independent external auditors of the Company for the ensuing year (the designated auditor being Mr WK Kinnear) and to note the remuneration of the independent external auditors as determined by the Audit Committee of the Board for the past year’s audit as reflected in note 4 to the annual financial statements.
6. DELEGATION OF AUTHORITYOrdinary resolution 4To authorise any one director and/or the Company Secretary to do all such things and sign all such documents as are deemed necessary or advisable to implement the resolutions set out in the notice convening the Annual General Meeting at which these resolutions will be considered.
7. NON-BINDING ADVISORY VOTEOrdinary resolution 5To consider and if deemed appropriate endorse, through a non-binding vote, the Company’s remuneration policy (excluding the remuneration of the non-executive directors and the members of Board committees for their services as directors and members of committees), as set out on page 50 of the Integrated Report.
Any other businessIn terms of section 61(8)(d) of the Companies Act, an Annual General Meeting must provide for the transacting of business in relation to any matters raised by shareholders, with or without advance notice to the Company.
Electronic communication and participationShareholders are advised in terms of section 63(3) of the Companies Act, that:
• while the meeting will be held in person, it is open to shareholders (and/or their proxies) to participate in (but not vote at) the Annual General Meeting by electronic communication, as contemplated in sub-section 63(2); and
• shareholders and/or proxies will be able, at their own expense, to access the meeting by means of a teleconference facility.
Arrangements can be made through the office of the Company Secretary.
Proxies and votingA shareholder entitled to attend and vote at the meeting is entitled to appoint a proxy to attend, participate in and vote at the meeting in the place of the shareholder. A proxy need not also be a shareholder of the Company.
Please note that, in accordance with section 63(1) of the Companies Act, the person presiding at the meeting must be reasonably satisfied that the right of that person to participate and vote, either as a shareholder, or as a proxy for a shareholder, has been reasonably verified. Accordingly, meeting participants (including shareholders and proxies) must provide satisfactory identification. Without limiting the generality hereof, the Company will accept a valid South African identity document, a valid driver’s licence or a valid passport as satisfactory identification.
Forms of proxy must be lodged in person or posted to the Company’s transfer secretaries, Computershare Investor Services (Proprietary) Limited (70 Marshall Street, corner Sauer Street, Johannesburg, 2001; PO Box 61051, Marshalltown, 2107), by no later than 14:00 on Wednesday, 29 January 2014.
All beneficial owners whose shares have been dematerialised through a Central Securities Depository Participant (“CSDP”) or broker, other than with “own name” registration, must provide the CSDP or broker with their voting instructions in terms of their custody agreement should they wish to vote at the Annual General Meeting. Alternatively, they may request the CSDP or broker to provide them with a letter of representation, in terms of their custody agreements, should they wish to attend the Annual General Meeting.
By order of the Board
NE SimelaneCompany SecretaryMidrand
18 December 2013

147
ADCOCK INGRAM INTEGRATED REPORT 2013
ANNUAL GENERAL MEETING – EXPLANATORY NOTES
PRESENTATION OF ANNUAL FINANCIAL STATEMENTSSection 61(8) of the Companies Act requires directors to present the annual financial statements for the year ended 30 September 2013 to shareholders, together with the reports of the directors and the Audit Committee at the Annual General Meeting. These are contained within the Integrated Report.
Shareholders are advised that, in terms of section 62(3)(d)(ii) of the Companies Act, a copy of the complete annual financial statements for the preceding financial year may be obtained by submitting a written request to the Company Secretary, and electronic copies are available on the Adcock website.
SOCIAL, ETHICS AND TRANSFORMATION COMMITTEE REPORTRegulation 43(5)(c) of the Companies Regulation, 2011 requires the Social and Ethics Committee, through one of its members, to report to the shareholders at the Annual General Meeting. The Social, Ethics and Transformation Committee’s report is available on the Adcock website.
ORDINARY RESOLUTION 1 – RE-ELECTION OF DIRECTORSIn accordance with the Company’s Memorandum of Incorporation (the MOI), one-third of the directors are required to retire at each Annual General Meeting and may offer themselves for re-election.
The following directors retire by rotation:
Mr CD Raphiri;Mr LE Schönknecht; andMr A M Thompson.
Messrs Raphiri and Thompson, having been evaluated and had their suitability for re-appointment confirmed by the Nominations Committee, are eligible and offer themselves for re-election. Mr LE Schönknecht is not available, and does not offer himself for re-election.
Brief biographical details of each of the above directors and the remaining members of the Board, are set out on pages 10 and 11 of the Integrated Report.
To be adopted, each of the resolutions for the re-election of directors in Ordinary resolution 1 requires the support of more than 50% of the voting rights exercised on the resolution.
ORDINARY RESOLUTION 2 – ELECTION OF THE AUDIT COMMITTEE MEMBERSSection 94(2) of the Companies Act requires the Company to elect an Audit Committee comprising at least three members at each Annual General Meeting. In order to comply with this provision of the Companies Act the Board, following the recommendations of the Nominations Committee, hereby nominates the following directors to be elected as members of the Audit Committee:
Prof M HausDr R I Stewart; andMr A M Thompson (Chairman).
Mr A M Thompson was appointed the Chairman of the Audit Committee with effect from 12 April 2013 following Mr E K Diack’s resignation from the Board and its Committees.
To be adopted, each of the resolutions for the election of members of the Audit Committee in Ordinary resolution 2 requires the support of more than 50% of the voting rights exercised on the resolution.
ORDINARY RESOLUTION 3 – AUDITORSErnst & Young has indicated its willingness to continue in office and Ordinary resolution 3 proposes the re-appointment of that firm as the Company’s auditors with effect from 1 February 2014 until the next Annual General Meeting. As required in terms of section 90(1) of the Companies Act, as amended or replaced, the name of the designated auditor, Mr WK Kinnear, forms part of the resolution. The resolution also notes the remuneration of the independent external auditors as determined by the Audit Committee of the Board.
To be adopted, Ordinary resolution 3 requires the support of more than 50% of the voting rights exercised on the resolution.
ORDINARY RESOLUTION 4 – DIRECTOR OR COMPANY SECRETARY AUTHORISATIONAny one director or the Company Secretary of the Company be authorised to do all such things and sign all documents and take all such action as they consider necessary to implement the resolutions set out in the notice convening the Annual General Meeting at which this ordinary resolution will be considered.
To be adopted, Ordinary resolution 4 requires the support of more than 50% of the voting rights exercised on the resolution.

148
ADCOCK INGRAM INTEGRATED REPORT 2013
ANNUAL GENERAL MEETING – EXPLANATORY NOTES
ORDINARY RESOLUTION 5 – REMUNERATION POLICY NON-BINDING ADVISORY VOTEChapter 2 paragraph 186 of King III dealing with boards and directors requires companies to table their remuneration policy to shareholders every year for a non-binding advisory vote at the Annual General Meeting. This vote enables shareholders to express their views on the remuneration policies adopted and on their implementation. The Company’s remuneration report is contained on pages 50 to 59 of the Integrated Report. Ordinary resolution 5 is of an advisory nature only and failure to pass this resolution will therefore not have any legal consequences relating to existing arrangements. However, the Board will take the outcome of the vote into account when reviewing the Company’s remuneration policy.
To be adopted, Ordinary resolution 5 requires the support of more than 50% of the voting rights exercised on the resolution.
QUORUMThe meeting of shareholders contemplated herein may begin, and a matter may begin to be debated at that meeting, only if the following quorum requirements are met:
1. subject to 2 and 3:
1.1 a meeting of shareholders may not begin until sufficient persons are present at the meeting to exercise, in aggregate, at least 25% of all of the voting rights that are entitled to be exercised in respect of at least one matter to be decided at the meeting; and
1.2 a matter to be decided at the meeting may not begin to be considered unless sufficient persons are present at the meeting to exercise, in aggregate, at least 25% of all of the voting rights that are entitled to be exercised on that matter at the time the matter is called on the agenda.
2. once a quorum has been established at a meeting of shareholders, all the shareholders required to maintain such quorum must be present at that meeting to consider and vote on any matter; and
3. notwithstanding the percentage figures set out in 1, as the Company has more than 2 (two) shareholders, a meeting may not commence, or a matter begin to be debated unless:
3.1 at least 3 (three) shareholders are present at the meeting; and 3.2 the requirements of 1, are satisfied.

149
ADCOCK INGRAM INTEGRATED REPORT 2013
FORM OF PROXY
ADCOCK INGRAM HOLDINGS LIMITED(Incorporated in the Republic of South Africa)
Registration number 2007/016236/06ISIN: ZAE000123436 JSE Share Code: AIP
(“Adcock Ingram” or “the Company”)
For use by certificated shareholders and “own name” dematerialised shareholders of Adcock Ingram in respect of the Annual General Meeting of shareholders to be held at 1 New Road, Midrand, Gauteng, on Friday, 31 January 2014 at 14:00.
A shareholder is entitled to appoint one or more proxies (none of whom need to be a shareholder of Adcock Ingram) to attend, speak and vote or abstain from voting in the place of that shareholder at the Annual General Meeting.
All terms defined in the Notice of Annual General Meeting to shareholders dated 18 December 2013 to which this form of proxy is attached and not defined herein shall bear the same meanings herein.
This form of proxy is only to be completed by those ordinary shareholders of Adcock Ingram who hold ordinary shares in certificated form or who are recorded on sub-registered electronic form in “own name”. Shareholders who hold dematerialised ordinary shares are referred to paragraphs 3 and 4 of the “Notes” overleaf for further instructions.
I/We, the undersigned (Please print full names)
of (address)
being a shareholder of the Company, and entitled to (insert number) votes, do hereby appoint:
or failing him/her,
or, failing him/her,
the chairman of the Annual General Meeting,
as my/our proxy to vote for me/us on my/our behalf at the Annual General Meeting of shareholders of the Company to be held at the Company’s premises, 1 New Road, Midrand, Gauteng on Friday, 31 January 2014 at 14:00 or any adjournment thereof, as follows:
(*Indicate instructions to proxy by insertion of the relevant number of votes exercisable by the shareholders in the space provided below. If no instructions are given, the proxy holder will be entitled to vote or to abstain from voting as such proxy holder deems fit.)
Number of votes
*In favour of the resolution
*Against the resolution
*Abstain from voting on the
resolution
1. To re-elect the following directors who retire in terms of the Company’s MOI and make themselves available for reelection:
1.1 Mr CD Raphiri
1.2 Mr AM Thompson
2. To elect the following Audit Committee members:
2.1 Prof. M Haus
2.2 Dr RI Stewart
2.3 Mr AM Thompson (Chairman)
3. To re-appoint Ernst & Young Inc. as the Company’s auditors
4. To authorise any one director or Company Secretary to do all such things and sign all such documents to implement the above resolutions
5. To endorse by way of a non-binding vote the Company’s remuneration policy
And generally to act as my/our proxy at the Annual General Meeting.
Signed by me (full names) in my capacity as
at (place) on this (date, month and year)
Signature
Please read the notes on the reverse hereof.

150
ADCOCK INGRAM INTEGRATED REPORT 2013
NOTES TO COMPLETION OF FORM OF PROXY
1. If you have disposed of all your ordinary shares, this document should be handed to the purchaser of such ordinary shares or the broker, Central Securities Depository Participant (“CSDP”), banker, attorney, accountant or other person through whom the disposal was effected.
2. If you are in any doubt as to what action you should take arising from this document, please immediately consult your broker, CSDP, banker, attorney, accountant or other person through whom the disposal was effected. You are reminded that the onus is on you to communicate with your CSDP or broker.
3. A form of proxy is only to be completed by those ordinary shareholders who are: 3.1 holding ordinary shares in certificated form; or 3.2 recorded on sub-register electronic form in “own name”.
4. If you have already dematerialised your ordinary shares through a CSDP or broker and wish to attend the Annual General Meeting, you must request your CSDP or broker to provide you with a letter of representation or you must instruct your CSDP or broker to vote by proxy on your behalf in terms of the agreement entered into between yourself and your CSDP or broker.
5. A shareholder may insert the name of a proxy or the names of two alternative proxies of the shareholder’s choice in the space provided with or without deleting “the chairman of the Annual General Meeting” but any such deletion must be initialled by you. Any insertion or deletion not complying with the foregoing will, subject to 15 below, be declared not to have been validly effected. A proxy need not be a shareholder of the Company. The person whose name stands first on this form of proxy and who is present at the Annual General Meeting of shareholders will be entitled to act as proxy to the exclusion of those whose names follow. In the event that no names are indicated, the proxy shall be exercised by the chairman of the Annual General Meeting.
6. If voting is by a show of hands, any person who is present at the meeting, whether as a shareholder or as a proxy for a shareholder, has the number of votes determined in accordance with the voting rights associated with the securities held by that shareholder.
7. A shareholder’s instructions to the proxy must be indicated by the insertion of the relevant numbers of votes exercisable by the shareholder in the appropriate box provided. Failure to comply with the above will be deemed to authorise the proxy to vote or to abstain from voting at the Annual General Meeting as he/she deems fit in respect of all the shareholder’s votes exercisable thereat. A shareholder or the proxy is not obliged to use all the votes exercisable by the shareholder or by the proxy, but the total of the votes cast and in respect of which abstention is recorded, may not exceed the maximum number of the votes exercisable by the shareholder or by the proxy.
8. The proxy shall (unless this sentence is struck out and countersigned) have the authority to vote, as he/she deems fit, on any other resolution which may validly be proposed at the meeting, including in respect of the proposed amendment to the above resolutions. If the aforegoing sentence is struck out, the proxy shall be deemed to be instructed to vote against any such proposed additional resolution and/or proposed amendment to an existing resolution as proposed in the notice to which this form of proxy is attached. A vote given in terms of an instrument of proxy shall be valid in relation to the meeting, notwithstanding the death of the person granting it, or the revocation of the proxy, or the transfer of the shares in respect of which the vote is given, unless an intimation in writing of such death, revocation or transfer is received by the Company Secretary before the commencement of the Annual General Meeting.
9. Forms of proxy must be received by the Company’s transfer secretaries by no later than 14:00 on Wednesday, 29 January 2014 (or not less than 48 hours before any adjourned or postponed meeting). The transfer secretaries’ address is: Computershare Investor Services (Pty) Limited, 70 Marshall Street, Johannesburg, 2001 (PO Box 61051, Marshalltown, 2107). The Company may at its sole discretion and in exceptional circumstances accept late forms of proxy.
10. The completion and lodging of this form of proxy will not preclude the relevant shareholder from attending the Annual General Meeting and speaking and voting in person thereat to the exclusion of any proxy appointed in terms hereof.
11. Documentary evidence establishing the authority of a person signing this form of proxy in a representative capacity or other legal capacity must be attached to this form of proxy, unless previously recorded by the transfer secretaries or waived by the chairman of the Annual General Meeting. A minor or any other person under legal incapacity must be assisted by his/her parent or guardian, as applicable, unless the relevant documents establishing his/her capacity are produced or have been registered by Adcock Ingram.
12. Any alteration or correction made to this form or proxy must be initialled by the signatory/ies.
13. Notwithstanding the aforegoing, the chairman of the Annual General Meeting may waive any formalities that would otherwise be a pre-requisite for a valid proxy.
Where there are joint holders of shares: (i) any one holder may sign this form of proxy; and (ii) the vote(s) of the senior shareholder (for that purpose seniority will be determined by the order in which the names of the shareholders appear in the securities register of the Company) who tenders a vote (whether in person or by proxy) will be accepted to the exclusion of the vote(s) of the other joint shareholders.
14. The chairperson of the Annual General Meeting may reject or accept any form of proxy which is completed and/or received, other than in compliance with these notes.
15. A proxy may not delegate his/her authority to act on behalf of the shareholder in question to another person.

151
ADCOCK INGRAM INTEGRATED REPORT 2013
SUMMARY OF APPLICABLE RIGHTS ESTABLISHED IN TERMS OF SECTION 58 OF THE COMPANIES ACTFor purposes of this summary, the term “shareholder” shall have the meaning ascribed thereto in section 57(1) of the Companies Act 71 of 2008 (“Companies Act”).
1. At any time, a shareholder of a company is entitled to appoint any individual, including an individual who is not a shareholder of that company, as a proxy to participate in, speak and vote at, a shareholders’ meeting on behalf of the shareholder.
2. A proxy appointment must be in writing, dated and signed by the relevant shareholder.
3. Except to the extent that the memorandum of incorporation of a company provides otherwise: 3.1 a shareholder of the relevant company may appoint two or more persons concurrently as proxies, and may appoint more than one proxy
to exercise voting rights attached to different securities held by such shareholder; 3.2 a proxy may delegate the proxy’s authority to act on behalf of the shareholder to another person, subject to any restriction set out in the
instrument appointing the proxy; and 3.3 a copy of the instrument appointing a proxy must be delivered to the relevant company, or to any other person on behalf of the relevant
company, before the proxy exercises any rights of the shareholder at a shareholders meeting.
4. Irrespective of the form of instrument used to appoint a proxy: 4.1 the appointment of the proxy is suspended at any time and to the extent that the shareholder who appointed that proxy chooses to act
directly and in person in the exercise of any rights as a shareholder of the relevant company; and 4.2 should the instrument used to appoint a proxy be revocable, a shareholder may revoke the proxy appointment by cancelling it in writing,
or making a later inconsistent appointment of a proxy, and delivering a copy of the revocation instrument to the proxy and the relevant company.
5. The revocation of a proxy appointment constitutes a complete and final cancellation of the proxy’s authority to act on behalf of the relevant shareholder as of the later of the date:
5.1 stated in the revocation instrument, if any; or 5.2 upon which the revocation instrument is delivered to the proxy and the relevant company.
6. Should the instrument appointing a proxy or proxies have been delivered to the relevant company, as long as that appointment remains in effect, any notice that is required by the Companies Act or the relevant company’s memorandum of incorporation to be delivered by such company to the shareholder must be delivered by such company to the:
6.1 shareholder; or 6.2 proxy or proxies if the shareholder has in writing directed the relevant company to do so and has paid any reasonable fee charged by the
company for doing so.
7. A proxy is entitled to exercise, or abstain from exercising, any voting right of the relevant shareholder without direction, except to the extent that the memorandum of incorporation of the relevant company or the instrument appointing the proxy provides otherwise.
8. If a company issues an invitation to shareholders to appoint one or more persons named by such company as a proxy, or supplies a form of instrument for appointing a proxy:
8.1 such invitation must be sent to every shareholder who is entitled to receive notice of the meeting at which the proxy is intended to be exercised and must bear a reasonably prominent summary of the rights established by section 58 of the Companies Act;
8.2 the company must not require that the proxy appointment be made irrevocable; and 8.3 the proxy appointment remains valid only until the end of the relevant meeting at which it was intended to be used, unless revoked as
contemplated in section 58(5) of the Companies Act (see paragraph 5 above).

152
ADCOCK INGRAM INTEGRATED REPORT 2013
GLOSSARY
The following terms and abbreviations, used in this Integrated Report, mean:
Adcock Ingram Adcock Ingram Holdings LimitedA ordinary share A share with a par value of 10 cents in the Company, which carries the same voting rights as an ordinary share, and which
is automatically convertible into an ordinary share on a one-for-one basisAPI Active Pharmaceutical Ingredient(s) used in the manufacturing of productsARV Anti-retrovirals, used in the treatment of HIV/AIDSBBBEE Broad-based black economic empowerment, as defined by the codes of BEE good practiceBEE Black Economic Empowerment, as envisaged in the BBBEE Act, 2003BEE-Co Blue Falcon 69 Trading (Proprietary) Limited (Registration number 2009/016091/07), a private company through which the
Strategic Partners hold their equity interests in Adcock IngramBEE Participants BEE-Co and the Employee TrustBlue Falcon 59 Trading (Pty) Limited
BEE-Co owned by Kagiso 62,9%, Kurisani 26,6% and Mookodi 10,5%
B ordinary share A share with a par value of 10 cents in the Company, which carries the same voting rights as an ordinary share, and which is automatically convertible into an ordinary share on a one-for-one basis
CAMs Complementary alternative medicinesCO2 Carbon dioxideCO2e Carbon dioxide equivalent Companies Act The Companies Act (Act 71 of 2008)DMD Drug management and developmentDPP DextropropoxypheneEmployee Trust The Mpho ea Bophelo Trust (Master’s reference number IT330/2010) FDA The Food and Drug Administration, a regulatory body in the United StatesFMCG Fast moving consumer goodsGMP Good manufacturing practiceGroup Adcock Ingram and its direct and indirect subsidiaries, joint ventures and associates from time to timeHRT Hormone Replacement TherapyHVL High-volume liquids, used in the context of the plant operated by Adcock Ingram in ClayvilleIFRS International Financial Reporting StandardsIT Information TechnologyJIBAR Johannesburg Interbank Agreed RateJSE JSE Limited, the securities exchange on which the shares of Adcock Ingram are listedKagiso Kagiso Strategic Investments III (Proprietary) Limited (Registration number 2007/023000/07)Kurisani Kurisani Youth Development Trust (Master’s reference number IT8979/04), a trust set up in accordance with the laws of
South Africa to benefit historically disadvantaged South African youth through loveLife’s ProgrammeskWh Kilowatt hourLIBOR London Interbank Offered RateMCC Medicines Control Council, the regulatory body responsible for evaluation of and monitoring the quality, safety and
efficacy of medicines on the South African marketMNC Multi-national companiesMookodi The Mookodi Pharma Trust (Master’s reference number IT314/2010), a trust set up in accordance with the laws of
South Africa and for the benefit of black medical doctors and/or health professionalsMSD MSD (Pty) Limited, also known as MerckOTC Over the Counter products, available without prescriptionPIC/S Pharmaceutical Inspection Convention and Pharmaceutical Co-operation SchemeR&D Research and DevelopmentSEP Single exit price, the price determined by regulation, at which medicines may be offered for sale on the South African
private marketSIP Strategic Industrial ProjectVMS Vitamins, minerals and supplementsWHO World Health OrganizationZAR South African Rand

Adcock Ingram
Integrated Reportt 2013
ENQUIRIES:For questions regarding this report, contact
Ntando Simelane Company Secretary
Email: [email protected] Tel: +27 11 6350143
More detailed information is also available on www.adcock.com
Adcock Ingram welcomes feedback from stakeholders at [email protected]