integrated analysis for the design of reusable tps based...
TRANSCRIPT

1
Integrated Analysis for the Design of Reusable TPS based on
Variable Transpiration Cooling for Hypersonic Cruise
Vehicles
S. Gulli1, L. Maddalena
2
The University of Texas at Arlington, Arlington, TX
S. Hosder3
Missouri University of Science and Technology, Rolla, MO, 65409
Abstract
The thermal management of hypersonic air-breathing vehicles presents formidable challenges. Reusable thermal
protection systems (TPS) are one of the key technologies that have to be improved in order to use hypersonic
vehicles as practical, long-range transportation systems. Both the aerodynamic and the material performances
are strongly related to the near-wall effects. The viscous dissipation within the hypersonic boundary layer,
coupled with the high dynamic pressure flight trajectories, generates surface temperatures for which the
strength and the environmental durability of the material can be widely exceeded. In this type of environment,
active cooling systems have to be considered in order to afford long duration flights in hypersonic regime.
Transpiration cooling represents a promising technique in terms of temperature reduction and coolant mass
saving. In order to explore the potential of this technique, it is important to understand the physics that
characterize the boundary layer and its interaction with the vehicle’s surface. The integrated analysis of the
hypersonic boundary layer coupled with the thermal response of a porous medium is performed here for a flat
plate and a 2-D blunt body configuration. A constant value of the transversal wall velocity is used to simulate
uniform transpiration. A saw-tooth wall velocity distribution is used to simulate the variable transpiration
strategy. An equal amount of coolant usage has been imposed in order to compare the cooling effectiveness in the
two cases. The uniform transpiration allows a reduction of 49% on the stagnation point heat flux in comparison
with the case without transpiration. The variable transpiration reduces the stagnation point heat flux by an
additional 7% with respect to the uniform transpiration case. The heat fluxes derived from the solution of the
hypersonic boundary layer as well as the imposed wall temperature are used to perform an integrated analysis
that includes the porous material. The test cases analyzed emphasize the importance of evaluating the influence
of the material’s thermo-physical properties at the initial design stage. For the flight conditions considered in
this analysis a combination of low material porosity and high thermal conductivity are necessary to generate the
required injection strategy. The integrated analysis is essential for the purpose of establishing the optimum
transpiration strategy needed to maintain the surface temperatures in the required range. The change in the
transpiration distribution along the vehicle surfaces (variable transpiration) allows to selectively cool down the
structure in the regions where the higher heat fluxes are located (i.e. nose, leading edges) and diminishes the
amount of required coolant fluid. The transpiration for the blunt body can be limited to the regions where the
local wall heat flux is greater than or equal to approximately 20% of the stagnation point heat flux. This strategy
allows the reduction of the total amount of coolant by 62% for the uniform transpiration and by 58% for the
variable transpiration.
Nomenclature
= surface exposed to the flow,
BC = boundary condition
BL = boundary layer
= permeability coefficient,
C/C = carbon-carbon
= specific heat at constant pressure, J/kgK
G = mass flow rate for unit of area, kg/ s
H = material thickness, m
1 Graduate Research Assistant, Aerospace Engineering, 500 W. First Street, Arlington, TX 76019, AIAA Member.
2 Assistant Professor, Aerospace Engineering, 500 W. First Street, Arlington, TX 76019, AIAA Member.
3 Assistant Professor, Aerospace Engineering, 400 West 13
th Street, Rolla, MO 65409, AIAA Senior Member.
10th International Energy Conversion Engineering Conference30 July - 01 August 2012, Atlanta, Georgia
AIAA 2012-4161
Copyright © 2012 by S. Gulli, L. Maddalena, S. Hosder. Published by the American Institute of Aeronautics and Astronautics, Inc., with permission.

2
k = thermal conductivity, W/mK
= volumetric heat transfer coefficient, W/ K
= mass flow rate, kg/s
Nu = Nusselt number
ODE = ordinary differential equation
P = pressure, Pa
q = heat flux, W/
Re = Reynolds number
= radius of spheres that simulate the porosity, m
SP = stagnation point
T = temperature, K
TPS = thermal protection system
t = time, s
= longitudinal velocity, m/s
= University of Texas at Arlington
V = transversal velocity, m/s
Subscripts
CF = coolant fluid
e = external
i = initial
m = matrix or porous medium
R = radiative
t = total
W = wall
0 = reference value
I. Introduction
any challenges have to be overcome in order to enable sustained hypersonic flights. Among these, the
management of heat loads and of surface temperatures has to be mentioned. The viscous dissipation of the
high enthalpy flow across the hypersonic boundary layer can increase the flow temperature to levels that
exceed the thermo-mechanical limits the available materials. The surface temperatures can be further increased by the
interaction of the dissociated flow with the vehicle’s surface. Neither current carbon nor ceramic-based materials are
able to sustain the generated extreme surface temperatures for long exposure times. In addition, high pick heat fluxes
are particularly dangerous even if characterized by small characteristic times, due to the material’s spallation
phenomenon. In this harsh environment, the cooling of the exposed structure, (i.e., surfaces exposed to external flows as
well as internal flows as those typical of the combustor of a scramjet engine) is a stringent requirement. The
transpiration cooling technique allows for a decrease in the heat flux at the wall through the issuing of coolant fluid
from a porous material into the boundary layer. Furthermore, the issuing phenomenon near the wall generates a
protective layer of coolant which favorably acts on preventing active oxidation phenomena that are known to quickly
deteriorate the TPS when particular combinations of elevated temperatures and low partial pressures of oxygen occur.
This cooling feature is particularly effective if C-C/SiC based materials are considered. The injection conditions at the
hot wall are strictly connected to the heat exchange between the porous body and the boundary layer flow. Based on
these considerations, it is necessary to be able to investigate the cooling efficiency of different techniques for various
flight conditions, and therefore different heat loads. In the previous works from the authors1,2
a reduced order model
was developed in order to couple the hypersonic boundary layer (AERO-code) with the thermal response of the porous
material (MAT-code). The complete integrated analysis of the coupling has been performed here in order to highlight
the importance of having the prediction capability and the strategic possibility to manipulate the natural properties of
the porous materials. In this scenario, the use of reduced order models is extremely useful in selectively studying the
effectiveness of different injection strategies to appropriately select and then optimize the thermal protection system
and, in turn, to reduce the costs of experimental campaigns.
M
3
II. Mathematical Models and Numerical Solutions
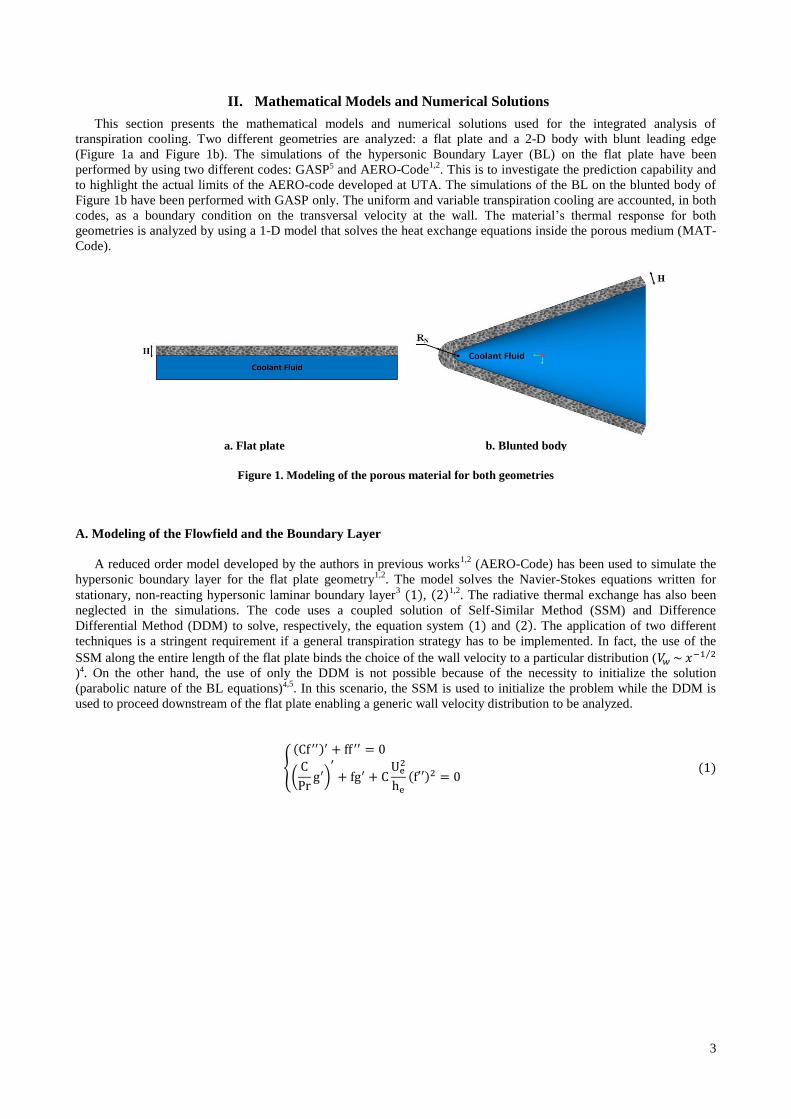
This section presents the mathematical models and numerical solutions used for the integrated analysis of
transpiration cooling. Two different geometries are analyzed: a flat plate and a 2-D body with blunt leading edge
(Figure 1a and Figure 1b). The simulations of the hypersonic Boundary Layer (BL) on the flat plate have been
performed by using two different codes: GASP5 and AERO-Code1,2
. This is to investigate the prediction capability and
to highlight the actual limits of the AERO-code developed at UTA. The simulations of the BL on the blunted body of
Figure 1b have been performed with GASP only. The uniform and variable transpiration cooling are accounted, in both
codes, as a boundary condition on the transversal velocity at the wall. The material’s thermal response for both
geometries is analyzed by using a 1-D model that solves the heat exchange equations inside the porous medium (MAT-
Code).
Figure 1. Modeling of the porous material for both geometries
A. Modeling of the Flowfield and the Boundary Layer
A reduced order model developed by the authors in previous works1,2
(AERO-Code) has been used to simulate the
hypersonic boundary layer for the flat plate geometry1,2
. The model solves the Navier-Stokes equations written for
stationary, non-reacting hypersonic laminar boundary layer3 , 1,2
. The radiative thermal exchange has also been
neglected in the simulations. The code uses a coupled solution of Self-Similar Method (SSM) and Difference
Differential Method (DDM) to solve, respectively, the equation system and . The application of two different
techniques is a stringent requirement if a general transpiration strategy has to be implemented. In fact, the use of the
SSM along the entire length of the flat plate binds the choice of the wall velocity to a particular distribution ( ⁄
)4. On the other hand, the use of only the DDM is not possible because of the necessity to initialize the solution
(parabolic nature of the BL equations)4,5. In this scenario, the SSM is used to initialize the problem while the DDM is
used to proceed downstream of the flat plate enabling a generic wall velocity distribution to be analyzed.
{
(
)
a. Flat plate b. Blunted body

4
{
[
]
(
)
(
)
(
)
The numerical simulations with AERO-Code have been performed for a mesh grid with 500 points along the y-direction
(across the BL) and 150 points along the x-direction (flat late length). The invariability of the results with respect to the
mesh grid has also been verified.
The Computational Fluid Dynamics (CFD) code GASP5 from AeroSoft Inc. has been used for the high-fidelity
numerical solution of the two-dimensional flow field including the shock-layer and the boundary layer regions over the
blunt body and flat plate geometries. GASP is a three-dimensional, structured, finite-volume, Reynolds-Averaged
Navier-Sokes (RANS) code, which is capable of modeling high-speed flows with frozen, equilibrium, or non-
equilibrium thermo-chemistry. Both for the blunt body and the flat plate cases, the inviscid fluxes were calculated with
the Roe-Harten6 flux-differencing scheme, which utilized third-order accurate upwind biased MUSCL interpolation and
Van Albada’s limiter. The viscous terms were calculated with second-order accurate central difference approximations
and the laminar flow assumption was made. For the cases with no transpiration, constant temperature no-slip boundary
condition was used for the wall, whereas for cases with the transpiration, specified velocity distributions were imposed
on the wall through slip-velocity, constant wall boundary condition. For both cases, the cross flow and the transpiration
gases were pure N2. The temperature and pressure values encountered during the simulations were below the onset
temperature and pressure values of the dissociation of the N2 gas, so no chemical reactions were considered. The
specific heats were calculated through Gordon and McBride curve fits to take into account the vibrational excitation
effects in the internal energy in thermodynamic equilibrium. The viscosity of the gas is calculated using the
Sutherland’s Law. The CFD solutions of the blunt body and the flat plate cases were obtained at three structured grid
levels: coarse, medium and fine to check the grid convergence. For all the cases, the results (pressure, wall heat flux,
skin-friction, etc) of the medium and fine grid levels were almost identical indicating the grid convergence at the
medium grid level. The results presented in this paper were obtained with the fine grid level, which has 273
(streamwise) x 257 (normal-to-wall) grid points for the blunt body and 101 (streamwise) x 181(normal-to-wall) grid
points for the flat plate. Figure 2 shows the fine grid level used in the blunt-body simulations. The iterative
convergence of the solutions was achieved by the reduction of the L2 norm of the governing equations ten orders of
magnitude and checking the convergence of pressure, heat flux, and skin-friction at selected wall locations.
Figure 2. The CFD grid (fine level) used in the blunt-body calculations

5
B. Modeling of the Porous Material
In this section the analysis of the porous material is described to relate the properties of the flow to those of the
coolant fluid issued from the porous wall. The characterization of the material response underneath the boundary layer
is essential to understand how the injection parameters of the coolant fluid influence the boundary layer profile. Figure
3 shows the schematic of the porous media with the relevant quantities involved in the analysis considered here. The
following assumptions are used for the thermal modeling of the porous material:
- 1-D analysis
- ⁄ (Stationary conditions)
- (Equal matrix and coolant temperatures at the cold wall)
- (Negligible radiation)
- (Matrix thermal conductivity constant with T, x, y)
- (Isotropicy of the porosity and permeability)
- as coolant fluid
Nitrogen has been considered as coolant fluid in order to neglect any chemical interaction with the free-stream flow.
The temperature of the material as well as the coolant’s temperature at the cold wall have been assumed similar within a
tolerance of 10 Kelvin. This assumption is reasonable in steady state conditions considering that no heat is permitted to
penetrate the material due to the blockage effect. The basis for introducing the tolerance chosen is clarified in the
discussion of the results for the flat plate geometry. The thermal conductivity has been considered constant because
carbon based materials have been selected for this analysis8. For most common carbon composite materials the thermal
conductivity doesn’t change considerably with the temperature. The invariance of the thermal conductivity with respect
to any location is discussed below where the model of the porous material is described. The heat exchange inside the
porous body has been modeled using the differential method. In this work, the differential method has been preferred
over the integral method since a detailed characterization of the thermodynamic parameters into the material is
necessary2,3,4.
Figure 3. Control volume for the thermo-fluid analysis of the porous material
The coolant’s pressure ( ) and temperature ( ), the material’s temperature ( ) and the convective heat transfer
( ) represent the unknowns of the problem. The material is modeled here as a homogenous material. The control
volume on a portion of the porous material has been selected (Figure 4) to impose the energy balance and extract the
heat exchange equations inside the porous material.
Figure 4. Domain used for the differential analysis
In Figure 4 the reference system has been placed on the hot wall in order to simplify the initialization of the
numerical method. The use of one dimensional model is justified by the fact that, for both blunted body and flat plate,
the longitudinal heat transfer (x-direction) has been considered negligible with respect to the heat transfer across the
6
material’s thickness. This assumption is valid when the material is homogenous and orthotropic thermal properties of
the porous matrix are considered. Porous media can be considered homogenous when the distribution and size of the
pores is uniform in all directions. If the material is homogenous, the coolant fluid has no preferential direction of flow
inside the pores network until a pressure gradient is applied in one or more directions. In this analysis the transpiration
is achieved by applying a pressure gradient across the material’s thickness and so, once the pores are completely filled
(steady state condition), the coolant will have a preferred direction of flow (main red filaments in Figure 4). The net
mass flux of coolant entering and exiting from the main stream filament (black arrows in Figure 4) is zero due to the
material’s homogeneity. In this way the same coolant mass injected at the cold wall will be issued at the same x-
location of the hot wall and it will be possible to consider the coolant mass flow rate constant across the material’s
thickness . Furthermore, if the longitudinal thermal conductivity of both coolant and material are lower with respect
to the transversal thermal conductivity of the material, the conductive and convective heat transfer along x can be
neglected. These considerations are practically realizable if the following materials are examined:
1. Laminate composites for which the carbon’s fibers have to be stacked at 90° with respect to the material
thickness,
2. Sintered carbon materials in which the carbon connections that create the pores are highly orientated
perpendicular to the material thickness. In fact, the thermal conduction in carbon materials occurs along the tightly-
bound planes of graphite. In the other direction (perpendicular to the graphite planes) the thermal conductivity is almost
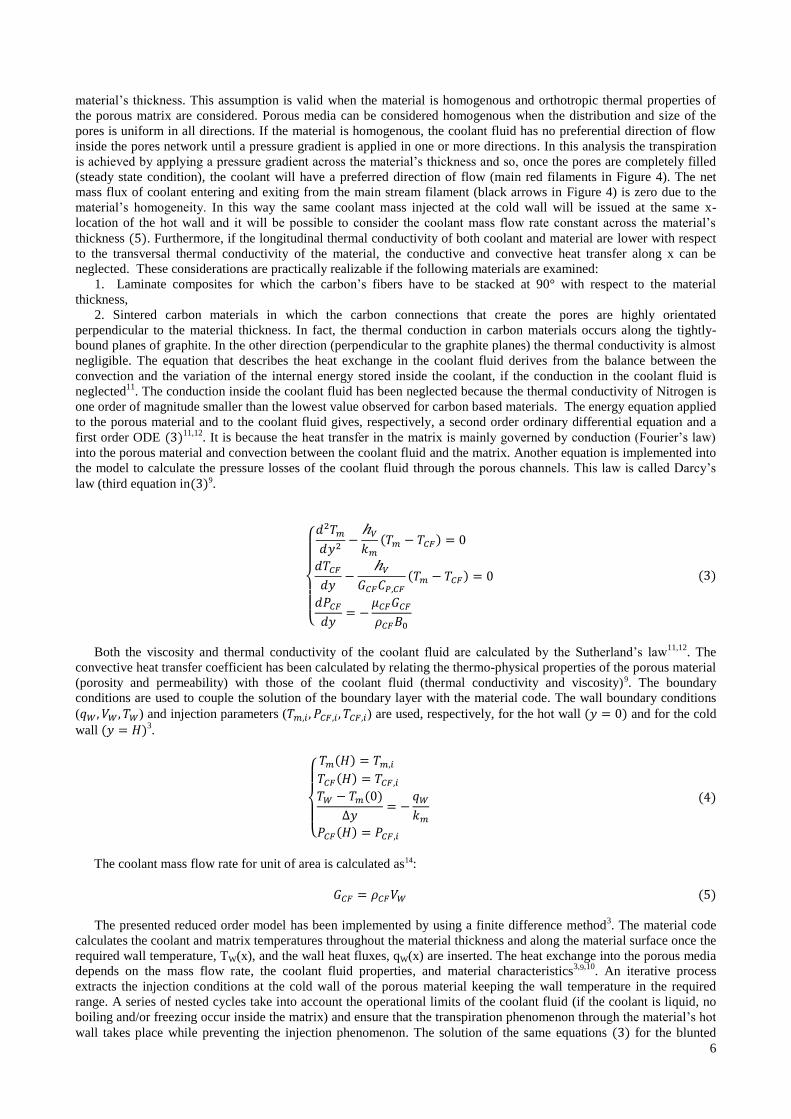
negligible. The equation that describes the heat exchange in the coolant fluid derives from the balance between the
convection and the variation of the internal energy stored inside the coolant, if the conduction in the coolant fluid is
neglected11
. The conduction inside the coolant fluid has been neglected because the thermal conductivity of Nitrogen is
one order of magnitude smaller than the lowest value observed for carbon based materials. The energy equation applied
to the porous material and to the coolant fluid gives, respectively, a second order ordinary differential equation and a
first order ODE 11,12. It is because the heat transfer in the matrix is mainly governed by conduction (Fourier’s law)
into the porous material and convection between the coolant fluid and the matrix. Another equation is implemented into
the model to calculate the pressure losses of the coolant fluid through the porous channels. This law is called Darcy’s
law (third equation in 9.
{
Both the viscosity and thermal conductivity of the coolant fluid are calculated by the Sutherland’s law11,12
. The
convective heat transfer coefficient has been calculated by relating the thermo-physical properties of the porous material
(porosity and permeability) with those of the coolant fluid (thermal conductivity and viscosity)9. The boundary
conditions are used to couple the solution of the boundary layer with the material code. The wall boundary conditions
( ) and injection parameters ( ) are used, respectively, for the hot wall and for the cold
wall 3.
{
The coolant mass flow rate for unit of area is calculated as14:
The presented reduced order model has been implemented by using a finite difference method3. The material code
calculates the coolant and matrix temperatures throughout the material thickness and along the material surface once the
required wall temperature, TW(x), and the wall heat fluxes, qW(x) are inserted. The heat exchange into the porous media
depends on the mass flow rate, the coolant fluid properties, and material characteristics3,9,10
. An iterative process
extracts the injection conditions at the cold wall of the porous material keeping the wall temperature in the required
range. A series of nested cycles take into account the operational limits of the coolant fluid (if the coolant is liquid, no
boiling and/or freezing occur inside the matrix) and ensure that the transpiration phenomenon through the material’s hot
wall takes place while preventing the injection phenomenon. The solution of the same equations for the blunted

7
body is possible with some limitations. In fact, the formulation of the model in Cartesian coordinates doesn’t account
for the variation of area due to the material thickness and to the radius of curvature of the leading edge. The change in
the area, which in a 2-D model is a length, is calculated by a simple geometric analysis referred to Figure 5.
Figure 5. Schematization of an annular sector of the leading edge
The more the area ratio is close to one, the more the Cartesian 1-D model is appliable to curved shapes. For the
blunted body case analyzed in Section III =0.80. The value of =0.75, which means H/RN = 0.5, is
considered as the limit above which the Cartesian coordinates cannot be applied to model curved geometries.
III. Integrated Analysis of Transpiration Cooling
In this section the integrated analysis of the boundary layer and the thermal response of the porous material are
performed for both the flat plate and the leading edge geometries. Two different transpiration strategies will be
considered for both the configurations: the uniform transpiration and the variable transpiration along the body’s surface.
A constant value of the wall velocity is imposed for the strategy with uniform transpiration (Figure 6a and Figure 7a).
The variable transpiration is obtained by imposing a saw-tooth distribution of the wall velocity (Figure 6b and Figure
7b).
Figure 6. Wall velocity distribution used for the simulations of the flat plate
a. Constant wall velocity b. Saw-tooth wall velocity

8
Figure 7. Wall velocity distribution used for the simulations of the blunted body
The saw-tooth distribution has been selected because in a previous work, authors2 highlighted its capability to save
coolant fluid with respect to other types of transpiration strategies. Two different nominal values of the wall velocity
distribution are chosen for both transpiration strategies and both geometries (Figure 6 and Figure 7). In this analysis the
total amount of coolant issued into the boundary layer has constrained to be constant in order to compare the
effectiveness of transpiration in terms of wall heat flux reduction. The total flow rate of coolant injected per unit width
is calculated integrating the mass flux with a trapezoidal quadrature formula (Table 1).
∫
Table 1 Total coolant flow rate for unit width
(kg/sm) (Constant ) (kg/sm) (Saw-tooth )
Flat Plate 0.0039 0.0039
2-D Blunted Body 0.0037 0.0038
A. Flat Plate Geometry
The simulations of the flat plate have been performed using the AERO-Code1,2
and GASP5. For both transpiration
strategies the wall velocity is activated at . The following input parameters are used:
-
-
-
-
-
- Nitrogen flow (in order to neglect chemical reactions)
- (at the end of the flat plate )
-
The flat plate length has been imposed in order to comply with the laminar flow assumption. The wall temperature
selected maintains almost the same temperature ratio used for previous analyses ( 0.5)1,2
. The higher wall
temperature with respect to the external temperature does not imply that the plate is being heated. The adiabatic wall
temperature corresponding to the flight conditions considered in this analysis is in the order of .
The uniform value of the wall temperature represents only a base case used for this analysis. In fact, in relation to
the material’s technology, the highest value of the wall temperature is desired in order to minimize the blowing of
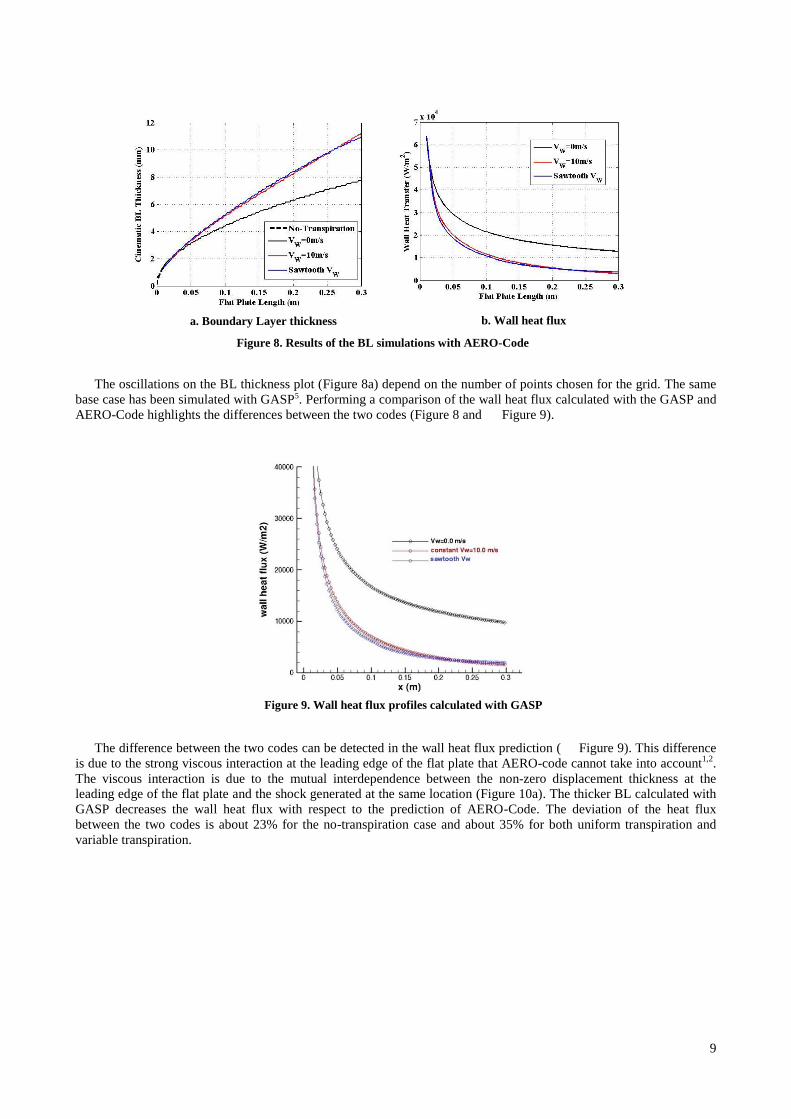
coolant. A variable wall temperature can be also implemented into the code. The results obtained from AERO-Code are
reported in Figure 8. The activation of the blowing increases the BL thickness (Figure 8a). The growth of both the
cinematic and thermal boundary layer thickness generates a decrease, respectively, of the velocity and temperature
gradient at the wall, which correspond to a diminishing of the wall shear stresses and wall heat fluxes (Figure 8b). The
uniform transpiration increases the BL thickness by about 15% and allows a decreasing of 45.7% of the wall heat flux at
. The variable transpiration reduces the wall heat flux by 49.4% at the same location.
a. Constant wall velocity b. Saw-tooth wall velocity
9
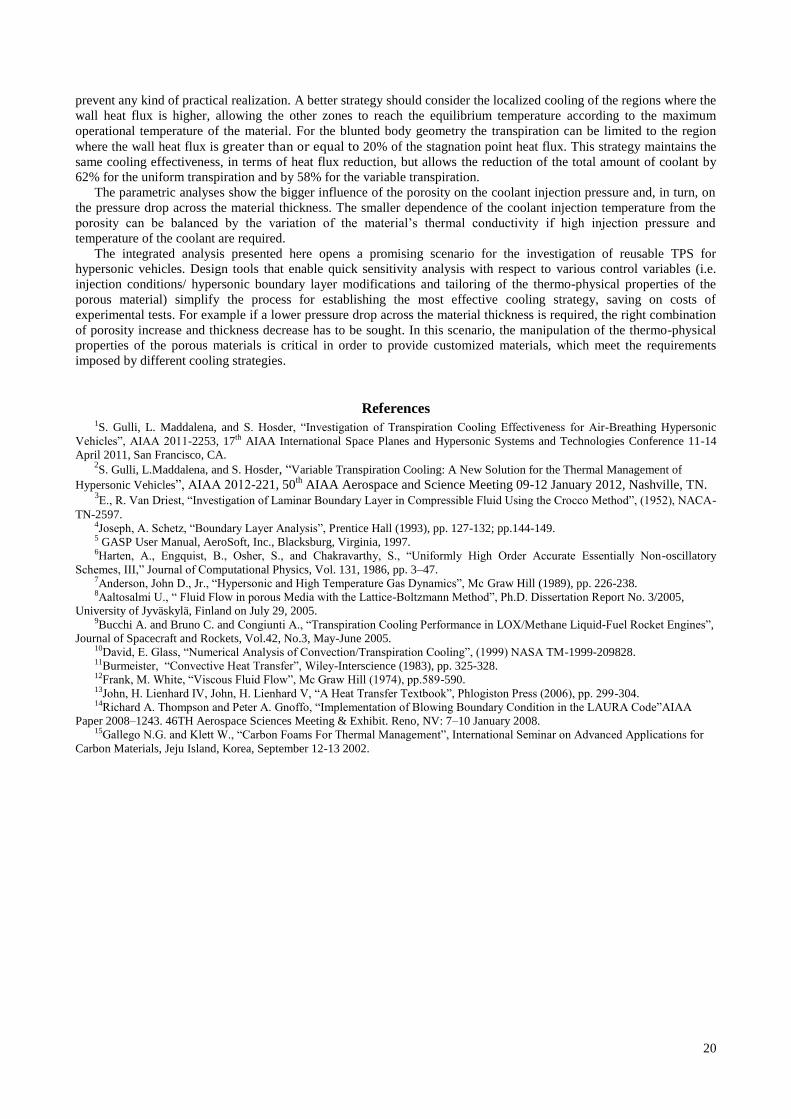
The oscillations on the BL thickness plot (Figure 8a) depend on the number of points chosen for the grid. The same
base case has been simulated with GASP5. Performing a comparison of the wall heat flux calculated with the GASP and
AERO-Code highlights the differences between the two codes (Figure 8 and Figure 9).
Figure 9. Wall heat flux profiles calculated with GASP
The difference between the two codes can be detected in the wall heat flux prediction ( Figure 9). This difference
is due to the strong viscous interaction at the leading edge of the flat plate that AERO-code cannot take into account1,2
.
The viscous interaction is due to the mutual interdependence between the non-zero displacement thickness at the
leading edge of the flat plate and the shock generated at the same location (Figure 10a). The thicker BL calculated with
GASP decreases the wall heat flux with respect to the prediction of AERO-Code. The deviation of the heat flux
between the two codes is about 23% for the no-transpiration case and about 35% for both uniform transpiration and
variable transpiration.
Figure 8. Results of the BL simulations with AERO-Code
a. Boundary Layer thickness b. Wall heat flux

10
Figure 10. Boundary layer simulation performed with the GASP solver
Figure 10b points out the fundamental importance of the hypersonic viscous effects in transpiration cooling. In fact,
the variation of the blowing velocity in the region near the leading edge affects directly the inclination of the shock
which, in turn, modifies the thermodynamic properties of the flow. The change of the wall pressure modifies the total
amount of coolant injected, if the transpiration velocity is kept the same of Figure 6. The total flow rate of coolant
blown increases by 28% for both uniform and variable transpiration ( ).
The variable transpiration has a higher nominal value of the blowing velocity near the leading edge (12m/s against
10m/s for the uniform transpiration). It generates a thicker BL which increase the shock angle and, in turn, the
downstream pressure. Consequently, in the region near the leading edge, the pressure at the wall for the variable
transpiration is higher with respect to the constant wall velocity. For the integrated analysis, it is preferable to use the
output data from GASP in order to take into account for the effects of the viscous interaction.
The wall heat fluxes ( ), the wall temperature ( ), the pressure inside the BL ( ) and the wall velocity ( )
are used as input parameters to perform the thermal analysis of the porous material. The thermo-physical properties of
the porous material are imposed considering C/C based materials. The base case is referred to the thermo-physical
properties of C/C foams for aerospace applications15.
-
- -
- - as coolant
The permeability has been calculated by the Brennan-Kroliczek relation3,9 which relates the permeability coefficient to
the dimension of the pores and to the porosity. An emphasis has to be placed on the choice of . The values of the
thermal conductivity range from 0.045 to 180 15. These values depend on the stacking sequence of the
composite material, if composite laminates are considered, or on the average orientation of the carbon/graphite grains, if
sintered materials are considered. In this analysis a low value of the transversal thermal conductivity ( ) has been
considered. It means that the longitudinal thermal conductivity ( ) has to be almost an order of magnitude lower in
order to respect the hypothesis about negligible side heat transfer across the material thickness (
15). The results are reported for the locations represented in Figure 10.
a. Contour plot of pressure inside the shock layer b. Pressure profiles at the wall

11
Figure 11. Chosen locations to plot the results from the MAT-Code
The results from the thermal analysis of both transpiration strategies are reported in Figure 12 to Figure 15.
Figure 12. Distribution of the coolant temperature across the material thickness
Figure 13. Distribution of the material temperature across the material thickness
a. Uniform transpiration b. Variable transpiration
a. Uniform transpiration b. Variable transpiration

12
Figure 14. Distribution of the coolant pressure across the material thickness
Figure 15. Pressure drop along the flat plate length
Figure 12 shows that, if the thermo-physical properties of the porous material ( ) are kept constant, it is
necessary to change the injection conditions of the coolant fluid at the cold wall in order to maintain a constant wall
temperature and the transpiration velocity of Figure 6. In general, if the wall temperature is maintained constant, both
the coolant and material temperatures have to increase along the flat plate length in order to compensate the decrease of
the heat flux. The temperature of the coolant fluid changes with the transpiration strategy based on its dependence on
the local mass flow rate issued from the porous wall. In fact, at P1; P2 and P3, the injection temperature for the variable
transpiration (Figure 12b) is lower with respect to the constant case (Figure 12a) due to the higher local coolant flow
rate in the range .
It is possible to verify the accuracy of the BC’s applied to the hot wall ( ; ) and to the cold wall
( ) from Figure 12-14. is the numerical tolerance used in the shooting technique to verify the
coolant temperature and matrix temperature are similar at the cold wall. The shooting technique is used to guess the
coolant temperature at the hot wall by obeying the relation ( ) at the cold wall. In this analysis has been imposed. It represents a good compromise between the computational time and the invariability of the
results. The pressure drop across the material’s thickness (Figure 15) is a fundamental parameter that has to be checked
after the thermal analysis of the material. The pressure difference is a critical parameter for both refractory porous
materials manufactured by a sintering process and laminated composite materials. In sintered materials a high pressure
difference can generate the cracking of the pores’ wall with the instantaneous propagation of the crack across the
material thickness. A different failure mechanism can be detected for those composite materials manufactured by
overlapping of composite laminates. In this case a high pressure gradient across the material thickness generates high
inter-laminar shear stress which can determine delamination of two or more layers of material. This problem is less
critical if winded composite materials are considered. A reference value for the maximum pressure drop, in the case of
thin wall structures, can be considered around 50psi. The pressure drop across the material is below the reference limit
for both transpiration strategies analyzed here (Figure 15) but the nominal values increase consistently if thicker
materials are considered (Figure 16). The injection conditions of the coolant (Figure 12) show that it is not feasible to
practically realize a TPS based on the input parameters considered in this analysis. This is due to the fact that the
temperatures below the heat shield are particularly high. In this scenario it is fundamental to perform quick integrated
a. Uniform transpiration b. Variable transpiration
a. Uniform transpiration b. Variable transpiration

13
analysis in order to define the best injection strategy and the way to modify the material geometry and thermo-physical
properties of the porous material. For example, if thicker materials are considered, a substantial decrease of the injection
temperature of the coolant can be obtained in the region where the heat load is higher (P1 in Figure 16). It is
fundamental to remember that the wall temperature is kept constant along the flat plate. With this assumption the
injection temperature has to increase in order to keep where the heat flux is lower. For this reason the
injection temperatures downstream of the leading edge are higher. The thermal analysis of the material highlights that
the beneficial effects of transpiration cooling are concentrated in the region where higher thermal loads are located. In
the case analyzed, for example, a better cooling strategy should consider to blow coolant fluid only in the region
and let that the wall reaches the equilibrium temperature downstream P2. In this way a considerably
saving of coolant fluid is obtained and it is not even necessary to inject the coolant at high temperature.
Figure 16. Integrated analysis performed for a thicker material (H=0.2’’)
B. 2-D Body with Blunt Leading Edge The simulations have been performed with GASP imposing the same input parameters used for the flat plate case
(Section IIIA). For the blunted body geometry the transpiration is activated at the stagnation point and the wall velocity
distributions of Figure 7 are implemented. The same input parameters used for the flat plate simulations are imposed.
-
-
-
- - Nitrogen flow
- ( at the end of the body )
-
The wall pressure and the heat-flux distributions obtained from the GASP simulations are reported below.
Figure 17. Results deriving from the GASP simulation of the blunted body
a. Coolant temperature distribution b. Pressure drop inside the material
a. Pressure at the wall b. Wall heat flux

14
Figure 17a shows that, contrary to the flat plate geometry, the wall pressure is not influenced by the transpiration.
For this case, the transpiration conditions chosen (i.e., injection velocity of the coolant fluid) do not seem to effect the
location of the shock and the flow field outside the boundary layer making no significant modification on the wall
pressure distribution. Figure 17b shows the decrease in the wall heat flux once the transpiration is activated. The
cooling effectiveness of the transpiration strategies can be compared analyzing the Stagnation Point region (SP). For
x=0; y=0 the uniform transpiration generates a decrease of 49% of the wall heat flux with respect to the no-transpiration
case. The variable transpiration with saw-tooth velocity distribution generates a decrease of 55.5% of the wall heat flux
at the same point. The advantages in using the variable transpiration are clear considering that the total amount of
coolant injected into the BL is the same for both transpiration strategies (Table 1).
Figure 18. Velocity contours around the 2-D blunted body (GASP simulations5)
Figure 19. Zoomed views of the velocity contours around the leading edge
Figure 18 shown the BL manipulation along the entire surface of the body when the variable transpiration is
adopted. Figure 19 represents the zoomed region where the wall heat flux drops by 80% with respect to the stagnation
point heat flux. When the transpiration is activated the BL thickness increases of few tenth of a millimeter. This is
enough to obtain almost the same heat flux’s reduction (55% at the SP) with respect to the flat plate case (50.8% at
x=0.1m). The output data returned by GASP (the wall heat flux, the wall velocity along the body’s surface and the
pressure inside the boundary layer) are used as initializing parameters for the solution of the material code. The
integrated analysis have been performed using 150 grid points across the material thickness and 136 points along the
leading edge surface (the same number of points used for the GASP simulations). The thermo-physical properties of the
porous material are imposed considering C/C based materials15. The input parameters for the base case are the same
used for the integrated analysis of the flat plate. The results are reported for the locations represented in Figure 20.
a. No-Transpiration (Vw=0m/s) b. Variable transpiration
(Saw-tooth wall velocity distribution)
a. No-Transpiration (Vw=0m/s) b. Variable transpiration
(Saw-tooth wall velocity distribution)

15
Figure 20. Chosen locations to plot the results from the MAT-Code
Figure 21. Distribution of the coolant temperature across the material thickness
Figure 22. Distribution of the material temperature across the material thickness
a. Uniform transpiration b. Variable transpiration
a. Uniform transpiration b. Variable transpiration

16
Figure 23. Distribution of the coolant pressure across the material thickness
Figure 24. Pressure drop along the blunted body surface
In Figure 21-23 it is possible to recognize the same features encountered for the flat plate integrated analysis. If the
wall temperature is kept constant, both the coolant and material temperatures have to increase along the flat plate length
in order to compensate for the decrease of the heat flux. At the stagnation point, the temperature of the coolant fluid at
the cold wall for the uniform transpiration is lower with respect to the variable transpiration (Figure 21). This happens
when the SP heat flux for the uniform transpiration is higher, therefore a lower injection temperature has to be
considered in order to maintain the . The injection conditions downstream the stagnation point, for both
strategies, is almost similar. The coolant pressure for the variable transpiration strategy is higher with respect to the
constant distribution (Figure 23) due to the higher injection velocity of the saw-tooth distribution at the stagnation
point: ; (Figure 7). The average pressure drop across the material
thickness is almost similar for both strategies (Figure 24). The pressure drop across the material thickness increases
rapidly in the curved surface of the blunted body and then becomes almost constant on the sidewall of the body. On the
curved surface, the pressure drop increases faster for the variable transpiration. This occurs due to the higher transversal
velocity at the same locations ( for ). The peaks of pressure drop at and (Figure 24b) are due to the rapid increase of the wall velocity. The same considerations made
for the flat plate analysis are valid here. In fact, downstream P1, it is not necessary to keep the wall temperature at
1500K, since, with respect to the SP heat flux, the local wall heat flux drops about 80% downstream (after
the corner region of Figure 20). Downstream P1 it is possible to let that the wall reaches the equilibrium temperature
that, in turn, allows saving a consistent amount of coolant. Furthermore, if the injection temperature of the coolant at the
cold wall is too high in the region between SP and P1, it is possible to increase the material thickness or decrease the
thermal conductivity of the porous material. In this scenario, the usage of reduced order models is extremely useful in
selectively studying the influence of the input parameters with the aim to define the cooling strategy.
IV. Parametric Analysis with respect to the material properties
In this section the parametric analysis with respect to the material thickness and to the thermo-physical properties of
the material is performed. Only the stagnation point on the blunted body is considered in this analysis because it is the
a. Uniform transpiration b. Variable transpiration
a. Uniform transpiration b. Variable transpiration

17
most critical region where higher thermal loads are encountered. The variable transpiration with saw-tooth distribution
is uniquely considered in this section due to its higher cooling effectiveness with respect to the uniform transpiration.
The base case analyzed in Section III is represented with black lines.
A. Parametric analysis with respect to the Porosity
Three different values of the porosity are considered in this analysis. The lower value ( ) is imposed taking
into account the average porosity of laminated carbon composites materials. The higher value of the porosity considered
here ( ) is based on sintered porous materials. Porosity values over (typical of carbon foams) are not
considered because of the low structural properties.
Figure 25. Injection strategies at the stagnation point for different values of the material porosity
The reduction in the porosity, with respect to the base case analyzed in Section III, has a small effect on the coolant
temperature at the cold wall while generating a consistent increase of the coolant’s temperature at the hot wall (Figure
25a). It is due to the fact that the smaller the porosity is the smaller the permeability is. In this scenario, the coolant
encounters more mechanical resistance while being issued and has more time to exchange heat with the hotter
surrounding matrix. The permeability coefficient, calculated by the Brennan-Kroliczek relation8,6
, for the three cases are
reported as:
→ High semi-pervious material
→ Semi-pervious material
→ Low semi-pervious material
Materials with lower porosity generate an increase of the coolant’s pressure inside the porous structure with the
consequent increase of the pressure drop necessary to guarantee the same conditions at the hot wall (Figure 25c). The
maximum pressure drop remains below the reference limit for carbon based materials ( 50psi as reference limit value
for thin wall structures) since the external pressure is low enough to favor the issuing of coolant. In the MAT-Code the
issuing pressure has to equalize the external pressure in order to prevent injection phenomenon at the exit of the pores.
The peaks of pressure drop at x=0.006m are due to the strong variation of the external pressure in the region that
connect the rounded nose with the straight sidewalls (expansion region). In this region the decrease of pressure on the
sidewalls is lower than the gradient of wall heat flux and, consequently, a local increase of the coolant’s injection
pressure is detectable. The local rise of injection pressure is more remarkable for lower values of the porosity (Figure
25).
B. Parametric analysis with respect to the thermal conductivity of the porous material
The range of the values considered has been selected based on data available on current porous materials for
aerospace applications15. The thermal conductivity, for the reasons reported in Section II is considered constant across
the material thickness. The transversal thermal conductivity is almost negligible.
c. Pressure drop across the
material thickness
material thickness
a. Coolant temperature distribution b. Coolant pressure distribution

18
Figure 26. Injection strategies at the stagnation point for different values of the material’s thermal conductivity
The thermal conductivity of the matrix has a high influence on the injection temperatures of the coolant (Figure 26
a). At the stagnation point, a difference of about 700K is detectable, passing from the base case (black line) to the
higher values of k because the convective heat transfer between the porous material and the coolant is directly related to
the thermal conductivity of the material itself 3. The coolant pressure, like the pressure drop, increases as the thermal
conductivity is increased (Figure 26) due to the fact that the higher coolant temperature generates higher values of the
coolant viscosity and, in turn, higher values of the coolant pressure. The pressure drop at the stagnation point (Figure
26) increases remarkably with the rise of the thermal conductivity. The pressure drop for the higher value of k (red line)
even decrease on the curved part of the blunted body. In this region, the effect of the temperature rising is bigger than
the effect of the external pressure decreasing (Figure 17a). On the body’s sidewalls the pressure drop does not change
remarkably with k giving that both external pressure and injection temperature remains constant along S.
C. Parametric analysis with respect to the material thickness
The purpose of the parametric analysis reported here is to highlight the influence of the material thickness on the
injection conditions at the stagnation point. The nominal values of the pressure gradient cannot be directly compared
with the results derived from the previous analysis because:
1. A higher value of the thermal conductivity, with respect to the base case of Section III, has been selected in order to
obtain the convergence of the code (k=80 W/mK).
2. The increase of the material thickness over 0.1 inches violates the hypothesis made in Section II about the use of the
Cartesian coordinates on curved shapes.
The MAT-Code does not converge for the insulating material considered in the base case (k=0.4W/mK). In view of
the fact that the reduced order model developed in Section II neglects the conduction into the coolant fluid. The
conduction in the coolant fluid is the only way to transport heat to the material’s cold wall, if thick insulating materials
are considered.
The cooling area considered for the aerodynamic simulations ( in Figure 5) is higher with respect to the surface of
the material’s cold wall ( in Figure 5). The area ratio of the curved surface cannot cross the limit that has imposed by
in order to respect the assumption about the use of the Cartesian coordinate system instead of the radial coordinate
system. The hypothesis H/RN 0.5 is no longer valid if the radius of curvature of the leading edge is kept constant and
the material thickness is increased over 0.1 inches. Furthermore, no comparisons can be made if the radius of curvature
is increased in order to keep valid the assumption reported above since the wall heat flux changes directly with the
variation of the external geometry.
a. Coolant temperature distribution b. Coolant pressure distribution c. Pressure drop across the
material thickness

19
Figure 27. Injection strategies at the stagnation point for different values of the material’s thickness
Figure 27 shows the decrease of the coolant injection temperature when the material thickness is increased. In fact,
for the same BC’s at the hot wall, thicker material allows for an extended heat exchange between matrix and coolant.
Differently from Section IV B, lower coolant temperatures generate higher injection pressure (Figure 27b) and, in turn,
higher pressure drop across the material thickness can be detected (Figure 27c). In vision of this, the material thickness
plays the biggest role in the definition of the pressure gradient. For thicker material the pressure drop is still below the
reference limit for carbon based material.
V. Conclusions
The integrated analysis of transpiration cooling is presented in this paper with the aim to highlight the strategic
importance of having a tool for the integrated design and analysis of reusable TPS based on transpiration cooling for
hypersonic cruise vehicles. The capability to investigate the influence of the geometric (e.g., material thickness) and
thermo-physical properties of the porous medium (porosity and thermal conductivity) open a promising scenario for the
practical realization of the transpiration wall velocity distribution simulated numerically. For example the sharp
reduction in the porosity and/or the material thickness can generate the desired characteristic peaks of the saw-tooth
distribution. In the current study, the simulations of the hypersonic flow field including the boundary layer have been
performed using GASP code and AERO-Code1,2,3
. A flat panel and a 2-D body with a blunt leading edge are analyzed
in order to investigate the cooling effectiveness of the transpiration technique for representative geometries. Two
different transpiration strategies are considered for the integrated analysis of both geometries. The nominal values of the
wall velocity distribution have been chosen in order to provide almost the same amount of total coolant mass flow rate
issued from the porous material.
The analysis of the boundary layer on the flat plate highlights the strong effect of the viscous interaction for high
Mach number. The big displacement thickness generates a maximum deviation of 35% on the heat flux prediction with
respect to the results obtained with the AERO-Code. This is due to the fact that AERO-Code cannot capture the non-
zero displacement thickness at the leading edge. So, AERO-Code predicts a thinner BL thickness that, in turn, generates
an higher wall heat flux. The viscous interaction increases the total amount of coolant flow rate by 28% for both
uniform and variable transpiration. It is due to the increase of pressure downstream the shock at the leading edge. The
simulations of the laminar boundary layer for the blunted body show that the heat flux drop by 80% passing from the
stagnation point to the sidewall of the body. It suggests applying the transpiration only in that region in order to reduce
the overall amount of coolant used. The use of the variable transpiration with saw-tooth wall velocity distribution
reduces the heat flux at the stagnation point by 55% and the wall heat flux on the flat plate by 56% at x=0.1m from the
leading edge. The variable transpiration for the blunted body is 5.8% more efficient, in terms of wall heat reduction at
the stagnation point, than the uniform transpiration. A lower cooling efficiency of the variable transpiration is detectable
for the flat plate geometry at x=0.1m (5%).
A 1-D model of the porous material has been developed in order to extract the injection conditions of the coolant
fluid at the cold wall of the material. In the thermal analysis of the flat plate, the other beneficial effect deriving from
the usage of variable transpiration is highlighted. In fact, the variable transpiration generates a slight lower pressure
drop across the material thickness. The small gain in the pressure drop becomes fundamental when higher external
pressure is considered3 (i.e. during the descendant phase of hypersonic cruise vehicles or inside a SCRJ engine). For
both geometries, the uniform and variable transpiration generate similar injection conditions at the cold wall of the
material. Another feature of the injection strategy can be evinced looking at the results for the points downstream the
leading edges of both geometries. The coolant’s injection temperature downstream the leading edge is high enough to
a. Coolant temperature distribution b. Coolant pressure distribution c. Pressure drop across the
material thickness
20
prevent any kind of practical realization. A better strategy should consider the localized cooling of the regions where the
wall heat flux is higher, allowing the other zones to reach the equilibrium temperature according to the maximum
operational temperature of the material. For the blunted body geometry the transpiration can be limited to the region
where the wall heat flux is greater than or equal to 20% of the stagnation point heat flux. This strategy maintains the
same cooling effectiveness, in terms of heat flux reduction, but allows the reduction of the total amount of coolant by
62% for the uniform transpiration and by 58% for the variable transpiration.
The parametric analyses show the bigger influence of the porosity on the coolant injection pressure and, in turn, on
the pressure drop across the material thickness. The smaller dependence of the coolant injection temperature from the
porosity can be balanced by the variation of the material’s thermal conductivity if high injection pressure and
temperature of the coolant are required.
The integrated analysis presented here opens a promising scenario for the investigation of reusable TPS for
hypersonic vehicles. Design tools that enable quick sensitivity analysis with respect to various control variables (i.e.
injection conditions/ hypersonic boundary layer modifications and tailoring of the thermo-physical properties of the
porous material) simplify the process for establishing the most effective cooling strategy, saving on costs of
experimental tests. For example if a lower pressure drop across the material thickness is required, the right combination
of porosity increase and thickness decrease has to be sought. In this scenario, the manipulation of the thermo-physical
properties of the porous materials is critical in order to provide customized materials, which meet the requirements
imposed by different cooling strategies.
References 1S. Gulli, L. Maddalena, and S. Hosder, “Investigation of Transpiration Cooling Effectiveness for Air-Breathing Hypersonic
Vehicles”, AIAA 2011-2253, 17th AIAA International Space Planes and Hypersonic Systems and Technologies Conference 11-14
April 2011, San Francisco, CA. 2S. Gulli, L.Maddalena, and S. Hosder, “Variable Transpiration Cooling: A New Solution for the Thermal Management of
Hypersonic Vehicles”, AIAA 2012-221, 50th
AIAA Aerospace and Science Meeting 09-12 January 2012, Nashville, TN. 3E., R. Van Driest, “Investigation of Laminar Boundary Layer in Compressible Fluid Using the Crocco Method”, (1952), NACA-
TN-2597. 4Joseph, A. Schetz, “Boundary Layer Analysis”, Prentice Hall (1993), pp. 127-132; pp.144-149. 5 GASP User Manual, AeroSoft, Inc., Blacksburg, Virginia, 1997. 6Harten, A., Engquist, B., Osher, S., and Chakravarthy, S., “Uniformly High Order Accurate Essentially Non-oscillatory
Schemes, III,” Journal of Computational Physics, Vol. 131, 1986, pp. 3–47. 7Anderson, John D., Jr., “Hypersonic and High Temperature Gas Dynamics”, Mc Graw Hill (1989), pp. 226-238. 8Aaltosalmi U., “ Fluid Flow in porous Media with the Lattice-Boltzmann Method”, Ph.D. Dissertation Report No. 3/2005,
University of Jyväskylä, Finland on July 29, 2005. 9Bucchi A. and Bruno C. and Congiunti A., “Transpiration Cooling Performance in LOX/Methane Liquid-Fuel Rocket Engines”,
Journal of Spacecraft and Rockets, Vol.42, No.3, May-June 2005. 10David, E. Glass, “Numerical Analysis of Convection/Transpiration Cooling”, (1999) NASA TM-1999-209828. 11Burmeister, “Convective Heat Transfer”, Wiley-Interscience (1983), pp. 325-328. 12Frank, M. White, “Viscous Fluid Flow”, Mc Graw Hill (1974), pp.589-590. 13John, H. Lienhard IV, John, H. Lienhard V, “A Heat Transfer Textbook”, Phlogiston Press (2006), pp. 299-304. 14Richard A. Thompson and Peter A. Gnoffo, “Implementation of Blowing Boundary Condition in the LAURA Code”AIAA
Paper 2008–1243. 46TH Aerospace Sciences Meeting & Exhibit. Reno, NV: 7–10 January 2008. 15Gallego N.G. and Klett W., “Carbon Foams For Thermal Management”, International Seminar on Advanced Applications for
Carbon Materials, Jeju Island, Korea, September 12-13 2002.