integrated evaluation of closed loop air revitalization ...€¦ · integrated evaluation of closed...
TRANSCRIPT

NASA/CR—2010–216451
Integrated Evaluation of Closed Loop Air Revitalization System ComponentsK. MurdockWolf Engineering, LLC, Somers, Connecticut
November 2010
National Aeronautics andSpace AdministrationIS20George C. Marshall Space Flight CenterMarshall Space Flight Center, Alabama35812
Prepared for Marshall Space Flight Center under Contract NNM10AB15P
https://ntrs.nasa.gov/search.jsp?R=20100042325 2020-05-01T02:54:00+00:00Z

The NASA STI Program…in Profile
Since its founding, NASA has been dedicated to the advancement of aeronautics and space science. The NASA Scientific and Technical Information (STI) Program Office plays a key part in helping NASA maintain this important role.
The NASA STI Program Office is operated by Langley Research Center, the lead center for NASA’s scientific and technical information. The NASA STI Program Office provides access to the NASA STI Database, the largest collection of aeronautical and space science STI in the world. The Program Office is also NASA’s institutional mechanism for disseminating the results of its research and development activities. These results are published by NASA in the NASA STI Report Series, which includes the following report types:
• TECHNICAL PUBLICATION. Reports of completed research or a major significant phase of research that present the results of NASA programs and include extensive data or theoretical analysis. Includes compilations of significant scientific and technical data and information deemed to be of continuing reference value. NASA’s counterpart of peer-reviewed formal professional papers but has less stringent limitations on manuscript length and extent of graphic presentations.
• TECHNICAL MEMORANDUM. Scientific and technical findings that are preliminary or of specialized interest, e.g., quick release reports, working papers, and bibliographies that contain minimal annotation. Does not contain extensive analysis.
• CONTRACTOR REPORT. Scientific and technical findings by NASA-sponsored contractors and grantees.
• CONFERENCE PUBLICATION. Collected papers from scientific and technical conferences, symposia, seminars, or other meetings sponsored or cosponsored by NASA.
• SPECIAL PUBLICATION. Scientific, technical, or historical information from NASA programs, projects, and mission, often concerned with subjects having substantial public interest.
• TECHNICAL TRANSLATION. English-language translations of foreign
scientific and technical material pertinent to NASA’s mission.
Specialized services that complement the STI Program Office’s diverse offerings include creating custom thesauri, building customized databases, organizing and publishing research results…even providing videos.
For more information about the NASA STI Program Office, see the following:
• Access the NASA STI program home page at <http://www.sti.nasa.gov>
• E-mail your question via the Internet to <[email protected]>
• Fax your question to the NASA STI Help Desk at 443 –757–5803
• Phone the NASA STI Help Desk at 443 –757–5802
• Write to: NASA STI Help Desk NASA Center for AeroSpace Information 7115 Standard Drive Hanover, MD 21076–1320

i
NASA/CR—2010–216451
Integrated Evaluation of Closed Loop Air Revitalization System ComponentsK. MurdockWolf Engineering, LLC, Somers, Connecticut
November 2010
National Aeronautics andSpace Administration
Marshall Space Flight Center • MSFC, Alabama 35812
Prepared for Marshall Space Flight Center under Contract NNM10AB15P

ii
Available from:
NASA Center for AeroSpace Information7115 Standard Drive
Hanover, MD 21076 –1320443 –757– 5802
This report is also available in electronic form at<https://www2.sti.nasa.gov>
Acknowledgement
The work documented in this Contractor Report (CR) was performed over the period of 2004 through 2006 as a joint effort between NASA Marshall Space Flight Center (MSFC), Johnson Space Center (JSC), and Ames
Research Center (ARC); Hamilton Sundstrand; and Southwest Research Institute. JSC provided the initial funding for the preparation of a test report. MSFC provided funding for the completion and publication of this CR.
The author would like to thank all NASA civil servants and contractors for their support in completing this sizable project, especially Bernadette Luna, ARC; James Knox, Jay Perry, and Monserrate Roman, MSFC; Fred Smith, JSC;
Lee Miller, ECLS Technologies; and Melissa Campbell, Hamilton Sundstrand.

iii
TABLE OF CONTENTS
1. INTRODUCTION ............................................................................................................... 1
1.1 What Did We do ............................................................................................................. 2 1.2 Why Did We do It ........................................................................................................... 2 1.3 What Did We Learn ........................................................................................................ 2 1.4 What do We Want to do Next ......................................................................................... 3
2. INTEGRATED TEST CONFIGURATION ....................................................................... 4
2.1 Description of Equipment—Subsystems and Support Hardware ................................... 5 2.1.1 4-Bed Molecular Sieve (4BMS) Carbon Dioxide Removal Assembly (CDRA) ...... 6 2.1.2 Mechanical Compressor Engineering Development Unit and Accumulator .......... 9 2.1.3 Temperature Swing Adsorption Compressor (TSAC) ............................................ 11 2.1.4 Sabatier Carbon Dioxide Reduction Subassembly ................................................. 19 2.1.5 Support Hardware Configuration .......................................................................... 23 2.2 Integrated Test Using the Mechanical Compressor ......................................................... 32 2.2.1 Overall Test Plan Objectives .................................................................................. 32 2.2.2 Description of Test Plan Details ............................................................................ 35 2.2.3 Discussion of Test Results ..................................................................................... 43 2.2.4 Conclusions From This Test Section ...................................................................... 55 2.3 Integration Test Using the TSA Compressor .................................................................. 55 2.3.1 Description of Tests ............................................................................................... 55 2.3.2 Discussion of Test Results—Integration Test With TSAC ..................................... 63 2.3.3 Conclusions From This Test Section ...................................................................... 71
3 CONCLUSIONS .................................................................................................................. 73
3.1 Overall Conclusions From the Integration Test Experience ............................................ 73 3.2 Summary of Observation From the Integration Test ...................................................... 73 3.3 Lessons Learned ............................................................................................................. 76 3.3.1 Lessons Learned From the Integration Testing ...................................................... 76 3.3.2 Lessons Learned fFom the Sabatier Flight Program .............................................. 78 3.4 Recommendations for Subsystem Modification if Designing a New System ................... 79
4 RECOMMENDATIONS ..................................................................................................... 82
4.1 Recommended Future Testing ........................................................................................ 82 4.1.1 Recommended Test Objective ................................................................................ 82 4.1.2 Specific Recommended Tests .................................................................................
iv
TABLE OF CONTENTS (Continued)
4.2 Recommended Future Hardware Development .............................................................. 83 4.2.1 Subsystem Development ........................................................................................ 83 4.2.2 Component Development ............................................................................................... 84 4.2.3 Controls Development ........................................................................................... 84
5. APPENDICES ...................................................................................................................... 86 REFERENCES ......................................................................................................................... 190

v
LIST OF FIGURES
1. Closed Loop Air Revitalization System .................................................................... 1
2. Overall block diagram of the Air Revitalization System (ARS) sub-systems. ........... 4
3. 4-Bed Molecular Sieve Schematic ............................................................................. 7
4. Work cycle of the TSAC ........................................................................................... 11
5. Flow diagram of the air-cooled TSAC ...................................................................... 12
6. TSAC and 4BMS beds temperature and pressure profiles ......................................... 13
7. Flow diagram of a three-bed TSAC device.. Internal pressure is controlled through a feedback loop to the heater. Inert gas vent tubes are not shown ............... 14
8. Adsorption isotherms and compression cycle ........................................................... 15
9. Heating and cooling assemblies of the TSAC ........................................................... 17
10. Schematic of 2-bed, liquid-cooled TSAC .................................................................. 17
11. Schematic of the air-cooled TSAC prototype ........................................................... 18
12. Air-cooled TSAC prototype ..................................................................................... 18
13. Sabatier Engineering Development Unit Schematic .................................................. 20
14. Original Sabatier EDU Hardware Configuration ...................................................... 22
15. Nodal representation of ISS for CO2 concentration prediction ................................ 25
16. Example metabolic load profile ................................................................................ 26
17. Example of Metabolic Load Profile CO2 Injection Rate .......................................... 26
18. CO2 Concentration for Simulated Lunar EVA Profile .............................................. 27
19. Integration of ARS Components ............................................................................. 29

vi
LIST OF FIGURES (Continued)
20. High CO2 rate requires excessive activation of vent valve ......................................... 30
21. Test setup of CDRA product CO2 moisture measurement using TILDAS ............... 32
22. CO2 inlet concentration fed to 4BMS for metabolic load profile case ....................... 34
23. Simplified Schematic of CDRA and CRA as intended to be integrated on ISS ........ 36
24. Integrated Test Schematic – 4BMS, Mechanical Compressor, Accumulator, Sabatier .............................................................................................. 37
25. Hardware configuration for 4BMS and compressor only tests. ................................. 40
26. Typical Performance Data for Mechanical Compressor Integration Tests ................ 51
27. Simplified Schematic of 4BMS and TSAC Integration Test ...................................... 56
28. Integrated Test Schematic – 4BMS, TSAC, Sabatier ................................................. 57
29. Lunar EVA Mission Scenario Cabin ppCO2 ............................................................ 63
30. Graphical presentation of integration effects on 4BMS efficiency ............................ 64
31. Typical TSAC Performance Data ............................................................................. 66
32. TSAC equilibrium loading pressure is dependent on CO2 feed to CDRA ................ 68
33. Results of simulated Lunar night .............................................................................. 70
34. Simulated Lunar EVA Excursion profile results in long periods of Sabatier starvation ............................................................................................... 71

vii
LIST OF TABLES
1. Compressor Operating Rules .................................................................................... 9
2. TSAC and 4BMS Synchronization Table .................................................................. 12
3. Production rates and resource requirements of TSAC sized for two kilograms CO2 production per day at 100 kPa .......................................................................... 16
4. Test conditions for mechanical compressor test ........................................................ 23
5. Test conditions for the TSAC test ............................................................................. 24
6. Standoff Valve Operating Rules ................................................................................ 30
7. Fluid Composition Analysis ..................................................................................... 31
8. Integrated Test Matrix Input Parameters, Mechanical Compressor Test ................... 42
9. Integration Test Metrics ............................................................................................ 43
10. Mechanical Compressor CO2 Capture Performance Data ........................................ 49
11. Sabatier Water Production Rate Efficiencies ............................................................. 54
12. Integrated Test Matrix—TSAC Test ......................................................................... 60
13. Operating parameters for 4BMS/TSAC comparison tests ......................................... 63
14. TSAC Performance Target and Actual Results ......................................................... 64
15. Test results for 4BMS/TSAC/Sabatier integrated testing ........................................... 67
16. Sabatier Efficiency Data when Integrated with TSAC ............................................... 69

viii

1 Introduction
NASA’s vision and mission statement include an emphasis on human exploration of space, which requires environmental control and life support technologies. As the target destination becomes more distant and the target mission duration longer, closed loop life support systems become increasingly necessary for feasibility and success.
Figure 1 – Closed Loop Air Revitalization System
An air revitalization system (ARS) includes temperature and humidity control, oxygen and nitrogen supply and control, carbon dioxide and trace contaminant removal and carbon dioxide reduction for oxygen recovery. These processes also interact with the water recovery system. Crew oxygen is produced by the electrolysis of water. The hydrogen by-product of electrolysis is utilized by the carbon dioxide reduction assembly along with the waste carbon dioxide to re-form water. This last step, carbon dioxide reduction, is a necessary step for loop closure that minimizes the resupply needed for crew support.
This paper describes the development of components for a closed loop ARS, modeling and simulation of the components and integrated hardware testing, with the goal of better understanding the capabilities and limitations of this closed loop system. The integrated testing included a carbon dioxide removal assembly (CDRA), carbon dioxide reduction assembly (CRA), and two different compressor technologies that provided the necessary link between the CDRA and CRA.
Contractor Report
Integrated Evaluation of Closed Loop Air Revitalization System Components
1.1 What did we do
The overall test objective was to integrate the carbon dioxide removal assembly with the carbon dioxide reduction assembly. Two distinct compressor technologies were developed to provide the function of collecting and storing CO2 from the CDRA before it is consumed by the CRA. The systems were tested over a range of conditions that represented both ISS and Lunar surface activities. The test program was conducted from November 2004 through March 2006 in the Laboratory Module Simulator facility at the NASA Marshall Space Flight Center (building 4755).
1.2 Why did we do it
The purpose of the integrated testing was to operate the two configurations of ARS components to determine any limitations or requirements imposed on each component by the interfacing components. Each of the hardware assemblies (CDRA, mechanical compressor, Temperature Swing Adsorption Compressor (TSAC), and Sabatier Reactor Subassembly (SRS)) has been tested independently, and computer simulations have been run of the integrated system. Testing was required to evaluate the performance of the 4-bed molecular sieve (4BMS, another name for CDRA), compressor and Sabatier performance when integrated together and to verify the results from the engineering analysis. Specifically, the testing was intended to:
Provide understanding of transients and integration issues; Validate baseline operation/control logic for the compressors; Validate FORTRAN integrated model of the 4BMS, compressors and Sabatier;
and Validate the mechanical compressor and TSAC computer models.
1.3 What did we learn
The testing described herein was the first integrated test of a Four-Bed Molecular Sieve and Sabatier Carbon Dioxide Reduction Assembly with the interfacing CO2 compressor. Two compressor technologies were tested, a mechanical oil-free piston compressor and a temperature swing adsorption compressor (TSAC). The mechanical compressor was tested under simulated International Space Station parameters. The TSAC was tested under both ISS and Lunar Base parameters. Both sets of tests provided enhanced understanding of nominal steady operation and dynamic, transient scenarios that can be expected to occur in an integrated Environmental Control and Life Support System. In general, the 4BMS, Sabatier and both compressor technologies were proved compatible and able to perform their intended functions for a wide range of input conditions. It is feasible, using these technologies to recover oxygen in the form of water, to make the next step toward oxygen loop closure. These technologies are ready to be advanced to the next Technology Readiness Level (TRL) level and put in service in a flight mission.
2

1.4 What do we want to do next
This test program showed not only that water recovery is feasible using CO2 reduction, but it also identified areas where each of the technologies could be improved. These improvements include upgrades to hardware components, changes to control logic and the implementation of artificial intelligence or smart controls. Additional testing should be performed with these systems to better define the proposed modifications to arrive at the best possible solution.
3

2 Integrated Test Configuration
Integrated testing of carbon dioxide removal and reduction assemblies was performed at MSFC over the period from 2004 through 2006. This testing was performed to understand the interactions between the different subassemblies in order to plan for future phases of subsystem development. This section details the hardware used in the integration testing, test configurations and operating parameters, and test results. Figure 1 below depicts three main elements of an Air Revitalization System (ARS). These systems and their interactions were the focus of this test program. The three systems shown below are the carbon dioxide removal assembly (CDRA), the oxygen generation assembly (OGA) and the carbon dioxide reduction assembly (CRA). The CDRA collects and concentrates carbon dioxide and feeds it to the CRA. The OGA electrolyzes water for crew oxygen and feeds the by-product hydrogen to the CRA. The CRA reacts hydrogen and carbon dioxide to form methane and water. The water is returned to the OGA, thus partially closing the oxygen loop. The OGA/CRA interaction has been separately studied by Hamilton Sundstrand, the supplier of the ISS OGA, and is not reflected in this report. This report focuses on the interaction of the CDRA with the CRA.
Oxygen Generation System (OGS) Rack Air Revitalization (AR)Rack
Oxygen Generation Assembly (OGA) Carbon Dioxide Reduction
Assembly (CRA)
Carbon Dioxide Removal Assembly (CDRA)
Carbon Dioxide ManagementSubassembly (CMS)
Sabatier Reactor
Subassembly (SRS)
Waste Water Bus Overboard Vent
H2 CO2
H2O CH4
Oxygen Generation System (OGS) Rack Air Revitalization (AR)Rack
Oxygen Generation Assembly (OGA) Carbon Dioxide Reduction
Assembly (CRA)
Carbon Dioxide Removal Assembly (CDRA)
Carbon Dioxide ManagementSubassembly (CMS)
Sabatier Reactor
Subassembly (SRS)
Waste Water Bus Overboard Vent
H2 CO2
H2O CH4
Figure 2 – Overall block diagram of the Air Revitalization System (ARS) sub-systems.
The CRA is further separated into two sub-assemblies, the Sabatier Reactor Subassembly (SRS) and the Carbon dioxide Management Subassembly (CMS). The CMS includes the compressor and accumulator. The focus of this test program, therefore, is the insertion of different compressor technologies into the CMS role supporting the requirements of the CDRA and Sabatier in their respective roles in the overall Air Revitalization System.
4

The 4BMS, Sabatier and compressors have each been independently tested over a range of operating conditions. These isolated tests are not covered in this test report, but are discussed in references [ ], with the focus of this study being to understand the subsystem interactions. The previous liquid and water-cooled versions of the TSAC were also tested in conjunction with the 4BMS. These tests are not reported here but are detailed in references [ ]. The sequence of test configurations presented here were planned to develop a working ARS originally for use on the International Space Station, and later as a potential solution for lunar missions. The test configurations are described below as they were conducted chronologically:
1. 4BMS with mechanical compressor and accumulator – (November, December 2004)
2. 4BMS, mechanical compressor, accumulator and Sabatier – (February, March 2005)
3. 4BMS with air-cooled TSAC – (November 2005) 4. 4BMS, air-cooled TSAC and Sabatier – (January 2006)
Referring back to Figure 1 of the Air Revitalization System, the Carbon Dioxide Reduction Assembly (CRA) consists of both the Carbon Dioxide Management Subassembly (CMS) and the Sabatier Reactor Subassembly (SRS). In these tests we evaluated two hardware configurations for the CMS. The mechanical compressor requires a separate accumulator; the TSAC serves as both compressor and accumulator. Regardless of which compressor technology was installed as CMS, the CMS would operate when required based on CO2 availability from the 4BMS, regardless of the operating state of the SRS. Since the compressor and 4BMS are so closely linked, each compressor was initially tested with the 4BMS prior to addition of the Sabatier.
2.1 Description of Equipment – Subsystems and Support
Hardware
This section describes each of the subsystems used in the integration testing. The summary includes the 4-bed molecular sieve (4BMS) carbon dioxide removal assembly (CDRA), the Sabatier reactor subassembly (SRS), the mechanical compressor and accumulator (the 1st evaluated compressor), and the temperature swing adsorption compressor (the 2nd evaluated compressor).
5
2.1.1 4-Bed Molecular Sieve (4BMS) Carbon Dioxide Removal
Assembly (CDRA)
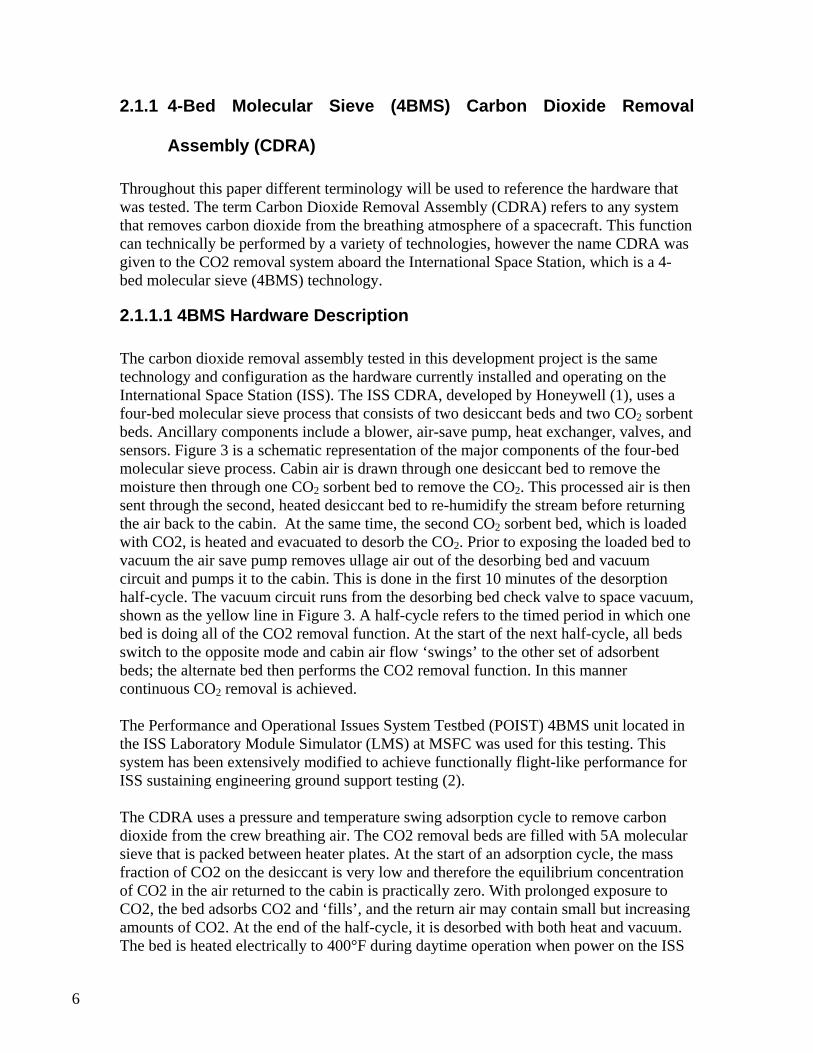
Throughout this paper different terminology will be used to reference the hardware that was tested. The term Carbon Dioxide Removal Assembly (CDRA) refers to any system that removes carbon dioxide from the breathing atmosphere of a spacecraft. This function can technically be performed by a variety of technologies, however the name CDRA was given to the CO2 removal system aboard the International Space Station, which is a 4-bed molecular sieve (4BMS) technology.
2.1.1.1 4BMS Hardware Description
The carbon dioxide removal assembly tested in this development project is the same technology and configuration as the hardware currently installed and operating on the International Space Station (ISS). The ISS CDRA, developed by Honeywell (1), uses a four-bed molecular sieve process that consists of two desiccant beds and two CO2 sorbent beds. Ancillary components include a blower, air-save pump, heat exchanger, valves, and sensors. Figure 3 is a schematic representation of the major components of the four-bed molecular sieve process. Cabin air is drawn through one desiccant bed to remove the moisture then through one CO2 sorbent bed to remove the CO2. This processed air is then sent through the second, heated desiccant bed to re-humidify the stream before returning the air back to the cabin. At the same time, the second CO2 sorbent bed, which is loaded with CO2, is heated and evacuated to desorb the CO2. Prior to exposing the loaded bed to vacuum the air save pump removes ullage air out of the desorbing bed and vacuum circuit and pumps it to the cabin. This is done in the first 10 minutes of the desorption half-cycle. The vacuum circuit runs from the desorbing bed check valve to space vacuum, shown as the yellow line in Figure 3. A half-cycle refers to the timed period in which one bed is doing all of the CO2 removal function. At the start of the next half-cycle, all beds switch to the opposite mode and cabin air flow ‘swings’ to the other set of adsorbent beds; the alternate bed then performs the CO2 removal function. In this manner continuous CO2 removal is achieved. The Performance and Operational Issues System Testbed (POIST) 4BMS unit located in the ISS Laboratory Module Simulator (LMS) at MSFC was used for this testing. This system has been extensively modified to achieve functionally flight-like performance for ISS sustaining engineering ground support testing (2). The CDRA uses a pressure and temperature swing adsorption cycle to remove carbon dioxide from the crew breathing air. The CO2 removal beds are filled with 5A molecular sieve that is packed between heater plates. At the start of an adsorption cycle, the mass fraction of CO2 on the desiccant is very low and therefore the equilibrium concentration of CO2 in the air returned to the cabin is practically zero. With prolonged exposure to CO2, the bed adsorbs CO2 and ‘fills’, and the return air may contain small but increasing amounts of CO2. At the end of the half-cycle, it is desorbed with both heat and vacuum. The bed is heated electrically to 400°F during daytime operation when power on the ISS
6

is plentiful, but during nighttime operation, the heaters are turned off. The length of the ISS orbit is approximately 90 minutes with the “day” portion running from 90 minutes maximum to 53 minutes minimum, depending on the inclination of the orbit. For all day/night cyclic testing, the worst case 53 minute day was used. The 5A molecular sieve material has a high affinity for water vapor, which preferentially adsorbs and displaces CO2. Because of this phenomenon, the two desiccant beds are included in the 4-bed design. One desiccant bed removes water prior to the air stream entering the 5A bed, while the other bed, previously loaded, replenishes the water to prevent over-drying of the cabin air.
AIR SAVEPUMP
OPEN LOOPVENT
VALVE
SELECTORVALVES
TOSPACE
VACUUM
CO2 SORBENT BED (2)(ADSORBING)
ELECTRICALHEATERS
CO2 SORBENT BED (4)(DESORBING) ELECTRICAL
HEATERS
AIR BLOWER
DESICCANT BED (3)(DESORBING)
DESICCANT BED (1)(ADSORBING)
AIRINLET
AIRRETURN
CHECKVALVE
ITCSINLET
SELECTORVALVES
SG 13X 5A
ABSOLUTEPRESSURE
SENSOR
SG 13X 5A
PRECOOLER
1
2
12
1
2 1
2 1
2 2
1
Air wit hout CO2, H2OAir wit h CO2, H2OAir wit h CO2 (no wat er) Air wit h H2O (no CO2)
CO2
13X
13X
Figure 3 - 4-Bed Molecular Sieve Schematic
2.1.1.2 4BMS Integration Characteristics
One of the peculiarities of the 4BMS CDRA is that it is designed to operate on a 144 minute half cycle (10 cycles per 24-hour day). This becomes an issue only when integrating CDRA with other systems designed to operate in synch with the 90 minute diurnal orbit of the International Space Station. The 4BMS operates on the physics of adsorption isotherms of 5A molecular sieve. As such, the temperature and pressure achieved during the desorption period affects the capacity for air scrubbing on the following cycle. This becomes an important factor when integrating with a downstream system that affects the desorption pressure and when nighttime power saving protocols limit the temperature the bed reaches. The two molecular sieve beds must have sufficient capacity such that the high efficiency periods can carry it through the times when the pressure and temperature are not so favorable for good desorption. The 5A molecular sieve material also has adsorptive capacity for chemicals other than CO2 and water. Some trace contaminants in the cabin atmosphere will be adsorbed on the zeolite and desorbed along with the carbon dioxide. Some of these chemicals have been
7

shown to affect the operation of downstream systems, specifically the Sabatier reactor. A summary of contaminant testing that was performed on the Sabatier catalyst is detailed in J.D. Tatara and J.L. Perry; International Space Station Trace Contaminant Injection Test, Revision A, NASA Test Requirements Document, January 1997.
8

2.1.2 Mechanical Compressor Engineering Development Unit and
Accumulator
2.1.2.1 Mechanical Compressor Hardware Description
A compressor is needed to provide a vacuum for 4BMS desorption as well as compression of CO2 for efficient storage and controlled delivery to the Sabatier. The first compressor design tested was a mechanical two-stage, reciprocating piston compressor design with three in-line cylinders, which was developed by Southwest Research Institute. There are two first stage pistons and one second stage piston. The compressor is an oil-free design so that no oil contamination is introduced to the downstream Sabatier reactor. A 2-micron filter on the inlet suction line traps any dust particles generated by the 4BMS beds. The compressor is cooled with 65°F chilled water representative of the medium temperature loop (MTL) on ISS. At median pressures of 4 psia suction and 70 psia discharge, the compressor delivers approximately 17.7 scfh (1.9 lb/hr) of CO2. To reduce compressor run time, the operating rules in Table 1 were established and programmed into the integrated control system. PACCUM is the compressor discharge or accumulator pressure while PSUCTION is the compressor suction or 4BMS desorbing bed pressure. These rules set the pressure limits for compressor activation and deactivation. For example, when the accumulator is almost full, at 110 psia, the compressor will not activate until the bed pressure exceeds 7.5 psia. These operating rules were developed with the goal of minimizing the compressor operating time, minimizing compressor power consumption and preventing starvation of the Sabatier. Starvation is defined as any time when hydrogen is produced by the OGA, but no CO2 is available for reaction. The performance goals are achieved by limiting the compressor operation to periods when CO2 is plentiful or the pressure rise is low. These operating rules were established during the model development period (described later) and were verified during this test activity. The compressor rules successfully minimize Sabatier starvation.
Table 1 – Compressor Operating Rules
Transition Conditions Compressor Transition PACCUM (psia) PSUCTION (psia)
>=100 AND <120 AND > 7.5 Standby to >25 AND <100 AND > PACCUM/58 + 3.6 Operate <=25 AND > 1.0
> 40 AND < PACCUM/58 + 1.5 Operate to <= 40 AND < 0.5 Standby >130 NA
9

2.1.2.2 Accumulator
Due to the chromatographic nature of CO2 desorption from molecular sieves resulting in short duration ‘waves’ of CO2 flow, and the Sabatier requirement for constant inlet CO2 flow, a buffering capacity is needed to integrate a 4BMS and a Sabatier when using a mechanical compressor. This is accomplished with a 0.73 ft3 accumulator. Due to space limitations within the OGA rack where the CRA hardware would be located on orbit, the total accumulator volume is achieved by ganging several small vessels together. The accumulators used for this test matched those being installed in the OGS rack.
2.1.2.3 Mechanical Compressor / Accumulator Integration
Characteristics
Since the mechanical compressor has no storage capacity, an accumulator is required to buffer the short duration, high rate production of CO2 from the CDRA into the long duration, low flow rate consumption of the Sabatier. The initial sizing of the accumulator was to be one cubic foot. This resulted in an ultimate pressure of 90 psia needed to store adequate CO2 to prevent starvation. This pressure level is under the 100 psia threshold that requires additional analysis on pressure vessels. Due to the space limitations in the OGS rack, the maximum volume accumulator that could be packaged was 0.73 ft3. This results in a need for 120 psia storage pressure to prevent starvation. The CDRA desorbs carbon dioxide from the molecular sieve first, followed by a wave of water. Water vapor in the mechanical compressor could pose problems if condensation occurs in either the compressor or the accumulator tank. A series of tests were conducted to analyze the desorption flow from the CDRA for the concentration of water in the carbon dioxide. The details of this test series are given in section 2.2.2.5. The results indicated that there is not enough water vapor desorbed by the CDRA during the normal desorption cycle to cause condensation in the compressor at pressures up to 120 psia.
10

2.1.3 Temperature Swing Adsorption Compressor (TSAC)
2.1.3.1 TSAC Hardware Description
The TSAC is a solid-state device that compresses CO2 using a temperature swing adsorption process on a CO2 selective molecular sieve. The TSAC combines the functions of a compressor and accumulator in one device.
2.1.3.1.1 Operating principle
Fundamental operating principles and designs of adsorption compressors have been applied in adsorption refrigeration cycles and heat pumps. Similar to the heat pumps, the TSAC operates based on thermal-swing adsorption compression.
Figure 4. Work cycle of the TSAC The typical work cycle of the TSAC is shown in Figure 4. The cycle includes four steps. [Ref. 1] STEP1: Adsorption of the gas (or gas component from a gas mixture) of interest at a low pressure and temperature. Adsorption is an exothermic process. Heat of adsorption is removed during this step by cooling the sorbent bed. STEP 2: Compression of the adsorbed gas by heating the sorbent. The bed volume is isolated during this step. The set point pressure of the process determines the temperature limit. The loading of the gas on the sorbent is reduced during heating, raising the pressure in the bed. STEP 3: Release of the compressed gas at the desired flow rate and pressure as required by the processor downstream. Heat must be applied to maintain production as the sorbent is depleted of the adsorbed gas. STEP 4: Decompression of the gas is achieved by cooling the sorbent. The bed volume is again isolated during this step. Temperature is reduced and gas pressure declines to the initial point in the work cycle.
2.1.3.1.2 Process Description
11

The process flow diagram for the air-cooled TSAC is shown in Figure 5. To obtain continuous operation, two identical adsorption chambers (beds) are used.
Figure 5 - Flow diagram of the air-cooled TSAC
The basic function of the TSAC is to remove the carbon dioxide from the CDRA at a pressure varying roughly from vacuum to 12 psia and deliver the gas to the Sabatier reactor at 21 psia. The carbon dioxide removal assembly (CDRA) includes two CO2 adsorption beds for removing the carbon dioxide vapor from the cabin air. Like the TSAC, these beds function cyclically to switch between their adsorption and desorption processes to ensure a continuous operation. The TSAC must be synchronized with the CDRA‘s operation cycle to maintain complete regeneration of the CDRA beds and to supply compressed CO2 to the Sabatier reactor. The synchronization schedule for the 4BMS and the TSAC is shown in Table 2.
Table 2 – TSAC and 4BMS Synchronization Table
Half Cycle 1 Half Cycle 2
Time (min) 0 10 134 144 154 278 288 Desorb to TSAC A
Desorb to space
4BMS Bed A Adsorb CO2 from Cabin Air Air-Save
TSAC Bed A
Produce CO2 Cool Adsorb Compress
Desorb to TSAC
B Air
Save Desorb to
space 4BMS Bed B
Adsorb CO2 from Cabin Air TSAC Bed B
Cool Adsorb Compress Produce CO2
12

Step 1 Step 2 Step 3Step 4
Half Cycle 1 Half Cycle 2
Step 1 Step 2 Step 3Step 4
Half Cycle 1 Half Cycle 2
Figure 6 – TSAC and 4BMS beds temperature and pressure profiles.
The correspondence for TSAC Bed 2 between Figure 6 and Figure 4 is as follows: Step 4, cooling/decompression in preparation for the CO2 intake, occurs from 0 to 10 minutes. Step 1 where the TSAC adsorbs CO2 from the 4BMS occurs from 20 to 134 minutes. Step 2, compression in preparation for the production step runs from 134 minutes to 144 minutes. Finally, Step 3, the production step, runs from 144 minutes to 288 minutes. Referring to the 4BMS desorbing bed in Figure 6, the segments are as follows: From 0 to 10 minutes is segment 1, when the desorbing bed is being evacuated to cabin via the air save pump and the primary heater is energized. Segment 2 is from 10 to 134 minutes; here primary and secondary heaters are energized. The bed is isolated for the first ten minutes of segment 2 to allow cooling of the TSAC bed. For the remainder of the segment, it is desorbing to the TSAC. Finally, during segment 3, the bed communicates with space vacuum for more complete desorption at low pressure.
2.1.3.1.3 TSAC Development History
13

Development of the TSA CO2 compressor at NASA ARC was originally started under the Mars In-Situ Resource Utilization (ISRU) program. An Engineering prototype of a CO2 compressor was developed and tested at NASA ARC under the payload proposal PROMISE, which was intended to fly in the 2005 Mars Surveyor Lander. The CO2 compressor prototype was designed to extract and separate atmospheric gases from the Mars environment to produce buffer gases and pure, compressed CO2 for rocket propellant production. The CO2 compressor operates based on the TSA technology to separate, compress and produce CO2 at a specified rate. The concept of a CO2 compressor for closing the air loop of an ECLS system was spun-off from the Mars CO2 compressor design. Three different TSAC compressors were sequentially developed during this program with process and equipment improvements implemented in each successive build.
2.1.3.1.4 Water Cooled TSAC
The first compressor developed utilized water as the cooling medium. This compressor was designed with a concept of using three sorbent beds to cyclically adsorb and desorb, thus providing a constant sink for the 4BMS to exhaust to, and also a constant source of CO2 for the Sabatier. These beds were synchronized to the 90 minute Sabatier cycle. A single prototype bed of this configuration was fabricated and tested at NASA Ames Research Center in August 2000. The operation of each bed is scheduled such that when one bed is available for adsorption of CO2 from CDRA, another is ready to produce CO2 for the CRA, and the third bed is in a standby or a cooling mode. A flow diagram for the proposed three bed processor is shown in Figure 7. The complete cycle of this TSAC is 270 minutes, with each desorption cycle taking 90 minutes. Each TSAC bed is designed to accommodate the full load of CO2 required by the CRA, which in this example is one-half the CO2 available from the CDRA.
CDRA CRA
space vacuum
PT
Figure 7 - Flow diagram of a three-bed TSAC device. Internal pressure is controlled through a feedback
loop to the heater. Inert gas vent tubes are not shown.
14

The baseline design for the TSAC uses a zeolite adsorbent and a working cycle that is shown in Figure 8. The intake cycle begins at a pressure of about 2.7 kPa (0.4 psi) and ends at 27 kPa (3.9 psi). The spacecraft coolant loop is used to maintain the temperature near 30°C during this step. During pressurization, the coolant flow is shut off and the sorbent is heated to approximately 60°C; production occurs at a pressure of 100 kPa (14.5 psi) and temperatures rising to about 90°C. For depressurization, the coolant is again allowed to flow through the device to bring the temperature back to about 30°C.
18
16
14
12
10
8
6
4
2
0
CO
2 lo
adin
g [w
t%]
10008006004002000
pressure [torr]
25°C
50°C
75°C
100°C
175°C
Figure 8 - Adsorption isotherms and compression cycle.
This cycle provides a working capacity of about 4.6 wt%. From it, a three-bed TSAC was sized to meet CDRA and CRA interface requirements for vacuum, CO2 pressure, and buffering capacity. A summary of the TSAC requirements is shown in Table 3.
15

Table 3 - Production rates and resource requirements of TSAC sized for two kilograms CO2 production per
day at 100 kPa.
Resource Requirement
Production level 2 kg CO2 / day
Production pressure 100 kPa Total mass 22.5 kg Average power 150 W Peak power 300 W Average heat rejection
150 W
Total volume 25 L
2.1.3.1.5 Liquid Cooled TSAC
The next development in the TSAC design was a change of the cooling medium from water to a heat transfer fluid known as Paratherm. This heat transfer fluid allowed the bed operating temperature to increase thus increasing the working capacity. This comes at the expense of added equipment to handle the heat transfer fluid, namely a pump, heat exchanger and reservoir. The operating schedule was also modified to reduce the number of beds to two. Rather than synchronizing with the Sabatier, the beds were synchronized with the 4BMS beds. One TSAC bed was sized to absorb the entire capacity of one 4BMS bed. The two-bed, liquid-cooled, TSAC consists of two identical sorption beds equipped with a heater in the middle and cooling coils brazed on the outer surface of the canister. The compressor canisters also contain multiple temperature sensors and pressure sensors. Pictures of the compressor canister with heating and cooling assemblies are shown in Figure 9.
16
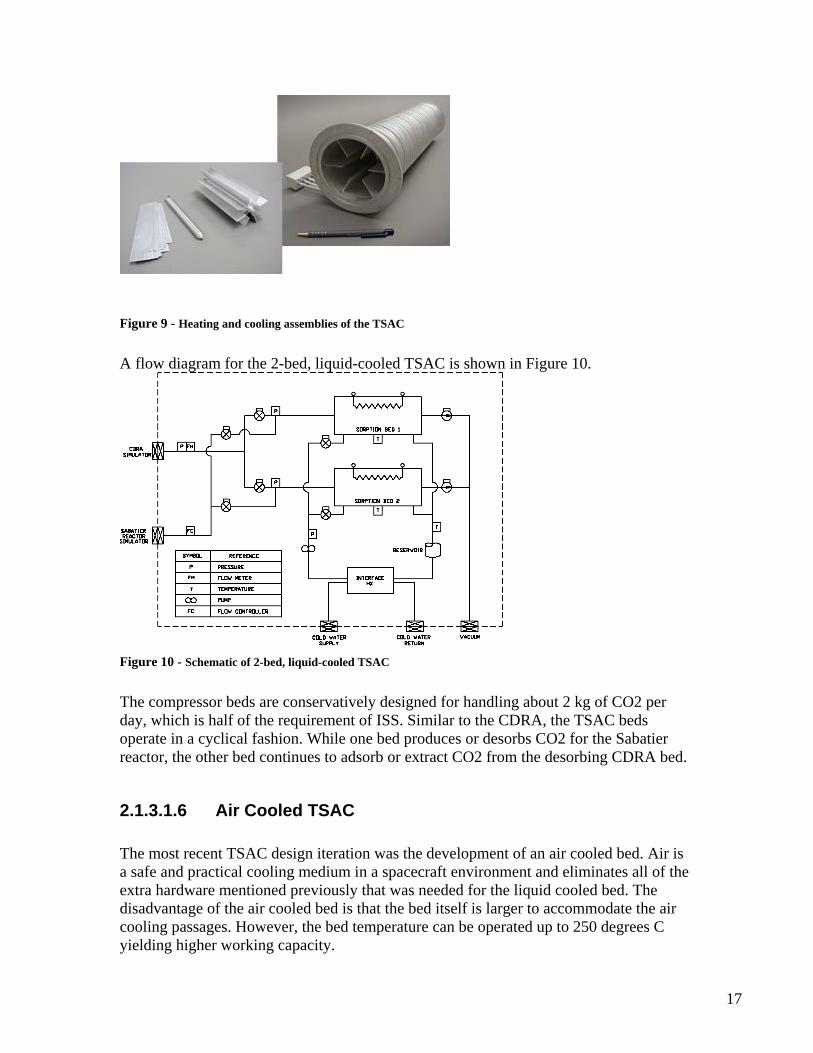
Figure 9 - Heating and cooling assemblies of the TSAC
A flow diagram for the 2-bed, liquid-cooled TSAC is shown in Figure 10.
Figure 10 - Schematic of 2-bed, liquid-cooled TSAC
The compressor beds are conservatively designed for handling about 2 kg of CO2 per day, which is half of the requirement of ISS. Similar to the CDRA, the TSAC beds operate in a cyclical fashion. While one bed produces or desorbs CO2 for the Sabatier reactor, the other bed continues to adsorb or extract CO2 from the desorbing CDRA bed.
2.1.3.1.6 Air Cooled TSAC
The most recent TSAC design iteration was the development of an air cooled bed. Air is a safe and practical cooling medium in a spacecraft environment and eliminates all of the extra hardware mentioned previously that was needed for the liquid cooled bed. The disadvantage of the air cooled bed is that the bed itself is larger to accommodate the air cooling passages. However, the bed temperature can be operated up to 250 degrees C yielding higher working capacity.
17
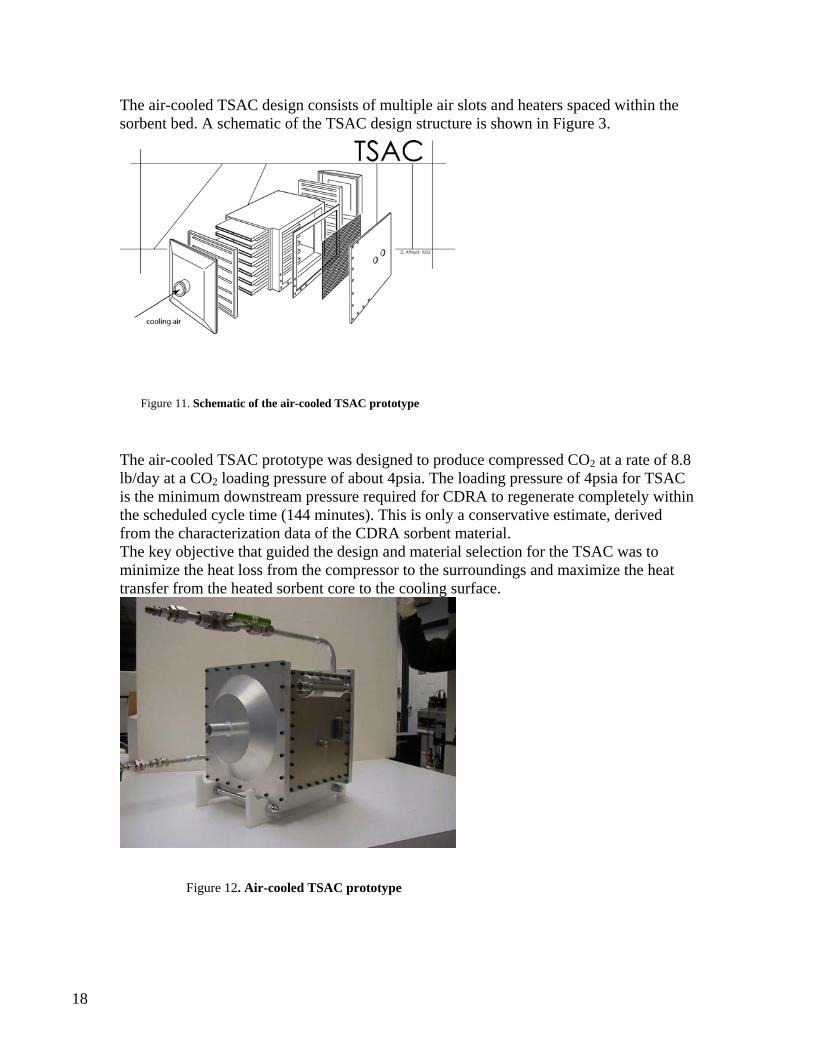
The air-cooled TSAC design consists of multiple air slots and heaters spaced within the sorbent bed. A schematic of the TSAC design structure is shown in Figure 3.
Figure 11. Schematic of the air-cooled TSAC prototype
The air-cooled TSAC prototype was designed to produce compressed CO2 at a rate of 8.8 lb/day at a CO2 loading pressure of about 4psia. The loading pressure of 4psia for TSAC is the minimum downstream pressure required for CDRA to regenerate completely within the scheduled cycle time (144 minutes). This is only a conservative estimate, derived from the characterization data of the CDRA sorbent material. The key objective that guided the design and material selection for the TSAC was to minimize the heat loss from the compressor to the surroundings and maximize the heat transfer from the heated sorbent core to the cooling surface.
Figure 12. Air-cooled TSAC prototype
18

The mechanical design of the TSAC was facilitated with a thermal model to finalize the size, material selection and coolant flow rate.
2.1.3.2 TSAC Integration Characteristics
In contrast to the mechanical compressor, the TSAC compresses and stores the carbon dioxide at the same time, eliminating the need for an accumulator. The CO2 is delivered to the Sabatier at a fixed pressure, which is controlled by regulating the temperature of the desorbing bed. This fixed delivery pressure eases the requirements on the Sabatier for CO2 flow control; i.e. the CO2 modulating valve would have only a 4:1 turndown requirement rather than 4:1 on flow and 6:1 on pressure. The 4BMS produces a high purity CO2 stream, but it will be contaminated by a small amount of nitrogen and oxygen. Because the TSAC is not a flow-through system, there is a potential for a buildup of non-adsorbing gases in the compressor. These could form a barrier to CO2 adsorption during the intake step. This situation is prevented by periodically venting this small amount of non-adsorbing gas to space vacuum via tubing between the TSAC beds and the CO2 vent line.
2.1.4 Sabatier Carbon Dioxide Reduction Subassembly
2.1.4.1 Sabatier Hardware Description
The Sabatier Engineering Development Unit (EDU), developed by Hamilton Sundstrand, was designed to simulate the proposed flight configuration of the Carbon Dioxide Reduction Assembly (CRA) for ISS. As described previously, the CRA is an integral part of a closed loop air revitalization system and makes use of waste products, CO2 from a 4BMS/CDRA and H2 from the OGA, which would otherwise be vented. The CO2 and H2 combine to produce methane (CH4) and water (H2O) as shown in the reaction below. The water and methane may then be used for other processes. In the case of ISS, the water would be sent to the wastewater bus and processed to potable quality for use by the crew. The methane would be vented overboard as a waste product. In future exploration missions, the waste methane could be used as a fuel source, or further reduced to carbon and hydrogen. Equation 1
CO2 + 4 H2 ⇔ CH4 + 2 H2O
The Sabatier EDU consists of a Sabatier methanation reactor, a condensing heat exchanger, a phase separator and accompanying valves and sensors necessary for safe operation. The Sabatier EDU was modified substantially after being tested with the mechanical compressor and before being tested with the TSAC. The overall function of the system was not changed, but the individual component fidelity was improved. The
19

most current Sabatier EDU schematic is shown here in Figure 13. A description of the differences between the two test series is given in the appendix.
SABATIERREACTOR
CONDENSINGHEAT
EXCHANGER
T
P
CG CG CONTROLLERAND EIB
N2 IN
CO2 IN
H2 IN
CH4 VENT
H2O OUT
MFC
P P
P
MFM
T
ΔP
MV202
SVO203 CV204F201
F001
P002FCV003
CV004
MFM005 P006-1
F101 SVC102
MFC103
CV104
R401
H402
T403-1,-8
DP405
T404-1,-2
SVO501
FAN502
T407-1,-2
DP409-1,-2
CV305
P304
P601
SVO604
BPR606
SVO608
CG411 CG412
P206
FR205HX406
TSVC007
P
ΔP
MV105
ΔP
DRUMSEPARATOR AND
PUMP L
SVC303
TT
COLD PLATE
COOLANTIN/OUT
T
PP106
P006-2
Manual Fill Port
RV207
RV009
RV107
P
L602
CP301
T413-1,-2
SEP411
FR607
TTT T T T T T
NN414
TT
T410-1,-2
GasSample
Port
BED412
GasSample
Port
Figure 13 – Sabatier Engineering Development Unit Schematic
The Sabatier EDU has two primary modes of operation: process and standby. In process mode, inlet gasses flow through the system and methane and water are produced. In standby mode, supply gasses are isolated, coolant air is stopped, the unit is evacuated to below 1 psia, and the system is isolated. Reactor heaters cycle as required maintaining a reactor temperature of approximately 300ºF. The Sabatier EDU is operated with excess CO2 (approximately 14%) to ensure that all hydrogen is reacted. The nominal molar ratio (MR) is 3.5 to 1, H2 to CO2. A hydrogen cylinder and a flow controller were used to simulate the delivery of hydrogen from an OGA. An operator sets the hydrogen flow rate, and the Sabatier system controller calculates the required carbon dioxide and controls the flow to achieve the desired molar ratio. The inlet CO2 and H2 gasses react in the catalytic reactor to produce methane and water vapor. This is an exothermic reaction that is self limiting at about 1000 F. The aft end of the reactor is air cooled to reduce the product exit temperature in order to achieve higher reactant conversion. Water vapor in the product stream is condensed in an air-cooled heat exchanger. The methane gas and liquid water are separated in a rotary drum phase separator. The rotation of the drum imposes an artificial gravity field that efficiently separates the two phases. When the delta pressure in the phase separator indicates a high level of liquid in the drum, the system controller increases the separator speed and the separator pumps the accumulated water to a pressurized water storage tank. The methane and excess, un-reacted gasses are vented to a facility combustible gas vent through a
20

combustible gas compatible vacuum system. The Sabatier system is operated at sub-ambient pressures, as planned for the flight design, to ensure that combustible gasses do not leak out to the surrounding atmosphere.
2.1.4.2 Sabatier Hardware Changes between Tests
The first series of fully integrated tests included the four bed molecular sieve, the mechanical compressor and accumulator, and the Sabatier engineering development unit. The Sabatier EDU, in its original configuration, matched the schematic shown here in Figure 14. Some of the more prominent features that were upgraded between the first and second test series are listed below:
• Addition of the rotary drum separator and pump with two differential pressure sensors for level monitoring. The original Sabatier used a tank as a 1-g separator and a small gear pump to transfer the water to the water storage device when the separator tank was full. The rotary separator included in the upgrade is of flight-like quality and is the design basis that would be used for a flight installation of Sabatier technology.
• Addition of a liquid sensor in the methane vent line. The original Sabatier had no liquid sensor. This sensor was included as a means to gather operational test data on the liquid sensor design.
• Incorporation of a multi-point thermocouple in the reactor bed for data collection. The original Sabatier had only two temperature sensors that were used for heater control and over-temperature protection. A flight system would rely on only the two or three sensors in the hot end of the bed. The Sabatier EDU was upgraded to include a multi-point thermocouple in order to gather additional reactor performance data during operation, which will lead to improved reactor designs in the future.
• Addition of a flight like modulating valve for CO2 control. The original Sabatier EDU used a commercial modulating valve with a stepper motor to control the CO2 flow. While this technology performed adequately, it could not be considered flight-like. The EDU was upgraded with a flight-like modulating valve that uses a variable solenoid to position the valve stem to control the flow. This valve was designed and manufactured with flight requirements in mind, including redundant seals and manifold mounting.
• Upgrade of the back pressure regulator to a flight-like design. Again, the original back pressure regulator was a commercial-off-the-shelf design. The new regulator was designed and manufactured to meet flight requirements including a welded diaphragm, manifold mounting and double seals.
21

SABATIERREACTOR
CONDENSINGHEAT
EXCHANGER
T
P
CG CG
N2 IN
CO2 IN
H2 IN
CH4 VENT
H2O OUT
LFCV
MFC
P P
P
T
T
ΔP
MV202
SVO203 CV204F201
F001
P002 FCV003
CV004MFM
MFM005 P006
F101SVC102
MFC103
CV104
R401
H402
T403
DP405
T404
SVO501
FAN502
T407
ST408
DP409
PUMP301
SVC303
P304
P601
RV602 SVO604
RV603 SVO605
BPR606
FR607
SVO608
CG411 CG412
P206
FR205
HX406
TT T
RV410
SVC007
P
T
ΔP
MV609
MV105
CV305
F406
SABATIERREACTOR
CONDENSINGHEAT
EXCHANGER
T
P
CG CG
N2 IN
CO2 IN
H2 IN
CH4 VENT
H2O OUT
LFCV
MFC
P P
P
T
T
ΔP
MV202
SVO203 CV204F201
F001
P002 FCV003
CV004MFM
MFM005
MFM
MFM005
MFM
MFM005 P006
F101SVC102
MFC103
CV104
R401
H402
T403
DP405
T404
SVO501
FAN502
T407
ST408
DP409
PUMP301
SVC303
P304
P601
RV602 SVO604
RV603 SVO605
BPR606
FR607
SVO608
CG411 CG412
P206
FR205
HX406
TT T
RV410
SVC007SVC007
P
T
ΔP
MV609
MV105
CV305
F406
Figure 14 – Original Sabatier EDU Hardware Configuration
2.1.4.3 Sabatier Integration Characteristics
The Oxygen Generation Assembly delivers its hydrogen byproduct to the Sabatier. The OGA has two hydrogen valves, one that goes directly to the vacuum vent of the ISS and the other that interfaces directly with the Sabatier. The control software includes a handshake between the OGA and CRA, which requires that both systems have to be ready to interact before the valve to the Sabatier is opened. This control software was not part of this test series, but has been independently verified. The Sabatier requires carbon dioxide pressurized at 18 psia or higher in order to operate. If the CO2 pressure available at the interface is too low, or the OGA is not ready, the Sabatier system will transition to Standby mode. The Sabatier CRA is designed to operate below ambient pressure. This prevents leakage of flammable gas to the cabin atmosphere after two failures. In order to test the system, a vacuum must be drawn on the methane vent line. This vacuum source must be compatible with methane and hydrogen and pose no explosion hazard. A water ejector setup was used in this integrated testing to simulate the vacuum source. The water ejector could only achieve about 4 psia under maximum flowing conditions; however, this did not seem to affect the system operating parameters elsewhere in the Sabatier system.
22

2.1.5 Support Hardware Configuration
2.1.5.1 4-BMS Inlet ppCO2 Control – Metabolic Load Simulation
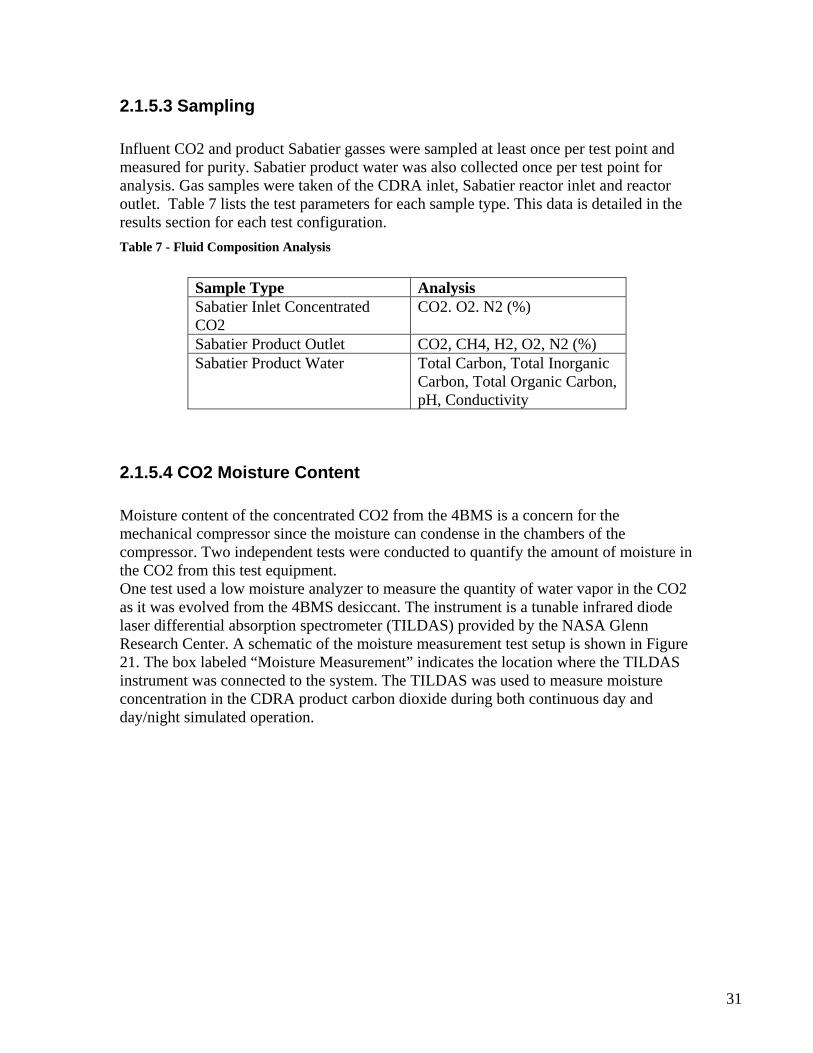
The metabolic load contribution to the integrated tests was created by injecting CO2 according to a mass flow schedule into the air stream at the inlet to the 4-bed molecular sieve. Some of the testing was done with constant CO2 concentration, while other tests were designed to mimic the time profile predicted for a volume with crew performing various activities. During testing, CO2 was injected into the 4BMS inlet per the test matrices in the two following tables: Table 4 lists the conditions used for the mechanical compressor test and Table 5 lists the conditions used for the TSAC test. Test conditions ranged from a 2.3-person crew to an 8.3 person crew (CO2 partial pressure of 1.5 to 5.3 mmHg respectively). Table 4 - Test conditions for mechanical compressor test.
Voz
dukh
O
pera
tion
(on=
25%
CO
2 lo
ad)
H2/
CO
2 M
olar
R
atio
Day
/nig
ht
Dur
atio
n (m
in)
4BM
S C
O2
Inle
t C
once
ntra
tion
(mm
Hg)
Com
p S
peed
(rp
m)
Min
. Num
ber
HC
Req
uire
d
US
H2
Feed
R
ate
(slp
m)*
CO
2 Fe
ed
Rat
e (s
lpm
)
Day
/nig
ht
Cyc
lic o
r C
ontin
uous
Rus
sian
E
leck
tron
Load
(EP
)
Mod
elin
g C
DR
A
Loca
tion
EP
tota
l
TP
1** 1.5 3 off 0 2.461 3.5 0.703 cont 3 1000 - 53/37
2** 1.5 3 off 0 4.179 3.5 1.194 day/night 4 1000 - 53/37
3** 1.5 3 off 0 4.179 3.5 1.194 day/night 4 800 - 53/37
4 3.5 7.25 on 2 4.289 3.5 1.225 continuous 3 1000 - 53/37
5 3.5 7.25 on 2 7.282 3.5 2.081 day/night 4 1000 - 53/37
6 3.5 7.25 on 2 7.282 3.5 2.081 day/night 4 800 - 53/37
met profile 8 6 off 0 8.724 3.5 2.493 day/night 50
hrs 1000 Node3 53/37
met profile 10 7.25 on 2 7.282 3.5 2.081 day/night 50
hrs Node
3 1000 53/37
met 11 profile 7.25 on 2 7.282 3.5 2.081 day/night 48 hrs 1000 Lab 53/37
*includes air leakage compensation of 0.24 lb/day air ** tests repeated after air leakage detected
23
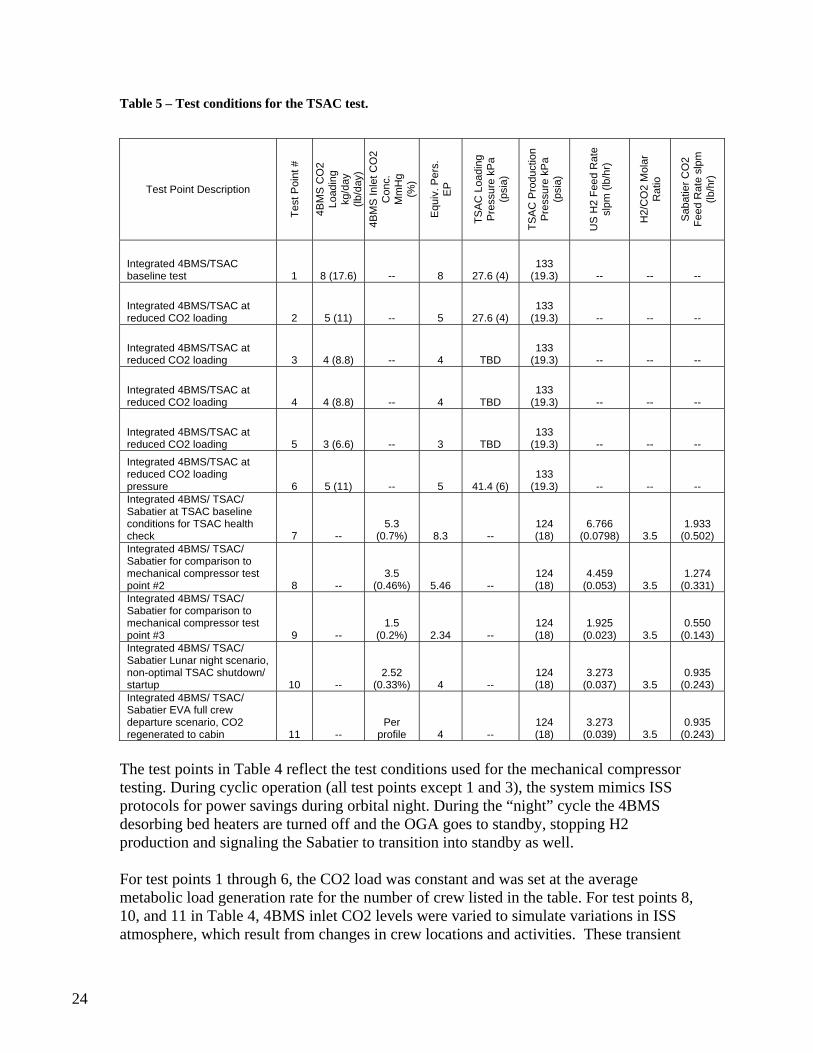
Table 5 – Test conditions for the TSAC test.
US
H2
Feed
Rat
e sl
pm (l
b/hr
)
TSA
C P
rodu
ctio
n P
ress
ure
kPa
(psi
a)
4BM
S In
let C
O2
Con
c.
Sab
atie
r CO
2 Fe
ed R
ate
slpm
(lb
/hr)
TSA
C L
oadi
ng
Pre
ssur
e kP
a (p
sia)
H2/
CO
2 M
olar
R
atio
Equ
iv. P
ers.
Test
Poi
nt #
4BM
S C
O2
Load
ing
kg/d
ay
(lb/d
ay)
Mm
Hg
(%)
EP
Test Point Description
Integrated 4BMS/TSAC baseline test
133 (19.3) 1 8 (17.6) -- 8 27.6 (4) -- -- --
Integrated 4BMS/TSAC at reduced CO2 loading
133 (19.3) 2 5 (11) -- 5 27.6 (4) -- -- --
Integrated 4BMS/TSAC at reduced CO2 loading
133 (19.3) 3 4 (8.8) -- 4 TBD -- -- --
Integrated 4BMS/TSAC at reduced CO2 loading
133 (19.3) 4 4 (8.8) -- 4 TBD -- -- --
Integrated 4BMS/TSAC at reduced CO2 loading
133 (19.3) 5 3 (6.6) -- 3 TBD -- -- --
Integrated 4BMS/TSAC at reduced CO2 loading pressure
133 (19.3) 6 5 (11) -- 5 41.4 (6) -- -- --
Integrated 4BMS/ TSAC/ Sabatier at TSAC baseline conditions for TSAC health check
The test points in Table 4 reflect the test conditions used for the mechanical compressor testing. During cyclic operation (all test points except 1 and 3), the system mimics ISS protocols for power savings during orbital night. During the “night” cycle the 4BMS desorbing bed heaters are turned off and the OGA goes to standby, stopping H2 production and signaling the Sabatier to transition into standby as well. For test points 1 through 6, the CO2 load was constant and was set at the average metabolic load generation rate for the number of crew listed in the table. For test points 8, 10, and 11 in Table 4, 4BMS inlet CO2 levels were varied to simulate variations in ISS atmosphere, which result from changes in crew locations and activities. These transient
7 -- 5.3
(0.7%) 124 (18)
6.766 (0.0798)
1.933 (0.502) 8.3 -- 3.5
Integrated 4BMS/ TSAC/ Sabatier for comparison to mechanical compressor test point #2
3.5 (0.46%)
124 (18)
4.459 (0.053) 8 -- 5.46 -- 3.5
1.274 (0.331)
Integrated 4BMS/ TSAC/ Sabatier for comparison to mechanical compressor test point #3
1.5 (0.2%)
124 (18)
1.925 (0.023) 9 -- 2.34 -- 3.5
0.550 (0.143)
Integrated 4BMS/ TSAC/ Sabatier Lunar night scenario, non-optimal TSAC shutdown/ startup 10 --
2.52 (0.33%)
124 (18)
3.273 (0.037) 4 -- 3.5
0.935 (0.243)
Integrated 4BMS/ TSAC/ Sabatier EVA full crew departure scenario, CO2 regenerated to cabin
Per profile
124 (18)
3.273 (0.039) 11 -- 4 -- 3.5
0.935 (0.243)
24

cabin CO2 levels, or metabolic profiles, were generated using an integrated model developed at NASA JSC. The model allows for atmosphere mixing and air revitalization hardware analysis of multiple integrated modules as configured on ISS [3] or as a potential Lunar base. Crewmember location and metabolic activity levels were based on the location of sleep stations, work stations, galley, and exercise equipment. The CO2 metabolic generation rate was defined by NASA document SSP41000 [4]. The model provided transient cabin CO2 levels, or metabolic profiles, for the United States Operating Segment (USOS) modules that will contain carbon dioxide removal units (Lab and Node 3) when ISS assembly is complete. Testing was conducted to evaluate integrated performance for the two different ISS CDRA locations. A generalized representation of the model is shown below.
Figure 15 - Nodal representation of ISS for CO2 concentration prediction.
Figure 13 is an example of a predicted crew metabolic profile including sleep, waking and exercising periods. This graph represents the gross overall CO2 load generated within the ISS for the 6 crew members. Figure 14 illustrates the predicted atmosphere concentration resulting from the crew activities and the calculated injection flow rate needed to simulate the mission profile.
25

Metabolic Profiles - Max Crew Size
0
0.05
0.1
0.15
0.2
0.25
0.3
0.35
0.4
0 4 8 12 16 20 24
Time (hrs)
CO
2 lo
adin
g, lb
/hr
Crew 1Crew 2Crew 3Crew 4Crew 5Crew 6
NOTE - crew 4 and 5 have the same profile.
Figure 16 - Example metabolic load profile
CO2 Injection Rate to Simulate Metabolic Profile
0
0.5
1
1.5
2
2.5
3
3.5
4
59.5 60 60.5 61 61.5 62
Time (days)
CO
2 In
ject
ion
Flow
Rat
e (s
lpm
)
0
0.2
0.4
0.6
0.8
1
1.2
1.4
1.6
1.8
2
4BM
S In
let C
O2
Con
cent
ratio
n (%
)
Concentration
Injection Rate
Figure 17 - Example of Metabolic Load Profile CO2 Injection Rate
26

The data in Table 5 reflects the test conditions used for the TSAC testing. For the TSAC testing, the system was configured to be always in “daylight”, in other words, there was no nighttime disabling of heaters and idling of the hydrogen generation. These conditions were set to simulate a Lunar habitat. For test points 10 and 11, 4BMS inlet CO2 levels were varied to simulate variations in a lunar habitat atmosphere based on crew locations and activities. The model used for ISS CO2 concentrations was modified to represent a Lunar habitat. Figure 16 shows the resulting CO2 concentration profile for the simulation of the Lunar EVA activity.
TSAC CO2 Injection Rate
0
0.5
1
1.5
2
2.5
3
3.5
4
27 27.5 28 28.5 29 29.5 30 30.5Time (days)
CO
2 In
ject
ion
Rat
e (s
lpm
)
0
0.2
0.4
0.6
0.8
1
1.2
1.4
1.6
1.8
2
4BM
S In
let C
O2
Con
cent
ratio
n (%
)
Injection Rate
Concentration
Figure 18 - CO2 Concentration for Siumulated Lunar EVA Profile
27

2.1.5.2 4BMS venting
When a 4BMS bed is desorbing, the compressor operation is governed by a set of operating rules based on the suction and discharge pressure. These rules have been established to optimize the compressor operation, including minimizing compressor power and compressor operating time without causing starvation of the Sabatier. These compressor rules allow the compressor to turn off while the 4BMS bed is still desorbing. Within the 4BMS, there are check valves that are closed when the bed is under vacuum and open when the bed is flowing cabin air. These check valves will crack open and leak CO2 back to the cabin atmosphere if the bed pressure gets too high. To prevent the check valves from opening, the standoff vacuum valve is used to vent the bed pressure when the compressor is not operating. The rules governing the operation of this valve are shown in Table 6. The desorbing sorbent bed pressure must remain low enough to maintain closing force on the flapper-style check valve. (Refer back to Figure 2 in Section 2.1.1) This pressure was set at 8 psia during the mechanical compressor testing and 12 psia during the TSAC testing. During 4BMS venting, the valve V2, shown in Figure 17 below, functions as the vent CO2 valve listed in the table. During high metabolic load cases, the accumulator often becomes full and the vent valve has to open to relieve the pressure in the 4BMS desorbing bed. Figure 18 shows how the vent valve is activated multiple times during each 4BMS half cycle. This would cause unnecessary wear on the valve. The actual Space Station implementation of this venting control will open the valve and leave it open until the end of the half cycle. This keeps the number of valve cycles at one actuation per half cycle. More CO2 is vented to vacuum, however, as seen in the chart, when the CO2 loading is high, there is more than enough CO2 available and it is not necessary to capture all of the CO2 from the 4BMS.
28

Simplified Schematic of Ground Test HardwareSimplified Schematic of Ground Test Hardware
V209
V2
Vent Line
CDRA
To Vacuum
V209 Air SaveV200LMS
Space VacuumSimulator
V2
FacilityVent
SabEDU
N2
Vacuum vent
PG
VenturiVacVent
H2Bottle/regulator
H2Bottle/regulator
CO2 inlet
TSAC
CDRA
To Vacuum
V209 Air SaveV200LMS
Space VacuumSimulator
V2
FacilityVent
SabEDU
N2
Vacuum vent
PGPG
VenturiVacVent
H2Bottle/regulator
H2Bottle/regulator
CO2 inlet
TSAC
V209
V2
Vent Line
CDRA
To Vacuum
V209 Air SaveV200LMS
Space VacuumSimulator
V2
FacilityVent
SabEDU
N2
Vacuum vent
PG
VenturiVacVent
H2Bottle/regulator
H2Bottle/regulator
CO2 inlet
TSAC
CDRA
To Vacuum
V209 Air SaveV200LMS
Space VacuumSimulator
V2
FacilityVent
SabEDU
H2Bottle/regulator
N2
Vacuum vent
H2Bottle/regulator
CO2 inletPGPG
VenturiVacVent
TSAC
Figure 19 - Integration of ARS Components
29

Table 6 – Standoff Valve Operating Rules
Vent Valve Command Time in Cycle
(minutes) Decision Criteria ISS
Implementation Integrated Test
0-10 ALWAYS CLOSED CLOSED
Psuction <8 AND Compressor OFF CLOSED CLOSED
Psuction < 10 AND Compressor ON CLOSED CLOSED
OPEN until end of half cycle
10-134 Psuction > 8 AND Compressor OFF OPEN for 20 sec
OPEN until end of half cycle
Psuction > 10 AND Compressor ON OPEN for 20 sec
134-144 ALWAYS OPEN OPEN
Vent Valve Operation at High CO2 Rates
0
1
2
3
4
5
6
7
8
9
10
45.4 45.6 45.8 46 46.2 46.4 46.6 46.8
Time (days)
Pre
ssur
e
0
20
40
60
80
100
120
140
Vacuum Pressure Accumulator Pressure Figure 20 - High CO2 rate requires excessive activation of vent valve.
30
2.1.5.3 Sampling
Influent CO2 and product Sabatier gasses were sampled at least once per test point and measured for purity. Sabatier product water was also collected once per test point for analysis. Gas samples were taken of the CDRA inlet, Sabatier reactor inlet and reactor outlet. Table 7 lists the test parameters for each sample type. This data is detailed in the results section for each test configuration. Table 7 - Fluid Composition Analysis
Sample Type Analysis Sabatier Inlet Concentrated CO2
CO2. O2. N2 (%)
Sabatier Product Outlet CO2, CH4, H2, O2, N2 (%) Sabatier Product Water Total Carbon, Total Inorganic
Carbon, Total Organic Carbon, pH, Conductivity
2.1.5.4 CO2 Moisture Content
Moisture content of the concentrated CO2 from the 4BMS is a concern for the mechanical compressor since the moisture can condense in the chambers of the compressor. Two independent tests were conducted to quantify the amount of moisture in the CO2 from this test equipment. One test used a low moisture analyzer to measure the quantity of water vapor in the CO2 as it was evolved from the 4BMS desiccant. The instrument is a tunable infrared diode laser differential absorption spectrometer (TILDAS) provided by the NASA Glenn Research Center. A schematic of the moisture measurement test setup is shown in Figure 21. The box labeled “Moisture Measurement” indicates the location where the TILDAS instrument was connected to the system. The TILDAS was used to measure moisture concentration in the CDRA product carbon dioxide during both continuous day and day/night simulated operation.
31

CDRA
To Vacuum
P
TPT
V209 Air SaveV200
Mechanical Compressor Simulator
LMS
Space VacuumPump Simulator
PT
TP
Dew Point
TPT
Flow
V2 V3Moisture Measurement
V4BottledN2
CDRA
To Vacuum
PP
TPTTPT
V209 Air SaveV200
Mechanical Compressor Simulator
LMS
Space VacuumPump Simulator
PT
TP
PTPT
TPTP
Dew Point
TPTTPT
Flow
V2 V3Moisture MeasurementMoisture Measurement
V4BottledN2BottledN2
Figure 21 – Test setup of CDRA product CO2 moisture measurement using TILDAS.
The other test involved running the compressor from the desorbing CDRA to various fixed discharge pressures and measuring the resulting dew point. The discharge pressure was set to 20, 47.5, 75, 102.5 and 130 psia during different test points. The compressor on/off operation was still controlled based on the Compressor Operating Rules defined in Table 1 of Section 2.1.3.
2.2 Integrated Test Using the Mechanical Compressor
2.2.1 Overall Test Plan Objectives
The integration tests using the mechanical compressor were designed specifically to determine how the hardware would operate in the Space Station configuration. The Space Station currently has a 4BMS CDRA installed in the Lab Module. An Oxygen Generator was launched July 2006 and activated in July 2007. The OGA is also installed in the Lab Module. The operating conditions of the Space Station were used to develop the test matrix in Table 1.
32

In addition to the missions operations described below, test parameters were also established as a result of
modeling of the systems that was being conducted in parallel to the test program. A FORTRAN program
was developed by the NASA Johnson Space Center to simulate the 4BMS, mechanical compressor and
accumulator. During the course of testing, the test data was correlated to the model predictions.
2.2.1.1 Test Requirements Based on ISS Implementation
The Sabatier design points detailed in Table 8 define operating conditions that serve as a simple baseline around which the Sabatier was designed to optimize water recovery performance. The Sabatier must be capable of responding to the variability of the full flow regime of both feed gases and continue operating robustly without compromising the life of any components. The interface conditions described next set the boundary conditions for the operation of the different subsystems and were used to define the test conditions. The following assumptions were used as the basis for the flow rates and settings used in the test points: Oxygen / Hydrogen Generation Rates The OGA is required to produce oxygen for the station at a commanded rate between 0.212 and 0.85 lb/hr. The command to the OGA will be from the station level controller that will request 25% to 100% of the maximum power setting. Crew consumption of oxygen is nominally 1.84 lb O2/crew-day. This translates to 0.23 lb/crew-day of hydrogen that is delivered by the OGA to the Sabatier. Air leakage from the station is also made up by oxygen from the OGA and nitrogen from storage tanks. A nominal leakage rate of 0.24 lb/day of air (0.05 lb/day O2) was assumed, which translates to an additional 0.0063 lb/day of hydrogen delivered. The nominal crew size expected when the Sabatier is initially installed on station is 3 crew, the max expected is 6 crew plus 1.25 EP worth of animals. Since the OGA is a high power user, it will likely only operate during the daylight time of the Space Station orbit. At the worst case azimuth, the available operating time is 53 minutes out of a 90 minute period. The daily average hydrogen flow rate is therefore multiplied by 90/53 to arrive at the instantaneous flow rates given in Table 8. CO2 Generation / Removal CO2 generation by the crew is 2.2 lb CO2/crew-day. CO2 is desorbed from the 4BMS and is compressed by the compressor into an accumulator. The beds of the TSA compressor act as an accumulator and no external device is necessary. The mechanical compressor stores CO2 in a tank so that the wave of CO2 desorbed from the 4BMS over a short time span can be delivered to the Sabatier at a fixed rate over a longer duration. The CO2 feed rates given in Table 8 are based on the crew size and the operating schedule (continuous or day/night). The day/night flow rates are 90/53 times the continuous rates per crew member. The contribution of CO2 lost due to station leakage is considered insignificant and not included in the calculations. The concentration of CO2 at the inlet of the 4BMS to achieve the desired rate of CO2 removal was obtained from a Fortran model of the 4BMS. The model and CO2 inlet control are described in more detail in Section 2.1.5.1. The model predicted the
33

atmospheric steady state concentration given a specific crew size and the actual operating conditions of the 4BMS. The model did not include adsorption/desorption of CO2 onto the desiccant beds. The initial prediction of 1.5 mmHg for a crew size of 3 turned out to be low, and the CO2 removal rate did not match the flow rate of hydrogen available to the Sabatier for the first three test points. These test points were later repeated with a different CO2 feed concentration. The graph below shows the CO2 concentration at the inlet of the 4BMS for one of the metabolic load cases. The concentration is calculated from the predicted crew activity and location coupled with the effectiveness of the 4BMS. The tall spikes in concentration are the result of the daily sensor calibration. The small spikes are due to the valves changing position between adsorbing bed cycles.
Metabolic Profile CO2 Concentration to 4BMS
0
0.2
0.4
0.6
0.8
1
1.2
59.5 60 60.5 61 61.5 62Time (days)
CO
2 C
once
ntra
tion
(%)
Figure 22 – CO2 inlet concentration fed to 4BMS for metabolic load profile case.
Load Sharing between US and Russian Hardware Some assumptions had to be made to establish the load sharing of Russian and US life support equipment on the Space Station. Since the Russian and US CO2 removal devices will be operating from the same mixed atmosphere aboard the Space Station, the split of CO2 concentrated by each system is a function of each one’s removal efficiency and the total amount of CO2 available. The Russian CO2 removal system (Vozdukh) specification requires that the CO2 partial pressure be maintained at 5.3 mmHg with a CO2 load of 3 EP. This can be considered the worst case performance point as actual Station data indicates that the CO2 partial pressure with the Vozdukh only operating is between 3.5 and 4.0 mmHg. The Station CDRA performance gives 3.0 mmHg pCO2
34
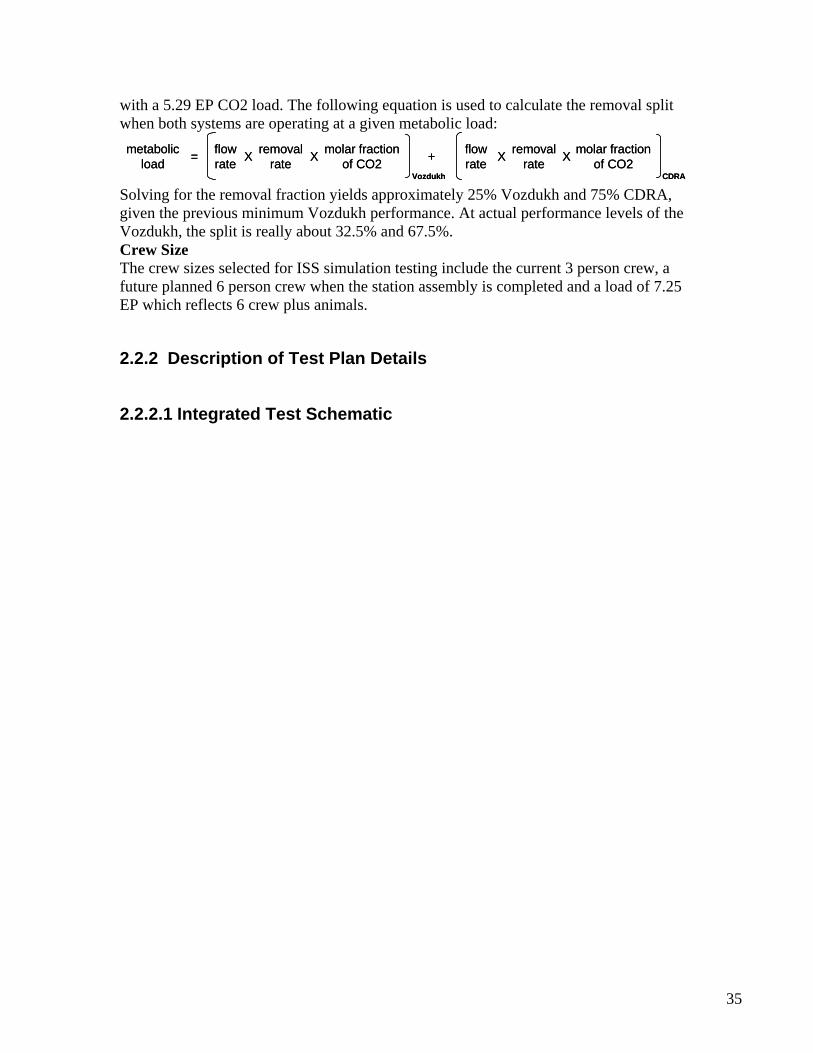
with a 5.29 EP CO2 load. The following equation is used to calculate the removal split when both systems are operating at a given metabolic load: metabolic
loadflow rate
removal rate
molar fraction of CO2
Vozdukh
X X= + flow rate
removal rate
molar fraction of CO2
CDRA
X Xmetabolic load
flow rate
removal rate
molar fraction of CO2
Vozdukh
X X= + flow rate
removal rate
molar fraction of CO2
CDRA
X X
Solving for the removal fraction yields approximately 25% Vozdukh and 75% CDRA, given the previous minimum Vozdukh performance. At actual performance levels of the Vozdukh, the split is really about 32.5% and 67.5%. Crew Size The crew sizes selected for ISS simulation testing include the current 3 person crew, a future planned 6 person crew when the station assembly is completed and a load of 7.25 EP which reflects 6 crew plus animals.
2.2.2 Description of Test Plan Details
2.2.2.1 Integrated Test Schematic
35

Simplified Schematic of ISS Life Support Hardware
Node 3Bulkhead
ARRack
P
Adsorbing5A Bed
Desorbing5A Bed
DesorbingDesiccant
Bed
Precooler
AdsorbingDesiccant
Bed
Carbon Dioxide RemovalAssembly (CDRA)
CH4/CO2
P
CO2
Airfrom
CCAA
Air toCCAAInlet
H2O
H2
OGSRack
CO2ACCUMULATOR
Carbon Dioxide ReactorAssembly (CRA)
COMPRESSOR
SabatierReactor
CondensingHeat
Exchanger
PP
Oxygen GeneratorAssembly (OGA)H2
P
P H2O
M
P
M
P
STANDOFF
V209
V2
V3P002P000
Figure 23 – Simplified Schematic of CDRA and CRA as intended to be integrated on ISS.
Figure 23 above shows simplified schematics of the CDRA and the CRA as they would be installed on the International Space Station. The highlighted components are shown with the component numbers as used in the ground integration testing. Figure 24 below is a schematic of the ground-integrated system with the same control components highlighted.
36
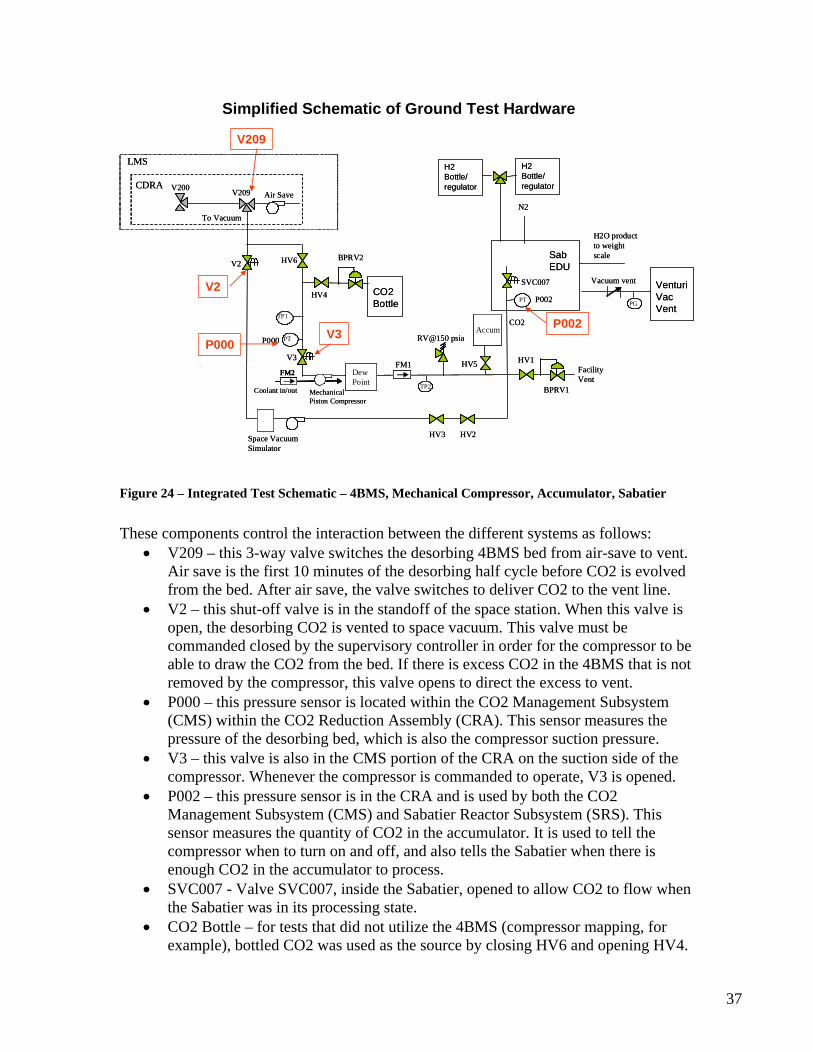
Simplified Schematic of Ground Test Hardware
CDRA
To Vacuum
V209 Air SaveV200
LMS
Space VacuumSimulator
PT
TP1
V2
V3
Accum
FacilityVent
Dew Point
HV1
HV2
BPRV1
FM1
TP2
HV3
CO2Bottle
SabEDU
HV4
BPRV2
SVC007
PT P002
N2
H2O productto weight scale
Vacuum vent
RV@150 psia
HV5
PG
VenturiVacVent
H2Bottle/regulator
H2Bottle/regulator
CO2
MechanicalPiston Compressor
FM2
Coolant in/out
FM2
HV6
P000
CDRA
To Vacuum
V209 Air SaveV200
LMS
Space VacuumSimulator
PTPT
TP1TP1
V2
V3
AccumAccum
FacilityVent
Dew Point
HV1
HV2
BPRV1
FM1
TP2TP2
HV3
CO2Bottle
SabEDU
HV4
BPRV2
SVC007
PTPT P002
N2
H2O productto weight scale
Vacuum vent
RV@150 psia
HV5
PGPG
VenturiVacVent
H2Bottle/regulator
H2Bottle/regulator
CO2
MechanicalPiston Compressor
FM2
Coolant in/out
FM2
HV6
P000
V209
Figure 24 – Integrated Test Schematic – 4BMS, Mechanical Compressor, Accumulator, Sabatier
These components control the interaction between the different systems as follows: • V209 – this 3-way valve switches the desorbing 4BMS bed from air-save to vent.
Air save is the first 10 minutes of the desorbing half cycle before CO2 is evolved from the bed. After air save, the valve switches to deliver CO2 to the vent line.
• V2 – this shut-off valve is in the standoff of the space station. When this valve is open, the desorbing CO2 is vented to space vacuum. This valve must be commanded closed by the supervisory controller in order for the compressor to be able to draw the CO2 from the bed. If there is excess CO2 in the 4BMS that is not removed by the compressor, this valve opens to direct the excess to vent.
• P000 – this pressure sensor is located within the CO2 Management Subsystem (CMS) within the CO2 Reduction Assembly (CRA). This sensor measures the pressure of the desorbing bed, which is also the compressor suction pressure.
• V3 – this valve is also in the CMS portion of the CRA on the suction side of the compressor. Whenever the compressor is commanded to operate, V3 is opened.
• P002 – this pressure sensor is in the CRA and is used by both the CO2 Management Subsystem (CMS) and Sabatier Reactor Subsystem (SRS). This sensor measures the quantity of CO2 in the accumulator. It is used to tell the compressor when to turn on and off, and also tells the Sabatier when there is enough CO2 in the accumulator to process.
• SVC007 - Valve SVC007, inside the Sabatier, opened to allow CO2 to flow when the Sabatier was in its processing state.
• CO2 Bottle – for tests that did not utilize the 4BMS (compressor mapping, for example), bottled CO2 was used as the source by closing HV6 and opening HV4.
V2
P000V3
P002
37

• Accumulator - The compressor delivered CO2 to the Sabatier/Accumulator inlet. The accumulator is simply a buffer volume that fills and empties when the compressor flow is greater or less than the Sabatier usage rate.
The 4BMS was operated in the nominal ISS CDRA mode. Half-cycle time was 144 minutes and process air flowrate was 95 lbs/hour average. For the last 10 minutes of the desorb cycle, the desorbing bed was exposed directly to the space vacuum simulator pump. This would be the recommended operating procedure for ISS in order to fully desorb the 4BMS bed prior to its next adsorption cycle. The CO2 loading profile to the 4BMS is described in Section 2.1.5.1.
2.2.2.2 Single Component Tests
2.2.2.2.1 4BMS
The 4 bed molecular sieve system was tested alone to verify that it met the removal capability that had been demonstrated in prior baseline cases. The test conditions are listed in the table below. The baseline testing was repeated throughout the project to ensure that there was no performance degradation as a result of the integration. Test Case # ppCO2 Inlet CO2 Removal
Rate Test Duration
torr Lb/hr
4BMS Baseline, 3 EP
1.48 0.23 8 hour min
4BMS Baseline, 6 EP
3.39 0.52 8 hour min
2.2.2.2.2 Mechanical Compressor
This configuration tested the compressor as a stand-alone item. The test results would be compared to the vendor test results prior to delivery of the compressor to NASA. This testing is referred to in the test plan as “Compressor Health Check.” The Table below list the test conditions. Test Point
Suction Pressure
Discharge Pressure
Pump Speed
(psia) (psia) (RPM) 4 20 1000 1
2 4 130 1000 Each test point will last a minimum of 5 minutes.
38
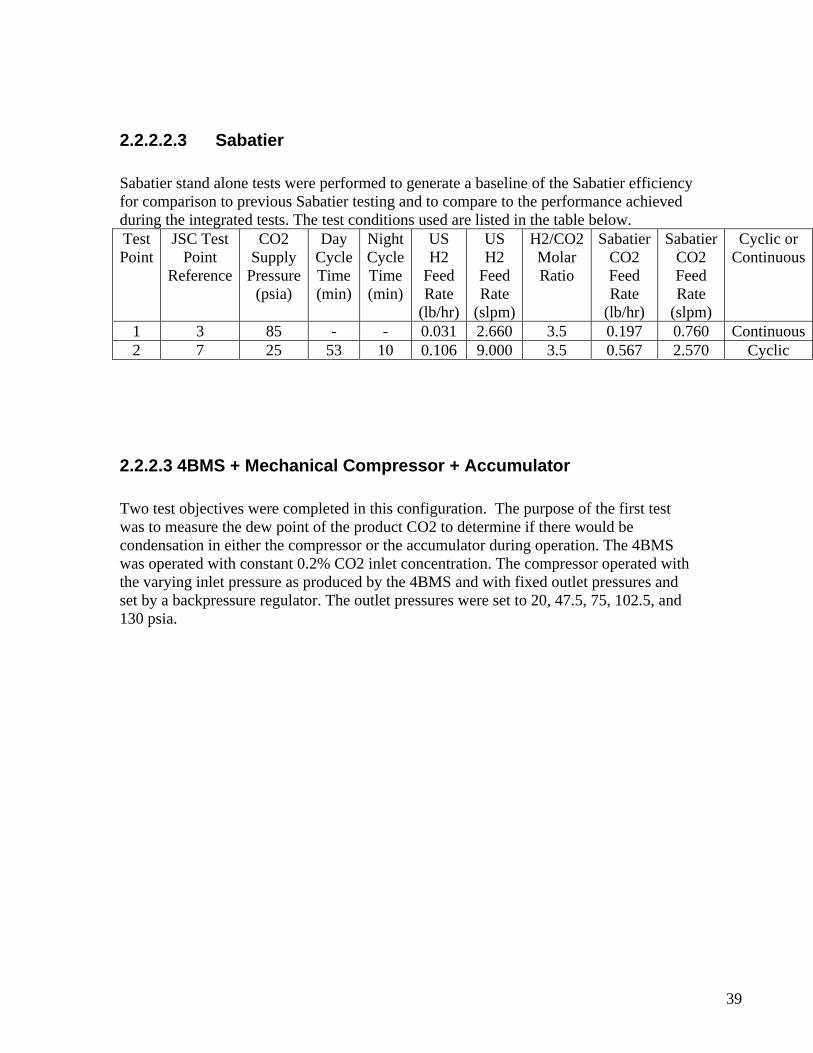
2.2.2.2.3 Sabatier
Sabatier stand alone tests were performed to generate a baseline of the Sabatier efficiency for comparison to previous Sabatier testing and to compare to the performance achieved during the integrated tests. The test conditions used are listed in the table below. Test Point
JSC Test Point
Reference
CO2 Supply
Pressure
Day Cycle Time
Night Cycle Time
US H2
Feed Rate
(lb/hr)
US H2
Feed Rate
H2/CO2 Molar Ratio
Sabatier CO2 Feed Rate
Sabatier CO2 Feed Rate
Cyclic or Continuous
(psia) (min) (min)(slpm) (lb/hr) (slpm)
1 3 85 - - 0.031 2.660 3.5 0.197 0.760 Continuous2 7 25 53 10 0.106 9.000 3.5 0.567 2.570 Cyclic
2.2.2.3 4BMS + Mechanical Compressor + Accumulator
Two test objectives were completed in this configuration. The purpose of the first test was to measure the dew point of the product CO2 to determine if there would be condensation in either the compressor or the accumulator during operation. The 4BMS was operated with constant 0.2% CO2 inlet concentration. The compressor operated with the varying inlet pressure as produced by the 4BMS and with fixed outlet pressures and set by a backpressure regulator. The outlet pressures were set to 20, 47.5, 75, 102.5, and 130 psia.
39

Simplified Schematic of Ground Test Hardware
CDRA
To Vacuum
V209 Air SaveV200
LMS
Space VacuumSimulator
PT
TP1
V2
V3
Accum
FacilityVent
Dew Point
HV1
HV2
BPRV1
FM1
TP2
HV3
CO2Bottle
SabEDU
HV4
BPRV2
SVC007
PT P002
N2
H2O productto weight scale
Vacuum vent
RV@150 psia
HV5
PG
VenturiVacVent
H2Bottle/regulator
H2Bottle/regulator
CO2
MechanicalPiston Compressor
FM2
Coolant in/out
FM2
HV6
P000
CDRA
To Vacuum
V209 Air SaveV200
LMS
Space VacuumSimulator
PTPT
TP1TP1
V2
V3
AccumAccum
FacilityVent
Dew Point
HV1
HV2
BPRV1
FM1
TP2TP2
HV3
CO2Bottle
SabEDU
HV4
BPRV2
SVC007
PTPT P002
N2
H2O productto weight scale
Vacuum vent
RV@150 psia
HV5
PGPG
VenturiVacVent
H2Bottle/regulator
H2Bottle/regulator
CO2
MechanicalPiston Compressor
FM2
Coolant in/out
FM2
HV6
P000
V209
V2
P000V3
Open
P002
Controlled by 4BMS for venting
Controlled by Sabatier for compressor control
Closed
Closed
Open
Figure 25 – Hardware configuration for 4BMS and compressor only tests.
In this test configuration, the 4BMS and compressor were integrated together with no other systems operating. The hand valves that connect the CO2 tank (HV4) and the accumulator (HV5) were closed. The Sabatier was powered on, but not processing so that it could monitor the compressor inlet (P000) and outlet (P002) pressures, and operate the compressor and inlet valve (V3). The back pressure regulator (BPRV1) was set to varying pressures according to the test plan. A closed hand valve isolated the accumulator. The other test was to start up the compressor under vacuum. Normally, the compressor discharge pressure ins never less than 18 psia, however a system self check is being considered that would evacuate the accumulator and compressor exit. The purpose of the test was to determine if there were any operational issues with the compressor.
2.2.2.3.1 4BMS + Mechanical Compressor + Accumulator +
Sabatier
Table 8 below details the test conditions used for the integration of the mechanical compressor with the 4BMS and the Sabatier. The column data in the table is as follows:
40

• Column 1 is the test point number used for recording test conditions and resulting data.
• Column 2 is the constant CO2 concentration fed to the 4BMS at the cabin air flow inlet. These tests were run open loop, therefore the feed concentration to the 4BMS was set by a CO2 mass flow controller with measured CO2 concentration feedback to the mass flow control setpoint.
• Column 3, EP, is Equivalent Persons. Early mathematical modeling of the 4BMS predicted that 1.5 mmHg partial pressure of CO2 fed to the inlet of the 4BMS would result in the equivalent CO2 removal rate of 3 EP generation rate. After testing this condition and analyzing the data, it was found that 1.5 mmHg inlet resulted in only 2.3 EP worth of CO2 collected and delivered to the Sabatier for processing. The correction to the inlet feed rate was made in later tests.
• Column 4 indicates the status of a virtual Vozdukh, the Russian CO2 removal system. When the Vozdukh is off, all of the CO2 from the entire crew is collected and concentrated by the US CRDA equipment and available for processing by the Sabatier. When the Vozdukh is on, 25% of the crew load of CO2 is collected by the Russian equipment and therefore not available to the Sabatier.
• Column 5 indicates the status of a virtual Elektron, the Russian oxygen generator. The contributing level of the Elektron is given in EP of oxygen delivered by the Elektron. When the Elektron is producing oxygen, the US OGA production level is lowered by the same amount and therefore the hydrogen available to the Sabatier for processing is decreased. These contributions from other hardware become important when determining the amount of water recovery available from the Sabatier system.
• Column 6 is the US hydrogen feed rate to the Sabatier. This value is the amount of hydrogen generated along with the rate of oxygen generated to make up for losses. The oxygen consumption rate is calculated from the crew size, the contribution supplied by the Elektron (subtracted out) and a component for make up oxygen for station air leakage amounting to 0.24 lb/day. The value of hydrogen in column 6 is used as the set point of the hydrogen mass flow controller in the Sabatier EDU.
• Column 7 is the set point for hydrogen/CO2 molar ratio. While this number is a variable in the Sabatier control program, it was set to a constant 3.5 for these tests. The Sabatier calculates the control set point for its CO2 control valve based on the hydrogen feed rate and the molar ratio.
• Column 8 is the CO2 feed rate. This is the average feed rate of CO2 that the Sabatier should be calculating for the set point of its control valve.
• Column 9 indicates day/night cyclic or continuous operation. When the integrated system is operating in day/night mode, the OGA transitions to a standby mode when the space station is in the dark side of the orbit and power is scarce. When the station is back in the daylight side of the orbit, the OGA transitions back to Process mode. Hydrogen is only available to the Sabatier when the OGA is in Process mode. The times used for the duration of the day and night portions of the orbit are given in Column 13.
41
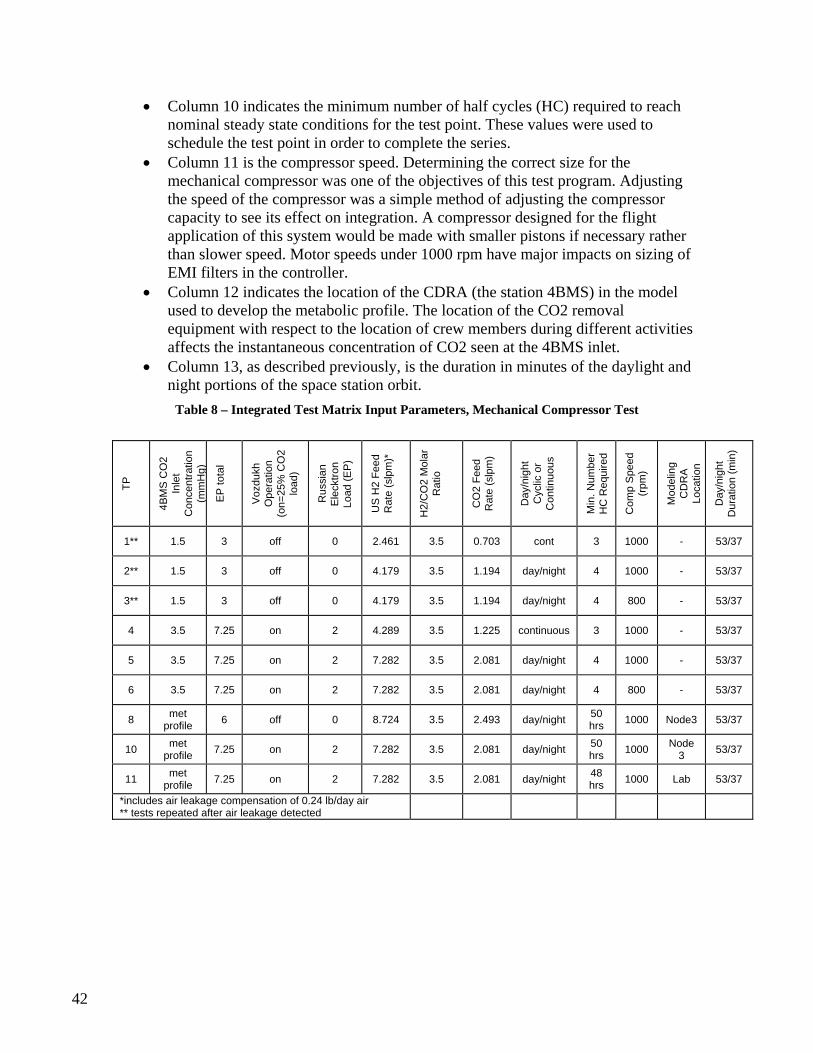
• Column 10 indicates the minimum number of half cycles (HC) required to reach nominal steady state conditions for the test point. These values were used to schedule the test point in order to complete the series.
• Column 11 is the compressor speed. Determining the correct size for the mechanical compressor was one of the objectives of this test program. Adjusting the speed of the compressor was a simple method of adjusting the compressor capacity to see its effect on integration. A compressor designed for the flight application of this system would be made with smaller pistons if necessary rather than slower speed. Motor speeds under 1000 rpm have major impacts on sizing of EMI filters in the controller.
• Column 12 indicates the location of the CDRA (the station 4BMS) in the model used to develop the metabolic profile. The location of the CO2 removal equipment with respect to the location of crew members during different activities affects the instantaneous concentration of CO2 seen at the 4BMS inlet.
• Column 13, as described previously, is the duration in minutes of the daylight and night portions of the space station orbit.
Table 8 – Integrated Test Matrix Input Parameters, Mechanical Compressor Test
Voz
dukh
O
pera
tion
(on=
25%
CO
2 lo
ad)
H2/
CO
2 M
olar
R
atio
Day
/nig
ht
Dur
atio
n (m
in)
4BM
S C
O2
Inle
t C
once
ntra
tion
(mm
Hg)
Com
p S
peed
(rp
m)
Min
. Num
ber
HC
Req
uire
d
US
H2
Feed
R
ate
(slp
m)*
CO
2 Fe
ed
Rat
e (s
lpm
)
Day
/nig
ht
Cyc
lic o
r C
ontin
uous
Rus
sian
E
leck
tron
Load
(EP
)
Mod
elin
g C
DR
A
Loca
tion
EP
tota
l
TP
1** 1.5 3 off 0 2.461 3.5 0.703 cont 3 1000 - 53/37
2** 1.5 3 off 0 4.179 3.5 1.194 day/night 4 1000 - 53/37
3** 1.5 3 off 0 4.179 3.5 1.194 day/night 4 800 - 53/37
4 3.5 7.25 on 2 4.289 3.5 1.225 continuous 3 1000 - 53/37
5 3.5 7.25 on 2 7.282 3.5 2.081 day/night 4 1000 - 53/37
6 3.5 7.25 on 2 7.282 3.5 2.081 day/night 4 800 - 53/37
met profile 8 6 off 0 8.724 3.5 2.493 day/night 50
hrs 1000 Node3 53/37
met profile 10 7.25 on 2 7.282 3.5 2.081 day/night 50
hrs Node
3 1000 53/37
met 11 profile 7.25 on 2 7.282 3.5 2.081 day/night 48 hrs 1000 Lab 53/37
*includes air leakage compensation of 0.24 lb/day air ** tests repeated after air leakage detected
42

2.2.3 Discussion of Test Results
2.2.3.1 Description of Result Metrics for Fully Integrated Tests
Table 2.2-2 lists the parameters used to evaluate the performance of the subsystems during the integration
tests. The parameters are listed as Set points or Performance. Set points are input parameters that are
established for each test case. They are the input variables to which the systems respond. Parameters are the
responses of the subsystems. The input parameters include the items discussed in Section 2.2.3.2 as well as
some additional items not included on the previous tables. Some of the additional parameters were not
changed between test points, but would have to be considered in the development of an Air Revitalization
System for other exploration mission scenarios.
Summary plots of each Test Point are assembled in Appendix A.
Table 2.2-9 – Integration Test Metrics
Integration Test Parameters Set point Performance
Overall System Test Test Duration Frequency of Vacuum Vent Day/Night or Continuous Sabatier Starvation Crew Size
4BMS CO2 Inlet Concentration or Feed Rate CO2 Removal Efficiency Half Cycle Duration Power
Mechanical Compressor Compressor Speed Power Accumulator Working Pressure Range Number of Start/Stop Cycles Accumulator Volume Duty Cycle
Sabatier Hydrogen Feed Rate (based on crew size) Water Recovery Efficiency Molar Ratio Actual Water Production Day/Night Cycle Times Power Theoretical Water Production (based on H2 available)
Reactor Temperatures
Reactor Pressure Drop
43

The significance of the Set points and Performance parameters are discussed in detail below:
Overall System Test
• Test Duration – the duration of each test was pre-established to attempt to reach steady state
operation within the 4BMS. The tests with constant CO2 concentration fed to the 4BMS were run
for three or four half cycles. The tests that incorporated a metabolic profile to simulate the
movement of crew within the habitat were run for 50 hours or more to include repetition of the
profile.
• Day/Night or Continuous – Day/night vs. continuous operation affects the availability of power. It
is assumed that when the ISS is in the night portion of the orbit that power consuming devices
must be tuned down or off. This affects the Sabatier operation and the heater power allowed in the
4BMS.
• Crew Size – crew size is used as an indicator of overall load on the systems. Crew consumption of
oxygen (reflected in hydrogen flow rate) and crew production of carbon dioxide drive the sizing
requirements for the subsystems.
• Frequency of Vacuum Vent – the vacuum vent is controlled at the system level based on what is
going on with the 4BMS. Excessive venting is an indication of poor CO2 management and likely
is associated with Sabatier starvation.
• Sabatier Starvation – the overall goal of the system integration is to recover as much water as
possible. Sabatier starvation means that there is hydrogen produced ready to be converted, but
there is not enough carbon dioxide available to run the reaction. The overall mass balance of
hydrogen and carbon dioxide is such that there is always excess CO2 available, so starvation is
another indicator of poor CO2 management.
4BMS
• Inlet CO2 concentration or feed rate – The feed rate of CO2 to the 4BMS falls out of the crew size
parameter and sets the operating envelope for the integrated systems.
• Half Cycle Duration – A half cycle refers to the length of time that all beds of the 4BMS system
are in either adsorb or desorb. The length of the half cycle affects how well the molecular sieve
beds adsorb and desorb CO2. The integration tests were all performed with a 144 minute half
44

cycle, however some of the stand alone tests were done with 155 minute half cycles to compare to
the manufacturer’s baseline tests. Shorter half cycle times increase the CO2 removal performance.
• CO2 Removal Efficiency – CO2 removal efficiency is a measure of the amount of CO2 actually
captured by the 4BMS compared to the amount fed to it. Most of the tests were done open loop,
which means that the scrubbed air from the 4BMS was not returned to the inlet. Because the
testing was open loop, there was no buildup of CO2 concentration that would otherwise be seen
with a poor performing 4BMS. CO2 removal efficiency is affected by the desorption pressure, a
significant artifact of integration with a compressor instead of space vacuum venting.
• Power – The 4BMS heaters consume power to desorb CO2 and water from the zeolite. The power
requirement is a function of the CO2 loading isotherms. The lower the vacuum pressure available
for desorption, the lower the power requirement to drive off the CO2.
Mechanical Compressor
• Compressor Speed – In this series of testing, the compressor speed was varied to effectively
change the flow rate capacity of the compressor. In reality, the piston size and stroke would be
optimized to achieve the desired volumetric flow rate. The speed change allowed an easy way to
change flow conditions and observe the results.
• Accumulator Working Pressure Range – The accumulator used in the mechanical compressor tests
was restricted to operation between 18 and 120 psia. There are several factors that influence this
range that could change for other than and ISS application. The low set point pressure is based on
the pressure drop allocation for the control components in the Sabatier at maximum flow rate. This
pressure drop is added to the reactor inlet pressure and the minimum pressure of 18 psia is
achieved. The actual pressure drop of the EDU hardware was lower than the allocation because
there were no filters installed in the lines. The upper pressure limit is based on pressure ratio
achievable by the compressor, inlet dew point and the resulting dew point of the gas once
compressed, and the pressure rating of the downstream components. The accumulator vessel can
withstand over 2000 psia, however, not all of the shutoff valves can be exposed to that pressure.
The maximum operating pressure selected for these tests was 120 psia, which was sufficiently low
enough to prevent condensation.
45
• Accumulator Volume – The accumulator volume for the ISS application is 0.73 ft3. This is the
largest volume of accumulator bottles ganged together that could fit in the Space Station rack
designated for Sabatier installation. All of the integration tests using an accumulator used similar
size bottles to simulate the ISS available volume.
• Power – Power is one of the key performance variables of the mechanical compressor. The power
consumption is based on the work done to compress the carbon dioxide and also the mechanical
and electrical efficiency of the compressor and motor.
• Number of Start/Stop Cycles – The number of start/stop cycles resulting from the integration
dynamics is an important factor in the life of the compressor. The number of start/stops affects
wear of moving parts and life of electronic components.
• Duty Cycle – Duty cycle is the most important factor affecting life of the compressor. The life
limiting component of the compressor is the piston rings, and their life is directly attributed to run
time.
Sabatier
• Hydrogen Feed Rate – The hydrogen feed in these tests was delivered from gas cylinders. In a real
ARS application, the hydrogen would come from an oxygen generator and would be a function of
the oxygen produced for crew consumption. The hydrogen feed rate can be any value for other
mission scenarios.
• Molar Ratio – Molar ratio is the ratio of hydrogen to carbon dioxide fed to the Sabatier reactor.
The stoichimetric ratio is 4 moles hydrogen to 1 mole CO2. In these tests, the molar ratio was set
to 3.5. In the space station application, CO2 is in excess of hydrogen. The reactor works more
efficiently when the molar ratio is not at the stoichiometric value. In other applications, Mars for
example, the reactor might be run at molar ratios greater than 4.
• Day/Night Cycle Times – The day night cycle time for most of the tests was set to 52 minutes day,
37 minutes night. This corresponds to the longest night duration of the ISS orbit. The length of the
night cycle affects how much the reactor cools off before being restarted.
46

• Theoretical Water Production – This value is the amount of water that could be generated by the
Sabatier if every mole of hydrogen was consumed, and all of the water was collected. The molar
ratio of water generated to hydrogen consumed is 1:2.
• Actual Water Production – This is actual mass of water collected over each test duration. The
water production is affected by the reactor efficiency, the separator waste heat and the number of
shutdown cycles for night time operation.
• Water Recovery Efficiency –This is the ratio of actual water to theoretical water. It is the most
telling of the Sabatier performance metrics for overall system performance.
• Power – Power is consumed by the Sabatier to preheat the reactor and to operate the separator, in
addition to valves and sensors.
• Reactor Temperatures – The reactor temperatures indicate the general health of the Sabatier
reaction and vary with different inlet feed rates and molar ratios.
• Reactor Pressure Drop – Reactor pressure drop varies with feed flow rate, unless there is
excessive water condensation in the reactor bed. A high value would indicate a
performance issue that would require adjustment.
2.2.3.2 4BMS Baseline Test
The table below lists the results of 4-BMS stand alone testing that was performed after the integrated tests
were completed.
Test Case # ppCO2 Inlet CO2 Removal Rate
In – Out CO2 Removal Efficiency
torr Lb/hr
4BMS Baseline 3.79 0.52 74% 4BMS Baseline TP2 Conditions
1.48 0.23 84%
4BMS Baseline TP4 Conditions
3.39 0.52 81.5%
4BMS Baseline TP5 Condition
3.40 0.52 81.8%
47

2.2.3.3 Mechanical Compressor Baseline Test
The mechanical compressor was tested in a stand-alone configuration to compare its performance against the baseline data recorded by the manufacturer. The compressor was tested at 4 psia inlet pressure, 130 psia outlet pressure and produced about 2 lb/hr. The compressor was also tested at 4 psia inlet pressure and 20 psia outlet pressure. The flow rate varied between the three runs, with approximate averages of 1.2, 1.4, and 2 lbs/hr. Large variations in inlet pressure were observed. Test Point
Suction Pressure
Discharge Pressure
Pump Speed
Flow Achieved
(psia) (psia) (RPM) 4 20 1000 1.2-2 lb/hr 1
2 4 130 1000 2 lb/hr Each test point will last a minimum of 5 minutes.
2.2.3.4 4BMS + Mechanical Compressor
The purpose of these integrated tests was to measure the dew point of the product CO2 to determine if there would be condensation in either the compressor or the accumulator during operation. The 4BMS was operated with constant 0.2% CO2 inlet concentration. The compressor operated with the varying inlet pressure as produced by the 4BMS and with fixed outlet pressures set by a back pressure regulator. The outlet pressures were set to 20, 47.5, 75, 102.5, and 130 psia. Dew point of the compressed CO2 remained below 31 F for all conditions tested. During extended compressor operation, the dew point remained around 0 F. CO2 removal from the 4BMS using the mechanical compressor was the same as using the space vacuum simulator within the measurement accuracy of the tests. Test Case # ppCO2 Inlet CO2 Removal
Rate In – Out CO2 Removal Efficiency
torr Lb/hr
4BMS CEDU 1.48 0.24 87% 4BMS CEDU 3.37 0.54 85% 4BMS CEDU 3.38 0.58 92% 4BMS Stand Alone 1.48 0.23 84% 4BMS Stand Alone 3.39 0.52 81.5% 4BMS Stand Alone 3.40 0.52 81.8% Dew Point Data Test Day Compressor outlet
pressure Max Dew Point
Day 7 20 31 F
48
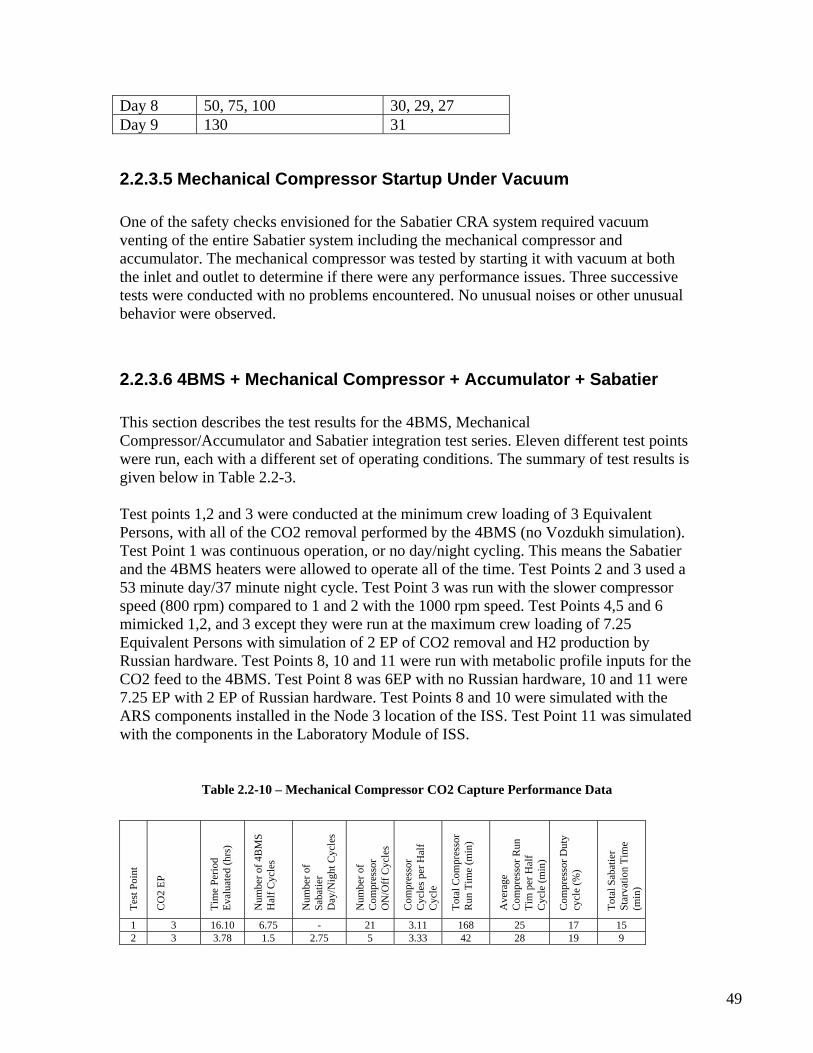
Day 8 50, 75, 100 30, 29, 27 Day 9 130 31
2.2.3.5 Mechanical Compressor Startup Under Vacuum
One of the safety checks envisioned for the Sabatier CRA system required vacuum venting of the entire Sabatier system including the mechanical compressor and accumulator. The mechanical compressor was tested by starting it with vacuum at both the inlet and outlet to determine if there were any performance issues. Three successive tests were conducted with no problems encountered. No unusual noises or other unusual behavior were observed.
2.2.3.6 4BMS + Mechanical Compressor + Accumulator + Sabatier
This section describes the test results for the 4BMS, Mechanical Compressor/Accumulator and Sabatier integration test series. Eleven different test points were run, each with a different set of operating conditions. The summary of test results is given below in Table 2.2-3. Test points 1,2 and 3 were conducted at the minimum crew loading of 3 Equivalent Persons, with all of the CO2 removal performed by the 4BMS (no Vozdukh simulation). Test Point 1 was continuous operation, or no day/night cycling. This means the Sabatier and the 4BMS heaters were allowed to operate all of the time. Test Points 2 and 3 used a 53 minute day/37 minute night cycle. Test Point 3 was run with the slower compressor speed (800 rpm) compared to 1 and 2 with the 1000 rpm speed. Test Points 4,5 and 6 mimicked 1,2, and 3 except they were run at the maximum crew loading of 7.25 Equivalent Persons with simulation of 2 EP of CO2 removal and H2 production by Russian hardware. Test Points 8, 10 and 11 were run with metabolic profile inputs for the CO2 feed to the 4BMS. Test Point 8 was 6EP with no Russian hardware, 10 and 11 were 7.25 EP with 2 EP of Russian hardware. Test Points 8 and 10 were simulated with the ARS components installed in the Node 3 location of the ISS. Test Point 11 was simulated with the components in the Laboratory Module of ISS.
Table 2.2-10 – Mechanical Compressor CO2 Capture Performance Data
Num
ber o
f 4B
MS
Hal
f Cyc
les
Num
ber o
f Sa
batie
r D
ay/N
ight
Cyc
les
Tota
l Com
pres
sor
Run
Tim
e (m
in)
Com
pres
sor D
uty
cycl
e (%
)
Ave
rage
C
ompr
esso
r Run
Ti
m p
er H
alf
Cyc
le (m
in)
Tota
l Sab
atie
r St
arva
tion
Tim
e (m
in)
Com
pres
sor
Cyc
les p
er H
alf
Cyc
le
Tim
e Pe
riod
Eval
uate
d (h
rs)
Num
ber o
f C
ompr
esso
r O
N/O
ff C
ycle
s
Test
Poi
nt
CO
2 EP
1 3 16.10 6.75 - 21 3.11 168 25 17 15 2 3 3.78 1.5 2.75 5 3.33 42 28 19 9
49

3 3 22.50 9 15 25 2.78 324 36 25 9 4 5.4 7.80 3.25 - 11 3.38 67 21 15 0 5 5.4 14.43 6 9.75 23 3.83 136 23 16 0 6 5.4 27.35 11.5 18 42 3.65 251 22 15 0 8 6 (met) 40.78 17 27.5 68 4.00 399 23 16 0 10 5.4 (met) 28.78 12 19 50 4.17 235 20 14 0 11 5.4 (met) 43.20 18 28.5 80 4.44 355 20 14 0
Acc
umul
ator
A
vera
ge M
inim
um
Pres
sure
(psi
a)
Tota
l Num
ber o
f 4B
MS
Ven
t C
ycle
s
Acc
umul
ator
A
vera
ge
Max
imum
(i
)
Ave
rage
4B
MS
Ven
t Cyc
les p
er
Hal
f Cyc
le
Test
Poi
nt
CO
2 EP
1 3 0 0 20 60 2 3 0 0 20 40 3 3 0 0 20 55 4 5.4 6 1.85 50 130 5 5.4 7 1.17 50 130 6 5.4 13 1.13 60 130 8 6 (met) 11 0.65 50 130 10 5.4 (met) 9 0.75 60 130 11 5.4 (met) 23 1.28 55 130
The number of compressor cycles and compressor duty did not vary greatly from between test conditions. The greatest difference noted is at the lower CO2 loading, there is a marked difference between the low and high speed compressor tests. As expected, the lower speed had a higher duty cycle. This difference is not seen in the higher CO2 loading cases. The compressor rules are less demanding on the compressor when the accumulator is near its full mark, and therefore the compressor operation is nearly the same for both cases. Some of the test periods evaluated were quite short and therefore there is significant round off error associated with the results. The minimum EP cases (1, 2 and 3) experienced periods of Sabatier starvation when H2 was being
produced by the OGA but there was not enough CO2 in the accumulator for processing. The accumulator
pressure dropped to the minimum operating pressure of 20 psia and only reached to a maximum pressure of
60 psia. There were no vent cycles, which indicates that no CO2 was wasted. At these low rates, the impact
of leakage is more significant, and it may not be possible to avoid starvation.
The higher EP cases (test points 4, 5 and 6) did not experience any starvation. There were numerous vent
cycles and overall high accumulator pressures. The overall water production efficiency was generally
higher, since all of the hydrogen was processed.
The compressor duty cycle for all cases was on the order of 13-21% with the higher CO2 loading cases
having the lower duty cycle. There was not a large difference in duty cycle between the cases with the
different compressor speeds (Test points 2 vs. 3 and 5 vs. 6).
50

Figure 2.2-26 below is a typical example of performance data collected during the mechanical compressor
integration tests. The performance data described above is shown in this plot of one CDRA half cycle. The
top purple line is the accumulator pressure. In this test case, the accumulator is regularly near the upper
limit of 130 psia. When the accumulator pressure is at this maximum value, the compressor rules do not
allow the compressor to turn on to pump CO2 from the CDRA. In time, the CDRA bed pressure, indicated
by the pink line, reaches the maximum allowable pressure of 8 psia and the vacuum vent valve is opened.
The vent valve opening is noted by the sharp increase in pressure of the vacuum tank indicated by the dark
blue line. The aqua line indicates when the Sabatier is in Process mode, and the green line indicates when
the compressor is activated. For this test case, the compressor activates between 3 and 4 times per CDRA
half cycle.
0
2
4
6
8
10
12
14
4:13 4:27 4:42 4:56 5:11 5:25 5:39 5:54 6:08 6:23
Time
Data
0
20
40
60
80
100
120
140
Accumulator Pressure
Vacuum Tank Pressure
Compressor Activation
Sabatier Process Mode
CDRA Discharge Pressure
Pressure relief by vacuum vent valve, accumulator is full
Compressor Operation
Compressor runs until max accumulator pressure is met
Sabatier operation uses CO2 from
accumulator, then compressor refills
Test Point 6, 5.4 EP, Day/Night, 800 RPM
Sabatier Process Mode
Figure 2.2-26 – Typical Performance Data for Mechanical Compressor Integration Tests
The following four plots show the characteristic water recovery data for some of the test points. In Test
Point 4, the overall water recovery was 95%. This test point was at continuous operation at the higher CO2
51
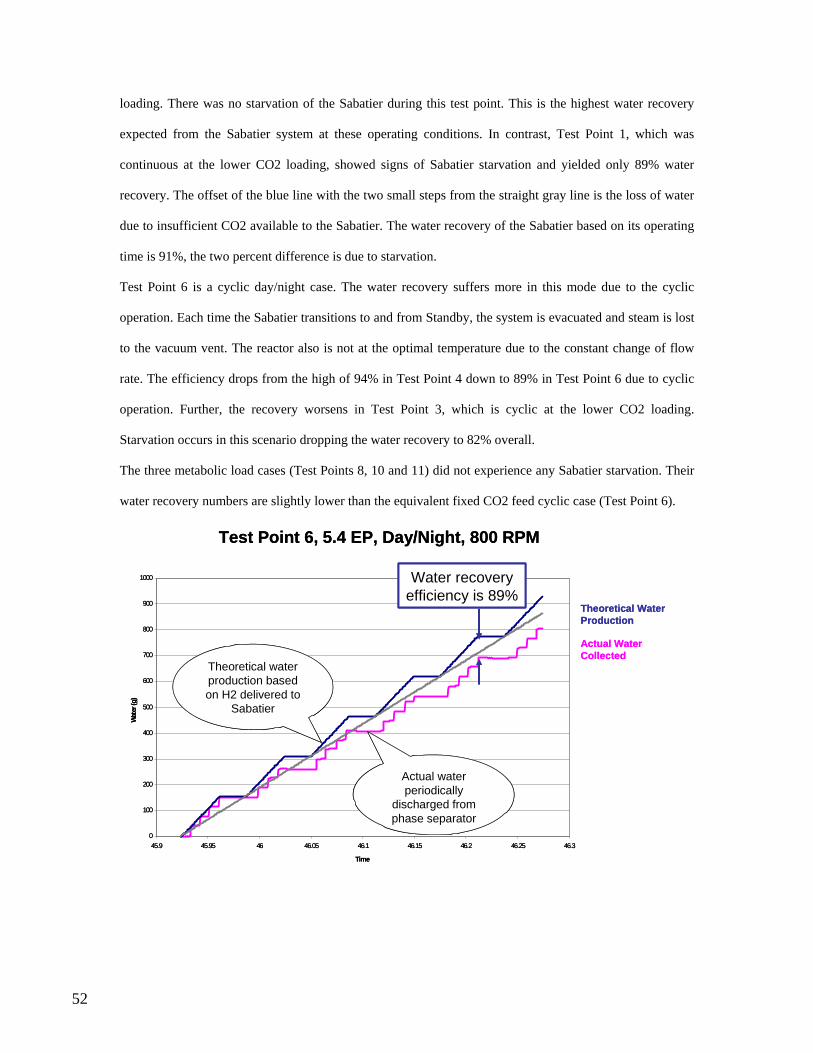
loading. There was no starvation of the Sabatier during this test point. This is the highest water recovery
expected from the Sabatier system at these operating conditions. In contrast, Test Point 1, which was
continuous at the lower CO2 loading, showed signs of Sabatier starvation and yielded only 89% water
recovery. The offset of the blue line with the two small steps from the straight gray line is the loss of water
due to insufficient CO2 available to the Sabatier. The water recovery of the Sabatier based on its operating
time is 91%, the two percent difference is due to starvation.
Test Point 6 is a cyclic day/night case. The water recovery suffers more in this mode due to the cyclic
operation. Each time the Sabatier transitions to and from Standby, the system is evacuated and steam is lost
to the vacuum vent. The reactor also is not at the optimal temperature due to the constant change of flow
rate. The efficiency drops from the high of 94% in Test Point 4 down to 89% in Test Point 6 due to cyclic
operation. Further, the recovery worsens in Test Point 3, which is cyclic at the lower CO2 loading.
Starvation occurs in this scenario dropping the water recovery to 82% overall.
The three metabolic load cases (Test Points 8, 10 and 11) did not experience any Sabatier starvation. Their
water recovery numbers are slightly lower than the equivalent fixed CO2 feed cyclic case (Test Point 6).
0
100
200
300
400
500
600
700
800
900
1000
45.9 45.95 46 46.05 46.1 46.15 46.2 46.25 46.3
Time
Wat
er (g
)
Theoretical Water Production
Actual Water Collected
Theoretical water production based on H2 delivered to
Sabatier
Actual water periodically
discharged from phase separator
Water recovery efficiency is 89%
Test Point 6, 5.4 EP, Day/Night, 800 RPM
52

0
200
400
600
800
1000
1200
41.75 41.8 41.85 41.9 41.95 42 42.05 42.1 42.15 42.2
Time
Wat
er (g
)
Theoretical Water Production
Actual Water Collected
Test Point 4, 5.4 EP, Continuous, 1000 RPM
Water recovery efficiency is 94%
53

Table 2.2-11 - Sabatier Water Production Rate Efficiencies
Actual Water Collected (gm)
Theoretical Water Production Rate
Actual Water Production Rate Time Period
Evaluated (hrs) Water Production
Efficiency Test Point CO2 EP (gm/min) (gm/min) 1 3 16.10 876.3 0.99 0.85 89% 2 3 3.78 197.1 0.99 0.85 84% 3 3 10.85 574.6 0.99 0.81 82% 4 5.4 5.97 576.0 1.72 1.6 94% 5 5.4 6.65 637.7 1.72 1.6 93% 6 5.4 15.05 1341.8 1.72 1.5 89% 8 6 (met) 14.90 1590.3 2.06 1.8 88% 10 5.4 (met) 19.97 1836.6 1.72 1.4 87% 11 5.4 (met) 19.98 1713.9 1.72 1.5 86%
The water production performance is presented in Table 2.2-4. As expected, the steady state cases (Test Points 1 and 4) had the highest water recovery rates as there was no water vapor lost due to venting during Standby operation. The higher EP cases had slightly higher water recovery as there were no periods of Sabatier starvation.
54

2.2.4 Conclusions from This Test Section
The integration test of the 4-Bed Molecular Sieve, Mechanical Compressor and Accumulator and Sabatier was a successful test program. The testing showed that these systems could be properly integrated together. There is no significant, detrimental impact on the 4-Bed CO2 removal system when desorbed with a compressor instead of space vacuum. 4-BMS CO2 removal efficiency was well above requirements for the wide range of CO2 inlet concentrations tested. The compressor control logic in place during this test program supported the wide range of conditions tested. Modifications were made in the flight CO2 compressor control logic to accommodate pressure sensor accuracy requirements. Also, the 4-BMS vent valve flight control strategy is different than what was tested and results in fewer valve cycles. As a result of this testing, the compressor simulation model was modified to better predict flow at low suction pressures. The 4-BMS model was also updated to incorporate a leakage factor to estimate air leakage into the system components that operate at vacuum.
2.3 Integration Test Using the TSA Compressor
2.3.1 Description of Tests
2.3.1.1 4BMS + TSAC
The TSAC integration tests were conducted in three phases at MSFC. The first phase included the integration test of the 4BMS and TSAC only with constant 4BMS CO2 loading. Phases 2 and 3 included the Sabatier with constant and variable CO2 loading of the 4BMS. The primary objective of the first phase was to demonstrate the TSAC performance in a realistic environment where the CO2 flow and pressure from the 4BMS varied with time. The objectives of these tests were to gather data for the validation and optimization of the air-cooled TSAC design, and for development of a low power CO2 removal system that incorporates the functions of the 4BMS and the TSAC. Figure 1 below shows a simplified schematic of the 4BMS and the TSAC configured for the initial phase of the stand alone tests. The Sabatier simulator was a mass flow controller set to draw a fixed flow rate of CO2 from the TSAC.
55

Figure 27 - Simplified Schematic of 4BMS and TSAC Integration Test
56

2.3.1.2 4BMS + TSAC + Sabatier
Simplified Schematic of Ground Test HardwareSimplified Schematic of Ground Test Hardware
V209
V2
Vent Line
CDRA
To Vacuum
V209 Air SaveV200LMS
Space VacuumSimulator
V2
FacilityVent
SabEDU
N2
Vacuum vent
PG
VenturiVacVent
H2Bottle/regulator
H2Bottle/regulator
CO2 inlet
TSAC
CDRA
To Vacuum
V209 Air SaveV200LMS
Space VacuumSimulator
V2
FacilityVent
SabEDU
N2
Vacuum vent
PGPG
VenturiVacVent
H2Bottle/regulator
H2Bottle/regulator
CO2 inlet
TSAC
V209
V2
Vent Line
CDRA
To Vacuum
V209 Air SaveV200LMS
Space VacuumSimulator
V2
FacilityVent
SabEDU
N2
Vacuum vent
PG
VenturiVacVent
H2Bottle/regulator
H2Bottle/regulator
CO2 inlet
TSAC
CDRA
To Vacuum
V209 Air SaveV200LMS
Space VacuumSimulator
V2
FacilityVent
SabEDU
H2Bottle/regulator
N2
Vacuum vent
H2Bottle/regulator
CO2 inletPGPG
VenturiVacVent
TSAC
Figure 28 – Integrated Test Schematic – 4BMS, TSAC, Sabatier
Figure 2 above is a simplified schematic of the 4BMS integrated with the TSAC and the Sabatier. The same V209 and V2 valves were used as with the mechanical compressor test. The two beds of the TSAC and the associated valves that allow switching are not shown in this diagram. These are all contained in the box labeled TSAC. The V209 valve again is used to allow the desorbing 4BMS bed to first perform the air-save function (removing ullage air volume back to the cabin). This valve then switched to the vent direction (to compressor or vacuum) once air-save was completed. The V2 valve, again was used to pressure relieve the 4BMS beds if the desorbing CO2 pressure was too high. The logic for this valve operation is described in Section 2.1 (Hardware Description). The integrated hardware shown above in Figure 2 operated as follows:
• During bed desorption, the 4BMS (labeled CDRA in the figure) delivers CO2 through valve V209.
• Excess CO2 is vented through valve V2 to the space vacuum simulator. The venting logic is described in more detail in Section 2.1.5.2, 4BMS Venting.
• CO2 for processing is delivered through valve V3 to the suction of the TSAC. The TSAC controlled all of the valves necessary to switch between the two sorbent beds and isolate the TSAC from the 4BMS and Sabatier. The Sabatier controller did not perform this function.
• A separate vent line from the TSAC to the space vacuum simulator was used to allow the TSAC beds to bleed diluent gases (nitrogen and oxygen) from the beds.
57

Without the bleed stream, these diluents would build up and the compression capacity would diminish.
• The compressor delivered CO2 to the Sabatier inlet. The TSAC sorbent beds act as both accumulator and compressor. A separate accumulator is not needed with this compressor configuration.
• Valve SVC007, inside the Sabatier (not shown), opened to allow CO2 to flow when the Sabatier was in its processing state.
As with the mechanical compressor integration, during the TSAC integration the 4BMS was operated in the nominal ISS CDRA mode. Half-cycle time was 144 minutes and process air flow rate was 95 lbs/hour average. For the last 10 minutes of the desorb cycle, the desorbing bed was exposed directly to the space vacuum simulator pump. The CO2 loading profiles for the different test points are described in detail in Section 2.0.
2.3.1.3 Test Conditions
Table 5 below details the test conditions used for the integration of the TSA compressor with the 4BMS with and without the Sabatier. The column data in the table is as follows:
• Column 1 is a description of the conditions being simulated. • Column 2 is the test point number for recording test parameters and resulting data. • Column 3 is the target CO2 loading on the 4BMS for the TSAC/4BMS parametric
tests without the Sabatier. • Column 4 is the target CO2 inlet concentration to the 4BMS for fully integrated
tests with the Sabatier. These tests were run open loop, therefore the feed concentration to the 4BMS was set by a CO2 mass flow controller with measured CO2 concentration feedback to the mass flow control set point.
• Column 5 is the number of equivalent persons in the crew. The test points used for comparison of the two compressors were set with the same number of crew. For the test points that simulated a Lunar Base, the crew was set to 4. The compressor parametric tests used various crew sizes to achieve the desired loading values.
• Column 6 is the TSAC loading or suction pressure. This value is controlled in each test.
• Column 7 is the TSAC production or discharge pressure. The pressure was set at 19.3 psia for the 4BMS/TSAC only tests. The pressure was set at 18 psia for the 4BMS/TSAC?Sabatier tests.
• Column 8 is the US H2 feed rate. This designation was carried over from the ISS simulation tests even though there currently is no concept of multiple life support hardware components for Lunar operations. The H2 feed rate is calculated from the crew O2 consumption with an allotment of 0.24 lb/day of air leakage.
• Column 9 is the H2/CO2 molar ratio. While this value is a variable in the Sabatier control logic, it was set to a constant value of 3.5 for all tests.
58

• Column 10 is the feed rate of CO2 from the compressor to the Sabatier. This value is calculated by the Sabatier controller from the indicated hydrogen flow rate and the desired molar ratio.
The following describes the different test points and objectives: • Test Points 1 through 5 were performed with the 4BMS and TSAC only, without
the Sabatier • Test Point 1 was a maximum loading test with 8 kg/day loading on the 4-BMS
and TSAC loading at 4 psia. The TSAC production rate was 4.2 kg/day. • Test Point 2 was to determine the maximum TSAC production capacity at 5
kg/day 4-BMS loading. • Test Point 3 was to determine the maximum TSAC production capacity at 4
kg/day 4-BMS loading . • Test Point 4 was to determine the maximum TSAC production capacity with the
4-BMS loaded to 4 kg/day, but the 4-BMS was not desorbed to vacuum at the end of the half cycle. This test would provide data pertinent to LPCOR development.
• Test Point 5 was to determine the maximum TSAC production capacity at 3 kg/day 4-BMS loading.
• Test Point 6 was a parametric test with the TSAC loading pressure intended to be 6 psia.
• Test Points 7 through 11 were integrated tests including the Sabatier. • Test point 7 was a baseline configuration that mimicked conditions of a
previously run 4BMS/TSAC only test. The purpose of this test was to verify that the integration of the Sabatier did not impact the performance of the TSAC and 4BMS.
• Test points 8 and 9 were designed to mimic previous integration tests with the 4BMS/Mechanical Compressor and Sabatier. The purpose of these tests was to obtain direct comparisons of the compressor technologies as they relate to the integration requirements.
• With the current focus on the Vision for Space Exploration, the team decided to develop test conditions that would reflect possible future exploration mission scenarios. These missions simulate a manned outpost at the Lunar south pole. Test Point 10 simulated the extended Lunar night and Test Point 11 simulated EVA activities. The basis for these test points is described in more detail in the next section.
In all of these tests, the objectives also included measurement of the effects of integration on the efficiencies of the stand-alone components.
59

Table 12 - Integrated Test Matrix – TSAC Test
US
H2
Feed
Rat
e sl
pm (l
b/hr
)
TSA
C P
rodu
ctio
n P
ress
ure
kPa
(psi
a)
4BM
S In
let C
O2
Con
c.
Sab
atie
r CO
2 Fe
ed R
ate
slpm
(lb
/hr)
TSA
C L
oadi
ng
Pre
ssur
e kP
a (p
sia)
H2/
CO
2 M
olar
R
atio
Equ
iv. P
ers.
Test
Poi
nt #
4BM
S C
O2
Load
ing
kg/d
ay
(lb/d
ay)
Mm
Hg
(%)
EP
Test Point Description
Integrated 4BMS/TSAC baseline test
133 (19.3) 1 8 (17.6) -- 8 27.6 (4) -- -- --
Integrated 4BMS/TSAC at reduced CO2 loading, 5 kg/day
133 (19.3) 2 5 (11) -- 5 27.6 (4) -- -- --
Integrated 4BMS/TSAC at reduced CO2 loading, 4 kg/day
2.3.1.4 Mission scenario development
This section describes the operating conditions set for each series of integration tests. Section 0 explains the reasons for choosing the test point in the matrices and how each series of tests relates to future missions. Section 2.3.1.3 details the input parameters in terms of crew size, processing duration, etc. Specific, quantitative test conditions, like any requirement, must be traceable back to some realistic higher level requirement, which in turn is traceable to a mission scenario. Rather than starting “at the bottom” with candidate test points the test point definitions
3 4 (8.8) -- 4 TBD 133
(19.3) -- -- -- Integrated 4BMS/TSAC at reduced CO2 loading and no vacuum desorb ot 4BMS
133 (19.3) 4 4 (8.8) -- 4 TBD -- -- --
Integrated 4BMS/TSAC at reduced CO2 loading, 3 kg/day 5 3 (6.6) -- 3 TBD
133 (19.3) -- -- --
Integrated 4BMS/TSAC at reduced CO2 loading pressure
133 (19.3) 6 5 (11) -- 5 41.4 (6) -- -- --
Integrated 4BMS/ TSAC/ Sabatier at TSAC baseline conditions for TSAC health check 7 --
5.3 (0.7%)
124 (18)
6.766 (0.0798)
1.933 (0.502) 8.3 -- 3.5
Integrated 4BMS/ TSAC/ Sabatier for comparison to mechanical compressor test point #2
3.5 (0.46%)
124 (18)
4.459 (0.053) 8 -- 5.46 -- 3.5
1.274 (0.331)
Integrated 4BMS/ TSAC/ Sabatier for comparison to mechanical compressor test point #3
1.5 (0.2%)
124 (18)
1.925 (0.023) 9 -- 2.34 -- 3.5
0.550 (0.143)
Integrated 4BMS/ TSAC/ Sabatier Lunar night scenario, non-optimal TSAC shutdown/ startup 10 --
2.52 (0.33%)
124 (18)
3.273 (0.037) 4 -- 3.5
0.935 (0.243)
Integrated 4BMS/ TSAC/ Sabatier EVA full crew departure scenario, CO2 regenerated to cabin
Per profile
124 (18)
3.273 (0.039) 11 -- 4 -- 3.5
0.935 (0.243)
60

can be derived “top down” from the mission scenarios. This process ultimately links the tests and the data produced to the mission need. Because of the configuration of the Sabatier scar in the OGS rack, the TSAC compressor is a less likely candidate for the ISS application, however its technical merits make it a viable candidate for other space exploration missions where interface conditions have not already been set. The TSAC test conditions were based on possible Lunar mission operating parameters. Various scenarios were explored that taxed the systems’ capabilities over a range of conditions. These Lunar mission scenarios were used to develop the input parameters of Table 5. Lunar Base CRA Installation With the current focus on the VSE, it was decided that test points should be included to reflect possible future mission scenarios. Three basic mission scenarios were developed: 1) Impact of lunar day/night cycles at the south pole, 2) Lunar mission EVA, and 3) Reduced pressure cabin atmosphere. For this test series, the third mission scenario was ruled out since time constraints would not allow the reconfiguration of test hardware for sub-ambient operation. Impact of Lunar Day/Night Cycles at the South Pole Lunar missions will operate with very different power cycle availability than the more familiar ISS power-cycle profile. Due to a reduction in resupply water capability, the use of a CDRA/TSAC/Sabatier system is most advantageous as part of an Outpost life support system, which will most likely be positioned at the Lunar South Pole. At the South Pole, solar power is available nearly continuously for most of the month, with periods of 24 to 48 hrs where no solar power is available and stored battery power is required. Reduced power operations will probably be necessary during this night period. Since OGA provides hydrogen to Sabatier, one test point included shutting down the Sabatier production during what would be the Lunar night. With the Sabatier shut down during Lunar night, TSAC need not operate to produce CO2. Depending on the TSAC state when the system shuts down, the start-up could be simple or more complex. The CDRA would continue operating to maintain CO2 levels in the habitat. Due to time constraints, the most challenging scenario was selected where the lunar night cycle begins relatively early in a CDRA half cycle and ends towards the end of a CDRA half cycle. This results in the TSAC shutting down when only a fraction of the adsorbing bed has been loaded and only a fraction of the desorbing/producing bed has been unloaded. Hence, when the lunar night is over and the TSAC/Sabatier re-started, for the first TSAC cycle after the half cycle change, there is too much CO2 on the adsorbing TSAC bed for the CDRA to fully desorb. Preliminary testing found that by approximately 70-80 min into the 4BMS 144 min cycle, about 25% of the available CO2 was adsorbed onto TSAC. Hence for this test point, Lunar night or TSAC/Sabatier shutdown occurred at this time. Due to time constraints, the Lunar night cycle was reduced to a minimum of 6 hrs, about the time it takes to fully cool down the TSAC and Sabatier systems. After the lunar night cycle, the TSAC and
61
Sabatier were started back up at roughly 120 min into the current 4BMS cycle. Since there is almost no CO2 remaining on the 4BMS desorbing bed at this time, the TSAC was not able to adsorb any additional CO2. Since the TSAC requires roughly 20 min to heat up before it can provide CO2 to the Sabatier, the desorbing TSAC bed at first was not able to unload any additional CO2 to Sabatier. Hence, when the CDRA half cycle change occurred, the TSAC was essentially in a worst-case configuration with both beds partially loaded with CO2. The results of this test configuration will be discussed below. Lunar Mission EVA Lunar Exploration missions will be highly EVA intensive, with crews of two to four making trips on the lunar surface multiple times in a week. The number of crewmembers actually in the habitat can change significantly during the day or the week, changing the load on each of the air systems. It was assumed that if an OGA were used for oxygen generation, it would also be used to generate oxygen that is stored for consumption during EVAs resulting in continuous H2 availability. It was also assumed that the CDRA would remain operational even if all crew were on EVA since this is the most likely flight configuration due to its simplicity. Multiple possible EVA scenarios were evaluated. These included: 1) 4 crew EVA where CO2 exhausted on EVA is stored and later regenerated back to the cabin, 2) 4 crew on EVA but CO2 is vented during EVA, 3) 4 crew on EVA but depart habitat in groups of two offset by 4 hrs, and 4) 2 crew on EVA and 2 remain in habitat. METOX regeneration was used as a model for the regenerable EVA CO2 removal technology. Overall, approximately ten different possible EVA scenarios were developed. Several of the configurations were modeled in JSC’s integrated model discussed previously. In comparing the predicted cabin ppCO2 profiles, it was concluded that the most dynamic and therefore worst case test scenario was defined as a 4 crew, single departure EVA where CO2 is stored and later regenerated to the cabin. Based on modeling, the most realistic EVA CO2 regeneration scenario involved 2 crew worth of CO2 being regenerated starting 2 hours post EVA followed by the remaining 2 crew’s worth of CO2 regenerated the following day. Figure 3 depicts the cabin ppCO2 results of this scenario.
62

0
1
2
3
4
5
6
7
8
9
0 10 20 30 40 50
Time (hours)
ppCO
2 (m
mH
g)
60
sleep sleep sleep
EVA CO2 regen exercise exercise CO2 regen
Figure 29 - Lunar EVA Mission Scenario Cabin ppCO2
2.3.2 Discussion of Test Results – Integration Test with TSAC
2.3.2.1 Results - 4BMS + TSAC
The 4BMS and TSAC were tested together over a range of CO2 feed rates to better define the TSAC operating envelope and to provide data for further design improvements. In order to understand the impact of the TSAC on the 4BMS, a test plan was developed to compare operating effects. The 4BMS was operated in a stand-alone open loop mode, and then integrated with the TSAC under similar input conditions. Table 2 below lists the test conditions and the results for the two different operating modes. The CO2 removal efficiency of the 4BMS was an average of 2.75% less when integrated with the TSAC than in open-loop mode, desorbing to vacuum. The worst effect was in the middle of the range of input CO2 concentration, 2.6 mmHg ppCO2, where the efficiency dropped 5% when the TSAC was added. Figure 4 below shows the difference between the two sets of operating conditions. Table 13 - Operating parameters for 4BMS / TSAC comparison tests
Inlet CO2 Concentration
CO2 Removal
4BMS CO2 Removal
Efficiency Loss with Data File
63
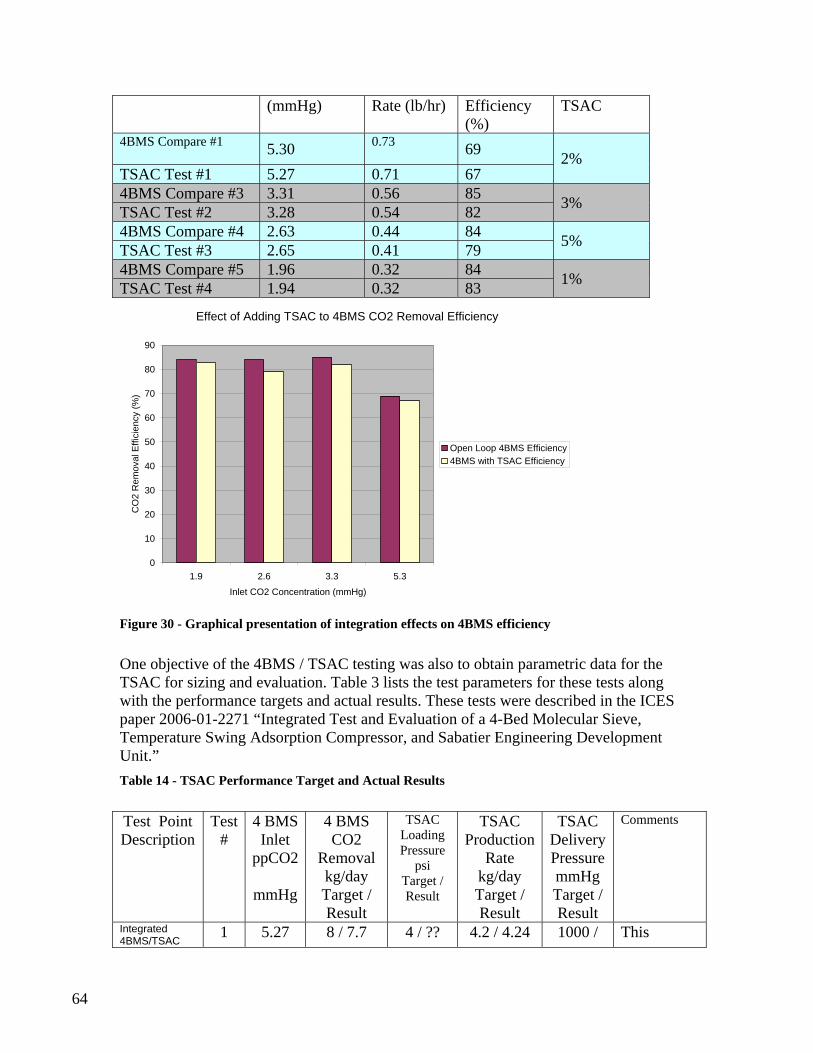
(mmHg) Rate (lb/hr) Efficiency (%)
TSAC
4BMS Compare #1 5.30 0.73 69 2% TSAC Test #1 5.27 0.71 67 4BMS Compare #3 3.31 0.56 85 3% TSAC Test #2 3.28 0.54 82 4BMS Compare #4 2.63 0.44 84 5% TSAC Test #3 2.65 0.41 79 4BMS Compare #5 1.96 0.32 84 1% TSAC Test #4 1.94 0.32 83
Effect of Adding TSAC to 4BMS CO2 Removal Efficiency
0
10
20
30
40
50
60
70
80
90
1.9 2.6 3.3 5.3
Inlet CO2 Concentration (mmHg)
CO
2 R
emov
al E
ffici
ency
(%)
Open Loop 4BMS Efficiency4BMS with TSAC Efficiency
Figure 30 - Graphical presentation of integration effects on 4BMS efficiency
One objective of the 4BMS / TSAC testing was also to obtain parametric data for the TSAC for sizing and evaluation. Table 3 lists the test parameters for these tests along with the performance targets and actual results. These tests were described in the ICES paper 2006-01-2271 “Integrated Test and Evaluation of a 4-Bed Molecular Sieve, Temperature Swing Adsorption Compressor, and Sabatier Engineering Development Unit.” Table 14 - TSAC Performance Target and Actual Results
Test Point Description
Test #
4 BMS Inlet
ppCO2
4 BMS CO2
Removal
TSAC Production
Rate
TSAC Delivery Pressure
TSAC Loading Pressure
Comments
psi
mmHg kg/day kg/day mmHg Target /
Result Target / Result
Target / Result
Target / Result
1 5.27 8 / 7.7 4 / ?? 4.2 / 4.24 1000 / This Integrated 4BMS/TSAC
64

1002 condition is not listed in the ICES paper
baseline test
2 3.28 5 / 5.39 4 / ?? Max / 4.24 1000 / 1002
ICES Test #1
Integrated 4BMS/TSAC at reduced CO2 loading, 5 kg/day
4.2 kg/day 3 2.65 4 / 4.5 4 / ?? Max / 4.07 1000 /
1004 ICES Test #3 11/18/05 9:06 AM to 11/19/05 6:13 AM
Integrated 4BMS/TSAC at reduced CO2 loading, 4 kg/day
4 2.58 4 / 4.16 4 / ?? Max / 2.89 1000 / 1004
ICES Test #4 11/21/05 9:06 AM to 11/22/05 7:12 AM
Integrated 4BMS/TSAC at 4 kg/day and no vacuum desorb of 4BMS
5 1.94 3 / 3.49 4 / ?? Max / 3.99 1000 / 1003
ICES Test #5 11/19/05 4:28 PM to 11/20/05 11:41 AM
Integrated 4BMS/TSAC at reduced CO2 loading, 3 kg/day
6 3.26 5 / 5.96 6 / ?? Max / 4.75 /
1000 / 1004
ICES Test #2
Integrated 4BMS/TSAC at increased CO2 loading pressure
4.8 kg/day
2.3.2.2 Results - 4BMS + TSAC + Sabatier
This section describes the test results for the 4BMS, Temperature Swing Adsorption Compressor and Sabatier integration test series. Five different test points were run, each with a different set of operating conditions. The summary of test results is given below in Table 3 along with the summary data from 4BMS + TSAC parametric testing.
2.3.2.2.1 Integrated Test Results - Nominal Steady State Operation
Some of the TSAC integration tests were conducted at nominal steady state inlet conditions to baseline the performance of the systems together. These first three test points were conducted with steady CO2 feed flow to the CDRA and continuous operation of the Sabatier. These cases resulted in sufficient CO2 capture by the TSAC so that there were no periods of Sabatier starvation. The excess CO2 not needed by the Sabatier was
65

vented by the CDRA directly to the vacuum vent. Figure 5 below illustrates typical TSAC performance for Test Point #1. This test point was run with very high CO2 loading, 8.3 EP. The pink and blue lines are the alternating TSAC bed pressures. There is instrumentation error between the pressure sensor measuring the 4BMS bed and the pressure sensor measuring the TSAC bed. The CDRA discharge pressure must be higher in order to flow to the TSAC. The saw tooth lines at about 10 psia are the equilibrium pressures when each TSAC bed has completed adsorbing CO2 from the desorbing CDRA bed. The saw tooth pressure is the result of the 4BMS bed heater cycling to maintain temperature while the CO2 is desorbing. The smooth lines at about 20 psia are each of the desorbing TSAC beds providing continuous flow to the Sabatier. As long as the green line at the top of the graph (Sabatier inlet CO2 pressure) remains above 18 psia, then the Sabatier is allowed to operate (shown by the purple line at the bottom of the graph). The brown line is the vacuum tank pressure. The large spike at each TSAC bed change is from the CDRA going into the 10 minute space vacuum desorb portion of its operating cycle. The smaller peaks in the middle of each half cycle are from the vent valve opening to relieve the CDRA pressure.
0
5
10
15
20
25
10.75 10.8 10.85 10.9 10.95 11 11.05
Sabatier Inlet CO2 Pressure
TSAC Bed A Discharge Press
TSAC Bed B Discharge Press
Sabatier Operating Status
Test Point 1 4BMS/TSAC Comparison
Sabatier Inlet pressure is always
above 18 psia
End of adsorption equilibrium pressure
CDRA Discharge Pressure
Vacuum Tank Pressure
Sabatier is always on Large peak, 10
minute vacuum desorb
Small peak, vent valve relief
Figure 31 - Typical TSAC Performance Data
66
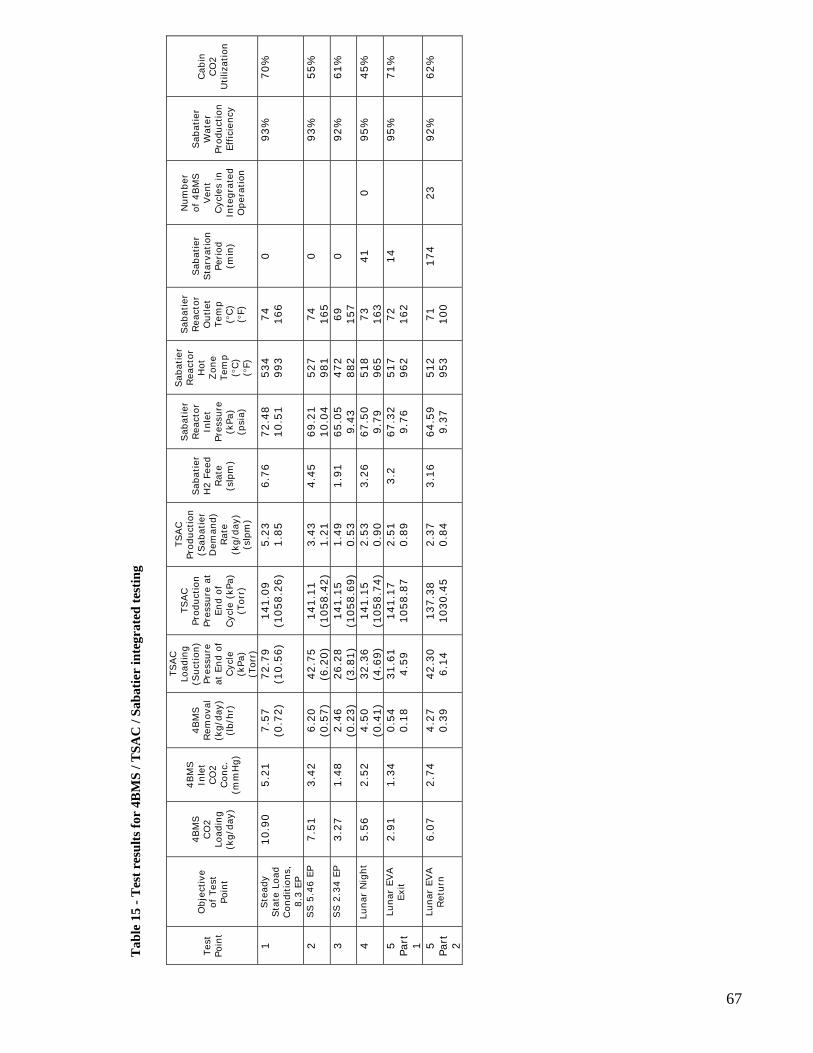
Tab
le 1
5 - T
est r
esul
ts fo
r 4B
MS
/ TSA
C /
Saba
tier
inte
grat
ed te
stin
g
TSAC
Load
ing
(Suc
tion)
Pr
essu
re
at E
nd o
f Cyc
le
(kPa
) (T
orr)
Sab
atie
r Rea
ctor
H
ot
Zon
e Te
mp
(°C)
TSAC
Prod
uctio
n (S
abat
ier
Dem
and)
Rat
e (k
g/da
y)
(slp
m)
Sab
atie
r Rea
ctor
O
utle
t Te
mp
(°C)
TSAC
Prod
uctio
n Pr
essu
re a
t En
d of
Cyc
le (
kPa)
(T
orr)
Sab
atie
r Rea
ctor
In
let
Pres
sure
(k
Pa)
(psi
a)
Num
ber
of 4
BM
S
Ven
t Cyc
les
in
Inte
grat
ed
Ope
ratio
n
4BM
S
Inle
t CO
2 Con
c.
(mm
Hg)
4BM
S
CO
2 Lo
adin
g (k
g/da
y)
4BM
S
Rem
oval
(k
g/da
y)
Sab
atie
r H
2 Fe
ed
Rat
e (s
lpm
)
Sab
atie
r Sta
rvat
ion
Period
(m
in)
Sab
atie
r W
ater
Pr
oduc
tion
Effic
ienc
y
Obj
ectiv
e of
Tes
t Po
int
Cab
in
CO
2 U
tiliz
atio
n
Test
Po
int
(lb/
hr)
(°F)
(°
F)
Ste
ady
Sta
te L
oad
Con
ditio
ns,
8.3
EP
1 10
.90
5.21
7.
57
72.7
9 14
1.09
5.
23
6.76
72
.48
534
74
0
93%
70
%
(0.7
2)
(10.
56)
(105
8.26
) 1.
85
10.5
1 99
3 16
6
SS 5
.46
EP
2 7.
51
3.42
6.
20
42.7
5 14
1.11
3.
43
4.45
69
.21
527
74
0
93%
55
%
(0.5
7)
(6.2
0)
(105
8.42
) 1.
21
10.0
4 98
1 16
5 SS 2
.34
EP
3 3.
27
1.48
2.
46
26.2
8 14
1.15
1.
49
1.91
65
.05
472
69
0
92%
61
%
(0.2
3)
(3.8
1)
(105
8.69
) 0.
53
9.43
88
2 15
7 Lu
nar
Nig
ht
4 5.
56
2.52
4.
50
32.3
6 14
1.15
2.
53
3.26
67
.50
518
73
41
0 95
%
45%
(0
.41)
(4
.69)
(1
058.
74)
0.90
9.
79
965
163
Luna
r EV
A
Exit
5
Part
1
2.91
1.
34
0.54
31
.61
141.
17
2.51
3.
2 67
.32
517
72
14
95
%
71%
0.
18
4.59
10
58.8
7 0.
89
9.76
96
2 16
2
Luna
r EV
A
Ret
urn
5 6.
07
2.74
4.
27
42.3
0 13
7.38
2.
37
3.16
64
.59
512
71
174
23
92%
62
%
Part
2
0.39
6.
14
1030
.45
0.84
9.
37
953
100
67

Test points 2 and 3 were designed to copy the operating conditions of the previously completed mechanical compressor integrated tests. The 3 and 5.4 EP CO2 loading cases with continuously operating Sabatier were chosen to replicate (refer to cases 1 and 4 of the Mechanical Compressor tests). As expected, the equilibrium pressure of the adsorbing TSAC bed for each case is related to the CDRA inlet CO2 concentration. This equilibrium data is summarized below in Table 5 and illustrated in Figure 6.
0
200
400
600
800
1000
1200
0 0.2 0.4 0.6 0.8 1 1.2 1.4 1.6
Time
Pres
sure
(tor
r)/T
empe
ratu
re (C
)
TP1 Bed A Press
TP1 Bed A Temp
TP2 Bed A Press
TP2 Bed A Temp
TP3 Bed A Press
TP3 Bed A Temp
8.3 EP 5.46 EP 2.34 EP
Equilibrium pressure of adsorbing TSAC bed
Bed heater temps
Production pressure of desorbing TSAC bed
TSAC Performance at Various CO2 Loading
Figure 32 - TSAC equilibrium loading pressure is dependent on CO2 feed to CDRA.
Table 5 below lists water production efficiency data for the various scenarios tested with the 4BMS, TSAC and Sabatier. The Sabatier was upgraded from the previous configuration that was tested with the mechanical compressor, so the efficiency data cannot be directly compared. The upgraded Sabatier EDU has a rotary phase separator, which spins all the time to separate the gas and liquid phases in micro-gravity. Some of the excess heat from the separator motor goes into evaporating the product water, which lowers the recovery efficiency. The previous version of the Sabatier EDU had a tank separator with a pump that only operated when the tank was emptied. For a gravity based mission, such as a lunar habitat, a tank and pump would be the preferred separator.
68
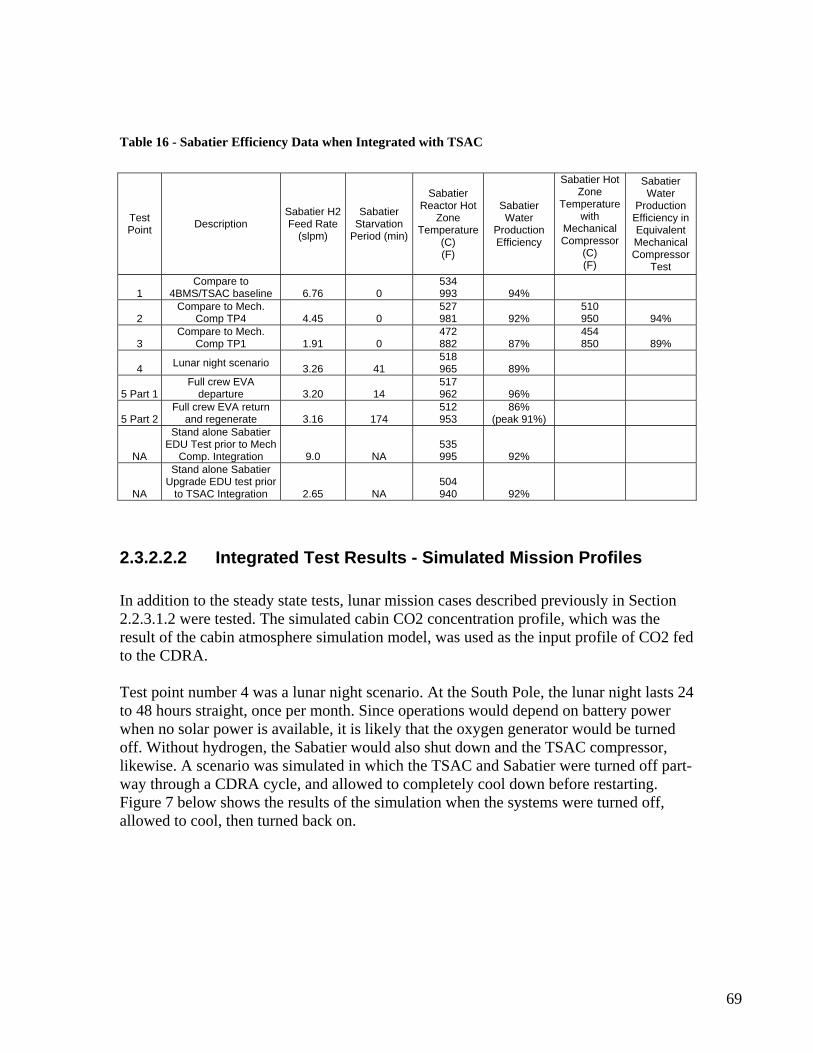
Table 16 - Sabatier Efficiency Data when Integrated with TSAC
Sabatier Hot Zone
Temperature with
Mechanical Compressor
Sabatier Water
Production Efficiency in Equivalent Mechanical Compressor
Test
Sabatier Reactor Hot
Zone Temperature
(C)
Sabatier Water
Production Efficiency
Sabatier H2 Feed Rate
(slpm)
Sabatier Starvation
Period (min)
Test Point Description
(C) (F) (F)
Compare to 4BMS/TSAC baseline
534 1 6.76 0 993 94%
Compare to Mech. Comp TP4
527 510 2 4.45 0 981 92% 950 94%
Compare to Mech. Comp TP1
472 454 3 1.91 0 882 87% 850 89%
518 Lunar night scenario 4 3.26 41 965 89% Full crew EVA
departure 5 Part 1 3.20 14 517 962 96%
Full crew EVA return and regenerate
512 86% 5 Part 2 3.16 174 953 (peak 91%)
Stand alone Sabatier EDU Test prior to Mech
Comp. Integration
535
NA 9.0 NA 995 92% Stand alone Sabatier
Upgrade EDU test prior to TSAC Integration
504
NA 2.65 NA 940 92%
2.3.2.2.2 Integrated Test Results - Simulated Mission Profiles
In addition to the steady state tests, lunar mission cases described previously in Section 2.2.3.1.2 were tested. The simulated cabin CO2 concentration profile, which was the result of the cabin atmosphere simulation model, was used as the input profile of CO2 fed to the CDRA. Test point number 4 was a lunar night scenario. At the South Pole, the lunar night lasts 24 to 48 hours straight, once per month. Since operations would depend on battery power when no solar power is available, it is likely that the oxygen generator would be turned off. Without hydrogen, the Sabatier would also shut down and the TSAC compressor, likewise. A scenario was simulated in which the TSAC and Sabatier were turned off part-way through a CDRA cycle, and allowed to completely cool down before restarting. Figure 7 below shows the results of the simulation when the systems were turned off, allowed to cool, then turned back on.
69

32 minutes into Bed B adsorb cycle CDRA turned off
After turning back on, Bed B doesn’t have enough CO2 for full cycle
Lunar Night Cycle Simulation with CDRA/TSAC/Sabatier
Sabatier should have turned on here
Figure 33 - Results of simulated Lunar night
During the simulation, the CDRA continued to operate as it would be required to properly maintain the atmosphere in the habitat. The CO2 desorbed from the CDRA was vented to the vacuum system as long as the TSAC was turned off. The systems were turned back on 120 minutes into the CDRA cycle, when there was essentially no more CO2 to transfer to the TSAC. The bed that had been adsorbing during the shutdown had only received a partial fill and during the following cycle there was not enough CO2 captured to operate the Sabatier continuously. The systems recovered to normal operation following one full CDRA cycle. The starvation effect could be minimized by starting up the TSAC one half cycle ahead of the oxygen generator and Sabatier as long as the atmosphere oxygen concentration would allow further delay.
70

0
5
10
15
20
25
27.5 28 28.5 29 29.5 30 30.5
Tme (days)
CO
2 Pr
essu
re (p
sia)
0
0.25
0.5
0.75
1
1.25
1.5
CO
2 C
once
ntra
tion
(%)
TSAC Bed A Press TSAC Bed B Press Sabatier Inlet CO2 Press Cabin CO2 Conc Sabatier Status
Sabatier feed pressure falls every TSAC bed change
One full cycle delay between CDRA intake
and TSAC delivery
Integrated Performance During Simulated Lunar EVA Mission
0
5
10
15
20
25
27.5 28 28.5 29 29.5 30 30.5
Tme (days)
CO
2 Pr
essu
re (p
sia)
0
0.25
0.5
0.75
1
1.25
1.5
CO
2 C
once
ntra
tion
(%)
TSAC Bed A Press TSAC Bed B Press Sabatier Inlet CO2 Press Cabin CO2 Conc Sabatier Status
Sabatier feed pressure falls every TSAC bed change
One full cycle delay between CDRA intake
and TSAC delivery
Integrated Performance During Simulated Lunar EVA Mission
Figure 34 - Simulated Lunar EVA Excursion profile results in long periods of Sabatier starvation.
Figure 8 above shows the results of a simulated lunar EVA mission. The CO2 concentration feeding the CDRA is the result of a simulation of a habitat with 4 crewmembers with periods of EVA followed by regeneration of the EMU CO2 collection canisters in the habitat. There is a time delay of one CDRA cycle (4.8 hours) between when the CO2 concentration in the cabin drops and when the CO2 delivered to the Sabatier is insufficient. This effect could possibly be corrected with intelligent software that lowers the O2 production rate (therefore lowering the Sabatier processing rate) during periods when the TSAC bed loading is low. The final loading pressure of the TSAC bed in its previous half cycle is an indicator of the total bed loading and what the delivery capability will be in the next half cycle.
2.3.3 Conclusions from This Test Section
The testing described herein was the first integrated test of a 4-Bed Molecular Sieve, Temperature Swing Adsorption Compressor, and Sabatier Reactor. Five successful tests were completed with these three systems. These tests provided enhanced understanding
71

of both nominal, steady-state operation and dynamic, transient scenarios that can be expected to occur on a Lunar base. Six additional 4BMS-TSAC tests explored widely varying 4BMS loading conditions and the corresponding response of the TSAC. In general, the three systems were proved compatible and able to perform their intended functions for a wide range of input conditions. These specific conclusions are drawn from these test results:
• The dynamic transients expected in a Lunar EVA scenario were played out in Test Point 5. The CO2 concentration changes due to crew movement into and out of the habitat. The response of the systems is delayed, one system to the next, as each system progresses through half cycles. The hydrogen generation rate (by-product from oxygen generation) is current with crew activity. The CO2 delivery rate is delayed by one half cycle. This mismatch results in Sabatier starvation. Adaptive software may be a solution to better match the hydrogen and CO2 rates to feed the Sabatier. There should be sufficient oxygen concentration buffer to allow delayed oxygen production while waiting for the CO2 to be concentrated.
• Large variations between half cycles were noted during the Lunar EVA scenario. The causes for these variations need to be understood and rectified.
• The TSAC had, on average, less than 5% negative impact on the 4BMS performance. However, much higher deviation was noted at 2.6 torr inlet ppCO2 and bears further review.
• A 4BMS heater ramp control algorithm can save about 50 watts (time averaged power). However, refinements to the TSAC operation will be required to prevent gaps in the CO2 production to the Sabatier.
• Additional work is required to prevent TSAC exposure to humidity from room air. The TSAC material’s sensitivity to humidity required it to be extensively purged after inadvertent exposure to room air. Isolation mechanisms should be implemented and tested to prevent air leakage during 4BMS shutdowns.
• Additional refinements to the overall control software are required for better communication between the 4BMS, TSAC and Sabatier.
• The Sabatier software performed a vacuum leak check during every transition to Standby. If the water level was sufficiently high, the separator would be instructed to pump out the water during the vacuum leak check. The separator cannot create enough pressure rise when at vacuum to satisfy the pump out requirement, which then causes a system shutdown. An adjustment to the Sabatier control is required to prevent separator triggered shutdowns during standby mode.
• The Sabatier required CO2 pressure deadband should be a minimum of 3 psi when integrated with a TSAC. The low pressure for Standby should be 16 psia and the high pressure should be 19 psia when operating at the conditions used in this test program. A smaller deadband results in valve chatter while the TSAC is heating up and generating pressure.
• The TSAC and 4BMS need sufficient communications to synchronize their half cycles and to signal each when shutdowns and initiated.
72

3 Conclusions
The testing described herein was the first integrated test of a Four-Bed Molecular Sieve, Sabatier Carbon Dioxide Reduction Assembly with the interfacing CO2 compressor. Two compressor technologies were tested, a mechanical oil-free piston compressor, and a temperature swing adsorption compressor. The mechanical compressor was tested under simulated International Space Station parameters. The TSAC was tested under simulated Lunar Base parameters. Both sets of tests provided enhanced understanding of both nominal steady operation and dynamic, transient scenarios that can be expected to occur in an integrated Environmental Control and Life Support System. Additionally, the compressors were tested independently and with only the 4BMS over varying CO2 loading conditions. The corresponding compressor response to changing conditions was observed. In general, the 4BMS, Sabatier and both compressor technologies were proved compatible and able to perform their intended functions for a wide range of input conditions.
3.1 Overall Conclusions from the Integration Test Experience
The integration test of the 4-Bed Molecular Sieve with two different compressors and a Sabatier reactor was a successful test program. The testing showed that these systems could be properly integrated together. There is no significant, detrimental impact on the 4-Bed CO2 removal system when desorbed with a compressor instead of space vacuum. 4-BMS CO2 removal efficiency was well above requirements for the wide range of CO2 inlet concentrations tested. The different systems’ control logic in place during this test program supported the wide range of conditions tested. These tests provided enhanced understanding of both nominal, steady-state operation and dynamic, transient scenarios. In general, the three systems were proved compatible and able to perform their intended functions for a wide range of input conditions.
3.2 Summary of Observation from the Integration Test
These specific conclusions are drawn from the test results: • Both compressors (TSAC and mechanical) had a small but measurable effect
on the CO2 removal performance of the 4BMS. Since the vacuum level is not as low as space vacuum, some residual CO2 remains on the CO2 removal beds, which in turn reduces their capacity on the next adsorb cycle. During the mechanical compressor testing, the performance reduction was 5.4%. During the TSAC testing, the performance reduction ranged from 1-9% with an average of 4.2%. The integrated
73

performance may be improved with longer space vacuum desorb time or higher temperature. This subject is a candidate for further testing.
• As a result of this testing, the mechanical compressor simulation model was modified
to better predict flow at low suction pressures. • The 4-BMS model was also updated to incorporate a leakage factor to estimate air
leakage into the system components that operate at vacuum. • The dynamic transients expected in a Lunar EVA scenario were evaluated in the
TSAC testing. The test results showed a significant time delay from crew activity to system performance. Adaptive software may be a solution to better anticipate system changes and to alter production rates to maintain system balance.
• Both compressors had, on average, less than 6% negative impact on the 4BMS
performance. • A modified 4BMS heater ramp control algorithm was tested and resulted in power
savings, however gaps in CO2 delivery occurred. The prospect of power improvements is likely and future testing of modifications to the heater schedule is warranted.
• Additional work is required to prevent TSAC exposure to humidity from room air by
implementing isolation mechanisms. • Additional refinements to the overall control software are required for better
communication between the 4BMS, TSAC and Sabatier. • The TSAC and 4BMS need sufficient communications to synchronize their half
cycles and to signal each other when shutdowns are initiated. • The current compressor operation/control logic appears to support a wide range of
test conditions, but modifications may need to be made in order to reduce starvation during the low EP cases as well as reduce the number of brief operation cycles during high EP loading.
• Also, the impact of increased cycles on the 4BMS vacuum vent valve should be
evaluated to determine if these operating rules could be improved. • The data collected over the course of integrated testing is currently being compared
with predictions from existing models to validate the model against test data. The model is being adjusted as required to duplicate test results. Thus far it has been determined that the current compressor model does not adequately predict flowrate through the compressor at low suction pressures. A curve fit has been added to the compressor model based on test results. In addition, the impact of vacuum circuit in-leakage has become very evident upon comparison of test results with model
74

predictions. Efforts are underway to estimate the current bed leak rates and incorporate them into the model as a “worst case”. An operational flight system, once leakage due to sorbent dusting is eliminated, is expected to have a much lower leak rate.
• The impact of in-leakage on the system and its operating rules cannot be ignored
since in-leakage results in increased compressor run time as well as decreased Sabatier efficiency. While it may be difficult to implement, any future plans regarding the integration of a flight CDRA with a CRA should also involve re-evaluating existing protocols for verifying CDRA as well as CRA leak rates. As observed in this test, current CDRA/4BMS leak test procedures could result in significant in-leakage that impacts CRA performance.
• The dynamic transients expected in a Lunar EVA scenario (TP 5) provided insight on
the delayed response of both the 4BMS and TSAC. Consideration of adaptive software to better utilize large influxes of CO2 is suggested.
• Large variations between half-cycles were noted during the Lunar EVA scenario. The
specific causes for this trend need to be understood and rectified. • The TSAC had, on average, less than 5% negative impact on the 4BMS performance.
However, much higher values were measured at about 2.6 torr inlet pp CO2, and bear further review.
• A 4BMS heater ramp control algorithm can save about 50 watts (time-averaged
power). However, refinements to the TSAC operation will be required to prevent gaps in CO2 production to the Sabatier.
• Additional work is required to prevent TSAC exposure to room air. An isolation
valve, or other appropriate solution, should be implemented and tested. • Additional refinements to the overall control software are required for better
communication between the 4BMS, TSAC, and Sabatier. • An adjustment to the Sabatier control is needed to prevent separator-triggered
shutdowns following standby mode. • 4BMS performance was well above requirements for the range of inlet CO2
concentrations tested. • In general, the current TSAC operation/control logic appears to support a range of test
conditions, but a more robust test matrix should be explored in future. • Upgraded components within the Sabatier EDU performed as expected.
75

• Lessons learned from this test can, should, and will be incorporated into future revisions of the CDRS hardware.
3.3 Lessons Learned
3.3.1 Lessons Learned from the Integration Testing
This section documents the Lessons Learned, Anomalies and Resolutions that were implemented as part of the integrated testing.
• Hydrogen flow rate inconsistent across various measurement means, system mass balance not in check. Sabatier water production efficiency calculation is based on hydrogen flow rate.
o Critical parameters that are used to evaluate system performance against requirements must be accurate and verified against accepted standards.
• Loss of network communication from the Sabatier system led to a crash of the overall control computer, which in turn led to shutdown of the other subsystems.
o Control systems need to be designed such that subsystems can continue to operate independently if they lose contact with the main controller. In the case of the ARS, the CDRA is considered critical life support and needs to have the capability to continue operation in the absence of higher level commands. The Sabatier software must be designed to not propagate errors outside its boundaries.
• The Sabatier system rapidly cycled from Process to Standby during operation with the TSAC compressor during low CO2 production rates. The transition was keyed off of CO2 supply pressure limits. The Sabatier operating bands designed initially for the mechanical compressor operation were too tight for TSAC operation. Pressure bands were widened to allow smoother, slower mode transitions and avoid rapid cycling.
o System triggers that initiate logic decisions (such as changing operating mode, activating control loops, etc) must be examined and exercised over the widest range of operating conditions possible. The problem during the testing was resolved by changing the set points for the transition commands. These type of set points should also be variable in the control software so they can be adjusted to optimize operation.
• The Sabatier phase separator pump attempted to pump water out of the system when in standby while the pressure was very low. The pump could not overcome the differential pressure to pump out water when the system pressure was so low.
o The Sabatier flight software was designed to prevent the separator from pumping water during any low-pressure conditions. The software also performs a pump-out prior to transitioning to Standby while there is still pressure in the system to aid the pumping.
• The Sabatier system rapidly between Standby and Process such that the Standby evacuation was not completed. Valves were chattering during the transition. The
76

action of the valves cause pressure changes that in turn changed status in the software that caused the valves to change position again. This was another artifact of control ranges set too close together. The transitions were taking place prior to completion of purge steps and the software ended up caught in an indeterminate state.
o Software logic should be designed such that sequences are completed before subsequent operating state changes are allowed to occur. Checks should be incorporated to verify that procedures (such as purges) are completed.
• If the Sabatier had gone through a shutdown and was still hot, upon restart it would go directly to Process without performing the required purge in Standby first. Apparently the temperature requirement was met and the software did not wait for the purge requirement to be met.
o Software must be written to ensure that all requirements are met, not just the first requirement. Careful testing is often needed to flush out these types of errors in code, as it is often only a unique set of circumstances will create the right conditions for these anomalies.
• Sabatier reactor thermal soak back – when flow to the reactor stops (as in Process
to Standby transition) the heat of the reactor soaks back to the inlet. This was accommodated in the Sabatier EDU by increasing high temperature shutdown limits. The flight reactor design also acknowledged this phenomenon and designed the inlet end instrumentation to tolerate high temperature.
o Component and controls design must consider all conditions, including non-operational conditions.
• 4MBS heater ramp rate – during the TSAC testing, the 4BMS heater control was
modified from a fixed temperature setpoint control to a ramp rate in which the temperature linearly increased from 60 to 400 F. The result of this test was a savings of 50 W time averaged over the desorption cycle, however, less CO2 was desorbed from the 4BMS to the TSAC during the cycle. The overall integration result was starvation of the Sabatier reactor for steadily increasing durations. Due to the potential power savings, further evaluation of modified desorption schedules is warranted.
• TSAC sensitivity to leaks – during testing, the TSAC was inadvertently exposed
to room air several times. Since the adsorbent material is very sensitive to humidity, the TSAC had to be taken offline and purged for an extended period of time before resuming testing.
o Future integrated designs must include means of isolating the TSAC to prevent accidental exposure to cabin air. Subsystem design must consider operating and non-operating states that may be damaging to the hardware.
• Integrated TSAC / Sabatier control pressure – as a result of the testing, it was determined that a minimum of 3 psid is needed for the Sabatier setpoints for CO2 pressure. When the Sabatier transitions to Process, the initial draw of CO2 lowers
77

the TSAC pressure by more than 2 psid. If the transition setpoints are too close together, the systems will cycle rapidly between Process and Standby.
• Air effects on Sabatier performance – temperature anomalies were noted in the
Sabatier profile during the mechanical compressor testing. It was concluded that the temperature spike at the reactor inlet was due to higher than normal concentration of air during a 4BMS bed switching event. The Sabatier reactor is robust to the presence of air and its known temperature profile proved to be a good indicator of altered operating conditions.
o A future test item would be to determine if the reconfigured Sabatier reactor temperature sensors are as sensitive to detecting air inclusion as the EDU Sabatier.
• Sabatier Phase Separator operation at vacuum – testing determined that the rotary
phase separator cannot pump water out when the gas pressure is at vacuum. The flight operating control is configured to empty the separator at the beginning of a Standby transition when the gas pressure in the system is still relatively high.
• CDRA leak check – A significant observation made during integrated testing was
that hardware leakage could be masked if the hardware is leak checked while not in operation. For example, during initial integration testing, the 4BMS passed leakage testing, yet significant air in-leakage was observed during testing. The root cause was a selector valve that was cold-soaked during operation that caused the soft goods to shrink and allow leak paths. The valve was not cold during the static system leak check, and therefore passed the test.
o Systems need to be leak checked in their operating environment to ensure trouble free operation.
3.3.2 Lessons Learned from the Sabatier Flight Program
This section documents Lessons Learned that were incorporated into the flight Sabatier design as a result of the integration testing.
3.3.2.1 Hardware Changes Required
• Hydrogen Vent Tee – the space station OGS rack was initially designed with a
scar for the Sabatier Assembly to be added at a later date to the Oxygen Generation Assembly, but the Sabatier design was not very far advanced at the time the rack was launched. The initial plan was for the Sabatier to vent in the same line as the CDRA. This was later changed to having the Sabatier use the hydrogen vent from the OGA instead.
o The implementation of this change required the addition of a tee line that would be inserted at the interface panel quick disconnect. The change also
78

imposed restrictions on the rate of discharge of the Sabatier to meet the restrictions of the shared vent line.
3.3.2.2 Software Changes Required
• CDRA Control Software – the flight CDRA software did not have provisions for interface commands related to a Sabatier system. The software had to be modified to keep the bulkhead vent valve closed so that the Sabatier could extract the CO2 from the desorbing CDRA beds. The CDRA venting logic, as noted earlier, is different for the flight system than the ground test system. Once the flight system bed pressure exceeds 8 psi, indicating that the compressor has not been activated, the vacuum vent valve is opened and left opened for the remainder of the desorption cycle. The loss of recovered CO2 is acceptable at this point since the accumulator is likely full or the system is not operational. This modification keeps the total number of cycles on the vacuum vent valve the same as that for which they were originally designed.
• OGA Evacuation Check – the OGA will check the pressure in the Sabatier hydrogen
delivery line before opening the valve to deliver hydrogen. If the pressure is high, the Sabatier could potentially have air in it. The OGA will not deliver if the pressure is too high to avoid a potentially hazardous condition. The pressure limit was initially 0.3 psia. This limit was too low, as the Sabatier pressure would at least be that of the vapor pressure of water in the phase separator, plus any instrumentation error in the pressure sensor. The limit was raised to 3.0 psia and the change made to the OGA software.
• Phase separator pumpout – as a result of the integrated testing, the flight Sabatier
software included provisions to pump out the phase separator at the very beginning of a transition to Standby while there is still sufficient gas pressure in the separator. The software then does not allow the separator to pump out any other time in Standby.
3.4 Recommendations for Subsystem Modification if Designing
a New System
• CDRA/TSAC combined design
79

Can there be weight/power/volume savings if the CDRA and TSAC were designed as a single system? LPCOR
• CDRA / OGA cycle mismatch The ARS system on ISS is designed with the OGA operating on a 90 minute diurnal cycle, which matches the station orbit. The OGA would be powered and producing hydrogen during the “day” when power is plentiful and in standby during the “night” when power is scarce. The CDRA operated on a 144 minute half cycle. The mismatch in cycle times requires the use of storage volume to collect CO2 when hydrogen is not available to process. This would be a good area to investigate in the future, either through modeling or testing, to see if matched cycles results in less starvation or smaller accumulator volume.
• CDRA Power Usage – Desorption Rate The current design of the 4MBS has the heaters turn on full power during
the desorption phase if the station is in the daylight portion of the orbit. Testing with both compressors has shown that the 4BMS can retain CO2 in the bed for a significant period of time as long as the bed is evacuated to space vacuum for the final 10 minutes of the cycle. The 4BMS may possibly be operated such that the bed is pressure controlled instead of temperature controlled to save power when the compressor is not ready to receive CO2. This would prevent venting of the CO2 from the 4BMS to space vacuum.
Investigate by modeling or testing.
• CO2 tank proof pressure During the period of time leading up to the Integration Test program, the OGA for the International Space Station was designed and built. Coincidental development of the Sabatier led to incorporation of accumulator tanks into the OGS rack prior to its launch. The volume available for these tanks was smaller than desired, but development testing of the mechanical compressor showed that the compressor could meet the higher pressure demand required to offset the smaller volume. Although these tanks were designed and manufactured to accommodate very high pressures, they were only proof tested to 160 psia. The application of sensor inaccuracies and control bands to the operating system requirements resulted in a usable maximum operating pressure of only 115 psia. In practice, this lower operating pressure will result in greater venting of CO2 overboard and likely associated Sabatier starvation. Interfacing systems should be proofed to as high a pressure as possible per the results of trade studies. The CO2 accumulator for ISS was proofed to 145 psig (160 psia), but the application of sensor accuracies to overpressure protection reduces the actual maximum operating pressure to 100 psig (115 psia).
• Shared Vent Lines - Restriction on flow, temperature, MDP, In the ISS design, the Sabatier shares the vent line with the OGA. The vent
line was sized and proof tested to meet the requirements of the OGA alone. During integrated operation, there are times when both systems must be able to vent gases
80

through this line at the same time. The line is not sized to accept this much flow without creating excessive back pressure. The Sabatier must therefore restrict the rate at which it allows venting gases to flow into the line.
Future integrated designs must consider all operating scenarios, including startup and shutdown, as input to designing interfacing systems (i.e. vent line).
• Coolant Interface The coolant temperature directly affects the percent of water recovery of the Sabatier system by setting the dew point temperature at the phase separator. Coolant temperature should certainly be included in any trade study for future ARS designs. The additional water recovery would have to be traded against issues of external condensation on coolant lines if installed in a habitable volume of the spacecraft or habitat.
• OGA Interface – Pressure Check The design of the ISS controls requires that the OGA verify that the Sabatier had been vented prior to allowing hydrogen to flow to the system. This is done for system safety to prevent introduction of hydrogen to the Sabatier if it was full of air. The target pressure value had been set to 0.1 psia to verify evacuation. However, this value is not achievable when the Sabatier system has water in the phase separator. When evacuated, the inlet pressure will be something more than the vapor pressure of water at the phase separator temperature. For ISS installation, a modification will have to be made to the OGA software to raise the pressure limit used for the interface check. This system check also requires that the Sabatier be evacuated during every standby. This results in some product water loss. The water recovery gained by not venting would have to be traded against other methods of preventing flammable mixtures.
• Waste Water Bus MDP The waste water bus on ISS has a MDP of about 90 psig. The Sabatier system was designed with an MDP of 268 psig to provide containment as a final means of protection against damage due to detonation. The interface of the phase separator to the waste water bus was an area of concern due to the possibility of transmitting a pressure wave through the water lines. I will get the details on how this was resolved.
• Location in Habitable Volume The ISS ARS is designed with all components in the habitable volume. This then requires that all of the components that contain flammable gas have either secondary containment (the OGA dome) or be operated at sub-ambient pressure to prevent leakage of gas out into the cabin. The sub-ambient operation results in a water recovery penalty, as the lower system pressure increases the volume fraction of water vapor that is vented with the methane product gas. For exploration systems, locating the flammable gas components outside the habitable area would allow operation at higher pressure, and therefore increase water recovery. There may be other benefits of volume and mass savings achieved by operating at higher pressure.
81

• Acoustics and EMI Restrictions Acoustics and EMI are not insurmountable requirements, but add weight and volume to systems for attenuation. Location of the system outside the habitable volume may lessen the burden of acoustic and EMI requirements.
4 Recommendations
4.1 Recommended Future Testing
This integrated test program has shown that a closed loop Air Revitalization System is achievable and practical. However, there is insufficient data from either integrated test to draw conclusions about the long term effects of each compressor on the 4BMS operation, and vice-versa. The testing uncovered possible areas for improvement, and areas where more information is needed. The testing has shown that the systems can be integrated with acceptable reduction of performance of the 4BMS and the resulting water recovered is as much as 90% of what is theoretically possible. Long duration experiments under controlled conditions, in terms of 4BMS loading, TSAC loading, compressed CO2 production, CO2 purity, vacuum levels, etc.., should be performed to better understand long term performance.
4.1.1 Recommended Test Objective
Any future development should focus on improving the systems’ equivalent system mass (ESM - weight, power and volume), efficiency and reliability. Many observations were made of potential improvements in ESM and reliability. These potential improvements should be the focus of follow on testing or modeling work. Due to software control limitations, the integrated tests to date were performed at preset operating schedules. Upon adding a more sophisticated and flexible control system, the integrated systems should be tested under dynamic operating conditions where the system parameters such as CO2 inlet, cycle time, standby time, etc are varied in a non-uniform pattern (that are realistic to mission-specific scenarios).
4.1.2 Specific Recommended Tests
The following specific test recommendations are made with a focus on discovering potential areas for improvement to system weight, power, volume, efficiency or reliability.
• Test integrated combinations of compressors and the 4BMS with different lengths of vacuum desorb time and different desroption temperatures to determine if the
82
4BMS CO2 removal efficiency can be improved. The integrated testing showed an average loss of CO2 removal efficiency of about 4-5%. This loss may be recovered by modifying operating times.
• Test adaptive software for the overall ARS system to better match CO2 and hydrogen availability. This would lead to minimizing instances of Sabatier starvation and improved overall water recovery.
• Test variations of heater ramp algorithms to determine if power savings can be achieved in both 4BMS and TSAC components.
• Test the TSAC with lower pressure cooling air (as might be a design requirement for a Lunar base or future spacecraft) or with alternate cooling medium (liquid) as might be available in future application. Each will have design impacts on the cooling rate and overall efficiency.
• Use the ground based hardware to verify protocols for evaluating leakage rates of in-flight hardware to improve flight system reliability.
• Further test variable loads, such as the Lunar EVA scenario tested here, to flush out the reason for the large variations noted between half cycles. This will lead to better understanding of the system operations and ultimately improve efficiency and reliability.
• Investigate the large performance impact noted at 2.6 torr inlet CO2 pressure and not at other CO2 concentrations during TSAC/4BMS testing. Perform addition tests if warranted. It remains unknown whether this stems from a testing anomaly, analysis error, or is indicative of a true performance sensitivity. Additional testing will provide a basis for overall system repeatability and measurement accuracy.
• Review test results to determine specific combinations of factors that cause subsystem shutdowns and make necessary control modifications. An example is the Sabatier separator attempt to empty at vacuum pressure. This protocol was corrected in the Sabatier flight software.
• Perform testing over a more robust range of operating conditions. The wider the acceptable operating range, the more flexibility for future loop closure.
4.2 Recommended Future Hardware Development
4.2.1 Subsystem Development
These are some possible development tasks that would result in improvements in ESM and reliability based on the results of the completed testing. Additional improvements may be discovered as a result of additional future testing outlined above.
• Develop a heater ramp algorithm for the 4BMS that will save power, yet accomplish the CO2 desorption needed.
83

• Develop isolation mechanism and associated control to prevent room air humidity from entering TSAC beds.
• Improve heat transfer design of the TSAC and the 4BMS in order to reduce power usage by investigating the following factors:
o Arrangement of heaters and cooling ducts to minimize the thermal mass; o New adsorbents or adsorbent structures with reduced thermal resistance; o Improved package insulation; and o Flexibility in design to allow utilization of waste heat.
• Design TSAC for moisture management which may include system isolation, moisture sensing and on-line regeneration.
• Improve TSAC controls which allow flexibility in startup, operation and shutdown, and allow better subsystem communication and synchronization.
• Implement adaptive software which will allow optimization of product delivery based on previous cycle loading, purge control, compression time, and available power.
• Develop subsystems that are modular, that operate more efficiently at reduced loading and can be stacked for higher loading.
• Develop low volume, lightweight, high temperature components. • Continue development of the LPCOR system that combines the CO2 removal and
CO2 compression functions of the 4BMS and TSAC. • Through modeling or testing, evaluate the impact of different cycle times for the
4BMS and Sabatier. Determine if there is an optimum cycle time for each that minimizes the accumulator volume and/or overall system power.
• Evaluate the impact of powering the 4BMS heaters to control bed pressure rather than temperature.
• Evaluate the length of vacuum desorb time needed to fully clear the 4BMS beds if the bed is pressure controlled prior to desorption.
• Determine the water recovery cost/benefit as a result of higher or lower Sabatier operating pressure, and the associated system level impacts.
4.2.2 Component Development
• Consider all operating and non-operating conditions (such as temperature and pressure extremes) when designing components.
• Test flight-like Sabatier reactor to determine if the temperature sensors are sensitive enough to detect excessive air in the CO2 as was noted with the EDU reactor.
• Develop a liquid cooled Sabatier phase separator for maximum water recovery.
4.2.3 Controls Development
• Improve communication links between integrated subsystems for synchronizing cycles and reporting system anomalies and shutdowns.
• Improve mechanical compressor operating logic to minimize short cycles and reduce starvation at low CO2 loading.
84

• Improve operating rules for 4BMS vent valve to minimize cycles on the valve. • Develop protocols for verification of accuracy of key measurement sensors. • Develop software protocols that prevent propagation of failures to other systems,
and the ability to operate independently if needed. • Evaluate system triggers that initiate logic decisions and exercise them over the
widest practical range of operating conditions. This will prevent issues such as rapidly cycling caused by pressure dead bands.
• Develop controls protocols that can be adjusted by crew intervention or by “smart” controls. This will allow a system to acclimate to its environment (for example, microgravity) and make necessary adjustments.
• Design software logic such that sequences are completed before subsequent operating state changes are allowed to occur. Checks should be incorporated to verify that procedures (such as purges) are completed.
• Design software such that all conditions are met before transitions occur. Careful testing over a wide range of operating conditions is needed to locate errors in code.
• Optimize Sabatier/TSAC pressure control logic and operating limits for transitions between Process and Standby that are based on TSAC delivery pressure.
• Develop protocols for leak checking components in their operating environment so that so that non-operating conditions (temperature or pressure) do not mask the detection of leakage.
85

5 Appendices
Calculations This section details the calculations used to evaluate the performance of the subsystems during the Integrated Test Program. Raw Data – Sensor for Mechanical test only in green, for TSAC test only in red, for both tests in black. Tag Name Units CDPGas124 4BMS Inlet Air CO2 Concentration %CO2 CDPGas125 4BMS Outlet Air CO2 Concentration %CO2 AFCGas126 Lab Air CO2 Concentration %CO2 CDPDP_120 4BMS Inlet Air Dewpoint F CDPDP_121 4BMS Outlet Air Dewpoint F AFcDP_120 Lab Air Dewpoint F CDPTmp120 4BMS Inlet Air Temperature F CDPTmp121 4BMS Outlet Air Temperature F AFcTmp120 Lab Air Temp. Middle F CDPmt13 5A Bed 308 Heater Temp A F CDPmt14 5A Bed 308 Heater Temp B CDPmt16 5A Bed 309 Heater Temp A F MSAFlw022 Lab CO2 Inject Flowrate SLPM CDPMpde 4BMS Operating Mode
0OF 1SH 2A1 3A2 4A3 5B1 6B2 7B3 8WP CDPmw12 5A Bed 308 Primary Heater Power Watt CDPmw13 5A Bed 309 Primary Heater Power Watt CDPmw14 5A Bed 308 Secondary Heater Power Watt CDPmw15 5A Bed 309 Secondary Heater Power Watt CDPFlw121 4BMS Inlet Air Flowrate (TSI Meter) SCFM CDPTmp086 4BMS Precool Inlet H2O Temp F CDPFlw080 4BMS Precooler Inlet H2O Flow GPM CDPPrs120 4BMS Inlet Air Pressure PSIA CDPPrs122 4BMS Outlet Air Pressure PSIA CDPDP_023 Dessicant Bed Outlet Air Dewpt F MSAMas020 Facility CO2 Tank Weight Lbs CDPPrs021 Fac Vacuum Tank Air Inlet Pressure Torr CDPPrs023 CDPPrs022 Fac Vacuum Tank Air Pressure Torr CDPPrs024 CDPmt11 Desiccant Bed Outlet Temperature F THCFlw120 THC CHX Outlet Air Flowrate SCFM VenFlw120 CDPPrs123 Sorbent bed 308 pressure PSIA CDPTmp125 Desiccant bed 104 Outlet Air Temp F CDPFlw120 4BMS Inlet Air Flowrate (Sierra Meter) SCFM CDPFacClk 4BMS cycle Elapsed Time CDPmdns 4BMS Day/Night Status AfcPrs120 Lab Pressure PSIA MSAFlw023 Lab High CO2 Inject Flowrate LBS/HR CDPPrs121 Precooler Outlet to Ambient PSIA CDPTemp133 Precooler Inlet Air Temp Deg F MSA3WV020 0 is Inlet 1 is THC CDPmp12 Pump Inlet Air Pressure PSIA CDPVlt120 2-Stage Pump (Air Save) Voltage Volts CDPCur120 2-Stage Pump (Air Save) Current Amps CDPmp10 Blower Delta Pressure In H2O CDPmz16 CDPTmp640
86

Tag Name Units CDPSpr003 MEDDP_020 Mechanical Compressor Outlet Dewpoint F MEDFlw020 Compressor Outlet Flow after DP lb/hr MEDPrs020 Compressor Inlet Pressure PSIA MEDTmp020 Manifold Outlet or Crankcase HX inlet F MEDTmp021 Crankcase HX Outlet or CP HX inlet F MEDTmp022 Manifold Inlet F MEDTmp023 Cold Plate Outlet F MEDTmp024 Crankcase External Motor End F MEDTmp025 Lower Guide Cylinder Stage 1 Motor End F MEDTmp026 Crossover Head Stage 1 Motor End F MEDTmp027 Crossover Head Stage 2 F SEDCO2 cmd Sabatier CO2 Command SLPM MEDFlw021 Sabatier CO2 Flow SLPM SEDMFM006 SEDCompressor Compressor command 1=on 0=off TSAF prod TSAC outlet CO2 flowrate Sccm TSAP1 Bed A Internal pressure Torr TSAP2 Bed B internal pressure Torr TSAExtWalA Bed A External Wall Temperature C TSAHA1 Bed A Heater 1 Temperature C TSAHA3 Bed A Heater 3 Temperature C TSATouchA Bed A Touch Temperature C TSAExtWalB Bed B External Wall Temperature C TSATouchB Bed B Touch Temperature C TSAHB1 Bed B Heater 1 Temperature C TSAHB3 Bed B Heater 3 Temperature C TSAPower Heater power for Bed A and Bed B Watts TSAF cdra TSAC Inlet CO2 flowrate Sccm TSAAirInA Bed A Cooling Air Inlet Temperature C TSAAirInB Bed b Cooling Air Outlet Temperature C TSAAirOutA Bed A Cooling Air Inlet Temperature C TSAAirOutB Bed A Cooling Air Outlet Temperature C TSAP cdra Inlet pressure Torr SEDP106 H2 Inlet pressure Psia SEDH2_SP_ent OGA H2 setpoint SEDP002 CDRA pressure psia SEDCRA READY Status 1=on 0=off SEDCurrent Current from OGA 0-4095 counts 0-100 Amps SEDDP405 Reactor Delta Pressure PSID SEDDP409 Separator Delta Pressure "H2O
PSID SEDEOGAREADY Ethernet write 1=on 0=off SEDH2 cmd SLPM SEDHtr A 1=on 0=off (Y20) SEDHtr B 1=on 0=off (Y21) SEDMas020 Sabatier EDU Water Grams SEDMFC H2 Mass Flow SLPM SEDMolar User selected molar ratio SEDOGA READY Status 1=on 0=off SEDP000 Compressor suction Pressure PSIA
CDRA Pressure MEDPrs021 Accumulator Pressure or CO2 inlet PSIA SEDP006 Reactor inlet pressure PSIA SEDP206 Nitrogen inlet pressure PSIA SEDP304 Product water pressure PSIA SEDP601 Reactor outlet pressure PSIA SEDProcess Process Mode (C102) SEDPUMP301 Water pump 1=on 0=off SEDSEP_run SEDPurge Purge Mode SEDstby_purge SEDReactCool 501 Cooling Air Valve 1=closed 0=open SEDSVO501 SEDShutdown Shutdown Mode SEDStandby Standby Mode
87

Tag Name Units SEDStop Stop Mode SEDASD SEDT CHXout A Heat Exchanger Outlet Temperature degF SEDT407-1 SEDT CHXout B Heat Exchanger Outlet Temperature degF SEDT407-2 SEDT React A Reactor Hot Zone degF SEDT403_1 Reacto Temperature 1 SEDT React B Reactor Hot Zone degF SEDT403_2 Reacto Temperature 2 SEDT React C Reactor Inlet degF SEDT403_3 Reacto Temperature 3 SEDT React D Reactor Inlet degF SEDT403_4 Reacto Temperature 4 SEDT React Out Reactor Outlet degF SEDT404_1 CDPSV_160 Vacuum Solenoid CDPSV_640 (0 Closed 1 Open) TSAC CDPSV_641 (0 Closed 1 Open) Space Vacuum CDPSV_642 (0 Closed 1 Open) MPC CDPmz16 Valve Pos. 209 (T = Ener. = B Pos.) Volt CDPTmp640 Re-positional Instr. Cluster Temp F CDPSpr003 Sabatier Inlet Hydrogen Flowrate SLPM SEDFCV003_cmd CO2 flow command SLPM SEDsep_spd Separator speed Rpm SEDfan Cooling fan status SEDMFC103_cmd H2 flow command SEDH402_1 Heater status SEDsep_curr Separator current Amps SEDMas020 Sabatier EDU Water Grams SEDMFC103 Actual hydrogen flow SLPM SEDmolar_ratio User selected molar ration
88

Calculated Data for Mechanical Compressor Test Name Units Calculation
(current time – initial time) *24 Time Hours (inlet air CO2 concentration/100 * inlet air pressure) *760/14.7 mmHg FMG62 4BMS Inlet Air
CO2 Pressure (inlet CO2 pressure/air pressure) * (flow*60) * 14.7*144 *44 / (R * (T+460)) CO2 in lb/hr (outlet air CO2 concentration/100 * inlet air pressure) *760/14.7 FFG69 4BMS Outlet Air
CO2 Pressure mmHg
(outlet CO2 pressure/air pressure) * (flow*60) * 14.7*144 *44 / (R * (T+460)) CO2 out lb/hr CO2 rate in – CO2 rate out 4BMS CO2 Removal
Rate lb/hr
(lab air CO2 concentration/100 * inlet air pressure) *760/14.7 FMG10 Lab Air CO2 Pressure
mmHg
1-CO2 out/CO2 in 4BMS CO2 Removal Fraction
Sum of 4 heaters, bed 308, 309 primary and secondary Total Heater Power Watts Total Watts Sum of 4 heaters plus air save pump power
Dew point converted to saturation pressure FMD13 Desiccant bed outlet
mmHg
Air flow rate * sat pressure * 18 * 14.7 * 144 / (760 * R * (T +460)) H2O lost lb/min Pump voltage * current (> 0) Air-Save Pump Power, Watts CO2 injection (slpm) * 0.035315 CO2 Injection scfm (CO2 injection flow * (1- outlet CO2 %))/((inlet – outlet CO2%)/100) Flow Rate from CO2
injection Scfm
Pump inlet air pressure / 2 CDPmp12 Pump Inlet Air Pressure corrected
torr
Bed 308 pressure psi * 760 / 14.7 CDPPrs123 Sorbent bed 308 pressure
torr
Pump inlet pressure psi *760 / 14.7 CDPmp12 Pump Inlet Air Pressure
torr
Dewpoint degrees F converted to C CDPDP_023 Dessicant Bed Outlet Air Dewpt
C
Dewpoint degrees F converted to C CDPDP_120 4BMS Inlet Air Dewpoint
C
Dewpoint degrees F converted to C CDPTmp120 4BMS Inlet Air Temperature
C
CRA ready status + 10 CRA Ready (11=on 10=off)
SEDH2_SP_ent / 10 OGA Current/10 TSAPower / 10 TSAC Power/10 OGA ready status + 8 OGA Ready (9=on 8=off) Compressor status + 12 Compressor Status
(13=on 12=off)
Corrected H2 flow / Sabatier CO2 flow Calc MR from Actual Flow
Recorded data * slope + offset H2 Rate adjusted, (@0°C)
SLPM
H2 flow/ 22.4 / 2 * 18 * timestep + previous summed value Calc H2O Prod @ 100% Eff
gram
Calculated 100% efficient water * 0.9 Calc H2O Prod @ 90% Eff
gram
Calculated 100% efficient water * 0.8 Calc H2O Prod @ 80% Eff
gram
Actual water produced / calculated 100% efficient water * 100 H2O Prod Efficiency (valid with W/D calc)
%
Current mass water (scale) – initial mass water H2O Production grams H2 flow * timestep + previous summed value H2 Useage Rate Liters Day night status + 6 Day/Night Status (7=day,
6=night)
H2 flow / selected molar ratio Desired CO2 Flow (SLPM) =1 when OGA ready is true and Sabatier is standby Starvation (Standby
when OGA Ready)
=1 if 4BMS mode is 3 and pump inlet pressure > 11.5 4BMS CO2 Dump in A2 (mp12>7.95 and segment=A2)
89

Name Units Calculation 4BMS CO2 Dump in A2 (mp12>7.95 and segment=B2)
=1 if 4BMS mode = 6 and pump inlet pressure > 11.5
CEDU Cycle Counter (flag step changes)
Checks for change in CEDU status from one time step to next
Water Dump Event Checks for water mass change > 17 grams from one time step to next
Subsystem Efficiency Calculations 4BMS 4BMS CO2 Removal Rate (lb/hr) = CO2 Inlet (lb/hr) – CO2 Outlet (lb/hr) 4BMS CO2 Removal Efficiency = 1- CO2 Inlet (lb/hr)/CO2 Outlet (lb/hr) Sabatier H2 Usage = Average H2 Flow * Total time of test Theoretical Water Production Rate = H2 Usage / 22.4 / 2 * 18 Actual Water Production Rate = Scale reading at end of test – scale reading at beginning of test Sabatier Water Recovery Efficiency = Actual Water Production / Theoretical Water Production *100
90
5.2
App
endi
x D
ata
Plot
s
5.2
.....
......
......
......
......
......
......
......
......
......
......
......
......
......
......
......
......
......
......
......
......
......
......
......
......
......
..... 5
-1
App
endi
x D
ata
Plot
s5.
2.1
......
......
......
......
......
......
......
......
......
......
......
......
......
......
......
......
......
......
......
......
......
......
......
......
......
......
......
.... 5
-6
Intro
duct
ion
5.2.
2 ...
......
......
......
......
......
......
......
......
......
......
......
......
......
......
......
......
......
......
......
......
......
......
......
......
......
16
4BM
S B
asel
ine
Cas
e5.
2.3
.....
......
......
......
......
......
......
......
......
......
......
......
......
......
......
......
......
......
......
......
......
......
... 2
8 A
dditi
onal
4B
MS
Bas
elin
e C
ase
5.2.
4 ...
......
......
......
......
......
......
......
......
......
......
......
......
......
......
......
......
......
......
......
. 31
Mec
hani
cal C
ompr
esso
r Sta
nd A
lone
Cas
e5.
2.5
......
......
......
......
......
......
......
......
......
......
......
......
......
......
......
......
......
......
......
......
......
......
......
... 4
0 4B
MS/
CED
U B
asel
ine
Cas
e5.
2.6
......
......
......
......
......
......
......
......
......
......
......
......
......
......
......
......
......
......
......
......
......
.....
48
Saba
tier S
tand
alon
e B
asel
ine
Cas
e5.
2.7
.....
......
......
......
......
......
......
......
......
......
......
......
......
......
......
......
......
......
......
. 67
4BM
S/C
EDU
/Sab
atie
r Ful
ly In
tegr
ated
Cas
e5.
2.8
......
......
......
......
......
......
......
......
......
......
......
......
......
......
......
......
......
......
......
. 81
4BM
S/TS
AC
/Sab
atie
r Ful
ly In
tegr
ated
Cas
e Fi
gure
1 -
Det
aile
d Sc
hem
atic
of 4
BM
S w
ith se
nsor
loca
tions
iden
tifie
d. ...
......
......
......
......
......
......
......
......
......
......
......
......
......
......
......
. 5-7
Fi
gure
2 -
Det
aile
d Sc
hem
atic
of S
abat
ier E
DU
use
d in
Mec
hani
cal C
ompr
esso
r Tes
t with
sens
or lo
catio
ns id
entif
ied.
.....
......
......
.... 5
-8
Figu
re 3
- Sc
hem
atic
of I
nteg
rate
d Te
st w
ith M
echa
nica
l Com
pres
sor w
ith se
nsor
loca
tions
iden
tifie
d. ..
......
......
......
......
......
......
......
.. 5-9
Fi
gure
4 -
Sche
mat
ic o
f Sab
atie
r ED
U u
sed
with
TSA
C te
stin
g w
ith se
nsor
loca
tions
iden
tifie
d. ...
......
......
......
......
......
......
......
......
.... 5
-10
Figu
re 5
- Sc
hem
atic
of I
nteg
rate
d Te
st w
ith T
SAC
with
sens
or lo
catio
ns in
dent
ified
. ....
......
......
......
......
......
......
......
......
......
......
......
. 5-1
1 Ta
ble
1 –
Sens
ors i
n th
e 4B
MS .
......
......
......
......
......
......
......
......
......
......
......
......
......
......
......
......
......
......
......
......
......
......
......
......
......
......
.... 1
2 Ta
ble
2 - S
enso
rs in
the
Saba
tier E
DU
.....
......
......
......
......
......
......
......
......
......
......
......
......
......
......
......
......
......
......
......
......
......
......
......
......
13
Tabl
e 3
- Sen
sors
in th
e M
echa
nica
l Com
pres
sor ..
......
......
......
......
......
......
......
......
......
......
......
......
......
......
......
......
......
......
......
......
......
.... 1
4 Ta
ble
4 - S
enso
rs in
the
Tem
pera
ture
Sw
ing
Ads
orpt
ion
Com
pres
sor ..
......
......
......
......
......
......
......
......
......
......
......
......
......
......
......
......
... 1
4
5.2.
1 In
trod
uctio
n Th
is d
ocum
ent d
escr
ibes
the
test
dat
a co
llect
ed fr
om th
e in
tegr
ated
test
pro
gram
. Dat
a w
as c
olle
cted
from
all
of th
e op
erat
ing
syst
ems.
Diff
eren
t dat
a se
ts a
re p
lotte
d fo
r diff
eren
t com
bina
tions
of s
yste
ms.
The
follo
win
g gr
aphs
are
repr
esen
tativ
e da
ta se
ts fr
om th
e di
ffer
ent c
ases
that
wer
e ru
n.
91

P T DPCO2
Cabi
nAt
mos
pher
e
CO 2
VENT
P
T
T
RESI
DUAL
AIR
RET
URN
LINE
CHEC
KVA
LVE
DESI
CCAN
T
OUTL
ET
VAL
VE
DESI
CCAN
T BE
D
INLE
T AI
RSE
LECT
ORVA
LVE
GE
L S
ILIC
A
s T s T
s T s T
P
BLOW
ERP
T
ACCU
MUL
ATO
R CO
2
P 2
CO
PU
MP
CO SELE
CTOR
VALV
E
2
CO S
ORBE
NT B
ED
2 EL
ECTR
ICAL
HEAT
ER
HX
PRE-
COOL
ER
WAT
ER
T T
T S
CO S
ORBE
NT B
ED
2
T
P T
TO V
ACU
UM
S
P
T S AI
R IN
LET
POIS
T FO
UR B
ED M
OLEC
ULAR
SIE
VE
P =
PRES
SURE
SEN
SOR
DP=
DEW
POI
NT S
ENSO
RT
= TE
MPE
RATU
RE S
ENSO
RS
= SA
MPL
E PO
RT
= SE
LECT
OR V
ALVE
= CA
RBON
DIO
XIDE
SEN
SOR
308
309
DPDP
CO2
CO2 CO
2
AIR
RETU
RN
DESI
CCAN
T BE
D
CDP-
Gas
124
CD
PGas
125
AFc
Gas
126
CDPD
P_12
0 CDPD
P_12
1,12
2
AFc
DP_1
20
CDP-
Tmp1
20
T CD
PTm
p121
AFc
Tmp1
20
CDPT
mp0
86
P
CDP-
Prs1
20
AFcP
rs12
0
CDPD
P_02
3
CDP-
mt1
1
CD
PPrs1
23
CDPT
mp1
25
CDP-
mt1
2
MSA
Flw
022
Lab
CO
2 In
ject
ion
Flow
rate
CDPP
rs022
Vac
m T
nk In
let P
ress
CDPP
rs02
3 V
acm
Tnk
Pre
ss
MSA
Mas
020
CO
2 Ta
nk W
eight
CO2
Inje
ctio
n
MSA
Flw
023
La
b C
O2
Inje
ctio
n Fl
owra
te
Cycl
e Inf
o
CDPm
dns
Day
/Nig
ht S
tatu
sCD
Pfcd
ck
Cycl
e Ela
psd
Tim
e
Proc
ess A
ir Fl
owra
te
CD
PFlw
120
Inle
t Air
Flow
rate
(Sie
rra)
CDPF
lw12
1 In
let A
ir Fl
owra
te (T
SI)
Pre
Cool
er W
ater
Flo
wrate
CDPF
lw08
0
Pre
Cool
er W
ater
Flo
wrat
e
Com
pone
nt P
ower
CDPm
w10
Vac
uum
Pum
p Po
wer
CDPm
w12
30
8 Be
d Pr
imar
y H
eate
r Pow
erCD
Pmw
13
309
Bed
Prim
ary
Hea
ter P
ower
CDPm
w14
308
Bed
Sec
onda
ry H
eate
r Pow
erCD
Pmw
15 3
09 B
ed S
econ
dary
Hea
ter P
ower
P
T
CDP-
Tmp0
87
CDPT
mp1
27
CDP-
Tmp1
28
CDPT
mp1
30CD
PTm
p129
CDPm
t-13,
14,1
5
CDPm
t 16,
17, 1
8
CDPm
p10
CDP-
mp1
1
516
514
515
513
512
CDP-
mp1
2CD
P-m
t92
511
CDP-
mp1
3CDPm
p14
CDPm
t91
F=
FLOW
MET
ER
FF
CD
PTm
p133
CDPF
lw12
0
517
CDPm
z11
CDP-
mz1
0
CDPm
z12
CDP-
mz1
3
CDP-
mz1
4
CDPm
z16
CDP-
mz1
5
F CD
PFlw
080
CDPF
lw12
1
DP P CDPm
t10
CDPP
rs122
CDPP
rs121
CDPT
mp1
26
Figu
re 1
- D
etai
led
Sche
mat
ic o
f 4B
MS
with
sens
or lo
catio
ns id
entif
ied.
92

SAB
ATIE
RR
EAC
TOR
CO
ND
ENSI
NG
HEA
TEX
CH
ANG
ER
T
P
CG
CG
CO
NTR
OLL
ERA
ND
EIB
N2
IN
CO
2 IN
H2
IN
CH
4 VE
NT
H2O
OU
T
LF CV
MFC
PP
P
T
T
Δ P
MV2
02
SVO
203
CV
204
F201
F001
P00
2FC
V003
CV
004
MFM
MFM
005
P006
F101
SVC
102
MFC
103
CV1
04
R40
1
H40
2
T403
DP
405
T404 SVO
501
FAN
502
T407 ST
408
DP4
09
PUM
P30
1
SVC
303
P304
P601
RV
602
SVO
604
RV6
03SV
O60
5
BPR
606
FR60
7
SVO
608
CG
411
CG
412
P206
FR20
5
HX4
06
TTT
RV4
10
SVC
007
P
T
Δ P
MV
609
Saba
tier E
ngin
eerin
g D
evel
opm
ent U
nit
SVL1
8383
MV
105
6/25
/04
CV
305
F406
SAB
ATIE
RR
EAC
TOR
CO
ND
ENSI
NG
HEA
TEX
CH
ANG
ER
T
P
CG
CG
CO
NTR
OLL
ERA
ND
EIB
N2
IN
CO
2 IN
H2
IN
CH
4 VE
NT
H2O
OU
T
LF CV
MFC
PP
P
T
T
Δ P
MV2
02
SVO
203
CV
204
F201
F001
P00
2FC
V003
CV
004
MFM
MFM
005
MFM
MFM
005
MFM
MFM
005
P006
F101
SVC
102
MFC
103
CV1
04
R40
1
H40
2
T403
DP
405
T404 SVO
501
FAN
502
T407 ST
408
DP4
09
PUM
P30
1
SVC
303
P304
P601
RV
602
SVO
604
RV6
03SV
O60
5
BPR
606
FR60
7
SVO
608
CG
411
CG
412
P206
FR20
5
HX4
06
TTT
RV4
10
SVC
007
SVC
007
P
T
Δ P
MV
609
Saba
tier E
ngin
eerin
g D
evel
opm
ent U
nit
SVL1
8383
MV
105
6/25
/04
CV
305
F406
Fi
gure
2 -
Det
aile
d Sc
hem
atic
of S
abat
ier
ED
U u
sed
in M
echa
nica
l Com
pres
sor
Tes
t with
sens
or lo
catio
ns id
entif
ied.
93

CD
RA
To V
acuu
mV20
9A
ir Sa
veV
200
LMS
Spac
e V
acuu
mSi
mul
ator
PT
TP1
V2
V3
Acc
um
Faci
lity
Ven
tD
ew
Poin
t
HV
1
HV
2
BPR
V1
FM1
TP2 H
V3
CO
2B
ottle
Sab
ED
U
HV
4
BPR
V2
SVC
007
PTP0
02
N2
H2O
pro
duct
to w
eigh
t sc
ale
Vac
uum
ven
t
RV
@15
0 ps
ia HV
5
PG
Ven
turi
Vac
Ven
t
H2
Bottl
e/re
gula
tor
H2
Bottl
e/re
gula
tor
CO
2
Coo
lant
in/o
ut
FM2
Coo
lant
in/o
ut
FM2
HV
6
P000
CD
RA
To V
acuu
mV20
9A
ir Sa
veV
200
LMS
Spac
e V
acuu
mSi
mul
ator
PTPT
TP1
TP1
V2
V3
Acc
umA
ccum
Faci
lity
Ven
tD
ew
Poin
t
HV
1
HV
2
BPR
V1
FM1
TP2
TP2 H
V3
CO
2B
ottle
Sab
ED
U
HV
4
BPR
V2
SVC
007
PTPTP0
02
N2
H2O
pro
duct
to w
eigh
t sc
ale
Vac
uum
ven
t
RV
@15
0 ps
ia HV
5
PGPG
Ven
turi
Vac
Ven
t
H2
Bottl
e/re
gula
tor
H2
Bottl
e/re
gula
tor
CO
2
Coo
lant
in/o
ut
FM2
Coo
lant
in/o
ut
FM2
HV
6
P000
Fi
gure
3 -
Sche
mat
ic o
f Int
egra
ted
Tes
t with
Mec
hani
cal C
ompr
esso
r w
ith se
nsor
loca
tions
iden
tifie
d.
94

SAB
ATIE
RR
EAC
TOR
CO
ND
ENSI
NG
HEA
TEX
CH
ANG
ER
T
P
CG
CG
CO
NTR
OLL
ERA
ND
EIB
N2
IN
CO
2 IN
H2
IN
CH
4 VE
NT
H2O
OUT
MFC
PP
P
MFM
T
ΔP
MV2
02
SVO
203
CV2
04F2
01
F001
P002
FCV
003
CV0
04
MFM
005
P006
-1
F101
SVC
102
MFC
103 CV1
04
R40
1
H40
2
T403
-1,-8
DP4
05
T404
-1,-2
SVO
501
FAN
502
T407
-1,-2
DP4
09-1
,-2
CV3
05
P304
P601SV
O60
4
BPR
606
SVO
608
CG
411
CG
412
P206
FR20
5H
X406
TSV
C00
7P
ΔP
MV1
05
ΔP
DR
UM
SEPA
RAT
OR
AN
DPU
MP
L
SVC
303
TT
CO
LD P
LATE
CO
OLA
NTIN
/OU
T
T
PP106
P006
-2
Man
ual F
ill P
ort
RV2
07
RV0
09
RV1
07
P L602
CP3
01
T413
-1,-2
SEP
411
FR60
7
TT
TT
TT
TT
NN
414
TTT4
10-1
,-2
Gas
Sam
ple
Por
t
BED
412
Gas
Sam
ple
Por
t
Fi
gure
4 -
Sche
mat
ic o
f Sab
atie
r E
DU
use
d w
ith T
SAC
test
ing
with
sens
or lo
catio
ns id
entif
ied.
95

CD
RA
To V
acuu
mV20
9A
ir Sa
veV
200
LMS
Spac
e V
acuu
mSi
mul
ator
V2
Faci
lity
Ven
tSab
ED
U
N2
H2O
pro
duct
to w
eigh
t sc
ale
Vac
uum
ven
t PG
Ven
turi
Vac
Ven
t
H2
Bottl
e/re
gula
tor
H2
Bottl
e/re
gula
tor
CO
2 in
let
TSA
C
CD
RA
To V
acuu
mV20
9A
ir Sa
veV
200
LMS
Spac
e V
acuu
mSi
mul
ator
V2
Faci
lity
Ven
tSab
ED
U
N2
H2O
pro
duct
to w
eigh
t sc
ale
Vac
uum
ven
t PGPG
Ven
turi
Vac
Ven
t
H2
Bottl
e/re
gula
tor
H2
Bottl
e/re
gula
tor
CO
2 in
let
TSA
C
Fi
gure
5 -
Sche
mat
ic o
f Int
egra
ted
Tes
t with
TSA
C w
ith se
nsor
loca
tions
inde
ntifi
ed.
96

Tab
le 1
– S
enso
rs in
the
4BM
S Se
nsor
D
esig
natio
n Se
nsor
Des
crip
tion
Sens
or
Des
igna
tion
Sens
or D
escr
iptio
n C
DPT
mp1
26
Port
514
Inte
rnal
Des
icca
nt B
ed 1
Te
mp.
C
DPD
P_02
3 D
essi
cant
Bed
Out
let A
ir D
ewpt
C
DPT
mp1
27
Port
515
Inte
rnal
Des
icca
nt B
ed 1
Te
mp.
C
DPD
P_12
0 4B
MS
Inle
t Air
Dew
poin
t C
DPF
lw08
0 4B
MS
Prec
oole
r Inl
et H
2O F
low
C
DPT
mp1
28
Port
516
(mt9
8) D
esic
cant
Bed
1
CD
PFlw
120
4BM
S In
let A
ir Fl
owra
te (S
ierr
a)
CD
PTm
p129
Po
rt 50
3 So
rben
t Bed
Inte
rnal
Tem
p.
CD
PFlw
121
4BM
S In
let A
ir Fl
owra
te (T
SI)
CD
PTm
p130
Po
rt 50
4 So
rben
t Bed
Inte
rnal
Tem
p.
CD
Pmw
12
5A B
ed 3
08 P
rim. H
eate
r Pow
er
CD
PTm
p133
Pr
ecoo
ler I
nlet
Air
Tem
p C
DPm
w13
5A
Bed
309
Prim
. Hea
ter P
ower
M
SAFT
_022
To
tal C
O2
Add
ed L
C
DPm
w14
5A
Bed
308
Sec
. Hea
ter P
ower
M
SAFT
_023
To
taliz
e C
DPF
lw02
3 C
DPm
w15
5A
Bed
309
Sec
. Hea
ter P
ower
A
FcD
P_12
0 La
b A
ir D
ewpo
int (
1)
CD
PPrs
021
Fac
Vac
uum
Tan
k C
O2
Inle
t Pre
ssur
e C
DPP
rs02
0 fe
edba
ck d
elta
pre
ssur
e C
DPP
rs02
2 Fa
c V
acuu
m T
ank
CO
2 Pr
essu
re
CD
PTm
p020
Sp
ace
Sim
ulat
or T
ank
In
CD
PPrs
120
4BM
S In
let A
ir Pr
essu
re
THC
Tmp0
84
THC
HX
Chi
ll In
C
DPP
rs12
1 Pr
ecoo
ler O
utle
t to
Am
bien
t TH
CTm
p085
TH
C H
X C
hill
Out
C
DPP
rs12
2 4B
MS
Out
let A
ir Pr
essu
re
THC
Tmp1
20
THC
CH
X In
let A
ir Te
mp.
C
DPT
mp0
86
4BM
S Pr
ecoo
ler I
nlet
H2O
Tem
p TH
CTm
p121
TH
C C
HX
Out
let A
ir Te
mp.
C
DPT
mp1
20
4BM
S In
let A
ir Te
mp.
A
FcPr
s120
M
odul
e Pr
essu
re (1
) M
SAFl
w02
2 La
b Lo
w C
O2
Inje
ct F
low
rate
A
FcTm
p120
La
b A
ir Te
mp.
Mid
dle
(1)
MSA
Flw
023
Lab
Hig
h C
O2
Inje
ct F
low
rate
A
FcTm
p121
C
AB
IN F
RO
NT
TEM
P (1
) M
SAM
as02
0 Fa
cilit
y C
O2
Tank
Wei
ght
AFc
Tmp1
22
CA
BIN
BA
CK
TEM
P (1
) TH
CFl
w12
0 TH
C C
HX
Out
let A
ir Fl
owra
te
HB
_Prs
220
Hig
h B
ay P
ress
ure
(1)
CD
PTm
p121
4B
MS
Out
let A
ir Te
mp.
H
B_T
mp2
20
Hig
h B
ay T
emp.
(1)
AFc
Tmp1
20
Lab
Air
Tem
p. M
iddl
e (1
)
CD
PCur
120
CO
2 Pu
mp
Cur
rent
C
DPV
lt120
C
O2
Pum
p V
olta
ge
CD
Pmp1
0 D
iff. F
an 3
03
CD
PPrs
123
Sorb
ent b
ed 3
08 p
ress
ure
CD
PTm
p087
C
DR
A C
hill
H2O
Out
C
DPT
mp1
21
4BM
S O
utle
t Air
Tem
p.
CD
PTm
p125
D
esic
cant
bed
104
Out
let A
ir Te
mp
97

Sens
or D
esig
natio
n Se
nsor
Des
crip
tion
Tab
le 2
- Se
nsor
s in
the
Saba
tier
ED
U
Sens
or D
esig
natio
n Se
nsor
Des
crip
tion
SED
PUM
P301
W
ater
pum
p 1=
on 0
=off
(Y22
) SE
DPu
rge
Purg
e M
ode
(C10
4)
SED
CO
2_cm
d_00
3 C
O2
Com
man
d 0-
4095
cou
nts
Coo
ling
Air
Val
ve 1
=clo
sed
0=op
en (Y
31)
SED
CO
2_Fl
ow_0
05
CO
2 M
ass F
low
(V14
14)
SED
Rea
ctC
ool_
501
Com
pres
sor c
omm
and
1=on
0=
off (
Y24
) SE
DC
ompr
esso
r SE
DSh
utdo
wn
Shut
dow
n M
ode
(C10
0)
SED
Stan
dby
Stan
dby
Mod
e (C
101)
SE
DC
RA
REA
DY
C
RA
Sta
tus 1
=on
0=of
f (Y
23)
SED
Stop
St
op M
ode
(C10
3)
SED
CR
AR
EAD
Y
CR
A S
tatu
s 1=o
n 0=
off (
C13
1)3
Hea
t Exc
hang
er O
utle
t Te
mpe
ratu
re (V
1435
) SE
DC
urre
nt f
OG
A
0-40
95 c
ount
s 0-1
00 A
mps
(V
1551
) SE
DT
CH
Xou
t_A
H
eat E
xcha
nger
Out
let
Tem
pera
ture
(V14
36)
SED
DP4
05
Rea
ctor
Del
ta P
ress
ure
(V14
00)
SED
T C
HX
out_
B
SED
DP4
09
Sepa
rato
r Del
ta P
ress
ure
(V14
01)
SED
T R
eact
_A
Rea
ctor
Hot
Zon
e (V
1430
) SE
DEO
GA
REA
DY
Et
hern
et w
rite
1=on
0=o
ff (C
135)
SE
DT
Rea
ct_B
R
eact
or H
ot Z
one
(V14
31)
H2
Com
man
d 0-
4095
cou
nts
(V14
20)
SED
H2_
cmd_
103
SED
T R
eact
_C
Rea
ctor
Inle
t (V
1432
) SE
DT
Rea
ct_D
R
eact
or In
let (
V14
33)
SED
Htr_
A
Hea
ter A
1=o
n 0=
off (
Y20
) SE
DT
Rea
ct_O
ut
Rea
ctor
Out
let (
V14
34)
SED
Htr_
B
Hea
ter B
1=o
n 0=
off (
Y21
)
Prod
uct w
ater
wei
ght s
cale
SE
DM
as02
0 Sa
batie
r ED
U W
ater
SED
MFC
_103
_dat
a H
2 M
ass F
low
(V14
15)
SED
Mol
ar ra
tio__
U
ser s
elec
ted
mol
ar ra
tio (V
1660
) SE
DO
GA
REA
DY
O
GA
Sta
tus 1
=on
0=of
f (X
104)
SE
DO
GA
REA
DY
O
GA
Sta
tus 1
=on
0=of
f (C
130)
C
ompr
esso
r suc
tion
Pres
sure
(V
1554
) SE
DP0
00
Acc
umul
ator
Pre
ssur
e or
CO
2 in
let (
V14
02)
SED
P002
SE
DP0
06
Rea
ctor
inle
t pre
ssur
e (V
1403
) SE
DP2
06
Nitr
ogen
inle
t pre
ssur
e (V
1404
) SE
DP3
04
Prod
uct w
ater
pre
ssur
e (V
1405
) SE
DP6
01
Rea
ctor
out
let p
ress
ure
(V14
06)
SED
Proc
ess
Proc
ess M
ode
(C10
2)
98

Tab
le 3
- Se
nsor
s in
the
Mec
hani
cal C
ompr
esso
r
Sens
or D
esig
natio
n Se
nsor
Des
crip
tion
MED
DP_
020
Mec
hani
cal C
ompr
esso
r O
utle
t Dew
poin
t, F
MED
Flw
020
Com
pres
sor O
utle
t Flo
w
afte
r DP,
lb/h
r M
EDPr
s020
C
ompr
esso
r Inl
et P
ress
ure,
PS
IG
MED
Tmp0
20
Man
ifold
Out
let o
r C
rank
case
HX
inle
t, F
MED
Tmp0
21
Cra
nkca
se H
X O
utle
t or C
P H
X in
let,
F M
EDTm
p022
M
anifo
ld In
let,
F M
EDTm
p023
C
old
Plat
e O
utle
t, F
MED
Tmp0
24
Cra
nkca
se E
xter
nal M
otor
En
d, F
M
EDTm
p025
Lo
wer
Gui
de C
ylin
der
Stag
e 1
Mot
or E
nd, F
M
EDTm
p026
C
ross
over
Hea
d St
age
1 M
otor
End
, F
MED
Tmp0
27
Cro
ssov
er H
ead
Stag
e 2,
F
Tab
le 4
- Se
nsor
s in
the
Tem
pera
ture
Sw
ing
Ads
orpt
ion
Com
pres
sor
TSA
F pr
od
TSA
C o
utle
t CO
2 flo
wra
te
TSA
P1
Bed
A In
tern
al p
ress
ure
TSA
P2
Bed
B in
tern
al p
ress
ure
TSA
ExtW
alA
B
ed A
Ext
erna
l Wal
l Te
mpe
ratu
re
TSA
HA
1 B
ed A
Hea
ter 1
Te
mpe
ratu
re
TSA
HA
3 B
ed A
Hea
ter 3
Te
mpe
ratu
re
TSA
Touc
hA
Bed
A T
ouch
Tem
pera
ture
TS
AEx
tWal
B
Bed
B E
xter
nal W
all
Tem
pera
ture
TS
ATo
uchB
B
ed B
Tou
ch T
empe
ratu
re
TSA
HB
1 B
ed B
Hea
ter 1
Te
mpe
ratu
re
TSA
HB
3 B
ed B
Hea
ter 3
Te
mpe
ratu
re
TSA
Pow
er
Hea
ter p
ower
for B
ed A
an
d B
ed B
TS
AF
cdra
TS
AC
Inle
t CO
2 flo
wra
te
TSA
AirI
nA
Bed
A C
oolin
g A
ir In
let
Tem
pera
ture
TS
AA
irInB
B
ed b
Coo
ling
Air
Out
let
Tem
pera
ture
TS
AA
irOut
A
Bed
A C
oolin
g A
ir In
let
Tem
pera
ture
TS
AA
irOut
B
Bed
A C
oolin
g A
ir O
utle
t Te
mpe
ratu
re
TSA
P cd
ra
Inle
t pre
ssur
e
99

4BM
S B
asel
ine
Cas
e Te
st D
ay 5
8
6
/27/
05
Page
11
Add
ition
al 4
BM
S C
ase
Te
st D
ay 1
7
2/6
/05
Page
23
Mec
hani
cal C
ompr
esso
r Sta
nd A
lone
Cas
e Te
st D
ay 4
11
/2/0
4 Pa
ge 2
7 4B
MS/
CED
U B
asel
ine
Cas
e Te
st D
ay 9
12
/1/0
4 Pa
ge 3
6 Sa
batie
r Sta
ndal
one
Cas
e Te
st D
ay 1
6 2/
4/05
Pa
ge 4
4 4B
MS/
TSA
C B
asel
ine
Cas
e
11/2
0/05
Pa
ge 5
7 4B
MS/
CED
U/S
abat
ier F
ully
Inte
grat
ed C
ase
Test
Day
16
2/4/
05
Page
63
4BM
S/TS
AC
/Sab
atie
r Ful
ly In
tegr
ated
Cas
e
1/27
/06
Page
77
100

5.2.
2 4B
MS
Bas
elin
e C
ase
PO
IST
4BM
S/C
ompr
esso
r ED
U T
estin
g - 4
BM
S B
/L w
ith T
P1 C
ondi
tions
- El
apse
d Ti
me
from
6/2
7 --
Tes
t D
ay 5
8 20
05
Plot
1 --
Sta
tus
for 4
BMS,
CRA
, OG
A an
d Co
mpr
esso
r (of
fset
for c
larit
y)
02468101214
01
23
45
67
89
1011
1213
1415
1617
1819
2021
2223
24
Tim
e, H
ours
status
CDPM
pde
0OF
1SH
2A1
3A2
4A3
5B1
6B2
7B3
8WP
CRA
Rea
dy (1
1=on
10=
off)
OG
A R
eady
(9=o
n 8=
off)
Com
pres
sor S
tatu
s (1
3=on
12=
off)
Th
is p
lot g
ives
the
stat
us o
f eac
h of
the
oper
atin
g sy
stem
s aga
inst
a ti
mel
ine.
For
this
cas
e, o
nly
the
4BM
S is
ope
ratin
g. T
he in
tege
r va
lues
cor
resp
ond
to th
e di
ffer
ent p
roce
ssin
g cy
cles
of t
he 4
BM
S. 0
=Off
, 1=S
H??
, 2=B
ed A
Air
Save
, 3=B
ed A
Des
orb,
4=B
ed A
V
acuu
m V
ent,
5=B
ed B
Air
Save
, 6=B
ed B
Des
orb,
7=B
ed B
Vac
uum
Ven
t. Th
e co
mpr
esso
r and
Sab
atie
r are
bot
h of
f.
101

Plot
2 --
Car
bon
Diox
ide
Parti
al P
ress
ures
at 4
BMS
Inle
t, 4B
MS
Out
let,
and
in L
ab
Mod
ule
Sim
ulat
or
0246810121416
01
23
45
67
89
1011
1213
1415
1617
1819
2021
2223
24
Tim
e, H
ours
mmHg
FMG
62 4
BMS
Inle
t Air
CO2
Pres
sure
mm
HgFF
G69
4BM
S O
utle
t Air
CO2
Pres
sure
mm
Hg
FMG
10 L
ab A
ir CO
2 Pr
essu
re m
mHg
This
plo
t sho
ws t
he C
O2
conc
entra
tion
in a
nd o
ut o
f the
4B
MS.
The
out
let c
once
ntra
tion
spik
es e
very
tim
e th
e be
ds sw
itch
beca
use
ther
e is
resi
dual
CO
2 in
the
lines
from
the
deso
rbin
g be
d th
at g
oes t
o th
e 4B
MS
outle
t onc
e th
at d
esor
bing
bed
com
es o
n-lin
e an
d ai
r st
arts
flow
ing
thro
ugh
it ag
ain.
102

Plot
3 --
Air
Dew
poin
t at 4
BMS
Inle
t, 4B
MS
Out
let,
and
in L
ab M
odul
e Si
mul
ator
-40
-30
-20
-100102030405060
01
23
45
67
89
1011
1213
1415
1617
1819
2021
2223
24
Tim
e, H
ours
Temperature, degrees F
CDPD
P_12
0 4
BMS
Inle
t Air
Dew
poin
t #1
F
CD
PDP_
121
4BM
S O
utle
t Air
Dew
poin
t #1
F
AFc
DP_1
20 L
ab A
ir De
wpo
int F
This
plo
t sho
ws t
he d
ew p
oint
of t
he a
ir en
terin
g th
e 4B
MS
and
the
bulk
air
in th
e La
b M
odul
e si
mul
ator
. The
out
let d
ew p
oint
sens
or
was
not
wor
king
dur
ing
the
test
.
103
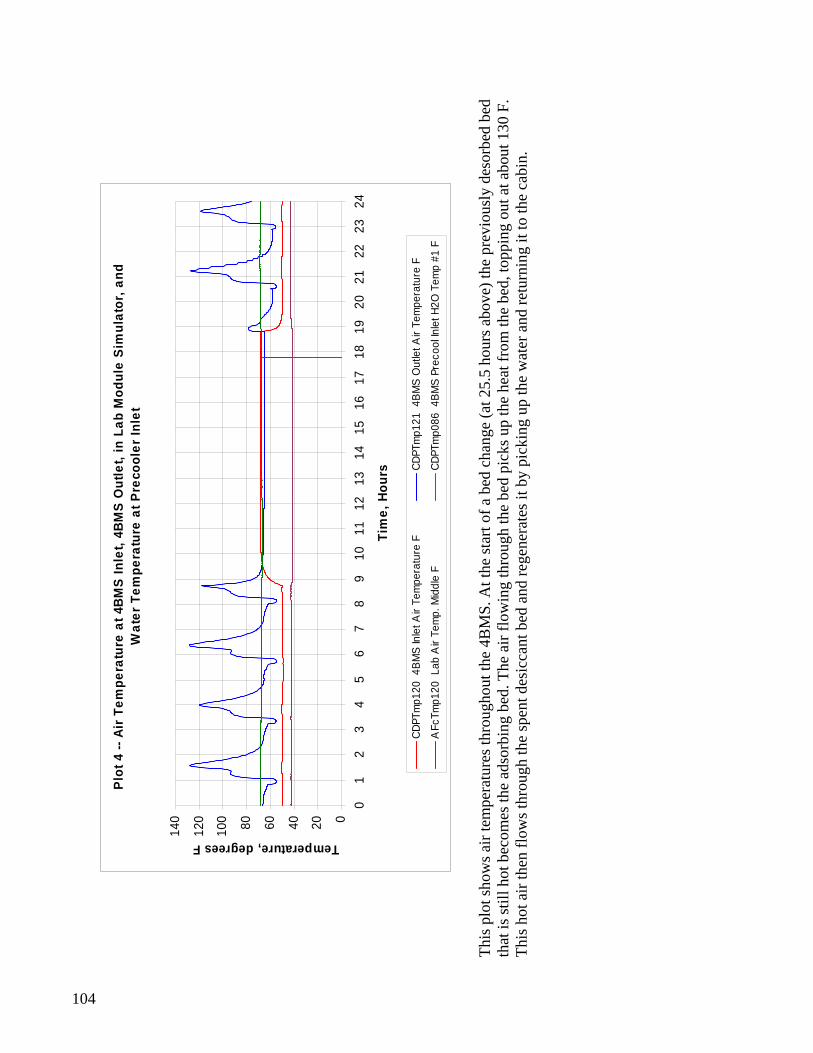
Plot
4 --
Air
Tem
pera
ture
at 4
BMS
Inle
t, 4B
MS
Out
let,
in L
ab M
odul
e Si
mul
ator
, and
W
ater
Tem
pera
ture
at P
reco
oler
Inle
t
020406080100
120
140
01
23
45
67
89
1011
1213
1415
1617
1819
2021
2223
24
Tim
e, H
ours
Temperature, degrees F
CDPT
mp1
20 4
BMS
Inle
t Air
Tem
pera
ture
F
CDPT
mp1
21 4
BMS
Out
let A
ir Te
mpe
ratu
re F
AFc
Tmp1
20 L
ab A
ir Te
mp.
Mid
dle
F
CD
PTm
p086
4BM
S Pr
ecoo
l Inle
t H2O
Tem
p #1
F
Th
is p
lot s
how
s air
tem
pera
ture
s thr
ough
out t
he 4
BM
S. A
t the
star
t of a
bed
cha
nge
(at 2
5.5
hour
s abo
ve) t
he p
revi
ousl
y de
sorb
ed b
ed
that
is st
ill h
ot b
ecom
es th
e ad
sorb
ing
bed.
The
air
flow
ing
thro
ugh
the
bed
pick
s up
the
heat
from
the
bed,
topp
ing
out a
t abo
ut 1
30 F
. Th
is h
ot a
ir th
en fl
ows t
hrou
gh th
e sp
ent d
esic
cant
bed
and
rege
nera
tes i
t by
pick
ing
up th
e w
ater
and
retu
rnin
g it
to th
e ca
bin.
104

Plot
5 --
Sor
bent
Bed
Hea
ter T
empe
ratu
res
050100
150
200
250
300
350
400
450
01
23
45
67
89
1011
1213
1415
1617
1819
2021
2223
24
Tim
e, H
ours
Temperature, degrees F
CDPm
t13
5A
Bed
308
Hea
ter T
emp
A F
CD
Pmt1
6 5
A B
ed 3
09 H
eate
r Tem
p A
F
This
plo
t sho
ws t
he te
mpe
ratu
res o
f the
mol
ecul
ar si
eve
beds
. The
des
orbi
ng b
ed h
eate
rs a
re fu
lly o
n un
til th
e te
mpe
ratu
re re
ache
s 400
F
and
then
an
ON
/OFF
con
trol i
s use
d to
mai
ntai
n th
e te
mpe
ratu
re a
t 400
unt
il th
e en
d of
the
cycl
e.
105

Plot
6 --
Des
icca
nt B
ed In
let a
nd O
utle
t Air
Tem
pera
ture
s
0102030405060708090100
01
23
45
67
89
1011
1213
1415
1617
1819
2021
2223
24
Tim
e, H
ours
Temperature, degrees F
CDPT
mp1
20 4
BMS
Inle
t Air
Tem
pera
ture
F
CDPm
t11
Des
icca
nt B
ed O
utle
t Tem
pera
ture
F
This
plo
t sho
ws t
he te
mpe
ratu
res o
f the
des
icca
nt b
ed. T
he a
ir le
avin
g th
e de
sicc
ant i
s war
med
by
the
heat
of a
dsor
ptio
n of
wat
er o
nto
the
desi
ccan
t mat
eria
l.
106

Plot
7 --
Des
icca
nt B
ed O
utle
t Air
Dew
poin
t Tem
pera
ture
-40
-30
-20
-10010203040
01
23
45
67
89
1011
1213
1415
1617
1819
2021
2223
24
Tim
e, H
ours
Temperature, degrees F
CDPD
P_02
3 D
essi
cant
Bed
Out
let A
ir De
wpt
F
This
plo
t sho
ws h
ow th
e de
w p
oint
of t
he a
ir le
avin
g th
e de
sicc
ant a
nd e
nter
ing
the
mol
ecul
ar si
eve
bed
rem
ains
ver
y dr
y. W
ater
will
co
ntam
inat
e th
e m
olec
ular
siev
e an
d re
quire
hig
h te
mpe
ratu
re re
gene
ratio
n. T
he sp
ikes
in th
e de
w p
oint
sign
al a
re d
ue to
cal
ibra
tions
of
the
sens
or.
107

Plot
8 --
4BM
S Pr
oces
s Ai
r Flo
w R
ate
051015202530
01
23
45
67
89
1011
1213
1415
1617
1819
2021
2223
24
Tim
e, H
ours
SCFM
CDPF
lw12
0 4
BMS
Inle
t Air
Flow
rate
SCF
M (S
ierr
a)
CDPF
lw12
1 4
BMS
Inle
t Air
Flow
rate
SCF
M (T
SI)
Two
diff
eren
t air
flow
inst
rum
ents
wer
e us
ed to
mon
itor t
he p
roce
ss a
ir flo
w.
108
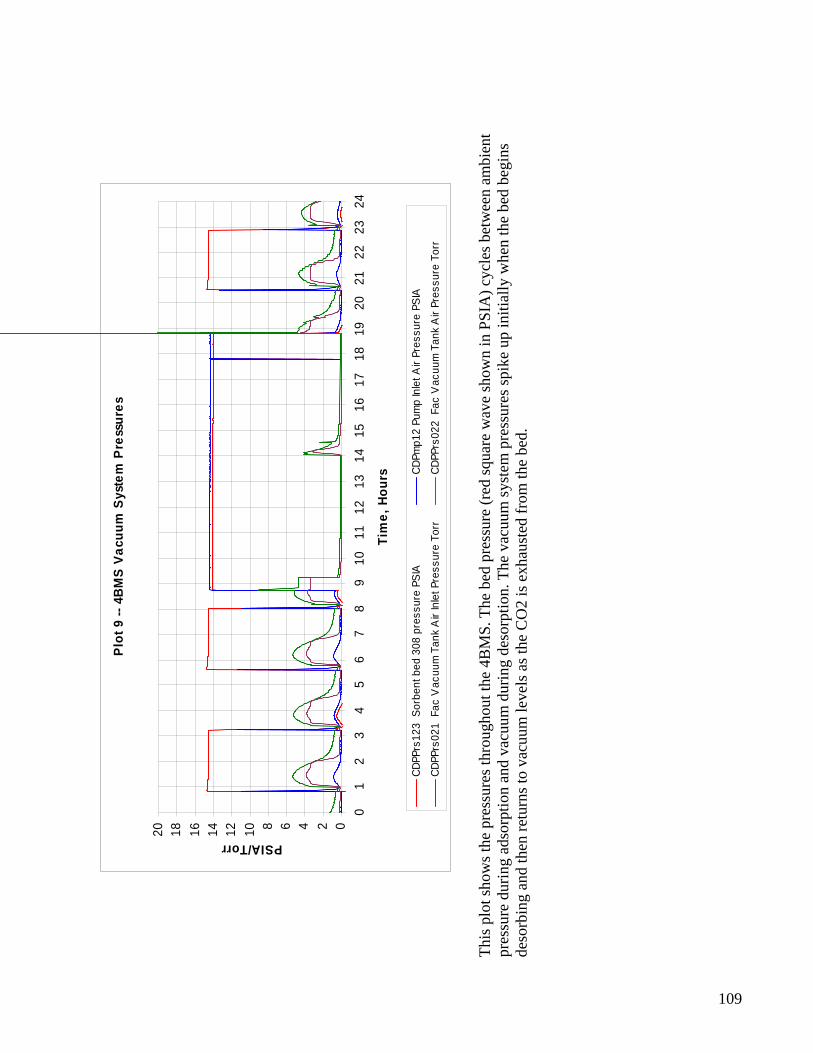
Plot
9 --
4BM
S Va
cuum
Sys
tem
Pre
ssur
es
02468101214161820
01
23
45
67
89
1011
1213
1415
1617
1819
2021
2223
24
Tim
e, H
ours
PSIA/Torr
CDPP
rs12
3 S
orbe
nt b
ed 3
08 p
ress
ure
PSIA
CDPm
p12
Pum
p In
let A
ir Pr
essu
re P
SIA
CDPP
rs02
1 F
ac V
acuu
m T
ank
Air
Inle
t Pre
ssur
e To
rr
CD
PPrs
022
Fac
Vac
uum
Tan
k A
ir Pr
essu
re T
orr
Th
is p
lot s
how
s the
pre
ssur
es th
roug
hout
the
4BM
S. T
he b
ed p
ress
ure
(red
squa
re w
ave
show
n in
PSI
A) c
ycle
s bet
wee
n am
bien
t pr
essu
re d
urin
g ad
sorp
tion
and
vacu
um d
urin
g de
sorp
tion.
The
vac
uum
syst
em p
ress
ures
spik
e up
initi
ally
whe
n th
e be
d be
gins
de
sorb
ing
and
then
retu
rns t
o va
cuum
leve
ls a
s the
CO
2 is
exh
aust
ed fr
om th
e be
d.
109

Plot
10
-- 4B
MS
Com
pone
nt P
ower
0
100
200
300
400
500
600
01
23
45
67
89
1011
1213
1415
1617
1819
2021
2223
24
Tim
e, H
ours
Watts
CDPm
w12
5A
Bed
308
Prim
. Hea
ter P
ower
Wat
t
CDPm
w13
5A
Bed
309
Prim
. Hea
ter P
ower
Wat
t
CDPm
w14
5A
Bed
308
Sec
. Hea
ter P
ower
Wat
t
CDPm
w15
5A
Bed
309
Sec
. Hea
ter P
ower
Wat
t
Air-
Save
Pum
p Po
wer
, Wat
ts
Th
is p
lot s
how
s the
pow
er su
mm
ary
for t
he sy
stem
. The
prim
ary
and
seco
ndar
y he
ater
s are
on
full
until
the
bed
reac
hes 4
00 F
and
th
en c
ycle
to m
aint
ain
the
tem
pera
ture
. The
air
save
pum
p is
act
ivat
ed fo
r 10
min
utes
of e
ach
half
cycl
e.
110

Plot
11
-- 4B
MS
CO2
Inje
ctio
n an
d Co
olan
t Wat
er F
low
Rat
e
0
0.51
1.52
2.53
3.5
01
23
45
67
89
1011
1213
1415
1617
1819
2021
2223
24
Tim
e, H
ours
SLPM/GPM
050100
150
200
250
300
350
LBS
MSA
Flw
022
Lab
CO
2 In
ject
Flo
wra
te S
LPM
CDPF
lw08
0 4
BMS
Prec
oole
r Inl
et H
2O F
low
GPM
MSA
Flw
023
Lab
High
CO
2 In
ject
Flo
wra
te L
BS/H
R
MSA
Mas
020
Fac
ility
CO2
Tank
Wei
ght L
bs
Th
is p
lot s
how
s the
CO
2 in
ject
ion
rate
into
the
4BM
S. T
he C
O2
inje
ctio
n ra
te is
bas
ed o
n a
clos
ed lo
op a
lgor
ithm
to m
aint
ain
a co
nsta
nt C
O2
conc
entra
tion
at th
e in
let o
f the
4B
MS
as sh
own
in p
lot 2
and
plo
t 12.
The
CO
2 ta
nk w
eigh
t is a
mea
ns o
f per
form
ing
a m
ass b
alan
ce o
n C
O2
to v
erify
the
accu
racy
of t
he m
easu
rem
ents
.
111

Plot
12
-- Pe
rcen
t Car
bon
Diox
ide
at 4
BMS
Inle
t, 4B
MS
Out
let,
and
in L
ab M
odul
e Si
mul
ator
0
0.51
1.52
2.5
01
23
45
67
89
1011
1213
1415
1617
1819
2021
2223
24
Tim
e, H
ours
%
CDPG
as12
4 4
BMS
Inle
t Air
CO2
Conc
entra
tion
%CO
2
CDPG
as12
5 4
BMS
Out
let A
ir CO
2 Co
ncen
tratio
n %
CO2
AFC
Gas
126
Lab
Air
CO2
Conc
entra
tion
%CO
2
Th
is p
lot i
s the
sam
e as
Plo
t 2 e
xcep
t it i
s rep
orte
d in
% c
once
ntra
tion
inst
ead
of m
mH
g.
112

5.2.
3 A
dditi
onal
4B
MS
Bas
elin
e C
ase
Ano
ther
exa
mpl
e of
4B
MS
Bas
elin
e te
st c
ondi
tions
:
POIS
T 4B
MS/
Com
pres
sor E
DU
Tes
ting
- 4B
MS
Bas
elin
e - E
laps
ed T
ime
from
2/6
-- T
est D
ay 1
7 20
05
Pl
ot 1
-- S
tatu
s fo
r 4BM
S, C
RA, O
GA
and
Com
pres
sor (
offs
et fo
r cl
arity
)
02468101214
01
23
45
67
89
1011
1213
1415
1617
1819
2021
2223
24
Tim
e, H
ours
status
CDPM
pde
0OF
1SH
2A1
3A2
4A3
5B1
6B2
7B3
8WP
CRA
Rea
dy (1
1=on
10=
off)
OG
A R
eady
(9=o
n 8=
off)
Com
pres
sor S
tatu
s (1
3=on
12=
off)
Plot
2 --
Car
bon
Diox
ide
Par
tial P
ress
ures
at 4
BMS
Inle
t, 4B
MS
Out
let,
and
in L
ab
Mod
ule
Sim
ulat
or
024681012141618
01
23
45
67
89
1011
1213
1415
1617
1819
2021
2223
24
Tim
e, H
ours
mmHg
FMG
62 4
BMS
Inle
t Air
CO2
Pres
sure
mm
HgFF
G69
4BM
S O
utle
t Air
CO2
Pres
sure
mm
Hg
FMG
10 L
ab A
ir CO
2 Pr
essu
re m
mHg
Plot
3 --
Air
Dew
poin
t at 4
BMS
Inle
t, 4B
MS
Out
let,
and
in L
ab M
odul
e Si
mul
ator
0102030405060
01
23
45
67
89
1011
1213
1415
1617
1819
2021
2223
24
Tim
e, H
ours
Temperature, degrees F
CDPD
P_12
0 4
BMS
Inle
t Air
Dew
poin
t #1
F
CD
PDP_
121
4BM
S O
utle
t Air
Dew
poin
t #1
F
Pl
ot 4
-- A
ir Te
mpe
ratu
re a
t 4BM
S In
let,
4BM
S O
utle
t, in
Lab
Mod
ule
Sim
ulat
or, a
nd
Wat
er T
empe
ratu
re a
t Pre
cool
er In
let
020406080100
120
140
160
180
01
23
45
67
89
1011
1213
1415
1617
1819
2021
2223
24
Tim
e, H
ours
Temperature, degrees F
CDPT
mp1
20 4
BMS
Inle
t Air
Tem
pera
ture
F
CDPT
mp1
21 4
BMS
Out
let A
ir Te
mpe
ratu
re F
AFc
Tmp1
20 L
ab A
ir Te
mp.
Mid
dle
F
CD
PTm
p086
4BM
S Pr
ecoo
l Inle
t H2O
Tem
p #1
F
113
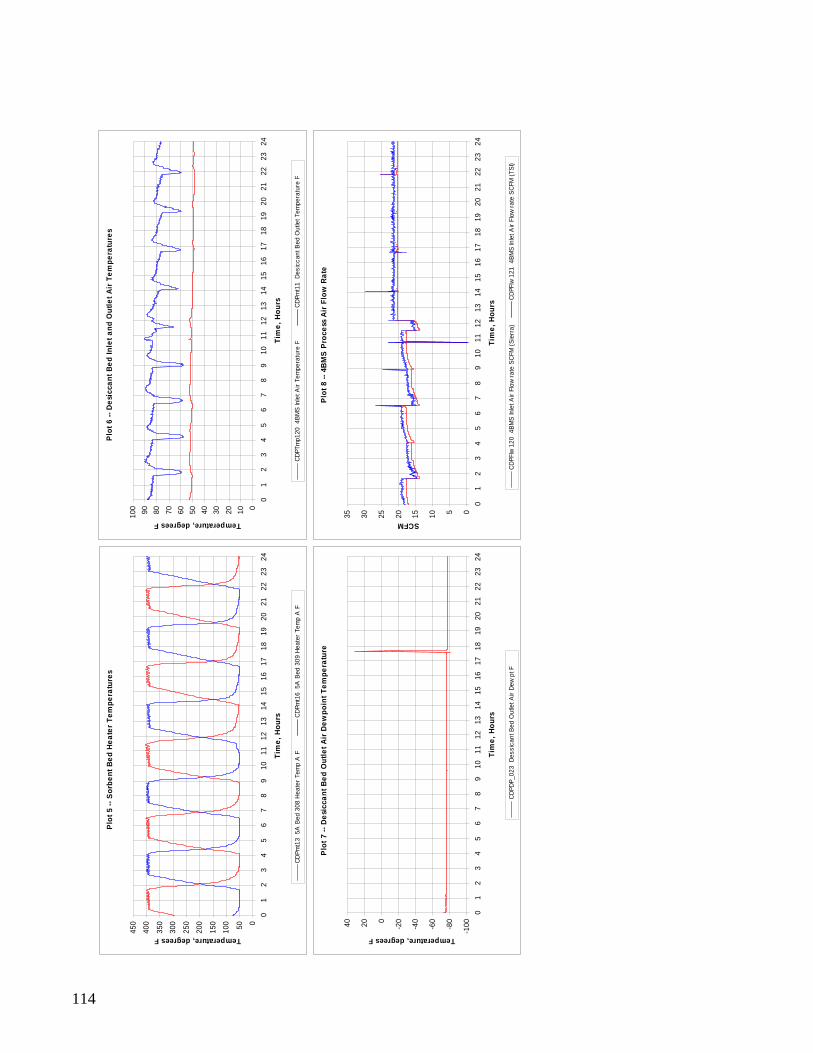
Plot
6 --
Des
icca
nt B
ed In
let a
nd O
utle
t Air
Tem
pera
ture
s
0102030405060708090100
01
23
45
67
89
1011
1213
1415
1617
1819
2021
2223
24
Tim
e, H
ours
Temperature, degrees F
CDPT
mp1
20 4
BMS
Inle
t Air
Tem
pera
ture
F
CDPm
t11
Des
icca
nt B
ed O
utle
t Tem
pera
ture
F
Plot
5 --
Sor
bent
Bed
Hea
ter T
empe
ratu
res
050100
150
200
250
300
350
400
450
01
23
45
67
89
1011
1213
1415
1617
1819
2021
2223
24
Tim
e, H
ours
Temperature, degrees F
CDPm
t13
5A
Bed
308
Hea
ter T
emp
A F
CD
Pmt1
6 5
A B
ed 3
09 H
eate
r Tem
p A
F
Pl
ot 7
-- D
esic
cant
Bed
Out
let A
ir De
wpo
int T
empe
ratu
re
-100-8
0
-60
-40
-2002040
01
23
45
67
89
1011
1213
1415
1617
1819
2021
2223
24
Tim
e, H
ours
Temperature, degrees F
CDPD
P_02
3 D
essi
cant
Bed
Out
let A
ir De
wpt
F
Plot
8 --
4BM
S Pr
oces
s Ai
r Flo
w R
ate
05101520253035
01
23
45
67
89
1011
1213
1415
1617
1819
2021
2223
24
Tim
e, H
ours
SCFM
CDPF
lw12
0 4
BMS
Inle
t Air
Flow
rate
SCF
M (S
ierr
a)
CDPF
lw12
1 4
BMS
Inle
t Air
Flow
rate
SCF
M (T
SI)
114
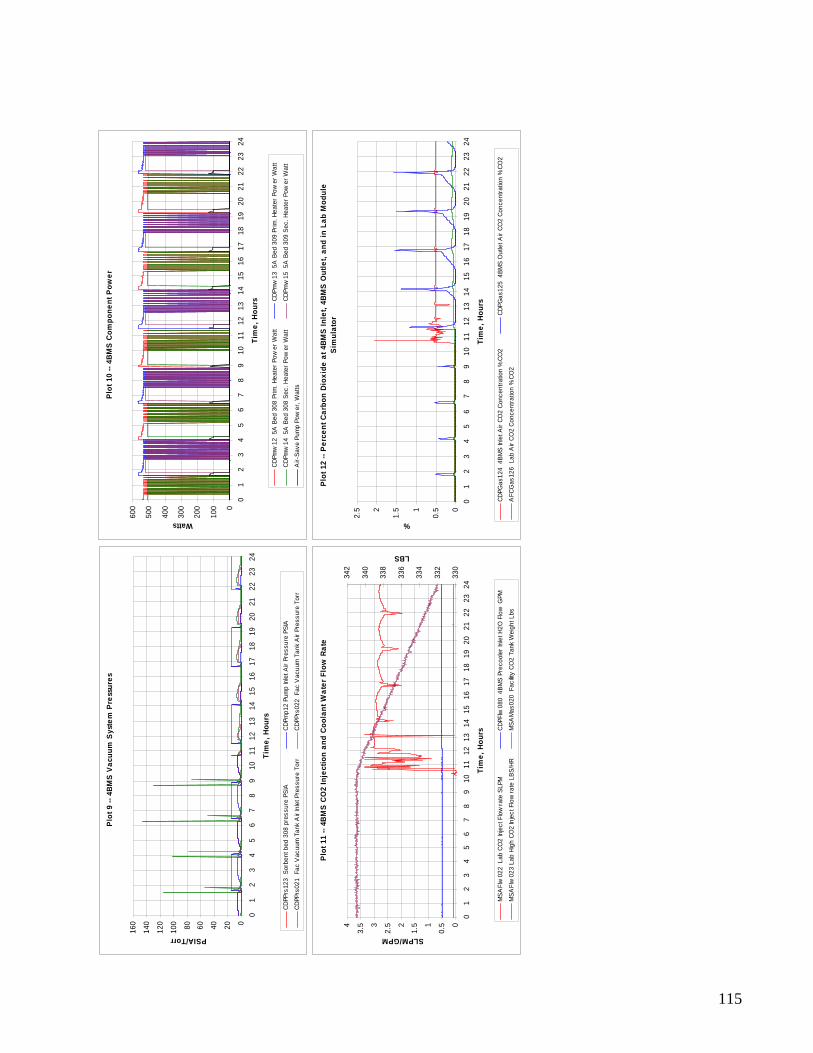
Plot
10
-- 4B
MS
Com
pone
nt P
ower
0
100
200
300
400
500
600
01
23
45
67
89
1011
1213
1415
1617
1819
2021
2223
24
Tim
e, H
ours
Watts
CDPm
w12
5A
Bed
308
Prim
. Hea
ter P
ower
Wat
t
CDPm
w13
5A
Bed
309
Prim
. Hea
ter P
ower
Wat
t
CDPm
w14
5A
Bed
308
Sec
. Hea
ter P
ower
Wat
t
CDPm
w15
5A
Bed
309
Sec
. Hea
ter P
ower
Wat
t
Air-
Save
Pum
p Po
wer
, Wat
ts
Plot
9 --
4BM
S Va
cuum
Sys
tem
Pre
ssur
es
020406080100
120
140
160
01
23
45
67
89
1011
1213
1415
1617
1819
2021
2223
24
Tim
e, H
ours
PSIA/Torr
CDPP
rs12
3 S
orbe
nt b
ed 3
08 p
ress
ure
PSIA
CDPm
p12
Pum
p In
let A
ir Pr
essu
re P
SIA
CDPP
rs02
1 F
ac V
acuu
m T
ank
Air
Inle
t Pre
ssur
e To
rr
CD
PPrs
022
Fac
Vac
uum
Tan
k A
ir Pr
essu
re T
orr
Plot
11
-- 4B
MS
CO2
Inje
ctio
n an
d Co
olan
t Wat
er F
low
Rat
e
0
0.51
1.52
2.53
3.54
01
23
45
67
89
1011
1213
1415
1617
1819
2021
2223
24
Tim
e, H
ours
SLPM/GPM
330
332
334
336
338
340
342
LBSM
SAFl
w02
2 L
ab C
O2
Inje
ct F
low
rate
SLP
M
CD
PFlw
080
4BM
S Pr
ecoo
ler I
nlet
H2O
Flo
w G
PM
MSA
Flw
023
Lab
High
CO
2 In
ject
Flo
wra
te L
BS/H
R
MSA
Mas
020
Fac
ility
CO2
Tank
Wei
ght L
bs
Plot
12
-- P
erce
nt C
arbo
n Di
oxid
e at
4BM
S In
let,
4BM
S O
utle
t, an
d in
Lab
Mod
ule
Sim
ulat
or
0
0.51
1.52
2.5
01
23
45
67
89
1011
1213
1415
1617
1819
2021
2223
24
Tim
e, H
ours
%
CDPG
as12
4 4
BMS
Inle
t Air
CO2
Conc
entra
tion
%CO
2
CDPG
as12
5 4
BMS
Out
let A
ir CO
2 Co
ncen
tratio
n %
CO2
AFC
Gas
126
Lab
Air
CO2
Conc
entra
tion
%CO
2
115

5.2.
4 M
echa
nica
l Com
pres
sor S
tand
Alo
ne C
ase
PO
IST
4BM
S/C
ompr
esso
r ED
U T
estin
g –
CED
U B
asel
ine
- Ela
psed
Tim
e fr
om 1
1/22
-- T
est D
ay 4
200
4
Plot
1 --
Sta
tus
for 4
BMS,
CRA
, OG
A an
d Co
mpr
esso
r (of
fset
for c
larit
y)
02468101214
01
23
45
67
89
1011
1213
1415
1617
1819
2021
2223
24
Tim
e, H
ours
status
CDPM
pde
0OF
1SH
2A1
3A2
4A3
5B1
6B2
7B3
8WP
CRA
Rea
dy (1
1=on
10=
off)
OG
A R
eady
(9=o
n 8=
off)
Com
pres
sor S
tatu
s (1
3=on
12=
off)
Th
is p
lot i
s the
sam
e as
the
stat
us p
lot f
or th
e 4B
MS
stan
d al
one
test
. Eac
h lin
e re
pres
ents
the
stat
us o
f eac
h pi
ece
of e
quip
men
t. Th
e 4-
bed
mol
siev
e w
as o
pera
ted
unde
r its
nor
mal
ope
ratin
g m
ode,
and
the
com
pres
sor w
as o
nly
activ
ated
thre
e tim
es. T
he S
abat
ier a
nd
OG
A w
ere
not i
nvol
ved
in th
is te
st.
116

Plot
2 --
CED
U O
verv
iew
-1012345678
01
23
45
67
89
1011
1213
1415
1617
1819
2021
2223
24
Tim
e, H
ours
Suction Press (PSIA), Flow
(Lb/hr), On/Off, Day/Night
-20
020406080100
120
140
Discharge Press (PSIA)
Day/
Nigh
t Sta
tus
(7=d
ay, 6
=nig
ht)
SEDC
ompr
esso
r com
man
d 1=
on 0
=off
MED
Flw
020
Com
pres
sor O
utle
t Flo
w a
fter D
P lb
/hr
M
EDPr
s020
Com
pres
sor I
nlet
Pre
ssur
e PS
IA
MED
Prs0
21 A
ccum
ulat
or P
ress
ure
or C
O2
inle
t PSI
A
Th
is p
lot s
how
s mul
tiple
dat
a ite
ms o
n on
e pl
ot: c
ompr
esso
r flo
w, i
nlet
and
out
let p
ress
ure
and
the
com
pres
sor c
omm
and.
The
se sa
me
data
are
show
n in
sepa
rate
plo
ts fo
llow
ing
for b
ette
r cla
rity.
117

Plot
3 --
CED
U O
utle
t Flo
w R
ate,
On/
Off
-1
-0.50
0.51
1.52
2.53
01
23
45
67
89
1011
1213
1415
1617
1819
2021
2223
24
Tim
e, H
ours
lb/hr
012
1=On/ 0=Off
MED
Flw
020
Com
pres
sor O
utle
t Flo
w a
fter D
P lb
/hr
SE
DCom
pres
sor c
omm
and
1=on
0=o
ff
Th
is p
lot s
how
s the
flow
rate
at t
he c
ompr
esso
r exi
t. Th
is d
ata,
alo
ng w
ith th
e in
let a
nd o
utle
t pre
ssur
e, is
use
d to
ver
ify th
e flo
w ra
te
mod
el o
f the
com
pres
sor.
118

Plot
4 --
CED
U In
let P
ress
ure
02468101214
01
23
45
67
89
1011
1213
1415
1617
1819
2021
2223
24
Tim
e, H
ours
PSIA
012
1=On / 0=Off
MED
Prs0
20 C
ompr
esso
r Inl
et P
ress
ure
PSIA
SEDC
ompr
esso
r com
man
d 1=
on 0
=off
This
plo
t sho
ws t
he c
ompr
esso
r inl
et p
ress
ure.
The
inle
t pre
ssur
e va
ries a
s the
4-b
ed m
ol si
eve
is tr
ansi
tioni
ng th
roug
h its
ope
ratin
g m
odes
.
119

Plot
5 --
CED
U O
utle
t Dew
Poi
nt
-40
-20020406080
01
23
45
67
89
1011
1213
1415
1617
1819
2021
2223
24
Tim
e, H
ours
Temperature, degrees F
012
1 = On / 0 = Off
MED
DP_0
20 M
echa
nica
l Com
pres
sor O
utle
t Dew
poin
t F
SEDC
ompr
esso
r com
man
d 1=
on 0
=off
This
plo
t sho
ws t
he o
utle
t dew
poi
nt o
f the
com
pres
sor.
The
dew
poi
nt w
as a
ntic
ipat
ed to
be
high
eno
ugh
to c
ause
con
dens
atio
n in
the
com
pres
sor,
but a
s sho
wn
in th
e pl
ot, t
he d
ew p
oint
rem
aine
d lo
w th
roug
hout
the
test
.
120

Plot
6 --
CED
U O
utle
t Pre
ssur
e
020406080100
120
140
01
23
45
67
89
1011
1213
1415
1617
1819
2021
2223
24
Tim
e, H
ours
PSIA
012
1 = On / 0 = Off
MED
Prs0
21 A
ccum
ulat
or P
ress
ure
or C
O2
inle
t PSI
ASE
DCom
pres
sor c
omm
and
1=on
0=o
ff
Th
is p
lot s
how
s the
com
pres
sor d
isch
arge
pre
ssur
e. T
he c
ompr
esso
r was
test
ed a
t var
ying
dis
char
ge p
ress
ures
by
inco
rpor
atin
g a
pres
sure
regu
lato
r int
o th
e do
wns
tream
plu
mbi
ng.
121

Plot
7 --
CED
U T
empe
ratu
res
(1 o
f 3)
0102030405060708090100
01
23
45
67
89
1011
1213
1415
1617
1819
2021
2223
24
Tim
e, H
ours
Temperature, degrees F
012
1 = On / 0 = Off
MED
Tmp0
20 M
anifo
ld O
utle
t or C
rank
case
HX
inle
t F
MED
Tmp0
21 C
rank
case
HX
Out
let o
r CP
HX in
let F
SEDC
ompr
esso
r com
man
d 1=
on 0
=off
This
plo
t and
the
next
two
show
the
tem
pera
ture
s at v
ario
us lo
catio
ns w
ithin
the
com
pres
sor.
The
tem
pera
ture
s are
mea
sure
d in
the
cool
ing
wat
er th
roug
hout
the
com
pres
sor.
The
larg
e te
mpe
ratu
re in
crea
se a
t 14-
15 h
ours
was
due
to th
erm
ocou
ples
bei
ng re
mov
ed
from
the
cool
ant a
nd n
ot re
leva
nt to
the
spec
ific
test
resu
lts.
122

Plot
8 --
CED
U T
empe
ratu
res
(2 o
f 3)
0102030405060708090100
01
23
45
67
89
1011
1213
1415
1617
1819
2021
2223
24
Tim
e, H
ours
Temperature, degrees F
012
1 = On / 0 = Off
MED
Tmp0
22 M
anifo
ld In
let F
M
EDTm
p023
Col
d Pl
ate
Out
let F
MED
Tmp0
24 C
rank
case
Ext
erna
l Mot
or E
nd F
SE
DCom
pres
sor c
omm
and
1=on
0=o
ff
123

Plot
9 --
CED
U T
empe
ratu
res
(3 o
f 3)
020406080100
120
01
23
45
67
89
1011
1213
1415
1617
1819
2021
2223
24
Tim
e, H
ours
Temperature, degrees F
012
1 = On / 0 = Off
MED
Tmp0
25 L
ower
Gui
de C
ylin
der S
tage
1 M
otor
End
F
MED
Tmp0
26 C
ross
over
Hea
d St
age
1 M
otor
End
F
MED
Tmp0
27 C
ross
over
Hea
d St
age
2 F
SEDC
ompr
esso
r com
man
d 1=
on 0
=off
124

5.2.
5 4B
MS/
CED
U B
asel
ine
Cas
e
POIS
T 4B
MS/
Com
pres
sor E
DU
Tes
ting
– C
EDU
/4B
MS
BL
#5 -
Elap
sed
Tim
e fr
om 1
2/1
-- T
est D
ay 9
200
4
Plot
1 --
Car
bon
Dio
xide
Par
tial P
ress
ures
at 4
BM
S In
let a
nd 4
BM
S O
utle
t, an
d 4B
MS,
CED
U a
nd S
EDU
Sta
tus
0246810121416
01
23
45
67
89
1011
1213
1415
1617
1819
2021
2223
24
mmHg
0246810121416
Status
FMG
62 4
BMS
Inle
t Air
CO2
Pres
sure
mm
HgFF
G69
4BM
S O
utle
t Air
CO2
Pres
sure
mm
Hg
CRA
Rea
dy (1
1=on
10=
off)
CDPM
pde
0OF
1SH
2A1
3A2
4A3
5B1
6B2
7B3
8WP
Com
pres
sor S
tatu
s (1
3=on
12=
off)
This
plo
t sho
ws t
he st
atus
of t
he 4
BM
S an
d th
e co
mpr
esso
r and
the
carb
on d
ioxi
de c
once
ntra
tion
into
and
out
of t
he C
O2
rem
oval
sy
stem
. The
com
pres
sor w
as o
pera
ted
in th
e m
iddl
e pa
rt of
the
day
for t
his t
est s
erie
s, as
indi
cate
d by
the
purp
le li
ne c
hang
ing
from
12
to 1
3. F
or th
is te
st, t
he in
let C
O2
conc
entra
tion
(indi
cate
d by
the
red
line
abov
e) w
as se
t to
3 m
mH
g fo
r hal
f of t
he te
st a
nd 1
.5 m
mH
g fo
r the
rem
aind
er.
125

Plot
2 --
CED
U S
tatu
s
02468101214
01
23
45
67
89
1011
1213
1415
1617
1819
2021
2223
24
Suction Press (PSIA), Flow (lb/hr), On/Off, Day, Night
020406080100
120
140
Day/
Nigh
t Sta
tus
(7=d
ay, 6
=nig
ht)
SEDC
ompr
esso
r com
man
d 1=
on 0
=off
MED
Flw
020
Com
pres
sor O
utle
t Flo
w a
fter D
P lb
/hr
M
EDPr
s020
Com
pres
sor I
nlet
Pre
ssur
e PS
IA
MED
Prs0
21 A
ccum
ulat
or P
ress
ure
or C
O2
inle
t PSI
A
This
plo
t sho
ws s
ome
of th
e ke
y da
ta fo
r the
mec
hani
cal c
ompr
esso
r. Th
e in
let a
nd o
utle
t pre
ssur
es a
re b
oth
show
n on
this
plo
t alo
ng
with
flow
and
the
com
pres
sor c
omm
and.
The
follo
win
g pl
ot sh
ows t
he sa
me
data
on
a m
agni
fied
time
scal
e.
126
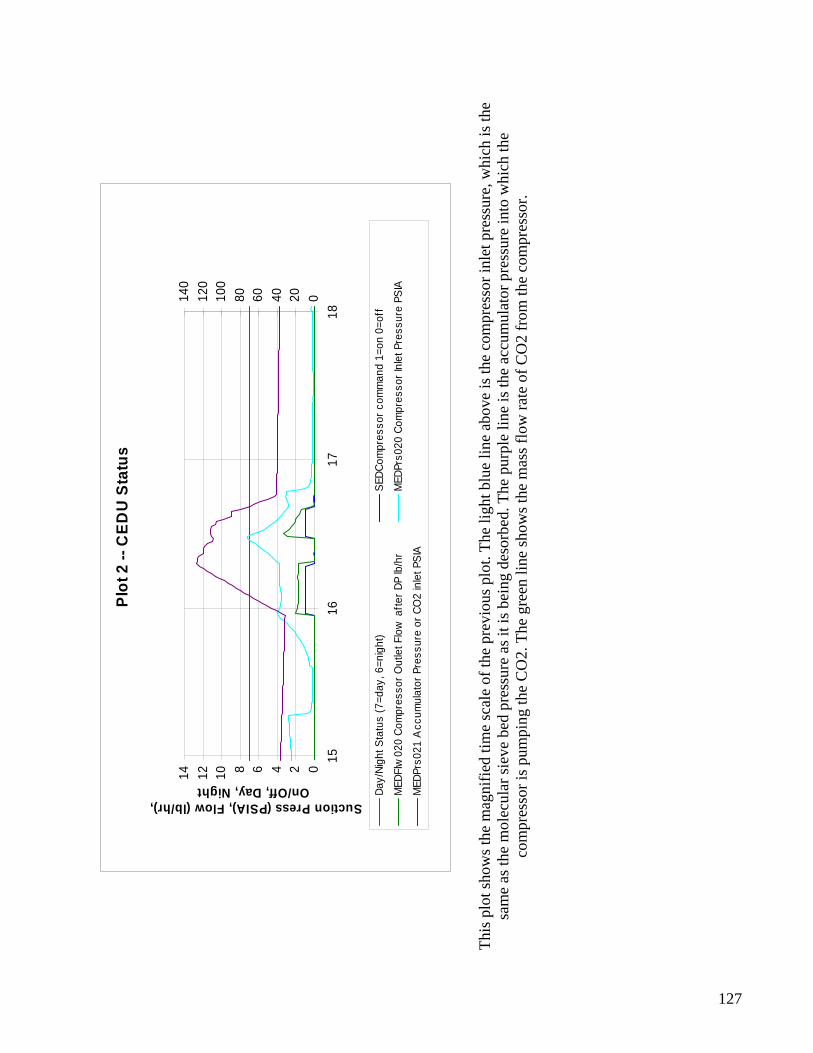
Plot
2 --
CED
U S
tatu
s
02468101214
1516
1718
Suction Press (PSIA), Flow (lb/hr), On/Off, Day, Night
020406080100
120
140
Day/
Nigh
t Sta
tus
(7=d
ay, 6
=nig
ht)
SEDC
ompr
esso
r com
man
d 1=
on 0
=off
MED
Flw
020
Com
pres
sor O
utle
t Flo
w a
fter D
P lb
/hr
M
EDPr
s020
Com
pres
sor I
nlet
Pre
ssur
e PS
IA
MED
Prs0
21 A
ccum
ulat
or P
ress
ure
or C
O2
inle
t PSI
A
This
plo
t sho
ws t
he m
agni
fied
time
scal
e of
the
prev
ious
plo
t. Th
e lig
ht b
lue
line
abov
e is
the
com
pres
sor i
nlet
pre
ssur
e, w
hich
is th
e sa
me
as th
e m
olec
ular
siev
e be
d pr
essu
re a
s it i
s bei
ng d
esor
bed.
The
pur
ple
line
is th
e ac
cum
ulat
or p
ress
ure
into
whi
ch th
e co
mpr
esso
r is p
umpi
ng th
e C
O2.
The
gre
en li
ne sh
ows t
he m
ass f
low
rate
of C
O2
from
the
com
pres
sor.
127

Plot
3 --
4B
MS
Vacu
um S
yste
m P
ress
ures
02468101214161820
01
23
45
67
89
1011
1213
1415
1617
1819
2021
2223
24
Tim
e, H
ours
PSIA/Torr
CDPP
rs12
3 S
orbe
nt b
ed 3
08 p
ress
ure
PSIA
CDPm
p12
Pum
p In
let A
ir Pr
essu
re P
SIA
CDPP
rs02
1 F
ac V
acuu
m T
ank
Air
Inle
t Pre
ssur
e To
rr
CD
PPrs
022
Fac
Vac
uum
Tan
k A
ir Pr
essu
re T
orr
Th
is p
lot s
umm
ariz
es th
e va
cuum
syst
em p
ress
ures
for t
he in
tegr
ated
test
. The
vac
uum
pre
ssur
es in
dica
te w
hen
the
4BM
S is
ven
ting
to v
acuu
m. T
he p
lot i
s sho
wn
agai
n w
ith a
mag
nifie
d tim
e lin
e on
the
next
pag
e.
128
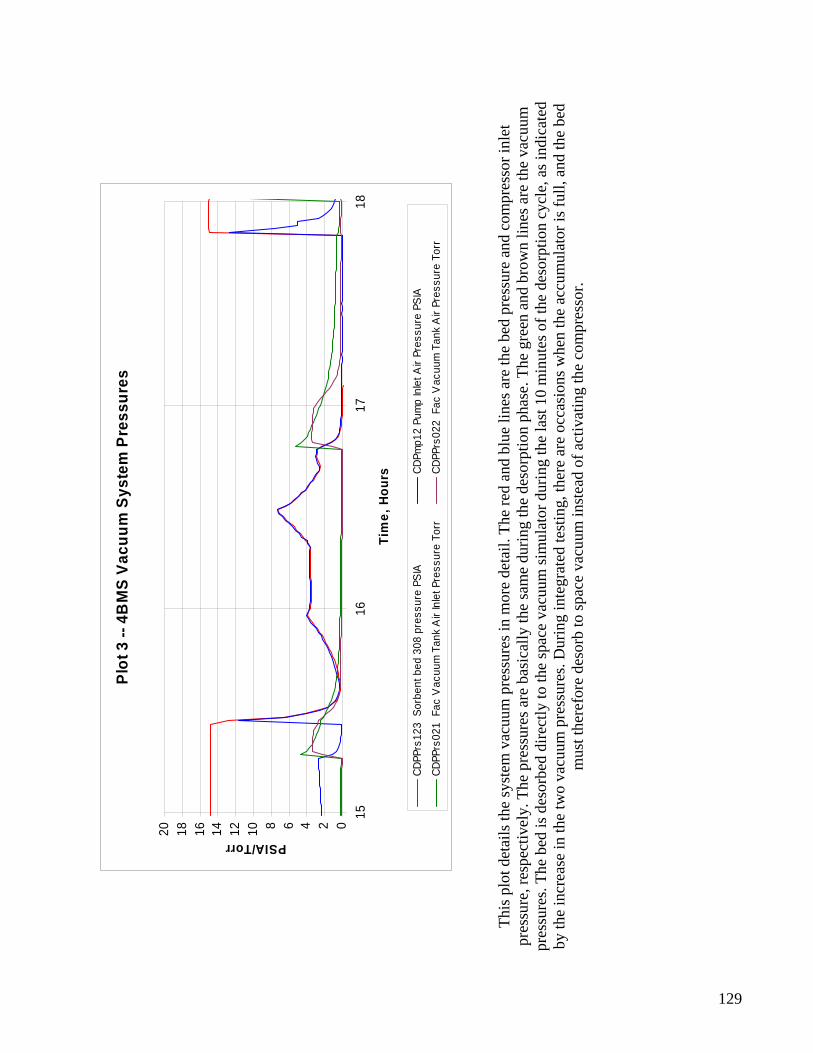
Plot
3 --
4B
MS
Vacu
um S
yste
m P
ress
ures
02468101214161820
1516
1718
Tim
e, H
ours
PSIA/Torr
CDPP
rs12
3 S
orbe
nt b
ed 3
08 p
ress
ure
PSIA
CDPm
p12
Pum
p In
let A
ir Pr
essu
re P
SIA
CDPP
rs02
1 F
ac V
acuu
m T
ank
Air
Inle
t Pre
ssur
e To
rr
CD
PPrs
022
Fac
Vac
uum
Tan
k A
ir Pr
essu
re T
orr
Th
is p
lot d
etai
ls th
e sy
stem
vac
uum
pre
ssur
es in
mor
e de
tail.
The
red
and
blue
line
s are
the
bed
pres
sure
and
com
pres
sor i
nlet
pr
essu
re, r
espe
ctiv
ely.
The
pre
ssur
es a
re b
asic
ally
the
sam
e du
ring
the
deso
rptio
n ph
ase.
The
gre
en a
nd b
row
n lin
es a
re th
e va
cuum
pr
essu
res.
The
bed
is d
esor
bed
dire
ctly
to th
e sp
ace
vacu
um si
mul
ator
dur
ing
the
last
10
min
utes
of t
he d
esor
ptio
n cy
cle,
as i
ndic
ated
by
the
incr
ease
in th
e tw
o va
cuum
pre
ssur
es. D
urin
g in
tegr
ated
test
ing,
ther
e ar
e oc
casi
ons w
hen
the
accu
mul
ator
is fu
ll, a
nd th
e be
d m
ust t
here
fore
des
orb
to sp
ace
vacu
um in
stea
d of
act
ivat
ing
the
com
pres
sor.
129

Plot
4 --
CED
U In
et a
nd O
utle
t Pre
ssur
es, O
utle
t Dew
Poi
nt
02468101214
01
23
45
67
89
1011
1213
1415
1617
1819
2021
2223
24
Inlet (PSIA)
-60
-40
-20
020406080100
120
140
Outlet (PSIA), Dew Point (deg F)
MED
Prs0
20 C
ompr
esso
r Inl
et P
ress
ure
PSIA
MED
Prs0
21 A
ccum
ulat
or P
ress
ure
or C
O2
inle
t PSI
A
MED
DP_0
20 M
echa
nica
l Com
pres
sor O
utle
t Dew
poin
t F
This
plo
t aga
in sh
ows t
he c
ompr
esso
r inl
et a
nd o
utle
t pre
ssur
e, a
nd a
lso
the
dew
poi
nt o
f the
pro
duct
CO
2. T
he d
ata
show
s tha
t the
de
w p
oint
nev
er e
xcee
ds 3
0 F,
eve
n at
hig
h ac
cum
ulat
or p
ress
ure.
The
re is
, the
refo
re, l
ittle
risk
of c
onde
nsat
ion
in e
ither
the
com
pres
sor o
r the
acc
umul
ator
.
130

Plot
5 --
Sor
bent
Bed
Hea
ter T
empe
ratu
res
050100
150
200
250
300
350
400
450
01
23
45
67
89
1011
1213
1415
1617
1819
2021
2223
24
Tim
e, H
ours
Temperature, degrees F
CDPm
t13
5A
Bed
308
Hea
ter T
emp
A F
CD
Pmt1
6 5
A B
ed 3
09 H
eate
r Tem
p A
F
This
plo
t sho
ws t
he te
mpe
ratu
re o
f the
two
mol
ecul
ar si
eve
beds
. The
hea
ter f
or th
e de
sorb
ing
bed
is tu
rned
on
full
pow
er u
ntil
the
bed
reac
hes 4
00 F
. The
hea
ter i
s the
n cy
cled
to m
aint
ain
the
bed
tem
pera
ture
whi
le th
e C
O2
is d
esor
bed.
131
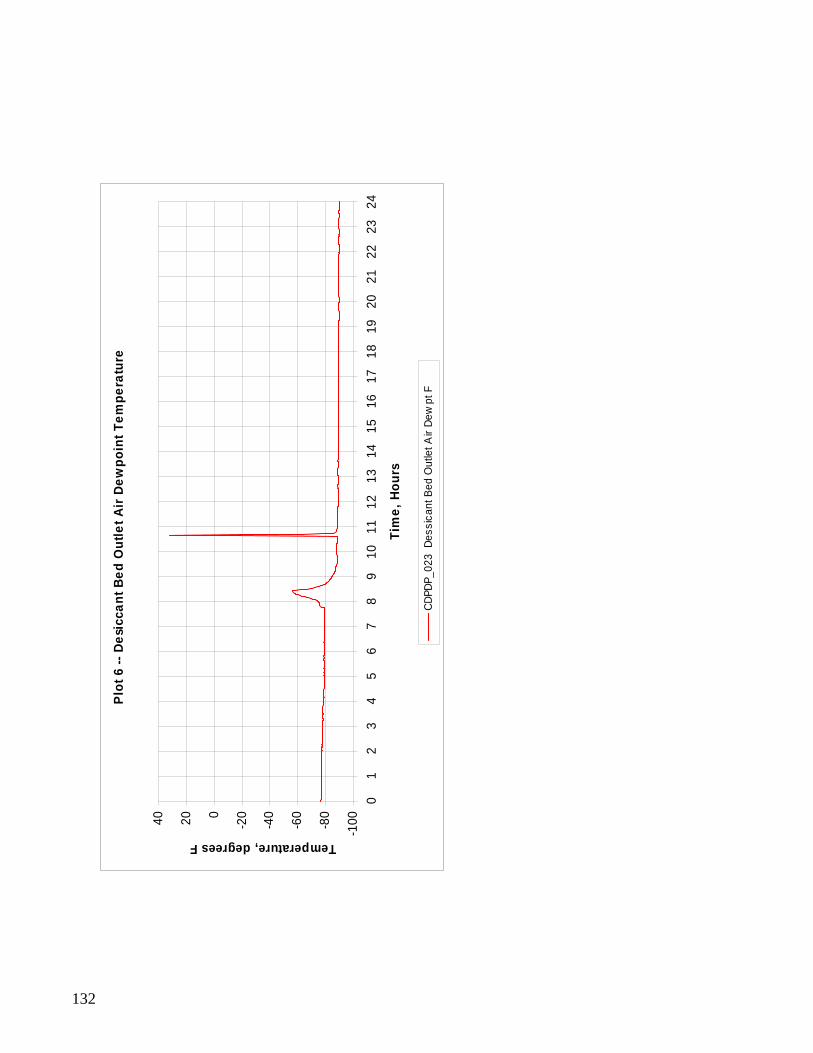
Plot
6 --
Des
icca
nt B
ed O
utle
t Air
Dew
poin
t Tem
pera
ture
-100-8
0
-60
-40
-2002040
01
23
45
67
89
1011
1213
1415
1617
1819
2021
2223
24
Tim
e, H
ours
Temperature, degrees F
CDPD
P_02
3 D
essi
cant
Bed
Out
let A
ir De
wpt
F
132
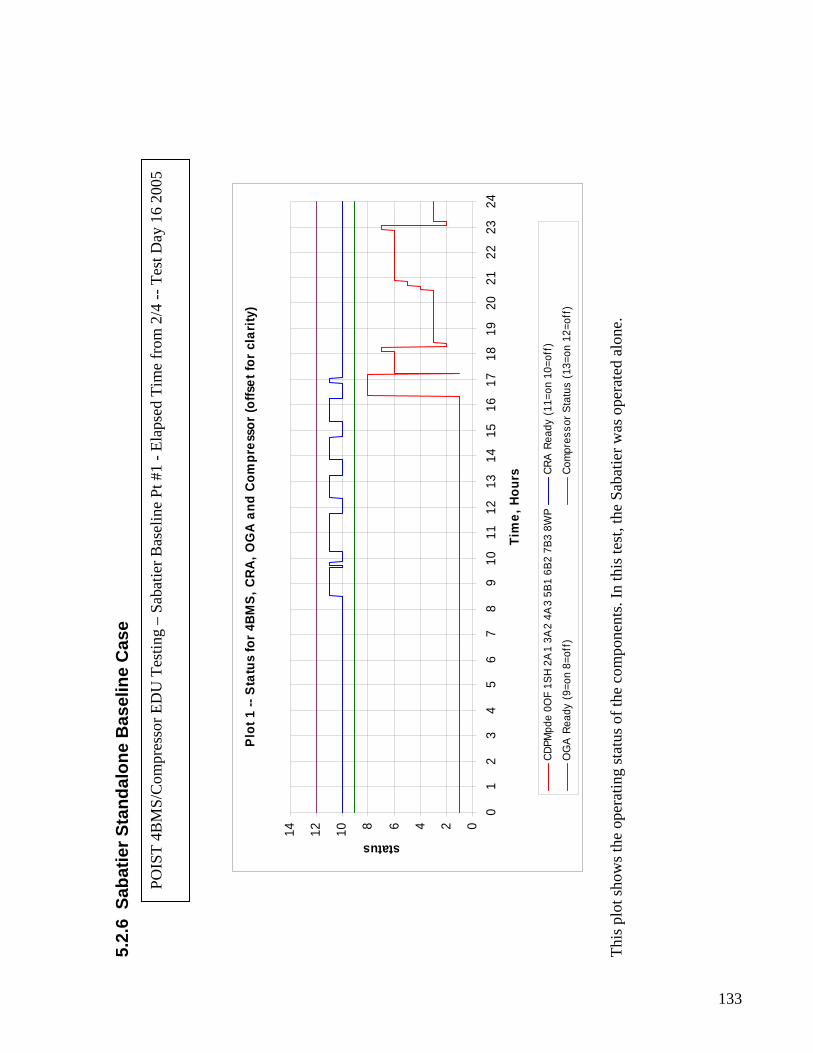
5.2.
6 Sa
batie
r Sta
ndal
one
Bas
elin
e C
ase
POIS
T 4B
MS/
Com
pres
sor E
DU
Tes
ting
– Sa
batie
r Bas
elin
e Pt
#1
- Ela
psed
Tim
e fr
om 2
/4 --
Tes
t Day
16
2005
Plot
1 --
Sta
tus
for 4
BMS,
CRA
, OG
A an
d Co
mpr
esso
r (of
fset
for c
larit
y)
02468101214
01
23
45
67
89
1011
1213
1415
1617
1819
2021
2223
24
Tim
e, H
ours
status
CDPM
pde
0OF
1SH
2A1
3A2
4A3
5B1
6B2
7B3
8WP
CRA
Rea
dy (1
1=on
10=
off)
OG
A R
eady
(9=o
n 8=
off)
Com
pres
sor S
tatu
s (1
3=on
12=
off)
This
plo
t sho
ws t
he o
pera
ting
stat
us o
f the
com
pone
nts.
In th
is te
st, t
he S
abat
ier w
as o
pera
ted
alon
e.
133

Plot
2 --
SED
U R
eact
or C
oolin
g C
ontro
l
0
200
400
600
800
1000
1200
01
23
45
67
89
1011
1213
1415
1617
1819
2021
2223
24
Tim
e, H
ours
Temperature (F)
0246810
Open/Closed, Flow (SLPM)
SEDT
Rea
ct A
Rea
ctor
Hot
Zon
e de
gFSE
DT R
eact
Out
Rea
ctor
Out
let d
egF
SEDR
eact
Cool
501
Coo
ling
Air
Val
ve 1
=clo
sed
0=op
enM
EDFl
w02
1 Sa
batie
r CO
2 Fl
ow S
LPM
H2 R
ate
adju
sted
, SLP
M (@
0°C)
Th
is p
lot s
how
s the
hyd
roge
n an
d ca
rbon
dio
xide
flow
rate
s alo
ng w
ith th
e te
mpe
ratu
res o
f the
reac
tor.
This
cas
e w
as ru
n at
full
flow
, 9
slpm
hyd
roge
n an
d 2.
7 sl
pm C
O2,
in c
yclic
ope
ratio
n. T
he re
acta
nt fl
ow is
on
for a
bout
53
min
utes
and
off
for 3
7 m
inut
es. T
he h
ot
zone
of t
he re
acto
r pea
ks o
ut a
t 100
0 F
whi
le re
acta
nts a
re fl
owin
g an
d co
ols d
own
to a
bout
500
F w
hen
the
flow
is st
oppe
d. T
he
reac
tor o
utle
t flo
w is
bel
ow 2
00 F
dur
ing
the
entir
e ru
n.
134

Plot
3 --
SED
U S
epar
ator
Lev
el C
ontro
l
0123456
01
23
45
67
89
1011
1213
1415
1617
1819
2021
2223
24
Tim
e, H
ours
On/Off, Delta Pressure (IWC)
0200
400
600
800
1000
1200
1400
1600
Weight (grams)
SEDP
UMP3
01 W
ater
pum
p 1=
on 0
=off
SEDD
P409
Sep
arat
or D
elta
Pre
ssur
e"H2
OSE
DMas
020
Saba
tier E
DU W
ater
Gra
ms
This
plo
t sho
ws t
he o
pera
tion
of th
e w
ater
col
lect
ion
tank
and
pum
p. T
he d
ata
is sh
own
mag
nifie
d in
the
next
plo
t.
135

Plot
3 --
SED
U S
epar
ator
Lev
el C
ontro
l
0123456
1112
1314
Tim
e, H
ours
On/Off, Delta Pressure (IWC)
0200
400
600
800
1000
1200
1400
1600
Weight (grams)
SEDP
UMP3
01 W
ater
pum
p 1=
on 0
=off
SEDD
P409
Sep
arat
or D
elta
Pre
ssur
e"H2
OSE
DMas
020
Saba
tier E
DU W
ater
Gra
ms
Th
is p
lot s
how
s the
ope
ratio
n of
the
wat
er se
para
tor i
n m
ore
deta
il. T
he sa
w to
oth
line
is th
e le
vel i
n th
e se
para
tor a
s mea
sure
d w
ith a
di
ffer
entia
l pre
ssur
e se
nsor
. Whe
n th
e le
vel r
each
es a
hig
h lim
it, th
e pu
mp
is a
ctiv
ated
for a
bout
5 se
cond
s. Th
e da
ta c
olle
ctio
n fo
r th
ese
test
s was
one
read
ing
per m
inut
e. M
any
times
, the
read
ing
did
not c
atch
the
activ
atio
n of
the
pum
p, w
hich
is w
hy o
nly
a fe
w
activ
atio
ns a
re sh
own
on th
e gr
aph.
The
wat
er w
eigh
t is m
easu
red
with
an
elec
troni
c sc
ale.
The
tim
e pe
riod
arou
nd h
our 1
2 w
ith n
o in
crea
se in
wat
er w
eigh
t is a
Sta
ndby
per
iod
for t
he S
abat
ier s
yste
m.
136

Plot
4 --
SED
U S
yste
m P
ress
ures
02468101214161820
01
23
45
67
89
1011
1213
1415
1617
1819
2021
2223
24
Tim
e, H
ours
PSIA
00.5
11.5
22.5
33.5
44.5
5
PSID
SEDP
006
Reac
tor i
nlet
pre
ssur
e PS
IASE
DP60
1 Re
acto
r out
let p
ress
ure
PSIA
SEDD
P405
Rea
ctor
Del
ta P
ress
ure
PSID
SEDD
P409
Sep
arat
or D
elta
Pre
ssur
e"H2
O
Th
is p
lot s
how
s the
pre
ssur
es th
roug
hout
the
Saba
tier s
yste
m. T
he m
aroo
n, sp
iked
line
s are
the
sam
e se
para
tor d
iffer
entia
l pre
ssur
e re
adin
g sh
own
in th
e pr
evio
us p
lot.
The
red
and
blue
line
s are
the
reac
tor i
nlet
and
out
let p
ress
ures
, res
pect
ivel
y. T
he re
acto
r is
evac
uate
d to
low
pre
ssur
e (<
2 p
sia)
eve
ry ti
me
the
syst
em tr
ansi
tions
to S
tand
by. T
he g
reen
line
is th
e re
acto
r diff
eren
tial p
ress
ure.
Th
e di
ffer
entia
l pre
ssur
e is
rela
ted
to fl
ow ra
te, a
nd is
less
than
1 p
sid
at fu
ll flo
w.
137

Plot
5 --
SED
U S
yste
m E
ffici
ency
0
500
1000
1500
2000
2500
3000
01
23
45
67
89
1011
1213
1415
1617
1819
2021
2223
24
Tim
e, H
ours
Weight (grams), Usage (lites)
Calc
H2O
Pro
d @
100
% E
ff, g
ram
Calc
H2O
Pro
d @
90%
Eff
, gra
mCa
lc H
2O P
rod
@ 8
0% E
ff, g
ram
H2O
Pro
duct
ion,
gra
ms
H2 U
seag
e Ra
te, L
iters
This
plo
t sho
ws t
he S
abat
ier w
ater
pro
duct
ion
rate
plo
tted
with
cal
cula
ted
effic
ienc
y ta
rget
s. Th
e ef
ficie
ncy
is c
alcu
late
d fr
om th
e us
age
rate
of h
ydro
gen.
Thi
s plo
t sho
ws t
he e
ffic
ienc
y to
be
abou
t 80%
. Thi
s plo
t is a
littl
e m
isle
adin
g fo
r eff
icie
ncy
beca
use
the
wat
er
wei
ght i
s not
reco
rded
unt
il th
e fir
st d
ump
out b
y th
e pu
mp,
and
ther
efor
e th
e in
vent
ory
of w
ater
in th
e sy
stem
is n
ot fu
lly a
ccou
nted
.
138

Plot
6 --
SED
U M
olar
Rat
io
012345678910
01
23
45
67
89
1011
1213
1415
1617
1819
2021
2223
2425
26
Tim
e, H
ours
Flow (SLPM @ 0 C)
00.5
11.5
22.5
33.5
4
Molar Ratio
H2 R
ate
adju
sted
, SLP
M (@
0°C)
Calc
MR
from
Act
ual F
low
MED
Flw
021
Saba
tier C
O2
Flow
SLP
M
Th
is p
lot s
how
s the
hyd
roge
n an
d ca
rbon
dio
xide
flow
s to
the
Saba
tier r
eact
or a
nd th
e ca
lcul
ated
mol
ar ra
tio. T
he st
oich
iom
etric
ratio
fo
r the
reac
tion
is 4
mol
es h
ydro
gen
per m
ole
of c
arbo
n di
oxid
e. S
ince
the
ISS
life
supp
ort c
lose
d lo
op m
ass b
alan
ce is
car
bon
diox
ide
rich,
the
reac
tor i
s con
trolle
d to
a m
olar
ratio
of 3
.5 to
ens
ure
that
all
of th
e av
aila
ble
hydr
ogen
is u
sed
in th
e re
actio
n.
139

Plot
7 --
SED
U C
O2
and
H2
Flow
00.
511.
522.
533.
544.
55
01
23
45
67
89
1011
1213
1415
1617
1819
2021
2223
24
Tim
e, H
ours
CO2 Flow (SLPM)
012345678910
H2 Flow (SLPM)
MED
Flw
021
Saba
tier C
O2
Flow
SLP
MDe
sire
d CO
2 Fl
ow (S
LPM
)SE
DMFC
H2
Mas
s Fl
ow S
LPM
This
plo
t sho
ws t
he C
O2
and
H2
flow
feed
s to
the
reac
tor.
In th
is te
st, t
he S
abat
ier w
as o
pera
ted
in c
yclic
mod
e, th
eref
ore
the
flow
s ar
e tu
rned
on
and
off f
or e
very
Pro
cess
/Sta
ndby
mod
e.
140

Plot
8 --
SED
U T
empe
ratu
res
0
200
400
600
800
1000
1200
01
23
45
67
89
1011
1213
1415
1617
1819
2021
2223
24
Tim
e, H
ours
Hot Zone and Inlet Temps
SEDT
Rea
ct A
Rea
ctor
Hot
Zon
e de
gFSE
DT R
eact
B R
eact
or H
ot Z
one
degF
SEDT
Rea
ct C
Rea
ctor
Inle
t deg
F
SEDT
Rea
ct D
Rea
ctor
Inle
t deg
FSE
DT R
eact
Out
Rea
ctor
Out
let d
egF
This
plo
t det
ails
the
tem
pera
ture
s in
the
Saba
tier r
eact
or. T
empe
ratu
res A
and
B a
re in
the
hot z
one
of th
e re
acto
r, w
hich
is a
bout
thre
e in
ches
from
the
inle
t end
. Tem
pera
ture
s C a
nd D
are
clo
ser t
o th
e in
let e
nd a
nd in
tend
ed to
be
used
to d
etec
t the
pre
senc
e of
air
in th
e in
let C
O2
stre
am. W
hile
the
reac
tant
s are
flow
ing
into
the
reac
tor,
the
heat
from
the
reac
tion
is c
ontin
uous
ly p
ushe
d to
war
d th
e af
t end
of
the
reac
tor b
ed. W
hen
the
flow
s sto
p (a
roun
d 11
.75
hour
s, 13
.25
hour
s, 14
hou
rs, e
tc) t
he h
otte
st p
art o
f the
reac
tion
zone
star
ts to
co
ol d
own,
but
the
inle
t end
of t
he re
acto
r im
med
iate
ly st
arts
to h
eat u
p du
e to
con
duct
ion
of h
eat f
rom
the
hot z
one.
The
out
let o
f the
re
acto
r fol
low
s the
sam
e co
olin
g tre
nd a
s the
hot
zon
e w
hen
the
reac
tant
s are
rem
oved
.
141

Plot
9 --
SED
U W
ater
Pro
duct
ion
Rat
e
0
200
400
600
800
1000
01
23
45
67
89
1011
1213
1415
1617
1819
2021
2223
24
Tim
e, H
ours
Rate (gm/hr)
012
Mode
H2O
Pro
duct
ion,
gra
ms
SEDS
tand
by S
tand
by M
ode
SEDP
roce
ss P
roce
ss M
ode
(C10
2)
Th
is p
lot d
etai
ls th
e w
ater
pro
duct
ion
rate
. The
wat
er p
rodu
ct is
reco
rded
on
a di
gita
l sca
le, w
hich
is in
crem
ente
d ev
ery
time
the
prod
uct w
ater
pum
p tu
rns o
n to
em
pty
the
sepa
rato
r. D
urin
g St
andb
y (w
hen
the
blue
line
is 1
and
the
gree
n lin
e is
0) t
here
is n
o ad
ditio
nal w
ater
pro
duct
ion,
and
the
red
line
is fl
at fo
r the
dur
atio
n. O
nce
Proc
ess m
ode
star
ts a
gain
, the
wat
er p
rodu
ctio
n st
arts
aga
in.
142
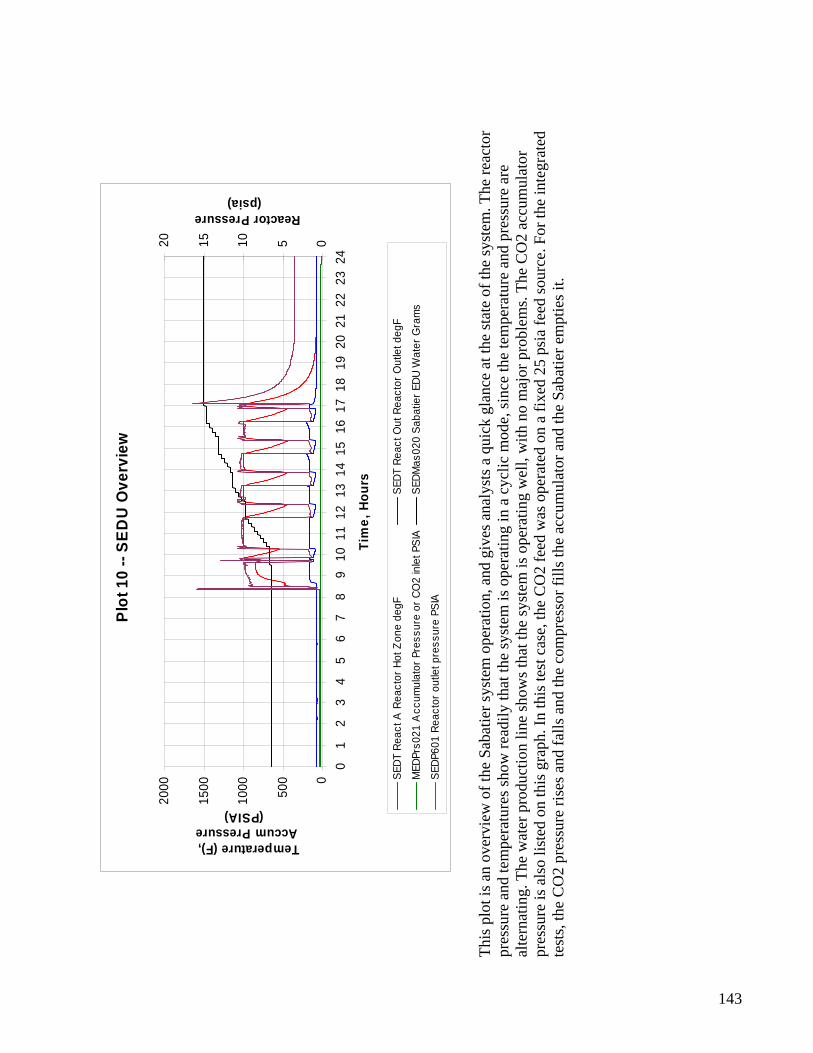
Plot
10
-- SE
DU
Ove
rvie
w
0
500
1000
1500
2000
01
23
45
67
89
1011
1213
1415
1617
1819
2021
2223
24
Tim
e, H
ours
Temperature (F), Accum Pressure
(PSIA)
05101520
Reactor Pressure (psia)
SEDT
Rea
ct A
Rea
ctor
Hot
Zon
e de
gFSE
DT R
eact
Out
Rea
ctor
Out
let d
egF
MED
Prs0
21 A
ccum
ulat
or P
ress
ure
or C
O2
inle
t PSI
ASE
DMas
020
Saba
tier E
DU W
ater
Gra
ms
SEDP
601
Reac
tor o
utle
t pre
ssur
e PS
IA
Th
is p
lot i
s an
over
view
of t
he S
abat
ier s
yste
m o
pera
tion,
and
giv
es a
naly
sts a
qui
ck g
lanc
e at
the
stat
e of
the
syst
em. T
he re
acto
r pr
essu
re a
nd te
mpe
ratu
res s
how
read
ily th
at th
e sy
stem
is o
pera
ting
in a
cyc
lic m
ode,
sinc
e th
e te
mpe
ratu
re a
nd p
ress
ure
are
alte
rnat
ing.
The
wat
er p
rodu
ctio
n lin
e sh
ows t
hat t
he sy
stem
is o
pera
ting
wel
l, w
ith n
o m
ajor
pro
blem
s. Th
e C
O2
accu
mul
ator
pr
essu
re is
als
o lis
ted
on th
is g
raph
. In
this
test
cas
e, th
e C
O2
feed
was
ope
rate
d on
a fi
xed
25 p
sia
feed
sour
ce. F
or th
e in
tegr
ated
te
sts,
the
CO
2 pr
essu
re ri
ses a
nd fa
lls a
nd th
e co
mpr
esso
r fill
s the
acc
umul
ator
and
the
Saba
tier e
mpt
ies i
t.
143

Plot
11
-- SE
DU
Sta
tus
024681012
01
23
45
67
89
1011
1213
1415
1617
1819
2021
2223
24
Tim
e, H
ours
Status
01020304050
Pressure (psia)
OG
A R
eady
(9=o
n 8=
off)
CRA
Rea
dy (1
1=on
10=
off)
SEDS
tand
by S
tand
by M
ode
SEDP
roce
ss P
roce
ss M
ode
(C10
2)
MED
Prs0
21 A
ccum
ulat
or P
ress
ure
or C
O2
inle
t PSI
A
Th
is p
lot s
how
s the
stat
us o
f som
e of
the
syst
ems i
n th
e in
tegr
ated
test
. The
OG
A st
atus
(off
for t
his s
tand
alo
ne te
st) i
s giv
en a
long
w
ith th
e Sa
batie
r Pro
cess
or S
tand
by m
odes
. The
acc
umul
ator
pre
ssur
e is
giv
en h
ere
as w
ell,
whi
ch is
mor
e in
form
ativ
e fo
r the
in
tegr
ated
test
s.
144

Plot
12
-- SE
DU
CO
2 Fl
ow C
ontro
l Acc
urac
y
0
0.51
1.52
2.53
3.54
01
23
45
67
89
1011
1213
1415
1617
1819
2021
2223
24
Tim
e, H
ours
Flow (SLPM), Reactor Press (psia)
051015202530
Accum Pressure (PSIA)
MED
Flw
021
Saba
tier C
O2
Flow
SLP
MDe
sire
d CO
2 Fl
ow (S
LPM
)
MED
Prs0
21 A
ccum
ulat
or P
ress
ure
or C
O2
inle
t PSI
ASE
DP00
6 Re
acto
r inl
et p
ress
ure
PSIA
This
plo
t sho
ws t
he a
ccur
acy
of th
e C
O2
flow
con
trol.
The
Saba
tier r
equi
red
deve
lopm
ent o
f a fl
ow c
ontro
l for
spac
e fli
ght u
se. T
he
Saba
tier E
DU
inco
rpor
ated
a m
otor
driv
e co
ntro
l val
ve. T
his p
lot s
how
s tha
t the
act
ual f
low
met
the
desi
red
flow
ove
r the
rang
e of
in
let p
ress
ures
use
d fo
r thi
s tes
t.
145
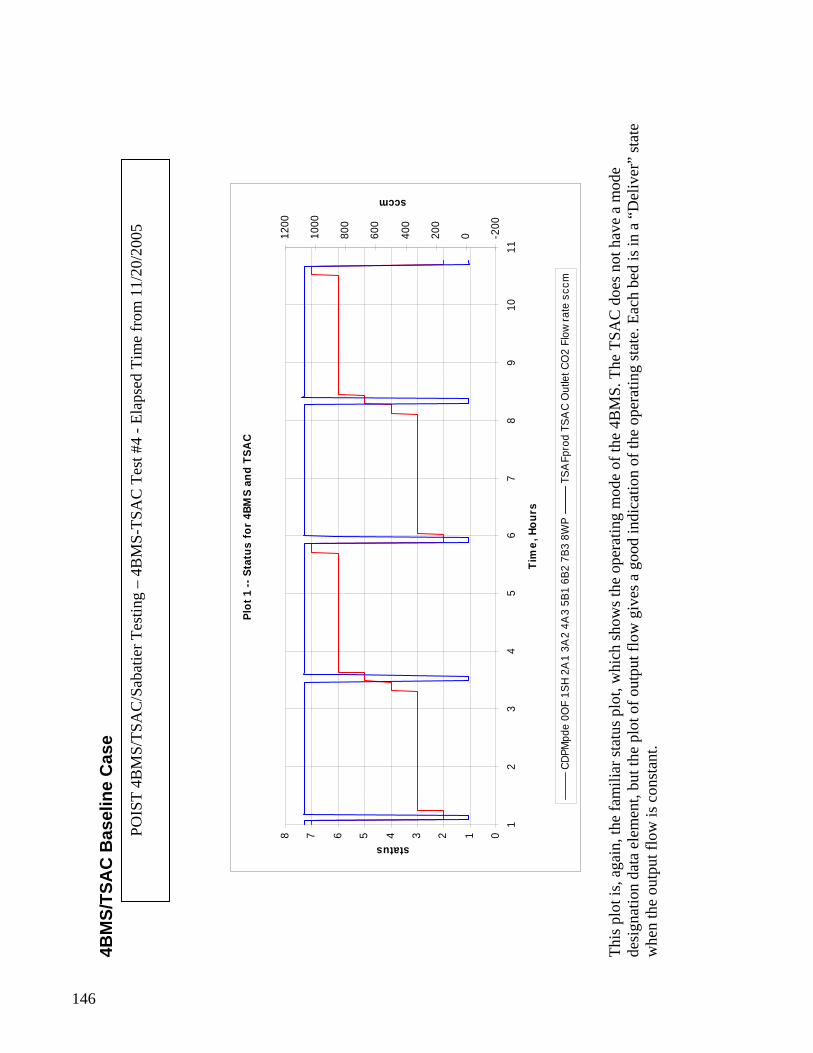
4BM
S/TS
AC
Bas
elin
e C
ase
PO
IST
4BM
S/TS
AC
/Sab
atie
r Tes
ting
– 4B
MS-
TSA
C T
est #
4 - E
laps
ed T
ime
from
11/
20/2
005
Plot
1 --
Sta
tus
for
4BM
S an
d TS
AC
012345678
12
34
56
78
910
11
Tim
e, H
ours
status
-200
0200
400
600
800
1000
1200
sccm
CDPM
pde
0OF
1SH
2A1
3A2
4A3
5B1
6B2
7B3
8WP
TSA
Fpro
d TS
AC
Out
let C
O2
Flow
rate
scc
m
This
plo
t is,
agai
n, th
e fa
mili
ar st
atus
plo
t, w
hich
show
s the
ope
ratin
g m
ode
of th
e 4B
MS.
The
TSA
C d
oes n
ot h
ave
a m
ode
desi
gnat
ion
data
ele
men
t, bu
t the
plo
t of o
utpu
t flo
w g
ives
a g
ood
indi
catio
n of
the
oper
atin
g st
ate.
Eac
h be
d is
in a
“D
eliv
er”
stat
e w
hen
the
outp
ut fl
ow is
con
stan
t.
146

Plot
13
-- T
SAC
Inte
rnal
Pre
ssur
es
0
200
400
600
800
1000
1200
12
34
56
78
910
11
Tim
e, H
ours
Pressure, torr
TSA
P1 B
ed A
Inte
rnal
Pre
ssur
e to
rrTS
AP2
Bed
B In
tern
al P
ress
ure
torr
Th
is p
lot s
how
s the
pre
ssur
es o
f the
CO
2 pr
oduc
t in
each
of t
he tw
o TS
AC
bed
s. W
hen
the
beds
are
des
orbi
ng, t
he p
ress
ure
is
mai
ntai
ned
at 1
000
torr
for t
he d
urat
ion
of th
e de
sorb
cyc
le.
147

Plot
14
-- T
SAC
Bed
A T
empe
ratu
res
050100
150
200
250
300
350
12
34
56
78
910
11
Tim
e, H
ours
Temperature, °C
TSA
HA1
Bed
A H
eate
r 1 T
empe
ratu
re C
TSA
HA3
Bed
A H
eate
r 3 T
empe
ratu
re C
TSA
ExtW
alA
Bed
A E
xter
nal W
all T
empe
ratu
re C
TSA
Touc
hA B
ed A
Tou
ch T
empe
ratu
re
Th
is p
lot s
how
s the
tem
pera
ture
pro
file
for B
ed “
A”.
The
sign
ifica
nce
of th
e cu
rves
is e
xpla
ined
for p
lot n
umbe
r 16
whi
ch sh
ows
tem
pera
ture
s and
pre
ssur
es to
geth
er.
148

Plot
15
-- T
SAC
Bed
B T
empe
ratu
res
050100
150
200
250
300
12
34
56
78
910
11
Tim
e, H
ours
Temperature, °C
TSA
HB1
Bed
B He
ater
1 T
empe
ratu
re C
TSA
HB3
Bed
B He
ater
3 T
empe
ratu
re C
TSA
ExtW
alB
Bed
B Ex
tern
al W
all T
empe
ratu
re C
TSA
Touc
hB B
ed B
Tou
ch T
empe
ratu
re C
Th
is p
lot s
how
s the
tem
pera
ture
pro
file
for B
ed “
B”.
149

Plot
16
-- T
SAC
Bed
A P
ress
ures
and
Tem
pera
ture
s
0
200
400
600
800
1000
1200
12
34
56
78
910
11
Tim
e, H
ours
Pressure, torr
050100
150
200
250
300
350
Temperature, °C
TSA
P1 B
ed A
Inte
rnal
Pre
ssur
e to
rrTS
AA
irInA
Bed
A C
oolin
g A
ir In
let T
empe
ratu
re C
TSA
AirO
utA
Bed
A C
oolin
g A
ir O
utle
t Tem
pera
ture
CTS
AEx
tWal
A B
ed A
Ext
erna
l Wal
l Tem
pera
ture
C
TSA
HA1
Bed
A H
eate
r 1 T
empe
ratu
re C
TSA
HA3
Bed
A H
eate
r 3 T
empe
ratu
re C
Th
is p
lot s
how
s the
tem
pera
ture
s and
pre
ssur
es to
geth
er. W
hen
Bed
A tr
ansi
tions
into
des
orb
mod
e (a
bout
5.5
hou
rs o
n th
e pl
ot) t
he
heat
ers a
re tu
rned
on
and
the
tem
pera
ture
and
pre
ssur
e of
the
bed
quic
kly
rise.
Eve
n th
ough
the
bed
tem
pera
ture
and
pre
ssur
e ar
e no
t at
the
max
imum
at h
our 6
.0, t
he b
ed is
cap
able
of d
eliv
erin
g fu
ll flo
w a
t thi
s tim
e (s
ee p
lot 1
). Th
e te
mpe
ratu
re a
nd p
ress
ure
cont
inue
to
rise
unt
il th
e de
liver
y pr
essu
re o
f 100
0 to
rr is
reac
hed
and
deliv
ery
is in
itiat
ed. O
nce
the
deliv
ery
pres
sure
is m
et, t
he h
eate
r pow
er
is re
duce
d to
mai
ntai
n th
e pr
essu
re a
nd th
e te
mpe
ratu
re m
omen
taril
y dr
ops.
As C
O2
is d
raw
n of
f the
bed
, the
tem
pera
ture
is in
crea
sed
to m
aint
ain
pres
sure
unt
il th
e en
d of
the
cycl
e (h
our 8
.5 o
n th
e pl
ot).
Upo
n sw
itchi
ng b
eds,
the
bed
that
was
pre
viou
sly
deso
rbin
g is
is
olat
ed a
nd c
oole
d to
redu
ce th
e in
tern
al p
ress
ure,
pre
parin
g it
for a
dsor
ptio
n fr
om th
e 4B
MS,
150

Plot
18
-- T
SAC
Inle
t Flo
w R
ate
-5000
500
1000
1500
2000
2500
3000
3500
12
34
56
78
910
11
Tim
e, H
ours
CO2 flow, sccm
TSA
Fcdr
a TS
AC
Inle
t CO
2 Fl
owra
te s
ccm
Th
is p
lot s
how
s the
flow
rate
of C
O2
from
the
4BM
S in
to th
e TS
AC
. The
CO
2 co
mes
off
the
4BM
S in
a w
ave,
and
the
saw
toot
h flo
w
patte
rn a
t the
end
of e
ach
cycl
e is
due
to th
e os
cilla
ting
heat
er c
ontro
l in
the
4BM
S as
the
last
of t
he C
O2
is d
esor
bed
from
the
4BM
S be
d.
151
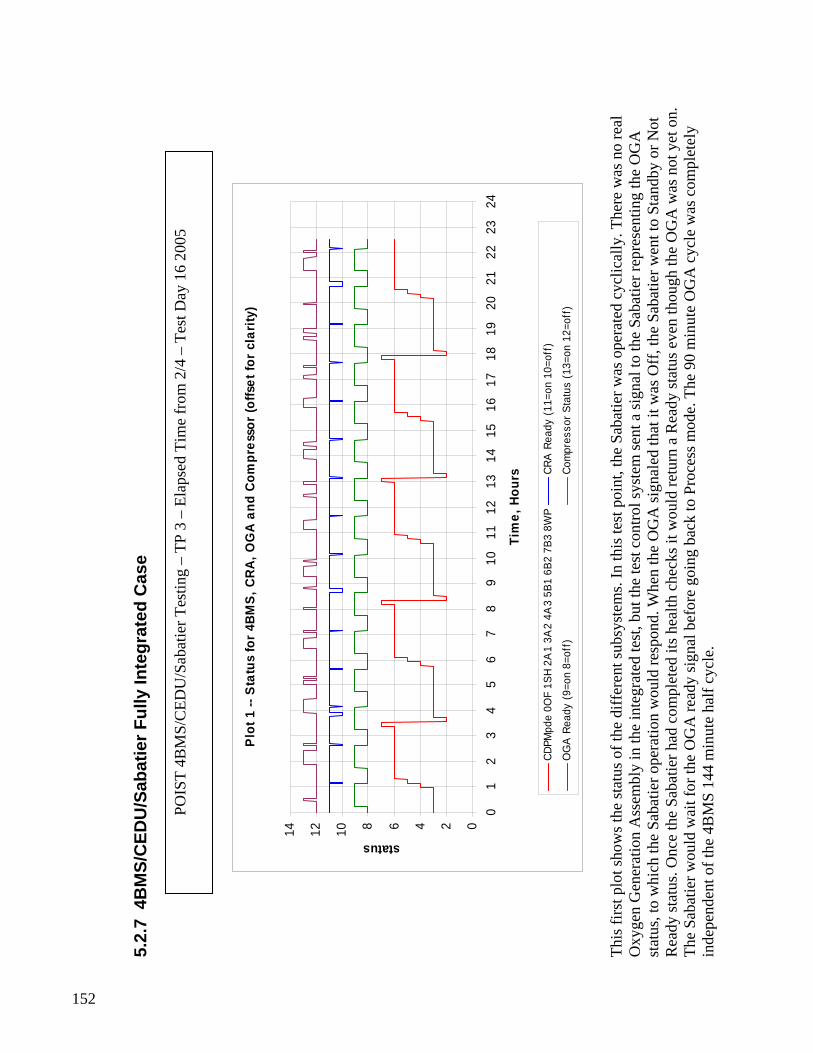
5.2.
7 4B
MS/
CED
U/S
abat
ier F
ully
Inte
grat
ed C
ase
PO
IST
4BM
S/C
EDU
/Sab
atie
r Tes
ting
– TP
3 –
Ela
psed
Tim
e fr
om 2
/4 –
Tes
t Day
16
2005
Plot
1 --
Sta
tus
for 4
BMS,
CRA
, OG
A an
d Co
mpr
esso
r (of
fset
for c
larit
y)
02468101214
01
23
45
67
89
1011
1213
1415
1617
1819
2021
2223
24
Tim
e, H
ours
status
CDPM
pde
0OF
1SH
2A1
3A2
4A3
5B1
6B2
7B3
8WP
CRA
Rea
dy (1
1=on
10=
off)
OG
A R
eady
(9=o
n 8=
off)
Com
pres
sor S
tatu
s (1
3=on
12=
off)
Th
is fi
rst p
lot s
how
s the
stat
us o
f the
diff
eren
t sub
syst
ems.
In th
is te
st p
oint
, the
Sab
atie
r was
ope
rate
d cy
clic
ally
. The
re w
as n
o re
al
Oxy
gen
Gen
erat
ion
Ass
embl
y in
the
inte
grat
ed te
st, b
ut th
e te
st c
ontro
l sys
tem
sent
a si
gnal
to th
e Sa
batie
r rep
rese
ntin
g th
e O
GA
st
atus
, to
whi
ch th
e Sa
batie
r ope
ratio
n w
ould
resp
ond.
Whe
n th
e O
GA
sign
aled
that
it w
as O
ff, t
he S
abat
ier w
ent t
o St
andb
y or
Not
R
eady
stat
us. O
nce
the
Saba
tier h
ad c
ompl
eted
its h
ealth
che
cks i
t wou
ld re
turn
a R
eady
stat
us e
ven
thou
gh th
e O
GA
was
not
yet
on.
Th
e Sa
batie
r wou
ld w
ait f
or th
e O
GA
read
y si
gnal
bef
ore
goin
g ba
ck to
Pro
cess
mod
e. T
he 9
0 m
inut
e O
GA
cyc
le w
as c
ompl
etel
y in
depe
nden
t of t
he 4
BM
S 14
4 m
inut
e ha
lf cy
cle.
152

Plot
2 --
SED
U R
eact
or C
oolin
g C
ontro
l
0
200
400
600
800
1000
1200
01
23
45
67
89
1011
1213
1415
1617
1819
2021
2223
24
Tim
e, H
ours
Temperature (F)
0123456
Open/Closed, Flow (SLPM)
SEDT
Rea
ct A
Rea
ctor
Hot
Zon
e de
gFSE
DT R
eact
Out
Rea
ctor
Out
let d
egF
SEDR
eact
Cool
501
Coo
ling
Air
Val
ve 1
=clo
sed
0=op
enM
EDFl
w02
1 Sa
batie
r CO
2 Fl
ow S
LPM
H2 R
ate
adju
sted
, SLP
M (@
0°C)
Th
is p
lot s
how
s the
reac
tor t
empe
ratu
res a
nd c
oolin
g co
ntro
l ope
ratio
n. T
he c
oolin
g ai
r val
ve w
as se
t to
open
to m
aint
ain
the
reac
tor
exit
tem
pera
ture
bel
ow 3
00 F
. Sin
ce th
is c
ase
was
cyc
lic o
pera
tion
at 3
cre
w ra
te o
f hyd
roge
n flo
w, t
he te
mpe
ratu
re w
as a
lway
s bel
ow
300
F an
d th
e co
olin
g ai
r val
ve w
as a
lway
s kep
t clo
sed.
As t
he S
abat
ier c
ycle
d fr
om P
roce
ss to
Sta
ndby
, the
hyd
roge
n an
d C
O2
flow
to
the
reac
tor w
as st
oppe
d an
d th
e re
acto
r wou
ld n
atur
ally
coo
l off
unt
il th
e ne
xt P
roce
ss c
ycle
beg
an a
nd th
e re
acto
r hea
ted
itsel
f up
agai
n.
153

Plot
3 --
SED
U S
epar
ator
Lev
el C
ontro
l
0123456
78
910
1112
Tim
e, H
ours
On/Off, Delta Pressure (IWC)
1000
1100
1200
1300
1400
1500
1600
Weight (grams)
SEDP
UMP3
01 W
ater
pum
p 1=
on 0
=off
SEDD
P409
Sep
arat
or D
elta
Pre
ssur
e"H2
OSE
DMas
020
Saba
tier E
DU W
ater
Gra
ms
Th
is p
lot s
how
s the
leve
l con
trol i
n th
e ph
ase
sepa
rato
r of t
he S
abat
ier.
Sinc
e th
e sy
stem
is o
pera
ting
cycl
ical
ly, t
here
are
per
iods
whe
n th
e le
vel i
n th
e se
para
tor s
tops
incr
easi
ng. T
his i
s the
tim
e w
hen
the
Saba
tier i
s in
Stan
dby
and
wat
er g
ener
atio
n ce
ases
. The
gra
dual
ly
incr
easi
ng sl
ope
of th
e bl
ue li
ne is
whe
n w
ater
is g
ener
ated
at a
con
stan
t rat
e du
ring
Proc
ess m
ode.
The
shar
p ve
rtica
l lin
es a
re si
mpl
y irr
egul
ar d
ata
from
the
diff
eren
tial p
ress
ure
sens
or. T
he o
rang
e lin
e re
pres
ents
the
accu
mul
ated
wat
er p
rodu
ct th
at is
reco
rded
by
a di
gita
l sca
le. T
he to
tal i
ncre
ases
in st
eps a
s the
wat
er fr
om th
e se
para
tor i
s per
iodi
cally
pum
ped
out t
o th
e re
serv
oir o
n th
e sc
ale.
Eac
h tim
e th
e w
ater
is p
umpe
d ou
t, th
e le
vel d
ecre
ases
and
then
star
ts sl
owly
bui
ldin
g ag
ain.
The
dat
a co
llect
ion
is o
nce
per m
inut
e, a
nd th
e pu
mp
oper
atio
n on
ly la
sts 5
seco
nds,
so ra
rely
is th
e pu
mp
activ
ity c
aptu
red
by th
e da
ta st
ream
.
154

Plot
4 --
SED
U S
yste
m P
ress
ures
02468101214161820
01
23
45
67
89
1011
1213
1415
1617
1819
2021
2223
24
Tim
e, H
ours
PSIA
012345678910
PSID
SEDP
006
Reac
tor i
nlet
pre
ssur
e PS
IASE
DP60
1 Re
acto
r out
let p
ress
ure
PSIA
SEDD
P405
Rea
ctor
Del
ta P
ress
ure
PSID
SEDD
P409
Sep
arat
or D
elta
Pre
ssur
e"H2
O
This
plo
t sho
ws t
he d
iffer
ent p
ress
ures
with
in th
e Sa
batie
r sys
tem
. The
reac
tor i
nlet
and
out
let p
ress
ures
var
y fr
om 1
2 an
d 10
psi
a (r
espe
ctiv
ely)
dur
ing
the
Proc
ess m
ode
to a
bout
1 p
sia
durin
g th
e St
andb
y m
ode.
Dur
ing
each
Sta
ndby
per
iod,
the
reac
tor i
s eva
cuat
ed
to sp
ace
vacu
um to
exh
aust
the
pote
ntia
lly fl
amm
able
gas
es. W
hile
the
pres
sure
is lo
w, t
he sy
stem
doe
s a se
lf ch
eck
to d
eter
min
e if
ther
e ar
e an
y le
aks.
The
reac
tor d
iffer
entia
l pre
ssur
e is
abo
ut 1
psi
d w
hile
gas
is fl
owin
g, a
nd it
goe
s to
zero
dur
ing
the
Stan
dby
perio
d of
no
flow
.
155

Plot
5 --
SED
U S
yste
m E
ffici
ency
0
500
1000
1500
2000
2500
3000
3500
12
34
56
78
910
1112
1314
1516
1718
1920
2122
2324
Tim
e, H
ours
Weight (grams), Usage (lites)
Calc
H2O
Pro
d @
100
% E
ff, g
ram
Calc
H2O
Pro
d @
90%
Eff
, gra
mCa
lc H
2O P
rod
@ 8
0% E
ff, g
ram
H2O
Pro
duct
ion,
gra
ms
H2 U
seag
e Ra
te, L
iters
Th
is p
lot s
how
s the
act
ual w
ater
pro
duct
ion
and
the
calc
ulat
ed p
rodu
ctio
n ba
sed
on d
iffer
ent e
ffic
ienc
y ra
tes.
The
top
line
is th
e hy
drog
en u
sage
, and
it le
vels
off
eve
ry ti
me
the
syst
em sw
itche
s int
o st
andb
y. T
he H
2O P
rodu
ctio
n lin
e is
the
sam
e va
lue
from
the
digi
tal s
cale
as w
as sh
own
on th
e le
vel c
ontro
l plo
t (#3
). Th
e ca
lcul
ated
pro
duct
ion
valu
es a
re th
e am
ount
of w
ater
that
wou
ld b
e co
llect
ed if
the
syst
em o
pera
ted
at th
e st
ated
eff
icie
ncy.
For
100
% e
ffic
ienc
y, th
e w
ater
gen
erat
ion
rate
is 0
.4 g
ram
s wat
er p
er st
anda
rd
liter
of h
ydro
gen
cons
umed
.
156

Plot
6 --
SED
U M
olar
Rat
io
012345
01
23
45
67
89
1011
1213
1415
1617
1819
2021
2223
24
Tim
e, H
ours
Flow (SLPM @ 0 C)
012345
Molar Ratio
H2 R
ate
adju
sted
, SLP
M (@
0°C)
MED
Flw
021
Saba
tier C
O2
Flow
SLP
MCa
lc M
R fr
om A
ctua
l Flo
w
This
plo
t sho
ws t
he fl
ow c
ontro
l of t
he h
ydro
gen
and
carb
on d
ioxi
de. T
he h
ydro
gen
is c
ontro
lled
by a
mas
s flo
w c
ontro
ller a
nd is
th
eref
ore
very
con
stan
t. Th
e C
O2
is c
ontro
lled
by a
mot
oriz
ed v
alve
and
mus
t res
pond
to th
e ch
angi
ng C
O2
accu
mul
ator
pre
ssur
e. T
he
CO
2 flo
w c
ontro
l is n
ot a
s con
stan
t as t
he h
ydro
gen,
but
the
mol
ar ra
tion
rem
ains
ver
y cl
ose
to 3
.5 th
roug
hout
the
test
.
157

Plot
8 --
SED
U T
empe
ratu
res
0
200
400
600
800
1000
1200
01
23
45
67
89
1011
1213
1415
1617
1819
2021
2223
24
Tim
e, H
ours
Hot Zone and Inlet Temps
SEDT
Rea
ct A
Rea
ctor
Hot
Zon
e de
gFSE
DT R
eact
B R
eact
or H
ot Z
one
degF
SEDT
Rea
ct C
Rea
ctor
Inle
t deg
F
SEDT
Rea
ct D
Rea
ctor
Inle
t deg
FSE
DT R
eact
Out
Rea
ctor
Out
let d
egF
Th
is p
lot s
how
s the
Sab
atie
r rea
ctor
tem
pera
ture
s dur
ing
test
ing.
It is
the
sam
e ch
arac
teris
tic a
s the
Sab
atie
r sta
nd a
lone
test
ing.
158

Plot
9 --
SED
U W
ater
Pro
duct
ion
Rat
e
0
200
400
600
800
1000
01
23
45
67
89
1011
1213
1415
1617
1819
2021
2223
24
Tim
e, H
ours
Rate (gm/hr)
012
Mode
H2O
Pro
duct
ion,
gra
ms
SEDS
tand
by S
tand
by M
ode
SEDO
GA
REA
DY S
tatu
s 1=
on 0
=off
Th
is p
lot s
how
s the
wat
er p
rodu
ctio
n ra
te o
verla
id w
ith th
e Sa
batie
r Rea
dy st
atus
. The
wat
er c
olle
cted
incr
ease
s onl
y w
hile
the
syst
em
is in
Pro
cess
mod
e an
d no
t in
Stan
dby.
159

Plot
10
-- SE
DU
Ove
rvie
w
0
400
800
1200
1600
2000
01
23
45
67
89
1011
1213
1415
1617
1819
2021
2223
24
Tim
e, H
ours
Temperature (F), Accum Pressure (PSIA)
02468101214161820
Reactor Pressure (psia)
SEDT
Rea
ct A
Rea
ctor
Hot
Zon
e de
gFSE
DT R
eact
Out
Rea
ctor
Out
let d
egF
MED
Prs0
21 A
ccum
ulat
or P
ress
ure
or C
O2
inle
t PSI
ASE
DMas
020
Saba
tier E
DU W
ater
Gra
ms
SEDP
601
Reac
tor o
utle
t pre
ssur
e PS
IA
Th
is p
lot i
s an
over
view
of t
he S
abat
ier s
yste
m o
pera
tion.
It sh
ows t
he a
ccum
ulat
or p
ress
ure,
syst
em p
ress
ure,
reac
tor t
empe
ratu
res
and
the
cum
ulat
ive
wat
er p
rodu
ct c
olle
cted
. With
this
one
plo
t, on
e ca
n te
ll th
at th
e sy
stem
is o
pera
ting
in c
yclic
mor
e, th
e te
mpe
ratu
res a
re st
able
and
the
outle
t tem
pera
ture
is c
ool e
noug
h to
not
nee
d co
olin
g ai
r. Th
e ac
cum
ulat
or p
ress
ure
is re
lativ
ely
low
(a
bout
50
psi)
thro
ugho
ut th
e cy
cles
.
160

Plot
11
-- SE
DU
Sta
tus
02468101214
23
45
67
8
Tim
e, H
ours
Status
010203040506070
Pressure (psia)
OG
A R
eady
(9=o
n 8=
off)
CRA
Rea
dy (1
1=on
10=
off)
SEDS
tand
by S
tand
by M
ode
SEDC
ompr
esso
r com
man
d 1=
on 0
=off
MED
Prs0
21 A
ccum
ulat
or P
ress
ure
or C
O2
inle
t PSI
A
This
plo
t sho
ws t
he st
atus
of t
he d
iffer
ent o
pera
ting
syst
ems a
nd th
e ac
cum
ulat
or p
ress
ure
with
the
time
scal
e m
agni
fied.
At a
bout
3.8
ho
urs,
the
pres
sure
in th
e ac
cum
ulat
or d
ips b
elow
20
psia
. The
Sab
atie
r has
to tr
ansi
tion
to S
tand
by m
ode
durin
g th
is ti
me
that
ther
e is
in
suff
icie
nt C
O2,
and
ther
efor
e th
e Sa
batie
r sta
tus i
s Not
Rea
dy. E
ach
time
the
com
pres
sor t
urns
on
(bot
tom
line
) the
pre
ssur
e in
the
accu
mul
ator
incr
ease
s. W
hen
the
OG
A is
ope
ratin
g an
d th
e Sa
batie
r is i
n Pr
oces
s (re
d lin
e) th
e pr
essu
re in
the
accu
mul
ator
dec
reas
es
as C
O2
is d
raw
n ou
t.
161
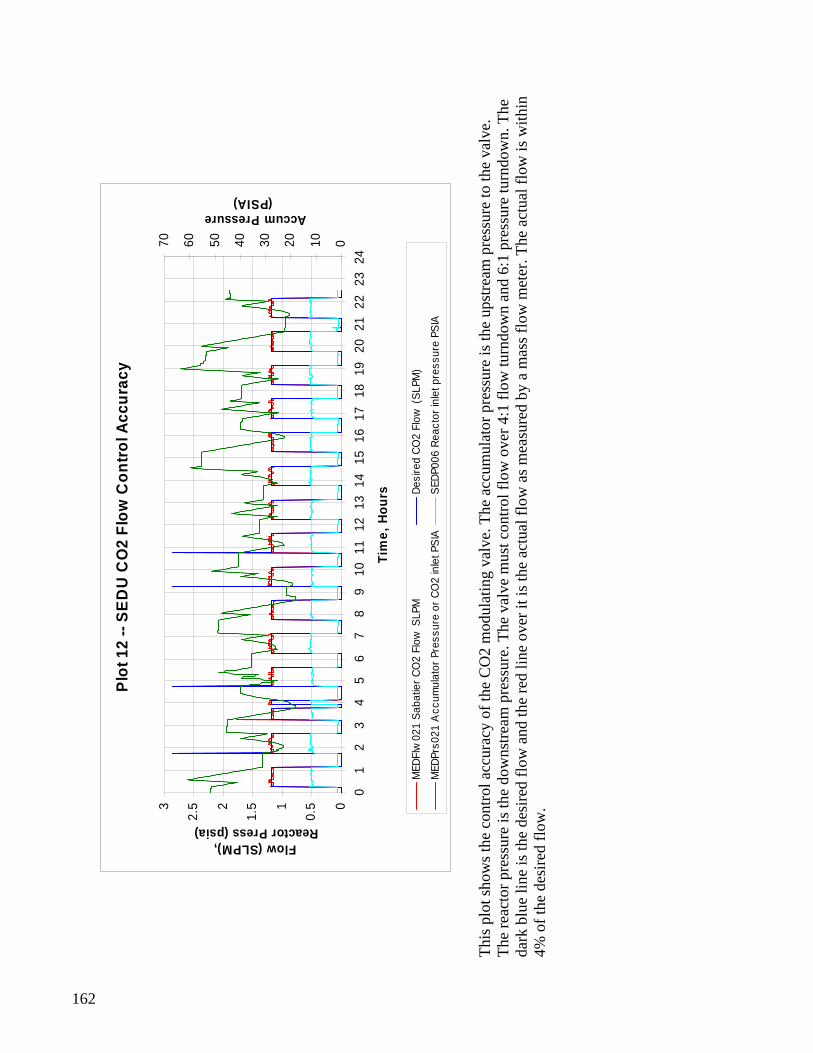
Plot
12
-- SE
DU
CO
2 Fl
ow C
ontro
l Acc
urac
y
0
0.51
1.52
2.53
01
23
45
67
89
1011
1213
1415
1617
1819
2021
2223
24
Tim
e, H
ours
Flow (SLPM), Reactor Press (psia)
010203040506070
Accum Pressure (PSIA)
MED
Flw
021
Saba
tier C
O2
Flow
SLP
MDe
sire
d CO
2 Fl
ow (S
LPM
)
MED
Prs0
21 A
ccum
ulat
or P
ress
ure
or C
O2
inle
t PSI
ASE
DP00
6 Re
acto
r inl
et p
ress
ure
PSIA
Th
is p
lot s
how
s the
con
trol a
ccur
acy
of th
e C
O2
mod
ulat
ing
valv
e. T
he a
ccum
ulat
or p
ress
ure
is th
e up
stre
am p
ress
ure
to th
e va
lve.
Th
e re
acto
r pre
ssur
e is
the
dow
nstre
am p
ress
ure.
The
val
ve m
ust c
ontro
l flo
w o
ver 4
:1 fl
ow tu
rndo
wn
and
6:1
pres
sure
turn
dow
n. T
he
dark
blu
e lin
e is
the
desi
red
flow
and
the
red
line
over
it is
the
actu
al fl
ow a
s mea
sure
d by
a m
ass f
low
met
er. T
he a
ctua
l flo
w is
with
in
4% o
f the
des
ired
flow
.
162

Plot
2 --
CED
U S
tatu
s
012345678
01
23
45
67
89
1011
1213
1415
1617
1819
2021
2223
24
Suction Press (PSIA), Flow (lb/hr), On/Off, Day, Night
010203040506070
Day/
Nigh
t Sta
tus
(7=d
ay, 6
=nig
ht)
SEDC
ompr
esso
r com
man
d 1=
on 0
=off
MED
Flw
020
Com
pres
sor O
utle
t Flo
w a
fter D
P lb
/hr
M
EDPr
s020
Com
pres
sor I
nlet
Pre
ssur
e PS
IA
MED
Prs0
21 A
ccum
ulat
or P
ress
ure
or C
O2
inle
t PSI
A
Th
is p
lot s
how
s the
stat
us o
f the
mec
hani
cal c
ompr
esso
r whe
n in
tegr
ated
with
the
4BM
S an
d Sa
batie
r. It
show
s the
com
pres
sor i
nlet
an
d ou
tlet p
ress
ures
and
flow
rate
. Thi
s inf
orm
atio
n is
use
d to
fine
tune
the
com
pres
sor o
pera
ting
logi
c to
min
imiz
e po
wer
and
m
axim
ize
CO
2 re
cove
ry.
163

Plot
4 --
CED
U In
et a
nd O
utle
t Pre
ssur
es, O
utle
t Dew
Poi
nt
0
0.51
1.52
2.53
3.54
4.5
01
23
45
67
89
1011
1213
1415
1617
1819
2021
2223
24
Inlet (PSIA)
-40
-20
020406080100
120
Outlet (PSIA), Dew Point (deg F)
MED
Prs0
20 C
ompr
esso
r Inl
et P
ress
ure
PSIA
MED
Prs0
21 A
ccum
ulat
or P
ress
ure
or C
O2
inle
t PSI
A
MED
DP_0
20 M
echa
nica
l Com
pres
sor O
utle
t Dew
poin
t F
Th
is p
lot a
dditi
onal
ly sh
ows t
he d
ew p
oint
of t
he C
O2
leav
ing
the
com
pres
sor.
The
tall
spik
es a
t 4.5
and
16.
4 ho
urs a
re c
alib
ratio
n ru
ns o
f the
dew
poi
nt se
nsor
. The
dew
poi
nt n
ever
exc
eeds
30
F, th
eref
ore
cond
ensa
tion
in th
e co
mpr
esso
r or a
ccum
ulat
or is
not
an
issu
e.
164

Plot
5 --
Sor
bent
Bed
Hea
ter T
empe
ratu
res
050100
150
200
250
300
350
400
450
01
23
45
67
89
1011
1213
1415
1617
1819
2021
2223
24
Tim
e, H
ours
Temperature, degrees F
CDPm
t13
5A
Bed
308
Hea
ter T
emp
A F
CD
Pmt1
6 5
A B
ed 3
09 H
eate
r Tem
p A
F
Th
is p
lot s
how
s the
var
iatio
n of
4B
MS
oper
atio
n w
hen
the
syst
em te
st is
sim
ulat
ing
a da
y/ni
ght c
ycle
. The
hea
ters
in th
e 4B
MS
are
turn
ed o
ff d
urin
g th
e ni
ght p
ortio
n of
the
cycl
e re
sulti
ng in
tem
pera
ture
dec
reas
e of
the
deso
rbin
g be
d. T
he c
ycle
at h
our 3
doe
s not
pr
oduc
e en
ough
CO
2 an
d re
sults
in a
shor
t per
iod
of C
O2
star
vatio
n fo
r the
Sab
atie
r (no
ted
in p
lot #
11
abov
e).
165

5.2.
8 4B
MS/
TSA
C/S
abat
ier F
ully
Inte
grat
ed C
ase
PO
IST
4BM
S/TS
AC
/Sab
atie
r Tes
ting
– Lu
nar N
ight
1C
– E
laps
ed T
ime
from
1/2
7/20
06
The
follo
win
g pl
ots a
re fr
om o
ne o
f the
test
s with
the
TSA
C a
nd th
e 4B
MS
and
Saba
tier.
The
cond
ition
s wer
e se
t to
sim
ulat
e a
Luna
r m
issi
on w
ith 4
cre
w a
ll le
avin
g fo
r EV
A to
geth
er a
nd re
turn
ing
toge
ther
. The
CO
2 fr
om 2
cre
w m
embe
rs is
rege
nera
ted
two
hour
s af
ter r
etur
n fr
om E
VA
, and
the
CO
2 fr
om th
e re
mai
ning
2 c
rew
mem
bers
is re
gene
rate
d th
e ne
xt d
ay.
Plot
1 --
Sta
tus
for
4BM
S, T
SAC
and
Sab
atie
r
024681012
1015
2025
3035
4045
5055
6065
7075
Tim
e, H
ours
status
-200
0200
400
600
800
1000
1200
1400
1600
1800
2000
sccm
CDPM
ode
0OF
1SH
2A1
3A2
4A3
5B1
6B2
7B3
8WP
CRA
Rea
dy (1
1=on
10=
off)
OG
A C
urre
nt/1
0TS
AFp
rod
TSA
C O
utle
t CO
2 Fl
owra
te s
ccm
Th
is p
lot s
how
s the
stat
us o
f the
diff
eren
t sub
syst
ems i
n th
e te
st. T
he L
unar
mis
sion
is a
ssum
ed to
be
in d
aylig
ht a
ll th
e tim
e, th
eref
ore
ther
e is
no
Day
/Nig
ht c
yclin
g as
in th
e IS
S M
issi
on sc
enar
ios u
sed
in th
e m
echa
nica
l com
pres
sor t
ests
. The
re a
re a
few
fals
e st
arts
at
the
begi
nnin
g of
the
test
, the
n at
hou
rs 2
2, 2
5 an
d 27
ther
e ar
e pe
riods
whe
re th
e Sa
batie
r sw
itche
d to
Sta
ndby
. Lat
er p
lots
will
show
th
at th
e m
issi
on sc
enar
io re
sulte
d in
per
iods
of C
O2
star
vatio
n fo
r the
Sab
atie
r sub
syst
em. A
roun
d 30
hou
rs, t
here
is a
per
iod
whe
re
the
Saba
tier r
apid
ly sw
itche
d fr
om P
roce
ss to
Sta
ndby
. Thi
s occ
urre
d be
caus
e th
e de
adba
nd o
n th
e pr
essu
re se
tpoi
nt to
turn
the
166

Saba
tier o
n an
d of
f was
too
narr
ow, a
nd th
e no
rmal
ope
ratio
n ca
used
the
pres
sure
to c
ross
that
span
qui
ckly
. One
of t
he
reco
mm
enda
tions
for f
utur
e m
odifi
catio
ns is
to b
road
en th
at d
eadb
and.
Plot
2 --
Car
bon
Dio
xide
Par
tial P
ress
ures
at 4
BM
S In
let,
4BM
S O
utle
t, an
d in
La
b M
odul
e Si
mul
ator
-505101520
1015
2025
3035
4045
5055
6065
7075
Tim
e, H
ours
mmHg
FMG
62 4
BMS
Inle
t Air
CO2
Pres
sure
mm
HgFF
G69
4BM
S O
utle
t Air
CO2
Pres
sure
mm
Hg
FMG
10 L
ab A
ir CO
2 Pr
essu
re m
mHg
Th
is p
lot s
how
s the
CO
2 co
ncen
tratio
n at
the
inle
t of t
he 4
BM
S. T
his c
once
ntra
tion
prof
ile w
as th
e ou
tput
resu
lt of
mod
elin
g th
e Lu
nar h
abita
t with
the
crew
act
iviti
es a
nd lo
catio
n. T
his p
rofil
e in
clud
es th
e 4
crew
mem
ber E
VA
with
the
stag
gere
d re
gene
ratio
n. T
he
outle
t CO
2 is
alm
ost z
ero
exce
pt fo
r the
shar
p sp
ikes
at t
he b
ed c
hang
es. T
here
is a
n in
crea
se in
CO
2 at
the
outp
ut b
etw
een
hour
s 35
and
40. T
his i
s the
tim
e pe
riod
whe
n th
e fir
st tw
o EV
A C
O2
pack
s are
rege
nera
ted
and
the
4BM
S in
the
habi
tat c
anno
t kee
p up
with
th
e ad
ditio
nal C
O2
load
dur
ing
rege
nera
tion.
Thi
s eff
ect i
s see
n ag
ain
betw
een
hour
s 60
and
65 w
hen
the
next
two
EVA
pac
ks a
re
rege
nera
ted.
167

Plot
3 --
Air
Dew
poin
t at 4
BM
S In
let a
nd in
Lab
Mod
ule
Sim
ulat
or
10203040506070
1015
2025
3035
4045
5055
6065
7075
Tim
e, H
ours
Temperature, degrees F
CDPD
P_12
0 4
BMS
Inle
t Air
Dew
poin
t #1
F
A
FcDP
_120
Lab
Air
Dew
poin
t F
This
plo
t sho
ws d
ew p
oint
read
ings
at t
he 4
BM
S in
let a
nd in
the
Lab
Mod
ule
sim
ulat
or. T
he se
ctio
n be
twee
n ho
ur 3
0 to
50
is a
n ap
pare
nt b
ad se
nsor
read
ing.
The
tall
spik
es a
re c
alib
ratio
n ru
ns o
f the
sens
or. D
urin
g ea
ch c
ycle
, as t
he b
eds c
hang
e, a
dum
p of
hum
id
air f
rom
the
deso
rbin
g be
d is
retu
rned
to th
e in
let o
f the
con
dens
ing
heat
exc
hang
er, w
hich
in tu
rn fe
eds b
ack
to th
e in
let o
f the
4B
MS.
Th
e re
d lin
e sh
ows t
he sm
all s
pike
in in
let h
umid
ity a
t eac
h be
d ch
ange
, whi
ch is
then
redu
ced
as th
e cy
cle
com
plet
es it
s cou
rse.
The
bl
ue li
ne is
the
lab
mod
ule
aver
age
hum
idity
, whi
ch fo
llow
the
trend
of t
he in
let h
umid
ity. W
ater
is c
ontin
uous
ly in
ject
ed in
to th
e la
b m
odul
e to
mak
e up
for t
he w
ater
lost
to th
e va
cuum
sim
ulat
or. T
he in
let,
bein
g do
wns
tream
of t
he c
onde
nsin
g he
at e
xcha
nger
, is
typi
cally
at a
low
er d
ew p
oint
than
the
lab
mod
ule
aver
age.
168

Plot
4 --
Air
Tem
pera
ture
at 4
BM
S In
let,
4BM
S O
utle
t, in
Lab
Mod
ule
Sim
ulat
or,
and
Wat
er T
empe
ratu
re a
t Pre
cool
er In
let
050100
150
200
1015
2025
3035
4045
5055
6065
7075
Tim
e, H
ours
Temperature, degrees F
CDPT
mp1
20 4
BMS
Inle
t Air
Tem
pera
ture
F
CDPT
mp1
21 4
BMS
Out
let A
ir Te
mpe
ratu
re F
AFc
Tmp1
20 L
ab A
ir Te
mp.
Mid
dle
F
CD
PTm
p086
4BM
S Pr
ecoo
l Inle
t H2O
Tem
p #1
F
This
plo
t sho
ws t
he a
ir an
d co
olin
g w
ater
tem
pera
ture
s at t
he 4
BM
S. W
hen
the
beds
switc
h, th
e ai
r exi
ting
is in
itial
ly v
ery
high
te
mpe
ratu
re a
s it i
s flo
win
g th
roug
h th
e be
d th
at w
as ju
st re
cent
ly h
eate
d to
400
F. T
his h
ot a
ir is
use
d to
des
orb
the
desi
ccan
t bed
that
is
full
of w
ater
. The
air
tem
pera
ture
qui
ckly
retu
rns t
o no
rmal
tem
pera
ture
s as t
he b
ed c
ools
dow
n an
d be
gins
ads
orbi
ng C
O2.
The
air
inle
t tem
pera
ture
is c
oole
r tha
n th
e av
erag
e La
b M
odul
e te
mpe
ratu
re si
nce
it ha
s bee
n co
oled
by
the
cond
ensi
ng h
eat e
xcha
nger
.
169

Plot
5 --
Sor
bent
Bed
Hea
ter
Tem
pera
ture
s
050100
150
200
250
300
350
400
450
1015
2025
3035
4045
5055
6065
7075
Tim
e, H
ours
Temperature, degrees F
CDPm
t14
5A
Bed
308
Hea
ter T
emp
B F
CDPm
t16
5A
Bed
309
Hea
ter T
emp
A F
This
plo
t sho
ws t
he 4
BM
S be
d he
ater
tem
pera
ture
s. Si
nce
the
sim
ulat
ion
is a
lway
s day
time,
the
heat
ers o
f the
4B
MS
are
kept
on
full
pow
er a
ccor
ding
to th
e no
rmal
pro
cess
ing
sche
dule
, i.e
., th
ere
is n
o po
wer
save
mod
e th
at tu
rns h
eate
rs o
ff. E
ach
bed
is h
eate
d to
400
F
to d
esor
b th
e C
O2.
170

Plot
6 --
Des
icca
nt B
ed In
let a
nd O
utle
t Air
Tem
pera
ture
s
0102030405060708090100
1015
2025
3035
4045
5055
6065
7075
Tim
e, H
ours
Temperature, degrees F
CDPT
mp1
20 4
BMS
Inle
t Air
Tem
pera
ture
F
CDPm
t11
Des
icca
nt B
ed O
utle
t Tem
pera
ture
F
Th
is p
lot s
how
s the
tem
pera
ture
of t
he a
ir in
to a
nd o
ut o
f the
ads
orbi
ng d
esic
cant
bed
. The
tem
pera
ture
rise
s due
to th
e he
at o
f ad
sorp
tion
of w
ater
ont
o th
e de
scic
cant
.
171

Plot
7 --
Des
icca
nt B
ed O
utle
t Air
Dew
poin
t Tem
pera
ture
-95.
5
-95
-94.
5
-94
-93.
5
-93
-92.
5
1015
2025
3035
4045
5055
6065
7075
Tim
e, H
ours
Temperature, degrees F
CDPD
P_02
3 D
essi
cant
Bed
Out
let A
ir De
wpt
F
Th
is p
lot s
how
s the
dew
poi
nt o
f the
air
leav
ing
the
desi
ccan
t and
ent
erin
g th
e C
O2
adso
rptio
n be
d. T
his d
ew p
oint
is m
onito
red
for
brea
kthr
ough
. Wat
er th
at e
scap
es th
e de
sicc
ant b
ed w
ill in
terf
ere
with
the
adso
rptio
n of
CO
2 on
to th
e C
O2
sorb
ent b
ed. T
he b
ed
wou
ld th
en h
ave
to b
e re
gene
rate
d at
hig
h te
mpe
ratu
re to
rem
ove
the
wat
er.
172

Plot
8 --
4B
MS
Proc
ess
Air
Flow
Rat
e, F
an d
P
05101520253035
1015
2025
3035
4045
5055
6065
7075
Tim
e, H
ours
SCFM
0510152025303540
CDPF
lw12
0 4
BMS
Inle
t Air
Flow
rate
SCF
M (S
ierr
a)
CDPF
lw12
1 4
BMS
Inle
t Air
Flow
rate
SCF
M (T
SI)
CDPm
p10
Blow
er D
elta
Pre
ssur
e in
H2O
Th
is p
lot s
how
s the
air
flow
rate
to th
e 4B
MS
and
the
blow
er p
ress
ure
drop
. The
pre
ssur
e dr
op ri
ses q
uick
ly w
hile
the
air t
empe
ratu
re
is h
igh
from
the
desi
ccan
t. (R
efer
bac
k to
plo
t 6).
The
air f
low
was
mea
sure
d w
ith tw
o di
ffer
ent d
evic
es, w
hich
show
ed v
ery
good
ag
reem
ent.
173
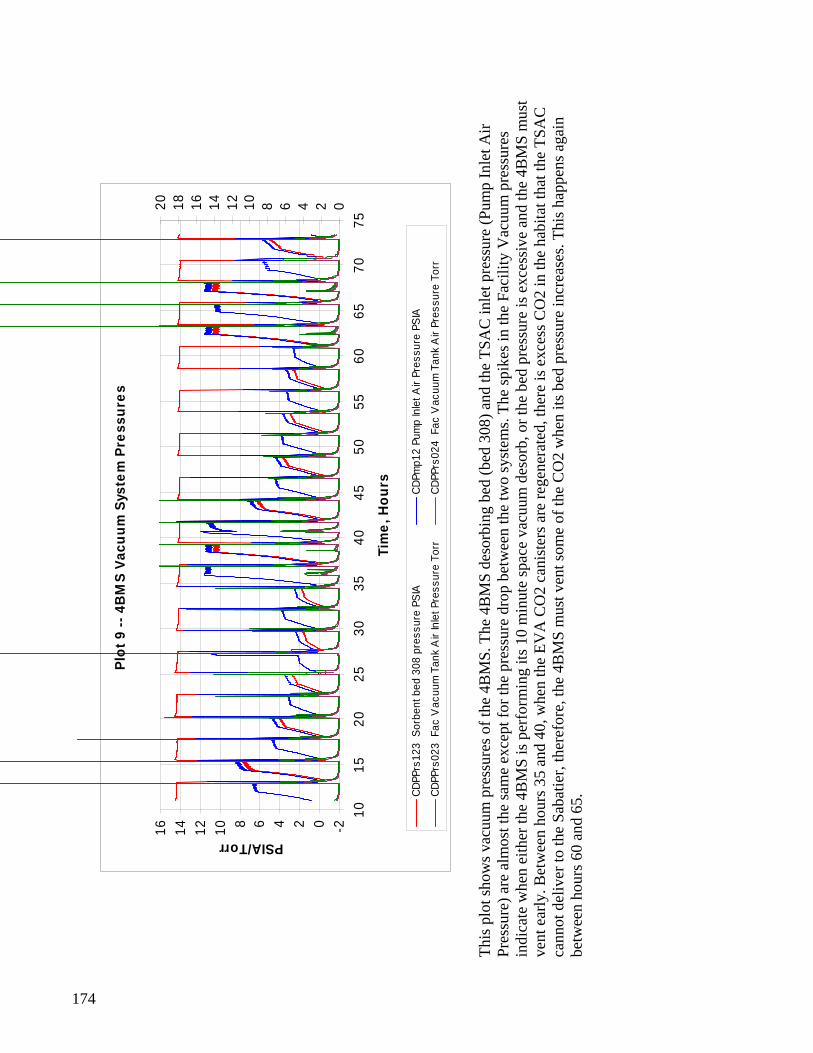
Plot
9 --
4B
MS
Vacu
um S
yste
m P
ress
ures
-20246810121416
1015
2025
3035
4045
5055
6065
7075
Tim
e, H
ours
PSIA/Torr
02468101214161820
CDPP
rs12
3 S
orbe
nt b
ed 3
08 p
ress
ure
PSIA
CDPm
p12
Pum
p In
let A
ir Pr
essu
re P
SIA
CDPP
rs02
3 F
ac V
acuu
m T
ank
Air
Inle
t Pre
ssur
e To
rr
CD
PPrs
024
Fac
Vac
uum
Tan
k A
ir Pr
essu
re T
orr
Th
is p
lot s
how
s vac
uum
pre
ssur
es o
f the
4B
MS.
The
4B
MS
deso
rbin
g be
d (b
ed 3
08) a
nd th
e TS
AC
inle
t pre
ssur
e (P
ump
Inle
t Air
Pres
sure
) are
alm
ost t
he sa
me
exce
pt fo
r the
pre
ssur
e dr
op b
etw
een
the
two
syst
ems.
The
spik
es in
the
Faci
lity
Vac
uum
pre
ssur
es
indi
cate
whe
n ei
ther
the
4BM
S is
per
form
ing
its 1
0 m
inut
e sp
ace
vacu
um d
esor
b, o
r the
bed
pre
ssur
e is
exc
essi
ve a
nd th
e 4B
MS
mus
t ve
nt e
arly
. Bet
wee
n ho
urs 3
5 an
d 40
, whe
n th
e EV
A C
O2
cani
ster
s are
rege
nera
ted,
ther
e is
exc
ess C
O2
in th
e ha
bita
t tha
t the
TSA
C
cann
ot d
eliv
er to
the
Saba
tier,
ther
efor
e, th
e 4B
MS
mus
t ven
t som
e of
the
CO
2 w
hen
its b
ed p
ress
ure
incr
ease
s. Th
is h
appe
ns a
gain
be
twee
n ho
urs 6
0 an
d 65
.
174

Plot
10
-- 4
BM
S C
ompo
nent
Pow
er
-1000
100
200
300
400
500
600
1015
2025
3035
4045
5055
6065
7075
Tim
e, H
ours
Watts
CDPm
w12
5A
Bed
308
Prim
. Hea
ter P
ower
Wat
t
CDPm
w13
5A
Bed
309
Prim
. Hea
ter P
ower
Wat
t
CDPm
w14
5A
Bed
308
Sec
. Hea
ter P
ower
Wat
t
CDPm
w15
5A
Bed
309
Sec
. Hea
ter P
ower
Wat
t
Air-
Save
Pum
p Po
wer
, Wat
ts
This
plo
t sho
ws t
he p
ower
usa
ge o
f the
4B
MS.
The
thic
k ba
rs a
re th
e be
d he
ater
s cyc
ling
on a
nd o
ff w
hen
the
bed
is a
t tem
pera
ture
. Th
e he
ater
con
trol i
s on/
off c
ontro
l, w
hich
giv
es th
e te
mpe
ratu
re p
rofil
e th
e ch
arac
teris
tic sa
w to
oth
patte
rn.
175
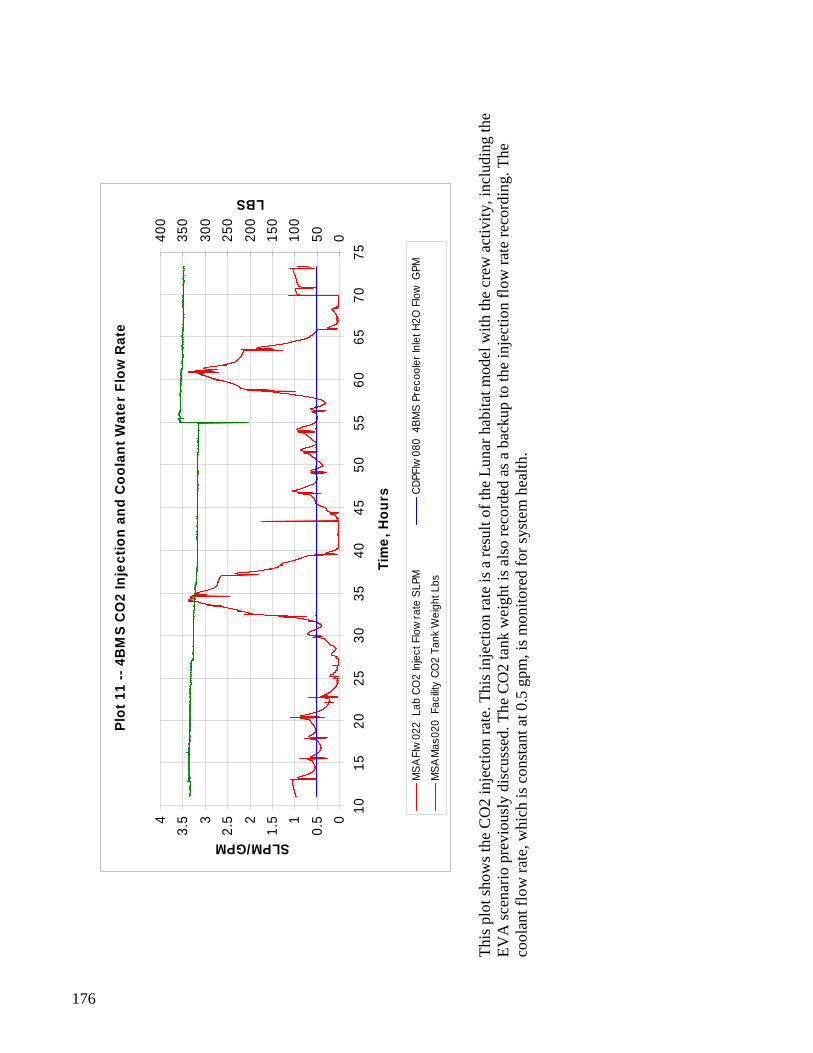
Plot
11
-- 4
BM
S C
O2
Inje
ctio
n an
d C
oola
nt W
ater
Flo
w R
ate
00.
511.
522.
533.
54
1015
2025
3035
4045
5055
6065
7075
Tim
e, H
ours
SLPM/GPM
050100
150
200
250
300
350
400
LBS
MSA
Flw
022
Lab
CO
2 In
ject
Flo
wra
te S
LPM
CDPF
lw08
0 4
BMS
Prec
oole
r Inl
et H
2O F
low
GPM
MSA
Mas
020
Fac
ility
CO2
Tank
Wei
ght L
bs
This
plo
t sho
ws t
he C
O2
inje
ctio
n ra
te. T
his i
njec
tion
rate
is a
resu
lt of
the
Luna
r hab
itat m
odel
with
the
crew
act
ivity
, inc
ludi
ng th
e EV
A sc
enar
io p
revi
ousl
y di
scus
sed.
The
CO
2 ta
nk w
eigh
t is a
lso
reco
rded
as a
bac
kup
to th
e in
ject
ion
flow
rate
reco
rdin
g. T
he
cool
ant f
low
rate
, whi
ch is
con
stan
t at 0
.5 g
pm, i
s mon
itore
d fo
r sys
tem
hea
lth.
176

Plot
12
-- T
SAC
Pro
duct
Flo
w R
ate
-2000
200
400
600
800
1000
1200
1400
1600
1800
2000
1015
2025
3035
4045
5055
6065
7075
Tim
e, H
ours
Flow Rate, sccm
TSA
Fpro
d TS
AC
Out
let C
O2
Flow
rate
scc
m
This
plo
t sho
ws t
he T
SAC
CO
2 de
liver
y flo
w ra
te to
the
Saba
tier.
The
deliv
ery
is fa
irly
cons
tant
unt
il th
e pe
riods
of s
tarv
atio
n be
gin
at h
our 2
2, 2
5 an
d 27
. The
n at
hou
r 30,
the
perio
d be
gins
whe
n th
e Sa
batie
r rep
eate
dly
tried
to st
art a
nd th
e pr
essu
re d
eadb
and
caus
ed
it to
shut
dow
n. A
t hou
r 55
the
hydr
ogen
flow
setp
oint
was
tem
pora
rily
set t
o tw
ice
the
norm
al ra
te. T
he T
SAC
was
mom
enta
rily
able
to
kee
p up
, but
then
late
r a p
erio
d of
star
vatio
n re
sulte
d at
hou
r 57.
177

Plot
13
-- T
SAC
Inte
rnal
Pre
ssur
es
0
200
400
600
800
1000
1200
1015
2025
3035
4045
5055
6065
7075
Tim
e, H
ours
Pressure, torr
TSA
P1 B
ed A
Inte
rnal
Pre
ssur
e to
rrTS
AP2
Bed
B In
tern
al P
ress
ure
torr
Th
is p
lot s
how
s the
pre
ssur
es o
f the
TSA
C b
eds.
Dur
ing
perio
ds o
f sta
rvat
ion
(hou
r 30
to 3
5), t
he T
SAC
bed
pre
ssur
e fa
lls sh
ort
beca
use
ther
e w
as in
suff
icie
nt C
O2
avai
labl
e fr
om th
e 4B
MS.
Thi
s is s
een
agai
n at
hou
r 60-
65.
178

Plot
14
-- T
SAC
Bed
A T
empe
ratu
res
050100
150
200
250
300
1015
2025
3035
4045
5055
6065
7075
Tim
e, H
ours
Temperature, °C
TSA
HA1
Bed
A H
eate
r 1 T
empe
ratu
re C
TSA
HA3
Bed
A H
eate
r 3 T
empe
ratu
re C
TSA
ExtW
alA
Bed
A E
xter
nal W
all T
empe
ratu
re C
TSA
Touc
hA B
ed A
Tou
ch T
empe
ratu
re
Th
is p
lot s
how
s the
tem
pera
ture
s of t
he T
SAC
Bed
A. T
he d
etai
led
desc
riptio
n is
giv
en fo
r plo
t 16.
179

Plot
15
-- T
SAC
Bed
B T
empe
ratu
res
050100
150
200
250
300
1015
2025
3035
4045
5055
6065
7075
Tim
e, H
ours
Temperature, °C
TSA
HB1
Bed
B He
ater
1 T
empe
ratu
re C
TSA
HB3
Bed
B He
ater
3 T
empe
ratu
re C
TSA
ExtW
alB
Bed
B Ex
tern
al W
all T
empe
ratu
re C
TSA
Touc
hB B
ed B
Tou
ch T
empe
ratu
re C
This
plo
t giv
es th
e te
mpe
ratu
res f
or th
e TS
AC
Bed
B. T
he d
etai
led
desc
riptio
n is
giv
en fo
r plo
t 17.
180
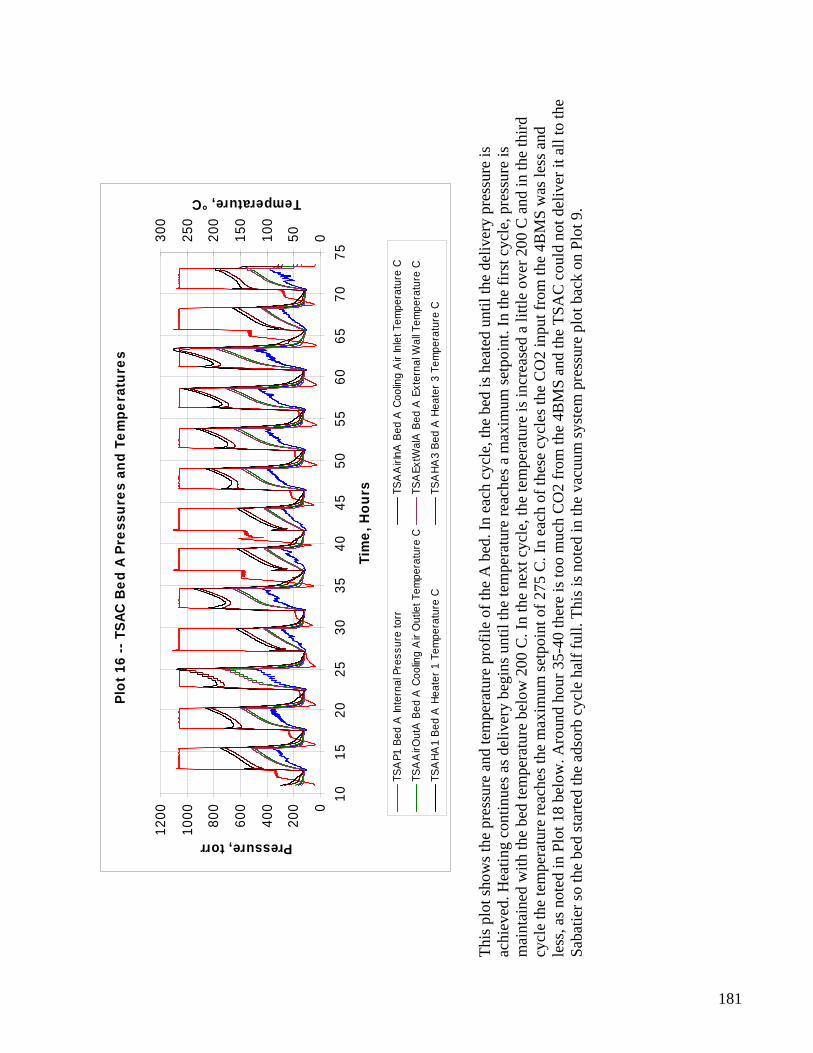
Plot
16
-- T
SAC
Bed
A P
ress
ures
and
Tem
pera
ture
s
0
200
400
600
800
1000
1200
1015
2025
3035
4045
5055
6065
7075
Tim
e, H
ours
Pressure, torr
050100
150
200
250
300
Temperature, °C
TSA
P1 B
ed A
Inte
rnal
Pre
ssur
e to
rrTS
AA
irInA
Bed
A C
oolin
g A
ir In
let T
empe
ratu
re C
TSA
AirO
utA
Bed
A C
oolin
g A
ir O
utle
t Tem
pera
ture
CTS
AEx
tWal
A B
ed A
Ext
erna
l Wal
l Tem
pera
ture
C
TSA
HA1
Bed
A H
eate
r 1 T
empe
ratu
re C
TSA
HA3
Bed
A H
eate
r 3 T
empe
ratu
re C
Th
is p
lot s
how
s the
pre
ssur
e an
d te
mpe
ratu
re p
rofil
e of
the
A b
ed. I
n ea
ch c
ycle
, the
bed
is h
eate
d un
til th
e de
liver
y pr
essu
re is
ac
hiev
ed. H
eatin
g co
ntin
ues a
s del
iver
y be
gins
unt
il th
e te
mpe
ratu
re re
ache
s a m
axim
um se
tpoi
nt. I
n th
e fir
st c
ycle
, pre
ssur
e is
m
aint
aine
d w
ith th
e be
d te
mpe
ratu
re b
elow
200
C. I
n th
e ne
xt c
ycle
, the
tem
pera
ture
is in
crea
sed
a lit
tle o
ver 2
00 C
and
in th
e th
ird
cycl
e th
e te
mpe
ratu
re re
ache
s the
max
imum
setp
oint
of 2
75 C
. In
each
of t
hese
cyc
les t
he C
O2
inpu
t fro
m th
e 4B
MS
was
less
and
le
ss, a
s not
ed in
Plo
t 18
belo
w. A
roun
d ho
ur 3
5-40
ther
e is
too
muc
h C
O2
from
the
4BM
S an
d th
e TS
AC
cou
ld n
ot d
eliv
er it
all
to th
e Sa
batie
r so
the
bed
star
ted
the
adso
rb c
ycle
hal
f ful
l. Th
is is
not
ed in
the
vacu
um sy
stem
pre
ssur
e pl
ot b
ack
on P
lot 9
.
181

Plot
17
-- T
SAC
Bed
B P
ress
ures
and
Tem
pera
ture
s
0
200
400
600
800
1000
1200
1015
2025
3035
4045
5055
6065
7075
Tim
e, H
ours
Pressure, torr
050100
150
200
250
300
Temperature, °C
TSA
P2 B
ed B
Inte
rnal
Pre
ssur
e to
rrTS
AA
irInB
Bed
B C
oolin
g A
ir In
let T
empe
ratu
re C
TSA
AirO
utB
Bed
B Co
olin
g A
ir O
utle
t Tem
pera
ture
CTS
AEx
tWal
B Be
d B
Exte
rnal
Wal
l Tem
pera
ture
C
TSA
HB1
Bed
B He
ater
1 T
empe
ratu
re C
TSA
HB3
Bed
B He
ater
3 T
empe
ratu
re C
Th
is p
lot o
f Bed
B p
ress
ure
and
tem
pera
ture
show
s a c
oupl
e of
inst
ance
s of t
he T
SAC
runn
ing
out o
f CO
2 pr
essu
re fo
r del
iver
y to
Sa
batie
r. B
etw
een
hour
25
and
30, t
he b
ed lo
ses p
ress
ure
befo
re th
e en
d of
the
cycl
e. T
he fo
llow
ing
cycl
e th
e be
d pr
essu
re is
low
for
the
full
cycl
e, a
nd a
gain
the
next
cyc
le th
e be
d pr
essu
re fa
ll sh
ort b
efor
e th
e en
d of
the
cycl
e. T
his i
s the
resu
lt of
too
little
CO
2 av
aila
ble
from
the
4BM
S th
e pr
eced
ing
cycl
e.
182

Plot
18
-- T
SAC
Inle
t Flo
w R
ate
-300
0-2
000
-100
0010
0020
0030
0040
0050
0060
0070
00
1015
2025
3035
4045
5055
6065
7075
Tim
e, H
ours
CO2 flow, sccm
TSA
Fcdr
a TS
AC
Inle
t CO
2 Fl
owra
te s
ccm
Th
is p
lot s
how
s the
CO
2 flo
w ra
te fr
om th
e 4B
MS
to th
e TS
AC
. The
CO
2 co
mes
off
the
CO
2 ad
sorb
ent b
ed in
a w
ave.
Mos
t of t
he
flow
com
es o
ff a
s the
bed
tem
pera
ture
is c
limbi
ng. O
nce
the
bed
reac
hes i
ts se
tpoi
nt te
mpe
ratu
re, t
he h
eate
rs st
art t
urni
ng o
n an
d of
f to
mai
ntai
n th
e se
tpoi
nt. E
ach
time
the
heat
ers t
urn
on, m
ore
gas i
s rel
ease
d, a
nd w
hen
the
heat
ers t
urn
off,
the
flow
rate
dec
reas
es.
This
pro
file
coul
d po
tent
ially
be
impr
oved
with
a v
aria
ble
pow
er h
eate
r con
trol i
nste
ad o
f the
on/
off c
ontro
l.
183

Plot
19
-- S
EDU
Sep
arat
or L
evel
Con
trol
0123456789
1015
2025
3035
4045
5055
6065
7075
Tim
e, H
ours
On/Off, Delta Pressure (PSID)
0500
1000
1500
2000
2500
3000
3500
4000
Weight (grams)
SEDS
EP_r
un S
epar
ator
run
stat
us
SE
DDP4
09-1
Sep
arat
or D
P PS
ID
SE
DMas
020
Saba
tier E
DU W
ater
Gra
ms
Th
is p
lot s
how
s the
ope
ratio
n of
the
rota
ry p
hase
sepa
rato
r in
the
Saba
tier s
yste
m a
nd th
e w
ater
col
lect
ion
rate
. The
rota
ting
bow
l of
the
sepa
rato
r gra
dual
ly fi
lls w
ith w
ater
that
is c
onde
nsed
in th
e he
at e
xcha
nger
. The
diff
eren
tial p
ress
ure
betw
een
the
liqui
d at
the
botto
m o
f the
bow
l and
the
gas p
ress
ure
slow
ly ri
ses a
s mor
e liq
uid
is a
ccum
ulat
ed. W
hen
the
pres
sure
reac
hes a
setp
oint
, the
spee
d is
in
crea
sed
to p
ump
the
liqui
d ou
t, dr
oppi
ng th
e di
ffer
entia
l pre
ssur
e as
the
liqui
d is
rem
oved
. Dur
ing
this
test
, the
sepa
rato
r col
lect
ed
abou
t 140
gra
ms o
f wat
er b
etw
een
each
pum
pout
ove
r a ti
me
perio
d of
abo
ut 1
16 m
inut
es. T
his e
quat
es to
1.2
gra
ms/
min
ute
of w
ater
ge
nera
tion.
At t
he h
ydro
gen
inle
t flo
w ra
te o
f 3.2
6 sl
pm, t
he m
axim
um w
ater
reco
very
pos
sibl
e is
1.3
gra
ms/
min
ute.
The
Sab
atie
r ac
hiev
ed 9
2% re
cove
ry d
urin
g th
e st
eady
stat
e po
rtion
s of t
his t
est.
184

Plot
20
-- S
EDU
Sys
tem
Pre
ssur
es
024681012141618
1015
2025
3035
4045
5055
6065
7075
Tim
e, H
ours
PSIA
00.5
11.5
22.5
PSID
SEDP
006-
1 re
acto
r inl
et p
ress
ure
PSIA
SEDP
601
H2 v
ent p
ress
ure
PSIA
SEDD
P405
Rea
ctor
DP
PSI
D
This
plo
t sho
ws t
he S
abat
ier s
yste
m p
ress
ures
. Dur
ing
stea
dy st
ate
oper
atio
n, th
e re
acto
r pre
ssur
e is
abo
ut 1
0 ps
ia. O
pera
ting
at su
b-am
bien
t pre
ssur
e is
a sa
fety
feat
ure
of th
e sy
stem
that
pre
vent
s lea
kage
of f
lam
mab
le g
as to
the
cabi
n en
viro
nmen
t. A
ny ti
me
the
Saba
tier t
rans
ition
s to
Stan
dby
the
syst
em is
eva
cuat
ed to
vac
uum
to re
mov
e th
e ga
ses.
The
dow
nwar
d sp
ikes
in th
e pl
ot in
dica
te th
e tim
es th
at th
e Sa
batie
r wen
t to
Stan
dby
due
to st
arva
tion.
185

Plot
21
-- S
EDU
Sys
tem
Eff
icie
ncy
-100
00
1000
2000
3000
4000
5000
1015
2025
3035
4045
5055
6065
7075
Tim
e, H
ours
Weight (grams)
02000
4000
6000
8000
1000
0
1200
0
H2 Usage (liters)
Calc
H2O
Pro
d @
100
% E
ff, g
ram
Calc
H2O
Pro
d @
90%
Eff
, gra
mCa
lc H
2O P
rod
@ 8
0% E
ff, g
ram
H2O
Pro
duct
ion,
gra
ms
H2 U
seag
e Ra
te, L
iters
Th
is p
lot s
how
s the
act
ual w
ater
col
lect
ion
com
pare
d to
the
theo
retic
pro
duct
ion
rate
. At 1
00%
reco
very
eff
icie
ncy,
the
Saba
tier
reac
tion
crea
ted
0.4
gram
s of w
ater
for e
ach
stan
dard
lite
r of h
ydro
gen
cons
umed
. The
ove
rall
wat
er g
ener
atio
n du
ring
this
ent
ire te
st
was
abo
ut 8
6%.
186

Plot
22
-- S
EDU
Mol
ar R
atio
024681012
4550
5560
Tim
e, H
ours
Flow (SLPM @ 0ºC)
00.5
11.5
22.5
33.5
44.5
5
Molar Ratio
SEDM
FM00
6 CO
2 flo
w ra
te S
LPM
Desi
red
CO2
Flow
(SLP
M)
H2 R
ate
adju
sted
, SLP
M (@
0°C)
Calc
MR
from
Act
ual F
low
Th
is p
lot s
how
s the
mol
ar ra
tio o
f hyd
roge
n to
CO
2 du
ring
the
test
. The
stoi
chio
met
ric ra
tio fo
r the
Sab
atie
r rea
ctio
n is
4 m
oles
hy
drog
en p
er m
ole
CO
2. T
he S
abat
ier i
s typ
ical
ly o
pera
ted
at a
mol
ar ra
tio o
f 3.5
bec
ause
ther
e is
usu
ally
exc
ess C
O2
avai
labl
e in
a
parti
ally
clo
sed
loop
Air
Rev
italiz
atio
n Sy
stem
. At o
ne p
oint
in th
e te
st (h
our 5
5) th
e hy
drog
en fl
ow ra
te w
as te
mpo
raril
y in
crea
sed
and
the
CO
2 flo
w in
crea
sed
to m
atch
it a
t the
sam
e ra
tio o
f 3.5
. The
mol
ar ra
tio v
alue
is u
ndef
ined
whe
n th
e hy
drog
en a
nd C
O2
flow
s ar
e bo
th z
ero.
187
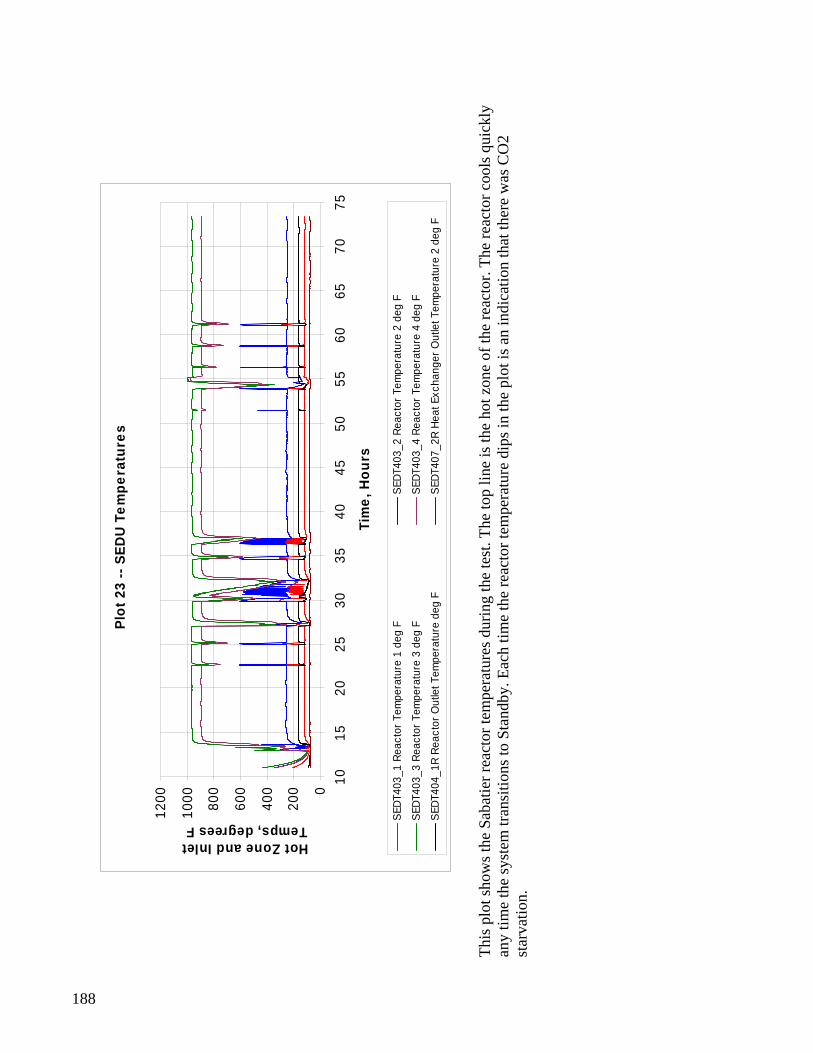
Plot
23
-- S
EDU
Tem
pera
ture
s
0
200
400
600
800
1000
1200
1015
2025
3035
4045
5055
6065
7075
Tim
e, H
ours
Hot Zone and Inlet Temps, degrees F SE
DT40
3_1
Reac
tor T
empe
ratu
re 1
deg
F
SE
DT40
3_2
Reac
tor T
empe
ratu
re 2
deg
F
SEDT
403_
3 Re
acto
r Tem
pera
ture
3 d
eg F
SEDT
403_
4 Re
acto
r Tem
pera
ture
4 d
eg F
SEDT
404_
1R R
eact
or O
utle
t Tem
pera
ture
deg
F
SE
DT40
7_2R
Hea
t Exc
hang
er O
utle
t Tem
pera
ture
2 d
eg F
This
plo
t sho
ws t
he S
abat
ier r
eact
or te
mpe
ratu
res d
urin
g th
e te
st. T
he to
p lin
e is
the
hot z
one
of th
e re
acto
r. Th
e re
acto
r coo
ls q
uick
ly
any
time
the
syst
em tr
ansi
tions
to S
tand
by. E
ach
time
the
reac
tor t
empe
ratu
re d
ips i
n th
e pl
ot is
an
indi
catio
n th
at th
ere
was
CO
2 st
arva
tion.
188

Plot
24
-- S
EDU
sta
tus
024681012
1015
2025
3035
4045
5055
6065
7075
Tim
e, H
ours
Status
0510152025
Pressure (PSIA)
OG
A C
urre
nt/1
0CR
A R
eady
(11=
on 1
0=of
f)
SEDS
TAND
BY_S
tat I
ndic
ator
0=F
ALS
E 1=
TRUE
SEDP
ROCE
SS_S
tat I
ndic
ator
0=F
ALS
E 1=
TRUE
SEDP
002
CO2
inle
t pre
ssur
e PS
IA
This
cha
rt sh
ows t
he st
atus
of t
he S
abat
ier s
yste
m a
nd th
e C
O2
inle
t pre
ssur
e. C
O2
avai
labi
lity
and
OG
A re
ady
are
the
two
key
indi
cato
rs th
at d
eter
min
e if
the
Saba
tier c
an o
pera
te. T
his m
issi
on sc
enar
io h
ad O
GA
read
y al
l the
tim
e, th
eref
ore
the
CO
2 in
let
pres
sure
was
the
caus
e fo
r the
Sab
atie
r bei
ng u
nabl
e to
ope
rate
.
189

References
Reference Papers presented at the International Conference on Environmental Systems (ICES) Ref No.
Paper No. Title Authors
[1] 2006-01-2271
Integrated Test and Evaluation of a 4-Bed Molecular Sieve, Temperature Swing Adsorption Compressor, and Sabatier Engineering Development Unit
James C. Knox Melissa Campbell Lee A. Miller Lila Mulloth Mini Varghese Bernadette Luna
[2] 2006-01-2133
Modeling and Analyses of an Integrated Air Revitalization System of a 4-Bed Molecular Sieve Carbon Dioxide Removal System (CDRA), Mechanical Compressor Engineering Development Unit (EDU) and Sabatier Engineering Development Unit
Frank F. Jeng Melissa Campbell Sao-Dung Lu Fred Smith James Knox
[3] 2006-01-2126
Performance Characterization of a Temperature-Swing Adsorption Compressor Based on Integrated Tests with Carbon Dioxide Removal and Reduction Assemblies
Lila Mulloth Micha Rosen Mini Varghese Bernadette Luna Bruce Webbon James C. Knox
[4] 2005-01-2864
Integrated Test and Evaluation of a 4-Bed Molecular Sieve (4BMS) Carbon Dioxide Removal System (CDRA), Mechanical Compressor Engineering Development Unit (EDU), and Sabatier Engineering Development Unit (EDU)
James C. Knox Melissa Campbell Karen Murdoch Lee A. Miller Frank Jeng
[5] 2004-01-
2496 Analysis of the Integration of Carbon Dioxide Removal Assembly, Compressor, Accumulator and Sabatier Carbon Dioxide Reduction Assembly
Frank F. Jeng Sharon Lafuse,
Frederick D. Smith Sao-Dung Lu James C. Knox Melissa L. Campbell,
Timothy D. Scull Steve Green
[6] 2004-01-2375
Integrated Testing of a 4-Bed Molecular Sieve and a Temperature-Swing Adsorption Compressor for Closed-Loop Air Revitalization
James C. Knox Lila M. Mulloth David L. Affleck
190

[7] 2004-01-2444
Measurement of Trace Water Vapor in a Carbon Dioxide Removal Assembly Product Stream
Joda Wormhoudt Joanne H. Shorter J. Barry McManus David D. Nelson Mark S. Zahniser Andrew Freedman Melissa Campbell Clarence T. Change Frederick D. Smith
[8] 2004-01-2374
Air Cooled Design of a Temperature-Swing Adsorption Compressor for Closed-Loop Air Revitalization Systems
Lila M. Mulloth Dave L. Affleck Micha Rosen Martin D. LeVan Yuan Wang Celio L. Cavalcante
[9] 2003-01-2627
Development of a Temperature-Swing Adsorption Compressor for Carbon Dioxide
Lila M. Mulloth David L. Affleck
[10] 2000-xx-xxxx
A Solid State Compressor for Integration of CO2 Removal and Reduction Assemblies
Lila M. Mulloth John E. Finn
[11] 2005-01-2942
Long-Duration Testing of a Temperature-Swing Adsorption Compressor for Carbon Dioxide for Closed-Loop Air Revitalization Systems
Lila M. Mulloth Micha Rosen Mini Varghese
Non-ICES Papers
[12] JSC-62218 CTSD-ADV-546
Test Plan and Requirements for the Integrated Evaluation of the 4-Bed Molecular Sieve (4BMS), Mechanical Compressor Engineering Development Unit (EDU), and Sabatier Engineering Development Unit (EDU)
Melissa Campbell
[13] Test Plan And Requirements For The Integrated Evaluation Of The 4-Bed Molecular Sieve (4BMS), Temperature Swing Adsorption Compressor (TSAC), And Sabatier Engineering Development Unit (EDU)
Melissa Campbell
[14] International Space Station Trace Contaminant Injection Test, Revision A, NASA Test Requirements Document, January 1997
J. D. Tatara J. L. Perry
191

2
REPORT DOCUMENTATION PAGE Form ApprovedOMB No. 0704-0188
The public reporting burden for this collection of information is estimated to average 1 hour per response, including the time for reviewing instructions, searching existing data sources, gathering and maintaining the data needed, and completing and reviewing the collection of information. Send comments regarding this burden estimate or any other aspect of this collection of information, including suggestions for reducing this burden, to Department of Defense, Washington Headquarters Services, Directorate for Information Operation and Reports (0704-0188), 1215 Jefferson Davis Highway, Suite 1204, Arlington, VA 22202-4302. Respondents should be aware that notwithstanding any other provision of law, no person shall be subject to any penalty for failing to comply with a collection of information if it does not display a currently valid OMB control number.PLEASE DO NOT RETURN YOUR FORM TO THE ABOVE ADDRESS.
1. REPORT DATE (DD-MM-YYYY) 2. REPORT TYPE 3. DATES COVERED (From - To)
4. TITLE AND SUBTITLE 5a. CONTRACT NUMBER
5b. GRANT NUMBER
5c. PROGRAM ELEMENT NUMBER
6. AUTHOR(S) 5d. PROJECT NUMBER
5e. TASK NUMBER
5f. WORK UNIT NUMBER
7. PERFORMING ORGANIZATION NAME(S) AND ADDRESS(ES) 8. PERFORMING ORGANIZATION REPORT NUMBER
9. SPONSORING/MONITORING AGENCY NAME(S) AND ADDRESS(ES) 10. SPONSORING/MONITOR’S ACRONYM(S)
11. SPONSORING/MONITORING REPORT NUMBER
12. DISTRIBUTION/AVAILABILITY STATEMENT
13. SUPPLEMENTARY NOTES
14. ABSTRACT
15. SUBJECT TERMS
16. SECURITY CLASSIFICATION OF:a. REPORT b. ABSTRACT c. THIS PAGE
17. LIMITATION OF ABSTRACT 18. NUMBER OF PAGES
19a. NAME OF RESPONSIBLE PERSON
19b. TELEPHONE NUMBER (Include area code)
Standard Form 298 (Rev. 8-98)Prescribed by ANSI Std. Z39-18
Integrated Evaluation of Closed Loop Air Revitalization System Components
K. Murdock
George C. Marshall Space Flight Center, Marshall Space Flight Center, AL 35812
Wolf Engineering, LLC, 24 Gulf Road, Somers, CT 06071
National Aeronautics and Space AdministationWashington, DC 20546–0001
Unclassified-UnlimitedSubject Category 54Availability: NASA CASI (443–757–5802)
Prepared for the Exploration and Space Operation Programs and Projects Office, Science and Missions Systems OfficeCOTR: Monserrate C. Roman
M–1300
NNM10AB15P
01/11/04 to 03/31/06Contractor Report
NASA/CR—2010–216451
Environmental Control and Life Support Technologies, Air Revitalization System, Closed Loop Air Revitalization System, 4-Bed Modular Sieve, Mechanical Compressor Engineering Development Unit, Temperature Swing Adsorption Compressor, Sabatier Engineering and Development Unit
01–11–2010
UU 200U U U
NASA’s vision and mission statements include an emphasis on human exploration of space, which requires environmental control and life support technologies. This Contractor Report (CR) describes the development and evaluation of an Air Revitalization System, modeling and simulation of the compo-nents, and integrated hardware testing with the goal of better understanding the inherent capabilities and limitations of this closed loop system. Major components integrated and tested included a 4-Bed Modular Sieve, Mechanical Compressor Engineering Development Unit, Temperature Swing Adsorption Compressor, and a Sabatier Engineering and Development Unit. The requisite methodolgy and technical results are contained in this CR.
STI Help Desk at email: [email protected]
STI Help Desk at: 443-757-5802

The NASA STI Program…in Profile
Since its founding, NASA has been dedicated to the advancement of aeronautics and space science. The NASA Scientific and Technical Information (STI) Program Office plays a key part in helping NASA maintain this important role.
The NASA STI Program Office is operated by Langley Research Center, the lead center for NASA’s scientific and technical information. The NASA STI Program Office provides access to the NASA STI Database, the largest collection of aeronautical and space science STI in the world. The Program Office is also NASA’s institutional mechanism for disseminating the results of its research and development activities. These results are published by NASA in the NASA STI Report Series, which includes the following report types:
• TECHNICAL PUBLICATION. Reports of completed research or a major significant phase of research that present the results of NASA programs and include extensive data or theoretical analysis. Includes compilations of significant scientific and technical data and information deemed to be of continuing reference value. NASA’s counterpart of peer-reviewed formal professional papers but has less stringent limitations on manuscript length and extent of graphic presentations.
• TECHNICAL MEMORANDUM. Scientific and technical findings that are preliminary or of specialized interest, e.g., quick release reports, working papers, and bibliographies that contain minimal annotation. Does not contain extensive analysis.
• CONTRACTOR REPORT. Scientific and technical findings by NASA-sponsored contractors and grantees.
• CONFERENCE PUBLICATION. Collected papers from scientific and technical conferences, symposia, seminars, or other meetings sponsored or cosponsored by NASA.
• SPECIAL PUBLICATION. Scientific, technical, or historical information from NASA programs, projects, and mission, often concerned with subjects having substantial public interest.
• TECHNICAL TRANSLATION. English-language translations of foreign
scientific and technical material pertinent to NASA’s mission.
Specialized services that complement the STI Program Office’s diverse offerings include creating custom thesauri, building customized databases, organizing and publishing research results…even providing videos.
For more information about the NASA STI Program Office, see the following:
• Access the NASA STI program home page at <http://www.sti.nasa.gov>
• E-mail your question via the Internet to <[email protected]>
• Fax your question to the NASA STI Help Desk at 443 –757–5803
• Phone the NASA STI Help Desk at 443 –757–5802
• Write to: NASA STI Help Desk NASA Center for AeroSpace Information 7115 Standard Drive Hanover, MD 21076–1320

NASA/CR—2010–
Integrated Evaluation of Closed Loop Air Revitalization System ComponentsK. MurdockWolf Engineering, LLC, Somers, Connecticut
November 2010
National Aeronautics andSpace AdministrationIS20George C. Marshall Space Flight CenterMarshall Space Flight Center, Alabama35812
Prepared for Marshall Space Flight Center under Contract NNM10AB15P