integrated report 2012 -...
TRANSCRIPT
MARKET DEMAND
STRATEGY
IntegratedReport
2012
Contents
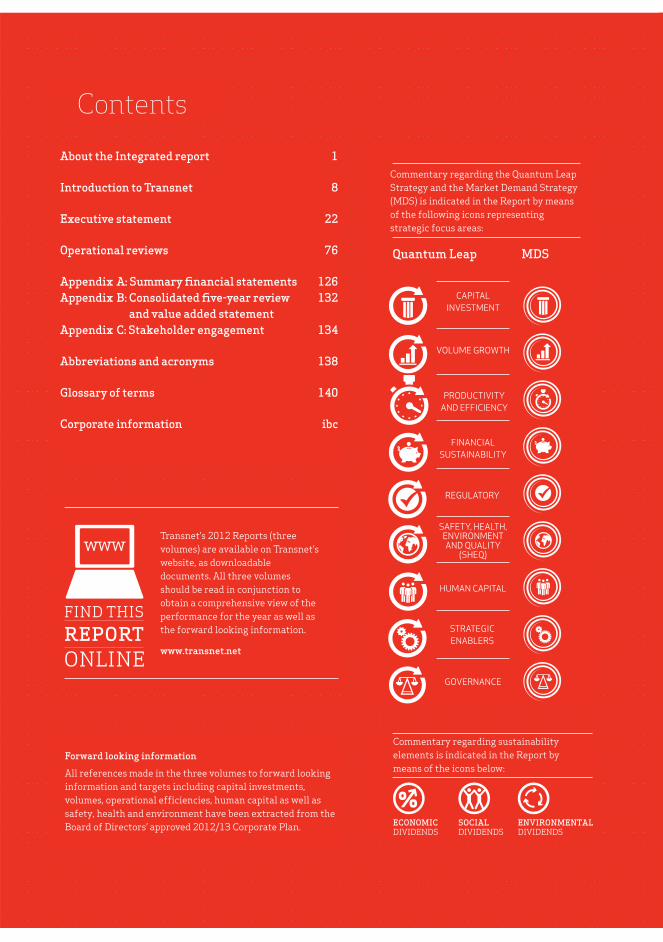
Commentary regarding the Quantum Leap Strategy and the Market Demand Strategy (MDS) is indicated in the Report by means of the following icons representing strategic focus areas:
Commentary regarding sustainability elements is indicated in the Report by means of the icons below:
About the Integrated report 1
Introduction to Transnet 8
Executive statement 22
Operational reviews 76
Appendix A: Summary financial statements 126Appendix B: Consolidated five-year review 132
and value added statementAppendix C: Stakeholder engagement 134
Abbreviations and acronyms 138
Glossary of terms 140
Corporate information ibc
Quantum Leap MDS
PRODUCTIVITY
AND EFFICIENCY
CAPITAL
INVESTMENT
STRATEGIC
ENABLERS
FINANCIAL
SUSTAINABILITY
REGULATORY
VOLUME GROWTH
HUMAN CAPITAL
SAFETY, HEALTH, ENVIRONMENT AND QUALITY
(SHEQ)
GOVERNANCE
Forward looking information
All references made in the three volumes to forward looking information and targets including capital investments, volumes, operational efficiencies, human capital as well as safety, health and environment have been extracted from the Board of Directors’ approved 2012/13 Corporate Plan.
Transnet’s 2012 Reports (three volumes) are available on Transnet’s website, as downloadable documents. All three volumes should be read in conjunction to obtain a comprehensive view of the performance for the year as well as the forward looking information.
www.transnet.netREPORTFIND THIS
ONLINE
ECONOMIC DIVIDENDS
SOCIAL DIVIDENDS
ENVIRONMENTAL DIVIDENDS

2012 Integrated report
Intr
od
uc
tio
n
1 Strictly private and confidential
1
About the Integrated report
The 2012 Integrated report (the Report) covers the period 1 April 2011 to 31 March 2012 and provides an overview of Transnet SOC Ltd (Transnet/the Company/the Group).
The Report demonstrates how Transnet gives effect to its mandate through its business model, strategy, governance, financial, economic, social and environmental performance and clarifies the integration of sustainability into the core business with alignment to Government Policy.
Although the Specialist Units, namely Transnet Foundation, Transnet Property and Transnet Capital Projects, are not individually covered, they are addressed in various sections of the three volumes where appropriate.
Transnet’s reporting for 2012 consists of three volumes:
Operational reviews are presented for the following Operating divisions:
2012 INTEGRATED REPORT
Volume 1
2012 ANNUAL FINANCIAL STATEMENTS
Volume 2
2012 SUSTAINABILITY REPORT
Volume 3
CONTENT
DISTRIBUTION
FRAMEWORK
The 2012 Integrated report is the Company’s primary report to all stakeholders.
The 2012 Annual financial statements and Corporate Governance report.
The 2012 Sustainability report is a review of the Company’s sustainability performance and includes a detailed index in which Transnet responds to each of the ‘G3.1’ criteria of the Global Reporting Initiative (GRI).Transnet assesses its application level in the Sustainability Report at a ‘C’ level.
Printed and distributed
Available online in PDF/HTML format:
http://www.transnet.net
Printed and distributed
Available online in PDF/HTML format:
http://www.transnet.net
Printed and distributed
Available online in PDF/HTML format:
http://www.transnet.net
King III Code on Corporate Governance (King III).Discussion papers issued by the South African Integrated Reporting Committee and the International Integrated Reporting Council.
International Financial Reporting Standards (IFRS)Companies Act, 2008Public Finance Management Act, 1999 PFMAKing III
Compact
Goals
RAIL ENGINEERING
FREIGHT RAILNATIONAL PORTS AUTHORITY
PORT TERMINALS
PIPELINES
2012 Integrated report

2
Evolutionary approach
Transnet is pleased to present its second Integrated report in both printed and electronic formats. The
Report focuses on enhanced content, illustrating how the Company is positioned for growth, and
highlights the material matters identified through the Company’s engagement with stakeholders and its
strategic response.
The Company will continue to improve its integrated reporting processes and output going forward to
further align with international reporting standards as well as its multifaceted role in creating and
sustaining lasting value for South Africa. This will yield increasing benefit, both internally and in respect
of Transnet’s social and economic contribution by demonstrating the Company’s high standards in
sustainability, accountability, transparency and inclusiveness in its business practices.
Materiality
The principle of materiality has been applied in determining pertinent content and disclosure which is
both qualitative and quantitative in nature with reference to Transnet’s performance against the Quantum
Leap Strategy. An issue is considered material if it is of such importance and impact that it could
substantively influence the assessments and decisions of the Company or its stakeholders.
Transnet uses a broad range of criteria to identify material issues, including:
Internal criteria External criteria
Transnet’s vision, mission, mandate and values, as well Challenges, opportunities and emerging issues in the global economy and political environment.
targets, associated key performance indicators (KPIs), policies, processes and procedures.
Regulatory changes and impact on Transnet’s operations.
Stakeholder expectations and feedback, eg from the Shareholder, employees, suppliers, customers, communities where we operate, regulators and environmental bodies.
considerations, sustainability impacts and risks.
Key risks impacting the Company, the combined assurance plan, risk mitigation methodologies, assurance, oversight and guidance provided by Management, internal specialists, various Committees,
Guidance provided by independent expert advisors.
Factors impacting reputation.
About the Integrated report (continued)
Port of Ngqura at night.

32012 Integrated report
Ab
ou
t th
e I
nte
gra
ted
re
po
rt
Stakeholder engagement
identifying issues that have the greatest potential for impacting Transnet’s ability to
fulfil its mandate, meet operational and financial performance targets and to ensuring
that the Company delivers sustainable economic, social and environmental value.
Annually, as required by the PFMA, Transnet and the Shareholder Representative
conclude a Shareholder’s Compact, which confirms Transnet’s mandate, strategic
of this Report for the performance against the targets contained in the Shareholder’s
Compact.
the year and has enforced the Company’s solid financial and operational foundation.
This foundation has been further enhanced by the alignment, support and improved
relationship with Government departments and, in particular, the Shareholder Ministry,
has resulted in an improved reputation for Transnet, both internally and externally,
which in turn has fostered an environment in which employees can thrive.
The Company’s analysis of sustainability trends, which includes policy developments
and responses to resource constraints, as well as increased consumption and ongoing
skills disparities, indicates both risks and opportunities for the Company. Transnet also
acknowledges the importance of researching complex regulatory issues and paying
acute attention to legislative detail to anticipate risks and opportunities.
The stakeholder engagement process, together with the Company’s risk management
practices, led to the identification of the Group’s Top 10 risks (refer to page 46 of this
Report). These were incorporated into the strategy where appropriate. Through the
process of embedding risk management and control within the business, Transnet has
been able to articulate the link between strategy, business performance, sustainability
and the impacts of material risks.
seeks to better communicate its ongoing work and plans to employees and other key
of the Company.
The Company has recognised the need to monitor and analyse the outcomes of these
engagements in a more systematic way to ensure that stakeholders’ concerns are
followed through to actions and that outcomes are reflected comprehensively in the
Company’s reporting in years to come.
Transnet will continue to refine the process of tracking stakeholder engagements.
Value added 2011
Value added 2012
Reinvested 44%
Reinvested 43%
Employees 42%
Employees 42%
Capital providers 13%
Capital providers 12%
Government 1%
Government 3%
Value added is defined as the financial value created by the activities of a business and its employees.To unlock sustainable value for all stakeholders, the execution of the strategy results in value created by the activities of the business and its employees.The value added depicted below reports on the value added and its application among the key stakeholders of Transnet.
Refer to Appendix B for further details.

4
About the Integrated report (continued)
During the year, the achievements (and hence the success) of the targeted growth and operational performance, as envisaged by the Quantum Leap Strategy, were constrained by:
In direct response to customer requirements and capacity creation demands, Transnet has therefore fundamentally changed its strategic approach from a ‘demand constraining’ model to an ‘unconstrained capacity creation’ model, as enabled by the
the Company.
The successful execution of the strategy requires mutual alignment amongst all stakeholders. Accordingly, the Company has crafted a comprehensive plan to communicate and gain support for the various aspects of its strategy implementation. The plan highlights the current levels of stakeholder awareness for Transnet’s strategic
comprehensive list of engagements and activities are devised to achieve the desired
effort and commitment from all stakeholders.
The sections that follow integrate the various stakeholder interactions and concerns raised during the year, as well as the material issues, risks and opportunities identified.
For a detailed list of stakeholders, their concerns and material issues as well as Transnet’s strategic response, refer to Appendix C of this Report.
Measurability
To ensure stakeholder expectations are aligned with Transnet’s strategic intent, KPIs have been identified to serve as reference points in monitoring the Company’s
important information to stakeholders in their assessment of Transnet’s financial standing and its economic, social and environmental impacts. They further enable stakeholders to evaluate the risks faced by each of the Operating divisions and the
Comparability
The Report includes comparative information on Transnet’s performance in previous years. To assist with improved disclosures, certain comparatives have been restated and where appropriate, disclosed accordingly. In addition, the definitions of certain KPIs were amended during the year and are disclosed in relevant sections of this Report and volume 2.
Refer to Operational reviews and volume 2 for further details.

52012 Integrated report
Assurance
improving performance, enhancing governance, instilling stakeholder confidence and strengthening the Company’s reputation. Transnet’s control framework encompasses a broad range of governance and operational components including:
Values and ethics form the cornerstone of an effective control environment and significant emphasis is placed
on this area. Management have also strengthened the financial controls over the last four years, resulting in
sustained improvements in this area.
to remain appraised of Management efforts to mitigate risks to an acceptable level and to improve the control
environment.
Management-based assurance
Management reviews and monitors risks and their related controls. This includes oversight of strategy
mechanisms and systems. Management oversight aims to establish and maintain a sound control environment
for managing risk and governance.
Oversight committees
adequacy and effectiveness of the risk management process.
Internal assurance
Internal assurance functions within Transnet provide assurance on the adequacy and effectiveness of controls.
Risk management, legal, compliance, health and safety, as well as quality assurance factors are included.
Independent assurance
effectiveness of controls, governance and management of critical risks. This is predominantly the role of
Ab
ou
t th
e I
nte
gra
ted
re
po
rt

6
Content Assurance providers Outcome Framework/standard
Annual Financial Statements
& Touche. opinion.International Financial Reporting Standards (IFRS).
Companies Act.
PFMA.
Review of internal controls and risk management
Safety Association
Organisation (ISO) accreditation bodies.
Financial controls: Satisfactory rating.
Operational controls: Requires improvement.
Legislative assessment.
Functional risk management and compliance maturity assessment.
Committee of Sponsoring Organisations (COSO).
PFMA.
ISO standards relating to safety and environment including ISO 9 000 and 14 000.
Legislative requirements.
standards including Risk Management and Compliance Institute of South Africa guidelines.
BEE contributor level
Level confirmed as Level ‘5’.
Corporate governance
Maturity assessment:
Assessment of controls.
King III.
PFMA.
Companies Act.
The Company has not commissioned additional external assurance of
will be undertaken in due course as measurement, reporting tools and
processes for the identified sustainability indicators mature.
The responsibility for review and recommendation of the Integrated
report and the annual financial statements currently resides with the
Audit Committee, and responsibility for review of the Sustainability
forward, the combined assurance approach, including further consideration
of independent assurance, will be developed and refined to cover all
aspects of integrated and sustainability reporting.
Feedback
Transnet aims to establish and maintain constructive and informed
relationships with all stakeholders. To maintain effective engagement with
stakeholders, all stakeholders reviewing the three volumes are encouraged
to provide feedback on their views. This will enable the Company to gauge
the adequacy and standard of its integrated reporting.
Collectively, assurance related activities performed by the various roleplayers constitute the combined
assurance plan.
For the feedback form on the three volumes refer to http://www.transnet.net
About the Integrated report (continued)

72012 Integrated report
Approval of the Integrated Report
confirms that they have collectively reviewed the content of the Report and agree that it addresses material
issues and provides a fair representation of the integrated performance of the Company.
ME Mkwanazi B Molefe A SinghChairman Group Chief Executive Acting Chief Financial Officer
12 June 2012 12 June 2012 12 June 2012
Johannesburg Johannesburg Johannesburg
Ab
ou
t th
e I
nte
gra
ted
re
po
rt

8
Introduction to Transnet
To enable the competitiveness, growth and development of the South African economy by delivering reliable freight transport and handling services that satisfy customer demand.
MISSIONTransnet will meet customer demand for reliable freight transport and handling through:
maximising the use of its unique set of assets;
cost efficiency; and
concern for sustainability in all we do.
VISIONThe mandate of Transnet is to assist in lowering the cost of doing business in South Africa, enabling economic growth and ensuring security of supply through providing appropriate port, rail and pipeline infrastructure in a cost-effective and efficient manner, within acceptable benchmarks. Transnet’s mandate and strategic objectives are aligned with the Government’s NGP and the Statement of Strategic Intent issued by the Minister of Public Enterprises.
MANDATE
As a SOC, Transnet is wholly owned by the Government of the Republic of South Africa and is the custodian of freight rail, ports and pipelines. The Company is responsible for enabling the competitiveness, growth and development of the South African economy through the delivery of reliable freight transport and the handling of services that satisfy customer demand.
The strategic objectives of SOCs can be summarised as contributing to economic growth through:
operations.
Delivering freight reliably
92012 Integrated report
Intr
od
uc
tio
n t
o T
ran
sne
t
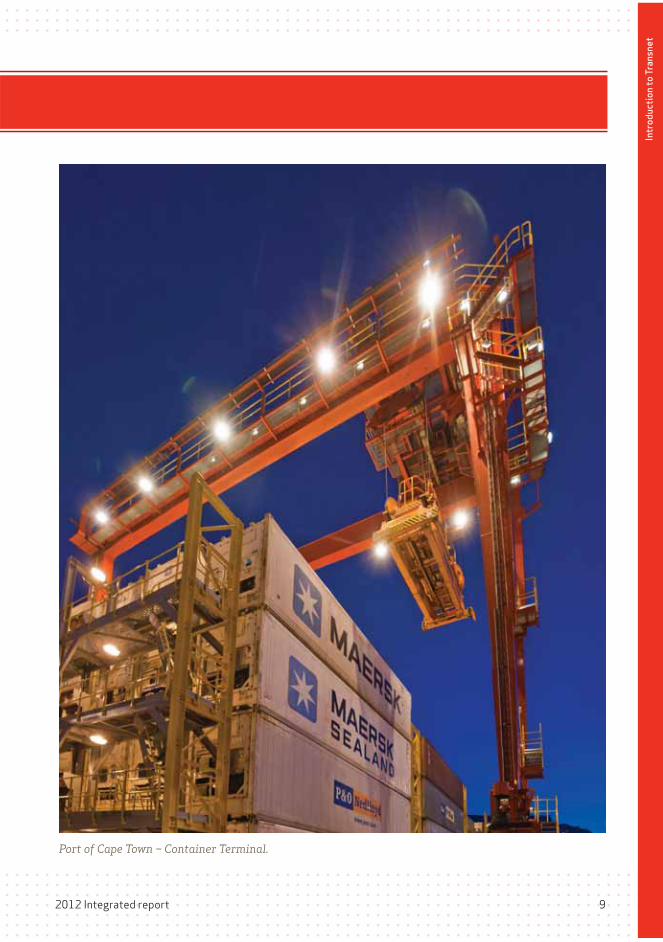
Port of Cape Town – Container Terminal.

10
HIGHLIGHTS
Introduction to Transnet (continued)
Revenue for the year increased by 20,9% to R45,9 billion, mainly as a result of solid volume performance.
EBITDA increased by 19,8% to R18,9 billion.
Unprecedented 10,4% growth in Rail volumes to 201 million tons including market share growth and road-to-rail migration.
18,0% improvement in operational efficiencies and productivity.
Continued aggressive investment in infrastructure of R22,3 billion.
Safety culture and performance restored – reduction in the number of disabling injuries, fatalities and derailments.
10

112012 Integrated report
Intr
od
uc
tio
nIn
tro
du
cti
on
to
Tra
nsn
et
Significant improvement in disabling injury frequency rate from 0,82 to 0,65.
33,0% increase in recognised B-BBEE spend per DTI Codes to R25,8 billion.
Critical vacancies filled by 3 159 new employees.
Transnet disbursed R160 million on CSI during the year, focusing on healthcare, teacher education, sports development and container assistance.
SOCIAL DIVIDENDS
2012 Integrated report 11

12
Seven employee fatalities
(compared to 12 in the
prior year).
Decline in transportation
of petroleum products as a
result of reduction in
market demand and
production problems
customers (7,1% decline
compared to prior year).
Durban Container Terminal
reflected a marginal
deterioration in all
measures of operational
efficiency.
With the exception of the
export iron ore line, the
achievement of targets on
all lines were hampered by
customer cancellations,
poor locomotive efficiency
averages (GTK per loco per
month) and a poor record
arrivals.
A 39,3% increase from prior
year in the number of
signals passed at danger at
adherence to standard
operating procedures.
A decline in the return on
average total assets
(excluding CWIP) due to an
increase in the asset base
resulting from the capital
investment programme and
revaluation of port facilities
and pipeline networks.
Increase in the number of
security related incidents
above target at Freight Rail.
has commenced but slower
than planned due to permit
delays.
CHALLENGES
12
Introduction to Transnet (continued)
132012 Integrated report
Intr
od
uc
tio
n t
o T
ran
sne
t
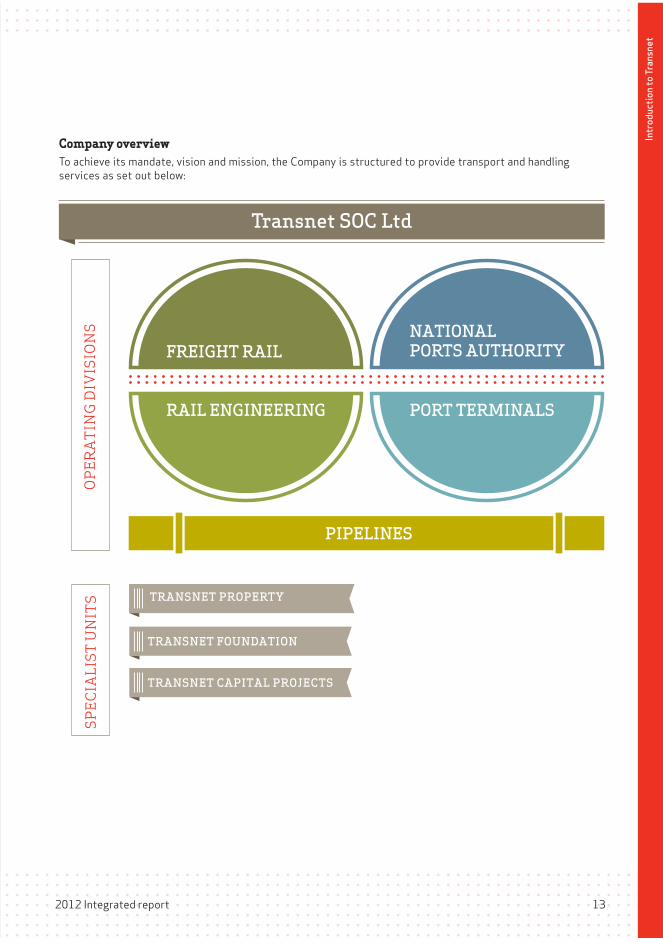
Company overviewTo achieve its mandate, vision and mission, the Company is structured to provide transport and handling
services as set out below:
RAIL ENGINEERING
FREIGHT RAILNATIONAL PORTS AUTHORITY
PORT TERMINALS
PIPELINES
OP
ER
AT
ING
DIV
ISIO
NS
SP
EC
IALI
ST U
NIT
S
Transnet SOC Ltd
TRANSNET PROPERTY
TRANSNET FOUNDATION
TRANSNET CAPITAL PROJECTS

14
Operating division highlights
PIPELINES
R27,7bn
REVENUE
R14,8 bn
CAPITALINVESTMENT
CAPITALINVESTMENT
26 850EMPLOYEES
10,4%VOLUME GROWTH
9,2%
ROTA
0,90
DIFR
ELECTRICITY REGENERATION10% COAL LINE20% IRON ORE LINE
GTK 000/ Loco/monthTARGETS NOT ACHIEVED
Transnet Pipelines (Pipelines) owns and operates South Africa’s 3 800 kilometres of strategic petroleum and gas pipeline infrastructure,
products and gas through the pipeline infrastructure and provides limited storage and handling facilities at Tarlton.
Refer to Operational reviews on page 76 of this Report for further details.
Transnet Freight Rail (Freight Rail), is the largest of Transnet’s Operating divisions, transporting bulk and containerised
freight along the approximately 20 500 route kilometre (31 000 track kilometres) rail network of which approximately 1 500
kilometres comprise heavy haul lines for export coal and export iron ore. The network includes 3 928 kilometres of branch lines.
The network and rail service provides strategic links between ports and production hubs and is connected with
the railways of the Southern African Development Community region.
Freight Rail’s strategic advantage lies in the movement of heavy haul and bulk
commodities over long distances where flow densities provide economies of scale
thereby lowering unit costs. Freight Rail further provides the network for long
distance passenger rail services as well as haulage capacity for other private
passenger services. Freight Rail does not operate passenger services
RAIL ENGINEERING upgrade, manufacturing and support services to Freight Rail in South Africa
and to other rail and terminal operators both regionally and internationally
focusing on:
locomotive, coach, rolling stock equipment, rotating machines, wheels, auxiliary,
foundry and port equipment maintenance. The port equipment maintenance business was recently
FREIGHT RAIL
R11,3bn
REVENUE
12 572EMPLOYEES
R0,7bn 90,5%TOTAL FLEET LOCO AVAILABILITY
12,5%
ROTA0,73
DIFR
16,7%IMPROVED LOCO RELIABILITY: TOTAL FLEET
Introduction to Transnet (continued)

152012 Integrated report
Intr
od
uc
tio
n t
o T
ran
sne
t
R2,1bnREVENUE
631EMPLOYEES
7,1%VOLUME DECLINE
9,0%ROTA
Internal productivity interruptions decreased by 17,2% vs prior year
0,21DIFR
REDUCTION IN SPILLAGE INCIDENCES
R4,5bnCAPITALINVESTMENT
Transnet Port Terminals (Port Terminals) plays an integral role in this
logistics chain by providing cargo handling services to a wide spectrum
of customers including shipping lines, freight forwarders and cargo
owners.
relevant geographic regions. Port Terminals manages 16 cargo terminal
facilities across South African ports.
PORT TERMINALS
NATIONAL PORTS AUTHORITY
The business is divided into two key operational areas: port infrastructure and maritime operations. The port infrastructure segment is responsible for the planning, development and maintenance of port infrastructure. The maritime business includes marine operations, which is responsible for rendering marine services that include pilotage,
which serve as aids to navigation.
containers, automotives, steel, fruit, ferrochrome, petroleum products and manganese. Growth of these commodities is a function of local and global demand and supply, logistics infrastructure, capacity and supply chain efficiencies which include port efficiencies.
R8,3bnREVENUE
R7,1bn
REVENUE
3 422EMPLOYEES
6 211EMPLOYEES
R1,7bnCAPITALINVESTMENT
R1,5bn
CAPITALINVESTMENT
MOST VOLUME TARGETS EXCEEDED
Most volumes achieved – on target or above target
7,7%
ROTA
8,8%ROTA
0,66
DIFR
0,62DIFR
Shipping delays improved significantly
Gross crane moves per hour achieved for all terminals except DCT Pier 1 and DCT Pier 2

16
Board of Directors
1 2 3
4 5
1Mr ME Mkwanazi Chairman
Appointment date13 December 2010
Area of expertiseCorporate governance, engineering and strategy.
2Mr B Molefe
Appointment date17 February 2011
Area of expertiseFinancial, management and leadership.
3Mr A SinghActing Chief Financial Offi cer
Appointment date6 March 2009
Area of expertiseFinancial.
4Mr NK Choubey
Appointment date24 June 2011
Area of expertise
Details regarding directorships and trusteeships are contained in volume 2.
5Mr MA Fanucchi
Appointment date13 December 2010
Area of expertiseLogistics, supply chain management, packaging, gases and engineering industries.
16

172012 Integrated report
Intr
od
uc
tio
n
6 7 8
9 10
6Ms Y Forbes
Appointment date24 June 2011
Area of expertiseICT governance.
7Mr HD Gazendam
Appointment date13 December 2010
Area of expertiseLabour Relations, HR management, remuneration and corporate governance.
8Ms NBP Gcaba
Appointment date27 August 2004
Area of expertiseLegal and corporate governance.
9Mr MP Malungani
Appointment date13 December 2010Resigned with effect from 1 April 2012
Area of expertise
strategy, corporate governance and investment banking.
10Mr BD Mkhwanazi
Appointment date13 December 2010
Area of expertise
resource development and corporate governance.
Intr
od
uc
tio
n t
o T
ran
sne
t
2012 Integrated report 17

18
Board of Directors (continued)
Details regarding directorships and trusteeships are contained in volume 2.
12 14
11
13
11Ms TZ Mnyaka
Appointment date13 December 2010
Area of expertise
development, international trade and business consulting.
12 Ms N Moola
Appointment date13 December 2010
Area of expertise
13Mr MP Moyo
Appointment date25 July 2008
Area of expertiseFinancial and business.
14Ms NR Ntshingila
Appointment date23 May 2006
Area of expertiseMarketing and advertising.
18

192012 Integrated report
Intr
od
uc
tio
nIn
tro
du
cti
on
to
Tra
nsn
et
15Mr IM Sharma
Appointment date13 December 2010
Area of expertiseStrategy, business, international trade, management and global economy.
16Mr IB Skosana
Appointment date13 December 2010
Area of expertiseFinancial, strategy and leadership.
17Ms E Tshabalala
Appointment date13 December 2010
Area of expertise
18 Ms DLJ Tshepe
Appointment date13 December 2010
Area of expertiseLegal and corporate governance.
19Ms ANC CebaGroup Company Secretary
Appointment date1 April 2009
Area of expertiseLegal and corporate governance.
15 1716
18 19
2012 Integrated report 19

20
Group Executive Committ ee
1Mr B Molefe
Year of appointment2011
Position
Area of expertiseFinancial, management and leadership.
2Mr A Singh
Year of appointment2003
PositionActing Chief Financial Offi cer
Area of expertiseFinancial.
3 Ms V Dunjwa
Year of appointment1998
PositionChief Risk Offi cer
Area of expertise
6Mr CA Möller
Year of appointment1975
Position
Area of expertise
7 Mr T Morwe
Year of appointment1997
Position
Ports Authority
Area of expertiseTransport and logistics.
4 Mr SI Gama
Year of appointment1994
Position
Area of expertiseFinancial, ports, railways and transformational/turnaround strategy.
5 Mr M Gregg-Macdonald
Year of appointment2001
Position
Monitoring
Area of expertiseFinancial and general management.
1 2 3 4
5 6 7
20

212012 Integrated report
Intr
od
uc
tio
n
8Ms M Moses
Year of appointment2005
Position
Area of expertise
9Mr KC Phihlela
Year of appointment2003
Position
Area of expertise
10Ms EAN Sishi
Year of appointment2012
Position
Area of expertiseHuman Resources.
11Mr KXT Socikwa
Year of appointment1995
Position
Terminals
Area of expertiseLegal and commercial.
12Mr R Vallihu
Year of appointment1995
Position
Area of expertiseStrategy and engineering.
13Mr R Wolfenden
Year of appointment2010
Position
Area of expertiseFinancial, governance, internal control and strategy.
8 9 10 11
12 13
Intr
od
uc
tio
n t
o T
ran
sne
t
2012 Integrated report 21

22
Executive statement
Introduction The Executive Statement (Statement) is written on behalf of the Board of Directors (Board) by the
Chairman, Group Chief Executive and Acting Chief Financial Officer. Individual perspectives have been
included in the Statement relative to various stakeholders.
The Board would like to use this opportunity to report on Transnet’s progress in executing the Quantum
Leap Strategy; as well as the challenges encountered during the year and outline the Company’s revised
strategy to enable all stakeholders, as referenced in this Report, to make informed decisions about the
state of Transnet.
Operating context and economic outlookThe current economic and market environment is characterised by significant uncertainty and change,
particularly in the short term. Europe’s ongoing financial crisis has left the global economy at risk of a
deep and prolonged recession. Growth has slowed in several major developing countries, including Brazil
and India. Despite renewed activity in the United States and Japan, global growth and world trade have
slowed sharply.
The longer-term outlook remains positive for South Africa and the region, with continued growth in
emerging economies driving increased commodity demand. Changing global and regional trade patterns
will also benefit the region as increased trade volumes and connectivity make it easier for regional firms
to participate in global manufacturing supply chains.
Growth forecasts have been significantly downgraded with the World Bank forecasting growth of 2,5%
and 3,1% in 2012 and 2013 versus the 3,6% projected in June 2011 for both years. High-income country
growth is forecast at 1,4% in 2012 and 2,0% in 2013, versus 2011 forecasts of 2,7% and 2,6% for 2012
and 2013 respectively. Growth in developing countries has been revised down to 5,4% and 6,0% versus
6,2% and 6,3% in the 2011 projections. As a result, world trade, which expanded by an estimated 6,6% in
2011, is forecast to grow by only 4,7% in 2012, before strengthening to 6,8% in 2013.
However, positive signals for an improved outlook include benign inflation in China over the last quarter
and the oversubscribed auction of Spanish and French bonds during January 2012. Global inflation appears
to be moderating, as weaker demand has contributed to declines in food and commodity prices. Oil prices,
however, have been underpinned by risks to supply due to geopolitical factors.
Although the forecast risks have increased owing to weakening global conditions and the heightened
probability of a break-up of the Euro Zone, the outlook for the region remains fairly positive. Sub-Saharan
Africa’s regional growth in 2012 and 2013 is estimated at 5,3% and 5,6% respectively.
Although commodity prices are expected to weaken in the short term, they will remain well above historic
levels, partly reflecting the continued strength of Asian demand. As global demand starts to recover in
2013, the average price of oil may rise. Against this backdrop, it is expected that the region’s oil
producers, namely Angola, Ghana, Equatorial Guinea and Nigeria, will remain the fastest-growing sub-
Saharan economies.
South Africa is highly integrated with the world economy, which plays a central role in shaping our
economic prospects. In the near term, South Africa will be affected by international trade and investment
trends, and is vulnerable to slowing global demand.

Ex
ec
uti
ve
sta
tem
en
t
232012 Integrated report
According to the South African Reserve Bank’s forecast, the annual real growth rate in
2011 is estimated to have been in the region of 3,1%, but the outlook for 2012 and
2013 has deteriorated relative to the previous forecast, mainly due to a downward
revision of the global growth assumptions. Growth in 2012 is expected to average 2,8%
compared with 3,2% in the previous forecast, while the forecast for growth in 2013 has
been revised down from 4,2% to 3,8%.
In spite of the challenging economic environment, the outlook for Transnet’s key
commodities remains positive. The aggressive investment that underpins the MDS is
targeted primarily at satisfying demand that has been validated with customers.
This includes additional capacity for export coal, iron ore and manganese as well as key
domestic commodities including coal, magnetite, iron ore, cement, agricultural
commodities and containers. The risk of demand destruction arising from the weak
economic outlook is thus minimal.
New locomotives at Rail Engineering, Koedoespoort.

Executive statement (continued)
24
GovernanceDuring the year, the Board demonstrated its continued commitment to the letter and
spirit of good corporate governance as outlined by the King III Code on Corporate
Governance and the Companies Act. As a SOC, Transnet has the additional responsibility
of complying with the PFMA, which sets strict guidelines for managing public funds. The
Company has, furthermore, adopted international standards of integrated reporting and
sustainability reporting in accordance with the Global Reporting Initiative.
The Board is of the view that the Company has discharged its responsibilities as set out
in all these best practice guidelines and legislation in a commendable manner.
Governance structure
Corporate Governance and Nominations Committee
Audit Committee
Human Resources and Remuneration Committee
Board Risk Committee
Social and Ethics Committee
Board Acquisitions and Disposals Committee
Transnet Board of Directors
Group Executive Committee
Divisional Executive Committees
Public Policy and Regulation Committee
FinanceCommittee
CapitalInvestmentCommittee
NMPP Governance Steering Committee
RiskManagementCommittee
HumanResourcesCommittee
Business Information Management Committee
Delegation of Authority
Extended Executive and Senior Management
Port Terminals PipelinesNational Ports Authority
Rail Engineering
Freight Rail
CO
MM
ITT
EE
SC
OM
MIT
TE
ES

Ex
ec
uti
ve
sta
tem
en
t
252012 Integrated report
Executive 11%
Non-executive 89%
Directors’ split
The detailed Corporate Governance Report can be accessed in volume 2.
Board of DirectorsThe Company’s Memorandum of Incorporation provides that
there shall not be less than 10 and not more than 18 directors,
of whom not less than eight shall be non-executive directors and
two executive directors. At 31 March 2012, the Board comprised
18 directors of whom the majority (16), are non-executive,
including the Chairman.
The non-executive directors have direct, unfettered access to all
Company’s records, external auditors, professional advisors and
internal auditors. The Chairman and the Group Chief Executive’s
roles are separate. The Chairman, Mr Mkwanazi is an
independent non-executive director.
The Board held six scheduled meetings for the year ended
31 March 2012 and member attendance at these meetings is
reflected in the Corporate Governance Report in volume 2. The
Board had two unscheduled meetings during the year to discuss,
amongst others, the appointment of the external auditors,
allegations raised in a Public Protector Report, the appointment
of the Chief Financial Officer and PFMA matters.
More detail regarding these significant matters is highlighted
below.
Appointment of the Chief Financial Officer
The position of the Chief Financial Officer is subject to a Board
and Shareholder process as determined by the Company’s
Memorandum of Incorporation. The Board has fulfilled its
obligation by making a recommendation to the Shareholder
Minister as to a suitable candidate. The Board is awaiting
Shareholder Minister approval. The acting position has not
negatively impacted the effective financial management of the
Company. Refer to the Audit Committee Report in volume 2 for
the assessment of the Company’s financial function as well as
the competency of the Acting Chief Financial Officer.
Appointment of external auditors
During the year, the Audit Committee concluded the appointment
of SizweNtsalubaGobodo as the Company’s external auditor
following a rigorous open tender process. The appointment is
significant for two reasons: it marks the first rotation of service
providers for our external audit function and, the first instance
of a 'home-grown' black-owned and managed audit firm being
appointed for an external audit of this magnitude.

Executive statement (continued)
26
Refer to volume 2 for further detail.
Internal control and Public Finance Management Act compliance
Transnet has implemented and maintained sound governance structures and processes in compliance with the provisions of the PFMA. PFMA compliance is one of the key business issues that the Company manages and monitors. This monitoring function is achieved through an approved PFMA policy, guidelines and a materiality framework that has been established at Group-level with the support of the Shareholder Representative and cascaded throughout the Company.
In terms of this materiality framework, four items are reported as irregular expenditure.
approval;
In all these cases, value was derived and the necessary corrective and disciplinary actions were taken by Management or are in the process of finalisation.
Complaint from the office of the Public Protector
In December 2010, a complaint was received from the office of the Public Protector relating to allegations of non-compliance with good corporate governance with respect to various transactions awarded by the Company. These complaints related to some of the Company’s contracts, its human resource management processes and the procedures followed in appointing certain consultants.
Accounting firms, Nkonki and KPMG were appointed to review the allegations and report to the Board on their findings. The Board reviewed the findings and as required by law, responded appropriately to the Public Protector on the allegations for them to be in a position to finalise their obligations.
Majority of control breaches identified in the report have been addressed by Management and Internal audit have assessed the improvements as adequate. Where appropriate and necessary corrective disciplinary action will be taken.
Dredger at the Port of Richards Bay.

Ex
ec
uti
ve
sta
tem
en
t
272012 Integrated report
Volume growth
2
4
Financial sustainability
Regulatory
Humancapital
Strategic enablers6
SHEQ
Quan
tum Leap Strategy
New Growth Path
3
Capital investment
Increase productivity and efficiency
1
IMPROVINGCUSTOMER
SERVICE
Overview of strategy executionThis Statement demonstrates that the Company has achieved yet another year of robust performance, reflecting significant improvement in all areas of the Company and is well on its way to delivering on its commitment to its various stakeholders. Its financial fundamentals are strong and the Company has shown
significant operational improvement during the year and more is
expected. Together these achievements have led to the
transformation of Transnet’s positive image and reputation with
its Shareholder, customers and other external stakeholders.
Transnet’s Quantum Leap Strategy as depicted alongside, was
informed by the policy context of South Africa’s NGP and the
Shareholder expectations and acknowledges the critical role of
SOCs as drivers of the developmental State’s objectives.
The strategic focus areas address productivity and efficiency
improvements, volume growth, financial sustainability, skills
development, job creation, infrastructure development, safety,
preferential procurement and enterprise development as well as
regional integration and regulatory certainty.
Transnet posted an impressive 20,9% increase in revenue to
R45,9 billion. This was driven by growth in volumes, and more
importantly, an 18,0% improvement in operational efficiencies
and productivity – a key element of the Company’s strategy.
Consequently, the Company’s key measure of profitability,
earnings before interest, taxation, depreciation and amortisation
(EBITDA) or profit from operations increased by 19,8% to
R18,9 billion.
This performance was underpinned by strong growth in volumes
from all Operating divisions, led by Freight Rail, which surpassed
201 million tons (mt) of freight moved in a single year, a first in
the history of the Company and its predecessors.
Our record breaking capital investment programme, a key
element in our drive to boast efficiency and create capacity was
R22,3 billion for the year.
Transnet investment and operational activities resulted in the
employment of an additional 3 159 new employees during 2012
and created 27 964 new jobs in supplier related industries, which
successfully support the objectives of the NGP.
Significant progress has been made in improving the Company’s
safety performance during the year. Notwithstanding this
improvement, 2012 saw fatalities of seven employees on duty.
The Board extends its heartfelt condolences to the families,
friends and colleagues of the deceased. The year’s painful events
have shown us that we must remain ever vigilant to ensure the
safety of our people and to strive unremittingly towards our goal
of zero harm.

Executive statement (continued)
28
Shareholder’s Compact – performance criteriaThe Shareholder’s Compact forms the basis for the development of the strategic direction of the Company
whilst the KPIs included in the Compact serve as a framework for the performance monitoring of the Company.
Performance information and other criteria comparing actual 2012 results to the targets, as required by
section 55 (2) of the PFMA have been outlined below. The performance information was subject to an audit and
no adverse findings have been reported.
Most of the 2012 Group KPIs incorporated into the Shareholder‘s Compact have been met. The overall
performance of Transnet over the financial year is commented on in more detail throughout this Report. The
Operating division KPIs are included in later sections of this Report and in volume 2.
Shareholder’s Compact – Group
Key performance area Key performance indicator Unit of measure
2012 Target
2012 Actual
Target achieved
2013 Target
Financial value creation
Operating expenditure as a % of revenue % �60 58,9 � �56
Return on average total assets# % �8,0 6,8 �
(a) �8,5
Cash interest cover times �3,2 4,2 � �3,6
Gearing % �46,8 42,1 � �45,5
Human capital Training spend % of personnel costs �3,5 3,9 � �4,0
Skills development
Engineering trainees Number of learners 60 60 � �120
Technician trainees Number of learners 180 181 � �300
Artisan trainees Number of learners 500 854 � �500
Sector-specific trainees Number of learners 1 500 2 506 � �1 800
Safety DIFR* Weighted average �0,80 0,65 � �0,80
Employee fatalities Number of fatalities 0 7 �(b) 0
Employment creation
Direct jobs created (Transnet employees) Number of jobs �2 562 3 159 � �4 048
Indirect jobs created in supplier industries+ Number of jobs �33 331 27 964 �
(c)
ns
��Target achieved.�� Target not achieved.ns�Not set.# Revenue divided by average total assets excluding capital work-in-progress.* The Group DIFR has been calculated by aggregating the disabling injuries (DI) and man-hours worked by all Operating divisions over the past
financial year. The standard NOSA formula (DIFR = (DI x 200,000) ÷ Rolling 12-month man-hours worked) had been applied. The DIFR rate was previously derived as an average of the actual DIFR of the Operating divisions. This resulted in the prior year DIFR of 0,98 being restated to 0,82.
+ As determined by Transnet's macro economic model.(a) The major contributing factor for the non achievement of the target was due to the capitalisation of the Pipeline assets to the value of
R11,7 billion.(b) Transnet continues to emphasise a culture of 'zero tolerance' with regard to fatalities. Each fatality is treated on a case-for-case basis.(c) Indirect job creation is based on targeted capital investment and operating cost spend. Both variables were below target for the 2012
financial year.

Ex
ec
uti
ve
sta
tem
en
t
292012 Integrated report
These results should be read in conjunction with the summary financial statements prepared in terms of International Financial Reporting Standards (IFRS) containing the information required by IAS 34: Interim Financial Reporting, as well as the Companies Act, No 71 of 2008, contained in Appendix A set out on page 126.
OPERATIONAL EFFICIENCY
VOLUME GROWTH
FINANCIAL SUSTAINABILITY
ECONOMIC DIVIDENDS
Refer to Operational reviews on page 76 for further detail.
Group performance reviewRevenue, volumes and operational efficiencies
Revenue for the year increased by 20,9% to R45,9 billion
(2011: R38,0 billion), mainly due to a growth in volumes. Significant productivity and efficiency improvements of 18,0% as well as volume growth were realised across all Operating divisions. This demonstrates the positive impact of the new operations philosophy of the Company as well as the benefits of the increased capacity created by the capital expenditure programme.
Furthermore the achievements underscore the effectiveness of Management's efforts in improving customer service and achieving volume growth through the scheduled railway strategy as well as improved monitoring and managing of operational risk.
General freight volumes increased by 9,9% to 81,0mt (2011: 73,7mt) including an increase in containers on rail of 21,5% to 762 760 TEUs (2011: 627 825 TEUs), evidencing a market share growth. On-time departures and arrivals for the general freight business improved by 18,9% and 17,7% respectively compared to prior years as a result of the 'Yard Countdown Tool' introduced during the year.
Export coal volumes increased by 8,8% to 67,7mt (2011: 62,2mt). This increase was due to on time departures and arrivals improving by 10,7% and 19,9% respectively compared to the prior year. A new weekly record of 1,7mt was achieved during the year.
Transnet has already engaged the Richards Bay Coal Terminal and the coal industry to ensure that capacity on the coal line is created for new mining entrants with a focus on B-BBEE. The Company has completed a formal study to determine the level of interest/appetite from new entrants for long and short-term allocation of capacity in both the coal and manganese export channels. The findings of the study will inform decisions on future expansion. This information is being processed and will inform us as to the required capacity in the short and long-term.
Export iron ore volumes increased by 13,2% to 52,3mt (2011: 46,2mt), due to scheduled departures and arrivals improving by 58,4% and 53,3% respectively. A record weekly throughput tempo of 1 222 000 tons was achieved in the last week of the financial year.
Container volumes increased by 6,6% due to an increase in transshipments, dry bulk increased by 7,7% and automotive volumes increased by 9,3%,
General Freight (mt)
2012 Actual
2012 Target
20112010
9,9% 2012 vs 2011 -4,0% 2012 vs 2012 Target
72
,1
73
,7 84
,4
81
,0

Executive statement (continued)
30
17
,8
18
,0
18
,0
16
,7
Export coal (mt)
2012 Actual
2012 Target
20112010
8,8% 2012 vs 2011 -3,3% 2012 vs 2012 Target
61
,8
62
,2 70
,0
67
,7
Export iron ore (mt)
2012Actual
2012Target
20112010
13,2% 2012 vs 2011 -1,4% 2012 vs 2012 Target
44
,7
46
,2 51
,6
52
,3
Containers (000 TEUs)
2012 Actual
2012 Target
20112010
6,6% 2012 vs 2011 0,8% 2012 vs 2012 Target
3 6
29
4 0
81
4 3
19
4 3
52
-7,2% 2012 vs 2011 -7,2% 2012 vs 2012 Target
Petroleum (bl)
2012Actual
2012 Target
20112010
Average moves per gross crane hour (GCH) increased by 8,1% from 24,6 GCH in the prior year to 26,6 GCH. The average tons loaded per hour at the Saldanha iron ore terminal has increased by 4,1% from 6 959 tons per hour to 7 242 tons per hour, and the Richards Bay dry bulk terminal’s loading rate has increased by 2,7% from 660 tons per hour in 2011 to 678 tons per hour in the current year.
A combination of supply and demand challenges contributed significantly to the underperformance of Pipelines volume performance for the year. Pipelines volume performance is 7,1%
below the prior year however 98% of all orders placed on the
pipeline system for delivery was met.
The Company continued to invest aggressively in infrastructure during the year. This resulted in tariff increases particularly for coal, iron ore and pipeline customers, in line with their contractual commitments that enabled the Company to earn a
fair return on invested capital.
Stakeholder engagement
Various stakeholder engagement initiatives during the year
reflected that service delivery, innovation, reliability, safety and
communication are amongst the concerns most raised by
customers. Accordingly, numerous customer engagement forums
were facilitated including Group Chief Executive roadshows,
customer satisfaction feedback reports, fact sheets, pamphlets,
newsletters, an annual customer satisfaction survey and social
events. These engagements proved invaluable, with Transnet’s
strategic responses leading to the achievement of significant
volume increases and operational efficiency improvements
during the year. Outcomes include:
practice methodology and models to sustain capital
investment and support volume growth;
processes to ensure fair allocation of capacity;
planning;
efficiency and productivity and to ensure security of fuel
supply;
efficiency improvements and transshipments; and
a transshipment hub and increasing over-border rail volumes.
Ex
ec
uti
ve
sta
tem
en
t
312012 Integrated report
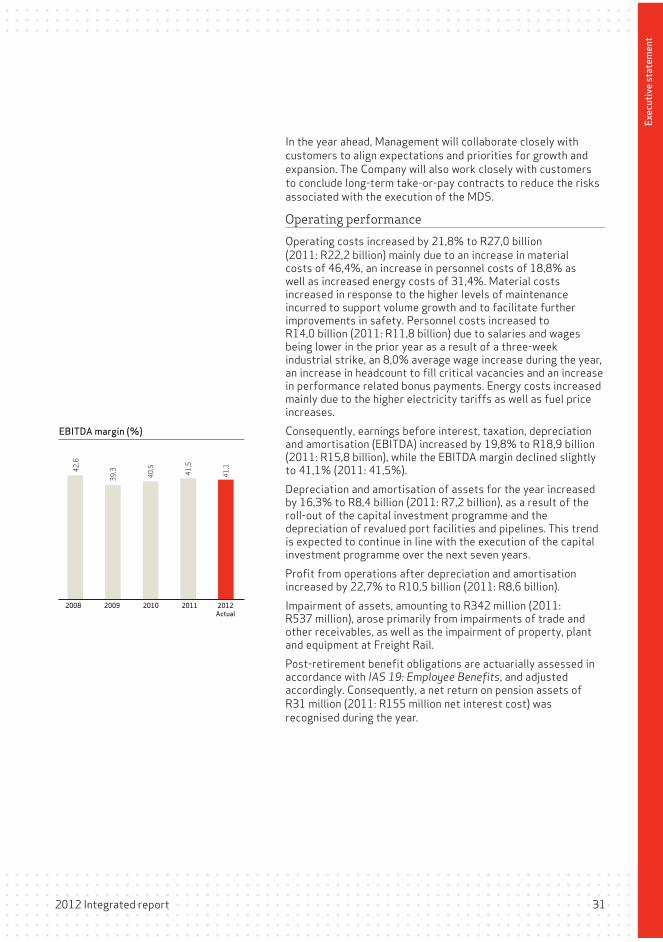
EBITDA margin (%)
2008 2009 2010 2011 2012Actual
41
,1
41
,5
40
,5
39
,342
,6
In the year ahead, Management will collaborate closely with
customers to align expectations and priorities for growth and
expansion. The Company will also work closely with customers
to conclude long-term take-or-pay contracts to reduce the risks
associated with the execution of the MDS.
Operating performance
Operating costs increased by 21,8% to R27,0 billion
(2011: R22,2 billion) mainly due to an increase in material costs of 46,4%, an increase in personnel costs of 18,8% as well as increased energy costs of 31,4%. Material costs increased in response to the higher levels of maintenance incurred to support volume growth and to facilitate further improvements in safety. Personnel costs increased to R14,0 billion (2011: R11,8 billion) due to salaries and wages being lower in the prior year as a result of a three-week industrial strike, an 8,0% average wage increase during the year, an increase in headcount to fill critical vacancies and an increase in performance related bonus payments. Energy costs increased mainly due to the higher electricity tariffs as well as fuel price increases.
Consequently, earnings before interest, taxation, depreciation and amortisation (EBITDA) increased by 19,8% to R18,9 billion (2011: R15,8 billion), while the EBITDA margin declined slightly to 41,1% (2011: 41,5%).
Depreciation and amortisation of assets for the year increased by 16,3% to R8,4 billion (2011: R7,2 billion), as a result of the roll-out of the capital investment programme and the depreciation of revalued port facilities and pipelines. This trend is expected to continue in line with the execution of the capital investment programme over the next seven years.
Profit from operations after depreciation and amortisation increased by 22,7% to R10,5 billion (2011: R8,6 billion).
Impairment of assets, amounting to R342 million (2011: R537 million), arose primarily from impairments of trade and other receivables, as well as the impairment of property, plant and equipment at Freight Rail.
Post-retirement benefit obligations are actuarially assessed in accordance with IAS 19: Employee Benefits, and adjusted accordingly. Consequently, a net return on pension assets of
R31 million (2011: R155 million net interest cost) was
recognised during the year.

Executive statement (continued)
32
The fair value adjustment results mainly from the capital loss of
R523 million, associated with the early redemption and swap of
the T018 bonds, offset by an investment property fair value gain
of R353 million recognised in terms of IAS 40: Investment Property. The early redemption and swap of the T018 bonds was
completed during the financial year to positively impact the
weighted average cost of debt. An amount of R2,999 million was
redeemed early in the first half of the year and the remainder of
the T018 bonds were swapped for T20, T23 and T25 bonds.
The ‘mark to market’ of derivative financial instruments resulted
in losses of R32 million for the year. More specifically, these
losses arose from the ’mark to market’ of foreign exchange
hedges that Transnet executed to eliminate foreign currency risk
and those hedges which have not been ‘hedge accounted’ in
terms of IAS 39: Financial Instruments: Recognition and Measurement.
Accordingly, net profit from operations before net finance costs
of R10,0 billion (2011: R8,6 billion) reflected an increase of
16,8% when compared to the prior year.
Finance costs increased by 23,7% to R4,3 billion (2011:
R3,4 billion), due to borrowings that were raised during the last
week of the prior financial year amounting to R5,1 billion as well
as additional borrowings raised during the year to fund the
capital investment programme. Capitalised borrowing costs
amounted to R1,6 billion (2011: R1,8 billion).
The taxation charge for the year amounted to R2,1 billion
(2011: R1,5 billion), comprising a current taxation charge of
R189 million (2011: R905 million) and a deferred taxation
charge of R1,9 billion (2011: R603 million). The decrease in the
current taxation charge and concomitant increase in the
deferred taxation charge arose mainly due to an increase in wear
and tear allowances as well as maintenance expenditure. The
effective taxation rate for the Group at 34,0% (2011: 26,8%) is
higher than the corporate taxation rate of 28,0% primarily as a
result of an increase in the capital gains taxation inclusion rate
from 50,0% to 66,6% and permanent differences.
Profit for the year from continuing operations amounted to
R4,1 billion (2011: R4,2 billion), a decrease of 1,6%.
Net finance costs (R billion)
3,8
2,9
2,4
2,0
1,9
2008 2009 2010 2011 2012Actual

Ex
ec
uti
ve
sta
tem
en
t
332012 Integrated report
Cash generated from operations (R billion)
2010 2011 2012 Actual
20092008
11
,1
11
,2
16
,2
14
,2
20
,6
Cash interest cover (times)
6,5
3,0
3,7
3,9
4,1 4
,2
2010 201120092008 2012Target
2012Actual
Revaluation of property, plant and equipment
The Group assesses the revaluation of its pipeline networks and
port facilities in line with its accounting policy, which requires an
independent valuation every three years as well as index
valuations in the intervening periods. During the year, an index
valuation was applied to pipeline networks and to port facilities.
Consequently, the carrying value of the port facilities required a
revaluation adjustment of R2,7 billion in accordance with
IAS 16: Property, Plant and Equipment (2011: R8,2 billion). The
decrease in the revaluation amount compared to the prior year is
due to the increase in the volume outlook for the prior year
following recovery from the recession.
In addition, a revaluation of the carrying value of the pipeline
network of R166 million was recognised (2011: R310 million).
Deferred taxation
The deferred taxation liability increased to R18,1 billion
(2011: R15,4 billion), as a result of the current year charge of
R1,9 billion, together with the deferred taxation impact on the
revaluation of property, plant and equipment of R850 million,
which has been recorded directly in equity.
Cash flows
Cash generated from operations amounted to R20,6 billion
(2011: R16,2 billion), an increase of 27,6% from the prior year,
evidencing the ability of the Company to generate strong
sustainable cash flows. Significant focus and improved working
capital management, as well as improved collections relating to
the Passenger Rail Agency of South Africa (PRASA), has resulted
in a working capital inflow of R781 million.
The Government-approved security of supply petroleum levy for
the NMPP of 7,5 cents per litre to ensure the long-term security
of supply of petroleum products to the inland market – also
contributed to the improvement in cash generated from
operations by R1,3 billion.
The cash interest cover ratio remains strong at 4,2 times (2011:
3,9 times). This is significantly above the target of 3,0 times
despite an increase in net finance costs, resulting from increased
borrowings to fund the capital investment programme. It is
expected that the cash interest cover ratio will not fall below
the target going forward.

Executive statement (continued)
34
Gearing (%)
50
,0
30
,9
37
,7
41
,1
39
,8
42
,1
2010 201120092008 2012 Actual
2012 Target
Funding initiatives (R billion)
The total funding raised during the year to 31 March 2012 amounted to R11,1 billion which is mainly made up of the following:
Club loans 5,5
Bank loans 0,1
Commercial paper 3,2
Domestic bonds 1,8
French Development Bank 0,5
Borrowings and funding
Despite the uncertain global financial markets and economic
growth outlook both locally and internationally, Transnet
successfully raised the funding required for its capital
investment programme. At the beginning of the financial year,
funding required for the year was estimated to be R20,8 billion.
As a result of pre-funding activities in the prior year, required
funding was reduced to R12,9 billion.
Transnet repaid borrowings amounting to R14,0 billion, which
related predominantly to domestic bonds, commercial paper, and
domestic and foreign loans that matured during the year. During
the year Transnet also early redeemed the T018 bonds.
The gearing ratio deteriorated marginally to 42,1% compared to
41,1% as at 31 March 2011, despite the capital expenditure of
R22,3 billion. This level is still well below the Group’s target
range of 50,0%, reflecting the significant capacity available to
fund future capital expenditure. The gearing ratio is not
expected to exceed the target ratio going forward.
Derivative financial assets and liabilities
Derivative financial instruments are held by the Group to hedge
financial risks associated with its capital investment and
borrowing programmes. The ‘mark to market’ of these derivative
financial instruments resulted in a net derivative financial asset of
R358 million (2011: Net liability of R605 million).
The recent volatility of foreign exchange rates gave rise to a net
asset position. Cross-currency interest rate hedges and forward
exchange contracts were executed to eliminate foreign currency
and interest rate risk on borrowings. These hedges have been
hedge accounted for in terms of IAS 39: Financial Instruments: Recognition and Measurement.
Shunting yard in Port Elizabeth.

Ex
ec
uti
ve
sta
tem
en
t
352012 Integrated report
Contingencies and commitments
There were no material movements in contingencies and commitments since
31 March 2011.
Guarantees
Transnet's sole Shareholder, namely the South African Government, has guaranteed
certain borrowings of the Group amounting to R3,5 billion (2011: R9,5 billion).
The redemption of the T018 bonds has resulted in the decrease of R6,0 billion
in guarantees from the State.
Stakeholder engagement
During the year, investors and credit rating agencies have expressed concern at a
number of issues including:
consequently Transnet;
flow from operations, which in turn increases funding requirements.
To mitigate these concerns, Transnet will continue to enhance financial risk
management throughout the capital investment programme and seek to establish
greater public policy and regulatory certainty with Government and regulators.
Mitigating actions include managing cash and working capital, diversifying funding
sources, seeking innovative means for Private Sector Participation opportunities (PSP)
and exploring the possibility of ‘off-balance-sheet’ funding.

Executive statement (continued)
36
Capital investmentsCapital investment for the period amounted to a record R22,3 billion (excluding capitalised borrowing costs) excluding the part payment for the acquisition of the former Durban International Airport site made during the year. Transnet will use the site to build a dig-out port to augment capacity in Durban, especially for containers. The total investment in infrastructure over the past seven years is R115,5 billion.
During the year, two noteworthy milestones were achieved in Transnet’s capital investment programme, namely: the completion of the pipelines network and pump stations of the NMPP project; and the official opening of the Port of Ngqura by His Excellency, President JG Zuma.
Stakeholder engagement
Long-term infrastructure planning is done in conjunction with national, provincial and local Government, other SOCs, long-term customers and other logistics service providers. All major capital investment projects, as well as any significant changes to the operating system, necessitate extensive engagement with interested and affected parties. These typically include customers, suppliers, business partners, employees, Government, communities, investors, regulators and the media.
A specific concern raised by stakeholders during the year was Transnet’s ability to create the required capacity to meet the needs of the growing economy through infrastructure
investments. The MDS will stimulate a significant increase in
freight volumes and encourage a considerable modal shift from
road-to-rail.
Transnet will further enhance its capital execution capabilities as well as use capital investment and related procurement of services and equipment as the catalyst for unlocking South Africa’s industrial base. This will, in turn, contribute to sustainable local industries and job creation, whilst supporting
the country’s transformation objectives, especially B-BBEE.
Historical capital investment (R billion)
15
,8
22
,3
19
,4
21
,5
18
,4
2010 2011 2012Actual
20092008
2012 capital spend by Operating division (%)
Freight Rail 67
National Ports Authority 8
Port Terminals 5
Pipelines 20
CAPITAL INVESTMENT FOR THE YEAR AMOUNTED TO A RECORD
R22,3 BILLION.
R11,6 BILLION OF THE CAPITAL SPEND FOR 2012 WAS INVESTED IN EXPANDING THE CURRENT INFRASTRUCTURE AND EQUIPMENT, WHILE
R10,7 BILLION WAS INVESTED IN MAINTAINING THE EXISTING CAPACITY.
CAPITAL EXPENDITURE
ECONOMIC DIVIDENDS

Ex
ec
uti
ve
sta
tem
en
t
372012 Integrated report
Progress on major projects
A significant component of the investment plan is geared towards infrastructure, sustainability and capacity creation to support Transnet's strategic objectives. Whilst the 'major project' portfolio is extensive, progress on selected projects are highlighted.
Iron ore line expansion up to 60,0mt
The iron ore line is the main export
channel for iron ore from the mines in
the Northern Cape to the Port of
Saldanha. Rail capacity will increase to
60,0mt and port capacity to 58,0mt
over the quay wall. The expansion of
the iron ore line is close to completion.
Construction of a 32 kilometre
electrified railway line linking Kolomela
mine in Sishen South to the mainline is
complete and fully operational.
Expansion of the Salkor Yard in
Saldanha is complete with only ancillary
works remaining. Upgrade works at the
Port of Saldanha are complete with
minor works relating to the shiploaders
and conveyor belts remaining and
scheduled for completion during the
planned shutdown in August 2012. The
acquisition of two batches of Class 15E
locomotives will facilitate the increase
in iron ore capacity to beyond 60,0mt.
The first batch of 44 locomotives was
delivered and accepted into operations
by September 2011. The second batch
of 32 locomotives is planned for
delivery over the next two years.
R1,6 billion was invested in iron ore
expansion projects and locomotive
acquisitions during the year.
Coal line expansion up to 81,0mt
The coal line is the main export channel
for coal and starts from the mines in
Mpumalanga and ends at the Port of
Richards Bay. Plans are in place to
increase capacity to 81,0mt and
thereafter to 97,5mt. Together with
sustaining capital, investment is
estimated to be R31,6 billion over the
next seven years.
The acquisition of 110 Class 19E dual
voltage locomotives will facilitate the
planned expansion of the coal line to
81,0mt. The locomotives, in
combination with wagons and upgraded
infrastructure, are expected to
contribute to the increased throughput
of export coal on the Richards Bay
corridor. Of the 110 Class 19E dual
voltage locomotives, 98 locomotives
have been delivered as at 31 March 2012.
A total of 95 locomotives have been
accepted into operations with the
remaining five undergoing acceptance
testing. The remaining 12 locomotives
are due to be delivered by June 2012.
A total of R2,2 billion was invested in
the coal line expansion and the
acquisition of Class 19E locomotives
during the year.
Dust mitigation on stockpiles at Saldanha. Dust mitigation on manganese tippler section at Port of Port Elizabeth.
Ngqura Container Terminal (NCT)
The Port of Ngqura was officially launched by His Excellency, President JG Zuma on 16 March 2012. The Ngqura Container Terminal is a new facility located at the Port of Ngqura and provides additional container handling capacity to the ports system in South Africa, making it the third largest port in the country.
Dredging is scheduled for completion in September 2012, which will signify completion of Phase 2, increasing capacity to 800 000 TEUs. Investment in the Ngqura Container Terminal, including the rail component, amounted to R257 million for the year.
Based on volume demand projections, Transnet has commenced with Phase 2A of the project to expand capacity from 800 000 TEUs to 1,5 million TEUs. The expansion involves the acquisition of container handling equipment at a cost of R1,1 billion and supports Transnet’s strategy of creating capacity ahead of demand. The terminal handled 507 000 TEUs for the year. Ngqura Container Terminal is being positioned as a transshipment hub and gateway for container traffic into Southern Africa.
Container being loaded onto Ferrari truck by rubber tyred gantry cranes.

Executive statement (continued)
38
Reach stackers moving empty containers at Pier 1.
Durban Container Terminal (DCT)
The Durban Container Terminal is one of the busiest container facilities in the southern hemisphere. The project to reengineer the terminal through reconfiguration and equipment replacement will increase terminal capacity to 2,9 million TEUs. R70 million was invested in the DCT reengineering project during the year. The seven tandem lift cranes for DCT are scheduled for commissioning by December 2012, and their introduction to the fleet is expected to improve efficiency by increasing gross crane moves per hour from the current level of 21 GCH to 33 GCH over the next seven years.
During the year, Transnet approved the accelerated acquisition of 33 hauler trailer sets, six additional mobile harbour cranes, and eight reach stackers for Maydon Wharf and Point (Ro-Ro) terminals at a total cost of R438 million. Delivery of the container handling equipment for these terminals is expected to be completed with all mobile harbour cranes fully commissioned by November 2012. This will facilitate the volume overflow from DCT during berth outages for scour protection, recessing of the crane rails to accommodate the 30 metre rail gauge for the tandem lift cranes and the berth deepening project, which will enable the terminal to accommodate larger vessels.
Moses Wence, SHEQ officer at the time of shift change next to a rubber tyred gantry crane.
Cape Town Container Terminal (CTCT)
The expansion of the Cape Town Container Terminal will increase capacity to 1,4 million TEUs (Phase 2) to address the growth in demand for containers, enabling it to be the second largest port in the country.
The first reconfigured terminal area for refrigerated containers has been completed. 720 metres of the 1 130 metre-long quay wall has been deepened to -15,5 metres chart datum. Certain sections of the reconfigured stacking area have been completed. The contract for the acquisition of 32 rubber tyred gantry cranes has been completed and the equipment commissioned to service. Six of the eight ship-to-shore cranes are in operation. The terminal handled 679 000 TEUs for the year.
Capital invested amounted to R652 million for the year.
Pipeline pumpstation 1 – Durban.
New Multi-Product Pipeline (NMPP)
The NMPP is a strategic investment to secure the supply of petroleum products to the inland market over the long term. It is one of the largest multi-product pipelines in the world, and one of the most complex. An innovative engineering project in concept, design and implementation, it remains unseen by many South Africans as the pipeline component of the NMPP system of assets is buried underground over a distance of 555 kilometres.
Transnet Pipelines successfully commissioned the Kendal – Waltloo, Jameson Park – Alrode and Alrode – Langlaagte sections of the pipeline in May 2011. The 16-inch pipelines are performing well. During the year, the southern portion of the 16-inch pipeline network transported in excess of 990 million litres of fuel, while over 275 million litres were transported in the northern section. The 24-inch trunkline from Durban to Jameson Park was operationalised in January 2012 and transported over 348 million litres of diesel for the year ended March 2012. The entire project (pipelines and terminals) is expected to be completed by December 2013.
The Company is confident that the revised schedule and costs will not be exceeded. The NMPP construction is progressing according to the revised plan.
R4,2 billion was invested in the NMPP during the year and R15,8 billion since the project commenced.
Newly built locomotive at Koedoespoort yard.
General Freight Business (GFB)
An amount of R10,3 billion was invested in GFB and relates to the upgrade and
maintenance of infrastructure and rolling stock. Of the 100 Class 43 new diesel
electric mainline locomotives, 39 have been delivered with 38 having been
accepted into operations and deployed to the Phalaborwa region.
During the year, the accelerated acquisition of an additional 43 diesel locomotives
for GFB was approved. 18 locomotives are expected to be delivered in 2013, with
the remaining 25 locomotives expected in the following year. The Company also
issued a tender to acquire 95 electric locomotives for GFB which will further
support volume growth.

Ex
ec
uti
ve
sta
tem
en
t
392012 Integrated report 39
TRANSNET’S INVESTMENT AND OPERATIONAL ACTIVITIES CREATED 27 964 NEW JOBS
IN SUPPLIER RELATED INDUSTRIES, SUPPORTING THE OBJECTIVES OF THE NGP.
HUMAN CAPITAL
Human capitalEmployee numbers across the Company increased by 3 159 (6,6%) to 50 922 from 47 763 in the previous year. The majority of the new appointments support the critical skills requirements.
Transnet’s investment and operational activities created 27 964 new jobs in supplier related industries, which successfully supports the objectives of the NGP.
During the year, Transnet focused on identified initiatives with regards to staff wellness including:
The Transnet Culture Charter defines a set of behaviours required from all Transnet employees to facilitate the achievement of the Company’s growth and strategic objectives. November 2011 marked the most successful scoring participation by Transnet employees of the culture behaviours since the launch of the behaviours in 2008. A total of 28 772 employees participated, showing an overall increase of 12450 over the previous year.
The high participation indicates an increasing sense of ownership of the culture behaviours and a growing perception that scoring is a credible process to have employees’ voices heard.
When asked to focus on the one priority area, employees scored as follows:
Stakeholder engagements facilitated with employees and unions during the year revealed concerns regarding the following:
Transnet invested significantly in employee safety and development during the year. This included maintaining a performance system that supports continuous improvement by informing employees of key strategic initiatives, policies and procedures.
Transnet will continue to fill critical vacancies whilst achieving employment equity targets and enhancing its talent management strategy, thereby contributing positively to skills development within South Africa.
ECONOMIC DIVIDENDS
SOCIAL DIVIDENDS

Executive statement (continued)
4040
A TOTAL OF
60 ENGINEERS, 854 ARTISANS AND 181 TECHNICIANS
QUALIFIED AND RECEIVED TRAINING.
THE COMPANY FURTHER TARGETS
2 000 APPRENTICES FOR TRAINING AT ANY GIVEN TIME.
Refer to volume 3 for further details.
Transnet exceeded the employment equity target of 75% for black employees and achieved 78,5% for the year. The target for female employees was 21,5% was exceeded and resulted in an actual achievement of 22,0%. The 1,1% target for employees with disabilities was not achieved, with an actual achievement of 0,9%. Specific interventions are underway to ensure achievement of the target going forward.
Transnet will work with stakeholders to increase labour productivity to deliver on volume growth and MDS targets.
Relations with labour
Transnet’s Human Capital strategy aims to achieve sound labour relations, ensure employee wellbeing and to drive productivity, whilst rewarding performance.
Just under 83% of Transnet employees are organised under the auspices of two recognised labour unions, namely: the South African Transport and Allied Workers Union (Satawu) and the United Transport and Allied Trade Union (Utatu). In recognition of the critical role worker leadership plays in implementing the Company’s future growth plans, Transnet invested significant time and resources to ensure meaningful engagement on initiatives that both support the business and enable fair, safe and productive workplace practices.
Having achieved positive working relations during the year, the wage agreement was concluded in good time, within mandate and with zero work days lost to industrial action. The wage negotiations resulted in an across the board increase of 8,5% to the basic salary of all bargaining unit employees. Following comprehensive consultation, parties agreed on a revised gain share scheme for Freight Rail to support improved operational efficiencies. Pressure to increase incentive earnings at the Durban Container Terminal resulted in an unprotected industrial action lasting one working day.
Training
During the year, the Company continued to develop sector- specific skills, as well as engineering, technical and artisan skills by building and maintaining established feeder pipelines for critical skills. Currently, the Company supports 393 engineering bursars from their first to final years of study and will grant an additional 200 engineering bursaries during 2013.
In addition to the allocation of bursaries, Transnet also provides engineers and technicians with a structured ‘Engineers-in-Training’ and ‘Technician-in-Training’ Programme, using a coaching and mentoring approach to develop further competencies in these professions.
The Company’s target to recruit 500 new apprentices during the year was met and exceeded, with a final intake of 1 095 individuals. The Company further targets 2 000 apprentices for training at any given time.
Sector-specific skills development will continue to focus on marine, rail and cargo handling with 2 506 learners taken on in 2012 with a planned new intake of 1 800 learners into various development programmes in 2013.

Ex
ec
uti
ve
sta
tem
en
t
412012 Integrated report
Transnet’s training delivery model and platform has been extended to encompass a security and commercial training module in addition to the sector-specific ‘Schools of Excellence’ modules already available for technical, functional, leadership, commercial and security training. Through the ‘Schools of Excellence’, the Company does not only train individuals to meet the Company’s own requirements, but develops a skills-base from which the wider economy can benefit.
In support of the NGP and alignment with skills development training, Transnet increased the training spend for the Company to a total of 3,9% of the wage bill for the year. The Company is training and developing competencies in excess of its requirements to enable alignment with the NGP objectives and in response to the national skills shortage.
Executive remuneration
The Human Resources and Remuneration Committee recommends annual remuneration for both executive and non-executive directors and considers associated performance measures and benefits when assessing remuneration.
Guaranteed
Large publicly listed companies and SOCs require people with exceptional competencies to provide strategic leadership and employment for tens of thousands of people. They are also responsible for generating returns on significant investor funding, including pension funds and savings of workers. In addition to managing businesses equal to or larger in magnitude than some public listed companies, SOCs also have the added responsibility of managing key national resources.
The executive remuneration benchmark survey is conducted based on the Deloitte ‘SA Guide to Executive Remuneration and Reward’, a national remuneration survey published annually by Deloitte Consulting.
Remuneration adjustments and incentive payments are based on individual performance. The individual performance scorecards of the Group Executive Members are directly translated from the Shareholder’s Compact and the strategic objectives of the Company. The measures for assessing executives are aligned with the targets in the Corporate Plan and Shareholder’s Compact.
Based on the benchmark survey and individual performance the remuneration of the Executive Management was adjusted by an average of 5,6% with effect from 1 April 2011.
The Company has fully disclosed all components of the Group Executive members’
remuneration information in volume 2.
Executive remuneration – guaranteed
Salary R thousand
Post-retirement
benefit fund contributions
R thousand
Other contributions
R thousand
Other payments
R thousandTotal 2012
R thousandTotal 2011
R thousand
Total 39 478 3 686 101 5 089 48 354 49 771
Refer to Volume 2 for further details.

Executive statement (continued)
42
Transnet Short- and Long-Term Incentive Schemes for 2012
The Short-term Incentive Scheme (STI) was designed with the specific objective to
drive the achievement of Company targets and rewards the achievement of results.
Executives qualify for an annual STI payment provided that the strategic objectives, as
agreed with the Shareholder Representative, have been achieved. Individual bonus
percentages are further modified with individual performance assessment ratings. The
eligibility range of percentages linked to individual performance ratings for 2012 are
as follows:
Qualifying percentage
Grade On target Maximum
Group Executive Committee A 50% 100%
Extended Executive Committee B 40% 80%
Transnet has implemented a Long-Term Incentive Scheme (LTI). The objectives of the LTI
are to sustain the achievement of the Company’s strategy, to retain key talent, to
encourage ‘stretch’ performance and to reward performance above target.
The table below reflects the short-term and long-term incentives for the Group
Executive Committee. The STI was based on the financial (EBITDA), volume and safety
performance of the Group. The vesting of the 2009 conditional award of the LTI
payments was based on the specific individual and Company performance objectives
being achieved.
LTI 2012 R thousand
LTI 2011 R thousand
STI 2012 R thousand
STI 2011 R thousand
Total 29 005 42 566 44 154 21 191
Non-executive directors’ remuneration
The Shareholder Representative approves, in advance, the fees payable to non-
executive directors The Human Resources and Remuneration Committee receives
independent remuneration guidance regarding the appropriate remuneration for
non-executive directors. During the year, a benchmark study was performed for
non-executive directors’ remuneration. The study concluded that the Board
compensation is comparable to the benchmarks. It was, therefore, recommended to
the Shareholder Representative that fees would not be increased in 2012. The matter
will be considered once again, when the Company is in receipt of the Masekela
Commission Report.
Fees paid to non-executive directors vary based on their appointment to the various
Committees of the Board.
Salary R thousand
Other payments
R thousandTotal 2012
R thousandTotal 2011
R thousand
Total 8 116 1 8 177 3 060
Refer to volume 2 for further detail.

Ex
ec
uti
ve
sta
tem
en
t
432012 Integrated report
Post-retirement pension and medical benefit obligations
The Group provides various post-retirement benefits to its
active and retired employees, including pension, post-retirement
medical and other benefits. The two defined benefit funds,
namely the Transnet Sub-Fund of the Transport Pension Fund
(TTPF) and the Transnet Second Defined Benefit Fund (TSDBF),
are fully funded with actuarial surpluses of R1,7 billion (March
2011: R2,0 billion) and R2,9 billion (March 2011: R3,2 billion)
respectively. Transnet has not recognised any portion of the
surplus on these funds, as the fund rules at present do not allow
for the distribution of a surplus to the Group.
Following discussions at the Parliament's Portfolio Committee
on Public Enterprises, the TSDBF and Transnet decided to pay
R538 million in ad hoc bonuses to the TSDBF beneficiaries
during the financial year. This translated into five months'
pensions for beneficiaries since November 2010. The cumulative
value of ad hoc bonuses paid by the TSDBF to its beneficiaries
over the last three years amounts to R1,4 billion, allowing the
beneficiaries to enjoy effective increases greater than CPI, and
in excess of the statutory 2,0% increase per annum contained in
the rules of the TSDBF.
In addition, the rule providing for the payment of ad hoc bonuses
by the TTPF was gazetted in December 2011 allowing the TTPF
and Transnet to approve the payment of ad hoc bonuses to the
beneficiaries of the TTPF amounting to R89 million in
December 2011.
Transnet has also provided R150 million for an ex gratia
payment to the poorest of its pensioners in the TSDBF and TTPF.
Typically, these pensioners are the widows of black pensioners
and pensioners with long service and relatively low pensions.
The post-retirement medical benefit obligation is approximately
R1,5 billion (March 2011: R1,5 billion) as at 31 March 2012.
TRANSNET HAS MADE A PROVISION OF
R150 MILLION FOR AN EX GRATIA BONUS PAYMENT TO ITS MOST DISADVANTAGED PENSIONERS.

Executive statement (continued)
44
Safety, health, environment and quality (SHEQ)The nature and scope of Transnet’s operations necessitates a
proactive and concerted effort in maintaining the highest
standards of safety, health, environment and quality governance.
SHEQ performance targets are included in the Company’s
strategy, not only to promote a safe and healthy working
environment for employees but also to create an organisational
culture in which trained and competent employees strive
towards excellence in service delivery through ‘zero harm’ to self,
colleagues and the environment. Further, by instilling sound
SHEQ governance principles among employees, it is hoped that
these principles will filter outwards into wider communities.
The significant focus placed on SHEQ performance has resulted
in a reduction of the number and severity of loss incidents during
the year, with incidents reducing from 1 652 in the prior year to
1 060, reflecting an improvement of 35,8%. The total estimated
cost of these incidents for the year was R432 million, compared
to R1,1 billion in the prior year, a reduction of 60,3%. The lower
severity of derailment incidents was a major contributor to this
reduction.
Sadly, the Company recorded seven employee fatalities
compared to 12 in the prior year. The majority of these fatalities
were as a result of motor vehicle accidents.
Safety performance is measured against industry recognised
indicators such as the DIFR. The Company recorded an
improvement in the DIFR from 0,82 in the prior year to 0,65 at
31 March 2012.
A total of 100 public fatalities were reported during the year
compared to 151 in the prior year, the majority being rail related.
Trespassing onto Transnet’s railway lines remains the largest
contributor to these incidents.
Notwithstanding the improvement noted, the Board wishes to
reiterate its continued commitment to the safety of employees
and the public as a vital and integrated component of operations
across the Company. The Board extends its condolences to the
families, friends and colleagues of those who lost their lives
while on duty.
Environmental related obligations arise from environmental
legislation (the National Environmental Management Act, No 107
of 1998; the National Water Act, No 36 of 1998; and the
National Environmental Management Act: Waste Act, No 59 of
2008), requiring Transnet to remove its waste material and
remediate the land. Transnet engaged external consultants to
perform risk assessments on identified areas of contamination
across the Company in order to draw appropriate responses and
mitigation plans.
EMPLOYEE FATALITIES HAVE DROPPED BY
MORE THAN 70% OVERTHE PAST SIX YEARS.
IMPROVEMENT IN DIFR FROM 0,82 IN 2011 TO 0,65.
SAFETY, HEALTH, ENVIRONMENT AND QUALITY
ENVIRONMENTAL DIVIDENDS

Ex
ec
uti
ve
sta
tem
en
t
452012 Integrated report 45
In accordance with the Group’s environmental policy and applicable legal requirements, environmental provisions of R1,8 billion (2011: R1,3 billion) for the remediation of soil contaminated areas have been raised in the annual financial statements. These include provisions for the removal and rehabilitation of contamination caused by asbestos, ferromanganese, manganese, mixed soil (including chrome and sulphur), fuel and rubble. The provision is for the estimated rehabilitation costs of the historical contamination and eventual decommissioning of Transnet assets. The provision has been computed by discounting future cash flows.
An amount of R788 million relating to the removal and rehabilitation of asbestos has been included in the overall environmental provision of R1,8 billion. Asbestos contamination has occurred due to historic spillages during the transportation of asbestos from mines and the historical use of asbestos products in buildings. A register of buildings containing asbestos is maintained by Transnet Property and reviewed annually to ensure that there is no exposure that has occurred that will create an obligation as required by legislation.
Quality management
The ISO 9001:2008 Quality Management System plays a crucial role in improving business processes and performance within Transnet and is an integrated part of the SHEQ management system.
There is significant improvement in the number of operations certified ISO 9001:2008 compliant. The customer centric approach, attention to detail and the refocused quality methodologies are the result of a dynamic mindset shift in Transnet towards embracing the quality management ethic and system. In certain operations, the quality management system have been in operation for more than four years. As part of continuous improvement the current quality management systems will be updated to meet the challenges of the MDS.
Climate change
As a first step in embedding a climate change response strategy into the Company, Transnet completed its carbon footprint study in 2011. Transnet accounted for 4,31mt C0
2 equivalent. This is approximately 1% of South
Africa’s total transport sector emissions and approximately 13% of South Africa’s total greenhouse gas (GHG) emissions in 2012.
Transnet’s indirect (Scope 2) carbon emissions (grid electricity usage) account for 85% of Transnet’s total emissions. Altogether, 75% of these Scope 2 emissions are accounted for by Freight Rail. Freight Rail is also the largest emitter of Transnet’s direct (Scope 1) emissions (largely diesel) and other indirect (Scope 3) emissions. More information is provided in the Sustainability Report 2012. Transnet has undertaken to participate in the Carbon Disclosure Project from 2013, where the Company’s carbon emissions data will be updated regularly for public information.
Sustainability
The Company has embedded sustainability into strategy and business practices by adopting a well-defined Sustainability Framework as part of the MDS, and establishing management capacity to plan, monitor and report on sustainability initiatives. Through the framework, the Company’s economic, social and
environmental dividends are tracked in a number of key performance areas and
aligned to the Shareholder mandate.
Refer to volume 3 for further details.
ENVIRONMENTAL DIVIDENDS
SOCIAL DIVIDENDS
ECONOMIC DIVIDENDS

Executive statement (continued)
46
Enterprise risk management Transnet Group Top 10 risks
1
Changes in the regulatory environment (ie economic, technical and compliance) – spending on capital investment based on assumptions that may be negatively impacted by subsequent changes in regulation.
2Inability to deliver on the capital investment plan due to the current capital and procurement operating methodology.
3
Inability to attract additional volumes, failure to align Transnet’s expansion plans with the customers’ plans, as the new capacity is created and to protect current volumes against new entrants, customer activism.
4Operational and business interruption due to safety and security incidents and natural disasters.
5Turmoil in the financial markets – loans being recalled, credit rating downgrade and systematic collapse of the financial system.
6 Security of energy supply uncertainty.
7Ineffective people management – talent attraction and skills development to operate the newly acquired assets.
8Inadequate ICT infrastructure and technological utilisation to enable the business.
9Counterparty risk – uncertainty of delivery by suppliers and customers.
10Environmental activism – increased pressure to be a sustainable organisation.
Priority I risk – Transnet Group Chief Executive and Board level
Priority II risk – Operating divisions’ Chief Executive’s level
Priority III risk – General Managers’ level
Priority IV risk – Managers’ level
Priority V risk – Employees’ level
Strategic residual risks heat map
Like
lihoo
d ra
ting
Consequence rating
E99%
D>50%
C>20%
B>1%
A<1%
7 6 5 4 3 2 1
12
34
5
6
8
10 9
7
The Company’s key risks are managed,
monitored and updated on a regular basis
so that timely and appropriate mitigating
plans are put in place as new risks
emerge. Transnet’s Enterprise Risk
Management (ERM) Framework aligns
with industry best practise,
King III and the global leading practice,
ISO 31000, 2009 Risk Management
Standard.
King III provides further clarity on the role
of the Board and that of other Governance
Committees for the management of risks.
Transnet has a well-established Board
Committee focusing on risk management.
The Risk Committee remains effective
and constantly challenges management to
ensure the ERM process is embedded
within the Company.
Transnet has a dynamic process to
manage, monitor and update the
Company’s risks, supported by dedicated
risk management information systems.
This enables the business to monitor the
changing risk profile and the strategic
and operational risks impacting the
Company’s growth objectives.
Mitigating actions in response to
identified risks have been incorporated
into the MDS.
The Company’s analysis of sustainability
trends, which includes policy
developments and responses to resource
constraints, as well as increased
consumption and ongoing skills
disparities, indicates both risks and
opportunities for the business. Transnet
also acknowledges the importance of
researching complex regulatory issues
and paying acute attention to legislative
detail to anticipate risks and
opportunities.

Ex
ec
uti
ve
sta
tem
en
t
472012 Integrated report
TRANSNET HAS INVESTED OVER
R160 MILLION IN ITS SOCIAL PROGRAMMES ACROSS SOUTH AFRICA.
Corporate social investment (CSI)Transnet has invested over R160 million (excluding capital
expenditure) in its social programmes across South Africa with approximately 76,3% of the budget disbursed during the year, focusing on healthcare, teacher education, sports development, container assistance programmes and employee volunteer programmes.
Whilst the Transnet Foundation remains the custodian of the Company’s CSI initiatives, the Operating divisions respond proactively to the needs of vulnerable communities surrounding their operations.
The Company’s flagship project, the Phelophepa Healthcare Train, traverses the country to provide various healthcare services including dentistry, optometry and counselling. It serves mainly rural communities, and in particular, rural learners whose schools are located along the Phelophepa route. It also mentors in excess of 900 medical students during its operation from January to September each year. Due to its success, a second Phelophepa train was commissioned during the year, effectively doubling the reach of this award-winning outreach service to create healthcare access for approximately 360 000 beneficiaries through its diverse onboard services and programmes.
The Rural and Farm Schools Sport Programme targets learners from 13 to 17 years of age in the poorest rural areas of the Free State, KwaZulu-Natal, Limpopo, North West, Northern Cape and Eastern Cape. Since its inception in 2001, more than 100 000 learners have benefited from the programme and approximately 3 000 teachers have been trained and accredited as coaches, umpires and referees. During the year, 5 000 learners participated in the programme, with 600 teachers being skilled as coaches, referees and umpires.
The Container Assistance Programme is an innovative way to address infrastructure challenges, with old and disused containers being refurbished to meet security and social infrastructure needs. Since the programme’s inception in 2001, R28 million has been invested in building 33 satellite police stations and community centres. 10 years on, the programme benefits 120 000 people annually.
Transnet recently launched two new programmes, namely the Teacher Development Programme and the Employee Volunteer Programme (EVP). The Teacher Development Programme is being implemented in KwaZulu-Natal, Mpumalanga and Limpopo. The EVP is already operating in Diepsloot in Gauteng, Motherwell in the Eastern Cape and Inanda in KwaZulu-Natal.
The Board of Trustees of the South African Football Association
(SAFA) Transnet School of Excellence successfully implemented
initiatives that resulted in the academic performance of
matriculants improving from a pass rate of 23,0% to 58,0%.Phelophepa health train serving the community.
Refer to volume 3 for further details.
SOCIAL DIVIDENDS

Executive statement (continued)
48
HIGHLIGHTS
The acquisition of
43 locomotives including
CSDP obligations of 65%;
The following key port handling
equipment transactions were
concluded during the year:
Seven tandem lift cranes, six
mobile harbour cranes,
28 straddle carriers, one
pneumatic ship un-loader,
one ship loader, 33 haulers and
eight reach stackers;
Total contract value since the
inception of the CSDP amounts
to R14,1 billion;
Total CSDP obligations
concluded to date amount to
R5,4 billion, 39% of total
contract value; and
Total CSDP obligations executed
by suppliers to date amount to
R3,0 billion, 55% of total supplier
development obligations.
Commitment to empowerment and transformationTransnet fully supports South Africa’s growth aspirations, as set
out in different Government policies, and is actively contributing to catalysing growth. While the Company is resolutely focused on improving South Africa’s transport infrastructure through its aggressive capital investment plan, it is also leveraging this spend to transform and grow the local economy and industrial base.
Transnet’s commitment to transformation is coordinated through its Supplier Development Programme, with three key facets: the Competitive Supplier Development Programme (CSDP), Enterprise Development (ED) and broad-based black economic empowerment (B-BBEE).
Supplier Development Programme and B-BBEETransnet undertakes all its procurement activities in a manner that protects and advances persons, or categories of persons, who have been disadvantaged by past discrimination and ensures that procurement activities are fair, equitable, transparent, competitive and cost-effective.
Transnet’s procurement activities contribute directly to the economic transformation of South Africa and as such have the ability to decrease income inequalities and significantly increase the numbers of previously disadvantaged individuals who manage, own and control businesses.
In addition, Transnet’s total recognised B-BBEE spend per the Department of Trade and Industry (DTI) Codes is R25,8 billion or
80,0% (2011: R19,4 billion or 75,0%), of total measurable
procurement spend of R32,2 billion (2011: R25,8 billion).
The DTI Codes of Good Practice classifies recognised B-BBEE spend in the following categories:
Competitive Supplier Development Programme (CSDP)The CSDP focuses on skills development, job creation and preservation and the localisation of suppliers and original equipment manufacturers (OEMs) through contractually obligated supplier development plans.
Numerous transactions were concluded during the year with the focus shifting from rolling stock to port handling equipment. Highlights are noted alongside.
STRATEGIC ENABLERS
SOCIAL DIVIDENDS

Ex
ec
uti
ve
sta
tem
en
t
492012 Integrated report
Students at the National Port Authority's School of Ports in Durban.

Executive statement (continued)
50
Economic regulationTwo of our Operating divisions, Pipelines and National Ports Authority are regulated by the National Energy Regulator of South Africa and the Ports Regulator respectively. With approximately 20,7% of Transnet’s revenue and 38,4% of its EBITDA impacted by economic regulation, unless the relationships with regulators are managed proactively and strategically, their decisions could have a significant impact on investment decisions, investor confidence and ultimately on the execution of the Company’s strategy.
Transnet believes that understanding regulatory issues in extreme detail is a prerequisite not only for anticipating risks and opportunities but also for building mutually beneficial relationships, based on trust and transparency, with the economic regulators.
The potential for making unfair adverse decisions in determining and setting tariffs that may negatively impact the future sustainability of the Company remains a key risk for Transnet given the capacity constraints faced by economic regulators, and limited recourse by the regulated entities in the absence of an appeal mechanism. Credible appeal mechanisms need to be put in place and attention needs to be paid to monitoring the performance and decision of regulators in line with international best practice and benchmarks.
Nersa’s set tariffs for 2012 will allow Transnet Pipelines to increase its basic allowable revenue by 20,0%. We also welcome Nersa’s draft decision, approving Transnet Pipelines’ gas transmission tariffs as requested. The tariff awards from the energy regulator reflect the maturity and stability of our relationship, which is enhanced by improving levels of regulatory certainty.
The 2012/13 National Ports Authority tariff application was submitted to the Ports Regulator on 29 July 2011, requesting a tariff increase of 18,06%. On 13 March 2012, the Ports Regulator announced its decision to increase the tariffs of National Ports Authority by 2,76%. The increase was determined after taking into account the R1,0 billion rebate to incentivise the export of value added goods from South Africa. Transnet and the Ports Regulator have agreed to have a tariff methodology in place by 30 June 2013.
In response to the Department of Transport’s (DoT) initial Rail Reform Green Paper, the DPE developed Phase 1 of its position paper on Rail Reform for South Africa in February 2012. The position paper entailed the development of rail reform models and high-level financial verifications of the recommended models. The DPE presented its position paper to Transnet and the Company will continue to monitor developments in this regard.
Regulatory reform
We continue to engage with different levels of Government with regards to the National Environmental Management: Integrated Coastal Management Act (the Act). The Act had the unintended effect of appropriating approximately R46 billion of National Ports Authority port assets (breakwaters, turning basins, entrance channels and quay walls) into State ownership under the Department of Environmental Affairs (DEA). This posed a threat to Transnet's financial position, the capital investment programme and loan
agreements. However, the sections of the Act that are problematic have not been
enacted. Consequently, the risk has been mitigated in the short term.
The engagements between Transnet and the Department of Public Enterprises are
aimed at ensuring that the appropriate amendments to the Ports Act are effected as it
relates to the corporatisation of the National Ports Authority.
Refer to Volume 2 for further details.
REGULATORY

Ex
ec
uti
ve
sta
tem
en
t
512012 Integrated report
The potential corporatisation of National Ports Authority poses significant risks to Transnet, as it could have a
material adverse impact on the Company, both financially and strategically, and could trigger default clauses in
some of Transnet’s funding agreements. However, the current undertaking from Government mitigates this risk.
The Cabinet of the Republic of South Africa decided on 09 November 2011, to direct National Ports Authority
to license Port Terminals to operate the Port of Ngqura for a limited period of three years, subject to the
National Ports Authority beginning a competitive process for the licensing of the Port of Ngqura in accordance
with section 56 of the Act.
The Minister of Transport gave effect to the Cabinet decision by issuing a section 79 Directive for three years
to National Ports Authority, in correspondence dated 27 January 2012. The section 79 Directive is an interim
measure, provided to address the current exceptional circumstances and to allow National Ports Authority, as
required by section 56 of the Act to follow the required 'fair, equitable, transparent, competitive and cost-
effective' process within the three-year window, and for the appointed terminal operator to be ready to
commence operations at the end of the three year period.
Regional integration
The Company plans to create a significant footprint on the continent, which will eventually lead to regional
integration and lower transport costs.
To date, Transnet has provided technical and commercial advisory services relating to locomotives, wagons
and coaches to several countries, including Tanzania, Mozambique, Angola, Benin and the Democratic Republic
of Congo.
In addition to the provision of products and services, the Company participates in various forums intended to
shape the African agenda. These include the Programme for Infrastructure Development in Africa and the
North South Corridor, which is championed by His Excellency, President JG Zuma. Transnet has supported, and
will continue to support, these initiatives through training, technical advice and supply of rail equipment and
engineering services, coupled with port technical advisory services.
Reputation management and corporate accountabilityTransnet’s reputation has been seriously compromised in recent years, with key stakeholders losing confidence
in the Company’s ability to align commercial needs with developmental imperatives. Accordingly, much
emphasis was placed on remedying the sources of reputational risk during the year, as well as rebuilding the
Company’s image, both internally, and with external stakeholders.
The appointment of the new Board in the previous year, together with the Executive team, has contributed to
the positive results for the year and has enforced the Company’s solid financial and operational foundation as
well as socio-economic contributions. This foundation has been further enhanced by the alignment, support and
improved relationship with Government departments and, in particular, the DPE. The Board believes that this
collaboration has resulted in an improved reputation for Transnet, both internally and externally, which in turn
has fostered an environment in which employees can thrive.
The Company completed a thorough analysis of key stakeholder expectations, linked to its stakeholder
expectations. Broadly, the study revealed that Transnet should establish clearer relevance of sustainability
projects within the communities in which it operates and improve engagement of the Company’s sustainability
commitment and outcomes.
Following the study, the Company embarked on a comprehensive community engagement programme in
association with the DPE. The programme entailed visiting most of the provinces affected by Transnet’s
operations to align the Company’s commercial needs with their developmental requirements.
Going forward, Transnet is committed to the regular monitoring of key stakeholder perceptions to ensure that
its interventions meet their needs, and to address negative sentiment before it leads to reputational damage.
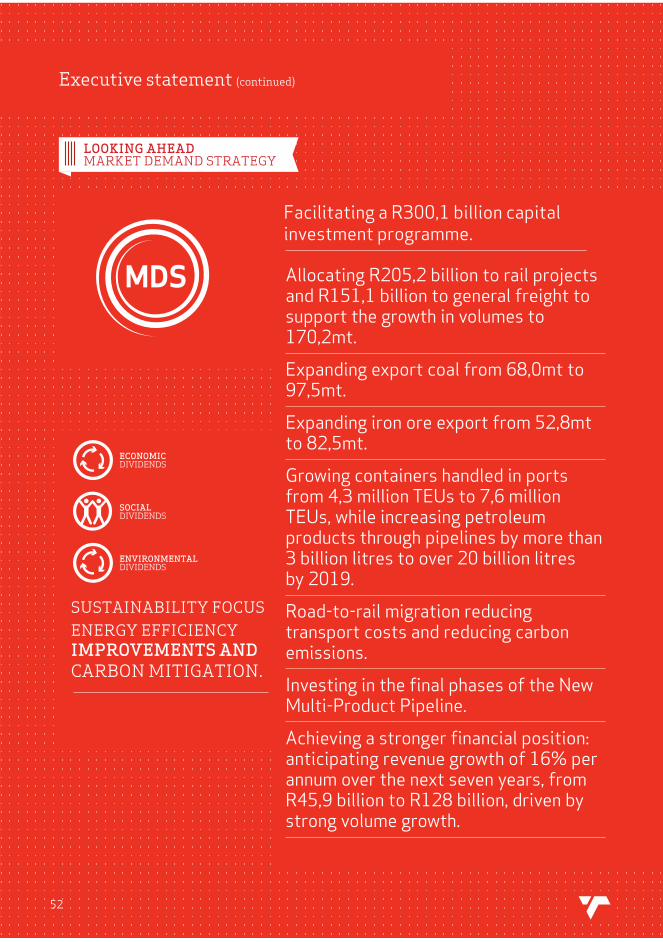
52
Facilitating a R300,1 billion capital investment programme.
ENERGY EFFICIENCYSUSTAINABILITY FOCUS
IMPROVEMENTS ANDCARBON MITIGATION.
LOOKING AHEADMARKET DEMAND STRATEGY
Allocating R205,2 billion to rail projects and R151,1 billion to general freight to support the growth in volumes to 170,2mt.
Expanding export coal from 68,0mt to 97,5mt.
Expanding iron ore export from 52,8mt to 82,5mt.
Growing containers handled in ports from 4,3 million TEUs to 7,6 million TEUs, while increasing petroleum products through pipelines by more than 3 billion litres to over 20 billion litres by 2019.
Road-to-rail migration reducing transport costs and reducing carbon emissions.
Investing in the final phases of the New Multi-Product Pipeline.
Achieving a stronger financial position: anticipating revenue growth of 16% per annum over the next seven years, from R45,9 billion to R128 billion, driven by strong volume growth.
ENVIRONMENTAL DIVIDENDS
ECONOMIC DIVIDENDS
SOCIAL DIVIDENDS
Executive statement (continued)
52

Ex
ec
uti
ve
sta
tem
en
t
532012 Integrated report
More than tripling EBITDA – Transnet’s key measure of
profitability – to R68 billion by 2019.
Generating R213,6 billion of the required funding from operating
cash flows.
Raising R86,5 billion of the required funding from debt capital
markets.
Maintaining gearing and cash interest cover within target levels
of 50% and greater than three times respectively.
Achieving significant productivity and efficiency improvements
in rail and port operations.
Increasing growth of the local industry through programmatic
procurement – approximately 50% of the R78 billion set aside
for locomotives will be spent on local suppliers.
Having Transnet’s employee headcount peak at 74 000 in 2019.
The total number of jobs to be created via MDS will peak at
approximately 220 000. This includes direct, indirect and
economy-wide jobs.
Enhancing skills development: R7,7 billion will be spent on
training by 2019, including R4,7 billion on bursaries and grants.
2012 Integrated report 53

Executive statement (continued)
54
A notable outcome of the seismic changes impacting global
economies in recent years, particularly emerging economies, has
been the rise of SOCs as strategic engines for enabling economic
growth. SOCs account for a substantial share of investment and
industrial output in many developing nations, contributing an
average of 7% to 15% of these countries’ gross domestic
product (GDP). SOCs are custodians of national assets and
resources, providing secure and affordable access to products
and services of high social benefit, and driving capital formation
through large-scale, long-term infrastructure investment to lay
the groundwork for further investment.
Transnet’s complex mandate balances commercial and
developmental objectives and requires prudent planning and
bold action in an increasingly volatile economic environment.
Accordingly, the Company has adopted the new MDS, which was
approved by the Board and is applicable from 1 April 2012
onwards, to ensure that Transnet serves as a proactive enabler
of economic growth.
The announcement of Transnet’s MDS by His Excellency,
President JG Zuma, in his State of the Nation Address on
9 February 2012, placed the Company at the centre of
Government’s drive to boost future economic growth and job
creation through infrastructure development.
The MDS is also a key component in enabling the aspirations of
the NGP.
Transnet’s strategic evolution since 2005 has seen the Company
systematically gear-up for growth. The Company stabilised its
financial foundation, maintaining, its self-funding ability without
Government guarantees by re-igniting investment, strengthening
governance and disposing of non-core assets; then the
operational base was stabilised by establishing a sound funding
strategy, eliminating backlog maintenance and consistently
achieving strong financial results. The MDS will see the Company
meet market demand through a strong investment focus and
accelerated economic transformation, ultimately poising
Transnet, and the country, for sustainable growth.
The new strategy harnesses Transnet’s strengthened financial
position to exploit strong regional growth prospects and to meet
the significant unsatisfied customer demand for its services,
especially for rail.
Underpinning the MDS is a commitment to sustainability in
everything we do, to ensure that we indeed create lasting
economic, social and environmental value for the present and
future generations.
MARKET DEMAND STRATEGY OVERVIEW
R300,1 BILLIONON CAPITAL INVESTMENTS.
220 000ADDITIONAL JOBS ACROSS
THE ECONOMY.
HUMAN CAPITAL
CAPITAL INVESTMENT

Integrated Report 2012 55
Ex
ec
uti
ve
sta
tem
en
t
2012 Integrated report 55
SKILLS DEVELOPMENT AND
ENERGY EFFICIENCY.
Furthermore, the Company is cognisant of the need to grow the
economy in a sustainable manner, ensuring that natural
resources are protected and that South Africa becomes
exemplary in renewable forms of energy, water conservation and
waste recycling.
Notwithstanding the successful financial turnaround of the
Company, and improved investment performance in recent years,
the lack of sufficient rail capacity has meant that economic
growth has been constrained, particularly in respect of the
demand for the transportation of mining products.
The shortfall in capacity needed to satisfy demand has had a
negative impact on South Africa in terms of economic
performance, investment and job creation as well as the cost
of business.
Currently, validated demand for rail services exceeds supply by
approximately 50mt per annum.
Transnet has, moreover, achieved a declining return on equity
since 2007 due to capital investments over the last few years
focusing largely on sustaining existing revenue streams and
reducing maintenance backlog, with limited expansionary
investments.
Through the MDS, Transnet will satisfy validated demand by
accelerating investment in freight logistics capacity and will
support the reliable, efficient and cost-effective movement of
bulk and manufactured goods.
This, in turn, will stimulate a significant increase in freight
volumes and encourage a considerable modal shift from
road-to-rail, reducing costs and carbon emissions. This will
increase Transnet’s energy demand, providing an incentive to
improve efficiency and explore innovation.
The successful implementation of the MDS will radically alter
Transnet’s organisational make-up. With its headcount set to
increase by 25% over the next seven years, the Company will, in
present day terms, become one of the largest employers in
South Africa. Transnet will also become one of the top five global
freight railways and one of the top five companies in South
Africa in terms of revenue.
Rail validated demand — Rail planned volumes
2013 2014 2015 2016 2017 2018 2019
mt
400
350
300
250
200
150
100
50
0
ECONOMIC DIVIDENDS
SOCIAL DIVIDENDS
ENVIRONMENTAL DIVIDENDS

Executive statement (continued)
56
FOUR-POINT TURNAROUND STRATEGY
QUANTUM LEAP AND GROWTH STRATEGY
MARKET DEMAND STRATEGY
FINANCIAL STABILITY OPERATIONAL STABILITY GROWTH
Laying foundations for operational
performance through investment
and efficiency improvements.
Robust governance and supporting
environment.
Disposal of non-core assets.
Reignite investment following
period of underinvestment.
Strong financial results.
Focused investment to eliminate
backlog, especially on asset
replacement; investment lagging
volume growth.
Operational stability.
Effective cost control and reduction
of cost base.
Integrated commercial management.
Strategic asset/liability
management.
Sound funding strategy.
Continued financial performance.
Investment focused on expanding
capacity to meet market demand
and to support SA economic growth.
Capture operational efficiencies.
Expand funding sources.
Accelerate SA’s economic
transformation by support of
the NGP.
2005 – 2007
2008 – 2012
2013 – 2019
The MDS as economic stimulusTransnet will spend R300,1 billion on capital projects over a seven-year period and will create up to 220 000
new job opportunities across the economy through the MDS.
The economic stimulus will be further amplified through a more developmental approach to procurement, skills
development and energy efficiency. However, this effort is currently hampered by the lack of sophistication of
Transnet’s measuring and reporting systems, especially for non-financial data. Sustainability performance
monitoring, for instance, is therefore receiving increased attention.
The MDS has been subdivided into the following eight focus areas based on the Company’s commercial needs
and South Africa’s broad macro economic and developmental objectives:
1. Optimising capital investments and growing the asset base;
2. Growing volumes and market share;
3. Improving operational efficiencies;
4. Secure funding and continued financial strength;
5. Prioritising SHEQ, sustainability and risk;
6. Meeting complementary objectives of the NGP through job creation and skills development;
7. Creating regulatory certainty; and
8. Promoting strategic enablers, governance and creating a high performance culture.
LOOKING AHEAD
Integrated Report 2012 57
Ex
ec
uti
ve
sta
tem
en
t
2012 Integrated report 57
Transnet will continue to invest significant resources in
recruitment, development, deployment and retention of key
operational, technical and managerial skills to facilitate growth.
All these interventions will be balanced with the need to
contain costs.
The MDS is a key contributor to South Africa’s growth and
sustainability priorities and aims to deliver lasting economic,
social and environmental value to society. Transnet has,
therefore, embedded sustainability as a foundational component
of the MDS, building measurable indicators of the Company’s
economic, social and environmental dividends into its
performance monitoring and reporting as further elaborated in
volume 3.
Refer to volume 3 for further details.
ECONOMIC DIVIDENDS
SOCIAL DIVIDENDS
ENVIRONMENTAL DIVIDENDS
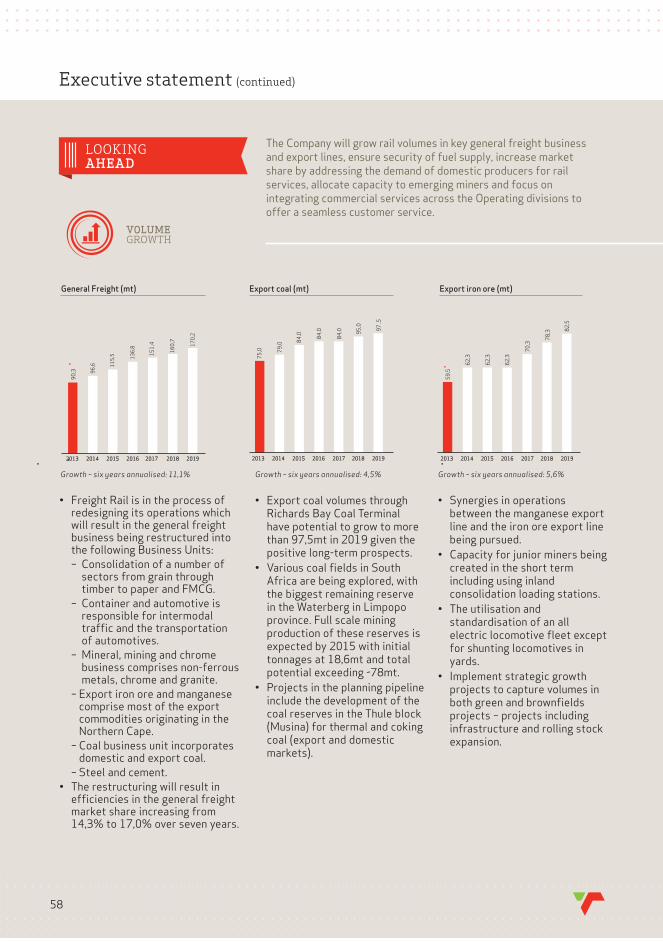
Executive statement (continued)
58
VOLUME GROWTH
LOOKING AHEAD
Richards Bay Coal Terminal have potential to grow to more than 97,5mt in 2019 given the positive long-term prospects.
Africa are being explored, with the biggest remaining reserve in the Waterberg in Limpopo province. Full scale mining production of these reserves is expected by 2015 with initial tonnages at 18,6mt and total potential exceeding ~78mt.
include the development of the coal reserves in the Thule block (Musina) for thermal and coking coal (export and domestic markets).
between the manganese export line and the iron ore export line being pursued.
created in the short term including using inland consolidation loading stations.
standardisation of an all electric locomotive fleet except for shunting locomotives in yards.
projects to capture volumes in both green and brownfields projects – projects including infrastructure and rolling stock expansion.
redesigning its operations which will result in the general freight business being restructured into the following Business Units:
– Consolidation of a number of sectors from grain through timber to paper and FMCG.
– Container and automotive is responsible for intermodal traffic and the transportation of automotives.
– Mineral, mining and chrome business comprises non-ferrous metals, chrome and granite.
– Export iron ore and manganese comprise most of the export commodities originating in the Northern Cape.
– Coal business unit incorporates domestic and export coal.
– Steel and cement.
efficiencies in the general freight market share increasing from 14,3% to 17,0% over seven years.
Export coal (mt) Export iron ore (mt)General Freight (mt)
75
,0 79
,0
84
,0
84
,0
84
,0 95
,0
97
,5
2015 2016 201720142013 2018 2019
Growth – six years annualised: 4,5%
59
,5
62
,3
62
,3
62
,3
70
,3
78
,3 82
,5
2015 2016 201720142013 2018 2019
Growth – six years annualised: 5,6%
90
,3 96
,6 11
5,5 13
6,8
15
1,4
16
0,7
17
0,2
2015 2016 201720142013 2018 2019
Growth – six years annualised: 11,1%
The Company will grow rail volumes in key general freight business
and export lines, ensure security of fuel supply, increase market
share by addressing the demand of domestic producers for rail
services, allocate capacity to emerging miners and focus on
integrating commercial services across the Operating divisions to
offer a seamless customer service.

Integrated Report 2012 59
Ex
ec
uti
ve
sta
tem
en
t
2012 Integrated report 59
72
1 9
29
2019
demand until 2019.
forecast to grow by 7,3% per annum for the next five years.
increased over the next seven years to 9,4 million TEUs per annum, ensuring that capacity remains ahead of demand.
underway in Durban Container Terminal, Ngqura Container Terminal and Cape Town Container Terminal.
1,2 million vehicle production by 2020.
bolstered by strong employment growth, rising incomes and declining interest rates in emerging markets.
by ~7%, supported by low interest rates and pent up demand due to delayed vehicle replacement by owners during the recent economic downturn (NAAMSA).
by a 1 000 bays to accommodate the diverted container volumes resulting from the Durban Container Terminal Pier 2 project.
industry established to improve automotive logistics performance.
being finalised.
Growth – six years annualised: 8,0% Growth – six years annualised: 2,8%
Automotives through ports (units)Containers through ports (000 TEUs)
5 2
50
6 0
87
4 8
21 5
57
6
6 5
30 7 0
94 7 6
46
2015 2016 201720142013 2018 2019
60
9 1
34
62
7 3
23
66
9 9
83
68
9 0
75
70
3 6
21
2014 20172013 20162015 2018
60
9 6
18
area consumes about 17 billion litres of refined products per annum with Pipelines market share of ~72%.
based on GDP less 1,0%.
longer constrained.
Growth – six years annualised: 2,0%
Petroleum products through Pipelines
(million l)
18
02
1
18
32
7
18
48
6
18
94
2
19
34
2
19
69
1
20
18
0
2015 2016 201720142013 2018 2019
In the allocation of rail and port capacity for commodities focused on coal, iron and manganese, we have
recognised and firmly believe that creation and allocation of capacity for new entrants in these specific
industries is necessary. This strategy is to ensure that companies which are valid holders of mining rights can be
translated into economic value by providing rail and/or port capacity. An allocation process has been developed
to ensure that it focuses on a governance process that is fair, equitable and transparent and strategically
supports companies that are new entrants and are B-BBEE compliant.

60
Executive statement (continued)
LOOKING AHEAD
Capital projects associated with the Market Demand StrategyTransnet’s mandate is to enable economic growth in South Africa
and as such the Company is committed to providing infrastructure capacity to fulfil its objectives. Consequently, Transnet has committed to invest R300,1 billion over the next seven years to upgrade existing (42%) and create new infrastructure capacity (58%) in rail, port and pipeline networks. This is in addition to R115,5 billion invested in infrastructure over the past seven years.
Specific growth areas will be export coal, export iron ore, and general freight volumes (domestic iron ore, domestic coal, manganese and facilitating Eskom’s road-to-rail migration). Containers (Ngqura, Cape Town and Durban) and bulk (Saldanha and Richards Bay) remain a key growth area in the port sector.
These plans are aligned to the objectives of the New Growth Path which include:
Optimising capital investments and improving the asset base, growing volumes and market share, enabling regional development, improving operational efficiencies, skills development, youth employment and efficient energy consumption.
Some of the key projects that Transnet will embark on over the next seven years include:
Acquisition of more than 1200 locomotives for Freight Rail. 1 064 locomotives are planned to be deployed in GFB. In addition, about 19 400 wagons are planned to be acquired for GFB over the next seven years to facilitate a GFB ramp-up in volumes from 81,0mt to 170,2mt.
Investment in the manganese export channel through the Port of Ngqura will increase manganese export capacity to 16,0mt.
Development of the Swaziland rail link is expected to cost R5 billion. The line will provide additional capacity to the ports of Richards Bay and Maputo. This initiative is a strategic investment and aligned to Government’s SADC objectives and NGP objective of regional integration.
The Waterberg region in Limpopo contains about 40% of SA’s remaining coal reserves and development of this area will enable Transnet to capitalise on the export and domestic consumption opportunities that the region presents. An amount of R5,1 billion is expected to be invested in this project over the next seven years.
The deepening of container berths at the Durban Container Terminal (DCT), in conjunction with the acquisition of a container handling fleet to enable the berthing of new generation deeper draft container vessels, will create an additional 400 000 TEUs of capacity. Expansion of Pier 1 into Salisbury Island will result in an additional 1,1 million TEUs of container capacity being created. The expansion will entail the deepening of the Pier 1 berths, the acquisition of 8,6 hectares of Salisbury Island, quay wall construction and the acquisition of container handling
equipment.
Seven-year divisional split (R billion)
Freight Rail 201,0
National Ports Authority 46,9
Port Terminals 32,9
Pipelines 11,3
Rail Engineering 3,8
Other 4,2
Seven-year commodity split (R billion)
GFB 151,1
Export coal 32,0
Export iron ore 25,2
Containers (Ports) 24,1
Piped products 9,4
Break bulk 2,9
Bulk 25,5
Other 29,9Seven-year capital investment plan by asset type (R billion)
Land, building and structure 16,5
Pipeline 9,4
Port facilities 66,3
Machinery and equipment 11,8
Perway 71,1
Locomotives 77,8
Other 47,2
2013 CAPITAL INVESTMENT.
SEVEN-YEAR CAPITAL INVESTMENT*.
R300,1 BILLION
R31,2 BILLION
* Amounts shown are before capitalised borrowing costs, interdivisional eliminations and PSP initiatives
CAPITALINVESTMENT
ECONOMICDIVIDENDS
649_TN_AR2012_Sec 2.indd 60 2012/06/14 8:21 PM
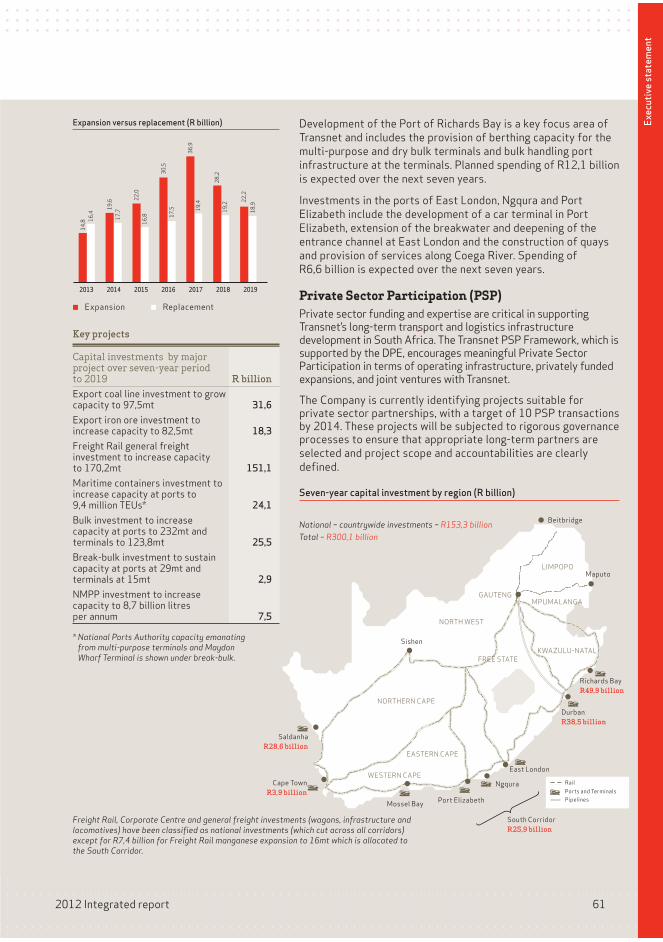
Integrated Report 2012 61
Ex
ec
uti
ve
sta
tem
en
t
2012 Integrated report 61
Development of the Port of Richards Bay is a key focus area of
Transnet and includes the provision of berthing capacity for the
multi-purpose and dry bulk terminals and bulk handling port
infrastructure at the terminals. Planned spending of R12,1 billion
is expected over the next seven years.
Investments in the ports of East London, Ngqura and Port
Elizabeth include the development of a car terminal in Port
Elizabeth, extension of the breakwater and deepening of the
entrance channel at East London and the construction of quays
and provision of services along Coega River. Spending of
R6,6 billion is expected over the next seven years.
Private Sector Participation (PSP)Private sector funding and expertise are critical in supporting Transnet’s long-term transport and logistics infrastructure development in South Africa. The Transnet PSP Framework, which is supported by the DPE, encourages meaningful Private Sector Participation in terms of operating infrastructure, privately funded expansions, and joint ventures with Transnet.
The Company is currently identifying projects suitable for private sector partnerships, with a target of 10 PSP transactions by 2014. These projects will be subjected to rigorous governance processes to ensure that appropriate long-term partners are
selected and project scope and accountabilities are clearly
defined.
Durban
R38,5 billion
Cape Town
R3,9 billion
Saldanha
R28,6 billion
East London
South Corridor
R25,9 billion
Port ElizabethMossel Bay
Ngqura
Seven-year capital investment by region (R billion)
2019
18
,9
22
,2
Key projects
Capital investments by major project over seven-year period to 2019 R billionExport coal line investment to grow capacity to 97,5mt 31,6
Export iron ore investment to increase capacity to 82,5mt 18,3
Freight Rail general freight investment to increase capacity to 170,2mt 151,1
Maritime containers investment to increase capacity at ports to 9,4 million TEUs* 24,1
Bulk investment to increase capacity at ports to 232mt and terminals to 123,8mt 25,5
Break-bulk investment to sustain capacity at ports at 29mt and terminals at 15mt 2,9
NMPP investment to increase capacity to 8,7 billion litres per annum 7,5
2013 2014 2015 2016 2017 2018
16
,4
14
,8 16
,8
22
,0
19
,2
28
,2
17
,7
19
,6
19
,4
36
,9
17
,5
30
,5
Expansion Replacement
Expansion versus replacement (R billion)
National – countrywide investments – R153,3 billion Total – R300,1 billion
Freight Rail, Corporate Centre and general freight investments (wagons, infrastructure and locomotives) have been classified as national investments (which cut across all corridors) except for R7,4 billion for Freight Rail manganese expansion to 16mt which is allocated to the South Corridor.
* National Ports Authority capacity emanating from multi-purpose terminals and Maydon Wharf Terminal is shown under break-bulk.
Richards Bay
R49,9 billion
Maputo
Beitbridge
Sishen
NORTH WEST
NORTHERN CAPE
EASTERN CAPE
WESTERN CAPE
GAUTENG
LIMPOPO
MPUMALANGA
KWAZULU-NATAL
FREE STATE
Rail
Ports and Terminals
Pipelines
649_TN_AR2012_Sec 2.indd 61 2012/06/14 8:20 PM
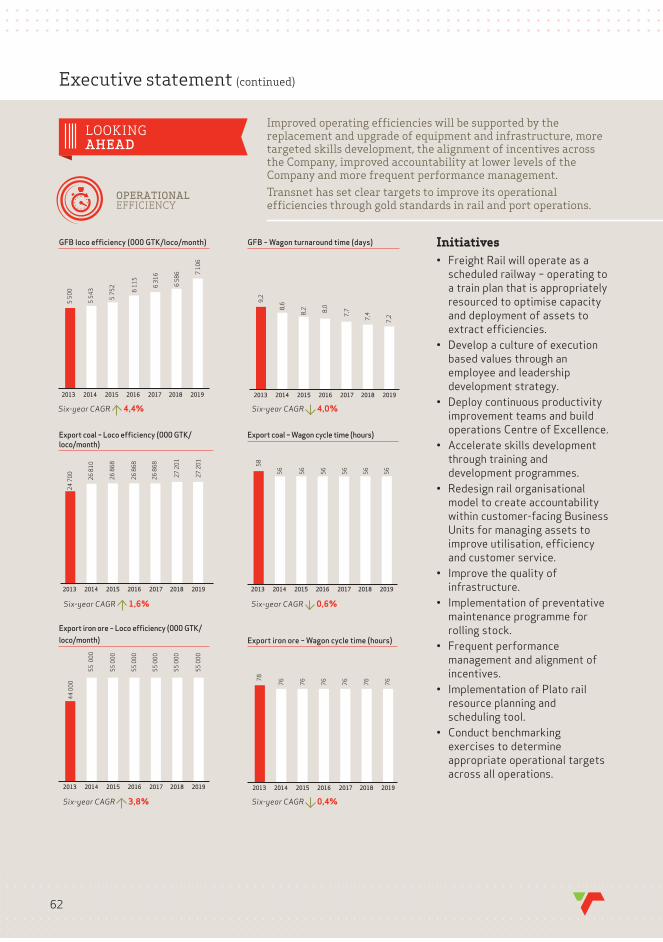
Executive statement (continued)
62
OPERATIONAL EFFICIENCY
LOOKING AHEAD
Initiatives
scheduled railway – operating to
a train plan that is appropriately
resourced to optimise capacity
and deployment of assets to
extract efficiencies.
based values through an
employee and leadership
development strategy.
improvement teams and build
operations Centre of Excellence.
through training and
development programmes.
model to create accountability
within customer-facing Business
Units for managing assets to
improve utilisation, efficiency
and customer service.
infrastructure.
maintenance programme for
rolling stock.
management and alignment of
incentives.
resource planning and
scheduling tool.
exercises to determine
appropriate operational targets
across all operations.
GFB – Wagon turnaround time (days)GFB loco efficiency (000 GTK/loco/month)
6 3
16
6 1
15
6 5
86
5 5
43
5 5
00
7 1
06
5 7
52
2015 2016 201720142013 2018 2019
Six-year CAGR 4,4%
2015 2016 201720142013 2018 2019
8,0
9,2
8,6
7,7
7,4
7,2
8,2
Six-year CAGR 4,0%
Export coal – Loco efficiency (000 GTK/
loco/month)
26
81
0
24
70
0
26
86
8
26
86
8
27
20
1
27
20
1
26
86
8
2015 2016 201720142013 2018 2019
Export coal – Wagon cycle time (hours)
Six-year CAGR 1,6%
56
58
56
56
56
56
56
2015 2016 201720142013 2018 2019
Six-year CAGR 0,6%
Export iron ore – Loco efficiency (000 GTK/
loco/month)
55
00
0
44
00
0
55
00
0
55
00
0
55
00
0
55
00
0
55
00
0
2015 2016 201720142013 2018 2019
Six-year CAGR 3,8%
Export iron ore – Wagon cycle time (hours)
767
8
76
76
76
76
76
2015 2016 201720142013 2018 2019
Six-year CAGR 0,4%
Improved operating efficiencies will be supported by the replacement and upgrade of equipment and infrastructure, more targeted skills development, the alignment of incentives across the Company, improved accountability at lower levels of the Company and more frequent performance management. Transnet has set clear targets to improve its operational efficiencies through gold standards in rail and port operations.

Integrated Report 2012 63
Ex
ec
uti
ve
sta
tem
en
t
2012 Integrated report 63
Initiatives
through training and
development programmes
(people transformation
project).
operational efficiencies and
create transparency.
replacement and maintenance
programme.
focusing on marine operation
issues, ie delays (tugs, pilots,
berthing staff); anchorage
time; vessel movements; and
availability of critical
maritime resources.
for each vessel that calls in
South Africa so that targets
can be developed accurately
per berth and the type of
vessel.
against licence conditions.
management and alignment of
incentives.
exercises to determine
appropriate operational
targets across all operations.
Moves per gross crane hour (GCH) – DCT Pier 1
30
30
30
30
30 3
2
30
2015 2016 201720142013 2018 2019
Six-year CAGR 1,1 %
Moves per gross crane hour (GCH) – DCT Pier 2
30
28
35
33
35
35
32
2015 2016 201720142013 2018 2019
Six-year CAGR 3,8%
Moves per gross crane hour (GCH) – Ngqura
Six-year CAGR 0%
2015 2016 201720142013 2018 2019
32
32
32
32 32
32
32
Moves per gross crane hour (GCH) – Cape Town
Six-year CAGR 0%
2015 2016 201720142013 2018 2019
32
32
32
32
32
32
32
Six-year CAGR 2,5% Shipping delays – Tugs Shipping delays – Pilot
Shipping delays
1,2
1,7
0,7
0,7
0,7
0,7
0,9
0,5
0,5
0,5
0,5
0,8
0,6
0,5
2015 2016 201720142013 2018 2019
Tugs – six-year CAGR 13,7%
Pilot – six-year CAGR 7,5%
40 4
1 43 4
4
44
44 44
2014 20172013 20162015 2018 2019
TEUs/ship turnaround time – Durban
Freight Rail will operate as a scheduled railway – operating to a train plan that is appropriately resourced to optimise capacity and deployment of assets to extract efficiencies. The Company will continue to focus on improving operational efficiencies and a safe working environment through the implementation of Lean
Six Sigma principles, safety and environmental initiatives.In the year ahead, partnerships with original equipment manufacturers (OEMs) will be strengthened with the aim of enhancing existing skills and know-how and creating new market opportunities.

Executive statement (continued)
64
Foundational to the financial strategy is the Company’s ability to maintain its strong financial position and to ensure long-term financial sustainability. The key metrics and related targets for the next seven years are detailed below.
LOOKING AHEAD
Target: > 3,0 times4
,8
Cash interest cover (times)
3,6
3,5
3,8
4,2 4,3 4,3
2014 20172013 20162015 2018 2019
Target: < 50%
Gearing# (%)
46
,0 47
,3
47
,0
46
,1
45
,3
42
,2
37
,0
2014 20172013 20162015 2018 2019
# Including Port Regulator’s clawback
*Current post-tax WACC: 12,2%2014 20172013 20162015 2018 2019
Return on average total assets (%)*
8,5
9,9
11
,5
13
,4
13
,3
13
,0
13
,3
FINANCIAL SUSTAINABILITY
ECONOMIC DIVIDENDS

Integrated Report 2012 65
Ex
ec
uti
ve
sta
tem
en
t
2012 Integrated report 65
Efficiency improvements and cost-containment initiatives will result in operating expense increases being contained to an average of 12% per year, despite aggressive volume growth and higher than CPI increases on energy costs.
Net operating expenses by cost element in 2013 (R billion)
Other operating expenses 7,1
Electricity 3,3
Fuel 2,3
Personnel 18,7
Net operating expenses (R billion)
33
,1
31
,4
45
,9
40
,3
53
,7
59
,3
37
,4
2015 2016 201720142013 2018 2019
53
,6
2019
Growth in EBITDA is largely due to volume increases.
EBITDA margin (%)
41
,8 48
,2
50
,9 54
,9
54
,9
53
,3
2014 20172013 20162015 2018
EBITDA (R billion)
30
,8
22
,5
55
,8
49
,0
61
,4 68
,5
38
,8
The reduction in the cost structures over the past two years resulted in a lower cost base going forward.
EBITDA growth for seven years annualised: 19,2%
2015 2016 201720142013 2018 2019
Revenue (R billion)
2015 2016 201720142013 2018 2019
63
,9
53
,9
10
1,6
89
,3
11
5,1
12
7,7
76
,2

Executive statement (continued)
66
Funding PlanThe objective of the Funding Plan is to ensure that the Company has sufficient liquidity to meet all its requirements, without breaching the key financial ratios. It is developed to support the Company’s increased capital expenditure in an environment of financial market volatility, unprecedented ratings action across sectors and countries and heightened risk aversion by investors and lenders alike.
Over the next seven years the anticipated funding requirements amount to R86,5 billion and R82,1 billion over the next five years.
Cash flows from investing activities (R billion) Funding requirement (R billion)
Cash flow from operating activities (R billion) Loan redemptions (R billion)
18
,5
23
,9 27
,4
34
,6
40
,8 43
,9
49
,3
(1,5
)
(2 ,2
)
(3,9
)
(7 ,1
)
(1,0
)
(8 ,0
)
(1,1
)
2014 20172013 20162015 2018 2019
2014 20172013 20162015 2018 2019
2014 20172013 20162015 2018 2019
2014 20172013 20162015 2018 2019
(31
,2)
(37
,3)
(38
,8)
(48
,0)
(56
,3)
(47
,4) (4
1,1
) (14
,1)
(15
,6)
(15
,4)
(20
,5)
(16
,5)
(11
,5)
7,1
LOOKING AHEAD
FINANCIAL SUSTAINABILITY

Integrated Report 2012 67
Ex
ec
uti
ve
sta
tem
en
t
2012 Integrated report 67
Funding strategies and sources of funding Transnet will continue to implement its pre-funding strategy, devised during the global credit crisis, to raise
funding cost-effectively from multiple sources and markets ahead of demand, ensuring it has sufficient
liquidity in challenging market conditions. The funding strategy devised to address the funding requirement in
the year ahead includes, inter alia:
Capital markets
a) Explore the issuance of alternative bonds under the new R55 billion Domestic Medium-Term Note (DMTN) Programme for purposes of building Transnet’s yield curve: i) a new longer-dated bond (eg a 20-year bond) for general funding purposes; ii) shorter-dated floating rate and/or fixed rate bonds with three, five and seven-year maturities; or iii) long-dated project specific bonds (eg 25 – 30-year bonds) to fund specific designated projects thereby
matching the funding raised with the payback period of the underlying asset. b) Continue to tap existing bonds (TN20; TN23; TN25) fortnightly and issue Commercial Paper monthly under
the R55 billion DMTN Programme to create sufficient liquidity and funding for working capital requirements. c) Second issuance under the US$2 billion Global Medium-Term Note (GMTN) Programme in order to diversify
Transnet’s funding base. d) Explore issuing bonds in other markets either as public or private placements such as the Yen; United States
Dollar; Euro; Australian Dollar; Swiss Franc; or Sukuk markets thereby ensuring diversification of funding sources. The cost of the possible funding to be raised will be evaluated relative to Rand funding.
Loan market
a) Continue to explore the syndicated loan market. b) Continue to utilise asset-backed finance and other related finance solutions.
ECA a) Funding the imported component of the capital investment plan using Export Credit Agency (ECA) supported funding.
b) Continue to explore untied ECA financing. c) Consider ECAs to guarantee Transnet’s obligations under its lease arrangements resulting in competitive
lease rates. d) Assessing opportunities within the global private placement market.
DFI a) Working together with Eskom and local Development Finance Institutions (DFIs) to explore the financing of projects such as Waterberg and Eskom's road-to-rail migration.
b) Establish further funding and relations with other international DFIs such as the European Investment Bank, Asian Development Bank and KFW (German DFI).
Other a) Explore the global infrastructure and sovereign wealth funds as an alternative funding source.b) Evaluate leasing and financial position optimisation related solutions. c) Exploring ways of working with customers and/or interested parties to part fund certain of the capital
investments using Private Sector Participation mechanisms. d) Continue to repay and/or refinance and/or restructure old expensive debt and implement more economically
viable financing structures in their stead.
e) Engage with ECAs and other finance institutions to structure a financing solution that can be used by small enterprises that Transnet procures from as part of Transnet’s contribution to supplier development.
The probable sources of funding for 2013 are subject to market conditions. The Company is confident that it
will be able to access the capital markets to raise the required funding for the year ahead.
R billion 2013
Domestic bonds 4,0
Commercial paper 2,2
DFIs/ECAs/GMTN 5,8
Bank loans/other 2,1
Total 14,1
Transnet’s credit rating metrics will be closely monitored and proactive steps will be taken where necessary to
ensure that the Company maintains its solid investment grade rating. Financial risk management will continue
to be at the centre of the execution and liability management, to ensure that all possible risks are identified,
quantified and mitigated where necessary. Cash management practices will continue to be enhanced as reliable
and accurate cash forecasting is crucial in assisting the Company to meet its intended investment plan.

Executive statement (continued)
68
Transnet will continue to invest significant resources in the
recruitment, development, deployment and retention of key
operational, technical and managerial skills to facilitate growth,
whilst carefully balancing all interventions with the need for cost
containment.
WellnessThe focus for 2013 will be to strengthen and embed the various Employee Wellness programmes across the Company:
Assistance Programme;
minimise risk factors;
implement appropriate interventions to address the risk; and
CultureThe focus for 2013 will be on strengthening the implementation of the various culture charter interventions by focusing on:
organisation through existing structures and forums to enable and facilitate ownership of the culture behaviours at an Operating divisional level;
existing HR and business processes; and
basis on programmes and initiatives to embed a high performance culture:
– Continue to embed the Safety culture programme;
– Implement a programme to address 'dignity and respect' issues;
– Strengthen the communication on 'recognition and reward'; and
– Design and implement an employee recognition programme.
Job creationTo ensure business-aligned employment growth, Transnet will
embark on a targeted workforce planning process, which
includes a detailed analysis of business needs, skills profile and
organisational requirements linked to an efficient organisational
management and recruitment function. This will facilitate
delivery on targets for an overall headcount growth of 25%
by 2019.
Group employees (headcount)
66
17
3
63
72
5 72
69
3
70
98
5
71
92
7
73
96
2
69
07
6
2015 2016 201720142013 2018 2019
LOOKING AHEAD
The Human Capital Plan will continue to focus on the improved wellbeing and productivity of staff whilst simultaneously addressing the key human resource challenges facing Transnet.
HUMAN CAPITAL
ECONOMIC DIVIDENDS
SOCIAL DIVIDENDS

Integrated Report 2012 69
Ex
ec
uti
ve
sta
tem
en
t
2012 Integrated report 69
Human capital developmentTransnet is committed to the development of a competent workforce and strives to allocate 4,0% of total
personnel spend on its skills development initiatives in line with national and business requirements in 2013.
The Company will maintain a skills and talent pipeline to address business priorities through its ‘integrated
value chain’, spanning secondary educational institutions, through to tertiary educational institutions and into
the workplace.
Skills and capacity building
Planned intake per annum (headcount)*
2013 2014 2015 2016 2017 2018 2019
Engineering degree 120 132 145 160 176 193 213
Technical diploma 300 330 363 399 439 483 531
Artisan 500 550 605 666 732 805 886
Protection officers 800 880 968 1 065 1 171 1 288 1 417
Specific training: Operating divisions and Specialist Units (headcount)
2013 2014* 2015* 2016* 2017* 2018* 2019*
Total 37 430 39 232 40 540 41 897 40 809 40 260 40 260
Training cost as a % of personnel costs 4,0 4,6 4,4 4,3 4,3 4,3 4,2
* Subject to future workforce plan.
Refer to volume 3 for further details.

Executive statement (continued)
70
Objective Initiatives and targets
Continued focus on safety and strive for zero fatalities.
Company DIFR target of �0,8 for 2013.
Embedding the safety culture programme across all operations.
Implementation of safety plans and standards.
Providing assurance on implementation of Boards of Inquiry (BoI) recommendations and quality
of reports.
Performance reviews of BoI panel members.
Management of Standard Operating Procedures (SOPs):
– Identify processes that require SOPs.
– Write/review SOPs for those processes.
– Sign off, training, monitoring and review by process owners.
Compliance and SHEQ audits.
Implement the integrated assurance framework across the business.
Implementation of a Paperless Audit System.
Inspection checklist to be established for OHSAS 18001 Safety Standard, ISO 14001
Environmental Standard and ISO 9001 Quality Standard.
Reduction in noise pollution.
Embedding of the Occupational Health policy.
The establishment of Occupational Risk Exposure Profiles at all Operating divisions, including
noise surveys.
Equipment will be reengineered where possible, and appropriate hearing protective equipment
will be issued to the exposed.
Periodic job observations on high risk activities to inform SOP reviews.
Minimal environmental incidents for 2013.
Roll-out of the environmental compliance control framework across the business.
Conduct regular environmental compliance audits.
Finalise environmental assessments.
Implement environmental rehabilitation plans.
Ongoing engagement with the Department of Environmental Affairs.
Clean-up of legacy asbestos at various sites.
Biodiversity protection.
Proactively address environmental management issues in planning and capital
investment processes.
Develop stakeholder management plans with respect to environmental impact assessments,
legal and community issues.
Reduce Transnet’s carbon footprint and electricity consumption.
Complete the Transnet carbon footprint assessment and develop the following:
– Carbon management plan.
– Climate change strategy.
– Recommendations for further research and innovation.
– GHG emissions inventory to design specific mitigation and adaptation plans as well as initiatives with measurable targets.
– A priority in the year ahead is to improve energy efficiency, particularly as the country faces electricity supply constraints and as MDS volume targets require the use of considerably more electricity and diesel.
LOOKING AHEAD
Prioritising safety, health, environment and quality (SHEQ)In striving to achieve the targeted growth in volume, Transnet will continue to promote SHEQ as an operational priority. Key interventions to improve performance include:
Transnet creates and maintains a safe working environment.
SAFETY, HEALTH, ENVIRONMENT AND QUALITY
SOCIAL DIVIDENDS
ENVIRONMENTAL DIVIDENDS
ECONOMIC DIVIDENDS

Integrated Report 2012 71
Ex
ec
uti
ve
sta
tem
en
t
2012 Integrated report 71
Development procurement and B-BBEEBy employing a developmental procurement approach, Transnet
will maximise the economic impact of procurement, both in
terms of job creation and developing local industrial capability
and capacity.
Integrated Supply Chain Management (iSCM) will focus on
delivering value through world-class strategic sourcing whilst
concentrating on transformation and empowerment through
preferential procurement, as well as enterprise development
through Supplier Development.
Transnet has implemented the following Centres of Excellence in
executing its procurement strategy:
Recognising the importance of B-BBEE as a critical component of
achieving sustainable and inclusive economic development, social
stability and labour absorbing economic growth, Transnet will
optimise its contribution to B-BBEE in all its activities. Transnet
aims to achieve a preferential procurement target for recognised
B-BBEE spend of between 70% – 80% of total measured
procurement spend.
Enterprise Development is one of the key pillars within Transnet’s
own B-BBEE programme. iSCM will continue to investigate
opportunities which will lead to the creation of specific initiatives
for assisting and accelerating the development and sustainability
of beneficiary entities through the expansion of their financial and/
or operational capacities.
Transnet’s B-BBEE statistics are tracked by the amount of spend
with B-BBEE companies as per the Codes of Good Practice. This
effort will be supported by new data collection methods to gather
accurate information on job creation, skills development and the
localisation of procurement, amongst others. Transnet is currently
a Level 5 B-BBEE contributor and is targeting the achievement of a
Level 2 certification within the next two years.
STRATEGIC ENABLERS

Executive statement (continued)
72
The rest of Africa
The MDS strongly emphasises opportunities in the rest of Africa.
This is based on various projections reflecting the considerable
potential for future growth on the continent. This extends to a
rapidly growing middle class, returns on investment, expanding
populations, and urbanisation. Combined, these factors have
spurred, and will continue to stimulate, a variety of market
sectors to service the growing consumer base.
The Board has approved an Africa Strategy Framework, which
will prioritise the following programmes through a
comprehensive Africa strategy:
transport in the region;
transport for the continent;
the African Union and SADC, either directly or via the
Government to incorporate infrastructure security issues;
enabling a regional transport network;
as a leading provider of transport related skills training;
port operations, and a key advisor on port services on the
continent;
engineering products and for offering maintenance solutions
for port and rail equipment; and
provider of training on pipeline related matters.
LOOKING AHEAD
STRATEGIC ENABLERS
ECONOMIC DIVIDENDS

Integrated Report 2012 73
Ex
ec
uti
ve
sta
tem
en
t
2012 Integrated report 73
Execution risks
CAPITAL INVESTMENTS
OPERATIONS – RAIL
COMMERCIAL VOLUMES
EC
ON
OM
IC F
ACTORS
REG
UL
AT
ION
EXTERNALINTERNAL
Capital investment:
- Cost overrun.
- Schedule delays.
Commercial:
- Demand volume delays.
- Demand does not exist.
Operations:
- Operational inefficiencies
limit growth from capital
investment.
Economic factors:
- Recession slows volume
growth or causes decline.
- Slump in capital markets
makes debt more expensive.
- Inflationary pressures.
Regulation:
- Regulators place cap on tariffs
which reduce capital recovery.
The implementation plan responds directly to the above risks to enable the successful execution of the
strategy. The focus of the implementation plan will be optimising capital investments and enhancing capital
execution; securing volume growth; improving operational efficiencies; prioritising safety, health and
environment, skills development and job creation.
Market Demand Strategy execution risks The MDS, in its emphasis on innovation and bold action, is a high-risk strategy that depends fundamentally on
effective and efficient execution.
In developing the MDS execution plan, it was clear that sufficient flexibility was required to respond to
external shocks, necessitating the creation of sufficient internal capability to build adequate buffers to
change. Accordingly, Transnet will achieve greater structural flexibility by decentralising, as far as possible,
daily decision making and enhancing accountability at all levels of the organisation. To achieve this, the
Company will ensure compliance with Standard Operating Procedures (SOPs) and work at achieving greater
granularity in target setting. This also necessitates radically improving the quality of the Company’s
measurement and decision support systems.
The implementation of the MDS will, therefore, be characterised by enhanced measurement and reporting,
more frequent performance reviews, enhanced risk management and capital allocation processes, and the
alignment of incentives across the Company. The 100-day reviews will continue to be the principle mechanism
for managing executive performance.
As part of the strategy setting process, specific execution risks have been identified, for which risk mitigation plans are being developed as part of the MDS implementation plan.

Executive statement (continued)
74
MDS Implementation Plans
OPTIMISING CAPITAL INVESTMENTS
GROWING VOLUMES AND MARKET SHARE
IMPROVING OPERATIONAL EFFICIENCIES
FINANCE AND FUNDING
REGULATORY AND KEY STAKEHOLDER ENGAGEMENT
SHEQ, SUSTAINABILITY AND RISK
Optimise the capital portfolio.
Achieve 'gold standard' management and execution.
Practice efficient, cost-effective procurement.
Achieve localisation and empowerment objectives.
Expand integrated customer planning.
Create long-term stable customer relationships.
Enhance key account management capabilities.
Align tariffs to recover full economic cost from customers.
Secure take or pay contracts.
Become a 'gold standard' operator.
Improve quality of infrastructure.
Drive continuous improvement to enhance operational efficiency and productivity.
Maintain financial sustainability throughout the capital investment programme.
Pursue Private Sector Participation opportunities.
Enhance financial risk management.
Alignment on
tariff
methodology
and regulatory
policy.
Engage with
stakeholders to
develop joint
view on
transport
industry
structure.
Actively
engage with
internal and
external
stakeholders to
support MDS.
Fill critical vacancies
whilst achieving
employment equity
targets.
Implement enhanced
talent management
strategy.
Increase contribution
to skills development
within South Africa.
Embed core values of
dignity and respect.
Continued focus on
employee wellness.
Embed union
engagement model.
Enhance performance
management
approaches.
Optimise the reward
and incentives model.
Establish high
performance
programmes.
Safeguard corporate
governance and ensure
statutory compliance.
Enhance identification,
assessment and
mitigation capacity
of enterprise risk
management to
manage risks.
Improve, standardise
and integrate EIMS to
support delivery on
business
requirements.
Ensure integrated ,
holistic approach to
MDS tracking and
reporting.
Significant financial, social, economic and environmental impact for South Africa and the region through:
Embed a safety
culture.
Accelerate
initiatives to
address
environmental
challenges.
Actively monitor
and improve
socio-economic
impact.
GOVERNANCE, BUILDING ORGANISATIONAL READINESS AND HIGH PERFORMANCE CULTURE
HUMAN CAPITAL

Ex
ec
uti
ve
sta
tem
en
t
752012 Integrated report
AppreciationThe Board wishes to take this opportunity to thank all colleagues upon whose shoulders the past, present and
future success of this Company rests. Without their dedication, commitment and hard work, the Company
would not be where it is. The Board would also like to thank its recognised unions, South African Transport and
Allied Workers Union (Satawu) and United Transport and Allied Trade Union (Utatu), for leadership and
willingness to share in the Company’s long-term vision.
Our colleagues on the Board, thank you for you wisdom, guidance and continued support. We also thank
Mr Peter Malungani, who resigned on 1 April 2012, for his invaluable contribution. We wish him well in his
future endeavours.
Our sincere gratitude to the Minister of Public Enterprises, the Minister of Transport and their respective
deputy Ministers, and the officials under the leadership of the Director-General for guidance and leadership.
Thank you also to the various committees in Parliament, industry and economic regulators who keep us on
track through their oversight responsibilities.
To our customers, investors and funders, our most sincere appreciation.
Lastly, on behalf of all at Transnet, we would like to pay final tribute to the seven colleagues who lost their
lives whilst on duty during the year. May the year ahead see us being even more collectively vigilant in
prioritising the safety and well-being of all our people through a philosophy of ‘zero harm to self, colleagues
and the environment’.
We face the future with confidence, and look forward to growing our Company safely, sustainably and through
operational excellence and strong leadership.
ConclusionThrough the MDS, the Company will harness its strong financial position, revitalised reputation as well as the
renewed appetite for bold action by the Shareholder, the Board and the Company as a whole – to create
employment opportunities, stimulate economic activity and deliver on its mandate in the year ahead.
The implementation of the MDS is gaining momentum, with the Company gearing up for continuous
improvements and creating capacity to meet market demand in the medium term.
Primary focus areas remain optimal asset utilisation, investment in capital infrastructure, sustained volume
growth, improved operational efficiencies, effective supply chain management, the development of critical
skills and enhanced safety performance.

76

77
FREIGHT RAIL
Fre
igh
t R
ail

Freight Rail
New locomotive at Koedoespoort.
reight Rail’s strategic advantage lies in the movement of heavy haul and bulk commodities over long distances, where flow densities provide economies of scale thereby lowering unit cost.
Freight Rail further provides the network for long distance passenger rail services as well as haulage capacity for other private passenger services. Freight Rail does not operate passenger services except for the Blue Train luxury passenger service which is operated as a strategic positioning tool for the tourism industry in Southern Africa.
F
78

Fre
igh
t R
ail
HIGHLIGHTS CHALLENGES
REVENUE UP BY 22,3% AND OPERATING
PROFIT INCREASED BY 29,4%
compared to the prior year.
FREIGHT RAIL RECORDED THE HIGHEST
TONNAGES TRANSPORTED IN THE
DIVISION’S HISTORY,
railing in excess of 201mt during the year.
This reflects a 10,4% improvement on
the 182,1mt conveyed in the prior year.
THE NUMBER OF TRAINS
OPERATED INCREASED
from an average of 770 per day in the prior
year to an average of 1 094 during the year,
representing a 42,1% improvement in the
number of trains run.
A SCHEDULED RAILWAY INITIATIVE
WAS INTRODUCED
to promote the delivery of an on-time,
reliable and predictable train service for
all customers.
DIFR IMPROVED FROM 1,22 IN THE
PREVIOUS YEAR TO 0,90,
resulting in a reduction of safety costs
from R790,9 million to R148,1 million.
This represents an 81,3% improvement
over the prior year.
ROAD-TO-RAIL VOLUMES LOWERS
CARBON EMISSIONS
Increased containers on rail, automotives
on rail and domestic coal on rail: estimated
218 000 CO2 equivalent reduced.
ELECTRICITY REGENERATION
recorded 10% regeneration in class 19E
locomotives on coal line. Recorded 20%
regeneration in class 15E locomotives on
iron ore line.
WITH THE EXCEPTION OF THE EXPORT
IRON ORE LINE,
the achievement of targets on all lines were
hampered by customer cancellations, poor
locomotive efficiency averages
(GTK per loco per month) and a poor record
of on-time departure and arrivals.
FOUR FATALITIES WERE REPORTED
DURING THE YEAR,
compared to eight in the previous year (two
rail related and two road related). Whilst
the fatality rate has reduced, Freight Rail
continues to emphasise a culture of 'zero
tolerance', making every effort to ensure
the highest standards of safety, health and
environmental compliance.
ABSENTEEISM REMAINS AN AREA OF
CONCERN.
LEGACY ASBESTOS CLEAN-UP
commenced but slower than planned due
to permit delays.
792012 Integrated report

81
Operating division performance
Salient features
Year ended 31 March
2012R million
Year ended 31 March
2011R million % change
Revenue 27 658 22 607 22,3
– General freight 15 660 13 364 17,2
– Export coal 7 629 5 632 35,5
– Export iron ore 3 440 2 669 28,9
– Other 929 942 (1,4)
Operating expenses (17 117) (14 463) 18,4
– Energy costs (3 252) (2 533) 28,4
– Maintenance (3 438) (2 949) 16,6
– Materials (459) (436) 5,3
– Personnel costs (7 488) (6 555) 14,2
– Other costs (2 480) (1 990) 24,6
Profit from operations before depreciation and amortisation and
items listed below (EBITDA) 10 541 8 144 29,4
Depreciation and amortisation (5 368) (4 602) 16,6
Profit from operations before items listed below 5 173 3 542 46,0
Impairments and fair value adjustments (51) (181) (71,8)
Dividend received – 12 (100)
Net finance costs (1 569) (1 448) 8,4
Profit before taxation 3 553 1 925 84,6
Total assets (excluding CWIP) R million 61 351 50 681 21,1
Profitability measures
EBITDA margin* % 38,1 36,0 2,1
Operating margin** % 18,7 15,7 3,0
Return on average total assets (excluding CWIP)*** % 9,2 7,7 1,5
Asset turnover (excluding CWIP)**** times 0,49 0,49 –
Capital investments^ R million 14 792 12 542 17,9
Capitalised maintenance expenditure R million 5 715 4 024 42,0
Employees
Number of employees (permanent) number 26 850 23 665 13,5
Revenue per employee R million 1,03 0,96 7,3
* EBITDA expressed as a percentage of revenue.** Profit from operations before impairment of assets, fair value adjustments, dividends received, net finance costs and taxation expressed as a
percentage of revenue.*** Profit from operations before impairment of assets, fair value adjustments, dividends received, net finance costs and taxation expressed as a
percentage of average total assets excluding capital work-in-progress.**** Revenue divided by average total assets excluding capital work-in-progress.^ Actual capital expenditure (replacement + expansion) excluding capitalised borrowing costs and including capitalised finance leases.
Freight Rail (continued)
8080

812012 Integrated report
Fre
igh
t R
ail
812012 Integrated report
Performance commentaryDuring the year, the Group’s largest and most complex division was severely handicapped by uncertainty resulting
from management upheavals. Consequently, of all the Operating divisions, Freight Rail was most in need of
concerted and targeted intervention and stabilisation. Following the reinstatement of the Chief Executive,
management stability was restored to the Operating division.
Freight Rail moved 201,0mt of freight during the year, representing a 10,4% increase compared to the prior
year, the highest tonnages transported in the Division’s history. General freight volumes increased by 9,9%
to 81,0mt (2011: 73,7mt) including an increase in containers on rail of 21,5% to 762 760 TEUs (2011: 627 825
TEUs), evidencing a market share growth. On-time departures and arrivals for the General Freight Business
improved by 18,9% and 17,7% respectively compared to prior years as a result of the “Yard Countdown Tool”
introduced during the year as part of the scheduled railway strategy.
The Company’s efforts to place ‘rail friendly’ cargo back on trains, resulted in a 21,5% increase in market share of
containers on rail. This will yield positive impacts for the economy in the long term as rail is approximately 75%
less expensive compared to road, in addition to the significant reduction in carbon emissions and road maintenance
costs associated with a modal shift.
Export coal volumes increased by 8,8% to 67,7mt (2011: 62,2mt), reversing a long trend of stagnating volume
growth spanning more than five years. This increase was due to improved operational efficiencies, with on-time
departures and arrivals improving by 10,7% and 19,9% respectively compared to the prior year. A new weekly
record of 1,7mt was achieved during the year.
Export iron ore volumes increased by 13,2% to 52,3mt (2011: 46,2mt), due to improved efficiencies, with
scheduled departures and arrivals improving by 58,4% and 53,3% respectively. This demonstrates the positive
impact of the new operations philosophy on the business as well as the benefits of the increased capacity
created by the capital expenditure programme. A record weekly throughput tempo of 1,2mt was achieved in the
last week of the financial year.
The year’s targets were not achieved in all instances as is demonstrated in the table overleaf. With the exception of
the Export iron ore line, contributing factors included, customer cancellations, low locomotive efficiency averages
(GTK per loco per month) and a poor record of on-time departures and arrivals. The locomotive fleet is now on
average 37 years old and no amount of maintenance spend is likely to improve its utilisation.
In addition to the implementation of the capital programme – which included the start of the delivery and
commissioning into service of new locomotives – management focus on efficiency has centred around improved
planning, integrated planning with customers, and in particular junior miners, improving adherence to the Integrated
Train Plan and deployment of locomotives to corridors to simplify operations and improve standardisation. The
National Command Centre has developed to a much more effective operation with general management visibility
and decision-making authority 24 hours everyday. This has improved monitoring and deviation management.
Furthermore, R450 million has been committed to the clean-up of legacy asbestos contamination at the various
sites by 2016.
The 201mt moved during the year was 2,4% short of the 206,0mt target.
Revenue for the year increased by 22,3% to R27,7 billion compared to R22,6 billion in the prior year.
Net operating expenses increased by 18,4% during the year to R17,1 billion compared to R14,5 billion in the
prior year, mainly as a result of an increase in personnel costs of 14,2%, an increase in electricity tariffs of
26,0% as well as a 15,1% increase in maintenance and material costs.
This resulted in an EBITDA of R10,5 billion (2011: R8,1 billion), an increase of 29,4% from the prior year.
Freight Rail aims to rail 224,8mt in the year ahead in terms of the MDS, which is an increase of 11,8% on the 2012
financial year.
Key performance indicators for the year under review and the year ahead are detailed overleaf.

82
Transnet Freight RailTransnet Freight RailFreight Rail (continued)
Performance indicators
2011Actual
2012Target
2012Actual
2013Target
Operational efficiency
GFB
– Locomotive efficiency(a)GTK 000/
locomotive/month5 121 5 400 5 167 5 500
– Wagon turnaround time days 12,6 11,0 11,5 9,2
Export coal
– Locomotive efficiency(b) GTK 000/
locomotive/month13 505 24 700 23 845 24 700
– Wagon cycle time hours 72 58 66 58
Export iron ore
– Locomotive efficiencyGTK 000/
locomotive/month38 866 45 600 43 110 44 000
– Wagon cycle time hours 85 76 93 78
Customer focus
On-time departures (deviations from schedule)(c)
– GFB minutes 350 175 284 225
– Export coal minutes 234 142 209 160
– Export iron ore minutes 161 89 67 60
On-time arrivals (deviations from schedule)(d)
– GFB minutes 434 227 357 260
– Export coal minutes 468 282 375 325
– Export iron ore minutes 285 152 133 120
Volumes
Total volumes mt 182,1 206,0 201,0 224,8
GFB(e) mt 73,7 84,4 81,0 90,3
Export coal mt 62,2 70,0 67,7 75,0
Export iron ore mt 46,2 51,6 52,3 59,5
Infrastructure
Capital investments(f) R million 12 542 14 693 14 792 19 512
B-BBEE procurement % 75 75 78 70
Financial value creation
EBITDA margin(g) % 36,0 38,9 38,1 44,9
Return on average total assets (excluding
CWIP)(h) % 7,7 10,0 9,2 13,9
82

832012 Integrated report
Fre
igh
t R
ail
2011Actual
2012Target
2012Actual
2013Target
Human capital
Number of employees (permanent) number 23 665 25 900 26 850 28 857
Training spend (% of personnel cost) % 2,2 2,0 2,6 2,9
Employment equity % 77,6 78,0 80,4 79,0
Employee turnover % 5,1 4,0 5,0 5,0
Revenue per employee R million 0,96 1,08 1,03 1,16
Absenteeism % 6,3 3,3 na na
– Absenteeism: Unplanned absenteeism rate
(UAR)% n/a 1,5 2,3 1,5
– Absenteeism: Sick absenteeism rate (SAR) % n/a 1,5 1,8 1,5
Safety, health and environment
DIFR (i) rate 1,22 0,88 0,90 1,25
Safety incidents number 558 374 103 90
Number of derailments – mainline number 125 80 87 73
Number of derailments – shunting number 363 243 294 247
Number of train-on-train collisions number 5 5 5 4
Signals passed at danger number 61 46 85 71
Employee fatalities number 8 zt 4 zt
Public fatalities number 138 zt 98 zt
Security incidents number 3 711 2 969 3 529 2 647
– Value of loss R million 67,1 53,7 53,9 40,5
Cost of risk % of revenue 7,0 5,6 4,9 5,5
(a) Excluding B-fleet and shunting locomotives as well as General Freight locomotives operating on the Export coal line (see note (b) below). These locomotives will be included in due course.
(b) In 2012, GFB locos in use on the Export coal line have been allocated to the GFB line. In addition, the methodology applied in the determination of the GTK being an input into the calculation has changed in the current year. The 2011 ratios have not been restated. Had this been restated the comparable locomotive efficiency ratio would have amounted to 22 095 rather than the 13 505 disclosed.
(c) A leniency departure window of 90 minutes for GFB and 94 minutes for coal and iron ore lines were included in 2012. The 2011 ratios have not been restated. Had the prior year metric been applied in the current year the current year on-time departures for GFB, Export coal and Export iron ore would be 345, 258 and 114 respectively rather than the 284, 209 and 67 disclosed.
(d) A leniency arrival window of 180 minutes for GFB and 160 minutes for coal and iron ore line were included in 2012. The 2011 ratios have not been restated. Had the prior year metric been applied in the current year, the current year on time departures for GFB, Export coal and Export iron ore would be 471, 485 and 232 respectively rather than 357, 375 and 133 as disclosed.
(e) In 2012 the weight of empty containers transported are included in total tons transported which positively impacted GFB by 1,3mt in the current year.(f) Excluding the capitalisation of borrowing costs and including the capitalisation of finance leases.(g) EBITDA expressed as a percentage of revenue.(h) Profit from operations before impairment of assets, fair value adjustments, net finance costs and taxation expressed as a percentage
of average total assets excluding capital work-in-progress.(i) In 2012 the determination of standard hours were refined in the calculation. Had the prior year metric been applied in the current year, the
current year DIFR would have been 1,0 rather than 0,90 as disclosed.ns not set.n/a not applicable.zt zero tolerance.nr not reported.
Achieved or exceeded 2012 target. Achieved >95% of 2012 target. Achieved <95% of 2012 target.
832012 Integrated report

Transnet Freight RailFreight Rail (continued)
LOOKING AHEAD
PRODUCTIVITY AND OPERATIONAL EFFICIENCIES
Revised service designs, a new train plan, capital and maintenance programme implementation, operational processes and improved operational discipline in execution will contribute to better asset utilisation and operational efficiencies.
Establishment of customer-facing Business Units designed to drive accountability and cascade performance measures to lowest level of the organisation.
Provide a scheduled railway operations philosophy: simplified operations, structure for accountability, plan for efficiency and introduction of technologies.
Implementation of the capital investment programme to drive efficiencies.
Establish export iron ore and Manganese Business Units as ‘gold standard’ heavy haul operations and thereafter roll out to all Business Units.
Implementation of the NAVIS Operating System in key container depots.
Automation of Yard Points Control Systems.
CAPITAL INVESTMENT
Reprioritised investments to improve allocation to specific growth market segments.
Investment in strategic infrastructure, standardising the network and rolling stock.
Implement the seven-year capital investment plan of R201,0 billion.
GROWING VOLUMES
Shift rail-friendly traffic from road-to-rail.
Grow market share from ~25% to ~35% by 2019.
Transport 224,8mt of freight in 2013 and 350,2mt in 2019.
Create capacity for junior miners.
Increase over-border rail volumes of 7,6mt in 2013 to 19,6mt in 2019.
VOLUMES 2013 2019
EXPORT COAL INCREASE TO 75,0mt INCREASE TO 97,5mt
EXPORT IRON ORE INCREASE TO 59,5mt INCREASE TO 82,5mt
GENERAL FREIGHT INCREASE TO 90,3mt INCREASE TO 170,2mt
2013 2019
REVENUE R34,2 BILLION R83,9 BILLION
EBITDA R15,3 BILLION R43,3 BILLION
CASH INTEREST COVER 6,8 TIMES 8,0 TIMES
GEARING 49,9% 34,8%
FINANCIAL
84

REGULATORY Collaborate with the Department of Transport and Rail Regulator on numerous initiatives to establish policy certainty and facilitate rail reform.
HUMAN CAPITAL
Create 8 807 jobs in one year and 17 359 jobs over seven years: employee numbers are anticipated to grow to 34 807 in 2013 and 43 359 by 2019 (including contract workers).
Develop workforce plans per Business Unit.
Define skills and behavioural competencies required to execute the plan and provide improved customer service.
Target growth in employee numbers for train drivers, operational, technical and engineering positions, in line with NGP commitments.
At least 4% of personnel costs will be spent per annum on training, development of employees and building leadership competence.
Investment in supervisory and management development programmes.
Cascade common set of values to promote service excellence.
Reorientate relationship with recognised trade unions.
SAFETY, HEALTH, ENVIRONMENT AND QUALITY (SHEQ)
Reduction in number of incidents to 316 in 2019.
Target DIFR reduction.
Target improved NOSA ratings in yards.
Continued focus on safety – people management and training with adherence to TWRs and SOPs.
Deployment of Integrated Condition Monitoring System.
Rolling stock management – monitoring of braking systems; OBC; data loggers; roller bearings; front mounted camera.
Level crossing awareness and policing.
Increased security to prevent cable theft.
Growth in volumes translates to 6 200 fewer trucks per annum and reducing logistics costs by 4% – 7%.
The implementation of the funded country-wide asbestos and hydrocarbon pollution elimination programmes will reduce pollution and liability exposures.
Refinement of holistic climate change strategy: – Migration to regenerative locomotive traction technology to save
energy and discharge electricity back to the system.
– Fuel facility upgrade programme to refurbish and prevent spillages.
– Greening of supply chain mechanisms to reduce electricity and water consumption; implementation of ISO14001.
Fre
igh
t R
ail
852012 Integrated report

86

87
RAIL ENGINEERING Ra
il E
ng
ine
eri
ng

Rail Engineering
Employee in wheels business division of Rail Engineering – Koedoespoort.
ail Engineering’s internal structure comprises nine businesses, namely wagon, locomotive, coach, rolling stock equipment, rotating machines, wheels, auxiliary, foundry and port equipment maintenance. The wagon, locomotive and coach
businesses are the primary customer facing entities and revenue generators, while the other seven operational businesses provide a supportive role within the organisation with the exception of the auxiliary business which has a substantial portion of its activity focused directly on serving Freight Rail. The port equipment maintenance business is a newly established business unit.
R
88
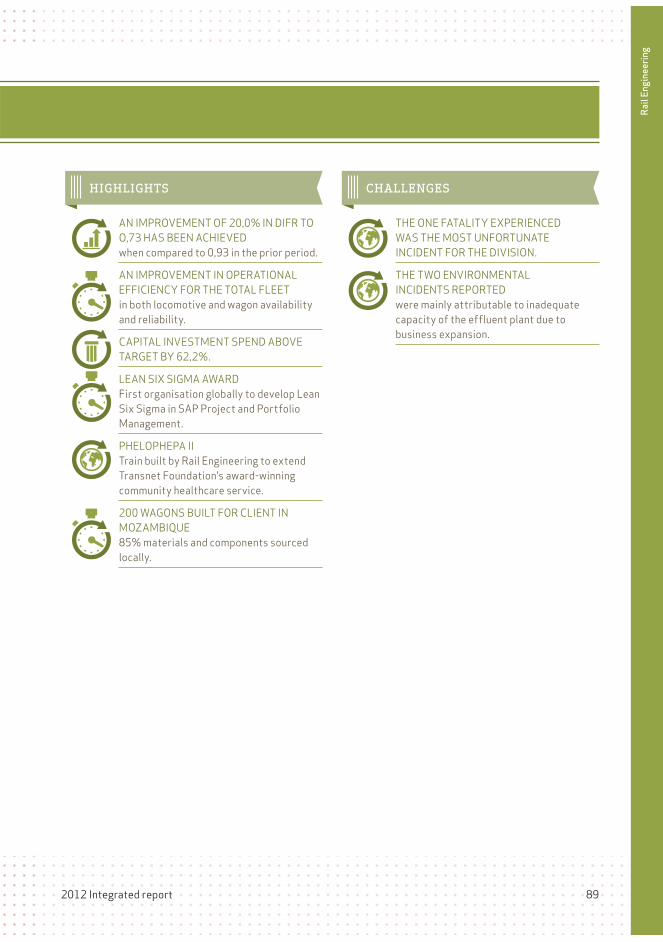
Ra
il E
ng
ine
eri
ng
HIGHLIGHTS CHALLENGES
AN IMPROVEMENT OF 20,0% IN DIFR TO
O,73 HAS BEEN ACHIEVED
when compared to 0,93 in the prior period.
AN IMPROVEMENT IN OPERATIONAL
EFFICIENCY FOR THE TOTAL FLEET
in both locomotive and wagon availability
and reliability.
CAPITAL INVESTMENT SPEND ABOVE
TARGET BY 62,2%.
LEAN SIX SIGMA AWARD
First organisation globally to develop Lean
Six Sigma in SAP Project and Portfolio
Management.
PHELOPHEPA II
Train built by Rail Engineering to extend
Transnet Foundation's award-winning
community healthcare service.
200 WAGONS BUILT FOR CLIENT IN
MOZAMBIQUE
85% materials and components sourced
locally.
THE ONE FATALITY EXPERIENCED
WAS THE MOST UNFORTUNATE
INCIDENT FOR THE DIVISION.
THE TWO ENVIRONMENTAL
INCIDENTS REPORTED
were mainly attributable to inadequate
capacity of the effluent plant due to
business expansion.
892012 Integrated report

91
Rail Engineering (continued)
Operating division performance
Salient features
Year ended31 March
2012R million
Year ended31 March
2011R million
% change
Revenue 11 266 9 326 20,8
– Internal 9 789 8 665 13,0
– External 1 477 661 123,4
Operating expenses (10 224) (8 175) 25,1
– Energy costs (198) (146) 35,6
– Maintenance (233) (145) 60,7
– Materials (4 657) (3 630) 28,3
– Personnel costs (4 514) (3 719) 21,4
– Other (622) (535) 16,3
Profit from operations before depreciation and amortisation and
items listed below (EBITDA) 1 042 1 151 (9,5)
Depreciation and amortisation (169) (171) (1,2)
Profit from operations before items listed below 873 980 10,9
Impairments and fair value adjustments (19) (12) 58,3
Net finance costs (166) (184) (9,8)
Profit before taxation 688 784 (12,2)
Total assets (excluding CWIP) R million 7 597 6 413 18,5
Profitability measures
EBITDA margin* % 9,2 12,3 (3,1)
Operating margin** % 7,7 10,5 (2,8)
Return on average total assets (excluding CWIP)*** % 12,5 15,8 (3,3)
Asset turnover (excluding CWIP)**** times 1,61 1,50 7,3
Capital investments^ R million 722 532 35,7
Employees
Number of employees (permanent) number 12 572 13 001 (3,3)
Revenue per employee R million 0,90 0,72 25,0
* EBITDA expressed as a percentage of revenue.** Profit from operations before impairment of assets, fair value adjustments, net finance costs and taxation expressed as a percentage of revenue.*** Profit from operations before impairment of assets, fair value adjustments, net finance costs and taxation expressed as a percentage of average
total assets excluding capital work-in-progress.**** Revenue divided by average total assets excluding capital work-in-progress.^ Actual capital expenditure (replacement + expansion) excluding capitalised borrowing costs.
9090

912012 Integrated report
Ra
il E
ng
ine
eri
ng
912012 Integrated report
Performance commentaryWith the exception of the coal line wagon reliability, Rail Engineering achieved all the rolling stock availability and
reliability targets at benchmark levels in support of Freight Rail volumes ramp up during the year. Action plans are
in place to address factors impacting negatively on the coal line wagon reliability.
Rail Engineering is pivotal to ensuring that Transnet’s extensive capital expenditure drives South Africa’s
industrialisation programme through the CSDP. Its Koedoespoort plant east of Pretoria is the site of the
Company’s flagship localisation initiative, where 143 locomotives are being built in partnership with American
original equipment manufacturer, General Electric.
Whilst strengthening its rail engineering capabilities, Rail Engineering has launched a new unit to focus on port
infrastructure maintenance, manufacturing and engineering. The Operating division is currently running a pilot
project at the Durban Container Terminal, with some equipment in use at various other terminals, including Ngqura.
Rail Engineering has commenced the first phase of legacy asbestos clean-up at various sites.
Rail Engineering’s internal revenue increased by 13,0% to R9,8 billion compared to R8,7 billion in the prior year.
The increase was due to higher demand from Freight Rail for maintenance and upgrade of locomotives and wagons
to support volume growth.
External revenue increased by 123,4% to R1,5 billion (2011: R661 million) mainly due to increased sales of
coaches to the Passenger Rail Agency of South Africa (PRASA) as well as locomotive and wagon sales into the
African market.
Net operating expenses increased by 25,1% to R10,2 billion (2011: R8,2 billion) mainly due to a 21,4% increase
in personnel costs and a 28,3% increase in material costs as a result of increased activity levels.
This resulted in a 9,5% decrease in EBITDA to R1,0 billion (2011: R1,2 billion).
Hoisting of under frame at Rail Engineering, Koedoespoort.

9292
Rail Engineering (continued)Rail Engineering (continued)
Performance indicators
2011Actual
2012Target
2012Actual
2013Target
Operational efficiency
Total fleet – weighted average (active
fleet)
– Locomotive availability % 89,6 89,8 90,5 89,5
– Locomotive reliability faults per million km 30 27 25 29
– Wagon availability % 94,5 94,6 94,8 94,7
– Wagon reliability faults per million km 0,38 0,34 0,30 0,42
GFB (active fleet)
– Locomotive availability % 89,6 89,8 90,5 89,5
– Locomotive reliability faults per million km 28 27 25 25
– Wagon availability % 93,8 94,0 94,2 94,0
– Wagon reliability faults per million km 0,79 0,74 0,62 0,60
Export coal line (active fleet)
– Locomotive availability % 90,2 90,6 90,6 89,5
– Locomotive reliability faults per million km 44 33 33 45
– Wagon availability % 97,6 97,5 98,0 97,5
– Wagon reliability faults per million km 0,13 0,14 0,18 0,17
Export iron ore line (active fleet)
– Locomotive availability % 88,2 87,7 90,5 89,5
– Locomotive reliability faults per million km 18 20 14 15
– Wagon availability % 98,1 97,5 98,0 97,5
– Wagon reliability faults per million km 0,01 0,10 0,03 0,07
Infrastructure
Capital investments(a) R million 532 445 722 890
B-BBEE procurement % 44 75 74 75
Financial value creation
EBITDA margin(b) % 12,3 12,3 9,2 13,2
Return on average total assets
(excluding CWIP)(c) % 15,8 17,4 12,5 19,6

932012 Integrated report
Ra
il E
ng
ine
eri
ng
2011Actual
2012Target
2012Actual
2013Target
Human capital
Number of employees (permanent) number 13 001 13 190 12 572 12 546
Training spend (% of personnel cost) % 3,5 4,3 5,8 6,0
Employment equity % 74,5 75,0 73,6 77,0
Employee turnover % 5,0 3,8 6,7 5,0
Revenue per employee R million 0,7 0,8 0,9 0,8
Safety, health and environment
DIFR rate 0,93 0,80 0,73 0,80
Safety incidents number 128 105 114 107
Employee fatalities number 1 zt 1 zt
Public fatalities number 0 zt 0 zt
Cost of risk % of revenue 1,8 1,7 1,6 2,3
Major environmental incidents number nil nil 2 nil
(a) Excluding the capitalisation of borrowing costs.(b) EBITDA expressed as a percentage of revenue.(c) Profit from operations before impairment of assets, fair value adjustments, net finance costs and taxation expressed as a percentage of
average total assets excluding capital work-in-progress.zt zero tolerance.ns not set.
Achieved or exceeded 2012 target. Achieved >95% of 2012 target. Achieved <95% of 2012 target.
932012 Integrated report

94
Rail Engineering (continued)Rail Engineering (continued)
CAPITAL INVESTMENT
Total seven-year investment of R3,8 billion.
Reinvest in equipment for breakdown and derailment recoveries.
Invest in depot equipment to enable higher productivity.
Start the prototyping of various upgrades.
Develop the General Electric 34D power upgrade.
Invest in smart technology to improve real time governance and system
disruptions as well as create full monitoring of all locomotives so as to
improve reliability.
GROWING VOLUMES
Rail Engineering’s strategy going forward is hinged around supporting
Freight Rail in its pursuit of volume growth.
Rail Engineering plans to increase revenues by an average of 17,0% per
annum over the next seven years, with volume growth of 10% per annum
REGULATORY
Conduct risk assessment on the identified regulatory requirements
applicable to Rail Engineering.
Develop Control Compliance Plans for each critical regulatory compliance
requirement.
Perform monitoring to measure the level of compliance, and update Control
Compliance Plans.
PRODUCTIVITY AND OPERATIONAL EFFICIENCIES
Increased availability and reliability in support of Freight Rail’s
requirements.
Satellite maintenance facilities to improve flexibility.
Lean Six Sigma.
Reduce diesel major turn-around from three weeks to one week.
Introduce new technology to protect locomotive from operator misuse.
Root cause failure analysis.
Quality assurance ramp up.
Reduce stand-time for failed locomotives.
2013 2019
REVENUE R12,6 BILLION R21,5 BILLION
EBITDA R1,7 BILLION R3,5 BILLION
CASH INTEREST COVER (ZERO DEBT FROM 2016) 7,2 TIMES
GEARING (ZERO DEBT FROM 2016) 27,5%
FINANCIAL
LOOKING AHEAD
94

952012 Integrated report
HUMAN CAPITAL
Train all employees on new technology fleet.
Train employees on maintenance principles of the new fleet.
Train all employees on Lean Six Sigma principles to improve productivity,
and efficiency.
Improve supervisors’ skills in financial management, and managing
non-performance and absenteeism.
Creating a strong succession pool of competent female managers that
can assume future top leadership positions in Rail Engineering.
Training of 2 000 artisans in support of the NGP to eliminate the skills shortage in the country.
Train 300 illiterate Rail Engineering employees through the ABET
programme.
Introduce a programme to train 100 unskilled young people; giving them
skills required in the market.
SAFETY, HEALTH ENVIRONMENT AND QUALITY (SHEQ)
Improve quality of incident investigations.
Introduce near miss frequency rating measurement and reward system
for improved performance.
SPO roll-out and implementation.
Intensify localised SHE Awareness to address specific trends in the
regions/businesses.
Strengthening the Behavioural Safety Programme.
Enhance and standardise existing Hearing Conservation Programmes
to address noise-induced hearing loss (NIHL) cases.
Enhancing involvement of SHEQ technical skill in contractor
management.
Introduction of a SHEQ management system (ie software) to improve productivity.
Continue with the implementation of the hydrocarbon pollution control
as per the three-year programme.
Engage the Regulatory Authorities in terms of required permits for waste removal.
Facilitate removal of buried asbestos where required as per the
recommendations of the scientific analysis report.
Develop Waste Management Plans for Bloemfontein, Uitenhage, Salt
River, and Germiston in line with new legislation.
Implementation of Waste Management Plans at the Durban and
Koedoespoort regions.
Expand on recycling initiatives.
Rehabilitation of the contaminated sites as per the anticipated
recommended remedial actions.
Assessment of the rest of the effluent plant’s efficiency in view of
possible upgrades to avoid environmental pollution.
Upgrading of effluent plants where required.
Facilitate sustainability and implementation of Climate Change Strategy.
Implementation and certification of an Environmental Management System and ensuring environmental compliance in general.
Ra
il E
ng
ine
eri
ng
952012 Integrated report

96

12
NATIONAL PORTS AUTHORITY
Na
tio
na
l Po
rts
Au
tho
rity

National Ports Authority
Marine Services Jetty R Nosipho Bokako, Tug Master and Lloyd Mpisane, Port Controller.
ransnet National Ports Authority (National Ports Authority) operates as a landlord port authority, which manages, controls and administers the South African port system on behalf of the State. On a wider economic front National
Ports Authority seeks to continually enhance its role in pursuing large scale market collaboration in partnership with customers and stakeholders including the Ports Regulator for the benefit of the national economy.
T
98

Na
tio
na
l Po
rts
Au
tho
rity
HIGHLIGHTS CHALLENGES
FAVOURABLE SHIPPING DELAY
PERFORMANCE,
attributable to berthing services, towage
and pilotage was achieved.
ALL VEHICLE PRODUCTIVITY TARGETS
WERE EXCEEDED
due to it being primarily uniform cargo, as
well as certain ports being able to perform
pre-stacking/parking.
LOADING RATE TARGETS WERE EXCEEDED
for dry bulk cargo (Iron ore – Saldanha and
coal at Richards Bay Coal Terminal) due to
good loading rates at both Terminals.
Improved joint operational planning and
the prevention of loader breakdowns have
been the key contributors in ensuring that
the targets were exceeded.
AUTOMOTIVE IMPORTS REFLECT A
58,3% INCREASE
compared to target of 18,8% compared
to prior year.
PORT OF NGQURA
officially opened by His Excellency,
President JG Zuma – March 2012.
SOUTH AFRICA'S FIRST
three black female marine pilots
graduated from The School of Ports.
PRODUCTIVITY TARGETS WERE ON
AVERAGE EXCEEDED BY 10% FOR ALL
MAJOR CONTAINER PORTS
with the exception of Port of Elizabeth.
This was primarily due to inclement
weather conditions and ageing
infrastructure which resulted in increased
crane breakdowns.
AN UNFAVOURABLE ABOVE TARGET SHIP
TURNAROUND TIME
actual of 54 hours compared to a target of
48 hours was achieved. This was primarily
due to larger parcel sizes of cargo on
container vessels, inclement weather
conditions as well as crane breakdowns
primarily at Durban Container Terminal.
FULL CONTAINER EXPORTS REFLECT A
12,2% NEGATIVE VARIANCE
as compared to the target. The negative
variance can be attributed to tough
economic conditions in Europe.
BREAK-BULK EXPORTS REFLECT A
NEGATIVE DEVIATION OF 24,6%
AGAINST TARGET.
The underperformance is mainly due
to reduced steel exports as a result of
constraints experienced within the
steel industry.
992012 Integrated report

101
National Ports Authority (continued)
Operating division performance
Salient features
Year ended31 March
2012R million
Year ended31 March
2011R million
% change
Revenue 8 257 8 061 2,4
– Containers 4 027 3 600 11,9
– Break-bulk 244 254 (3,9)
– Dry bulk 821 697 17,8
– Liquid bulk 579 654 (11,5)
– Automotive 559 472 18,4
– Other 2 027 2 384 (15,0)
Operating expenses (2 504) (2 195) 14,1
– Energy costs (274) (215) 27,4
– Maintenance (275) (254) 8,3
– Materials (67) (63) 6,3
– Personnel costs (1 440) (1 180) 22,0
– Other (448) (483) (7,2)
Profit from operations before depreciation and amortisation and
items listed below (EBITDA) 5 753 5 866 (1,9)
Depreciation and amortisation (1 248) (997) 25,2
Profit from operations before items listed below 4 505 4 869 (7,5)
Impairments and fair value adjustments 255 355 (28,2)
Net finance costs (1 427) (1 234) 15,6
Profit before taxation 3 333 3 990 (16,5)
Total assets (excluding CWIP) R million 60 659 56 050 8,2
Profitability measures
EBITDA margin* % 69,7 72,8 (3,1)
Operating margin** % 54,6 60,4 (5,8)
Return on average total assets (excluding CWIP)*** % 7,7 9,6 (1,9)
Asset turnover (excluding CWIP)**** times 0,14 0,16 (12,5)
Capital investments^ R million 1 749 2 031 (13,9)
Employees
Number of employees (permanent) number 3 422 3 535 (3,2)
Revenue per employee R million 2,41 2,28 5,7
* EBITDA expressed as a percentage of revenue.** Profit from operations before impairment of assets, fair value adjustments, dividends received, net finance costs and taxation expressed as a
percentage of revenue.*** Profit from operations before impairment of assets, fair value adjustments, dividends received, net finance costs and taxation expressed as a
percentage of average total assets excluding capital work-in-progress.**** Revenue divided by average total assets excluding capital work-in-progress.^ Actual capital expenditure (replacement and expenses) excluding capitalised borrowing costs.
100100

1012012 Integrated report
Na
tio
na
l Po
rts
Au
tho
rity
1012012 Integrated report
Performance commentaryRevenue increased by 2,4% to R8,3 billion (2011: R8,1 billion). This growth is mainly attributable to an
improvement in volumes when compared to the prior year. Container volumes increased by 6,6%, dry bulk
increased by 7,8% and automotive volumes increased by 9,3%, offset by the clawback provision of R1,4 billion
(2011: R750 million) resulting from the Record of Decision issued by the Ports Regulator.
Net operating expenses increased by 14,1% to R2,5 billion compared to R2,2 billion in the prior year. The cost
increase was mainly due to an increase in personnel costs of 22,0% and an increase in energy costs of 27,4%
in line with electricity tariff increases and fuel price increases.
Accordingly, EBITDA decreased by 1,9% to R5,8 billion (2011: R5,9 billion).
On 13 March 2012, the Ports Regulator of South Africa awarded National Ports Authority a tariff increase of
2,76% following extensive stakeholder engagement on an 18,1% application. The award was determined after
considering Transnet’s R1 billion rebate to identified categories of port users. The rebate serves primarily to
encourage exports of manufactured goods to create a balance between imports and exports. The Regulator
approved Transnet’s proposal for the allocation of the rebate.
National Ports Authority continued to pursue environmental excellence by, amongst others, further protecting
mangrove swamps in Durban and Richards Bay; enhancing biodiversity at the Port of Ngqura; and enforcing
pollution control measures at all ports.
Tug Palmiet, Sailing out to a vessel.

102
National Ports Authority (continued)
Transnet Freight RailNational Ports Authority (continued)
Performance indicators
2011Actual
2012Target
2012Actual
2013Target
Operational efficiency
Shipping delays (average hours if
ship is delayed)
– Tugs (All ports) hours 1,7 1,8 1,0 1,6
– Tugs (Durban Containers) hours 1,0 2,0 0,1 0,7
– Pilot (All ports) hours 1,3 1,8 1,3 1,6
– Pilot (Durban Containers) hours 0,5 1,4 0,0 0,5
– Berthing staff (All ports) hours 1,4 2,0 0,5 1,3
TEUs per STAT hour
– Durban TEUs/STAT hour 40 40 45 40
– Cape Town TEUs/STAT hour 26 27 46 46
– Port Elizabeth TEUs/STAT hour 36 36 32 37
– Ngqura TEUs/STAT hour nr 40 41 42
Ship turnaround time (Durban
Containers) hours 46 48 54 43
Vehicle units per STAT hour
– Durban Vehicles/STAT hour 46 44 53 44
– East London Vehicles/STAT hour 67 63 73 72
– Port Elizabeth Vehicles/STAT hour 78 72 80 74
Tons per STAT hour
– Richards Bay (Export coal) Tons/STAT hour 2 237 2 000 2 377 2 440
– Saldanha (Export iron ore) Tons/STAT hour 3 316 3 078 3 453 3 550
Service delivery
Anchorage waiting time
– Richards Bay average hours nm 33 48 30
– Durban average hours nm 45 63 46
– Port Elizabeth average hours nm 39 33 35
– Ngqura average hours nm 58 29 52
– Cape Town average hours nm 35 17 35
– Saldanha average hours nm 109 85 98
Security incidents
– Value of loss R million 2,3 1,5 8,1 ns
102

1032012 Integrated report
Na
tio
na
l Po
rts
Au
tho
rity
2011Actual
2012Target
2012Actual
2013Target
Volumes
– Containers 000 TEUs 4 081 4 319 4 352 4 821
– Break-bulk mt 8,7 10,3 8,6 11,5
– Liquid bulk million kilolitres 41,9 41,0 42,6 40,2
– Dry bulk mt 140,3 146,9 151,2 162,0
– Automotive units 617 592 453 990 674 776 609 618
Infrastructure
Capital investments(a) R million 2 031 2 444 1 749 2 376
B-BBEE procurement % 80 70 70 70
Financial value creation
EBITDA margin(b) % 72,8 75,6 69,7 64,7
Return on average total assets
(excluding CWIP)(c) % 9,6 10,9 7,7 6,8
Human capital
Number of employees (permanent) number 3 535 3 748 3 422 4 044
Training spend (% of personnel cost) % 4,0 5,6 4,3 4,0
Employment equity % 76 76 79 78
Employee turnover % 5,4 7,0 0,7 0,7
Revenue per employee R million 2,3 2,6 2,4 2,1
Safety, health and environment
DIFR rate 0,80 0,80 0,66 0,80
Number of disabling injuries number 32,0 30,0 25,0 zt
Employee fatalities number nil zt 0,0 zt
Public fatalities number nil zt 2 zt
Cost of risk % of revenue nr 1,9 2,0 1,9
Major environmental incidents
(level 1) number nil nil nil nil
(a) Excluding the capitalisation of borrowing costs.(b) EBITDA expressed as a percentage of revenue.(c) Profit from operations before impairment of assets, fair value adjustments, net finance costs and taxation expressed as a percentage of
average total assets excluding capital work-in-progress.nr not reported.nm not measured.zt zero tolerance.
Achieved or exceeded 2012 target. Achieved >95% of 2012 target. Achieved <95% of 2012 target.
1032012 Integrated report

104
National Ports Authority (continued)National Ports Authority (continued)
CAPITAL INVESTMENT
Implement a seven-year capital investment plan of R46,9 billion.
DCT berth 203 to 205 deepening.
Salisbury Island acquisition and container development.
Acquisition of land sites linked to Durban International Airport site.
Expansion of Cape Town Container Terminal.
GROWING VOLUMES
Formalised customer segmentation and defined value proposition.
Develop and implement Integrated Key Account Plans for main revenue
customers.
Execute National Ports Act section 56 process for Richards Bay Ship Repair Facility.
Complete pre-feasibility for the dry bulk and break-bulk expansion in
Richards Bay.
Complete pre-feasibility for the Richards Bay, Ngqura, Saldanha LNG Terminal.
Additional 500 000 tons of chrome ore capacity in Richards Bay through
optimisation.
Unlocking of additional volumes in Durban through stakeholder interface
– Coal 226 000 tons; manganese 203 740 tons; steel 100 000 tons;
automotive 7 000 units and short sea shipping 13 200 automotive units.
Develop feasibility for East London coal exports.
Promote Ngqura transshipment hub.
Prepare Ngqura manganese terminal development.
PRODUCTIVITY AND OPERATIONAL EFFICIENCIES
Establish oversight structure to focus on compliance and terminal
performance.
Improve the productive utilisation of port infrastructure assets and land.
Focus on marine services and terminal efficiencies to improve vessel
turnaround.
VOLUMES 2013 2019
DRY BULK INCREASE TO 162,0mt INCREASE TO 220,9mt
CONTAINERS INCREASE TO 4 821 million TEUs INCREASE TO 7 646 million TEUs
LIQUID BULK INCREASE TO 40,2 mkl INCREASE TO 48,8mkl
LOOKING AHEAD
104
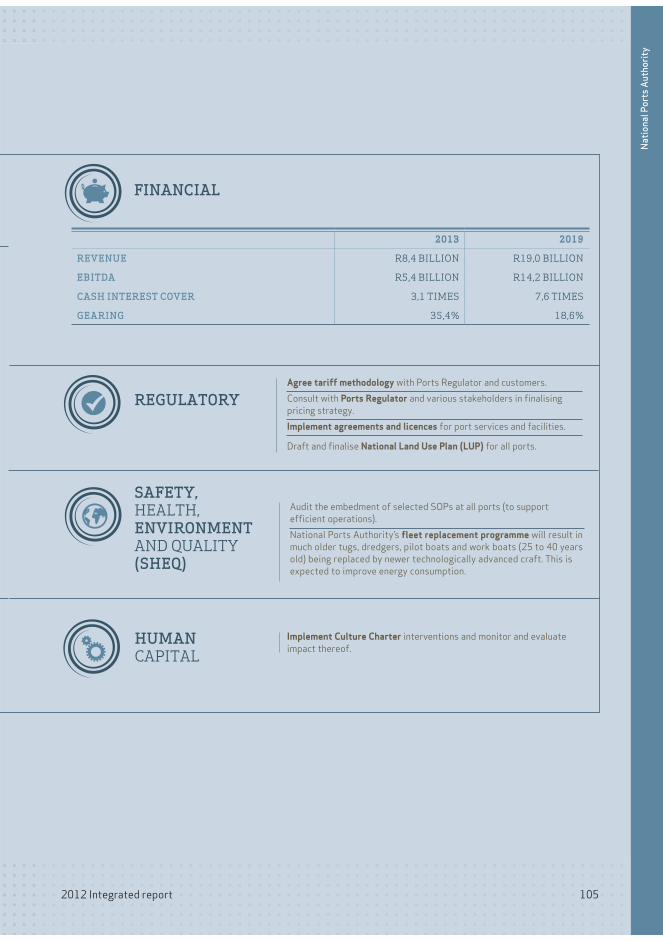
1052012 Integrated report
HUMAN CAPITAL
Implement Culture Charter interventions and monitor and evaluate
impact thereof.
REGULATORYAgree tariff methodology with Ports Regulator and customers.
Consult with Ports Regulator and various stakeholders in finalising
pricing strategy.
Implement agreements and licences for port services and facilities.
Draft and finalise National Land Use Plan (LUP) for all ports.
Audit the embedment of selected SOPs at all ports (to support
efficient operations).
National Ports Authority’s fleet replacement programme will result in
much older tugs, dredgers, pilot boats and work boats (25 to 40 years
old) being replaced by newer technologically advanced craft. This is
expected to improve energy consumption.
SAFETY, HEALTH, ENVIRONMENT AND QUALITY (SHEQ)
FINANCIAL
2013 2019
REVENUE R8,4 BILLION R19,0 BILLION
EBITDA R5,4 BILLION R14,2 BILLION
CASH INTEREST COVER 3,1 TIMES 7,6 TIMES
GEARING 35,4% 18,6%
Na
tio
na
l Po
rts
Au
tho
rity
1052012 Integrated report

106

12
PORT TERMINALS Po
rt T
erm
ina
ls

Port Terminals
TBU
Panamax ship-to-shore crane offloading a container vessel moored at Ngqura Container Terminal.
outh Africa has acknowledged the strategic role of ports and the necessity to promote effective and efficient transport throughout the logistics chain (Department of Transport, 2004). Furthermore, the post-sanction drive towards
an export-oriented economy has resulted in significant trade liberalisation and increasing advocacy of competitive markets and liberalisation of services in order to promote investment, economic growth and employment in South Africa through increased integration into the global economy. With more than 90% of world trade volumes being seaborne, and approximately 98% of South Africa’s exports conveyed by sea, South Africa’s commercial ports serve not only a strategic role through trade facilitation, but also help to shape the economic growth and development of the entire Southern African region.
S
108

Po
rt T
erm
ina
ls
HIGHLIGHTS CHALLENGES
OVERALL, PORT TERMINAL VOLUMES
WERE SIGNIFICANTLY HIGHER THAN
PRIOR YEAR.
OPERATIONAL EFFICIENCIES GENERALLY
REFLECTED SIGNIFICANT
IMPROVEMENTS
on prior year, with the exception of the
Durban Container Terminal – Pier 2.
344 ADDITIONAL JOBS WERE CREATED
DURING THE YEAR.
ELECTRICITY REGENERATION
recorded 20% regeneration on Liebherr
cranes at Port of Ngqura.
WHILE OPERATIONAL EFFICIENCIES
GENERALLY SHOWED A MARKED
IMPROVEMENT OVER THE PRIOR YEAR,
the Durban Container Terminal – Pier 2
reflected a marginal deterioration in all
measures of operational efficiency. This
was mainly due to aged equipment and
shortcomings of a change management
strategy in the implementation of the
NAVIS operating system. The NAVIS
system is now operating optimally and the
matter of aged equipment is being
addressed through accelerated capital
expenditure in these areas.
ALTHOUGH CAPITAL SPEND INCREASED
FROM THE PRIOR YEAR, IT WAS STILL
BELOW TARGET BY 12,7%.
1092012 Integrated report

110
Port Terminals (continued)
Operating division performance
Salient features
Year ended31 March
2012R million
Year ended31 March
2011R million
% change
Revenue 7 055 6 351 11,1
– Containers 3 799 3 495 8,7
– Bulk 2 051 1 611 27,3
– Break-bulk 711 826 (13,9)
– Automotive 494 419 17,9
Operating expenses (4 844) (4 163) 16,4
– Energy costs (379) (273) 38,8
– Maintenance (248) (208) 19,2
– Materials (316) (257) 23,0
– Personnel costs (2 519) (2 048) 23,0
– Other (1 382) (1 377) 0,4
Profit from operations before depreciation and amortisation and
items listed below (EBITDA) 2 211 2 188 1,1
Depreciation and amortisation (1 133) (998) 13,5
Profit from operations before items listed below 1 078 1 190 (9,4)
Impairments and fair value adjustments 2 (106) (101,9)
Net finance costs (315) (356) (11,5)
Profit before taxation 765 728 5,1
Total assets (excluding CWIP) R million 12 299 12 256 0,4
Profitability measures
EBITDA margin* % 31,3 34,5 (3,2)
Operating margin** % 15,3 18,7 (3,4)
Return on average total assets (excluding CWIP)*** % 8,8 10,5 (1,7)
Asset turnover (excluding CWIP)**** times 0,57 0,56 1,8
Capital investments^ R million 1 472 866 70,0
Employees
Number of employees (permanent) number 6 211 5 867 5,9
Revenue per employee R million 1,14 1,08 5,6
* EBITDA expressed as a percentage of revenue.** Profit from operations before impairment of assets, fair value adjustments, dividends received, net finance costs and taxation expressed as a
percentage of revenue.*** Profit from operations before impairment of assets, fair value adjustments, dividends received, net finance costs and taxation expressed as a
percentage of average total assets excluding capital work-in-progress.**** Revenue divided by average total assets excluding capital work-in-progress.^ Actual capital expenditure (replacement and expansion) excluding capitalised borrowing costs and including decommissioning liability.
110
1112012 Integrated report
Key business segments Port Terminals’ operations are structured into four key business segments, ie containers, dry bulk, break-bulk and
automotives of which the container and dry bulk segments contribute approximately 85% of volume revenue.
Most of the world’s major container shipping lines call at the container terminals in Durban, Ngqura,
Port Elizabeth and Cape Town.
The dry bulk volumes comprise iron ore, manganese, coal, magnetite, chrome, and various other commodity
exports. In addition, imports of vital raw material to harbour-bound and inland industries are handled through the
dry bulk terminals. Port Terminals’ dry bulk terminals thus play a vital part in the supply chain logistics in the South
African economy and customers include major mining houses and multi-national industries.
Port Terminals operates three car terminals in the ports of Durban, East London and Port Elizabeth. These
terminals supply diverse service offerings to numerous Original Equipment Manufacturers (OEMs). Port Terminals
also provides import services for most makes of vehicles that are sold in South Africa.
Break-bulk cargo is handled at all the multipurpose terminals, and customers vary from entrepreneurial emerging
businesses to established large corporations.
Port Terminals has a large market share in each of the sectors in which it operates. While the container and
automotive sectors currently face minimal competition in South Africa, competitive forces and the further
implementation of the National Ports Act are likely to place the Operating division under increasing competition.
Performance commentaryPort Terminals continues to grow volumes across all sectors, despite the impact of challenging global economic
conditions on international trade.
Revenue increased by 11,1% to R7,1 billion (2011: R6,4 billion) as a result of higher volumes handled and improved
operational efficiencies. Container volumes increased by 7,2% to 4 305 066 TEUs (2011: 4 016 564 TEUs); bulk
and break-bulk volumes increased by 6,6% to 82,9mt (2011: 77,8mt); and automotive volumes increased by
8,9% to 672 536 units (2011: 617 588 units). Moreover, a concerted focus by management resulted in significant
operational efficiency improvements in both container and bulk handling.
Port Terminals' primary measure of container efficiency, average moves per gross crane hour (GCH) increased by
8,1% from 24,6 GCH in the prior year to 26,6 GCH. In addition, the average tons loaded per hour at the Saldanha
iron ore terminal has increased by 4,1% from 6,959 tons per hour to 7,242 tons per hour, and the Richards Bay
dry bulk terminal’s loading rate has increased by 2,7% from 660 tons per hour in 2011 to 678 tons per hour in the
current year.
Net operating expenses increased by 16,4% to R4,8 billion (2011: R4,2 billion) mainly due to a 23,0% increase in
personnel costs, a 38,8% increase in energy costs, and a 23,0% increase in material costs as a result of
increased maintenance activity levels.
Consequently, EBITDA increased by 1,1% to R2,2 billion (2011: R2,2 billion).
Port Terminals' waste management initiatives included recycling 6 552 tons of scrap metal and 235 000 litres
of used oil.
Po
rt T
erm
ina
ls
1112012 Integrated report

112
Performance indicators
2011Actual
2012Target
2012Actual
2013Target
Operational efficiency
Gross crane moves per hour
– DCT Pier 2 (excluding east quay) number 23 28 21 28
– DCT Pier 1 number 26 30 27 30
– CTCT number 25 25 28 32
– PECT number 25 25 27 25
– NCT number 24 30 30 32
Moves per ship working hour
– DCT Pier 2 (excluding east quay) number 47 68 42 55
– DCT Pier 1 number 40 50 44 53
– CTCT number 46 46 57 48
– PECT number 37 38 38 38
– NCT number 40 44 47 50
Tons per hour
– Tons loaded per hour – Saldanha IOT** tons 6 959 6 896 7 242 7 880
– Tons loaded per hour – Richards Bay DBT tons 660 600 678 700
– Tons offloaded per hour – Richards Bay DBT tons 425 450 445 500
Truck turnaround time
– DCT Pier 2 minutes 46 38 44 35
– DCT Pier 1 minutes 45 35 43 35
Volumes
Containers 000 TEUs 4 017 4 319 4 305 4 897
Break-bulk mt 10,3 8,3 8,9 10,3
Bulk mt 67,5 72,9 74,0 82,0
Automotive units 617 588 453 990 672 536 609 618
Infrastructure
Capital investments(a) R million 866 1 686 1 472 2 551
B-BBEE procurement % 80 65 75 75
Financial value creation
EBITDA margin(b) % 34,5 32,5 31,3 32,0
Return on average total assets (excluding
CWIP)(c)% 10,5 10,1 8,8 11,6
Port Terminals (continued)
112

1132012 Integrated report
Po
rt T
erm
ina
ls
Performance indicators (continued)
2011Actual
2012Target
2012Actual
2013Target
Human capital
Number of employees (permanent) number 5 867 6 292 6 211 8 183
Training spend (% of personnel cost) % 3,7 4,0 4,7 2,8
Employment equity % 80 75 80 75
Employee turnover % 5,5 7,0 5,1 7,6
Absenteeism % 5,3 4,4 4,6 4,0
Safety, health and environment
DIFR rate 0,51 0,62 0,62 0,80
Safety incidents number 1 436 1 091 1 684 1 348
Employee fatalities number 1 zt 1 zt
Public fatalities number nil zt – zt
Security incidents number 200 160 144 130
Value of loss R million 0,9 0,7 0,3 0,2
Major environmental incidents number nil nil nil nil
Employees registered on HIV/Aids
programme number 218 ns 143 ns
Cost of risk
% of
revenue ns 3,60 3,04 3,24
** Blended loading rate based on dual (85%) and single (15%) loading.(a) Excluding the capitalisation of borrowing costs and including decommissioning liability.(b) EBITDA expressed as a percentage of revenue.(c) Profit from operations before impairment of assets, fair value adjustments, net finance costs and taxation expressed as a percentage of
average total assets excluding capital work-in-progress. zt zero tolerance.ns not set.
Achieved or exceeded 2012 target. Achieved >95% of 2012 target. Achieved <95% of 2012 target.
1132012 Integrated report
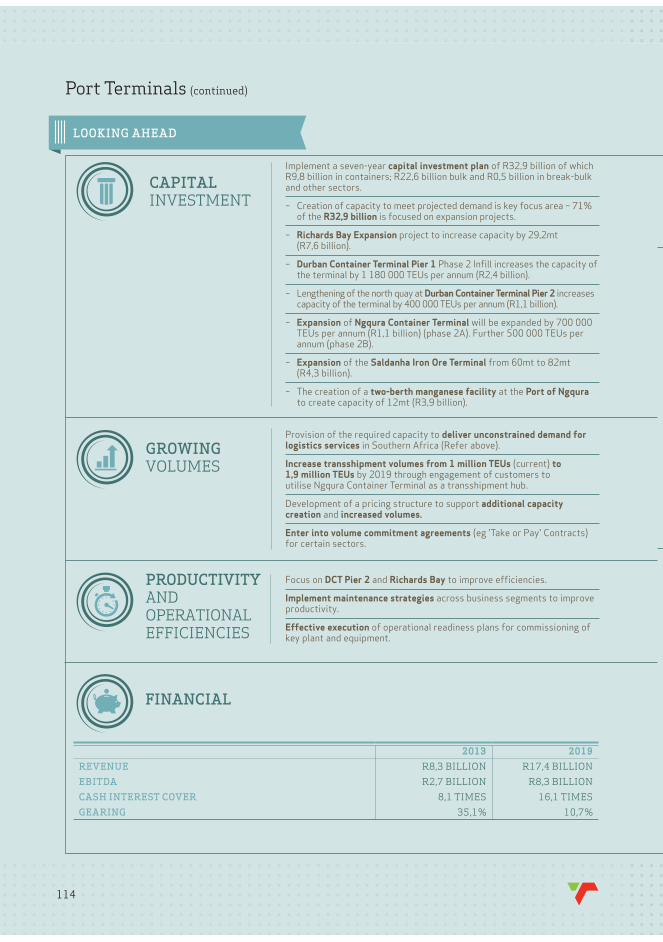
114
Transnet Freight RailPort Terminals (continued)
CAPITAL INVESTMENT
Implement a seven-year capital investment plan of R32,9 billion of which R9,8 billion in containers; R22,6 billion bulk and R0,5 billion in break-bulk and other sectors.
– Creation of capacity to meet projected demand is key focus area – 71% of the R32,9 billion is focused on expansion projects.
– Richards Bay Expansion project to increase capacity by 29,2mt (R7,6 billion).
– Durban Container Terminal Pier 1 Phase 2 Infill increases the capacity of the terminal by 1 180 000 TEUs per annum (R2,4 billion).
– Lengthening of the north quay at Durban Container Terminal Pier 2 increases capacity of the terminal by 400 000 TEUs per annum (R1,1 billion).
– Expansion of Ngqura Container Terminal will be expanded by 700 000 TEUs per annum (R1,1 billion) (phase 2A). Further 500 000 TEUs per annum (phase 2B).
– Expansion of the Saldanha Iron Ore Terminal from 60mt to 82mt (R4,3 billion).
– The creation of a two-berth manganese facility at the Port of Ngqura to create capacity of 12mt (R3,9 billion).
GROWING VOLUMES
Provision of the required capacity to deliver unconstrained demand for logistics services in Southern Africa (Refer above).
Increase transshipment volumes from 1 million TEUs (current) to 1,9 million TEUs by 2019 through engagement of customers to utilise Ngqura Container Terminal as a transshipment hub.
Development of a pricing structure to support additional capacity creation and increased volumes.
Enter into volume commitment agreements (eg 'Take or Pay' Contracts) for certain sectors.
PRODUCTIVITY AND OPERATIONAL EFFICIENCIES
Focus on DCT Pier 2 and Richards Bay to improve efficiencies.
Implement maintenance strategies across business segments to improve productivity.
Effective execution of operational readiness plans for commissioning of key plant and equipment.
2013 2019
REVENUE R8,3 BILLION R17,4 BILLION
EBITDA R2,7 BILLION R8,3 BILLION
CASH INTEREST COVER 8,1 TIMES 16,1 TIMES
GEARING 35,1% 10,7%
FINANCIAL
LOOKING AHEAD
114

1152012 Integrated report
REGULATORY
Port Terminals has deemed licences (as per the National Ports Act) at all terminals except Ngqura, where a licence agreement is in place for a fixed duration. These will be converted to long-term licences in 2012.
Cabinet approved the decision to direct the National Ports Authority to license Port Terminals to operate the Ngqura Container Terminal for a limited period of three years.
HUMAN CAPITAL
Establishment and mobilisation of the People Transformation Unit to change the culture of operations by realigning employees’ vision with the strategic intent and values of the organisation.
Development and rollout of the People Transformation project such as Mission Directed Work Teams.
Improve employment by 48% over seven years.
To close the gap between the supply and demand of skills through increased investment in human resources.
Accelerate skills development through training and development programmes.
SAFETY, HEALTH, ENVIRONMENT AND QUALITY (SHEQ)
Promotion of value driven and proactive safety leadership and progressive change of human factors to improve safety awareness and behaviour.
Management and monitoring of three key safety performance indicators, namely: safety incidents, cost of risk and DIFR.
Support achievement of fitness for duty and prevent illness and uncontrolled, unplanned absences through implementation of the 'Five S’s of Health' programme (Systems, Surveillance, Sharing of lessons learned, Sanitation and Self-care).
Define, strengthen and support strategy and direction of integrated SERQ/RS management system for all elements, namely: occupation, health and safety, environmental, quality and railway safety management.
Environmental emphasis on bulk terminals (Saldanha, Richards Bay and Port Elizabeth), where environmental challenges are prevalent.
Historical reviews of electrical consumption and engagement of specialists to reduce usage.
Improved fuel consumption with straddle carrier replacement programme.
Reverse osmosis plant in Saldanha to be commissioned in 2013.
Appointed third-party specialists to manage the waste activities nationwide and to initiate a recycling programme.
Po
rt T
erm
ina
ls
1152012 Integrated report

116

117
PIPELINES
Pip
eli
ne
s

Pipelines
Durban pipelines, pumpstation 1.
ipelines, established in 1965, owns and operates South Africa’s 3 800 kilometres of strategic petroleum and gas pipeline infrastructure, traversing five provinces with the strategic objective of ensuring security of supply of petroleum products
to the inland market.
The pipeline system is the preferred mode of transportation of petroleum products as it is most efficient to carry large volumes, environmentally friendly and reliable. The business is regulated by the National Energy Regulator of South Africa (Nersa) and is governed by the Petroleum Pipelines Act, No 60 of 2003 (Petroleum Pipelines Act), and the Gas Act, No 48 of 2001 (Gas Act).
P
118
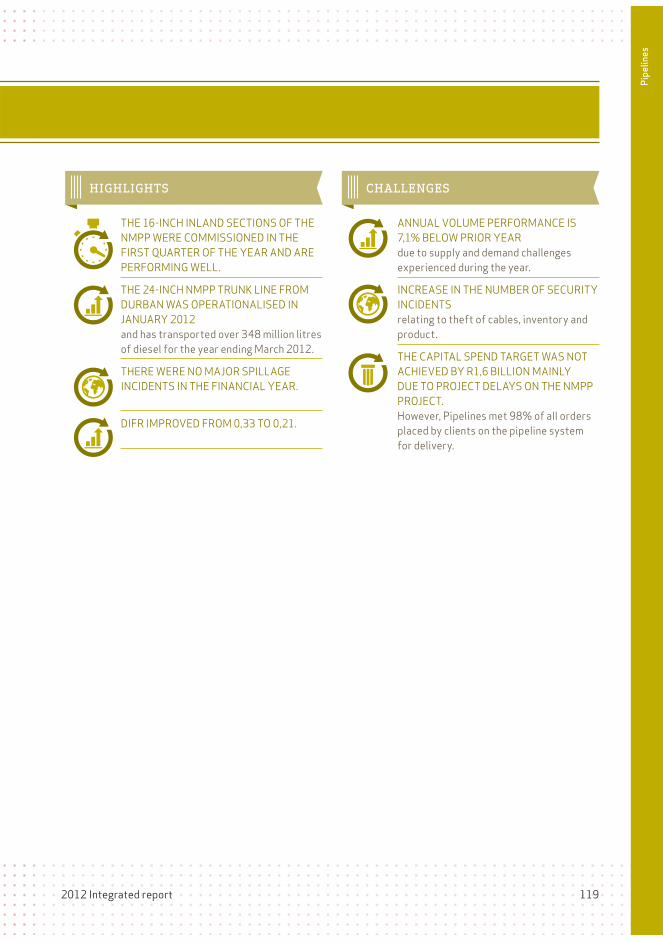
Pip
eli
ne
s
HIGHLIGHTS CHALLENGES
THE 16-INCH INLAND SECTIONS OF THE
NMPP WERE COMMISSIONED IN THE
FIRST QUARTER OF THE YEAR AND ARE
PERFORMING WELL.
THE 24-INCH NMPP TRUNK LINE FROM
DURBAN WAS OPERATIONALISED IN
JANUARY 2012
and has transported over 348 million litres
of diesel for the year ending March 2012.
THERE WERE NO MAJOR SPILLAGE
INCIDENTS IN THE FINANCIAL YEAR.
DIFR IMPROVED FROM 0,33 TO 0,21.
ANNUAL VOLUME PERFORMANCE IS
7,1% BELOW PRIOR YEAR
due to supply and demand challenges
experienced during the year.
INCREASE IN THE NUMBER OF SECURITY
INCIDENTS
relating to theft of cables, inventory and
product.
THE CAPITAL SPEND TARGET WAS NOT
ACHIEVED BY R1,6 BILLION MAINLY
DUE TO PROJECT DELAYS ON THE NMPP
PROJECT.
However, Pipelines met 98% of all orders
placed by clients on the pipeline system
for delivery.
1192012 Integrated report

120
Pipelines (continued)
120
Operating division performance
Salient features
Year ended31 March
2012R million
Year ended31 March
2011R million
% change
Revenue 2 096 1 129 85,7
– Refined and synthetics 1 023 774 32,2
– Aviation fuel 38 35 8,6
– Crude 837 433 93,3
– Gas 121 112 8,0
– Handling 63 39 61,5
– Other 66 – > 100
– Clawback and petroleum levy (52) (264) (80,3)
Operating expenses (594) (432) 37,5
– Energy costs (154) (56) 175,0
– Maintenance (44) (40) 10,0
– Materials (12) (11) 9,1
– Personnel costs (266) (217) 22,6
– Other costs (118) (108) 9,3
Profit from operations before depreciation and amortisation and
items listed below (EBITDA) 1 502 697 115,5
Depreciation and amortisation (383) (330) 16,1
Profit from operations before items listed below 1 119 367 204,9
Impairments and fair value adjustments 13 (10) 230,0
Net finance costs 150 118 27,1
Profit before taxation 1 282 475 169,9
Total assets (excluding CWIP) R million 19 285 5 476 252,2
Profitability measures
EBITDA margin* % 71,7 61,7 10,0
Operating margin** % 53,4 32,5 20,9
Return on average total assets (excluding CWIP)*** % 9,0 7,0 2,0
Asset turnover (excluding CWIP)**** times 0,17 0,22 (22,7)
Capital investments^ R million 4 507 6 077 (25,8)
Employees
Number of employees (permanent) number 631 567 11,3
Revenue per employee R million 3,32 1,99 66,8
* EBITDA expressed as a percentage of revenue.** Profit from operations before impairment of assets, fair value adjustments, net finance costs and taxation expressed as a percentage of revenue.*** Profit from operations before impairment of assets, fair value adjustments, net finance costs and taxation expressed as a percentage of average
total assets excluding capital work-in-progress.**** Revenue divided by average total assets excluding capital work-in-progress.^ Actual capital expenditure (replacement + expansion) excluding capitalised borrowing costs and including capitalised decommissioning liability.

1212012 Integrated report
Pip
eli
ne
s
1212012 Integrated report
Performance commentaryTransnet’s petroleum and gas pipelines division celebrated the commissioning of three pipeline sections of the
New Multi-Product Pipeline (NMPP) during the year, namely: Kendal to Waltloo, Jameson Park to Alrode and Alrode
to Langlaagte. The 24-inch trunk line was commissioned in January 2012. With the pipeline and pump station
aspects of the NMPP project now complete, Transnet Capital Projects will focus on the completion of the coastal
and inland terminals in Durban and Jameson Park in Gauteng, with the final stages to be completed by December
2013. The NMPP trunk line is Transnet’s technologically advanced 555 kilometre pipeline between Durban and
Gauteng.
Revenue for the year increased by 85,7% to R2,1 billion (2011: R1,1 billion). This is mainly due to the 59% increase
in allowable revenue including the F-factor granted by Nersa in its 2011/12 Tariff Determination.
Volume performance is 7,1% below the prior year. The combination of supply and demand challenges
contributed significantly to the underperformance for the year. However, Pipelines met 98% of all orders
placed on the pipeline system for delivery.
Net operating expenses, increased by 14,6% (excluding the reversal of the energy provision in the prior year).
This increase is mainly attributable to an electricity tariff increase, as well as maintenance on the ageing
pipeline network.
Consequently, EBITDA increased by 115,5% to R1,5 billion (2011: R697 million).
Durban pipelines, pumpstation 1, manifold, outside of sampling area, (L) Pat Sibeko, Controller and (R) Sammy Wilkie, Assistant.
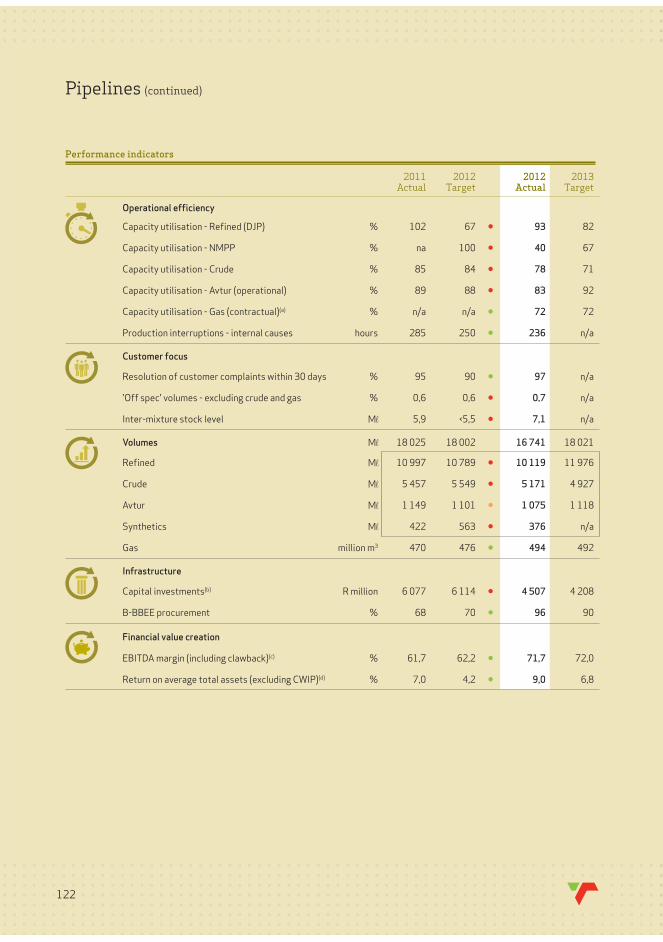
122
Pipelines (continued)
Transnet Freight RailPipelines (continued)
Performance indicators
2011Actual
2012Target
2012Actual
2013Target
Operational efficiency
Capacity utilisation - Refined (DJP) % 102 67 93 82
Capacity utilisation - NMPP % na 100 40 67
Capacity utilisation - Crude % 85 84 78 71
Capacity utilisation - Avtur (operational) % 89 88 83 92
Capacity utilisation - Gas (contractual)(a) % n/a n/a 72 72
Production interruptions - internal causes hours 285 250 236 n/a
Customer focus
Resolution of customer complaints within 30 days % 95 90 97 n/a
'Off spec' volumes - excluding crude and gas % 0,6 0,6 0,7 n/a
Inter-mixture stock level Ml 5,9 <5,5 7,1 n/a
Volumes Ml 18 025 18 002 16 741 18 021
Refined Ml 10 997 10 789 10 119 11 976
Crude Ml 5 457 5 549 5 171 4 927
Avtur Ml 1 149 1 101 1 075 1 118
Synthetics Ml 422 563 376 n/a
Gas million m3 470 476 494 492
Infrastructure
Capital investments(b) R million 6 077 6 114 4 507 4 208
B-BBEE procurement % 68 70 96 90
Financial value creation
EBITDA margin (including clawback)(c) % 61,7 62,2 71,7 72,0
Return on average total assets (excluding CWIP)(d) % 7,0 4,2 9,0 6,8
122

1232012 Integrated report
Pip
eli
ne
s
2011Actual
2012Target
2012Actual
2013Target
Human capital
Number of employees (permanent) number 567 650 631 660
Training spend (% of personnel cost) (incl NMPP) % 5,1 7,0 12,6 9,2
Employment equity % 77 75 81 80
Employee turnover % 4,0 6,0 5,9 6,0
Absenteeism % 1,2 1,4 1,6 1,7
Safety, health and environment
DIFR rate 0,33 0,80 0,21 0,80
Safety incidents number 76 23 22 31
Security incidents number 72 28 61 54
Employee fatalities number nil zt nil zt
Public fatalities number nil zt nil zt
Employees registered on HIV/Aids programme number 26 26 26 26
Cost of risk(e)
% of
revenue n/a 4,42 2,22 3,0
Spillage incidents number 6 10 3 n/a
Electricity consumption(f)
kWh/
Ml.km na na 31 32
(a) From 2012 capacity utilisation – Gas is measured in actual available capacity as opposed to the previous contractual capacity.(b) Excluding the capitalisation of borrowing costs and including the capitalisation of decommissioning liability.(c) EBITDA expressed as a percentage of revenue.(d) Profit from operations before impairment of assets, fair value adjustments, net finance costs and taxation expressed as a
percentage of average total assets excluding capital work-in-progress.(e) Cost of risk was not applicable in 2011, it replaced cost of losses.(f) From 2012 electricity consumption is measured in kWh per Ml.km as opposed to the previous MWh.n/a not applicable.zt zero tolerance.
Achieved or exceeded 2012 target. Achieved >95% of 2012 target. Achieved <95% of 2012 target.
1232012 Integrated report

124
Pipelines (continued)PipelinesPipelines (continued)PipelinesPipelines (continued)
LOOKING AHEAD
CAPITAL INVESTMENT
Implement a seven-year capital investment plan of R11,4 billion (excluding capitalised borrowing costs).
Enhanced focus by the NMPP Steering Committee to monitor progress against schedules and budgets.
Change the operating model of the NMPP project until terminal one is completed.
Accelerate the execution of telecontrol, security and fire upgrade projects.
GROWING VOLUMES
Determine customer requirements for pipeline capacity.
Forecast market demand and improved marketing.
Liaise with the Government of Botswana to establish needs and continuity of supply ex Tarlton.
Future of the DJP to be determined.
VOLUMES 2013 2019
REFINED PRODUCTS INCREASE TO 11 976 ml INCREASE TO 13 781 ml
CRUDE DECREASE TO 4 927 ml DECREASE TO 4 964 ml
AVTUR INCREASE TO 1 118 ml INCREASE TO 1 436 ml
TOTAL PETROLEUM INCREASE TO 18 021 ml INCREASE TO 20 180 ml
GAS INCREASE TO 492 mm3 INCREASE TO 592 mm3
PRODUCTIVITY AND OPERATIONAL EFFICIENCIES
Embed operating and maintenance philosophy.
Containment costs while running both the DJP and NMPP.
Stabilise and sustain NMPP operation.
Ensure focused maintenance on the DJP.
Optimise scheduling of both lines.
Optimise jet to ORTIA at 24 ml/wk.
Optimise DJP and NMPP usage up to a level of 112 ml/wk.
Operationalise and optimise the future use of rail tank cars at Tarlton to Botswana.
Renegotiate contract with Sasol Gas on Lily pipelines.
Implement 'shutdown' philosophy at depots.
Procure critical spares holding.
2013 2019
REVENUE R3,0 BILLION R6,2 BILLION
EBITDA R2,2 BILLION R4,8 BILLION
CASH INTEREST COVER 2,9 TIMES 9,2 TIMES
GEARING 51,1% 10,9%
FINANCIAL
124

1252012 Integrated report
SAFETY, HEALTH, ENVIRONMENT AND QUALITY (SHEQ)
Reduce the number of safety incidents (2013: 31) to target below 17 in 2019.
Review site-specific SHEQ risk assessments and ensure appropriate controls are in place.
Roll out a behaviour-based safety programme.
Target an improved DIFR rating of 0,80 for 2013, improving to 0,3 in 2019.
Review statutory training programmes and perform ongoing policy and procedure reviews.
Implement hearing conservation programme.
Convert some motors to variable speed electric motors for improved pump efficiency.
Implement power factor correction on electric motors.
Implement air quality, water and waste management initiatives.
Continue to execute the Environmental Management Plan.
Establish a biodiversity offset area around the Jameson Park fuel terminal (this area is demarcated by the Lesedi municipality as an environmentally sensitive area and it has protected species. In accordance with Pipelines’ EIA approval, the biodiversity offset area must protect the species and area).
HUMAN CAPITAL
Implement a workforce plan.
Develop and implement capacity-building plans and retention strategies.
Develop plan to provide training to sub-Saharan countries.
In filling vacancies target demographics that positively impact equity.
Investigate the business model of the refractionator as unregulated business.
Participate in investigation for the import terminal in Durban.
Work with successful tenderers on TM1 and TCP on Supplier Development plans to ensure that the local community is fully involved in the project.
Physical security – ensuring compliance with National Key Point requirements.
Improve B-BBEE rating to Level 3 by 2013.
REGULATORYAgree on guidelines with the National Energy Regulator of South Africa (Nersa), specifically:
– Allowable costs.
– Benchmarking philosophy.
Pip
eli
ne
s
1252012 Integrated report

126
Consolidated income statement
Summary financial statements#
for the year ended 31 March 2012
(in R million) 31 March 2012 31 March 2011Continuing operations
Revenue 45 900 37 952
Net operating expenses excluding depreciation and amortisation (27 018) (22 189)
Profit from operations before depreciation, amortisation and items listed below
(EBITDA) 18 882 15 763
Depreciation and amortisation (8 355) (7 184)
Profit from operations before the items listed below: 10 527 8 579
Impairment of assets (342) (537)
Post-retirement benefit obligation income/(costs) 31 (155)
Fair value adjustments (202) 625
(Loss)/income from associates and joint ventures (6) 58
Profit from operations before net finance costs 10 008 8 570
Finance costs (4 255) (3 439)
Finance income 488 561
Profit before taxation 6 241 5 692
Taxation (2 122) (1 508)
Profit for the year from continuing operations 4 119 4 184
Discontinued operations
Loss from discontinued operations – (71)
Profit for the year 4 119 4 113
# Refer to volume 2 for detailed annual financial statements.
Appendix A
Approval and preparationThe audited condensed financial information has been prepared under the supervision of the Group Chief Executive and has been audited in compliance with applicable requirements of the Companies Act, No 71, 2008.
Group accounting policiesThe condensed financial information has been prepared in compliance with the framework concepts and the
measurement and recognition requirements of International Financial Reporting Standards (IFRS) containing
the information required by International Accounting Standard (IAS) 34: Interim Financial Reporting as well as
in accordance with the requirements of the Companies Act, No 71, 2008.
Financial information presented has been prepared using accounting policies that comply with International
Financial Reporting Standards. The accounting policies are consistent with those applied in the annual financial
statements for the year ended 31 March 2011.
New standards and interpretations issued by the International Accounting Standards Board effective for the
year under review did not have a material impact on the Group’s financial results.

1272012 Integrated report
Consolidated statement of financial positionas at 31 March 2012
Ap
pe
nd
ix A
As at(in R million) 31 March 2012 31 March 2011 31 March 2010 ASSETS
Non-current assets 165 380 146 243 120 845
Property, plant and equipment 155 953 137 836 113 579
Investment properties 7 732 7 368 6 604
Intangible assets 586 464 421
Investments in associates and joint ventures 72 81 21
Derivative financial assets 467 15 11
Long-term loans and advances 2 11 37
Other investments and long-term financial assets 568 468 172
Current assets 12 625 20 827 18 040
Inventories 2 591 2 257 2 048
Trade and other receivables 5 615 5 503 5 859
Current taxation asset 209 303 –
Derivative financial assets 35 30 28
Other short-term investments 2 755 1 566 1 670
Cash and cash equivalents 1 189 10 876 7 918
12 394 20 535 17 523
Assets classified as held-for-sale 231 292 517
Total assets 178 005 167 070 138 885
EQUITY AND LIABILITIES
Capital and reserves 79 421 73 666 63 347
Issued capital 12 661 12 661 12 661
Reserves 66 760 61 005 50 686
Non-current liabilities 79 846 72 660 60 179
Employee benefits 3 322 3 232 3 451
Long-term borrowings 52 566 50 452 42 736
Derivative financial liabilities 82 558 366
Long-term provisions 1 626 1 174 1 054
Deferred taxation liabilities 18 050 15 415 12 473
Other non-current financial liabilities 4 200 1 829 99
Current liabilities 18 738 20 744 15 359
Trade payables and accruals* 11 151 9 733 9 533
Short-term borrowings 5 566 9 578 4 698
Current taxation liability – – 171
Derivative financial liabilities 62 92 183
Short-term provisions 934 672 694
Other current financial liabilities* 1 025 660 65
18 738 20 735 15 344
Liabilities directly associated with assets classified as held-for-sale – 9 15
Total equity and liabilities 178 005 167 070 138 885
* Short-term deferred income relating to regulated clawbacks has been reallocated from trade payables and accruals to other current financial liabilities (March 2011: R660 million, March 2010: R65 million).

128
Consolidated statementsfor the year ended 31 March 2012
Statement of cash flows(in R million) 31 March 2012 31 March 2011
Cash flows from operating activities 17 910 13 159
Cash generated from operations 20 616 16 159
Security of supply petroleum levy 1 315 1 315
Changes in working capital 781 792
Cash generated from operations after changes in working capital 22 712 18 266
Finance costs (4 233) (3 428)
Finance income 407 466
Taxation paid (95) (1 379)
Settlement of post-retirement benefit obligations (270) (268)
Derivatives settled and raised (611) (498)
Cash flows utilised in investing activities (24 661) (23 018)
Investments to maintain operations (10 367) (10 423)
Investments to expand operations (13 194) (12 730)
Changes in investments, loans, advances and other investing activities (1 100) 135
Cash flows (utilised in)/from financing activities (2 936) 12 791
Borrowings raised 11 110 18 418
Borrowings repaid (14 046) (5 627)
Net (decrease)/increase in cash and cash equivalents (9 687) 2 932
Cash and cash equivalents at the beginning of the year 10 876 7 944
Total cash and cash equivalents at the end of the year 1 189 10 876
Appendix A (continued)
Statement of comprehensive income(in R million) 31 March 2012 31 March 2011
Profit for the year 4 119 4 113
Other comprehensive income 2 338 8 545
Exchange differences on translation of foreign operations 1 (6)
Gains on revaluations 2 899 8 690
(Loss)/gain on cash flow hedges (61) 65
Actuarial loss on post-retirement benefit obligations (501) (204)
Taxation relating to components of other comprehensive income (702) (2 339)
Other comprehensive income for the year, net of taxation 1 636 6 206
Total comprehensive income for the year 5 755 10 319

1292012 Integrated report
Headline earnings summarised reconciliation(in R million) 31 March 2012 31 March 2011
Profit for the year attributable to the equity holder 4 119 4 113
Profit on the disposal of property, plant and equipment (39) (33)
Total remeasurements (268) (319)
Impairment and loss on disposal of discontinued operations – 30
Investment property fair value adjustments (353) (637)
Impairment of property, plant and equipment 150 291
Impairment reversal of assets held-for-sale (66) –
Impairment/(reversal of impairment) of associates 1 (3)
Total taxation effects of adjustments 53 17
Headline earnings 3 865 3 778
Statement of changes in equity
(in R million)
Issued capital
Revaluationreserve
Foreign currency
translation reserve
Actuarial gains
and losses
Cash flowhedgingreserve
Other reserve
Retainedearnings Total
Opening balances as
at 1 April 2010 12 661 22 319 25 2 495 (79) 249 25 677 63 347
Other
comprehensive
income for the year
(net of taxation) – 6 312 (6) (147) 47 – 4 113 10 319
Transfer to retained
earnings (net of
taxation) – (84) – – – – 84 –
Balances as at
31 March 2011 12 661 28 547 19 2 348 (32) 249 29 874 73 666
Other
comprehensive
income for the year
(net of taxation) – 2 042 1 (363) (44) – 4 119 5 755
Transfer from
retained earnings
(net of taxation) – (31) – – – – 31 –
Balances as at
31 March 2012 12 661 30 558 20 1 985 (76) 249 34 024 79 421
Ap
pe
nd
ix A

130
Segmental informationfor the year ended 31 March 2012
Appendix A (continued)
Events after the reporting period dateSubsequent to the reporting period date:
the old Durban International Airport site from the Airports Company of South Africa (ACSA). The total cost
of the acquisition is R1,85 billion and an amount of R1,2 billion was paid on 31 March 2012.
R200 million.
No other events have occurred after the reporting period date that would have a material impact on reported
results.
Transnet Freight Rail
Transnet Rail Engineering
Transnet National Ports Authority
(in R million)
31 March 2012
31 March 2011
31 March 2012
31 March 2011
31 March 2012
31 March 2011
External revenue 27 371 22 310 1 477 661 7 423 7 343
Internal revenue 287 297 9 789 8 665 834 718
Total revenue 27 658 22 607 11 266 9 326 8 257 8 061
Earnings before interest, taxation, depreciation and amortisation (EBITDA) 10 541 8 144 1 042 1 151 5 753 5 866
Total assets*** 65 851 55 466 8 400 6 944 64 313 60 956
Total liabilities*** 38 712 33 925 5 179 3 802 33 598 29 850
Capital expenditure** 14 792 12 542 722 532 1 749 2 031
Cash generated from operations after changes in working capital# 13 056 7 660 1 298 1 588 7 440 6 770
* Other includes other segments, inter-unit eliminations and consolidation adjustments.** Capital expenditure excludes the effects of borrowing costs, includes capitalised leases and decommissioning liabilities.*** Excludes assets and liabilities held-for-sale.# Includes an amount of R1 315 million relating to the levy on the NMPP.

1312012 Integrated report
Ap
pe
nd
ix A
External auditor’s audit opinionThe Group’s external auditors have issued their opinion on the Group’s financial statements for the year ended
31 March 2012. The audit was performed in accordance with International Standards on Auditing. They have
issued an unmodified audit opinion. These condensed results have been derived from the Group annual
financial statements and are consistent in all material respects, with the Group annual financial statements.
A copy of the external audit report is available for inspection at the Company’s registered office. Any
reference to future financial performance and operational information included in this announcement, has not
been audited or reported on by the Group’s external auditors.
Transnet Port Terminals
Transnet Pipelines
Total reportable segments Other* Total Transnet
31 March 2012
31 March 2011
31 March 2012
31 March 2011
31 March 2012
31 March 2011
31 March 2012
31 March 2011
31 March 2012
31 March 2011
7 053 6 349 2 093 1 128 45 417 37 791 483 161 45 900 37 952
2 2 3 1 10 915 9 683 (10 915) (9 683) – –
7 055 6 351 2 096 1 129 56 332 47 474 (10 432) (9 522) 45 900 37 952
2 211 2 188 1 502 697 21 049 18 046 (2 167) (2 283) 18 882 15 763
13 504 12 856 24 760 19 355 176 828 155 577 946 11 201 177 774 166 778
7 084 6 637 14 674 13 530 99 247 87 744 663 5 651 98 584 93 395
1 472 866 4 507 6 077 23 242 22 048 (983) (544) 22 259 21 504
2 506 2 424 2 917 3 450 27 217 21 892 (4 505) (3 626) 22 712 18 266

132
Consolidated five-year reviewfor the year ended 31 March 2012
March 2012
R million
March 2011
R million
March 2010
R million
March 2009
R million
March 2008
R million
Income statementContinuing operations
Revenue 45 900 37 952 35 610 33 592 30 091
Earnings before interest, taxation,
depreciation and amortisation (EBITDA) 18 882 15 763 14 409 13 200 12 810
Depreciation and amortisation (8 355) (7 184) (6 089) (4 779) (3 798)
Operating profit 10 527 8 579 8 320 8 421 9 012
Impairment of assets (342) (537) (778) (324) (153)
Post-retirement benefit obligation income/(costs) 31 (155) (180) ( 436) 686
Fair value adjustments (202) 625 (18) 941 1 416
(Loss)/income from associates and joint ventures and dividends received (6) 58 5 82 63
Net finance costs (3 767) (2 878) (2 436) (1 966) (1 931)
Profit before taxation 6 241 5 692 4 913 6 718 9 093
Taxation (2 122) (1 508) (1 763) (1 492) (2 615)
Profit for the year 4 119 4 184 3 150 5 226 6 478
Statement of financial position
Non-current assets 165 380 146 243 120 845 103 417 84 220
Current assets 12 625 20 827 18 040 15 117 14 466
Total assets 178 005 167 070 138 885 118 534 98 686
Equity 79 421 73 666 63 347 57 276 49 949
Non-current liabilities 79 846 72 660 60 179 44 256 29 230
Current liabilities 18 738 20 744 15 359 17 002 19 507
Total liabilities 98 584 93 404 75 538 61 258 48 737
Equity and liabilities 178 005 167 070 138 885 118 534 98 686
Capital investments** 22 259 21 504 18 441 19 382 15 780
Statement of cash flowsCash flows from operating activities 17 910 13 159 12 092 7 400 10 287
Cash flows utilised in investing activities (24 661) (23 018) (20 408) (19 084) (8 250)
Cash flows (utilised in)/from financing activities (2 936) 12 791 10 355 11 587 9
Net (decrease)/increase in cash and cash equivalents (9 687) 2 932 2 039 (97) 2 046
** Excludes capitalised borrowing costs, includes capitalised finance leases and capitalised decommissioning liabilities.
Appendix B

1332012 Integrated report
Consolidated value added statementfor the year ended 31 March 2012
Ap
pe
nd
ix B
2012 Value 2011 Value apportioned apportioned
R million % R million %
Revenue 45 900 37 952
Cost of materials and services (12 955) (10 349)
Net operating expenses excluding depreciation and amortisation (27 018) (22 189)
– Excluding: Personnel costs 14 063 11 840
Value added by operations 32 945 99 27 603 96
Other income 280 1 1 244 4
– Fair value adjustments (202) 625
– (Loss)/income from associates ( 6) 58
– Investment and other income 488 561
Value created 33 225 100 28 847 100
Applied as follows:
Employees 14 032 42 11 995 42
– Personnel costs 14 063 11 840
– Post-retirement benefit obligation (income)/costs ( 31) 155
Providers of capital# 4 255 13 3 439 12
– Lending institutions 4 255 3 439
Government 189 1 905 3
– South African normal taxation 173 898
– Capital gains taxation 9 –
– Foreign taxation 7 7
Re-invested to maintain and expand operations 14 749 44 12 508 43
– Depreciation, amortisation and impairment 8 697 7 721
– Deferred taxation 1 933 603
– Profit for the year 4 119 4 184
Value apportioned 33 225 100 28 847 100
In addition to value apportioned to Government, the following amounts were paid to the South African Revenue Service (SARS):– Pay as you earn (PAYE) R2 680 million (2011: R2 432 million);– Skills development levy (SDL) R141 million (2011: R126 million);– Unemployment Insurance Fund (UIF) R158 million (2011: R143 million); and– Value added taxation (VAT) R2 691 million (2011: R1 564 million).# Borrowing costs amounting to R1 645 million (2011: R1 760 million) were capitalised.

134
Stakeholder engagement
Stakeholder groupHow Transnet engages with stakeholders
Main area of stakeholder concern
Transnet’s response and impact on the Quantum Leap and MDS
What Transnet hopes to achieve through stakeholder engagement
Transnet’s Shareholder, Government and other SOCs
Shareholder’s Compact engagements.
Quarterly report, Integrated reports and Corporate Plans.
SOCs CEOs, Chairman and Chief Financial Officer fora.
Annual general meetings.
Board engagement with the Shareholder Minister, Deputy Minister and the Director-General of DPE.
Bilateral Meetings between DPE, Transnet and Executive management.
Provincial visit by the Group Chief Executive and Minister of Public Enterprises.
Business breakfast hosted by the Minister of Public Enterprises.
Progress against New Growth Path commitments.
Meeting the development State objectives.
Infrastructure investment to create the required capacity.
Operational efficiencies.
Skills development and job creation.
Supplier development and localisation.
Rural development.
Regional integration.
Performance against Shareholder’s Compact targets.
Delivering sustainable returns.
Lowering the cost of doing business in South Africa.
Policy alignment with Government departments.
PFMA approvals.
Financial strategy of the Company.
Investor and funding concerns.
Executing the Quantum Leap Strategy successfully and fulfilling the Company’s mandate.
Participating in achieving infrastructure that meets the needs of the growing economy.
Earning an appropriate return on invested capital and maintaining a strong financial position.
Meeting the New Growth Path objectives.
Support industrial capacity building and job creation.
Undertaking the MDS.
Greater collaboration with stakeholders, thereby creating an enabling environment for successful execution of the MDS.
Regulators and other Government agencies
Governance.
Appropriateness of tariffs.
Access to network infrastructure.
Productivity and efficiency levels.
Customer service levels.
Secure revenue streams.
Closing the funding gaps through PSP.
Alignment on tariff methodology and regulatory policy to create regulatory certainty.
Secure funding required but not funded in the funding plan.
Managing the impact of regulation on revenues.
Appendix C

1352012 Integrated report
Stakeholder groupHow Transnet engages with stakeholders
Main area of stakeholder concern
Transnet’s response and impact on the Quantum Leap and MDS
What Transnet hopes to achieve through stakeholder engagement
Customers GCE road shows.
Customer satisfaction feedback and reports.
Fact sheets, pamphlets and newsletters.
Annual customer satisfaction survey.
Participation in industry forums and steering committees.
Regular direct customer engagement.
Consultative matters.
Social events.
Service delivery.
Innovation.
Leadership.
Reliability.
Safety.
Customer relations and communication.
Integrated account management to optimise opportunities across Operating divisions to drive volume growth.
Transnet pricing/tariff guidelines, best practice methodology and models to sustain capital investment and support volume growth.
Transparent capacity allocation framework and processes to ensure fair allocation of capacity. Security of fuel supply.
Creating sufficient capacity and improving on operating efficiencies.
Growing transshipment volumes and establishing South Africa as a transshipment hub and increasing over-border rail volumes.
Undertaking the MDS.
Alignment and collaboration on growth and expansion plans, detailed in key account plans.
Secure long term take-or-pay contracts.
Suppliers and business partners
Transnet Acquisition Council.
BEE fora.
Publications and site visits.
Stakeholder engagement meetings.
Supplier summits.
Governance.
Transparency.
Suppliers partnering with Transnet to deliver capital spend and achieve localisation and empowerment objectives.
Ap
pe
nd
ix C

136
Stakeholder groupHow Transnet engages with stakeholders
Main area of stakeholder concern
Transnet’s response and impact on the Quantum Leap and MDS
What Transnet hopes to achieve through stakeholder engagement
Employees, labour unions and pensioners
Strategic leadership forum.
Transnet Restructuring Committee.
National Business Committees.
Local Business Committees.
Internet/Intranet.
Memoranda from the GCE.
Culture Charter champions.
Correspondence with pensioners and fund administrators.
Engagement with the Portfolio Committee on Public Enterprises together with defined benefit pension funds.
Dignity and respect.
Safety.
Training and skills development.
Remuneration.
Culture.
Queries from former employees on whether they qualify for pensions.
In November 2010, the Portfolio Committee on Public Enterprises recommended that certain enhanced benefits be implemented for the pensioners of the Transnet Second Defined Benefit Fund and the Transnet Sub-Fund of the Transport Pension Fund comprising the payment of five months’ pension benefits as a bonus, an uplift of the base pensions and CPI-linked increases, targeting 75% of CPI.
Investing in employee safety and development.
Maintaining a performance system that supports continuous improvement.
Informing employees of key strategic initiatives, policies and procedures that impact the workforce.
Social responsibility and reputation management.
Both funds have provided bonuses to their pensioners of five months’ pension benefits. Neither fund will implement a base uplift, as this is tantamount to adjusting the salary of employees at date of retirement, and not within the ambit of the funds. Both funds, who have ad hoc bonus rules, will seek to pay annual bonuses to their pensioners that result in an annual increase in pension received linked to CPI.
Increase in labour productivity to deliver on volume growth and MDS targets.
Labour stability to support strategy execution and competitiveness of South Africa’s freight logistics system.
Building union relationships to support labour stability.
Collaboration with and organised labour to ensure business success.
Appendix C (continued)

1372012 Integrated report
Stakeholder groupHow Transnet engages with stakeholders
Main area of stakeholder concern
Transnet’s response and impact on the Quantum Leap and MDS
What Transnet hopes to achieve through stakeholder engagement
Investors Quarterly report, Integrated report and Corporate Plan.
Investor road shows and presentations.
Market feedback.
Circulate and distribute media statements issued by Transnet before the statements are read in the media.
Realising poor returns on capital investment.
Financial performance - Company’s ability to deliver on its commitments as set out in its strategy.
Affordability of capital investment plans.
Sovereign concerns that could lead to a downgrade of South Africa and consequently Transnet. Political instability that can impact interest rates and foreign exchange rates.
Policy uncertainty.
Regulatory tariff lower than Transnet’s needs.
Volumes railed far lower than planned – thus putting pressure on planned cash flow from operations which in turn increases funding requirement.
Managing cash and working capital proactively.
Diversifying sources of funding.
Seeking innovative means for Private Sector Participation (PSP).
Exploring possibility of ‘off-balance sheet’ funding.
Continued support and access to cost effective funding to meet requirements.
Better understanding of Transnet strategy and not react to ‘non-important’ reports.
Enable investors to feel comfortable to engage us when they so require.
Communities Partnerships,
Awareness campaigns.
Corporate social investment (CSI) initiatives.
Employment opportunities and environmental impacts.
Supporting key community development issues.
Beneficiation.
Sustaining CSI initiatives.
Fostering mutually beneficial relationships with various communities.
Job creation.
Supporting communities in areas of operation.
Demonstrating principles of accountability and care.
Increasing reach of beneficiaries.
Identify and impart skills to potential suppliers at community level, thus contributing to the transformation of suppliers.
A deeper understanding of community interests.
Building trusted relationships.
Ensuring sustainable community development, by building trust within communities where Transnet has established CSI programmes.
Ap
pe
nd
ix C

138
Abbreviations and acronyms
AFD Agence Française de Development – French Development Bank
AfDB African Development Bank
Aids Acquired immune deficiency syndrome
B-BBEE broad-based black economic empowerment
BCM business continuity management
bp basis point
BRICS Brazil, Russia, India, China and South Africa
CD chart datum
CFRC critical financial reporting controls
CGT Capital gains taxation
COE Centre of Excellence
COPEX Capitalised operating expenditure
CPI Consumer price index
CSDP Competitive Supplier Development Programme
CSI Corporate social investment
CWIP Capital work-in-progress
DBT Dry Bulk Terminal
DCT Durban Container Terminal
DEA Department of Environmental Affairs
DFI Development Finance Institution
DIFR disabling injury frequency rate
DJP Durban to Johannesburg pipeline
DMTN Domestic Medium-Term Note
DoT Department of Transport
DPE Department of Public Enterprises
DTI Department of Trade and Industry
EAP Employee Assistance Programme
EBIT earnings before interest and taxation
EBITDA earnings before interest, taxation, depreciation and amortisation
ECA Export Credit Agency
ED Enterprise development
EE employment equity
EIA environmental impact assessment
EIMS enterprise information management services
ERM Enterprise-wide Risk Management
FEL front-end loading
FIFA Federation International Football Association
FINCO Group Finance Committee
GBP Pound Sterling
GCH gross crane moves per hour
GE General Electric
GHG greenhouse gas
GIT Graduate-in-Training
GMTN Global Medium-Term Note
GRI Global Reporting Initiative
HCM Human Capital Management
HCT HIV/Aids Testing and Counselling
HIV human immunodeficiency virus
HR Human Resources
IAS International Accounting Standards
IASB International Accounting Standards Board
ICM Act Integrated Coastal Management Act, No 24 of 2008
IFRIC International Financial Reporting Interpretations Committee
IFRS International Financial Reporting Standards

1392012 Integrated report
Ab
bre
via
tio
ns
an
d a
cro
ny
ms
iSCM integrated Supply Chain Management
JBIC Japan Bank for International Cooperation
JPY Japanese Yen
King III King III Report on Governance for South Africa – 2009
LTI long-term incentive scheme
MDS Market Demand Strategy
ml/km million litres per kilometre
mt million tons
NEMA National Environmental Management Act, No 107 of 1998
NGP New Growth Path
NIHL noise-induced hearing loss
Ports Act National Ports Act, No 12 of 2005
PP preferential procurement
PRASA Passenger Rail Agency of South Africa
PSP Private Sector Participation
ROD Record of Decision
ROTA return on total average assets
RTG Rubber tyred gantry crane
SADC Southern African Development Community
Satawu South Africa Transport and Allied Workers Union
SATS South African Transport Services
SDR Sustainable Development Report
SHEQ Safety, health, environment and quality
SMME Small, medium and micro-enterprise
SOC state-owned company
SOP standard operating procedure
SPAD Signals past at danger points
SPO strategic performance objective
SRAB starting regulatory asset base
SSI Statement of Strategic Intent
STAT ship turnaround time
STI short-term incentive scheme
STS ship-to-shore
SVA Shareholder value add
TIP Transnet Infrastructure Plan
TEU twenty-foot equivalent unit
TSDBF Transnet Second Defined Benefit Fund
TWR Train working rules
UKLA United Kingdom Listing Authority
USA United States of America
US$ US Dollar
Utatu United Transport and Allied Trade Union
WACC weighted average cost of capital
ZAR South African Rand

140
Glossary of terms
Asset turnover (times)
Revenue divided by total assets (total assets
excluding capital work-in-progress).
Average total assets
Total assets, where ‘average’ is equal to the total
assets at the beginning of the reporting period
plus total assets at the end of the reporting period,
divided by two.
Cash interest cover (times)
Cash generated from operations after working
capital changes, divided by net finance costs (net
finance costs includes finance costs, finance income
and capitalised borrowing costs from the cash flow
statement).
Debt
Interest-bearing borrowings (short and long-term),
post-retirement benefit obligations, derivative
financial liabilities plus overdraft, less short-term
investments and net cash and cash equivalents.
EBITDA
Profit/(loss) from operations before depreciation,
amortisation, profit on sale of interest in businesses,
impairment of assets, dividend received, post-
retirement benefit obligation income/(costs), fair
value adjustments, (loss)/income from associates
and net finance costs.
EBITDA margin
Profit/(loss) from operations before depreciation,
amortisation, profit on sale of interest in businesses,
impairment of assets, dividend received, post-
retirement benefit obligation income/(costs), fair
value adjustments, (loss)/income from associates
and net finance costs expressed as a percentage of
revenue.
Equity
Issued capital, reserves and minority interests.
Debt (for gearing calculation)
Long-term borrowings, short-term borrowings,
employee benefits, derivative financial liabilities plus
overdraft less other short-term investments, less
derivative financial assets and less cash and cash
equivalents.
Gearing
Debt expressed as a % of the sum of debt and
Shareholder’s equity.
Headline earnings
As defined in Circular 3/2009, issued by the
South African Institute of Chartered Accountants,
separates from earnings all items of a capital
nature. It is not necessarily a measure of sustainable
earnings.
Operating profit
Profit or loss from operations after depreciation and
amortisation but before profit on sale of interest in
businesses, impairment of assets, dividends received,
post-retirement benefit obligation income/(costs)
income, fair value adjustments, (loss)/income from
associates and net finance costs.
Operating profit margin
Operating profit expressed as a percentage of
revenue.
Profit/(loss)
Profit or loss after taxation and minority interests.
Return on average total assets
Operating profit expressed as a percentage of
average total assets (average total assets exclude
capital work-in-progress).
Return on net assets
Profit before taxation expressed as a percentage of
net assets.
Shareholder value add
EBIT less the cost of capital. Cost of capital is the
average total assets, excluding capital work-in-
progress, multiplied by WACC.
Total assets
Non-current and current assets.
Total debt
Non-current and current liabilities.
Total debt-to-equity ratio
Total debt expressed as a ratio to equity.

Executive DirectorsB Molefe (Group Chief Executive), A Singh (Acting Chief Financial Officer).
Non-executive DirectorsME Mkwanazi (Chairman), NK Choubey#, MA Fanucchi, Y Forbes, HD Gazendam, NBP Gcaba, BD Mkhwanazi, T Mnyaka, N Moola, MP Moyo, NR Ntshingila, IM Sharma, IB Skosana, E Tshabalala, DLJ Tshepe.
# Indian.Mr MP Malungani resigned from the Board of Directors with effect from 1 April 2012.
www.transnet.net
Group Company SecretaryMs ANC Ceba
47th Floor, Carlton Centre, 150 Commissioner Street, Johannesburg, 2001.
PO Box 72501, Parkview, 2122, South Africa.
AuditorsDeloitte & Touche, Deloitte Place, The Woodlands Office Park, Woodlands Drive, Sandton.
Transnet SOC LtdIncorporated in the Republic of South Africa.
Registration number 1990/000900/30.
Corporate information
