integrated ticketing system (mumbai metropolitan...
TRANSCRIPT

Leadership in Urban Transport Project on Integrated Ticketing System for Mumbai Metropolitan Region
Urban Mobility India Conference
Presented by:1. Smt.K Vijaya Lakshmi, Chief, Transport & Communications Division, MMRDA2. Shri. Raju Bhadke, Dy. Chief Engineer, Indian Railways3. Shri. Goraksha V.Jagtap, Dy Chief Personnel Officer, Central Railway

Mumbai Metropolitan Region (MMR)
Particulars India Maharashtra MMR MCGM
Population 2011 Census (in millions)
1,210 (1.21 billion)
1120.112 (billion)
23(0.023 billion)
12 (0.012 billion)
Area Sq. km 3,287,240 307,713 4,253 438
Density - Persons per sq. km 382 370 5,361 28,310
Urban Pop in % 32% 45.23% 94% 100%
GDP Per Capita (USD/annum) $1,626.62 $1,963.33 $2,120.18 $2,570.73
2
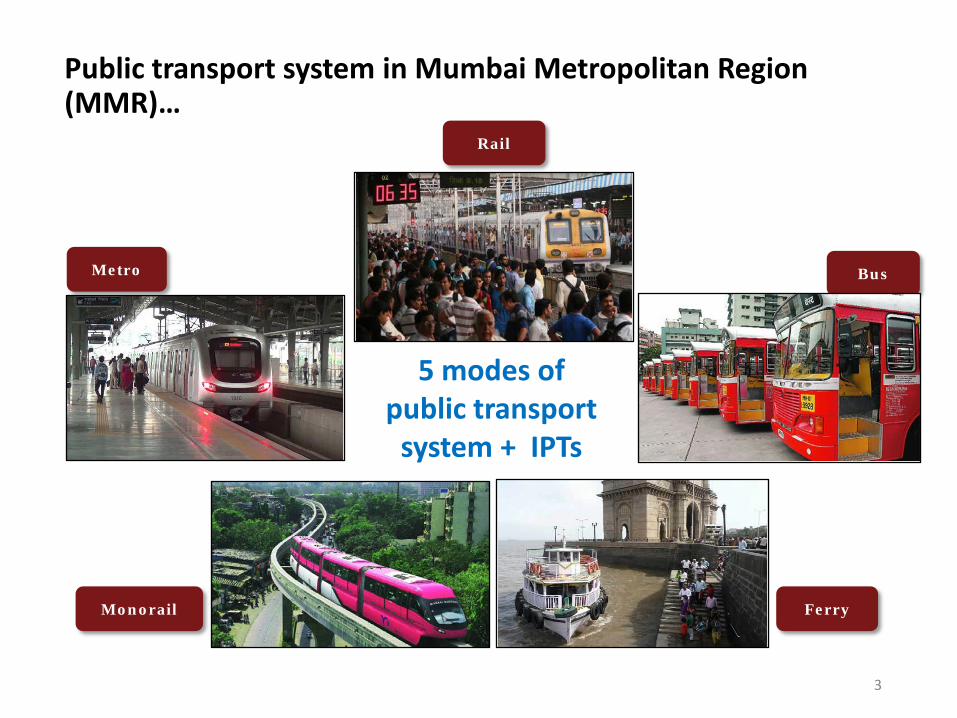
Public transport system in Mumbai Metropolitan Region (MMR)…
3
5 modes of public transport
system + IPTs
Rail
Metro Bus
Monorail Ferry
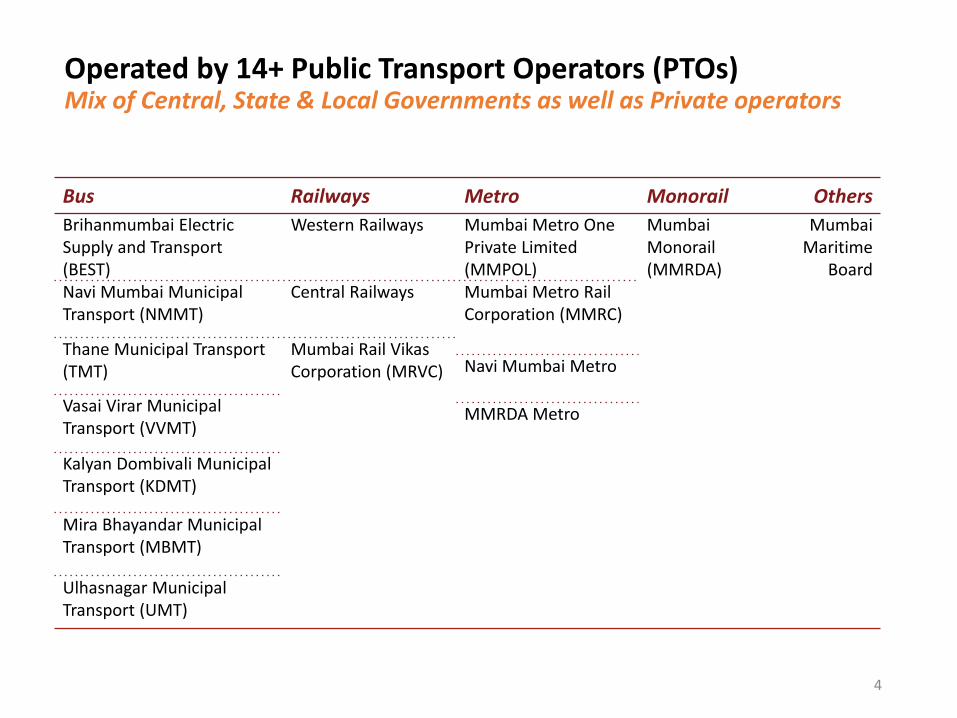
Bus Railways Metro Monorail OthersBrihanmumbai Electric Supply and Transport (BEST)
Western Railways Mumbai Metro One Private Limited (MMPOL)
MumbaiMonorail (MMRDA)
Mumbai Maritime
BoardNavi Mumbai Municipal Transport (NMMT)
Central Railways Mumbai Metro Rail Corporation (MMRC)
Thane Municipal Transport (TMT)
Mumbai Rail VikasCorporation (MRVC) Navi Mumbai Metro
Vasai Virar Municipal Transport (VVMT)
MMRDA Metro
Kalyan Dombivali Municipal Transport (KDMT)
Mira Bhayandar Municipal Transport (MBMT)
Ulhasnagar Municipal Transport (UMT)
Operated by 14+ Public Transport Operators (PTOs) Mix of Central, State & Local Governments as well as Private operators
4
Railways- Key Statistics
5
7.5 million daily trips
70% of the journeys completed through season tickets
Around 30-40% of the suburban rail commuters uses other motorizedtransport modes (primarily bus and autos) to connect and from therailway stations
Ridership saturated likely to be same till 2020 - 21
Average ticket size of each journey is in slab of 05-20 Kms i.e.- INR 6

Railways- Existing Ticketing System
6
Fare Medium Paper and Mobile Tickets
Ticketing Channels Ticket Counters, ATVMs, Online and Mobile App
Payment Type Cash, Smartcard, Credit/ Debit cards, Mobile Wallets
Inspectionmechanism Spot checking at the station and inside the trains

Metro- Key Statistics
7
0.3 million trips on a week day
Per annum ridership growth is 5%
Average ticket size of each journey is INR21
New metro lines expected to be operational by 2021-2022
The overall daily ridership expected to increase to 3-4 million by 2022
No season tickets available, only Pay As You Go (PAYG)

Major Projects Currently Under Implementation
• Metro Line 2A : DN Nagar – Dahisar
• Metro Line 7 : Dahisar – Andheri
• Metro Line 2B : DN Nagar – Mandale
• Metro Line 4 : Wadala-Kasarwadvli
• Metro Line 3 : Colaba to SEEPZ
• Metro Line 5 : Thane Bhiwandi - Kalyan
• Metro Line 6 : Jogeshwari – Kanjurmarg
• Monorail Line Extension
8

Metro- Existing Ticketing System
9
Fare Medium Smartcards and tokens
Ticketing Channels Ticket Counters, TVMs, Online and Mobile App
Payment Type Cash, Credit/ Debit cards, Mobile Wallets
Inspectionmechanism Gated system, No inspection required

Monorail- Key Statistics
10
17000-18000 regular commutes
2nd line to be operational by 2018
The ridership by 2021 expected to reach 0.18 million
No season tickets available, only Pay As You Go (PAYG)
Average ticket size of each journey is 3.5km i.e. -INR 9

Monorail- Existing Ticketing System
11
Fare Medium Smartcards and tokens
Ticketing Channels Ticket Counters, TVMs, Online and Mobile App
Payment Type Cash, Credit/ Debit cards, Mobile Wallets
Inspectionmechanism Gated system, No inspection required

Buses- Key Statistics
12
7 Bus Operators in Mumbai Metropolitan Region
3.5 million daily trips
BEST Undertaking is the largest Bus Operator in the city with ~2.8 million daily trips
Around 20% of the trips completed through season tickets
Around 10 % of the suburban rail commuters use bus to connect and from the railway stations
Estimated growth of 15% per annum
Average ticket size of journey is INR 12.84 for normal Buses
Average ticket size of INR 82.40 for AC buses

Buses- Existing Ticketing System
13
Fare Medium Paper Tickets, Smartcards and Mobile Tickets
Ticketing Channels Ticket Counters, ETMs with conductors and Mobile App
Payment Type Cash, Credit/ Debit cards and Mobile Wallets
Inspectionmechanism Spot checking inside and outside the buses
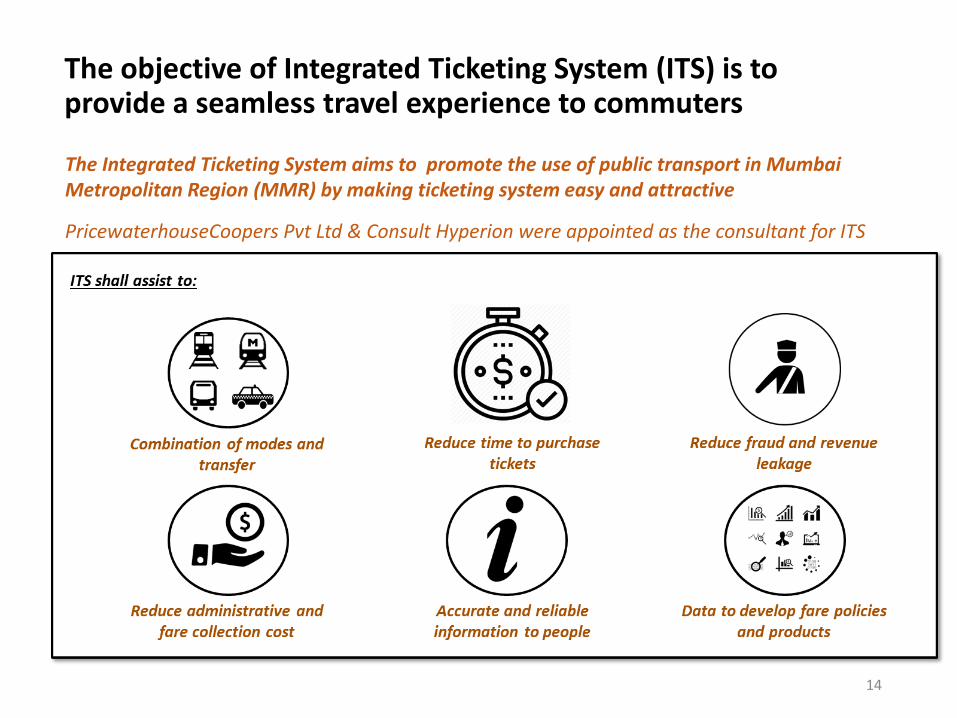
The objective of Integrated Ticketing System (ITS) is to provide a seamless travel experience to commuters
The Integrated Ticketing System aims to promote the use of public transport in Mumbai Metropolitan Region (MMR) by making ticketing system easy and attractive
PricewaterhouseCoopers Pvt Ltd & Consult Hyperion were appointed as the consultant for ITS
14
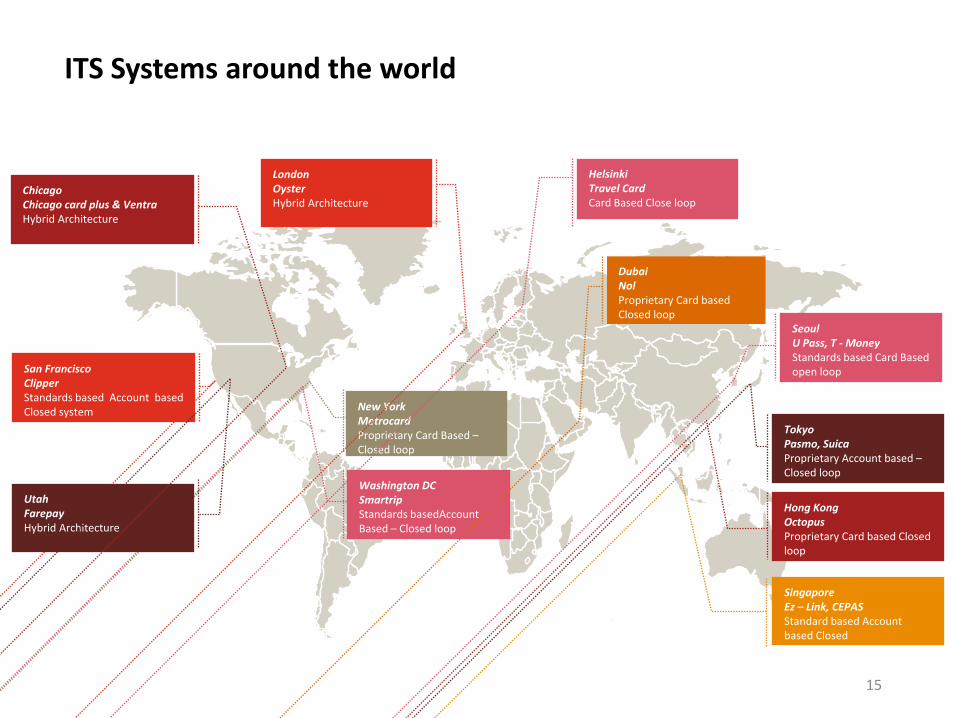
ITS Systems around the world
15
ChicagoChicago card plus & VentraHybrid Architecture
San FranciscoClipperStandards based Account based Closed system
Washington DCSmartripStandards basedAccountBased – Closed loop
New YorkMetrocardProprietary Card Based –Closed loop
SingaporeEz – Link, CEPASStandard based Account based Closed
Hong KongOctopusProprietary Card based Closed loop
TokyoPasmo, SuicaProprietary Account based –Closed loop
LondonOysterHybrid Architecture
UtahFarepayHybrid Architecture
DubaiNol Proprietary Card based Closed loop
HelsinkiTravel CardCard Based Close loop
SeoulU Pass, T - MoneyStandards based Card Based open loop
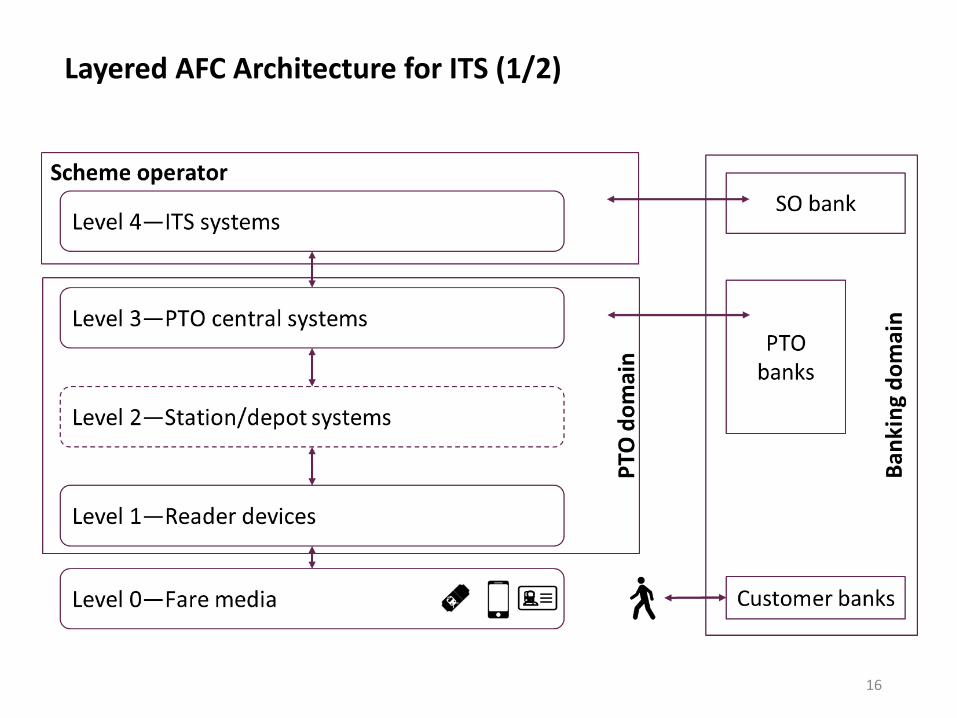
Layered AFC Architecture for ITS (1/2)
16

Layered AFC Architecture for ITS (2/2)
17
Level-0: The fare medium available with the passengers. These may include smartcard,mobile phones, wearables etc.
Level-1: Front-end devices with which passengers interact. These include Ticket VendingMachines (TVMs), Ticket Office Machines (TOMs), Fare Gates, Fare Readers etc.
Level-2: Station/ depot level servers for data aggregation. The data from all Level-1 devicesinstalled at a station are aggregated at its respective Level-2 server.
Level-3: These are PTO level servers which collect the data from all Level-2 servers. Theaggregated data is passed on to the common city level server and also used forreconciliation.
The Level-1 to Level-3 devices come under PTO domain.
Level-4: This is a common ITS server, which comes under a central scheme operator. ThisLevel-4 will performs the function of tap aggregation, fare calculation, riskmanagement and interact with the acquiring bank for the settlement of thetransactions with the issuing banks.

Commercial structure for the ITS setting out clear roles and responsibilities of each group of stakeholders needs to be developed
18
SLAs to be agreed with PTOs and payment service agreements with third party users Scheme Operator can issue hardware specifications and testing criteria for PTOs to deploy
own hardware Transaction charges to be paid by PTOs to the Scheme Operator depending on levels of
service taken
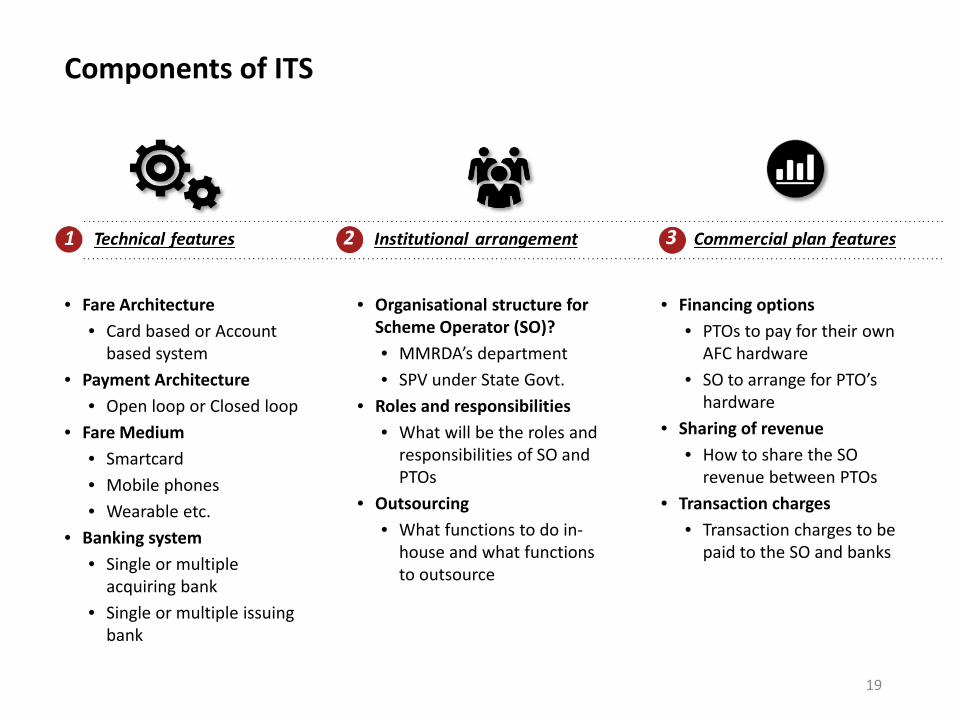
Components of ITS
19
• Fare Architecture• Card based or Account
based system• Payment Architecture
• Open loop or Closed loop• Fare Medium
• Smartcard• Mobile phones• Wearable etc.
• Banking system• Single or multiple
acquiring bank• Single or multiple issuing
bank
• Organisational structure for Scheme Operator (SO)?• MMRDA’s department• SPV under State Govt.
• Roles and responsibilities• What will be the roles and
responsibilities of SO and PTOs
• Outsourcing• What functions to do in-
house and what functions to outsource
• Financing options• PTOs to pay for their own
AFC hardware• SO to arrange for PTO’s
hardware• Sharing of revenue
• How to share the SO revenue between PTOs
• Transaction charges• Transaction charges to be
paid to the SO and banks
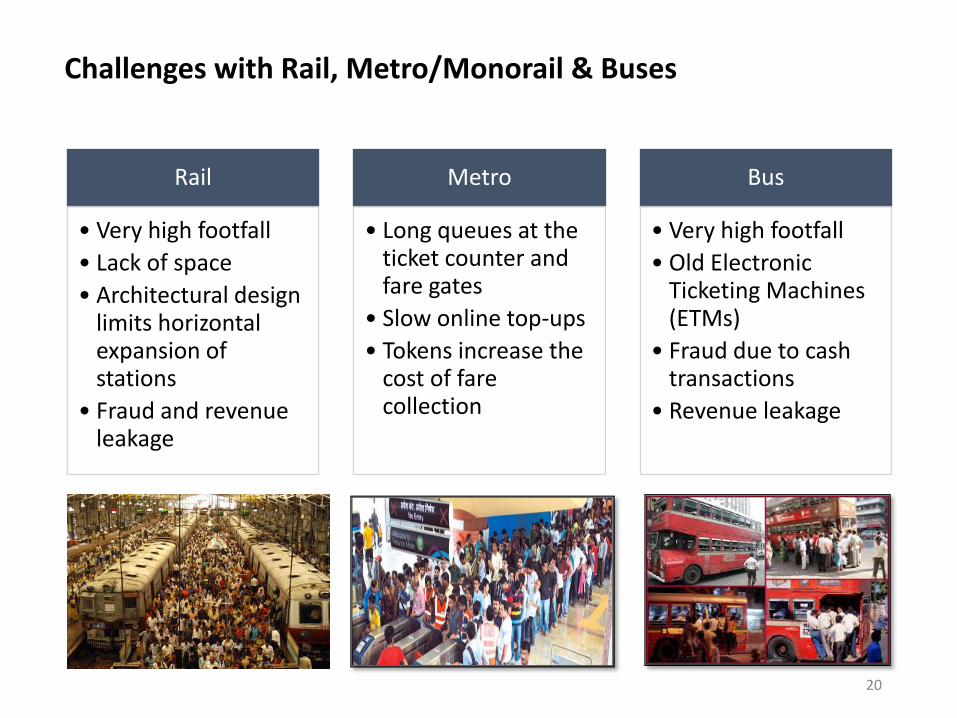
Challenges with Rail, Metro/Monorail & Buses
20
Rail
• Very high footfall• Lack of space• Architectural design
limits horizontal expansion of stations
• Fraud and revenue leakage
Metro
• Long queues at the ticket counter and fare gates
• Slow online top-ups• Tokens increase the
cost of fare collection
Bus
• Very high footfall• Old Electronic
Ticketing Machines (ETMs)
• Fraud due to cash transactions
• Revenue leakage

Strategy for Railways
21
Phase-1
Phase-2
Installation of tap-in fare readers
• Redevelopment/ modification of stations • Installation of Fare Gates
Suburban Stations are segregated into Zones
Fares are Calculated based on transit between zones for Singlejourney
Ticket stored in Customer account at Backend
Traditional Paper Single Journey Tickets can be purchased incounter like existing ticketing system
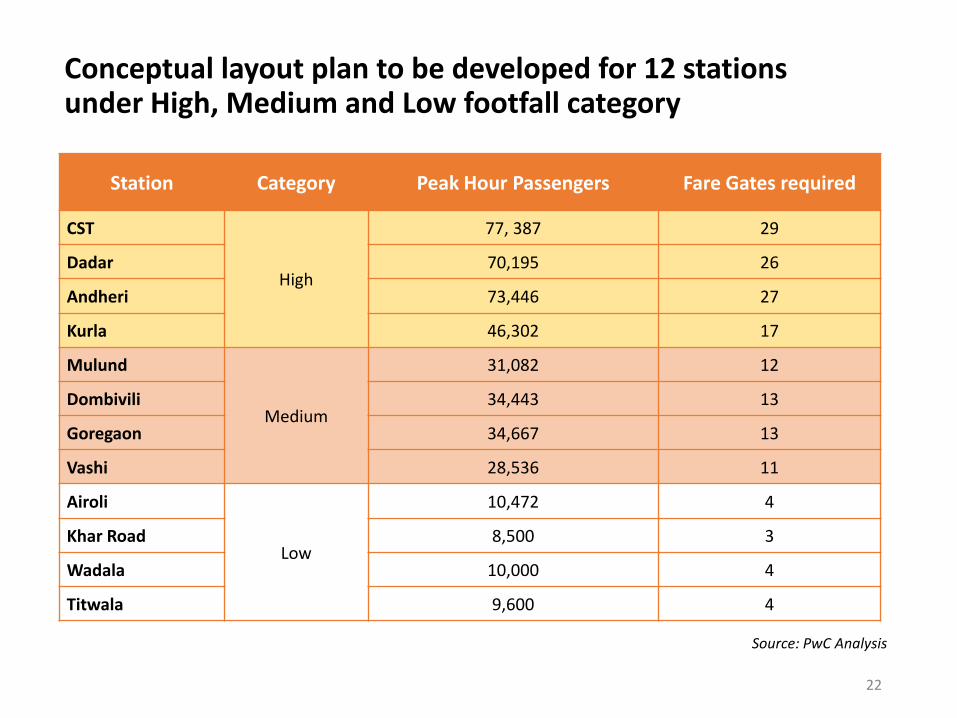
Conceptual layout plan to be developed for 12 stations under High, Medium and Low footfall category
22
Station Category Peak Hour Passengers Fare Gates required
CST
High
77, 387 29
Dadar 70,195 26
Andheri 73,446 27
Kurla 46,302 17
Mulund
Medium
31,082 12
Dombivili 34,443 13
Goregaon 34,667 13
Vashi 28,536 11
Airoli
Low
10,472 4
Khar Road 8,500 3
Wadala 10,000 4
Titwala 9,600 4
Source: PwC Analysis
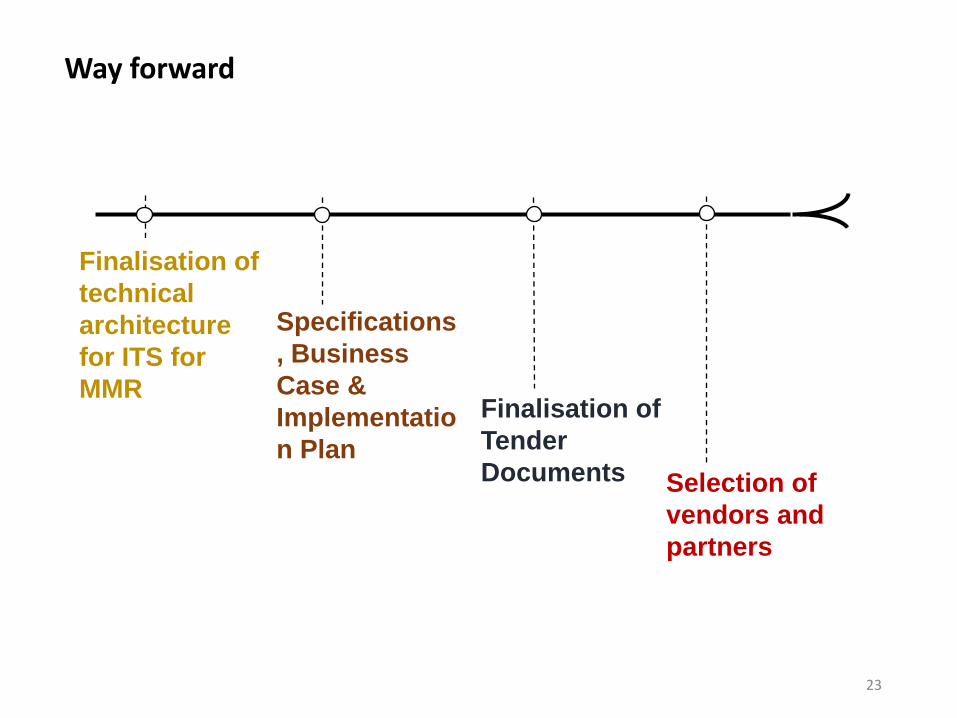
Way forward
23
Finalisation of technical architecture for ITS for MMR
Finalisation of Tender Documents
Specifications, Business Case & Implementation Plan
Selection of vendors and partners

24
Thank You