integrated transit lab
TRANSCRIPT

8/22/2019 Integrated Transit Lab
http://slidepdf.com/reader/full/integrated-transit-lab 1/112
INTEGRATED TRANSIT MULTI MODAL TRANSIT LAB,
Urban Transport Planning and Management 2012-2014

8/22/2019 Integrated Transit Lab
http://slidepdf.com/reader/full/integrated-transit-lab 2/112
AIM: To prepare a Detailed Project Report for a
multimodal interchange(s)
OBJECTIVES
1. To understand the concept, components and need of INTEGRATION.
2. How to plan and design for an interchange.3. To understand and evaluate the over-all project.

8/22/2019 Integrated Transit Lab
http://slidepdf.com/reader/full/integrated-transit-lab 3/112
1. Evaluate existing Public Transit scenario in Ahmedabad region.
2. Identify future growth areas in Ahmedabad region.
3. Draw lessons from best practices (International cities).
4. Propose connectivity to future growth areas.
5. Choose the appropriate Public Transport mode for the regions.
6. Identify the Interchange Locations and the preferable level of Interchange.
7. Conceptual design of the interchanges.
8. Carry out the over-all project evaluation.
9. Look in to the complimentary measures – Institutional Integration.
METHODOLOGY

8/22/2019 Integrated Transit Lab
http://slidepdf.com/reader/full/integrated-transit-lab 4/112
The organizational process through which the planning and delivery of elements of the transport
system are brought together across modes, sectors, operators and institutions with the aim of
increasing economic and social benefits.
SOURCE: Article ‘on the move: delivering integrated transit system in Britain’ by John Preston, Adam Marshall & LenaTochterman
CONCEPT OF INTEGRATION
Commuterrail
Buses
MetroNon
MotorizedTransport
Para Transit
Regional
buses
Othersectors
(Env., Edu.,Health)
BRTS

8/22/2019 Integrated Transit Lab
http://slidepdf.com/reader/full/integrated-transit-lab 5/112
Integration of public transport informationtep 1
Integration Public transit servicesStep 2
Integration of Public transit faresStep 3
Integration public & private transport servicesStep 4
Integration of public transport authoritiesStep 5
Integration of Transportation & Land useStep 6
Integration of education, health & Social service
sectors
Integration of environment, social & economic
policy
Step 7
Step 8
Integration of education, health & Social service
sectors
Integration of public transport information
Integration Public transit services
Integration of Transportation & Land use
Integration public & private transport services
Integration of public transport authorities
Integration of Public transit fares
Integration of environment, social & economic
policyPhysical Integration
Institutional Integration
Fare Integration
Policy measures
INTEGRATION LADDER
SOURCE: Article ‘on the move: delivering integrated transit system in Britain’ by John Preston, Adam Marshall & Lena Tochterman

8/22/2019 Integrated Transit Lab
http://slidepdf.com/reader/full/integrated-transit-lab 6/112
WHY DO CITIES NEED INTEGRATION?
More than one transport mode
Transfers required for direct, convenient through service or route for the journey
Network Coverage

8/22/2019 Integrated Transit Lab
http://slidepdf.com/reader/full/integrated-transit-lab 7/112
BENEFITS OF INTEGRATION
• One network, one timetable, one ticket, one fare – from door to door•
Minimizes the need to travel by concentration of activities• Minimizes the over- all travel time• Provides safe and secure journeys.• Minimises the private vehicle dependency.• More integrated – more choice of destination.
Source: i. Preston J, Marshall A & Tochtermann L, 2008, On the Move: Delivering Integrated Transport in Britain’s Cities ii. SPUTNIC, Strategies for Public Transport in Cities
• Higher public transit ridership• Higher revenue generation• Increase in Efficiency of the system
• Acts as a catalyst for urban regeneration• Supports continued economic development• Environmental benefit
USER PERSPECTIVE
OPERATOR PERSPECTIVE
SOCIETY PERSPECTIVE

8/22/2019 Integrated Transit Lab
http://slidepdf.com/reader/full/integrated-transit-lab 8/112
INTERCHANGE
Atocha, Madrid, Spain Regional Rail, Metro, Regional Buses, Local Buses
An interchange is a location where customers transfer from one mode of transport to another
or between two services of the same mode.
It may be a place where customers join or leave the public transport system on foot, by bicycle,
motorcycle, or car.

8/22/2019 Integrated Transit Lab
http://slidepdf.com/reader/full/integrated-transit-lab 9/112
BASIC ELEMENTS OF INTERCHANGEPhysical needs Such as:
- Location, area boundaries, connectivity to street network,
- Customer forecasts (arrival, departure by mode including transfers, peaks),- Bus number forecasts (peaks, type of bus, layover requirement), and
- Primary interchange purpose (terminus, Park and Ride, intermodal transfer).
Customer needs Such as:
- Customer movements (bus to bus, bus to rail, Park and Ride to bus),- Travel type (commuters, tourists, special events),
- Volume considerations (mode separation),
- Safety (mode conflicts, personal security), and
- Accessibility.
Land use integration Such as:
- Integrated facilities (toilets, retail) provided by adjacent land use,
- Connectivity (pedestrian desire lines),
- Complementary development opportunities (TOD, retail, cafes),
- Local context, and- Safety. SOURCE: Public Transport Interchange Design Guidelines, Auckland Transport, 2013

8/22/2019 Integrated Transit Lab
http://slidepdf.com/reader/full/integrated-transit-lab 10/112
CASE STUDIES

8/22/2019 Integrated Transit Lab
http://slidepdf.com/reader/full/integrated-transit-lab 11/112
Singapore
• Singapore has a total land area of 714.3 km², housing a population of 5.32 lakhs
• The population growth rate of the city is about 2.5% p.a.
• The population density of the city is 7482 persons per square kilometre
• There exists 4 types of public transport modes- MRT, LRT, Bus and Taxi
49 kms
25 kms
• The Republic of Singapore, is a south- east Asian island city- state off the southern tip of
the Malay Peninsula
• Located at 1° 14’N latitude and 103° 55’E longitude
• The mainland of Singapore measures 49 kilometres from East to West and 25 kilometresfrom North to South with 193 km of coastline.
8/22/2019 Integrated Transit Lab
http://slidepdf.com/reader/full/integrated-transit-lab 12/112
Transit Services- Taxi• Taxis provide door- to- door service
• As on April 2010, there were 24000 taxis on the streets of Singapore
• Daily taxi trips: 0.9 million
• An average trip length on a taxi is 9.7 kms/ passenger trip
• All taxi rides are metered
• Taxi fares are based on a flag-down fare and the distance travelled
• Taxi fares can be paid with cash, credit card, NETS, or EZ-Link card, subject to the
availability of such payment devices in the taxis
• There are 7 private taxi operators in the city
• Taxi fares, licenses, standard of services are regulated by the Land Transport
Authority

8/22/2019 Integrated Transit Lab
http://slidepdf.com/reader/full/integrated-transit-lab 13/112
Transit Services- Bus
• Bus lanes extend to 150 km
• 4000 buses are spread over 330 routes with daily bus trips of 3.1 million
There exists various types of Bus services, which are as follows:
o Trunko Short trip
o Intra- town (SMRT Buses) and Town Link (SBS Transit)
o Jurong Industrial Service
o Express
o Fast Forward
o Night Rider (SMRT Buses) and Nite Owl (SBS Transit)
o China Town Direct
o Parks
o Premium
• The MRT system spans some 130km across the island with 85 stations and LRT with 29 kms and 43
stations
• Operation hours- 5.30am – 12:00 a.m.
• Frequency: Peak hours-2 to 3 minutes
Off- eak Hours- 5 to 7 minutes
North- South LineEast- West Line
North- East Line
Circle LineDowntown LineThomson Line
LRT Lines
Transit Services- MRT/ LRT
• Daily MRT/ LRT trips: 1.9 million
• Network Density- 0.2 km/ sq. km

8/22/2019 Integrated Transit Lab
http://slidepdf.com/reader/full/integrated-transit-lab 14/112
Interchange
TAMPINEJURONG EAST
BUKIT PANJANG
WOODLANDS YISHUN
BISHAN
NEWTONORCHARD
CITY HALL
RAFFLES PLACE
MARINA BAY
PAYA LEBAR
BUGIS
OUTRAM PARK
BUONA VISTA
HARBOUR FRONT
SERANGOON
PUNGGOL
SENGKANG
PROMENADEDHOBY GHAUT
There are 22 interchanges within the city
The interchange levels are decided on the basis of the number of routes intersecting at that
stationAll MRT stations are an interchange in themselves as bus services connect them
Level I
Level IILevel III

8/22/2019 Integrated Transit Lab
http://slidepdf.com/reader/full/integrated-transit-lab 15/112
Punggol Interchange- Level III
Bus Stop
EE E
E Bus BaysBus Bays
Elevated LRT
Entrance Entrance

8/22/2019 Integrated Transit Lab
http://slidepdf.com/reader/full/integrated-transit-lab 16/112
Outram Park Interchange- Level II
Bus Stop
13.2 m
5 mE
E
Road Over Bridge
Bus StopBus StopTaxi Parking

8/22/2019 Integrated Transit Lab
http://slidepdf.com/reader/full/integrated-transit-lab 17/112
Dhoby Ghaut Interchange- Level I
Bus Stop
36.2 m
55.4 m
E
EE
E
E32 m
us Stop at the Entrance of the Station, thus reducing access
istance
Entrance
Bus Bays
8/22/2019 Integrated Transit Lab
http://slidepdf.com/reader/full/integrated-transit-lab 18/112
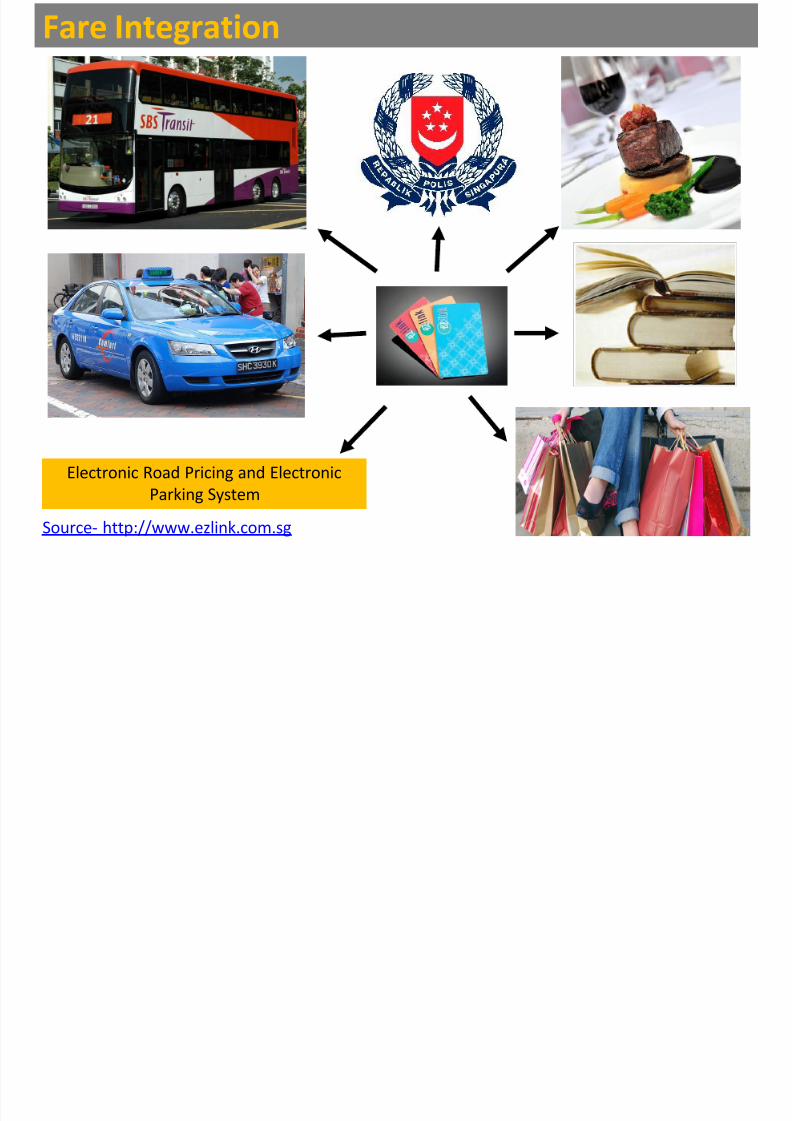
Fare Integration
Electronic Road Pricing and Electronic
Parking System
Source- http://www.ezlink.com.sg

8/22/2019 Integrated Transit Lab
http://slidepdf.com/reader/full/integrated-transit-lab 19/112
Institutional Integration
Land Transport Authority
Public Transport
Council
MRT/ LRT Operators Bus Operators
Regulator Advisor Operator
Taxi Operators
• Public transport system is publicly owned but privately operated
• LTA has the single authority over all the land transportation system of the city
• LTA is the single regulator, planner and policy- maker in land transport
• PTC leases not only acts as an advisor to LTA, but also leases out tenders to operators and
looks into quality of services by the operators
• The operators of MRT/ LRT and Buses operate on separate routes leased out to them by
PTC

8/22/2019 Integrated Transit Lab
http://slidepdf.com/reader/full/integrated-transit-lab 20/112
Lessons LearntPhysical Integration• The MRT/ LRT acts as the trunk transportation route for the city
• The buses act as feeder to the MRT services
Fare Integration• Single ticketing System for all modes
• Distance based telescopic fare
• Speedy transaction
Institutional Integration• Single transport authority, who is both the planner as well as the regulator

8/22/2019 Integrated Transit Lab
http://slidepdf.com/reader/full/integrated-transit-lab 21/112
CURITIBA CITY PROFILE
•The capital of the Brazilian state of Parana.
•The largest city with a biggest economy of
both Parana and Southern Brazil.
Curitiba Municipality Metro
Population 1,764,540 3,209,980
Area Km sq 430.9 15,416.9
Density per sq
km
4062 210.9
Source: IPPUC 2008

8/22/2019 Integrated Transit Lab
http://slidepdf.com/reader/full/integrated-transit-lab 22/112
TRANSIT SERVICE NETWORK
8/22/2019 Integrated Transit Lab
http://slidepdf.com/reader/full/integrated-transit-lab 23/112
BUS INTERCHANGES AND CONCEPT PLAN
Source: IPPUC 2008
13 cities conected
385 lines
28 terminals
351 tube stations
Accessibility network - 500m
Single fare
70 Km of exclusive lanes for buses

8/22/2019 Integrated Transit Lab
http://slidepdf.com/reader/full/integrated-transit-lab 24/112
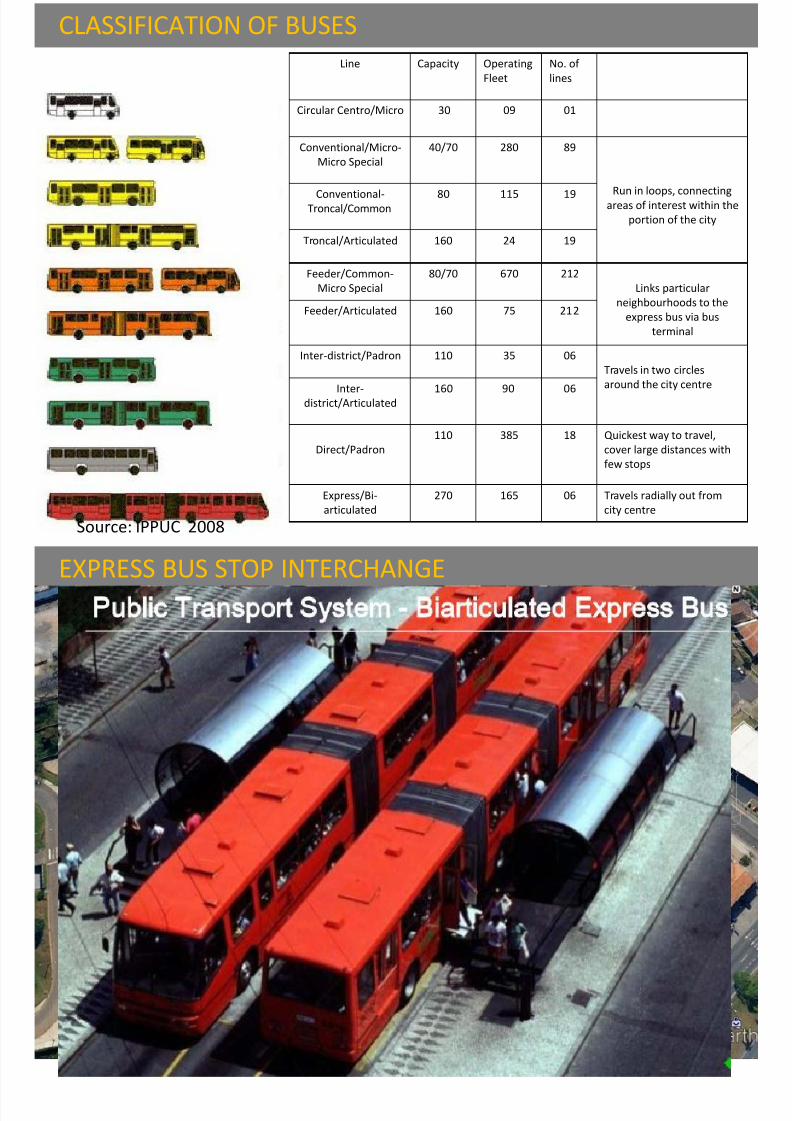
CLASSIFICATION OF BUSES
Line Capacity Operating
Fleet
No. of
lines
Circular Centro/Micro 30 09 01
Conventional/Micro-
Micro Special
40/70 280 89
Run in loops, connecting
areas of interest within the
portion of the city
Conventional-
Troncal/Common
80 115 19
Troncal/Articulated 160 24 19
Feeder/Common-
Micro Special
80/70 670 212
Links particular
neighbourhoods to the
express bus via bus
terminal
Feeder/Articulated 160 75 212
Inter-district/Padron 110 35 06
Travels in two circles
around the city centreInter-
district/Articulated
160 90 06
Direct/Padron
110 385 18 Quickest way to travel,
cover large distances with
few stops
Express/Bi-
articulated
270 165 06 Travels radially out from
city centreSource: IPPUC 2008

8/22/2019 Integrated Transit Lab
http://slidepdf.com/reader/full/integrated-transit-lab 25/112
EXPRESS BUS STOP INTERCHANGE

8/22/2019 Integrated Transit Lab
http://slidepdf.com/reader/full/integrated-transit-lab 26/112
DIRECT BUS ROUTE INTERCHANGE
I A Y SYS

8/22/2019 Integrated Transit Lab
http://slidepdf.com/reader/full/integrated-transit-lab 27/112
TRINARY SYSTEM
LANDUSE AND PUBLIC TRANSPORTATION

8/22/2019 Integrated Transit Lab
http://slidepdf.com/reader/full/integrated-transit-lab 28/112
LANDUSE AND PUBLIC TRANSPORTATION
Land use Street Network Public Transport
FARE INTEGRATION

8/22/2019 Integrated Transit Lab
http://slidepdf.com/reader/full/integrated-transit-lab 29/112
FARE INTEGRATION
•Electronic ticketing was introduced in 2002
through smart cards.
•Express and direct services require access
via prepayment in tube stations andterminals.
•Feeder buses have on board validation of
electronic cards or direct payment to a
conductor.
INSTITUTIONAL FRAMEWORK OF CURITIBA

8/22/2019 Integrated Transit Lab
http://slidepdf.com/reader/full/integrated-transit-lab 30/112
INSTITUTIONAL FRAMEWORK OF CURITIBA
Urban Level Metropolitan Level
IPPUC URBS
Created by Municipal
Law in 1965•Envisioned within the
original “Linear City” Plan
• Responsible for integrated
planning of the city• Collaborates closely with
URBS .
Public Transport Authority -
URBS
Created by Municipal
Law in 1980
• Administers: – public
space (stations, stops,
etc.) – parking meters –
taxi system – traffic
enforcement (together
with State Police)
• Also administers Curitiba
Urbanization Fund
COMEC
•Funded through fare collection
•90% goes to private sector
operators
•6% goes to infrastructure
development
•4% goes to financing URBS
LESSONS LEARNT

8/22/2019 Integrated Transit Lab
http://slidepdf.com/reader/full/integrated-transit-lab 31/112
LESSONS LEARNT
Physical integration
•Sustainable Urban Development : Trinary System based on land use, street network and publi
•Transport system with economic, social and environmental development.
•Accessibility network – 500m
•Exclusive lanes for buses.
•Single mode of transport with different types of buses.
Fare integration
Single fare system
Institutional integration
•Curitiba is having research centre for public transport IPPUC.
•Well integration between authorities from urban to metropolitan level.

8/22/2019 Integrated Transit Lab
http://slidepdf.com/reader/full/integrated-transit-lab 32/112
GOVERNMENT
• Regional authority Greater London Authority
• Regional assembly London Assembly
• Mayor Boris Johnson
• UK Parliament 74 constituencies
• London Assembly• European Parliament
14 constituenciesLondon constituency
AREA
• City 606.95 sq mi (1,572.00 km2)
• Urban 671.0 sq mi (1,737.9 km2)
• Metro 3,236.31 sq mi (8,382.00 km2)
Elevation 79 ft (24 m)
POPULATION (2012)
• City 8,308,369
• Density 13,690/Sq mi (5,285/km2)
PUBLIC TRANSPORT
Bus Tram
Tube Rail
DLR Ferry
LONDON - INTRODUCTION
Source: www.cityof london .gov.uk
TUBE RAIL DLR TRAM FERRY BUS
8/22/2019 Integrated Transit Lab
http://slidepdf.com/reader/full/integrated-transit-lab 33/112
TUBE
405 kms,
3 million
passengers
RAIL
86 kms,
200,000
passengers
DLR
34 kms,
300,000
passengers
TRAM
27.35 kms,
79,600
passengers
FERRY
11.26 kms,
BUS
6 million
passengers
Source: www.tfl .gov.uk
RINGS AND RADIALS
INTERCHANGES

8/22/2019 Integrated Transit Lab
http://slidepdf.com/reader/full/integrated-transit-lab 34/112
INTERCHANGES
600 stations which involve multi-modal interchange
TfL & IPB
stakeholders, such as local authorities, Pvt operators
integrate transport policy within other policy areas such as land use planning and
economic development and prioritize TfL activity
KING’S CROSS INTERCHANGE

8/22/2019 Integrated Transit Lab
http://slidepdf.com/reader/full/integrated-transit-lab 35/112
BUS STOPS
50 mts
20 mts
15 mts
5 mts
5 mts
KING’S CROSS INTERCHANGE
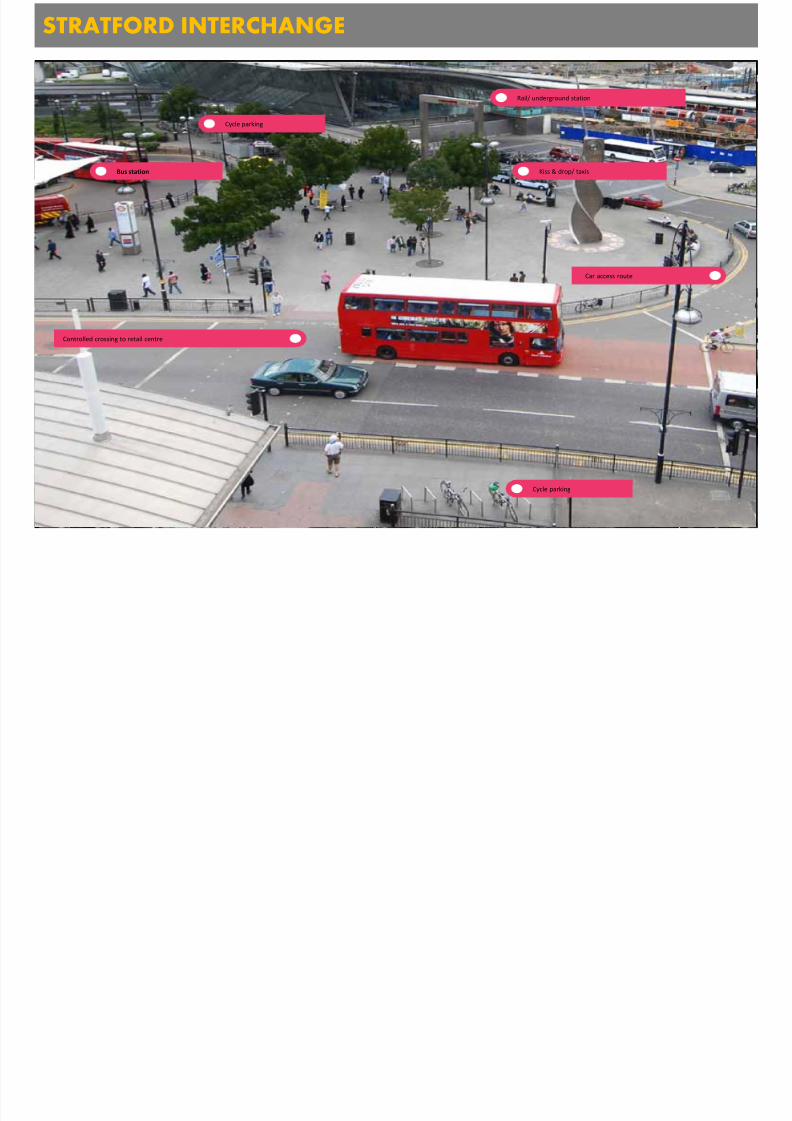
STRATFORD INTERCHANGE

8/22/2019 Integrated Transit Lab
http://slidepdf.com/reader/full/integrated-transit-lab 36/112
LONDON RAIL
FOOT BRIDGE
BUS STOP
PARKING
10m
25 m
Controlled crossing to retail centre
Car access route
Bus station
Rail/ underground station
Kiss & drop/ taxis
Cycle parking
Cycle parking
STRATFORD INTERCHANGE
INTERCHANGE: CROYDON

8/22/2019 Integrated Transit Lab
http://slidepdf.com/reader/full/integrated-transit-lab 37/112
Tram stop
Parking
INTERCHANGE: CROYDON
Bus Stops
INTERCHANGE: CROYDON

8/22/2019 Integrated Transit Lab
http://slidepdf.com/reader/full/integrated-transit-lab 38/112
Tram
Bus
INTERCHANGE: CROYDON
INTERCHANGE: CROYDON

8/22/2019 Integrated Transit Lab
http://slidepdf.com/reader/full/integrated-transit-lab 39/112
Bus Stops
Towards Rail
INTERCHANGE: CROYDON
INTERCHANGE: CROYDON

8/22/2019 Integrated Transit Lab
http://slidepdf.com/reader/full/integrated-transit-lab 40/112
INTERCHANGE: CROYDON
Bus
line
Tram
line
National rail station
45 m
10 m
Integrated bus/ tram stop
Retail centre
FARE ZONES
8/22/2019 Integrated Transit Lab
http://slidepdf.com/reader/full/integrated-transit-lab 41/112
FARE ZONES
'point-to-point‘ according to distance travelled
Bus – Flat fare
Three mile intervals—effectively creating zones
FLAT - FARE
BENEFITS:-
• UNIFIED ACROSS
MODES.
• SIMPLIFYING FARE
ASSIGNMENT.• EASIER COLLECTION. Source: www.tfl .gov.uk
TELESCOPIC FARE
CONTRACT – TfL & TranSys
OPERATOR: EDS & Cubic.
MANAGER: TfLSHAREHOLDERS: Fujitsu, Atkins
INSTITUTIONAL SETUP

8/22/2019 Integrated Transit Lab
http://slidepdf.com/reader/full/integrated-transit-lab 42/112
THE GREATER LONDON AUTHORITY ACT 1999 Established
MAYOR’S
TRANSPORT
STRATEGY
THE GREATER LONDON AUTHORITY
TRANSPORT
FOR LONDON
SUB-REGIONAL
TRANSPORT
PLANS
(London Council &
London Boroughs)
LOCAL
IMPLEMENTATION
PLANS
(London
Boroughs)
•London
Underground•London Rail
•London Surface
Transport
•London Traffic
Control Center
(LTCC)
C o r p o r a t
e
S e r v i c e s
INSTITUTIONAL SETUP
• London Travel
Watch, a bodyappointed by and
reporting to the
Assembly, deals
with complaints
about transport
in London.
• Timetable
integration
• Fare decisions
Work together
Plans
LESSONS

8/22/2019 Integrated Transit Lab
http://slidepdf.com/reader/full/integrated-transit-lab 43/112
LESSONS
Physical Integration:
1. Interchanges – are pedestrian friendly,
step out – step in.
2. Terminals – are pedestrian friendly3. Network – the services are complimentary
and not competing, destination oriented.
Fare Integration:
1. Fare Zones
2. Oyster Card
Institutional Integration:
1. Greater London Authority.
2. Transport for London (TfL)
3. Local authorities.4. Stakeholders
Policy Integration:
1. Greater London Authority Act.
2. Mayor’s Transport Strategy.
3. London Spatial Plan.
4. Economic Development Plan
Transport for London
GLA, TfL, MTS.
HONG KONG
8/22/2019 Integrated Transit Lab
http://slidepdf.com/reader/full/integrated-transit-lab 44/112
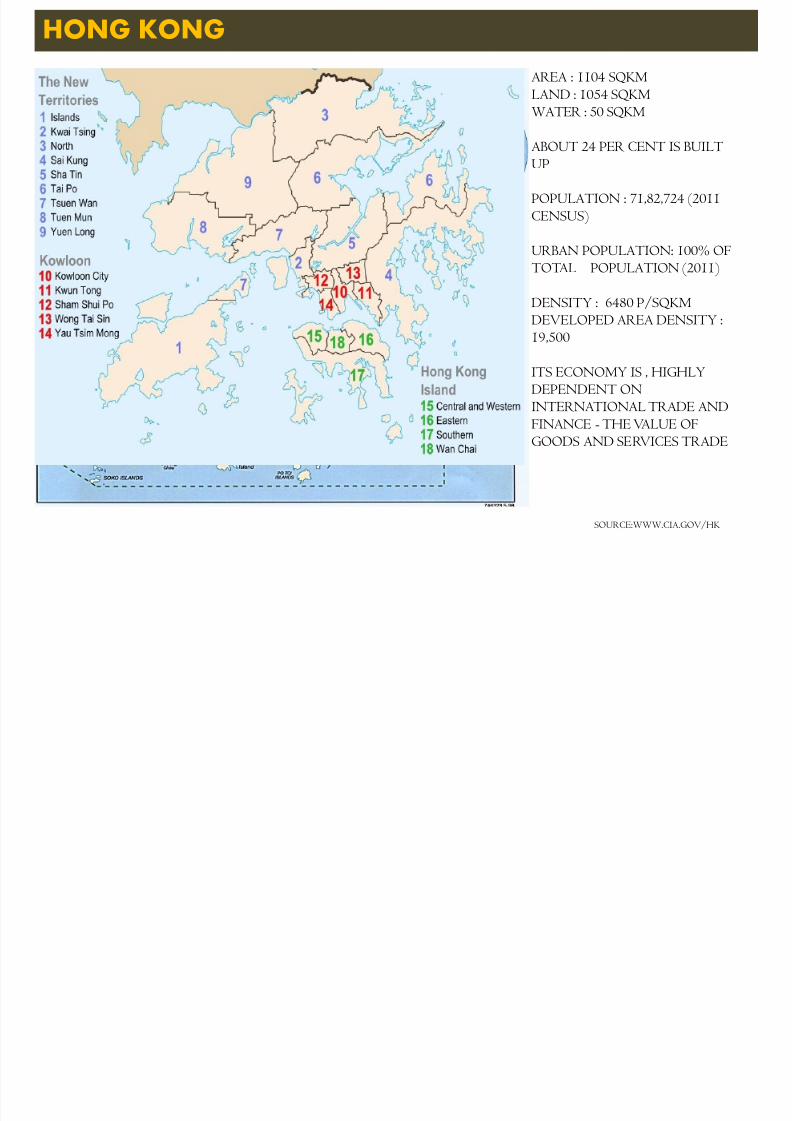
HONG KONG
AREA : 1104 SQKMLAND : 1054 SQKMWATER : 50 SQKM
ABOUT 24 PER CENT IS BUILTUP
POPULATION : 71,82,724 (2011CENSUS)
URBAN POPULATION: 100% OFTOTAL POPULATION (2011)
DENSITY : 6480 P/SQKMDEVELOPED AREA DENSITY :19,500
ITS ECONOMY IS , HIGHLY
DEPENDENT ONINTERNATIONAL TRADE ANDFINANCE - THE VALUE OFGOODS AND SERVICES TRADE
SOURCE:WWW.CIA.GOV/HK
PUBLIC TRANSIT NETWORK AND INTERCHANGES

8/22/2019 Integrated Transit Lab
http://slidepdf.com/reader/full/integrated-transit-lab 45/112
MTR
LIGHT RAIL
TRAM
INTERCHANGES
FERRY
STATION
FUNICULAR
RAILWAY
MTR
NETWORK LENGTH 185 KM
NO. OF PASSENGERS 3.9 MIL(DAILY)LION
TYPE OF LINES 8 LINES
OPERATOR MTRCL
SERVICE TYPES • EXPRESS LINE (TO AIRPORT-35.5 KM)
• LOCAL SERVICE
MODAL SHARE 37 %
LRT
NETWORK LENGTH 36.3 KM
NO. OF PASSENGERS 4,30,000 (DAILY)
TYPE OF LINES 1
OPERATOR MTRCL
SERVICE TYPES • FEEDER TO MTR(WEST RAIL LINE)• LOCAL SERVICE
TRAM
NETWORK
LENGTH
13 KM
NO. OF
PASSENGERS
2,30,000 (DAILY)
TYPE OF ROUTES 7 ROUTES
OPERATOR HONGKONG TRAMWAY LIMITED
FLEET SIZE 164
FUNICULAR RAILWAY
NETWORK LENGTH 1.4 KM
NO. OF PASSENGERS 12,000 (DAILY)
OPERATOR PEAK TRAMWAY COMPANY LIMITED
BUS
NO. OF PASSENGERS 3.4 MILLION (DAILY)
NO. OF ROUTES 517
OPERATORS 6
FLEET SIZE 5800
SERVICE TYPES • LOCAL SERVICE
• FEEDER SERVICE TO RAIL (OPERATED BY MTRCL)
MINI BUS
NO. OF PASSENGERS 1.9 MILLION (DAILY)
NO. OF ROUTES 452
FLEET SIZE 4349
SERVICE TYPES • GREEN BUS SERVICE ( SCHEDULED SERVICE)• RED BUS SERVICE (NON SCHEDULE SERVICE)
YUEN LONG INTERCHANGE
Kowloon TongTsing Yi
Lai King
Nam Cheong
Central
Admiraity
North Point
Quarry Bay
Yau TongTui Keng Leng
Sunny Bay
Tai Wai
Tuen Mun
Siu Hong
Tin Shui Wai
Level 1
Level 2
Level 3
Parameters Considered for Identifying Levels of interchanges:
1. No. of Different Modes
2. Connectivity to Major Locations & Stations
3. No. Of routes
4. NO. Of passengers they carry
CENTRAL STATION
SOURCE:WWW.TD.GOV.HK
TRANSIT NETWORK PATTERN

8/22/2019 Integrated Transit Lab
http://slidepdf.com/reader/full/integrated-transit-lab 46/112
CBD-1
CBD-2
AIRPORT
TOURIST PLACES/
RESIDENTIAL
INDUSTRIAL/
COMMERCIAL/
RESIDENTIALRESIDENTIAL/
COMMERCIAL
SMALL
INDUSTRIES/
VILLAGES
VILLAGES/
RESIDENTIAL/
INDUSTRIES
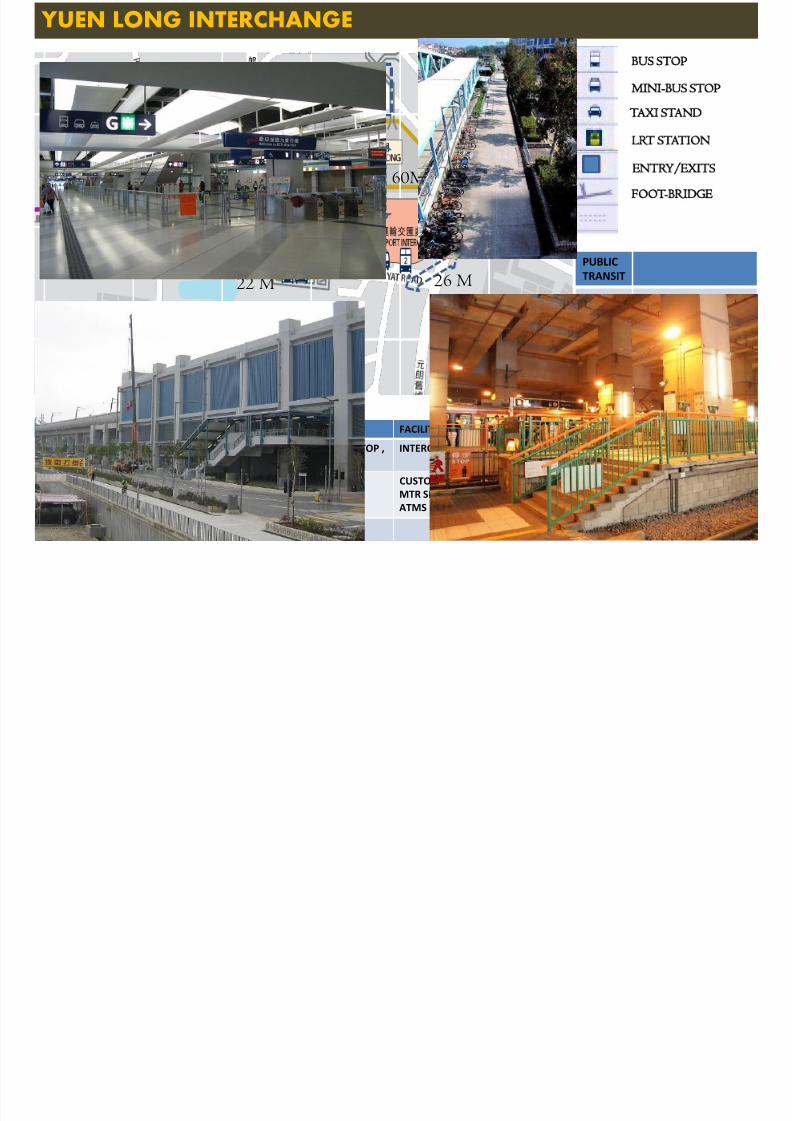
YUEN LONG INTERCHANGE

8/22/2019 Integrated Transit Lab
http://slidepdf.com/reader/full/integrated-transit-lab 47/112
BUS STOP
TAXI STAND
LRT STATION
ENTRY/EXITS
FOOT-BRIDGE
MINI-BUS STOP
MTR
LRT
LEVELS SERVICES FACILITIES
GROUND ENTRY/EXIT , LRT STOP, BUS STOP ,
MINI BUS STOP , TAXI STAND
INTERCHANGE
LEVEL-1 CONCOURSE CUSTOMER SERVICES, TOILETS
MTR SHOPS, TICKET MACHINES,
ATMS
LEVEL-2 PLATFORMS
PARKING
PUBLICTRANSIT
MTR 2 ROUTES
LRT 1 ROUTE
BUS 20 ROUTES
MINI
BUS
15 ROUTES
PARKING
60M
22 M 26 M
services Routes
P 3 30 000
Levels Services
Facilities
G d C Pl f

8/22/2019 Integrated Transit Lab
http://slidepdf.com/reader/full/integrated-transit-lab 48/112
Bus Stop
Minibus stop
Taxi stand
Ferry
Lower Peak Tram Terminus
Exit
Footbridge
Subway
Paseengers 3,30,000
Bus 35
Minibus 27
MTR 5 routes
Tram 4 routes
Ferries 5 routes
Ground Concourse,tram PlatformCustomer Service,ticketing
-L1 Concourse Customer Service, MTR Shops ,Hang Seng Bank, Vending Machines
Octopus Promotion Machine, ATM
-L2 PlatformsCustomer Service, MTR Shops ,Subway To Hong Kong StationOctopus Promotion Machine, I-centre Internet Service
-L3 Platforms
Tsuen Wan Line Towards Tsuen Wan (Admiralty)→
Tsuen Wan Line Towards Tsuen Wan (Admiralty)→
-L4 Platform
Island Line Towards Sheung Wan Terminus)
MTR
TSUEN WAN LINE
TRAM
ISLAND LINE
AIRPORT EXPRESS
TUNG SHUNG LINE
HONG KONG TRAMWAY
210 M630 M
INSTITUTIONAL FRAMEWORK

8/22/2019 Integrated Transit Lab
http://slidepdf.com/reader/full/integrated-transit-lab 49/112
SOURCE:WWW.TD.GOV.HK
Transport and Housing
Bureau
HOUSING DEPARTMENTTRANSPORTATIONDEPARTMENT
The Transport and Housing Bureau is an agency of
the Government of Hong Kong responsible for the
internal and external transportation, including air
services, land transport, maritime transport and
logistics in Hong Kong.
• TO MANAGE TENDERS AND
PRIVATE OPERATERS
• SET FARES
• ALL KIND OF PHYSICAL
PLANNING
• PLAN
ROUTES,STATIONS.ETC
• TO IMPLEMENT THE PLA
• RISPONSIBE FOR
INFRASTRUCTURE
FARE INTEGRATION

8/22/2019 Integrated Transit Lab
http://slidepdf.com/reader/full/integrated-transit-lab 50/112
• OCTOPUS CARD WHICH CAN BE USED IN ANY
PUBLIC TRANSIT MODE,EVEN IN TAXIS TOO.
• THE CARDS ARE USED BY 95% OF HONG KONG’S
POPULATION AGED 16 TO 65.
SOURCE:WWW.TD.GOV.HK
LEARNINGS

8/22/2019 Integrated Transit Lab
http://slidepdf.com/reader/full/integrated-transit-lab 51/112
• Hong Kong Has A Proper Physical Integration Amongst All The Public Transit Modes . Every Mtr Station Has ABus Stop In A Interchange Zone So Every Mtr Station Works As An Interchange.
• Every Ferry Station Has Bus Routes As A Feeder Service.
• A Person Having An Octopus Card Can Travel In All The Public Transit Modes,even In Taxis And Mini Buses Too.
• Only Transport Department Is Responsible For All The Planning , Implementation,set Fares,operating PublicTransits .
FARE INTEGRATION
PHYSICAL INTEGRATION
INSTITUTIONAL INTEGRATION
COPENHAGEN

8/22/2019 Integrated Transit Lab
http://slidepdf.com/reader/full/integrated-transit-lab 52/112
COPENHAGEN
Population :559440(2013)
Area :88.25 sq.km
Density : 645 persons/sq km
Region : HovedstadenMunicipalties:
Copenhagen Municipality
Fredriskberg Municipalty
AE
B
B+
C
H
B A B E
C
F
Source:radiantcopenhagen.net ,,http://denmark.dk/en/quickfacts/facts/
TYPES OF MODES

8/22/2019 Integrated Transit Lab
http://slidepdf.com/reader/full/integrated-transit-lab 53/112
The S-TRAIN sub urban rail consists of
7 lines
Network : 170kmStations : 85 stations
Headway : 10min
Copenhagen Metro consists of two
linesNetwork : 20.5km
Stations :22stations
Headway : 10min
Movia buses- The Movia bus are of two
types A and S as feeder services for the
metro and trains which ply almost
everywhere every 3-7 min.
TYPES OF MODES
Source: http://www.visitcopenhagen.com/copenhagen-tourist http://denmark.dk/en/quickfacts/facts/
CENTRAL STATION- T R A I N A N D B U S I N T E R C H A N G E
8/22/2019 Integrated Transit Lab
http://slidepdf.com/reader/full/integrated-transit-lab 54/112
Source: http://www.visitcopenhagen.com/copenhagen-tourist
BUS STOP
PARKING
CYCLE PARKING
CENTRAL STATION
The station is integrated with bus stops and huge number of NMV facilities which
complement the interchange to be the easily accessible and the most preferred.
NORREPORT STATION- T R A I N , M E T R O , B U S I N T E R C H A N G E

8/22/2019 Integrated Transit Lab
http://slidepdf.com/reader/full/integrated-transit-lab 55/112
80mts
S- TRAINSMETRO
BUSTOP
, ,
Source: http://www.visitcopenhagen.com/copenhagen-tourist
The Metro and S stations being underground stations provide a total interchange zone
encouraging easy access to NMV and pedestrian facilities.
INSTITUTIONAL FRAMEWORK

8/22/2019 Integrated Transit Lab
http://slidepdf.com/reader/full/integrated-transit-lab 56/112
DENMARK MINISTRY OF TRANSPORT
Copenhagen
Centre forBusiness
and Analysis
The executive board
Centre for publicTransport
Centre for Roadsand Bridges
International
Agency
Corporate
centre
Law andContract
unit
Coastal ,Net Denmark, NRA, Road directorate
•Bornholmstrafikken holding A/S,
• DSK
• Metroselskabet/S,
• Naviair
• Portnord AB
• Healthy and belt holding A/S
• Cph City Port I/S
Agencies
Companies
Departments
Source: http://www.trm.dk/en/
Integration of agencies of all modes helps to achieve a huge number of commuters for
making public transport as the preferred mode of travel.
INTEGR ATION : MODE & FARE
8/22/2019 Integrated Transit Lab
http://slidepdf.com/reader/full/integrated-transit-lab 57/112
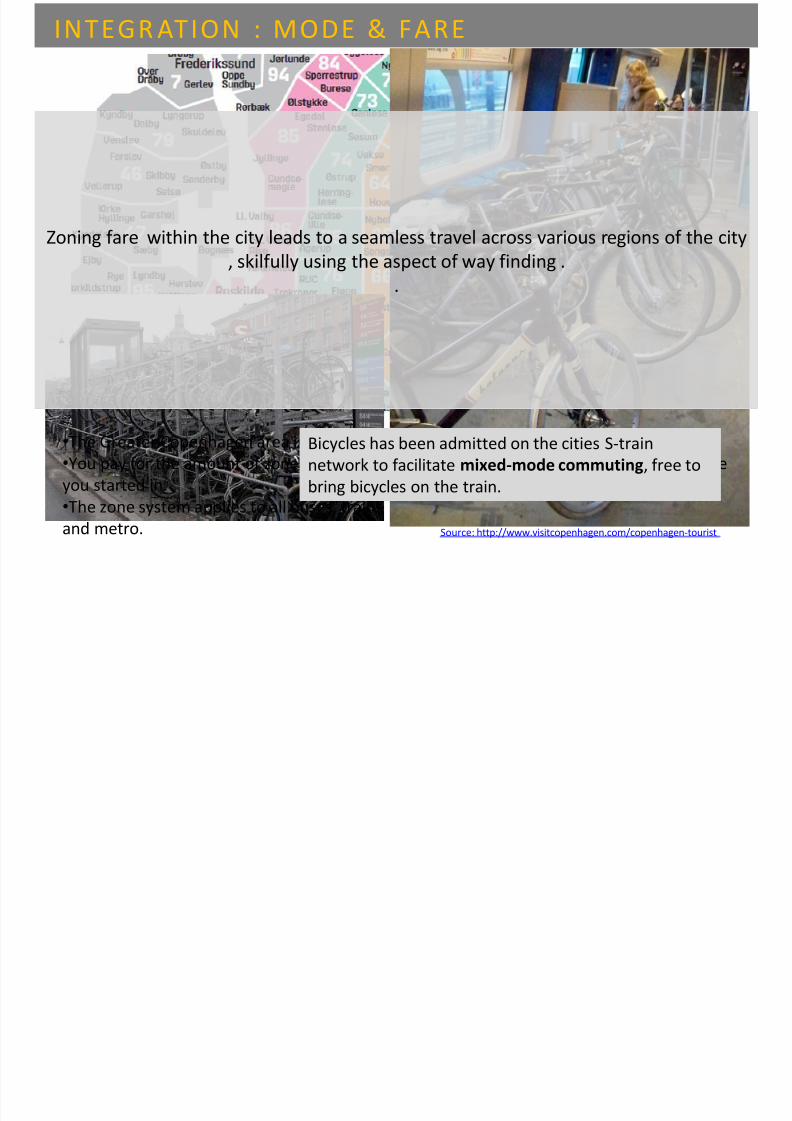
INTEGR ATION : MODE & FARE
•The Greater Copenhagen area is divided into zones.
•You pay for the amount of zone rings you pass through on your journey, including the zone
you started in.
•The zone system applies to all buses, trains
and metro.
Bicycles has been admitted on the cities S-train
network to facilitate mixed-mode commuting, free to
bring bicycles on the train.
Source: http://www.visitcopenhagen.com/copenhagen-tourist
Zoning fare within the city leads to a seamless travel across various regions of the city
, skilfully using the aspect of way finding ..
MUMBAI REGIONAL MAP

8/22/2019 Integrated Transit Lab
http://slidepdf.com/reader/full/integrated-transit-lab 58/112
SOURCE : www.mmrda.gov
PT NETWORK

8/22/2019 Integrated Transit Lab
http://slidepdf.com/reader/full/integrated-transit-lab 59/112
Mumbai City
Western rail
Harbour rail
Central rail
Ghatkopar-Versova
Metro link I Thane
(central + harbour)
Alibaug & Uran to
Gateway of India
Sanjay Gandhi
National Park
Metro Phase II
FORT
BANDRA
BANDRA KURLACOMPLEX
ANDHERIMULUND
VASHI
CBD-BELAPUR
PT NETWORK
Major CBDs
RAIL NETWORK

8/22/2019 Integrated Transit Lab
http://slidepdf.com/reader/full/integrated-transit-lab 60/112
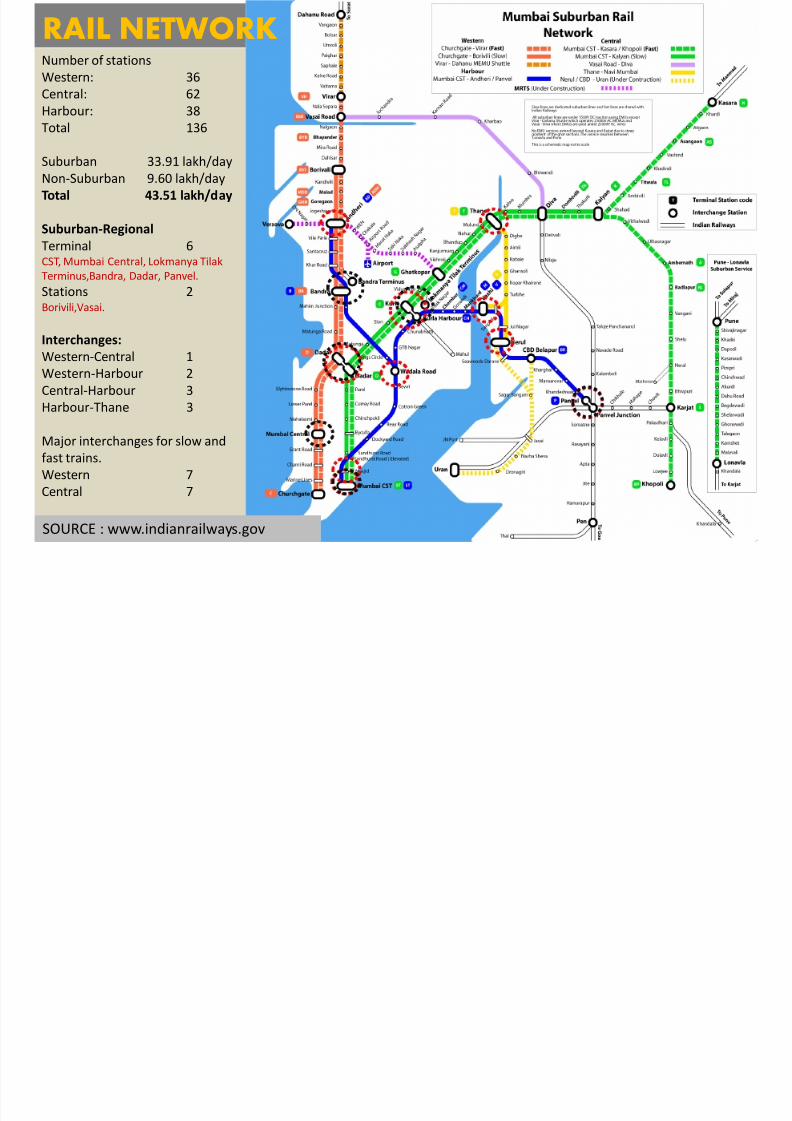
Number of stations
Western: 36
Central: 62
Harbour: 38
Total 136
Suburban 33.91 lakh/day
Non-Suburban 9.60 lakh/day
Total 43.51 lakh/day
Suburban-Regional
Terminal 6
CST, Mumbai Central, Lokmanya TilakTerminus,Bandra, Dadar, Panvel.
Stations 2Borivili,Vasai.
Interchanges:
Western-Central 1
Western-Harbour 2
Central-Harbour 3Harbour-Thane 3
Major interchanges for slow and
fast trains.
Western 7
Central 7
SOURCE : www.indianrailways.gov
O
RAIL-BUS INTERCHANGE FACILITY AT BANDRA
8/22/2019 Integrated Transit Lab
http://slidepdf.com/reader/full/integrated-transit-lab 61/112
BANDRA BUS DEPOT
BUS STOP40 MTS
`
`BANDRA
STATION• All railway stations of Mumbai posses interchange facility outside the railway station complex
with BUS stops.
Bus stop
Railway station complex
INTERCHANGE ZONE
SKYWALKS CONNECTING EAST(BKC) & WEST BANDRA
East - 1.3km and West - 0.86km
39%
32%
16%
13%
Preferred Modes
Pedestrians
Bus
Auto Rickshaw
Other
SOURCE :Report on effectiveness of skywalks in Mumbai, Samik Sajal Roy.
ORGANISATIONALSTRUCTURE

8/22/2019 Integrated Transit Lab
http://slidepdf.com/reader/full/integrated-transit-lab 62/112
STRUCTURE
LEARNINGS

8/22/2019 Integrated Transit Lab
http://slidepdf.com/reader/full/integrated-transit-lab 63/112
• Unlike international cities, there is no fare integration between different publictransport modes (rail and bus) in Mumbai.
• In Mumbai all railway stations act as interchange stations with buses. Buses actas feeder to suburban train facility.
• There is also a regional rail and suburban rail interchange facility on majorregional terminal stations . The seamless interchange facility between suburbanand regional rail encourages people to use suburban railway.
PHYSICALINTEGRATION
FAREINTEGRATION
INSTITUTIONALSTRUCTURING
POLICYINTEGRATION
NETWORKDESIGN
LAND USE ANDTRANSPORT
INTEGRATION
8/22/2019 Integrated Transit Lab
http://slidepdf.com/reader/full/integrated-transit-lab 64/112
SINGAPORE
High percentage of activities concentratedwithin walking distance of stations and the ease withwhich stations are reachedeither by foot or bytransit.
Distance based fareIntegration
Singapore LTA isresponsible for entireregulation of transport
systems
Concet plan that act as agudeline to the masterplan
Heavy rails are planned for thehigh density corridors andLRTs are planned forResidential developments. Thebus services will act as feederroutes to complement thoseservices
Provided High density areasalong transit station thuscreating enough demand for the
transit systems.
A mix of land use can be foundat every station providing everykind of facilities for thecommuters. Vertical level of
integration happens level retailand commercial sectors willraise funds for the Transitcompany
CURTIBA
Sustainable UrbanDevelopment : TrinarySystem based on land use,street network and publicTransport system with
economic, social andenvironmentaldevelopment.
Distance based
Single fare system
Curitiba is havingresearch centre forpublic transportIPPUC.Well integrationbetween authoritiesfrom urban tometropolitan level
----- Ring and Radial pattern
Provided High density areasalong transit lines thus creatingenough demand for the transitsystems.
LONDON
CBD/ Commercial areasnear the stations, also thestations are like a step out-step in system- pedestrianfriendly
Fare zones - basedfare, smart cardOyster- across all
modes
TfL has the soleauthority - in terms of services and plans
Mayor's transportstrategy acts hand inhand with the spatialplan and the economicdevelopment plan.
the services are planned suchthat there are no majoroverlaps, the services
complement each other.
transport strategy works withthe spatial plan, at both the planlevel, and also theimplementation at the boroughlevel.
PHYSICALINTEGRATION
FAREINTEGRATION
INSTITUTIONALSTRUCTURING POLICY INTEGRATION
NETWORKDESIGN
LAND USE ANDTRANSPORT
INTEGRATION

8/22/2019 Integrated Transit Lab
http://slidepdf.com/reader/full/integrated-transit-lab 65/112
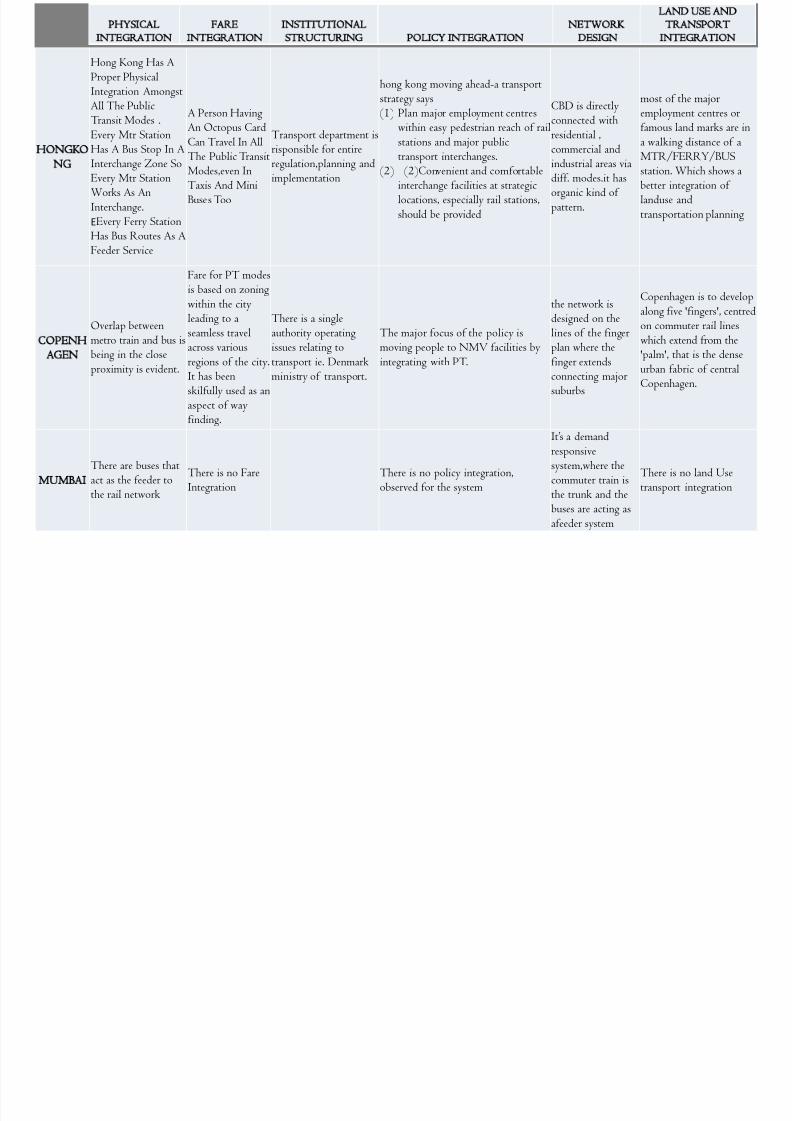
HONGKONG
Hong Kong Has AProper PhysicalIntegration AmongstAll The PublicTransit Modes .
Every Mtr StationHas A Bus Stop In AInterchange Zone SoEvery Mtr StationWorks As AnInterchange.EEvery Ferry StationHas Bus Routes As AFeeder Service
A Person HavingAn Octopus CardCan Travel In AllThe Public TransitModes,even InTaxis And MiniBuses Too
Transport department isrisponsible for entireregulation,planning andimplementation
hong kong moving ahead-a transportstrategy says(1) Plan major employment centres
within easy pedestrian reach of railstations and major publictransport interchanges.
(2) (2)Convenient and comfortableinterchange facilities at strategiclocations, especially rail stations,should be provided
CBD is directlyconnected with
residential ,commercial andindustrial areas viadiff. modes.it hasorganic kind of pattern.
most of the majoremployment centres orfamous land marks are ina walking distance of aMTR/FERRY/BUSstation. Which shows abetter integration of landuse andtransportation planning
COPENHAGEN
Overlap betweenmetro train and bus isbeing in the closeproximity is evident.
Fare for PT modesis based on zoningwithin the cityleading to aseamless travelacross variousregions of the city.It has been
skilfully used as anaspect of wayfinding.
There is a singleauthority operatingissues relating totransport ie. Denmarkministry of transport.
The major focus of the policy ismoving people to NMV facilities byintegrating with PT.
the network isdesigned on thelines of the fingerplan where thefinger extendsconnecting major
suburbs
Copenhagen is to developalong five 'fingers', centredon commuter rail lineswhich extend from the'palm', that is the denseurban fabric of centralCopenhagen.
MUMBAIThere are buses thatact as the feeder tothe rail network
There is no FareIntegration
There is no policy integration,observed for the system
It’s a demand
responsivesystem,where thecommuter train isthe trunk and thebuses are acting asafeeder system
There is no land Usetransport integration

8/22/2019 Integrated Transit Lab
http://slidepdf.com/reader/full/integrated-transit-lab 66/112
AHMEDABAD
SPATIAL GROWTH
8/22/2019 Integrated Transit Lab
http://slidepdf.com/reader/full/integrated-transit-lab 67/112
Source: AUDA Development Plan 2021
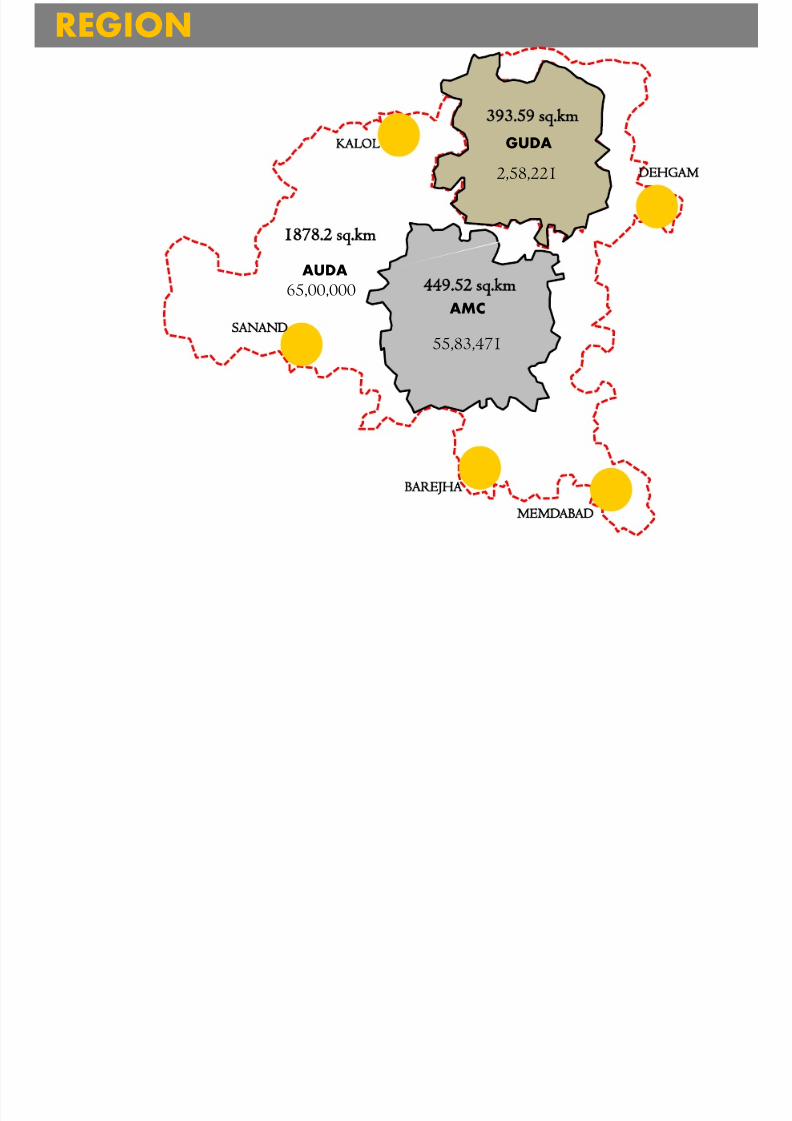
REGION
8/22/2019 Integrated Transit Lab
http://slidepdf.com/reader/full/integrated-transit-lab 68/112
AMC
GUDA
SANAND
BAREJHA
MEMDABAD
DEHGAM
KALOL
AUDA449.52 sq.km
55,83,471
1878.2 sq.km
65,00,000
393.59 sq.km
2,58,221
REGION

8/22/2019 Integrated Transit Lab
http://slidepdf.com/reader/full/integrated-transit-lab 69/112
• Population:32,417• Distance: 25 kms• Tata nano project• Industrial hub
• Population: 1,12,013• Distance:30 kms• SEZ
• General motors,AMBEinternational, CEAT tyre etc
• Population: 38,123• Distance: 32 kms• Ahmedabad & Gandhinagar in
close proximity• Emerging spot for real estate
• Population: 38000• Distance:42.7 kms• Small scale industries
• Developing as cultural heritage
NETWORK

8/22/2019 Integrated Transit Lab
http://slidepdf.com/reader/full/integrated-transit-lab 70/112
Well developed ring radial system in Ahmedabadand grid iron in Gandhinagar
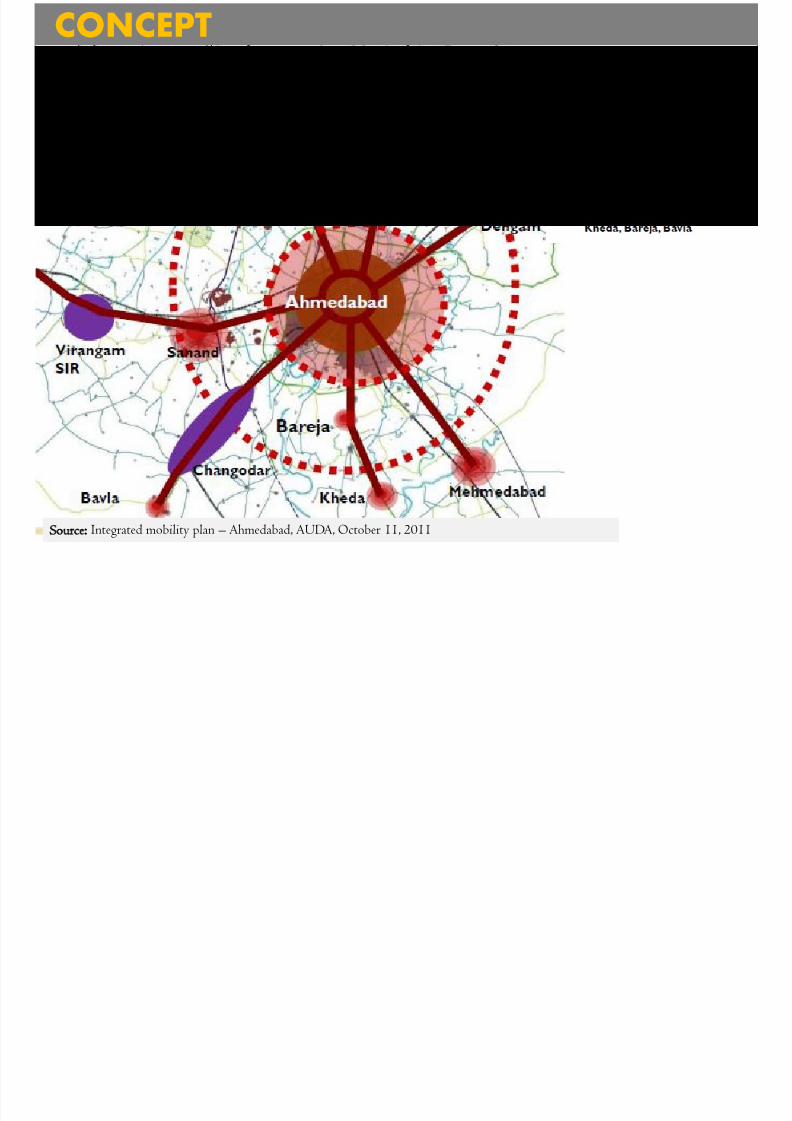
CONCEPT
8/22/2019 Integrated Transit Lab
http://slidepdf.com/reader/full/integrated-transit-lab 71/112
Source: Integrated mobility plan – Ahmedabad, AUDA, October 11, 2011
Ahmedabad city has a population of 6.35 million according to the 2011 census report, withan economic influence area of 45Kms outward from the periphery of the city.
The city also has a continuous inflow of population, and as the population increases so doesthe pressure on the public amenities.
Transport being one of them.
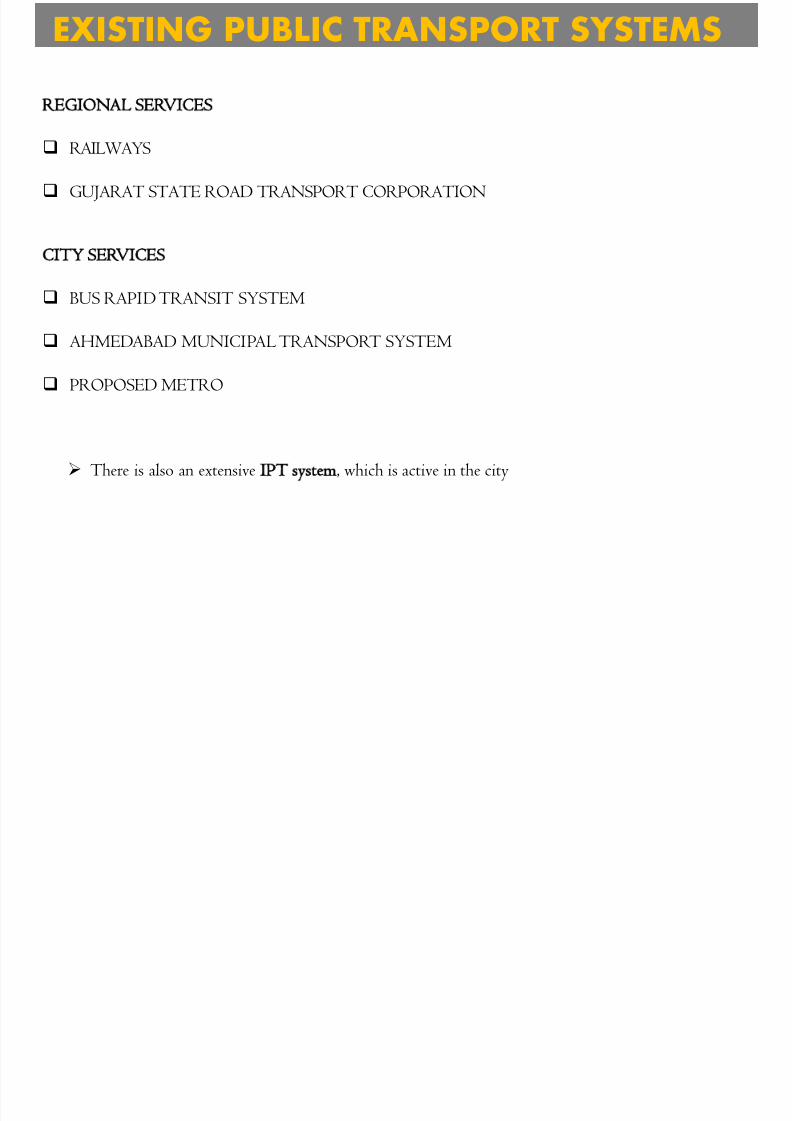
EXISTING PUBLIC TRANSPORT SYSTEMS

8/22/2019 Integrated Transit Lab
http://slidepdf.com/reader/full/integrated-transit-lab 72/112
REGIONAL SERVICES
RAILWAYS
GUJARAT STATE ROAD TRANSPORT CORPORATION
CITY SERVICES
BUS RAPID TRANSIT SYSTEM
AHMEDABAD MUNICIPAL TRANSPORT SYSTEM
PROPOSED METRO
There is also an extensive IPT system, which is active in the city
RAILWAYS
8/22/2019 Integrated Transit Lab
http://slidepdf.com/reader/full/integrated-transit-lab 73/112
Meter Gauge
Broad Gauge
Corridor kilometres:Within AUDA
Broad Gauge- 117.4 kms
Metre Gauge- 51.6 kmsWithin AMC
Broad Gauge – 44.6 kms
Metre Gauge – 35.9 kms
TOWARDS
VADODARA
TOWARDS
DHOLKA
TOWARDS
VIRAMGAM
TOWARDS
MEHSANA
Source- Working Time Table No. 88 Ahmedabad Division (01/07/2013), Western Railway
RAILWAY
LINE
Inference:
Metro/ Proposed
Regional Rail can be run
on all existing and
proposed broad gauge
lines.
Electrified
Non Electrified
RAILWAYS

8/22/2019 Integrated Transit Lab
http://slidepdf.com/reader/full/integrated-transit-lab 74/112
TOWARDS
VADODARA
TOWARDS
DHOLKA
TOWARDS
VIRAMGAM
TOWARDS
MEHSANADAILY
TRAINS
25>75- 50
50- 25
in %
Total trains in/out of
Ahmedabad daily: 236
Source- Working Time Table No. 88 Ahmedabad Division (01/07/2013), Western Railway
Inference:
Trains passing through
North-South corridors
need to be looked into foreffective decentralization
of Kalupur.
Apart from trains comingfrom Dholka, all other
trains come till Kalupur
station, putting a huge
demand on roads and PT
near Kalupur.
RAILWAYS

8/22/2019 Integrated Transit Lab
http://slidepdf.com/reader/full/integrated-transit-lab 75/112
TOWARDS
VADODARA
TOWARDS
DHOLKA
TOWARDS
VIRAMGAM
TOWARDS
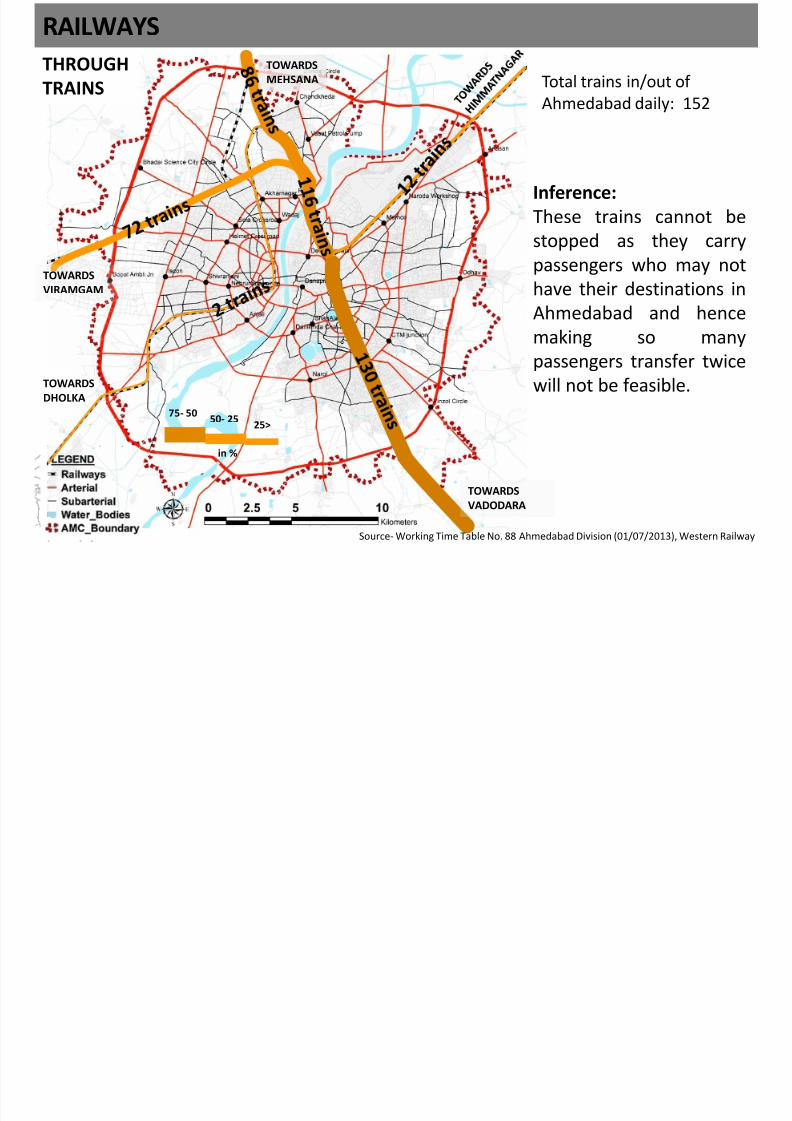
MEHSANATHROUGH
TRAINS
25>75- 50
50- 25
in %
Total trains in/out of
Ahmedabad daily: 152
Source- Working Time Table No. 88 Ahmedabad Division (01/07/2013), Western Railway
Inference:
These trains cannot be
stopped as they carry
passengers who may nothave their destinations in
Ahmedabad and hence
making so many
passengers transfer twice
will not be feasible.
RAILWAYS

8/22/2019 Integrated Transit Lab
http://slidepdf.com/reader/full/integrated-transit-lab 76/112
TOWARDS
VADODARA
TOWARDS
DHOLKA
TOWARDS
VIRAMGAM
TOWARDS
MEHSANATERMINATING
TRAINS Total trains terminating at
Ahmedabad daily: 84
Source- Working Time Table No. 88 Ahmedabad Division (01/07/2013), Western Railway
Inference:
These trains can be
stopped at the periphery
from where thepassengers can transfer
to a high frequency Mass
transit system for
accessing the city.
25>50- 25
in %
RAILWAYS

8/22/2019 Integrated Transit Lab
http://slidepdf.com/reader/full/integrated-transit-lab 77/112
TOWARDS
VADODARA
TOWARDS
DHOLKA
TOWARDS
VIRAMGAM
TOWARDS
MEHSANA
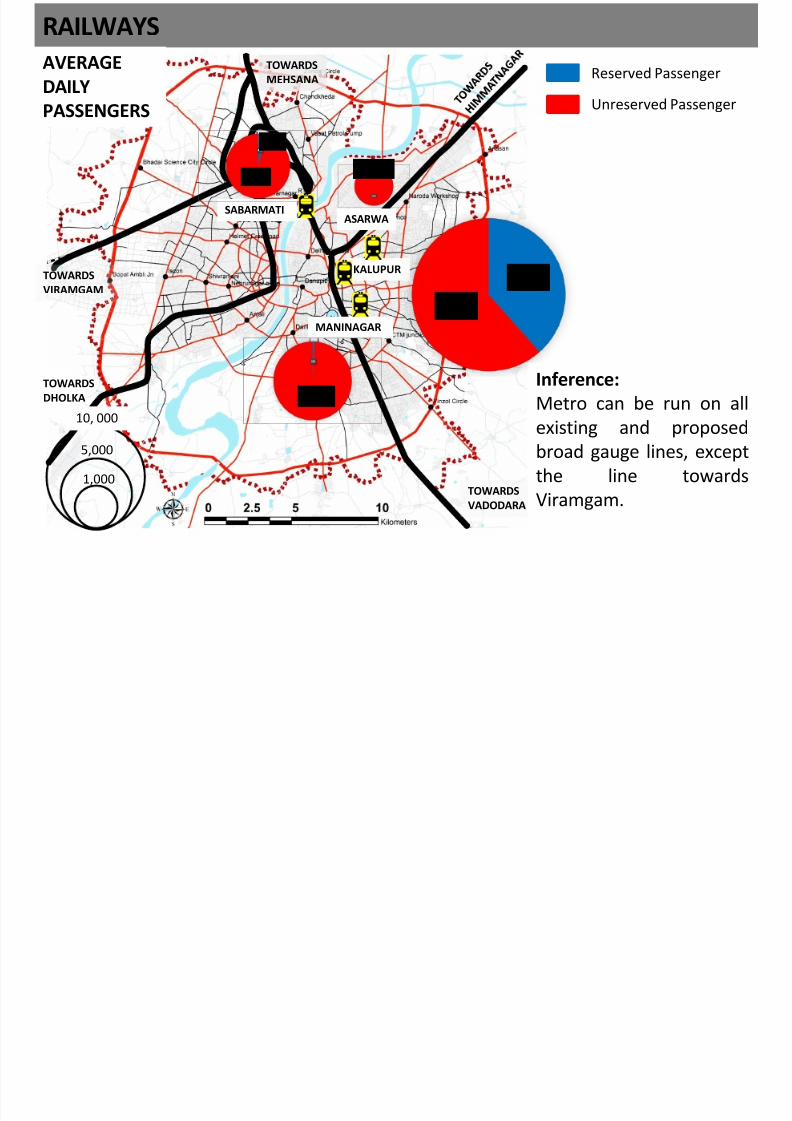
AVERAGE
DAILY
PASSENGERS
KALUPUR
MANINAGAR
62%
38%
99%
10, 000
5,000
1,000
ASARWA
100%
SABARMATI
96%
4%
Inference:
Metro can be run on all
existing and proposed
broad gauge lines, except
the line towards
Viramgam.
Reserved Passenger
Unreserved Passenger
RAILWAYS

8/22/2019 Integrated Transit Lab
http://slidepdf.com/reader/full/integrated-transit-lab 78/112
KALUPUR
GERATPUR
VATVA GIDC
VATVA
JASHODA NAGAR
MANINAGAR
ASARWA
MEGHANI NAGAR
SARDARGRAM
NARODA
SARASPUR
SABARMATI
RANIP
D-CABIN
TRAGAD
NATIONAL MEMORIAL
TOWARDS
VADODARA
TOWARDS
VIRAMGAM
TOWARDS
MEHSANAREGIONAL
RAIL
Source- AUDA Development Plan 2021
Inference:
A RRTS has already been
proposed in AUDA DP
2021 which can act as
high frequeny mass
transit system for people
to access the city.
Proposed RRTS
Proposed RRTS
StopsProposed BRTS
Corridor
RAILWAYS

8/22/2019 Integrated Transit Lab
http://slidepdf.com/reader/full/integrated-transit-lab 79/112
SABARMATI
KALUPUR
TOWARDS
VADODARA
TOWARDS
VIRAMGAM
TOWARDS
MEHSANA
Proposed BRTS
Corridor
Proposed RRTS
Proposed MetroCorridor
Reasons for Sabarmati:
• All north bound trains
terminating at Kalupur
pass through Sabarmati.• Various modes like RRTS,
Metro, BRTS and AMTS
are available at this
station.
Implications:
• Demand at Kalupur will bereduced by nearly 12,000
passengers, out of which
64.5% passengers will get
direct access to their
destinations through RRTS
or BRTSSource- AUDA Develo ment Plan 2021 Primar Surve 2013
Trains That Originate and Terminate at Ahmedabad PHASE 1
8/22/2019 Integrated Transit Lab
http://slidepdf.com/reader/full/integrated-transit-lab 80/112
Sabarmati stn.
Kalupur stn.
Out of the total 80
trains originating and
terminating at Kalupur,
North bound trains
which currently
terminate at Kalupur
are proposed to be
halted at Sabarmati,
i.e 38 trains.
The south bound trains
will be terminated at
Kalupur,
i.e 42 trains.
Trains That Pass Through Ahmedabad PHASE 1

8/22/2019 Integrated Transit Lab
http://slidepdf.com/reader/full/integrated-transit-lab 81/112
Sabarmati stn.
Kalupur stn.
We also propose to halt
72 (north bound) trains
at Kalupur and the
remaining 58 trains at
Sabarmati, thus
reducing the total
(north bound) trains
stopping at Kalupur
from 116 to 72, inturn
leading to a reductionin footfall at Kalupur.
PHASE 1
8/22/2019 Integrated Transit Lab
http://slidepdf.com/reader/full/integrated-transit-lab 82/112
The total number of trains thus stopping at Kalupur and Sabarmati as per scenario 1 are as
follows:-
Originating/Terminating trains Through trains
Existing Proposed Proposed
Kalupur 80 42 72
Sabarmati 0 38 58
Thus the total number of trains that are proposed to be catered by Sabarmati is 96 and that by
Kalupur is 140 against an existing of 236 trains.
As the area available in Sabarmati is equivalent to that of Kalupur, it is proposed as a potential
interchange and terminal station similar to that of Kalupur.
By the above proposal, an approximate shift of 22780 daily passengers (40.6% of the total
passenger traffic) can be achieved from Kalupur to Sabarmati station, thus reducing thepassenger traffic flow from 56000 to 33220.
(The total passenger traffic flow at Kalupur station is around 25,000 daily commuters and 22,000 long
distance travellers – source DP 2012.)
Interchange at Sabarmati

8/22/2019 Integrated Transit Lab
http://slidepdf.com/reader/full/integrated-transit-lab 83/112
Sabarmati
Railway Station
Railway LineMajor Roads
BRTS Corridor
Metro Corridor
BRT Stop
Proposed BRT
Stop
RTO BRT
Stop
RTO BRT
Stop
PHASE 1

8/22/2019 Integrated Transit Lab
http://slidepdf.com/reader/full/integrated-transit-lab 84/112
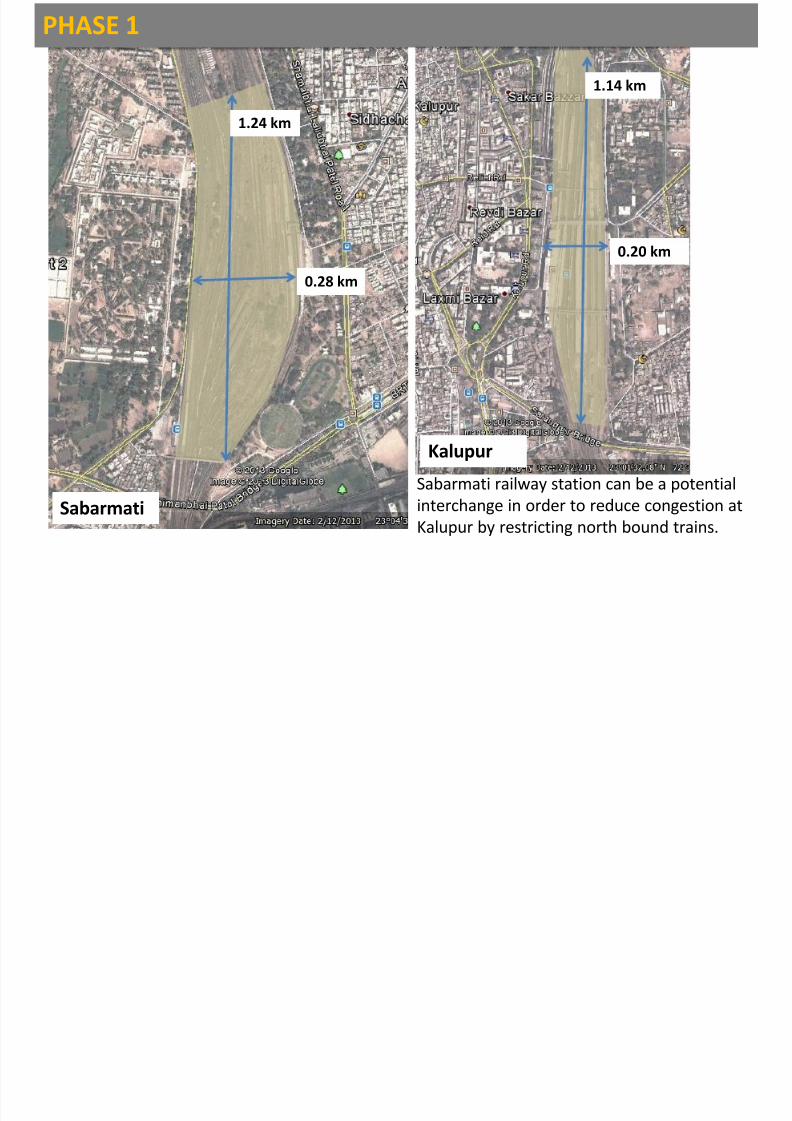
1.24 km
0.28 km
0.20 km
1.14 km
Sabarmati
Kalupur
Sabarmati railway station can be a potential
interchange in order to reduce congestion at
Kalupur by restricting north bound trains.
TOWARDS
RAILWAYS

8/22/2019 Integrated Transit Lab
http://slidepdf.com/reader/full/integrated-transit-lab 85/112
SABARMATI
KALUPUR
TOWARDS
VADODARA
TOWARDS
VIRAMGAM
TOWARDS
MEHSANA
CADILLA
BRIDGE
Proposed BRTS
Corridor
Proposed RRTS
Proposed Metro
Corridor
Reasons for Cadilla Bridge:
• Strategic location of
station in between Metro
and BRTS corridor and
AMTS route.
• Space available at Vatva
for Rail yard.
Implications:
• Demand at Kalupur will be
reduced by nearly 43,000passengers, out of which
46.6% passengers will get
direct access to their
destinations through
RRTS, Metro, BRTS and
AMTS.
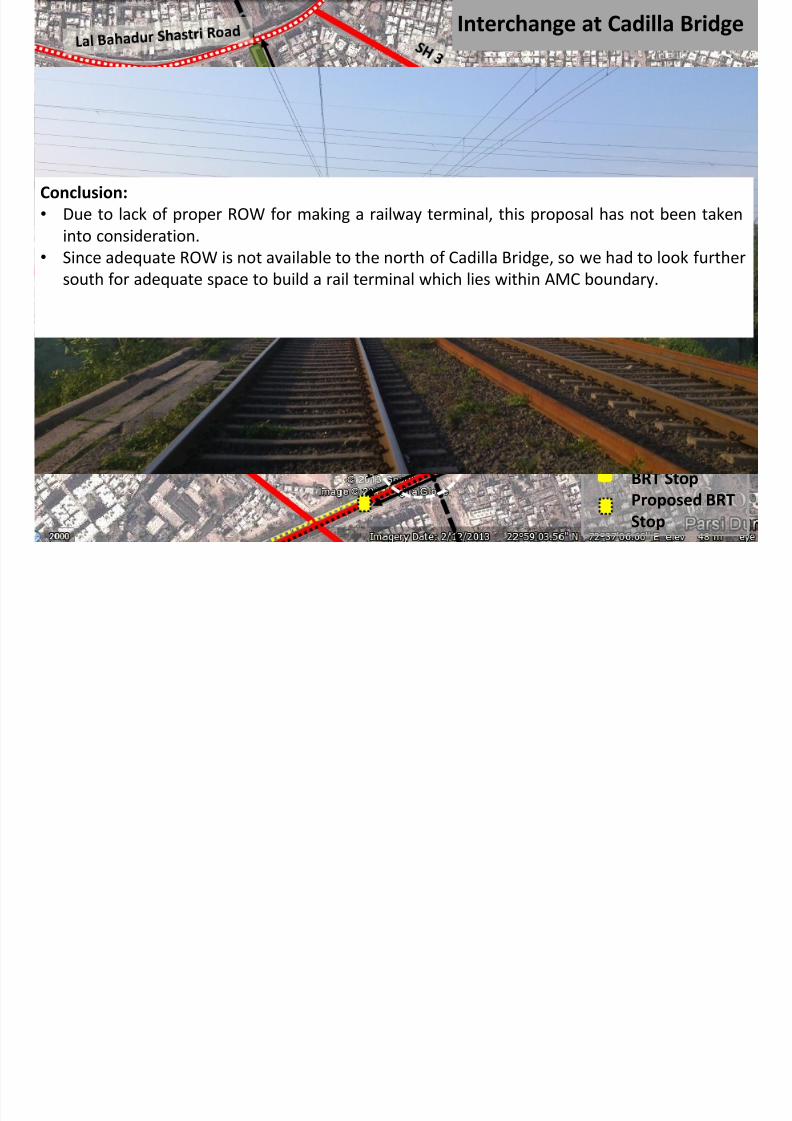
Interchange at Cadilla Bridge

8/22/2019 Integrated Transit Lab
http://slidepdf.com/reader/full/integrated-transit-lab 86/112
Railway LineMajor Roads
BRTS Corridor
Metro Corridor
BRT Stop
Proposed BRT
Stop
Jashoda NagarBRT Stop
Proposed
ROB
Conclusion:
• Due to lack of proper ROW for making a railway terminal, this proposal has not been taken
into consideration.
• Since adequate ROW is not available to the north of Cadilla Bridge, so we had to look further
south for adequate space to build a rail terminal which lies within AMC boundary.
TOWARDS
RAILWAYS

8/22/2019 Integrated Transit Lab
http://slidepdf.com/reader/full/integrated-transit-lab 87/112
SABARMATI
KALUPUR
TOWARDS
VADODARA
TOWARDS
VIRAMGAM
TOWARDS
MEHSANA
CADILLA
BRIDGE
VATVA GIDC
Proposed BRTS
Corridor
Proposed RRTS
Proposed Metro
Corridor
Reasons for Vatva GIDC:
• Better accessibility to both
GSRTC and BRTS.
• Close proximity to SP Ring
Road will ensure
accessibility to other mass
transit systems that may
come up in future, apart
from RRTS.
Implications:
• Demand at Kalupur will bereduced by nearly 43,000
passengers, out of which
46.6% passengers will get
direct access to their
destinations through RRTS
or BRTSSource- AUDA Develo ment Plan 2021 Primar Surve 2013
RAILWAYS – VATVA GIDC BRIDGE

8/22/2019 Integrated Transit Lab
http://slidepdf.com/reader/full/integrated-transit-lab 88/112
VATVA
GERATPUR
VATVA GIDC

8/22/2019 Integrated Transit Lab
http://slidepdf.com/reader/full/integrated-transit-lab 89/112
Existing- Double line Broad
Gauge
Unutilized ROW- 26.5 m
Source: Feasibilty of Existing Rail System to Enhance Mobility Needs of Ahmedabad Region
(Batch 2010- 14)
Conclusion:
• Since this lies right on the outskirts of the city, so this proposal can be taken up as phase II
which can be implemented once the city grows further and a mass transit system has been
proposed on the SP Ring Road.
8/22/2019 Integrated Transit Lab
http://slidepdf.com/reader/full/integrated-transit-lab 90/112
GSRTC
GSRTC – AN INTRODUCTION
8/22/2019 Integrated Transit Lab
http://slidepdf.com/reader/full/integrated-transit-lab 91/112
GSRTC was established in 1960 under the Road Transport Corporation Act of 1950.
The Motor Vehicles Act of 1939 was intended for regulation and co-ordination of road transport
and to vest the control of the use of transport vehicles in the hand of the transport authorities.
At present GSRTC have 16 Divisions and 128 Depots in its overall organization system.
TYPES OF SERVICES PROVIDED :
MOFFUSIL SERVICES: connects major cities, smaller towns and villages within Gujarat.
INTERCITY SERVICES: connects major cities- Ahmedabad, Rajkot, and Baroda.
INTERSTATE SERVICES: connects various cities of Gujarat to the neighbouring States.
PARCEL SERVICES: are available for transporting goods.
CITY SERVICES: provides city bus services at Surat, Baroda, Rajkot and Gandhinagar
NORTH (308)
EXISTING GSRTCCORRIDORS

8/22/2019 Integrated Transit Lab
http://slidepdf.com/reader/full/integrated-transit-lab 92/112
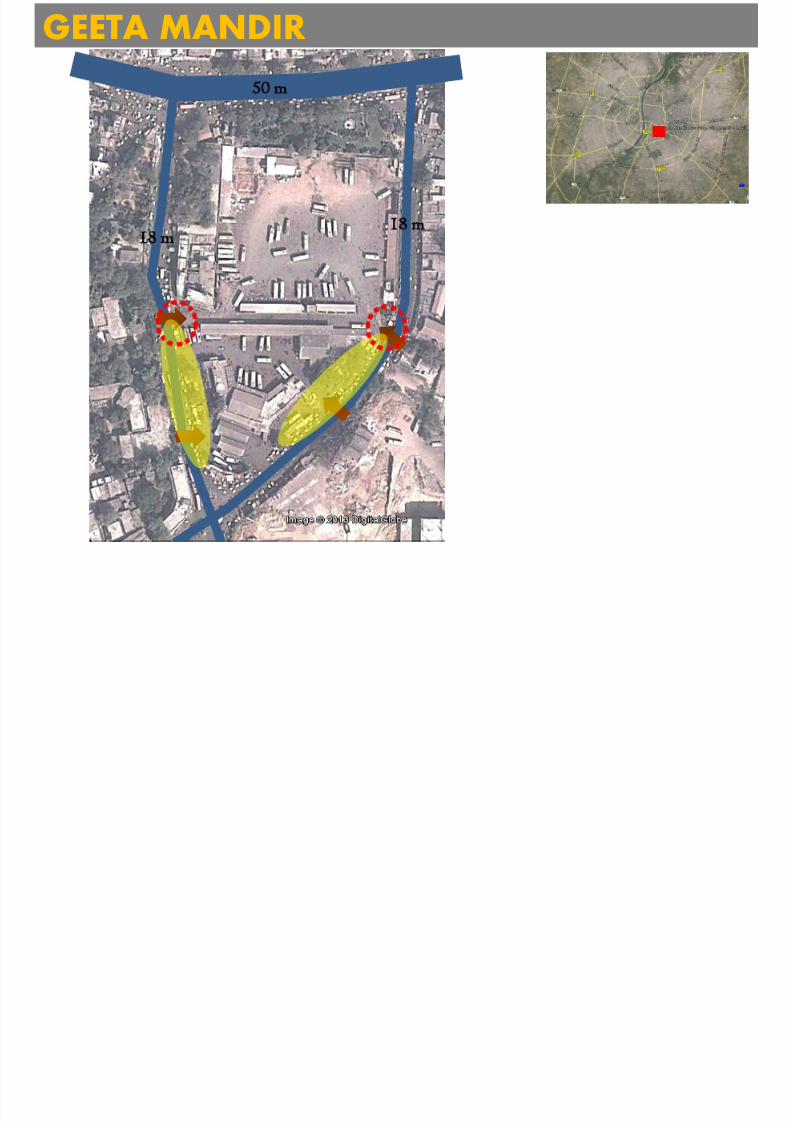
GEETA MANDIR
NORTH EAST (340)
SOUTH WEST (323)
SOUTH WEST (375)
SOUTH (493)SOUTH EAST
(195)
SOUTH EAS(106)
EAST (160)
NORTH WEST (40)
NARODA
RANIP
NORTH WEST (392)
Total No. of buses - 2732
NORTH Mehasana, palanpur,Tharad, Deesa,
Bahuchraji, Patan, kadiNORTHEAST
Gandhinagar, Visnagar,Kheralu, Vijapur, ManasaDehgam, Modasa,Himmatnagar, Ambaji,Kapadwanj, lunawada
SOUTH
EAST
Nadiad, Anand, Baroda,
Surat, Valsad, Dahod,Godhra
SOUTHWEST
Rajkot, Bhavnagar,Ambreli, Jamnagar,
Junagadh, Dwaraka,Somnath, Dhandhukwa,Dhorka, Sanand,
Viramgam, Bawda
2732
GEETA MANDIR - STATISTICS

8/22/2019 Integrated Transit Lab
http://slidepdf.com/reader/full/integrated-transit-lab 93/112
Total Buses at C.B.S 2732
Average Number of Buses PerHour in day
194.91
Average Number of Buses per minin day
3.24
Morning peak hour (8:00 am to 12:00 pm)
Total Buses 1248
Buses (per hour) 312Buses per min 5.2
Evening peak hour (14:00 to 18:00)
Total Number of buses 960
Buses (per hour) 240Buses per min 4
Non peak Hour
Total buses in Non peak Hour 524
Buses (per hour) 32.75
Buses per min 0.545833
Observations from Survey:
Departures > Arrivals
Occupancy of buses arriving at Geeta Mandir
is 30%
0
50
100
150
200
250
300GSRTC
No. of buses arrived No. of buses departed
GEETA MANDIR

8/22/2019 Integrated Transit Lab
http://slidepdf.com/reader/full/integrated-transit-lab 94/112
50 m
18 m18 m

8/22/2019 Integrated Transit Lab
http://slidepdf.com/reader/full/integrated-transit-lab 95/112
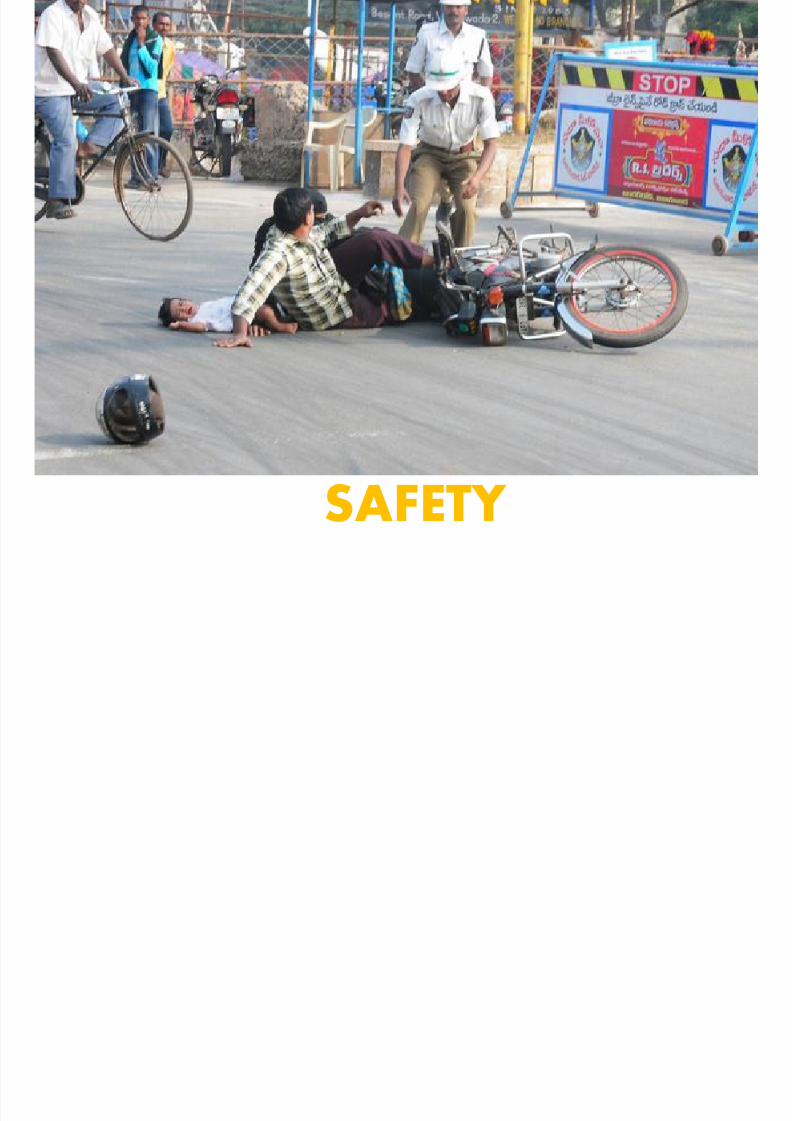
SAFETY
ACCIDENT PRONE STRETCHES

8/22/2019 Integrated Transit Lab
http://slidepdf.com/reader/full/integrated-transit-lab 96/112
Source: Presentation on ‘Capacity of ULBs for Road Safety’ – Centre of Excellence, 2012
SAFETY

8/22/2019 Integrated Transit Lab
http://slidepdf.com/reader/full/integrated-transit-lab 97/112
RESPONSIBLE MODE NO.2 WHEELER 50 16.13%3 WHEELER 33 10.65%
4 WHEELER - CAR, JEEP, SUV 48 15.48%
AMTS 7 2.26%BRTS 2 0.65%
GSRTC & PRIVATE 18 5.81%TRUCK & MULTI AXEL 107 34.52%
OTHERS 8 2.58%UNKNOWN 37 11.94%
310
16%
11%
15%
2%%
6%
34%
3% 12%
Responsible Modes
2 WHEELER
3 WHEELER
4 WHEELER - CAR, JEEP, SUV
AMTS
BRTS
GSRTC & PRIVATE
TRUCK & MULTI AXEL
OTHERS
UNKNOWN
Fatal Accidents FIR- 310RESPONSIBLE MODES IN FATAL ACCIDENTS
Source: Presentation on ‘Capacity of ULBs for Road Safety’ – Centre of Excellence, 2012

8/22/2019 Integrated Transit Lab
http://slidepdf.com/reader/full/integrated-transit-lab 98/112
SCENARIO
DECENTRALIZING BUS TERMINALS
Proposed bus terminalsFROM NORTH GUJARAT
AND GANDHINAGAR FROM NORTH-EAST
(HIMMATNAGAR,
DEHGAM)

8/22/2019 Integrated Transit Lab
http://slidepdf.com/reader/full/integrated-transit-lab 99/112
Existing bus terminals
SOUTH AND EAST
(VADODARA, SURAT,
GODHARA)
TOWARDS KUTCH,
SAURASHTRA
GEETA MANDIR
RANIP
Proposed GSRTC
Corridor NARODA
FROM NORTH GUJARAT
AND GANDHINAGARFROM NORTH-EAST
(HIMMATNAGAR,
DEHGAM)
SCENE 1
8/22/2019 Integrated Transit Lab
http://slidepdf.com/reader/full/integrated-transit-lab 100/112
SOUTH AND EAST
(VADODARA, SURAT,
GODHARA)
TOWARDS KUTCH,
SAURASHTRA
GEETA MANDIR
RANIPNARODA
FROM NORTH GUJARAT
AND GANDHINAGAR
FROM NORTH-EAST
(HIMMATNAGAR,
DEHGAM)
SCENE 2

8/22/2019 Integrated Transit Lab
http://slidepdf.com/reader/full/integrated-transit-lab 101/112
SOUTH AND EAST
(VADODARA, SURAT,
GODHARA)
TOWARDS KUTCH,
SAURASHTRA
GEETA MANDIR
RANIPNARODA
FROM NORTH GUJARAT
AND GANDHINAGARFROM NORTH-EAST
(HIMMATNAGAR,
DEHGAM)
SCENE 3

8/22/2019 Integrated Transit Lab
http://slidepdf.com/reader/full/integrated-transit-lab 102/112
SOUTH AND EAST
(VADODARA, SURAT,
GODHARA)
TOWARDS KUTCH,
SAURASHTRA
GEETA MANDIR
RANIPNARODA
FROM NORTH GUJARATAND GANDHINAGAR
FROM NORTH-EAST
(HIMMATNAGAR,
DEHGAM)
PROPOSEDINTERCHANGES

8/22/2019 Integrated Transit Lab
http://slidepdf.com/reader/full/integrated-transit-lab 103/112
SOUTH AND EAST
(VADODARA, SURAT,
GODHARA)
TOWARDS KUTCH,
SAURASHTRA
LEVEL-1 Interchange(GSRTC Terminal – BRTS)
LEVEL-2 Interchange(GSRTC – BRTS)
LEVEL-3 Interchange(GSRTC – METRO)
Proposed Metro CorridorGEETA MANDIR
RANIPNARODA
Interchange (METRO – BRTS – AMTS)
Interchange (BRTS – AMTS)
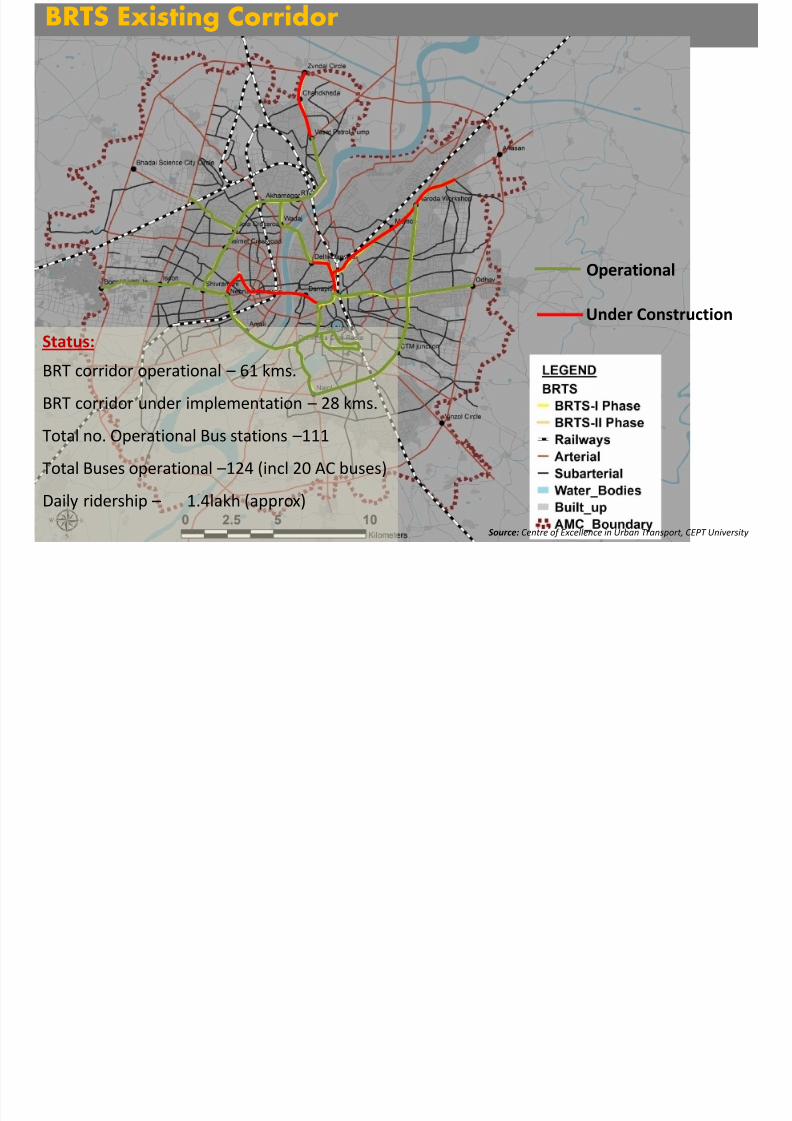
BRTS Existing Corridor
8/22/2019 Integrated Transit Lab
http://slidepdf.com/reader/full/integrated-transit-lab 104/112
Status:
BRT corridor operational – 61 kms.
BRT corridor under implementation – 28 kms.
Total no. Operational Bus stations –111
Total Buses operational –124 (incl 20 AC buses)
Daily ridership – 1.4lakh (approx)
Source: Centre of Excellence in Urban Transport, CEPT University
Under Construction
Operational
BRTS TO BRTS INTERCHANGE

8/22/2019 Integrated Transit Lab
http://slidepdf.com/reader/full/integrated-transit-lab 105/112
No. of interchanges: 18
Total length of BRTS corridor: 135
BRTS TO GSRTC INTERCHANGE

8/22/2019 Integrated Transit Lab
http://slidepdf.com/reader/full/integrated-transit-lab 106/112
No. of interchanges: 9
BRTS TO Metro INTERCHANGE

8/22/2019 Integrated Transit Lab
http://slidepdf.com/reader/full/integrated-transit-lab 107/112
No. of interchanges: 17
BRTS TO Regional Rail INTERCHANGE

8/22/2019 Integrated Transit Lab
http://slidepdf.com/reader/full/integrated-transit-lab 108/112
No. of interchanges: 2
Modes No. of Interchanges
BRTS BRTS 18
BRTS GSRTC 9
BRTSMetro 17
BRTS Regional rail 2
Total 46
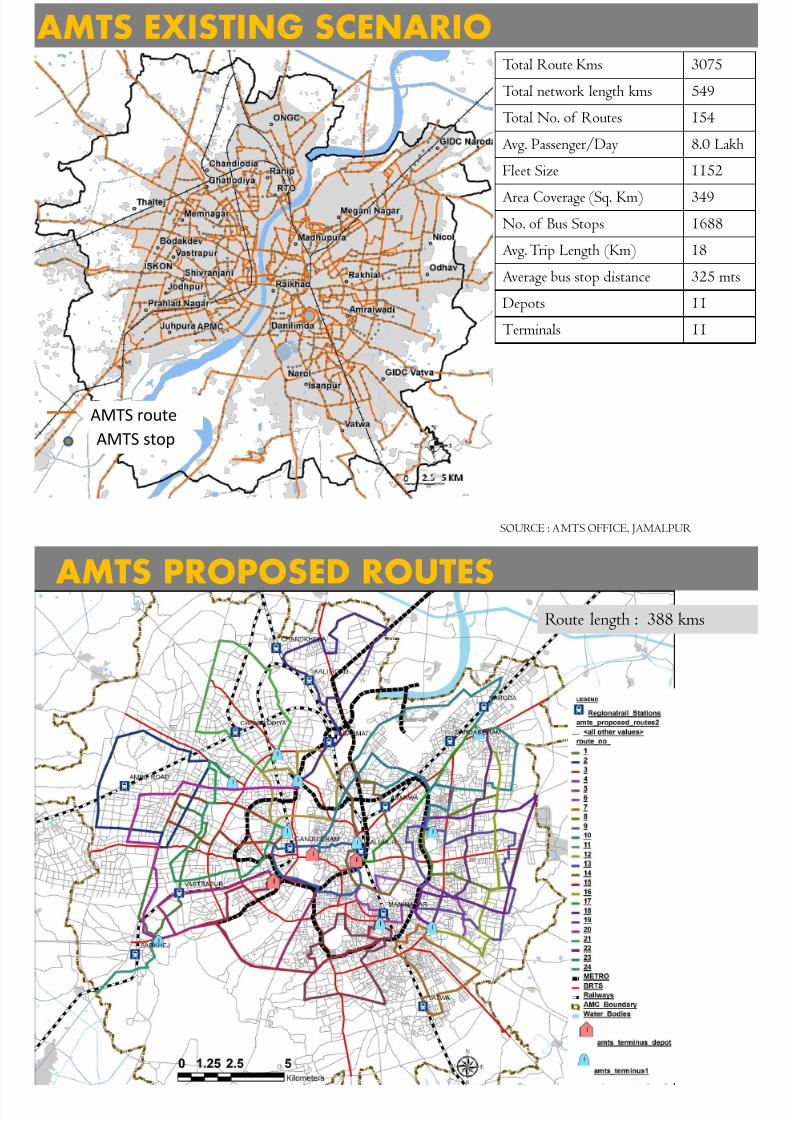
AMTS EXISTING SCENARIOTotal Route Kms 3075

8/22/2019 Integrated Transit Lab
http://slidepdf.com/reader/full/integrated-transit-lab 109/112
Total network length kms 549
Total No. of Routes 154
Avg. Passenger/Day 8.0 LakhFleet Size 1152
Area Coverage (Sq. Km) 349
No. of Bus Stops 1688
Avg. Trip Length (Km) 18
Average bus stop distance 325 mts
Depots 11
Terminals 11
AMTS route
AMTS stop
SOURCE : AMTS OFFICE, JAMALPUR
R t l th 388 k
AMTS PROPOSED ROUTES

8/22/2019 Integrated Transit Lab
http://slidepdf.com/reader/full/integrated-transit-lab 110/112
Route length : 388 kms
AMTS BRTS INTERCHANGES

8/22/2019 Integrated Transit Lab
http://slidepdf.com/reader/full/integrated-transit-lab 111/112
Tapovan Circle
Zundal Circle
SGBP Circle

8/22/2019 Integrated Transit Lab
http://slidepdf.com/reader/full/integrated-transit-lab 112/112
Level- 1 (2)
Level- 2 (10)
Level- 3 (6)
Kalupur
Sabarmati
OdhavBopal
Science city
Vinzol Circle
Paldi
Civil Hospital
Jamalpur
Vadaj
Aslali
Sanand Circle
Anasan
APMC, Vasana
Level- 1:
AMTS + BRTS + Metro + Regional rail
Level- 2:
BRTS + GSRTC Terminals + Metro Interchanges
Metro Terminals
Level- 3:
GSRTC Stops with BRTS
GSRTC Stops with Metro