integrating environmental safeguards into disaster
TRANSCRIPT
Integrating Environmental Safeguards into Disaster Management: a field manual
Sriyanie Miththapala
Volume 1: Reference material
Ecosystems and Livelihoods Group, Asia, IUCN

Integrating Environmental Safeguards into Disaster Management: a field manualVolume 1: Reference material
Integrating Environmental Safeguards into Disaster Management: a field manual
Sriyanie Miththapala
Volume 1: Reference material
Ecosystems and Livelihoods Group, Asia, IUCN
This document was produced under the project ‘Rehabilitating coastal ecosystems in a post-tsunami context: Consolidation Phase’ carried out with financial support from the Autonomous Organisation for National Parks (Organismo Autónomo Parques Nacionales - OAPN) of the Ministry of Environment of Spain. The designation of geographical entities in this technical report, and the presentation of the material, do not imply the expression of any opinion whatsoever on the part of IUCN or OAPN concerning the legal status of any country, territory, or area, or of its authorities, or concerning the delimitation of its frontiers or boundaries. The views expressed in this publication do not necessarily reflect those of IUCN or OAPN.
Published by: Ecosystems and Livelihoods Group Asia, IUCN, International Union for Conservation of Nature and Natural Resources.
Copyright: © 2008, International Union for Conservation of Nature and Natural Resources.
Citation: Miththapala. S (2008). Incorporating environmental safeguards into disaster risk management. Volume 1: Reference material. Colombo: Ecosystems and Livelihoods Group, Asia, IUCN. viii + 130 pp.
Reproduction of this publication for educational or other non-commercial purposes is authorized without prior written permission from the copyright holder provided the source is fully acknowledged.
Reproduction of this publication for resale or other commercial purposes is prohibited without prior written permission of the copyright holder.
ISBN: 978-955-8177-86-0 Cover Photo: © Earthquake damage in Pakistan, 2005 © Karl Schuler/IUCN
Design: Sriyanie Miththapala
Produced by: Ecosystems and Livelihoods Group Asia, IUCN.
Printed by: Karunaratne & Sons (Pvt) Ltd. 67 UDA Industrial Estate Katuwana Road Homagama [email protected]
Available from: Ecosystems and Livelihoods Group, Asia IUCN 4/1, Adams Avenue Colombo 4 Sri Lanka Phone: +(9411) 255 9634-5 Fax: +(9411) 255 9637 email: [email protected] website: http://data.iucn.org/places/asia/coastalinfo/
iii
Contents
Acknowledgements vList of figures and tables viExecutive summary viiWhy is the environment necessary for sustainable living? 1Ecosystem well-being in Asia 4Human well-being in Asia 8An overview of Asian ecosystems and their status 12 Terrestrial inland ecosystems 13 Tropical lowland rain forests 13 Montane and sub-montane forests 15 Monsoon forests 16 Scrub forests 17 Tropical coniferous forests 18 Temperate broad-leaved and mixed forests 19 Grasslands 20 Deserts 22 Aquatic inland ecosystems 23 Rivers and streams 23 Ponds and lakes 25 Coastal ecosystems 26 Coral reefs 26 Mangroves 28 Seagrasses 30 Sand dunes 31 Lagoons and estuaries 32The value of ecosystems 34Natural hazards and natural disasters 38The difference between natural hazards and natural disasters 39Risk and vulnerability 39Natural hazards 41 Geological hazards 41 Earthquakes 41 Volcanoes 45 Landslides 47 Hydrological hazards 47 Floods 47 Drought 49 Tsunamis 50 Climatic hazards 51 Hurricanes/tropical cyclones/typhoons 51 Other natural hazards 52 Wildfires 52 Disease 52Natural disasters 54Global warming and climate change 60References 70Annex 1 Ecosystem services of and threats to lowland tropical rain forests 74 Annex 2 Ecosystem services of and threats to montane and sub-montane forests 79Annex 3 Ecosystem services of and threats to monsoon forests 83
iv
Annex 4 Ecosystem services of and threats to scrub forests 87Annex 5 Ecosystem services of and threats to tropical coniferous forests 90Annex 6 Ecosystem services of and threats to temperate broad-leaved and mixed forests 93Annex 7 Ecosystem services of and threats to tropical grasslands 97Annex 8 Ecosystem services of and threats to deserts 101Annex 9 Ecosystem services of and threats to rivers and streams 105Annex 10 Ecosystem services of and threats to ponds and lakes 109Annex 11 Ecosystem services of and threats to swamps and marshes 113Annex 12 Ecosystem services of and threats to mangroves 116 Annex 13 Ecosystem services of and threats to coral reefs 119Annex 14 Ecosystem services of and threats to seagrasses 122Annex 15 Ecosystem services of and threats to sand dunes 125Annex 16 Ecosystem services of and threats to lagoons and estuaries 127Photocredits 130
v
Acknowledgments
Many people assisted with the preparation and production of this manual. The author expresses her grateful thanks to Saima Baig, Channa Bambaradeniya, Lucy Emerton, Janaki Galappatti, Ranjit Galappatti, Usman Ifthikar, Mikkel Kallesøe, Sanjeewa Lellwala, Maeve Nightingale, Thushara Ranasinghe, Ali Raza Rizvi, Rebecca Roberts and Devaka Weerakoon for content inputs and comments.
Yvanka de Soysa prepared most of the annexes in Volume 1 and Eric Wikramanayake generated some GIS maps used for illustration in Volume 2. Anouchka Wijenaike and Irushnie Wedage proof-read the document.
Many people generously provided photographs for use. They are credited individually at the end of each volume.
This document was produced and published with financial support through a grant made from the Autonomous Organisation for National Parks (Organismo Autónomo Parques Nacionales - OAPN) of the Ministry of Environment of Spain to IUCN.
vi
List of Figures
Figure 1: The Millennium Ecosystem Assessment (MA) framework 2Figure 2: Impacts of the main drivers of ecosystem change 6Figure 3: Current world population 9Figure 4: World poverty distribution 10Figure 5: Global distribution of tropical rainforests 13Figure 6: Global distribution of temperate broad-leaved forests 19Figure 7: Global distribution of grasslands 20Figure 8: Global distribution of deserts 22Figure 9: Major river basins of the world 23Figure 10: Extent of mangroves remaining compared to coral reefs and tropical rainforests 29Figure 11: Total economic value 36Figure 12: Total economic value related to the MA framework 36Figure 13a: The different elements of vulnerability 39Figure 13b: The relationship between risk, hazard and vulnerability 40Figure 13b: The relationship between risk, hazard and the different elements of vulnerability 40Figure 14: Cutaway views showing the internal structure of the Earth 41Figure 15: Tectonic plates of the world 42Figure 16: Types of boundaries: top: Extensional; middle: Compressional; and bottom: Transform 43Figure 17: Earthquake prone areas in the world 44Figure 18: Cross section of a volcano 45Figure 19: Volcano prone areas in the world - the Pacific ‘Ring of Fire’ 46Figure 20: Major floods reported in 2008 47Figure 21: Number of drought disaster reported by country: 1970-2006 49Figure 22: Diagram of a tsunami waves 50Figure 23: Distribution of tropical cyclones 51Figure 24: Emerging and re-emerging diseases 52Figure 25: Natural hazard hotspots, by risk type 53Figure 26: Natural hazards in the Asian region, current situation 55Figure 27: Past and future concentrations of CO2 62Figure 28: Melting snow on Kilimanjaro 62Figure 29: Extent of ice on polar ice cap 63Figure 30: Diagram of El Niño conditions 64Figure 31: Climate change and vector-borne diseases 65Figure 32: Potential impacts of climate change 66Figure 33: Trends in natural disasters 66Figure 34: Incidence of floods 1950-2000 67Figure 35: Incidence of wildfires 1950-2000 67Figure 36: Incidence of tropical storms in the north Atlantic 68
List of Tables
Table 1: Population and poverty in Asia 9Table 2: Economic value of Muthurajawela marsh, Sri Lanka 37Table 3: Rapid and slow onset and cyclic disasters 55Table 4: Some of the worst natural disasters recorded (evaluated by the number of human deaths) 56Table 5: Some of the worst natural disasters recorded (evaluated by cost) 56Table 6: Natural disasters in Asia in 2008 56Table 7: Greenhouse gases 61
vii
Executive summary
Environmental facets are essential components of human well-being and contribute positively to human security, providing basic materials for good life, good health and good social relations. Yet, these are being damaged and overexploited, ultimately to the detriment of humans. In addition, increasing incidence and intensity of natural disasters and climate change are having over-arching impacts on the environment. Sustainable development, often of the most vulnerable sectors of society, is thus being undermined.
One of the key reasons why this damage continues is that an integrated approach is adopted rarely in disaster risk management. For example, relief organisations may focus on damage to life and property while others examine impacts on livelihoods. Very often, ecological services and their indirect economic values are omitted completely from assessments. Adaptation to climate change is ignored.
Mainstreaming ecosystem concerns – both ecological and economical – into the development agenda and integrating them into disaster management, therefore, becomes essential. This manual attempts to provide background information and guidance for integrating environmental concerns into disaster management.
Volume 1 of the manual describes briefly the framework of the Millennium Ecosystem Assessment (MA). The MA links clearly ecosystem well-being to human well-being, and presents the major threats imposed by human activities to the services that ecosystems provide. Volume 1 also gives snapshot views of ecosystem well-being and human well-being in Asia and a brief overview of selected ecosystems in the region. Clarification of the difference between natural hazards and natural disasters and a discussion on risk and vulnerability are presented. Climate change and its impacts on natural disasters is also discussed. At the end of Volume 1 is a series of annexes that detail ecosystem services of and threats to ecosystems described in the text.
Volume 2 describes the disaster management cycle and its phases: prevention, mitigation, preparedness, relief, recovery and rebuilding. It introduces an integrated approach to assessments that examines biodiversity, ecosystem services, economic valuation and livelihoods. Volume 2 deals with each of the phases of the disaster management cycle, lists steps and introduces questions that must be raised during each phase in order to integrate environmental concerns into disaster management. These steps and questions are designed around the framework of the Millennium Ecosystem Assessment and its identified threats.
Finally, in the third volume, an integrated summary worksheet is presented as a tool for use. Details of the techniques for each component of assessment are also presented in this volume, as well as a list of available web resources.

1
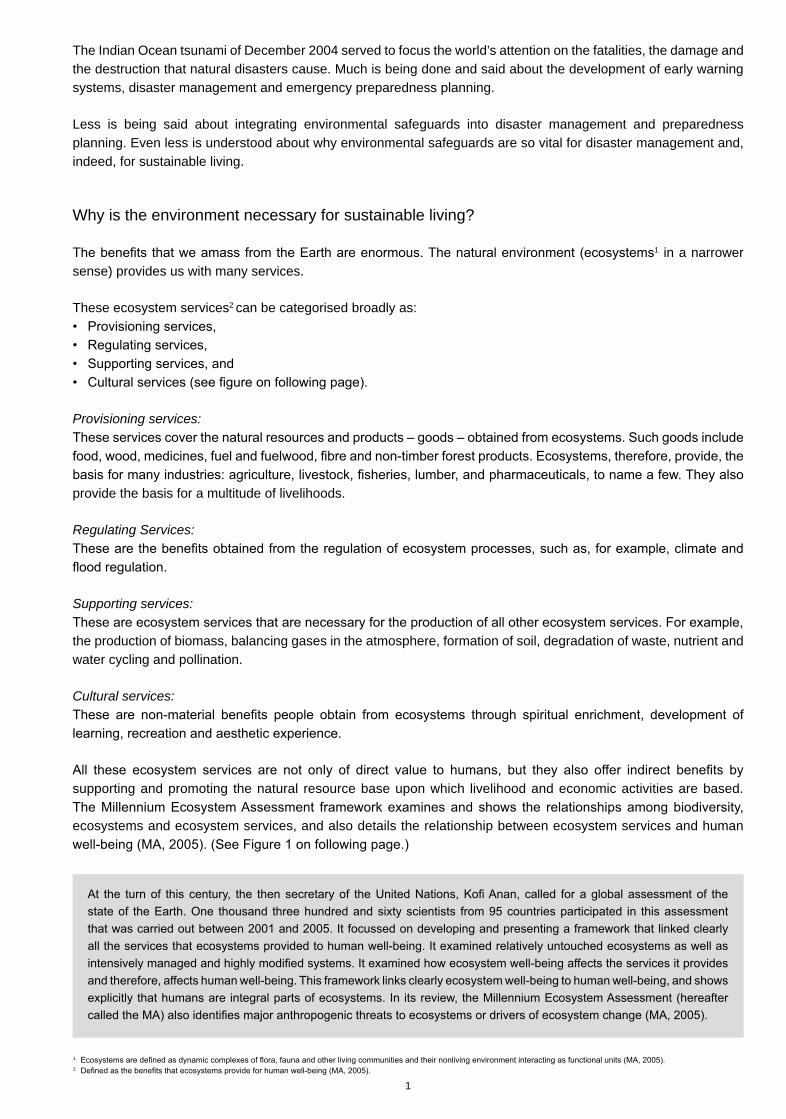
The Indian Ocean tsunami of December 2004 served to focus the world’s attention on the fatalities, the damage and the destruction that natural disasters cause. Much is being done and said about the development of early warning systems, disaster management and emergency preparedness planning.
Less is being said about integrating environmental safeguards into disaster management and preparedness planning. Even less is understood about why environmental safeguards are so vital for disaster management and, indeed, for sustainable living.
Why is the environment necessary for sustainable living?
1 in a narrower sense) provides us with many services.
These ecosystem services2 can be categorised broadly as:
Provisioning services:
provide the basis for a multitude of livelihoods.
Regulating Services:
Supporting services:
the production of biomass, balancing gases in the atmosphere, formation of soil, degradation of waste, nutrient and water cycling and pollination.
Cultural services:
supporting and promoting the natural resource base upon which livelihood and economic activities are based.
ecosystems and ecosystem services, and also details the relationship between ecosystem services and human
1
2
2
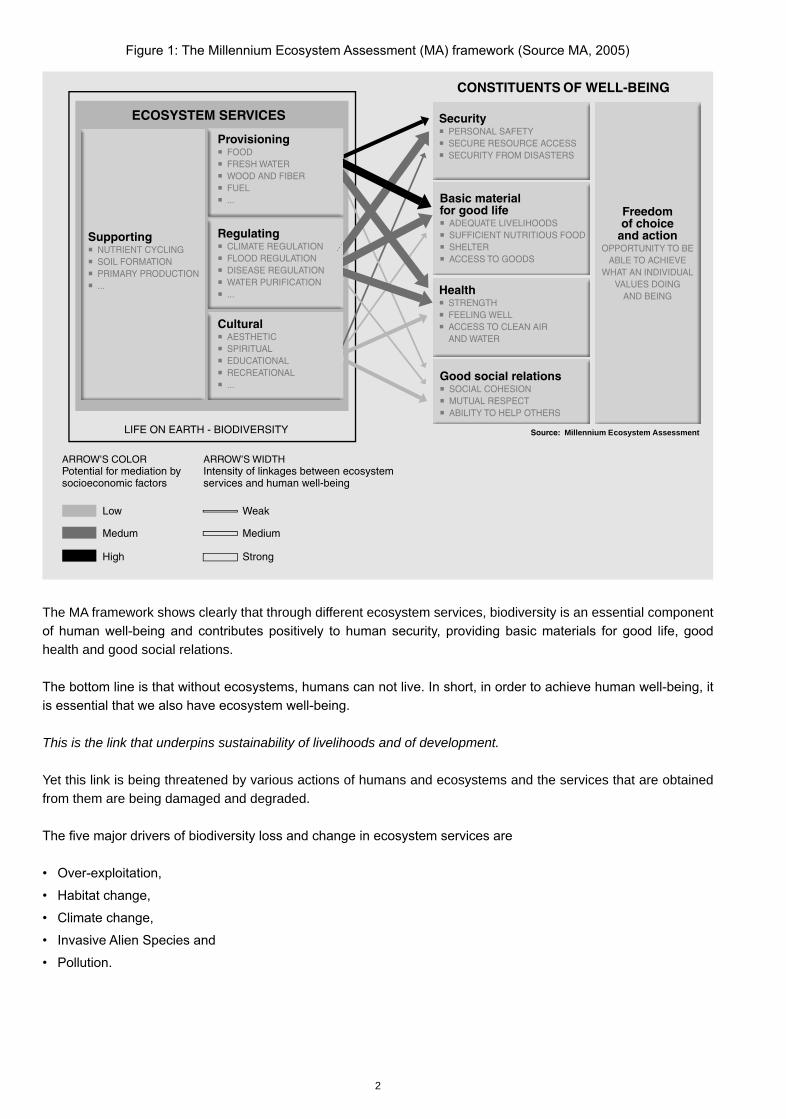
The MA framework shows clearly that through different ecosystem services, biodiversity is an essential component
health and good social relations.
This is the link that underpins sustainability of livelihoods and of development.
Yet this link is being threatened by various actions of humans and ecosystems and the services that are obtained from them are being damaged and degraded.
ECOSYSTEM SERVICES
CONSTITUENTS OF WELL-BEING
Security PERSONAL SAFETY SECURE RESOURCE ACCESS SECURITY FROM DISASTERS
Basic material for good life ADEQUATE LIVELIHOODS SUFFICIENT NUTRITIOUS FOOD SHELTER ACCESS TO GOODS
Health STRENGTH FEELING WELL ACCESS TO CLEAN AIR
AND WATER
Good social relations SOCIAL COHESION MUTUAL RESPECT ABILITY TO HELP OTHERS
Freedomof choice
and actionOPPORTUNITY TO BE
ABLE TO ACHIEVE WHAT AN INDIVIDUAL
VALUES DOINGAND BEING
Supporting NUTRIENT CYCLING SOIL FORMATION PRIMARY PRODUCTION ...
LIFE ON EARTH - BIODIVERSITY
ARROW’S COLORPotential for mediation bysocioeconomic factors
Low Weak
Medum Medium
High Strong
ARROW’S WIDTHIntensity of linkages between ecosystem services and human well-being
Source: Millennium Ecosystem Assessment
Provisioning FOOD FRESH WATER WOOD AND FIBER FUEL ...
Regulating CLIMATE REGULATION FLOOD REGULATION DISEASE REGULATION WATER PURIFICATION ...
Cultural AESTHETIC SPIRITUAL EDUCATIONAL RECREATIONAL ...
3
Over-exploitation:
Habitat Change:
than in any other time in recorded history.
Climate Change:
earth. This global warming is causing climate change: melting ice caps, changing weather patterns and ocean currents,
Invasive Alien Species:
compete vigorously with native species, become established in natural ecosystems, threaten native species and have the potential of eradicating them. When they eradicate native species and disrupt ecosystem interactions, they
Pollution:
have become one of the most important drivers of ecosystem change.
Other forms of water pollution such as domestic, industrial and marine pollution are further degrading ecosystems and
groundwater and rivers and generates methane) is also adding considerably to the problem of ecosystem degradation.

4
Ecosystem well-being in Asia
Asia contains some of the richest ecosystems and livelihoods. More than half the world’s biodiversity is found in
regulating and supporting services such as storm protection, climate regulation, balancing gases in the atmosphere, water regulation, soil engineering, nutrient cycling, degradation of wastes and pollination.
include reduced availability of goods and services to local communities, increased spread of diseases and reduced economic opportunities. This, in turn, is leading to issues associated with environmental security through the loss of livelihoods and food security. Declining ecosystems have also increased the vulnerability of the people to natural
Mediterranean forests, and tropical dry forests.
The most rapid changes are taking
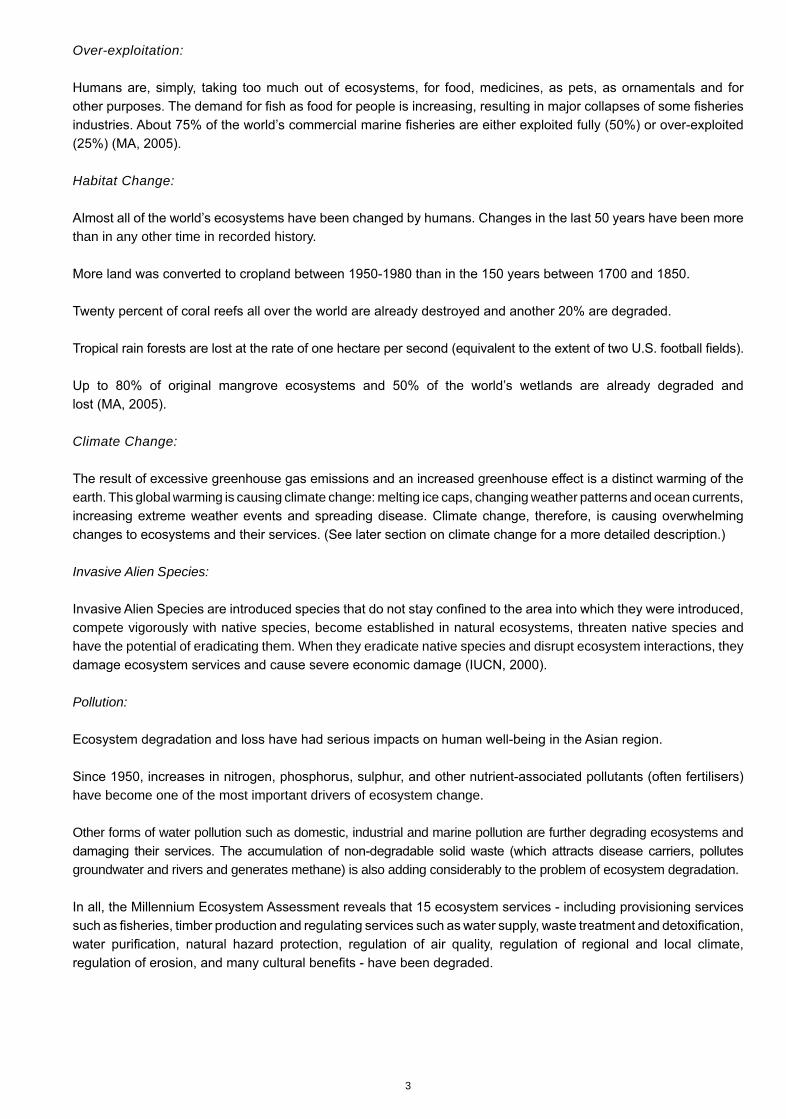
(Source MA, 2005).
Habitat
change
Forest
Dryland
Inland water
Coastal
Marine
Island
Mountain
Polar
Driver’s impact on biodiversity
over the last centuryDriver’s current trends
Low
Moderate
High
Very high
Decreasing impact
Continuing impact
Increasing impactVery rapid increase
of the impact
Temperate
Tropical
Temperate grassland
Mediterranean
Tropical grassland and savanna
Desert
Invasive
species
Climate
change
Over-
exploitation
Pollution
(nitrogen,
phosphorus)
7
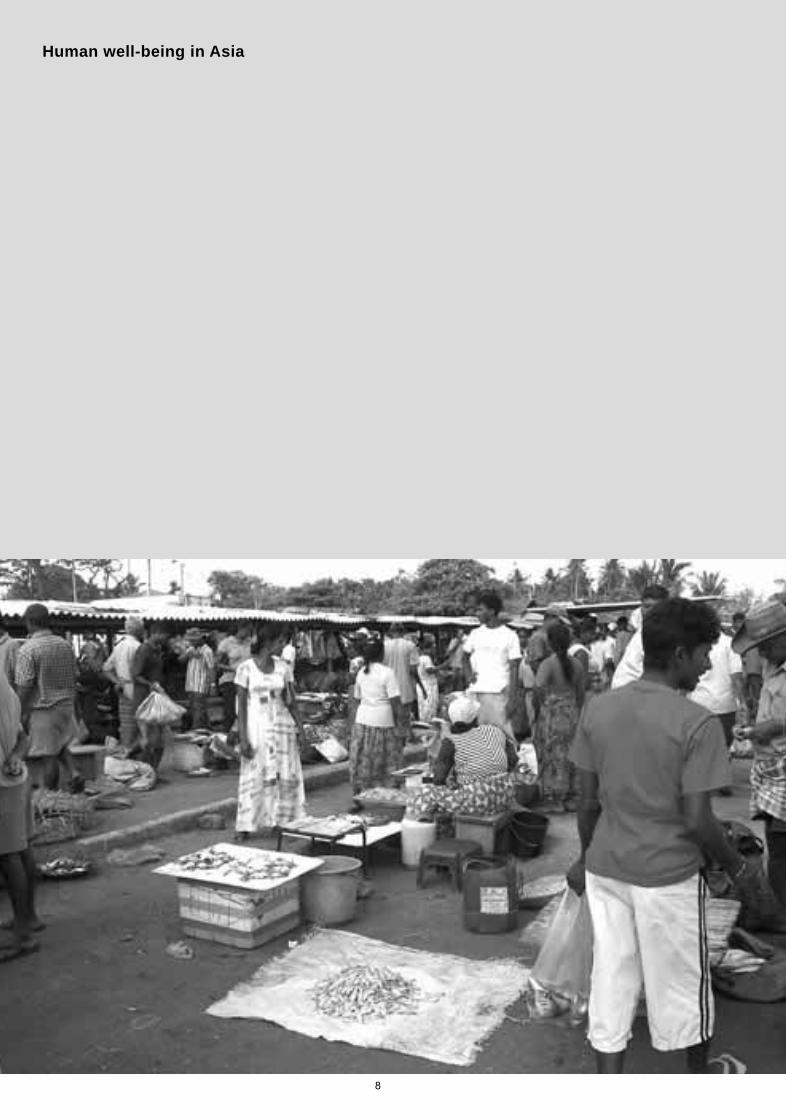
Human well-being in Asia
coastal areas and depend on an easily disturbed natural resource base for their survival.
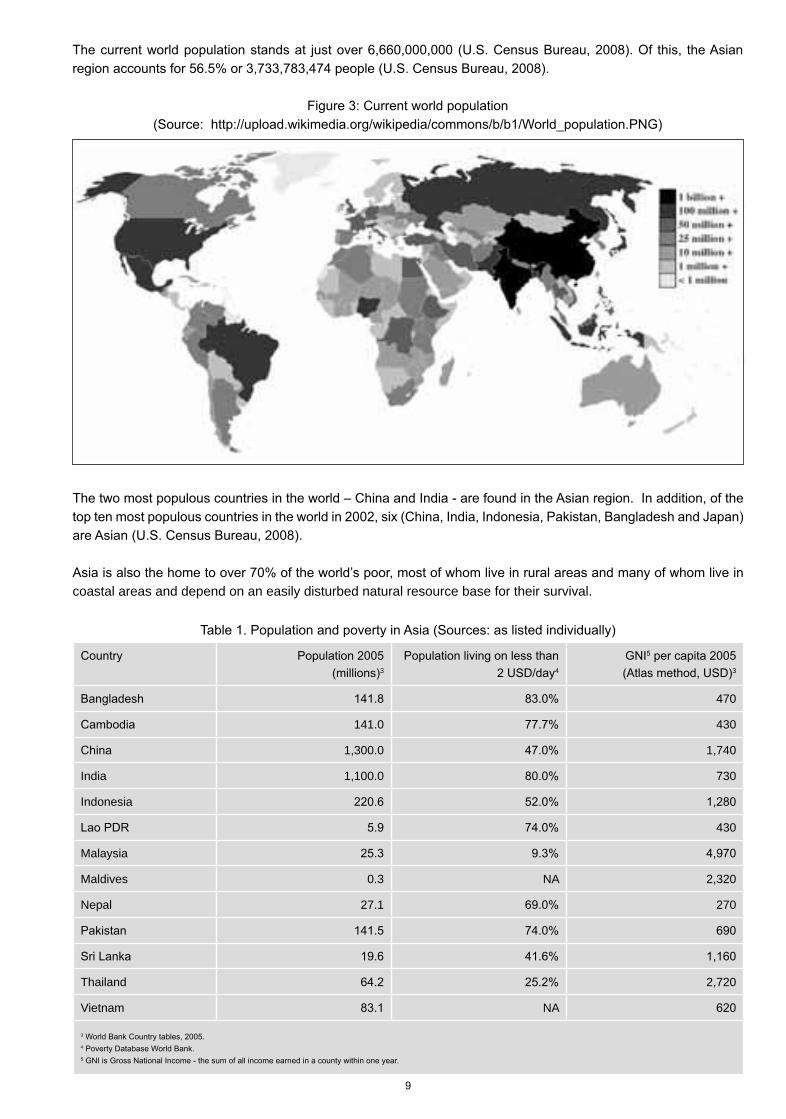
3 4 3
470
141.0 430
1,300.0 1,740
India 1,100.0 730
Indonesia
430
Malaysia
Maldives 0.3 NA 2,320
Nepal 27.1 270
Thailand 2,720
Vietnam NA
3
4
10
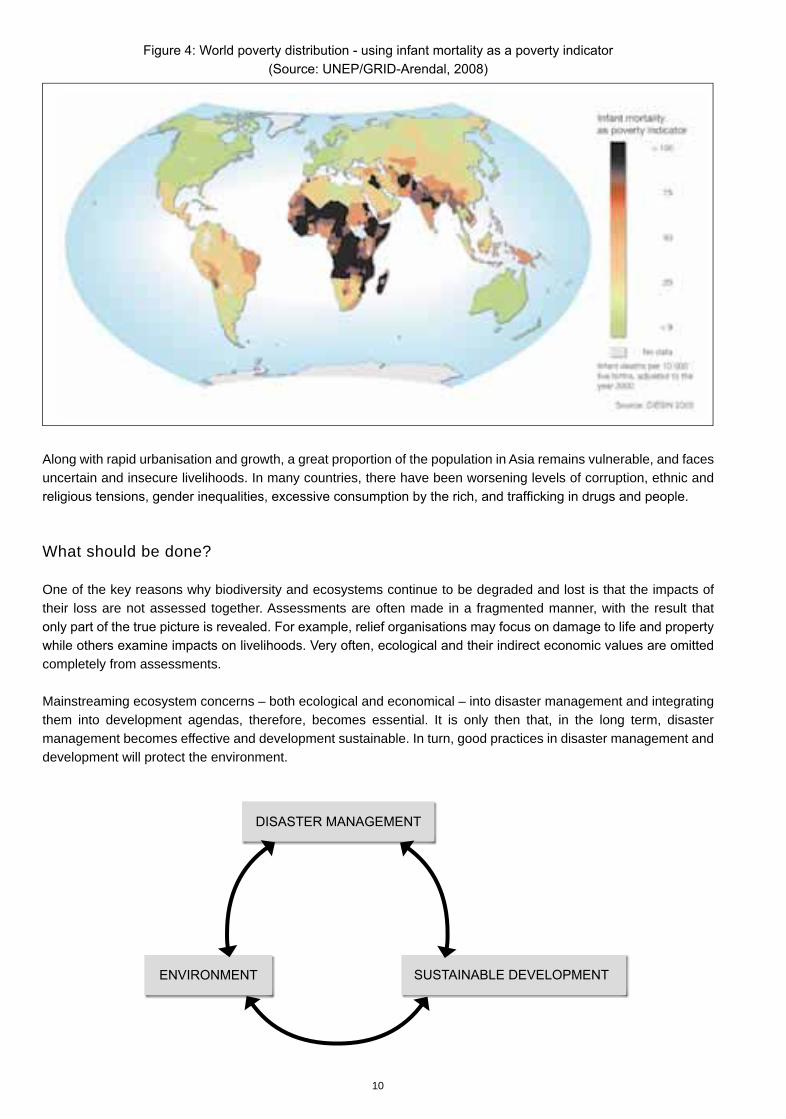
Along with rapid urbanisation and growth, a great proportion of the population in Asia remains vulnerable, and faces uncertain and insecure livelihoods. In many countries, there have been worsening levels of corruption, ethnic and
What should be done?
One of the key reasons why biodiversity and ecosystems continue to be degraded and lost is that the impacts of their loss are not assessed together. Assessments are often made in a fragmented manner, with the result that
completely from assessments.
Mainstreaming ecosystem concerns – both ecological and economical – into disaster management and integrating them into development agendas, therefore, becomes essential. It is only then that, in the long term, disaster management becomes effective and development sustainable. In turn, good practices in disaster management and development will protect the environment.
11
This manual attempts to provide background information and guidance for integrating environmental concerns into disaster management and to provide direction for carrying out integrated assessments.
The manual is structured in three parts. Volume 1 gives background information on ecosystems and their value,
Volume 2 describes the disaster management cycle and its phases: prevention, mitigation, preparedness, relief, recovery and rebuilding. It deals with each of the components of the disaster management cycle, lists
Finally, in the third volume, an integrated summary worksheet is presented as a tool for use. Details of the
web resources.
12
An overview of main Asian ecosystems and their status
13
Terrestrial inland ecosystems
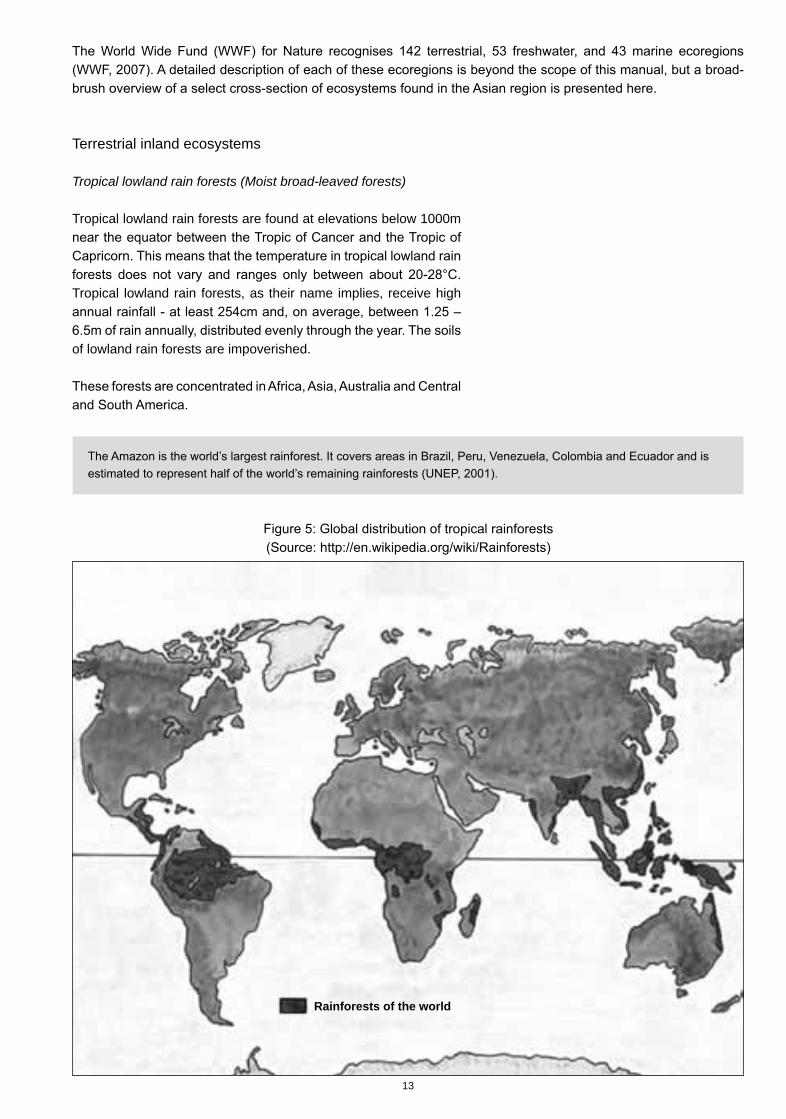
Tropical lowland rain forests (Moist broad-leaved forests)
Tropical lowland rain forests are found at elevations below 1000m
Tropical lowland rain forests, as their name implies, receive high
of lowland rain forests are impoverished.
Rainforests of the world
14
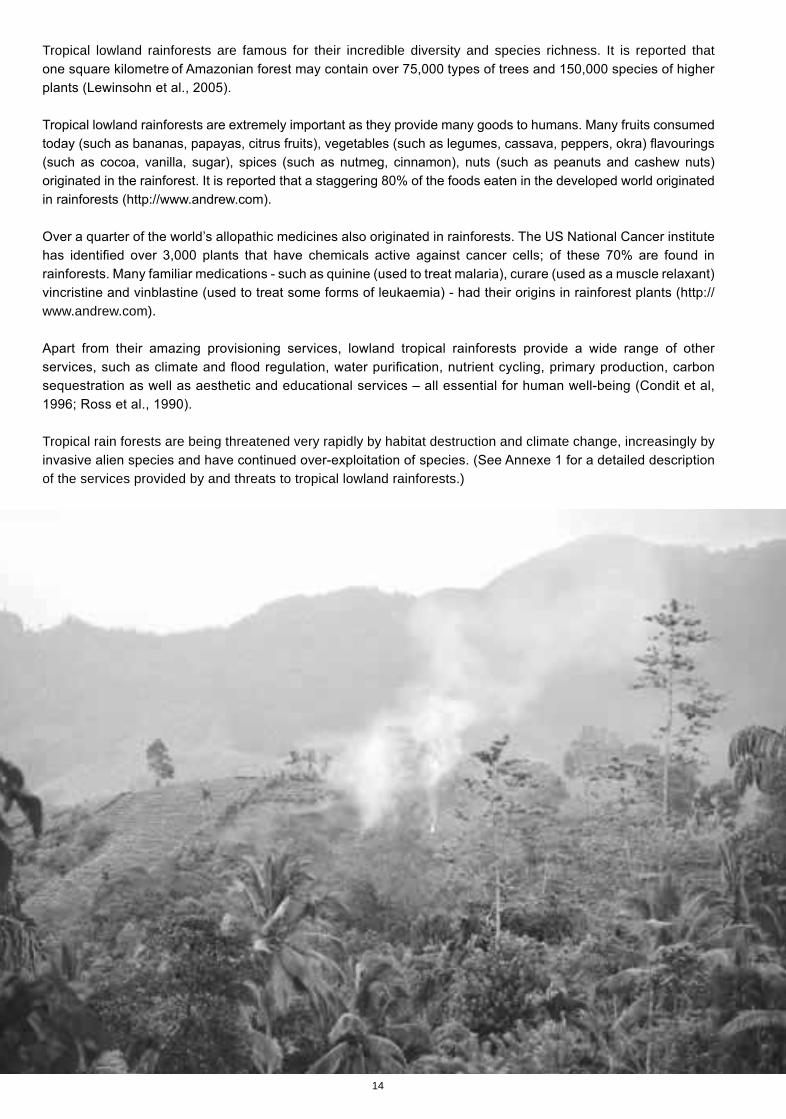
Tropical lowland rainforests are famous for their incredible diversity and species richness. It is reported that
www.andrew.com).
Tropical rain forests are being threatened very rapidly by habitat destruction and climate change, increasingly by
of the services provided by and threats to tropical lowland rainforests.)
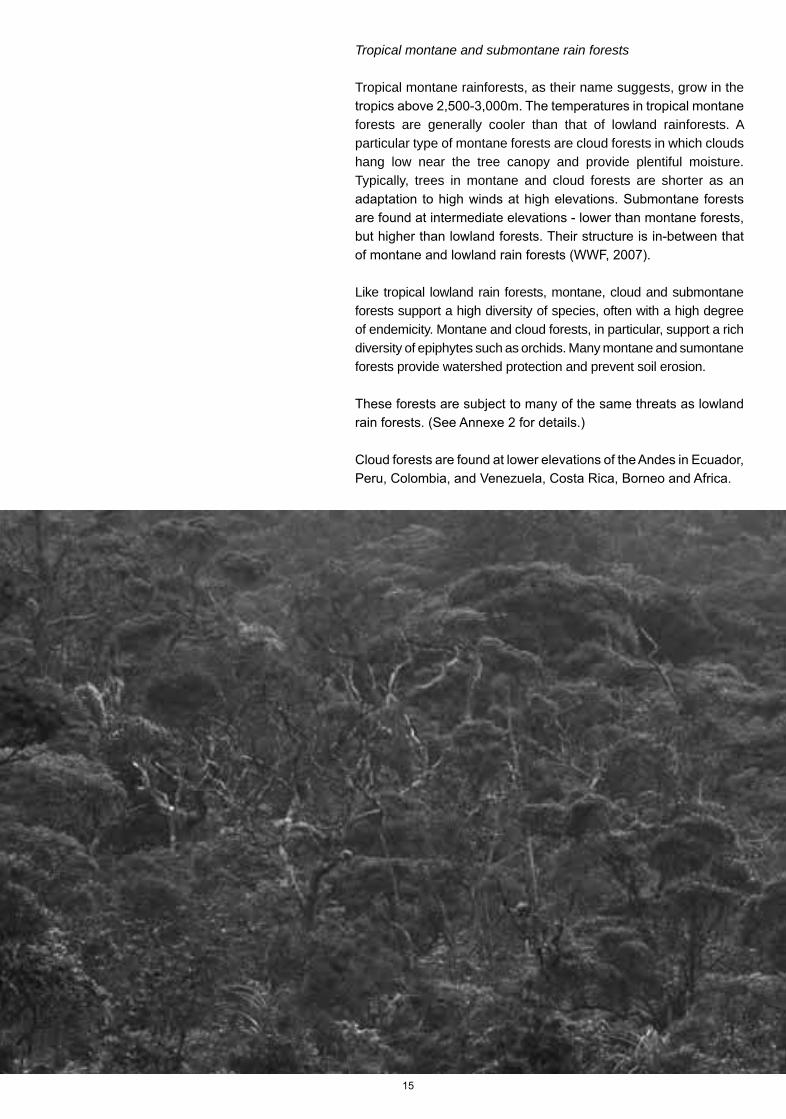
Tropical montane and submontane rain forests
Tropical montane rainforests, as their name suggests, grow in the
forests are generally cooler than that of lowland rainforests. A particular type of montane forests are cloud forests in which clouds hang low near the tree canopy and provide plentiful moisture. Typically, trees in montane and cloud forests are shorter as an
Like tropical lowland rain forests, montane, cloud and submontane forests support a high diversity of species, often with a high degree of endemicity. Montane and cloud forests, in particular, support a rich diversity of epiphytes such as orchids. Many montane and sumontane forests provide watershed protection and prevent soil erosion.
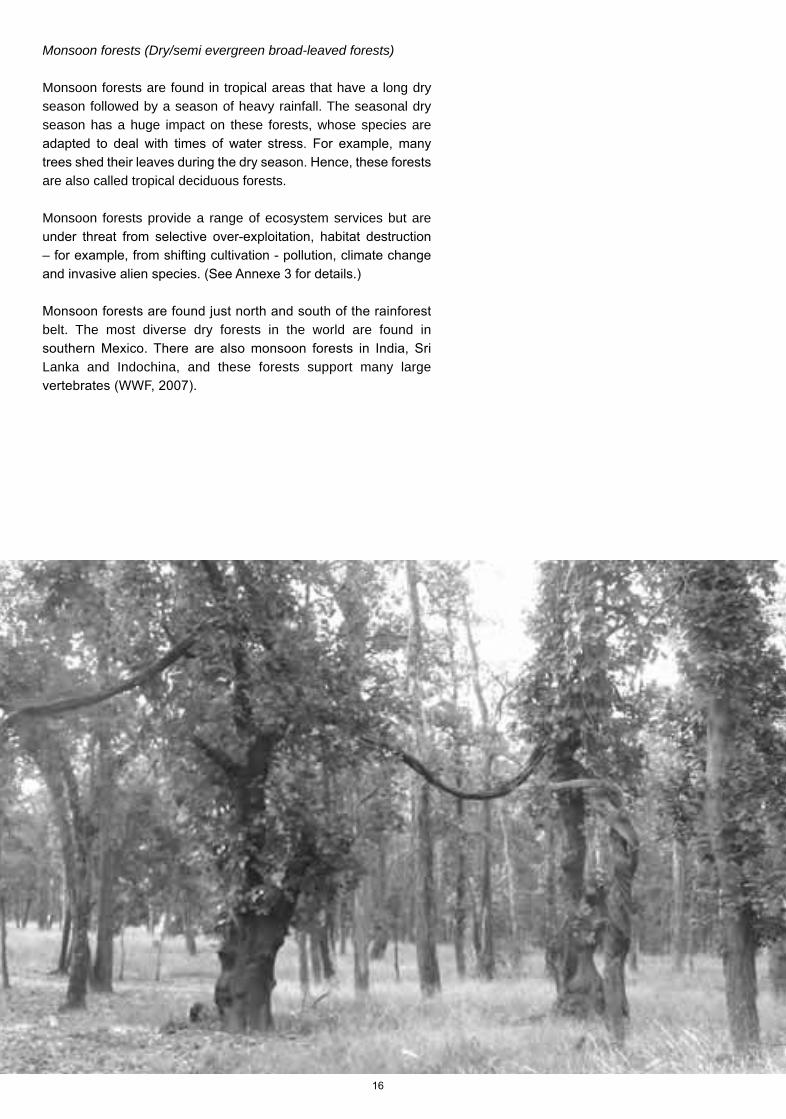
Monsoon forests (Dry/semi evergreen broad-leaved forests)
Monsoon forests are found in tropical areas that have a long dry season followed by a season of heavy rainfall. The seasonal dry season has a huge impact on these forests, whose species are
are also called tropical deciduous forests.
Monsoon forests provide a range of ecosystem services but are
belt. The most diverse dry forests in the world are found in
Lanka and Indochina, and these forests support many large
17
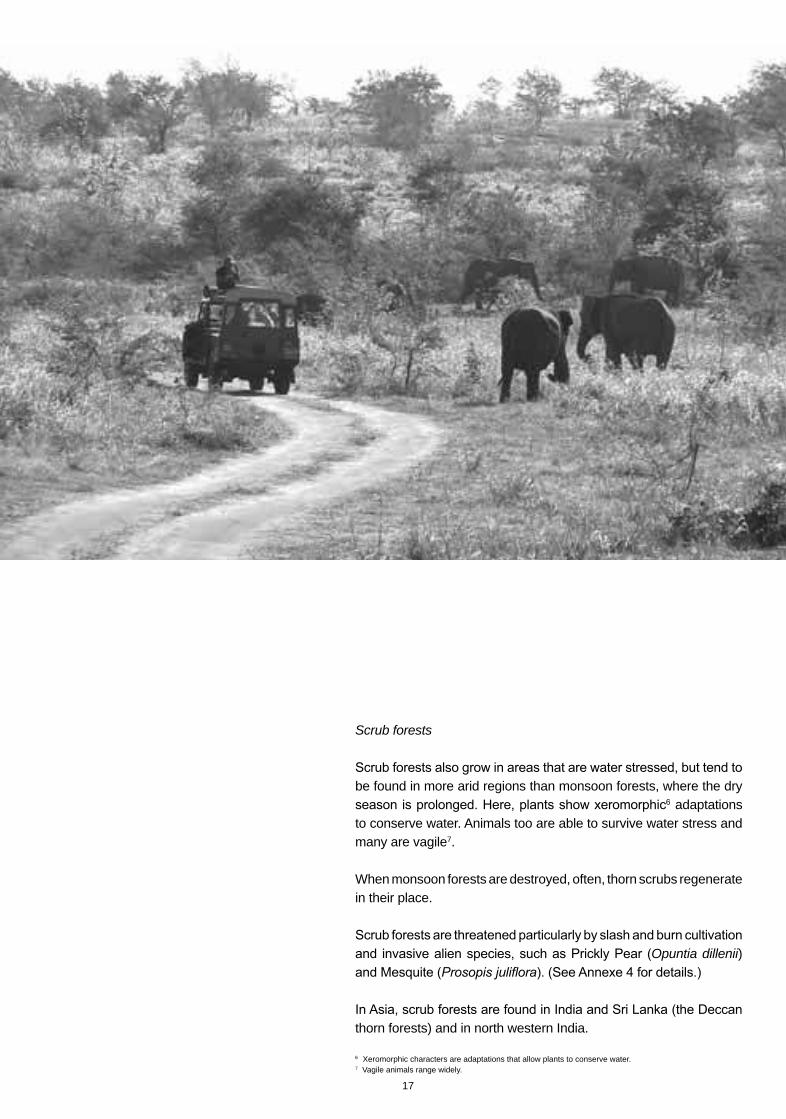
Scrub forests
be found in more arid regions than monsoon forests, where the dry adaptations
to conserve water. Animals too are able to survive water stress and many are vagile7.
When monsoon forests are destroyed, often, thorn scrubs regenerate in their place.
Opuntia dillenii)
thorn forests) and in north western India.
Xeromorphic characters are adaptations that allow plants to conserve water.7 Vagile animals range widely.
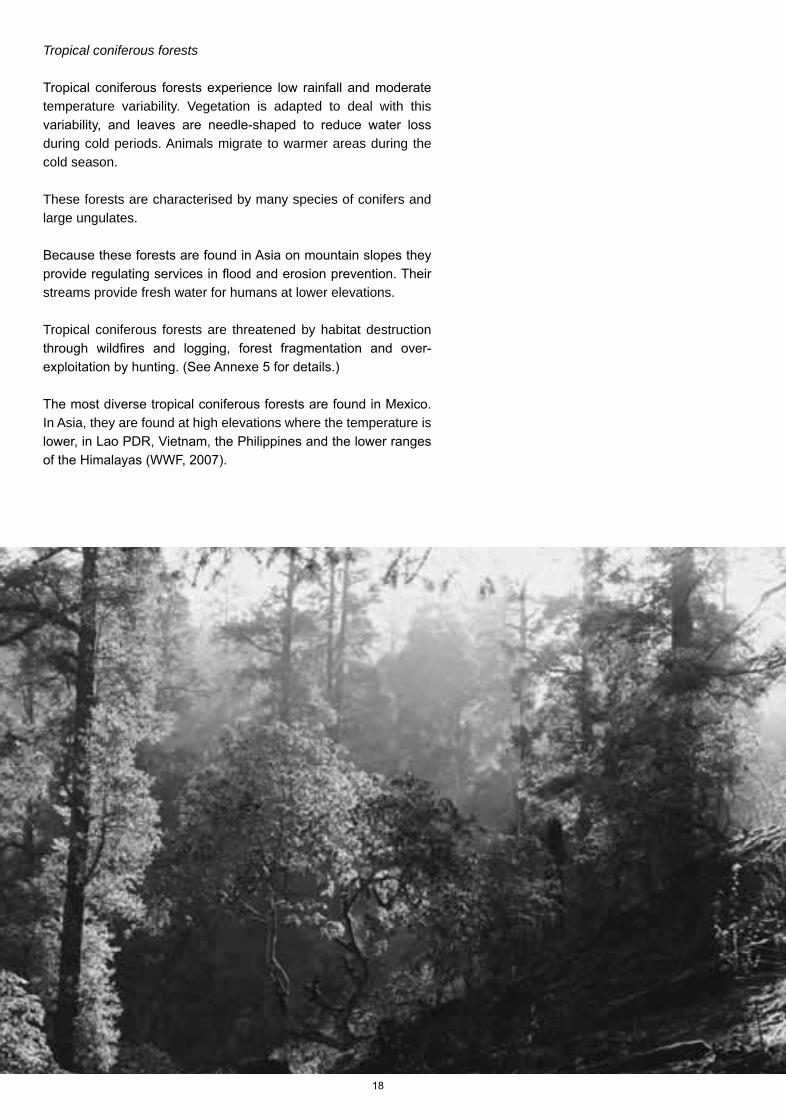
Tropical coniferous forests
temperature variability. Vegetation is adapted to deal with this
during cold periods. Animals migrate to warmer areas during the cold season.
These forests are characterised by many species of conifers and large ungulates.
streams provide fresh water for humans at lower elevations.
Tropical coniferous forests are threatened by habitat destruction
In Asia, they are found at high elevations where the temperature is
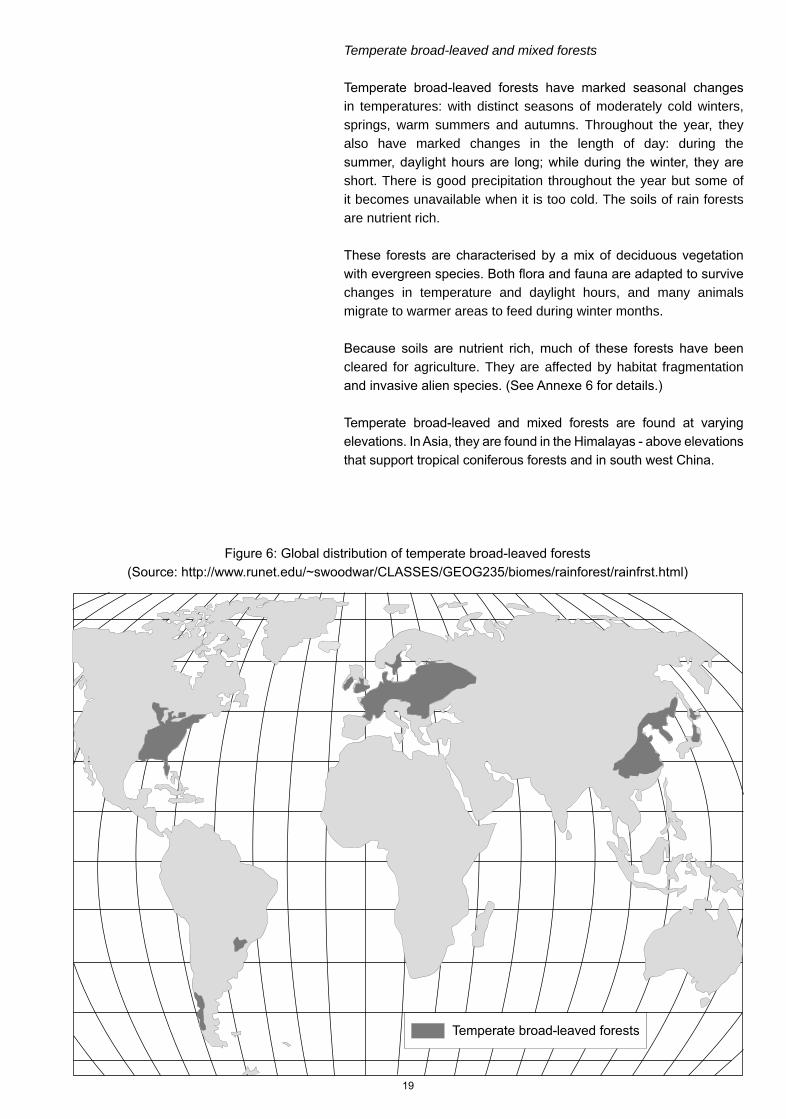
Temperate broad-leaved and mixed forests
in temperatures: with distinct seasons of moderately cold winters, springs, warm summers and autumns. Throughout the year, they also have marked changes in the length of day: during the
short. There is good precipitation throughout the year but some of it becomes unavailable when it is too cold. The soils of rain forests are nutrient rich.
changes in temperature and daylight hours, and many animals migrate to warmer areas to feed during winter months.
cleared for agriculture. They are affected by habitat fragmentation
20
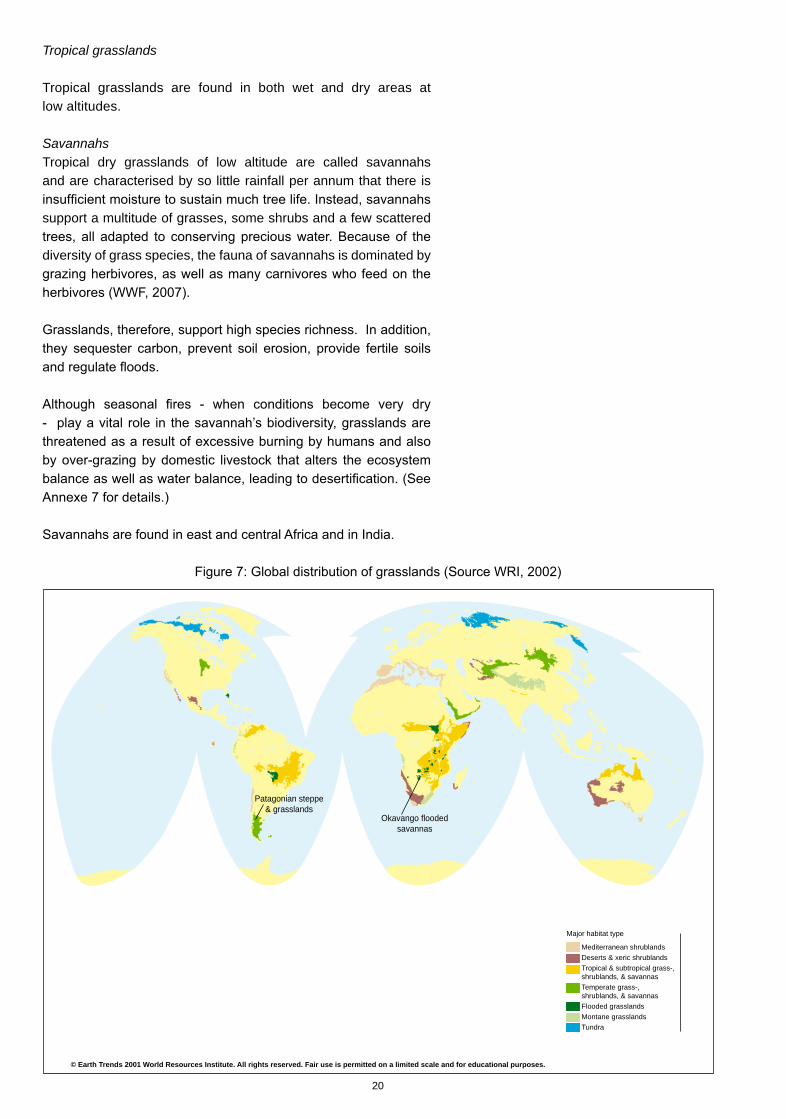
Tropical grasslands
Tropical grasslands are found in both wet and dry areas at low altitudes.
SavannahsTropical dry grasslands of low altitude are called savannahs and are characterised by so little rainfall per annum that there is
support a multitude of grasses, some shrubs and a few scattered
diversity of grass species, the fauna of savannahs is dominated by
© Earth Trends 2001 World Resources Institute. All rights reserved. Fair use is permitted on a limited scale and for educational purposes.
Major habitat type
Mediterranean shrublandsDeserts & xeric shrublandsTropical & subtropical grass-, shrublands, & savannasTemperate grass-,shrublands, & savannasFlooded grasslandsMontane grasslandsTundra
Okavango floodedsavannas
Patagonian steppe& grasslands
21
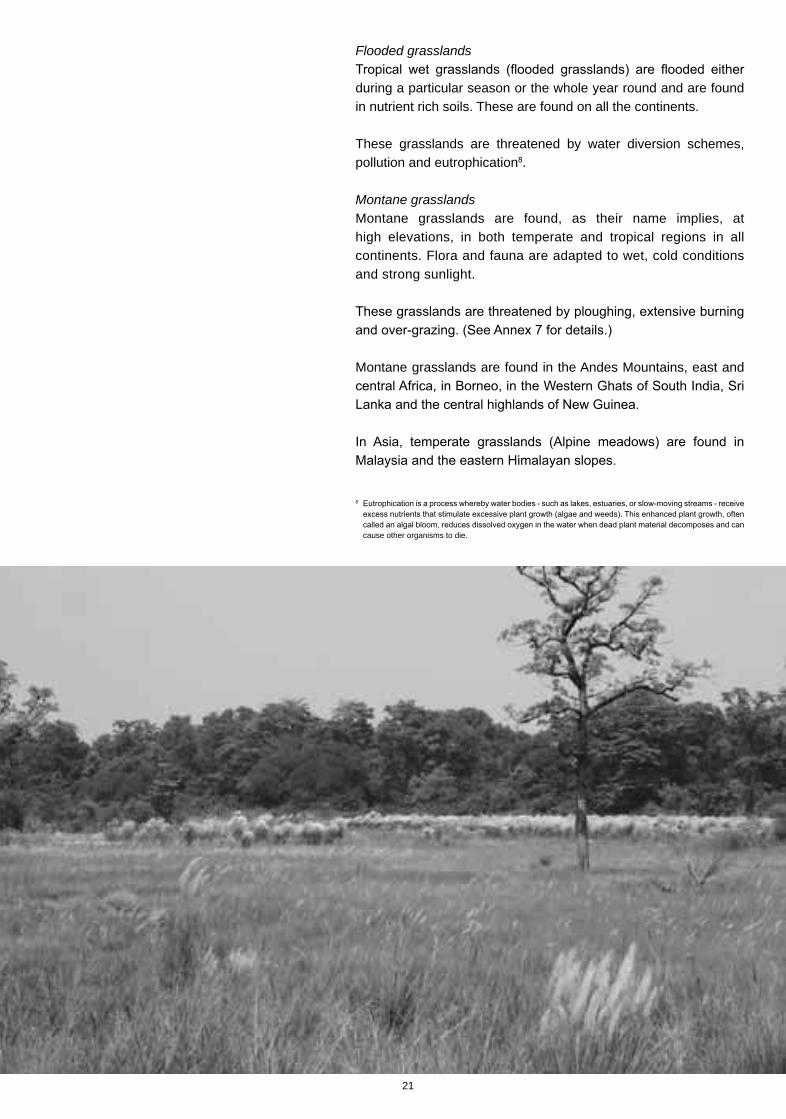
Flooded grasslands
during a particular season or the whole year round and are found in nutrient rich soils. These are found on all the continents.
These grasslands are threatened by water diversion schemes, pollution and eutrophication .
Montane grasslandsMontane grasslands are found, as their name implies, at high elevations, in both temperate and tropical regions in all continents. Flora and fauna are adapted to wet, cold conditions and strong sunlight.
Montane grasslands are found in the Andes Mountains, east and
cause other organisms to die.
22
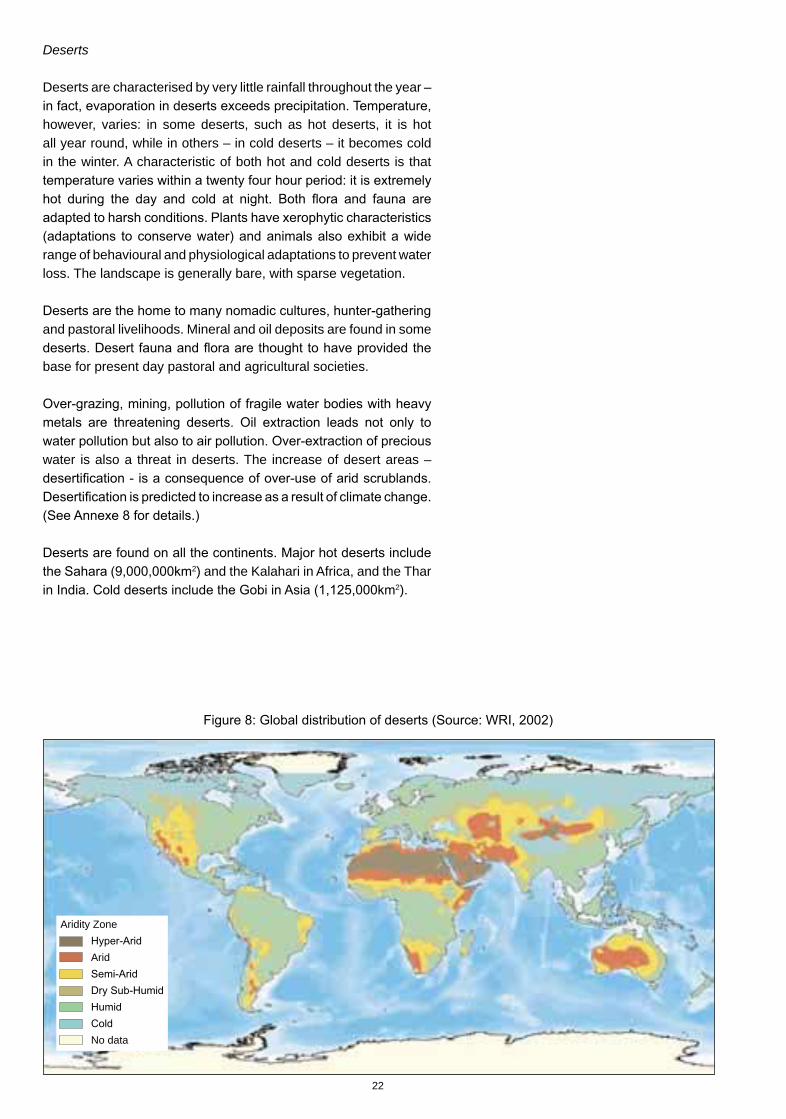
Aridity Zone
Arid
No data
Deserts
Deserts are characterised by very little rainfall throughout the year –
however, varies: in some deserts, such as hot deserts, it is hot all year round, while in others – in cold deserts – it becomes cold in the winter. A characteristic of both hot and cold deserts is that
range of behavioural and physiological adaptations to prevent water loss. The landscape is generally bare, with sparse vegetation.
and pastoral livelihoods. Mineral and oil deposits are found in some
base for present day pastoral and agricultural societies.
water is also a threat in deserts. The increase of desert areas –
2) and the Kalahari in Africa, and the Thar 2).
23
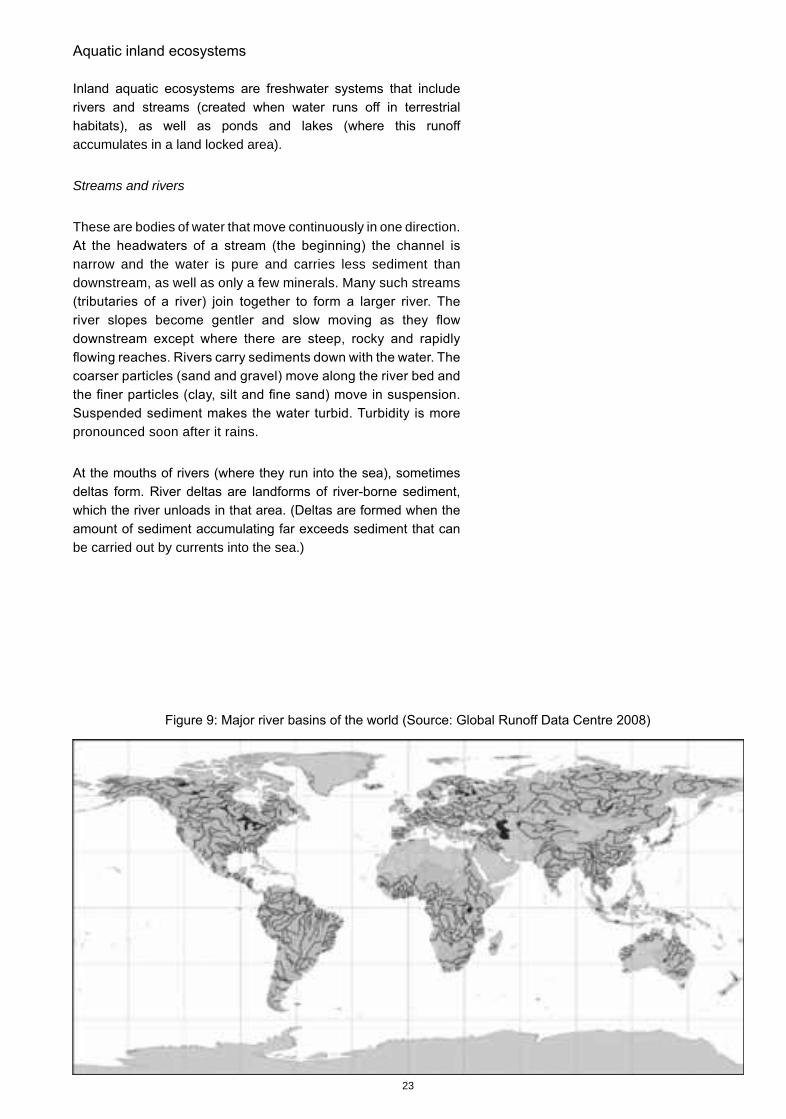
accumulates in a land locked area).
Streams and rivers
These are bodies of water that move continuously in one direction.
narrow and the water is pure and carries less sediment than downstream, as well as only a few minerals. Many such streams
pronounced soon after it rains.
be carried out by currents into the sea.)
24
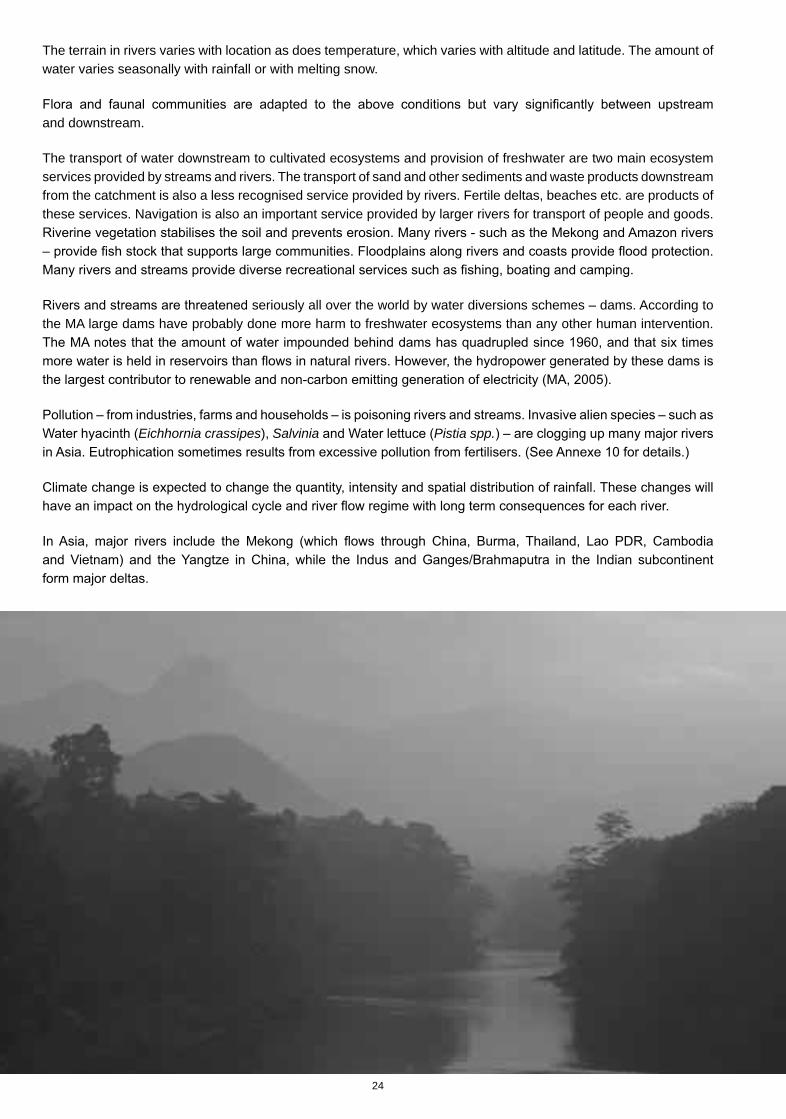
The terrain in rivers varies with location as does temperature, which varies with altitude and latitude. The amount of water varies seasonally with rainfall or with melting snow.
and downstream.
The transport of water downstream to cultivated ecosystems and provision of freshwater are two main ecosystem services provided by streams and rivers. The transport of sand and other sediments and waste products downstream from the catchment is also a less recognised service provided by rivers. Fertile deltas, beaches etc. are products of these services. Navigation is also an important service provided by larger rivers for transport of people and goods.
seriously all over the world by water diversions schemes – dams. According to the MA large dams have probably done more harm to freshwater ecosystems than any other human intervention.
Eichhornia crassipes), Salvinia Pistia spp.
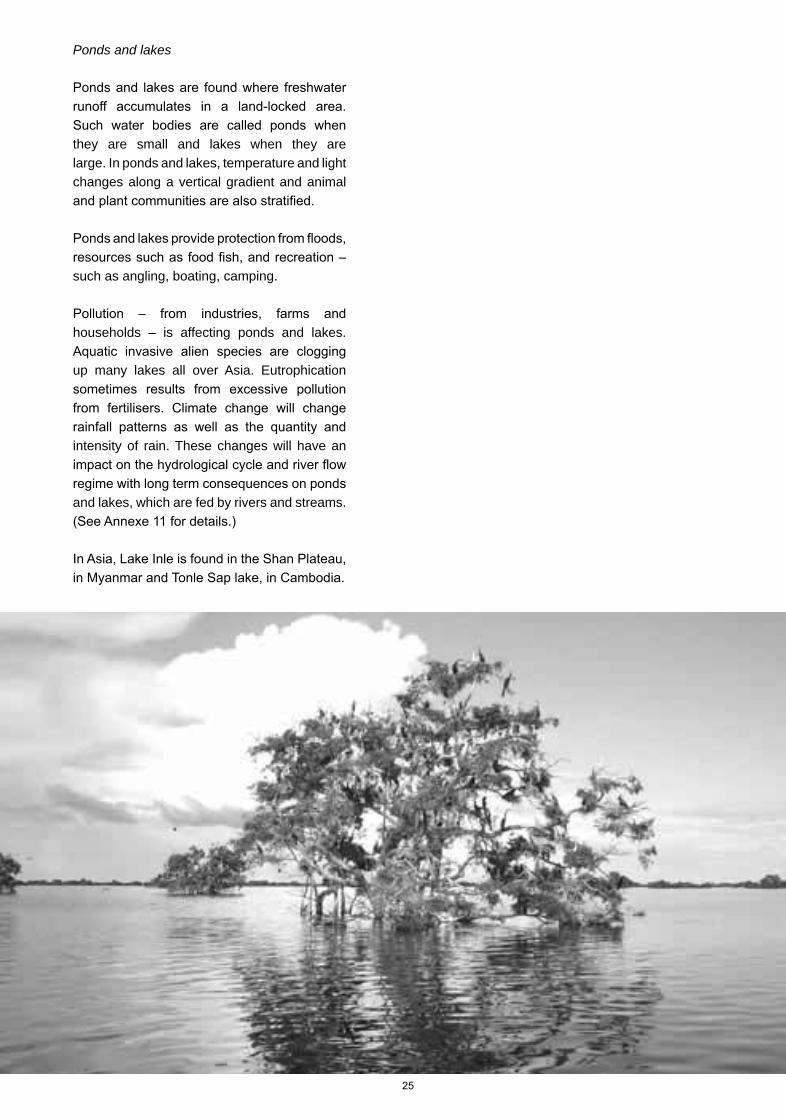
Ponds and lakes
they are small and lakes when they are large. In ponds and lakes, temperature and light changes along a vertical gradient and animal
such as angling, boating, camping.
households – is affecting ponds and lakes.
up many lakes all over Asia. Eutrophication
intensity of rain. These changes will have an
and lakes, which are fed by rivers and streams.
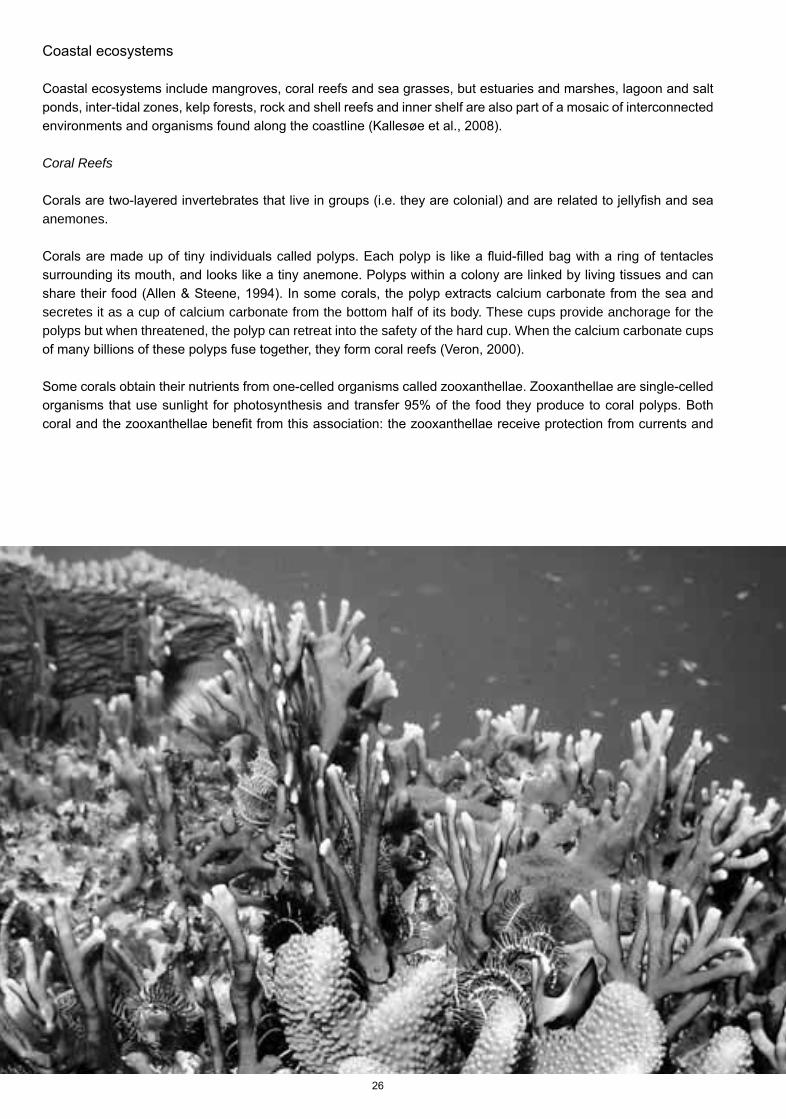
Coral Reefs
anemones.
secretes it as a cup of calcium carbonate from the bottom half of its body. These cups provide anchorage for the polyps but when threatened, the polyp can retreat into the safety of the hard cup. When the calcium carbonate cups
27
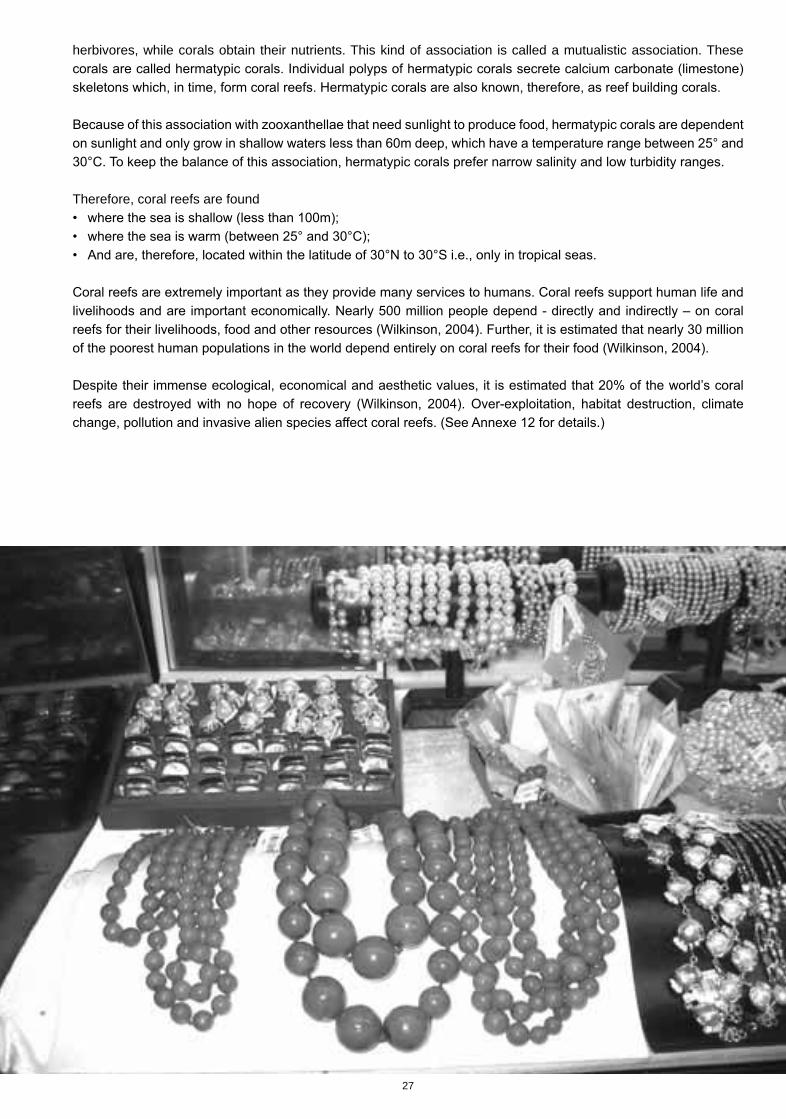
herbivores, while corals obtain their nutrients. This kind of association is called a mutualistic association. These
Therefore, coral reefs are found
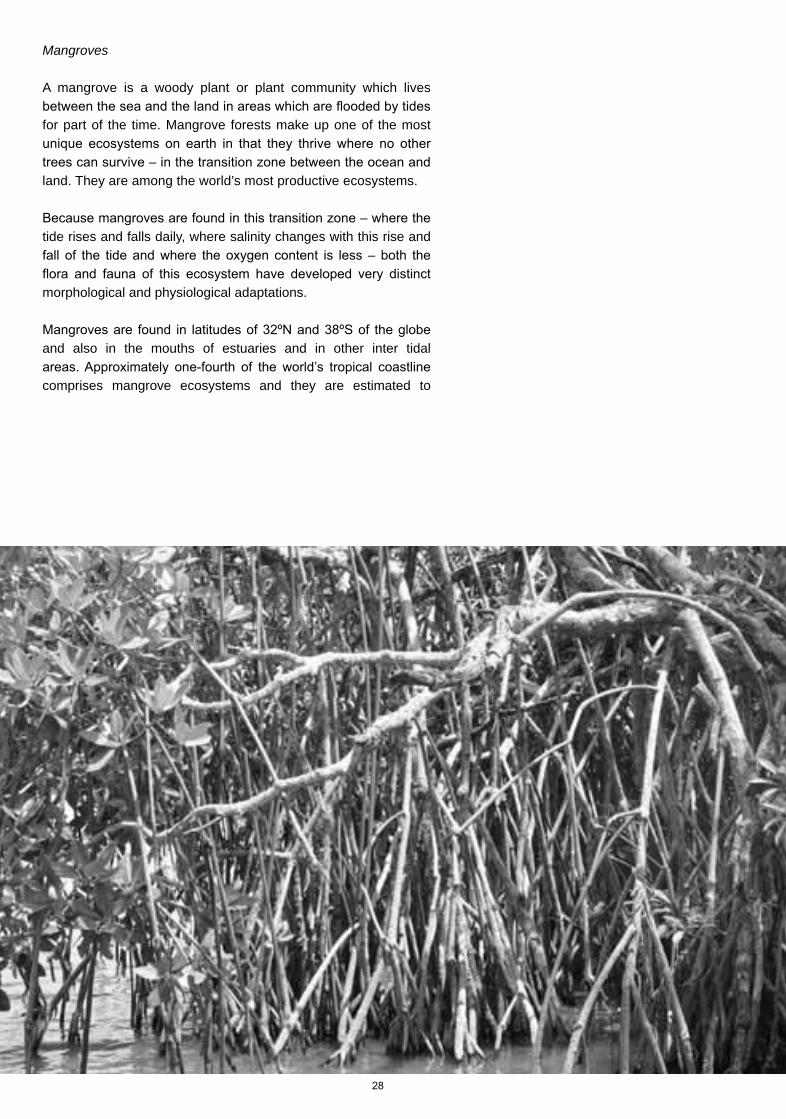
Mangroves
A mangrove is a woody plant or plant community which lives
for part of the time. Mangrove forests make up one of the most
land. They are among the world’s most productive ecosystems.
tide rises and falls daily, where salinity changes with this rise and
morphological and physiological adaptations.
and also in the mouths of estuaries and in other inter tidal
comprises mangrove ecosystems and they are estimated to
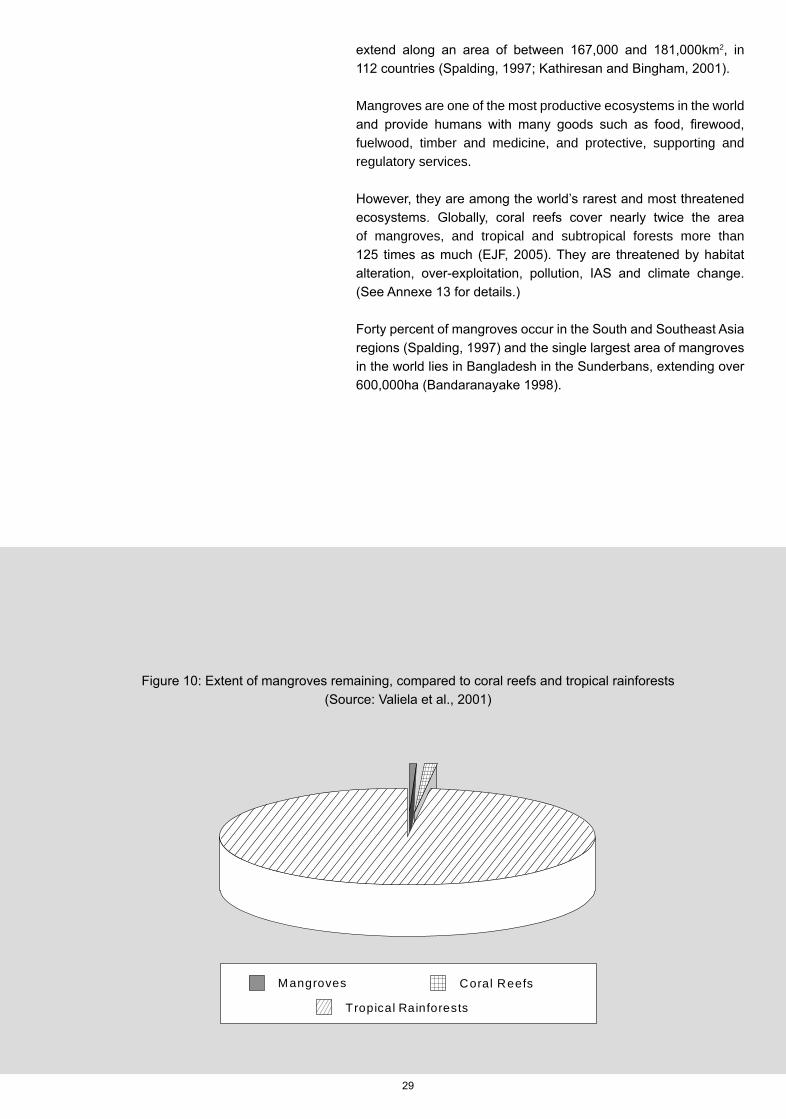
2, in
Mangroves are one of the most productive ecosystems in the world
fuelwood, timber and medicine, and protective, supporting and regulatory services.
of mangroves, and tropical and subtropical forests more than
Tropical Rainforests
Coral Reefs Mangroves
30
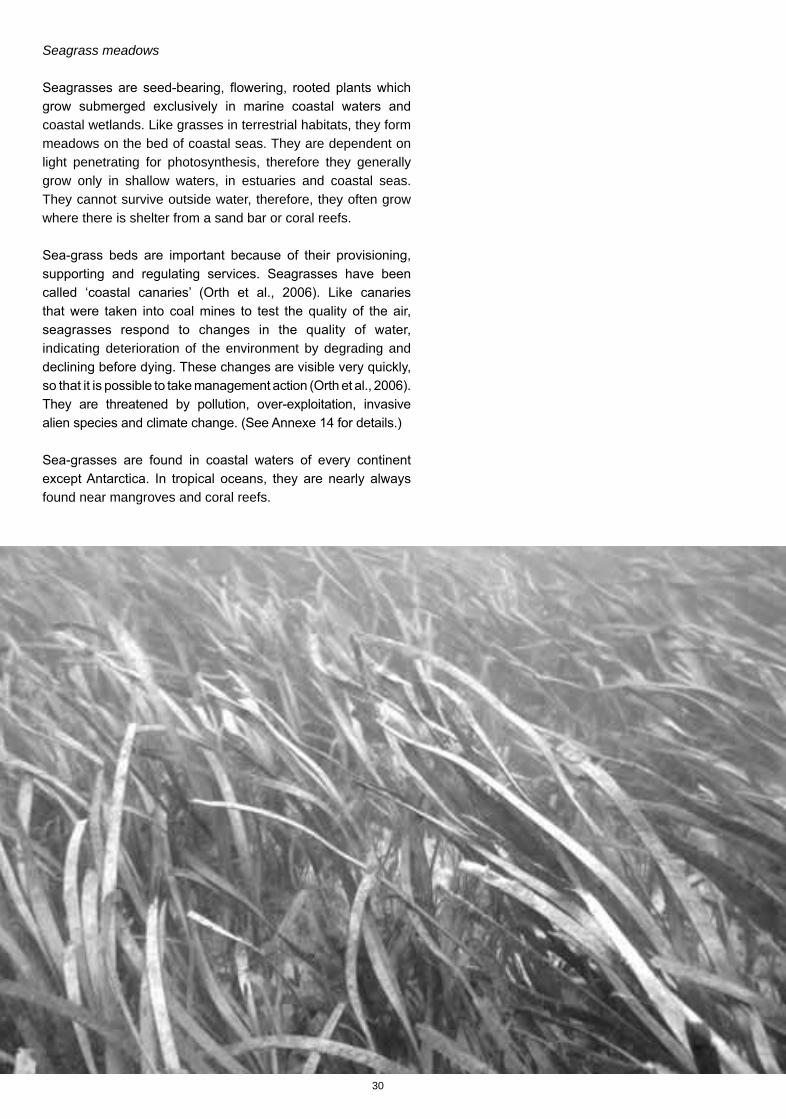
Seagrass meadows
coastal wetlands. Like grasses in terrestrial habitats, they form meadows on the bed of coastal seas. They are dependent on light penetrating for photosynthesis, therefore they generally grow only in shallow waters, in estuaries and coastal seas. They cannot survive outside water, therefore, they often grow where there is shelter from a sand bar or coral reefs.
indicating deterioration of the environment by degrading and
found near mangroves and coral reefs.
31
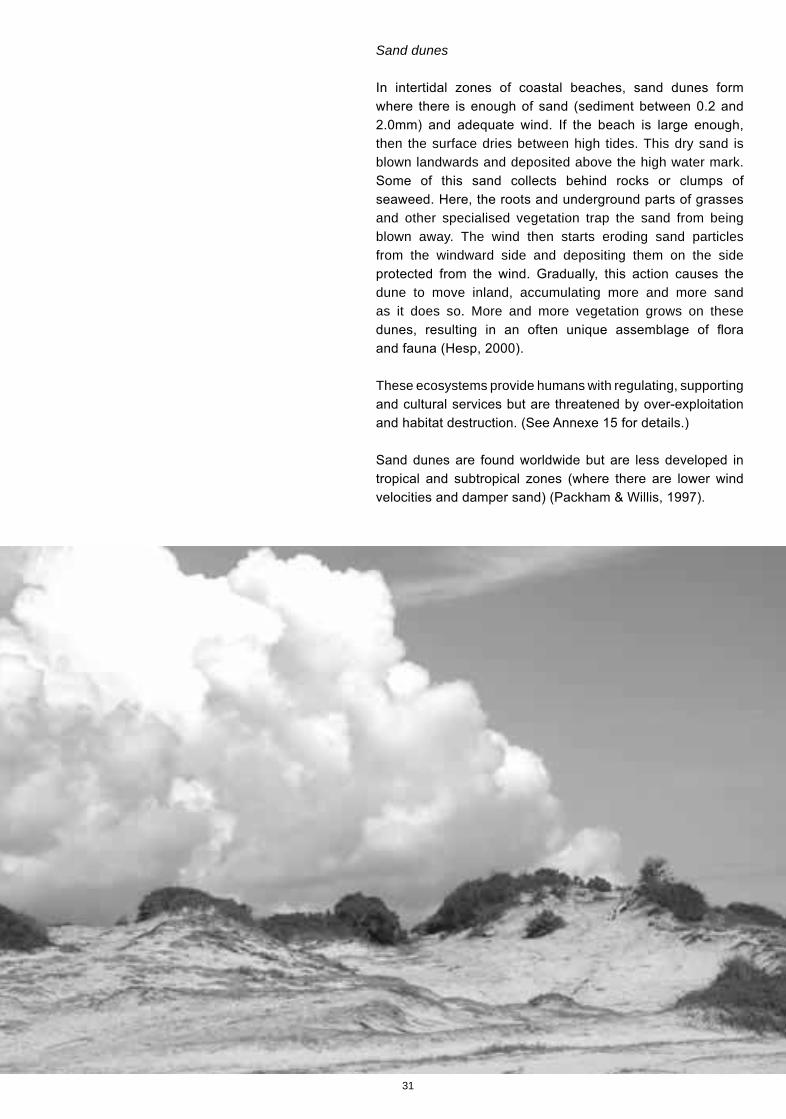
Sand dunes
then the surface dries between high tides. This dry sand is blown landwards and deposited above the high water mark.
and other specialised vegetation trap the sand from being blown away. The wind then starts eroding sand particles from the windward side and depositing them on the side
dune to move inland, accumulating more and more sand as it does so. More and more vegetation grows on these
These ecosystems provide humans with regulating, supporting

32
Estuaries and Lagoons
Estuaries
An estuary is the last, wide part of a river before it reaches the sea, i.e., it is the tidal mouth of a river. Estuaries are, therefore, important in the movement of sediment from rivers to the sea.
Lagoons
personal communication).
In both estuaries and lagoons, water is brackish .
Lagoons and estuaries are productive. The provisioning service of
livelihoods in the these ecosystems.
Lagoons and estuaries are under threat from both coastal erosion – which can change the physical structure of mouths and spits – changing lagoon morphology, as well as upstream pollution and
Fresh water
33
34
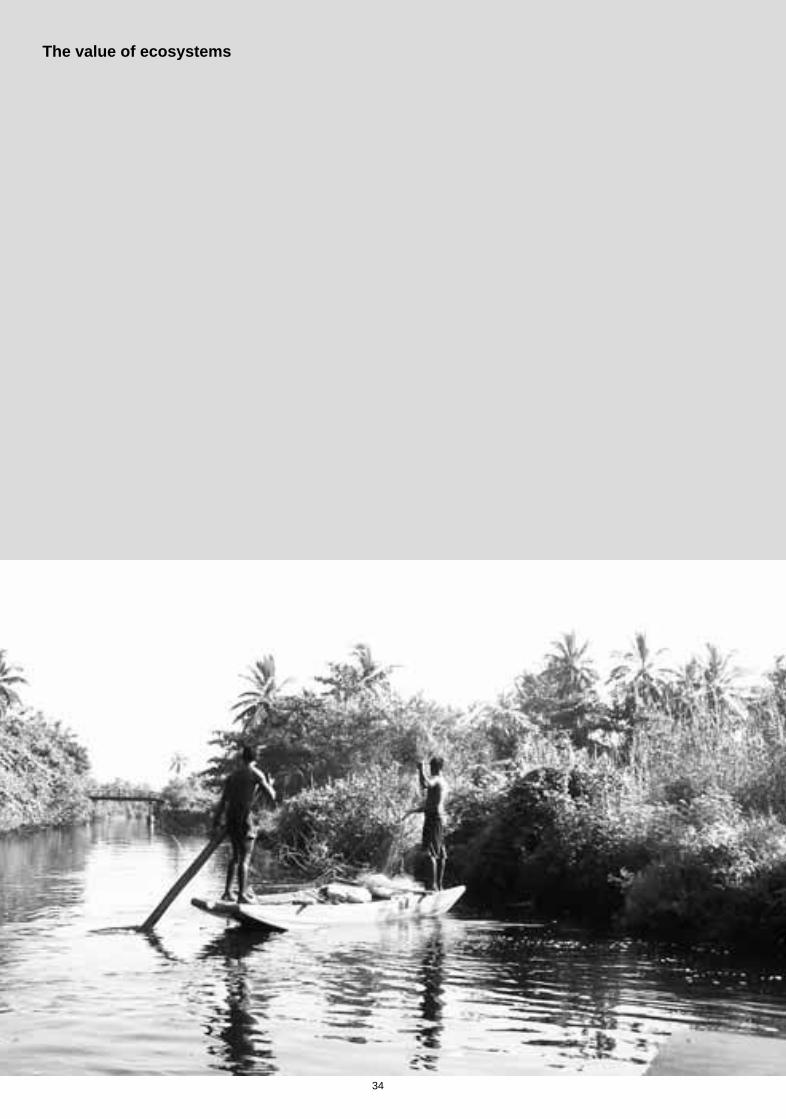
The value of ecosystems
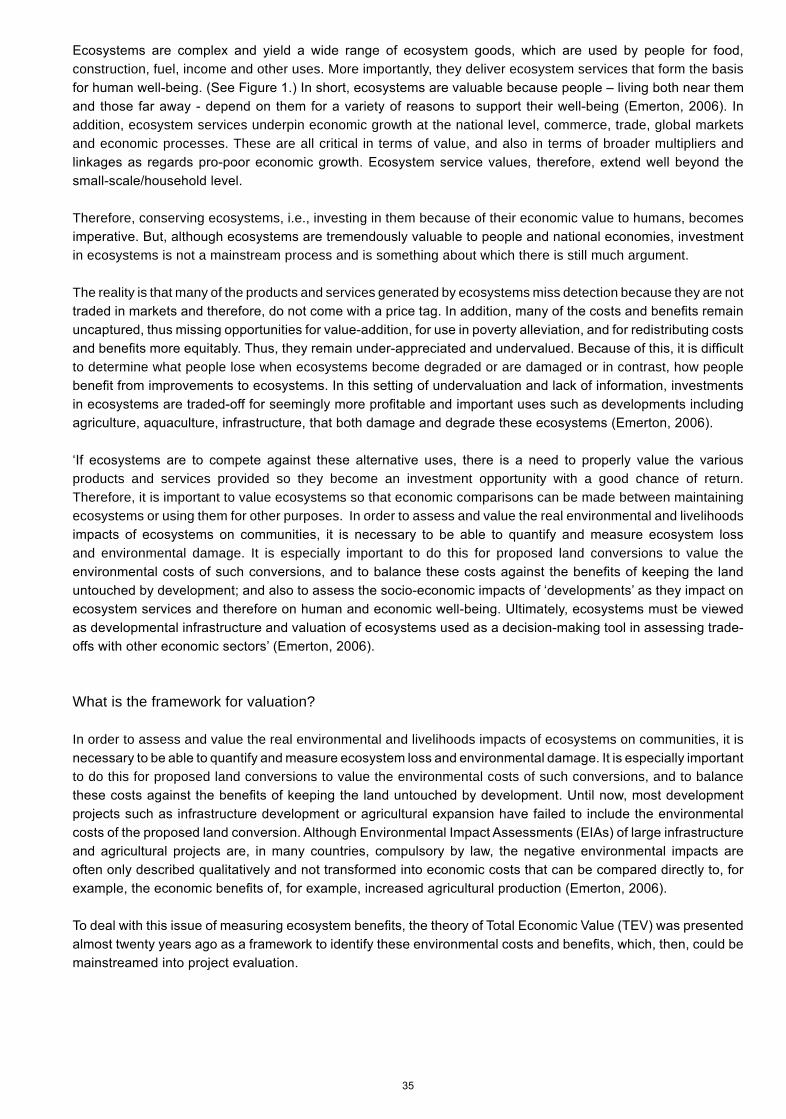
construction, fuel, income and other uses. More importantly, they deliver ecosystem services that form the basis
addition, ecosystem services underpin economic growth at the national level, commerce, trade, global markets and economic processes. These are all critical in terms of value, and also in terms of broader multipliers and
Therefore, conserving ecosystems, i.e., investing in them because of their economic value to humans, becomes
in ecosystems is not a mainstream process and is something about which there is still much argument.
The reality is that many of the products and services generated by ecosystems miss detection because they are not
to determine what people lose when ecosystems become degraded or are damaged or in contrast, how people
products and services provided so they become an investment opportunity with a good chance of return. Therefore, it is important to value ecosystems so that economic comparisons can be made between maintaining ecosystems or using them for other purposes. In order to assess and value the real environmental and livelihoods
and environmental damage. It is especially important to do this for proposed land conversions to value the
What is the framework for valuation?
In order to assess and value the real environmental and livelihoods impacts of ecosystems on communities, it is
to do this for proposed land conversions to value the environmental costs of such conversions, and to balance
although yet to be institutionalised in most conservation and development planning and appraisal processes. These
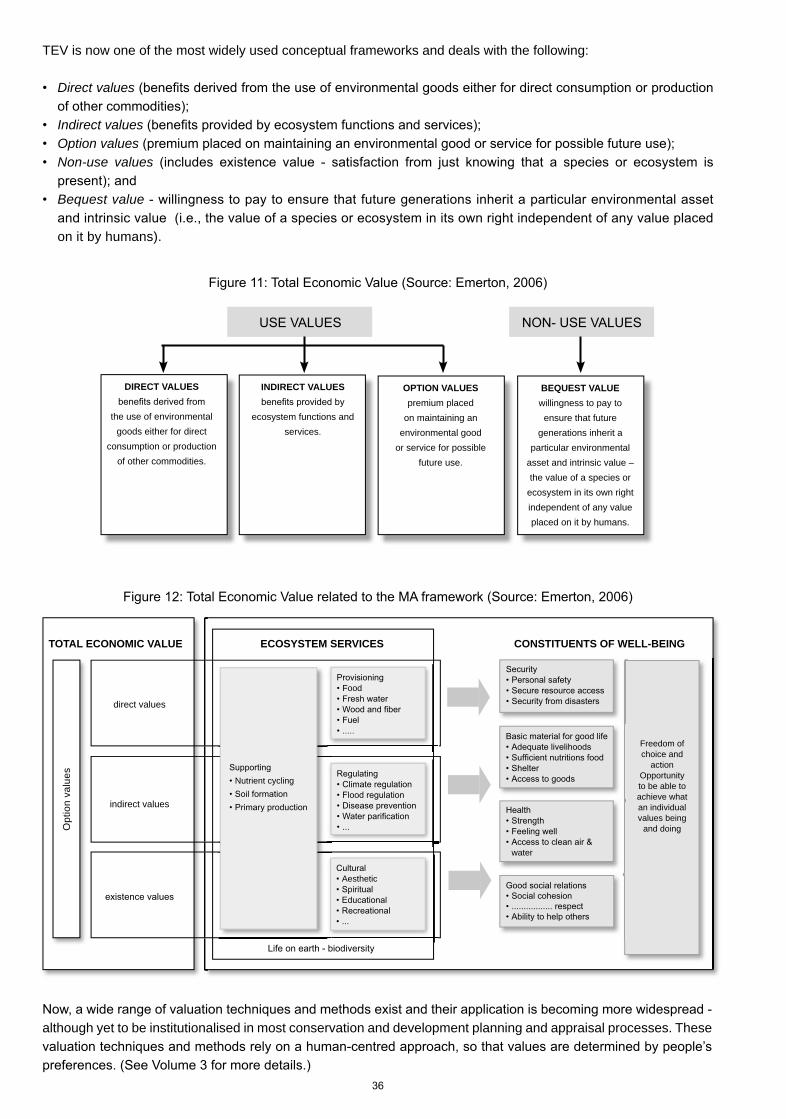
TEV is now one of the most widely used conceptual frameworks and deals with the following:
Direct values
Indirect valuesOption values Non-use values
Bequest value
on it by humans).
TOTAL ECONOMIC VALUE
Opt
ion
valu
es
direct values
indirect values
Nutrient cycling
Aesthetic
Freedom of choice and
actionOpportunityto be able to achieve whatan individual values being
and doing
water
Food
ECOSYSTEM SERVICES CONSTITUENTS OF WELL-BEING
DIRECT VALUES
the use of environmental
goods either for direct
consumption or production
of other commodities.
INDIRECT VALUES
ecosystem functions and
services.
OPTION VALUES
premium placed
on maintaining an
environmental good
or service for possible
future use.
BEQUEST VALUE
willingness to pay to
ensure that future
generations inherit a
particular environmental
asset and intrinsic value –
the value of a species or
ecosystem in its own right
independent of any value
placed on it by humans.
37
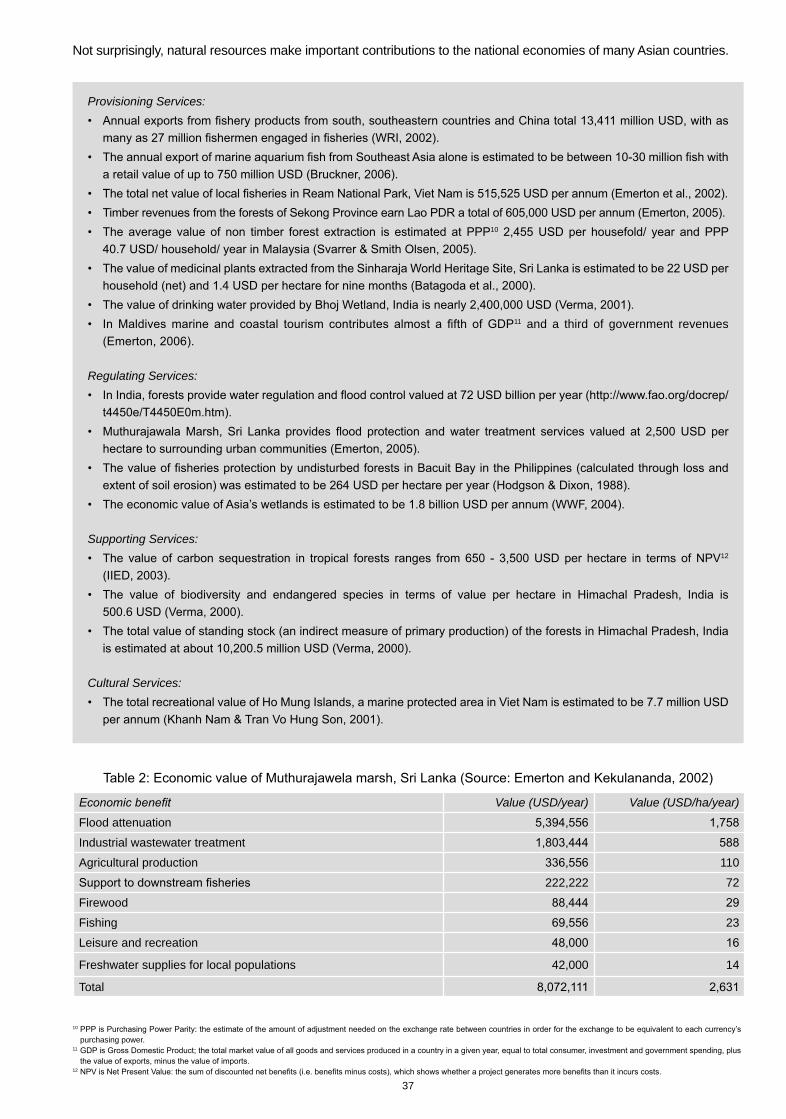
Not surprisingly, natural resources make important contributions to the national economies of many Asian countries.
10
purchasing power. 11
12
Value (USD/year) Value (USD/ha/year)
Flood attenuation
Industrial wastewater treatment
Agricultural production 110
222,222 72
Firewood
Fishing 23
Leisure and recreation
Freshwater supplies for local populations 42,000 14
Total
Provisioning Services:
10
11 and a third of government revenues
Regulating Services:
Supporting Services:12
Cultural Services:
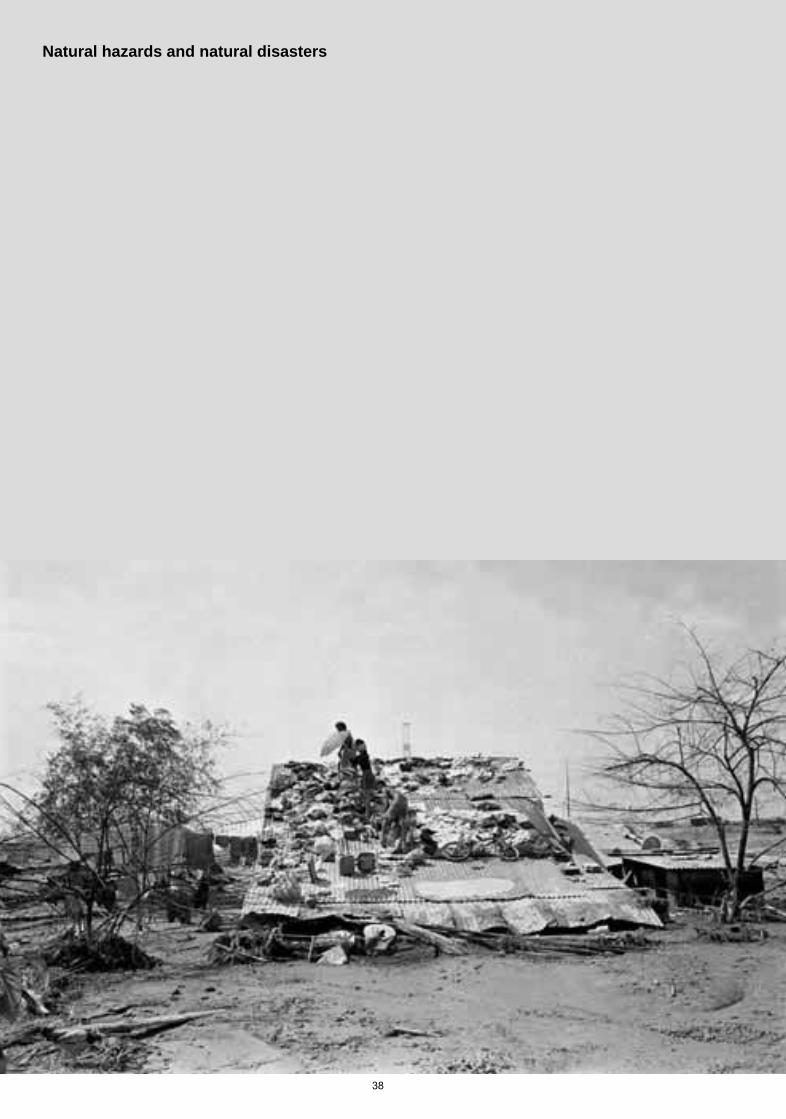
Natural hazards and natural disasters

is a naturally occurring phenomenon that is harmful to humans and has the potential to cause damage. Natural
shtml.).
effect of natural disasters – i.e., natural disasters can be reduced or prevented. This is a basic difference between a natural hazard and natural disaster.
The difference in the capability to cope is vulnerability.
Various elements such as social, environmental, economical and infrastructural factors affect the capability of
built on a slope. The risk for the damage is from a landslide. The people whose house is built on this slope are,
basic ecosystem services are environmentally vulnerable.
Figure 13a: The different elements of vulnerability
Environmental vulnerability
Attitudinal vulnerability
Vulnerability
40
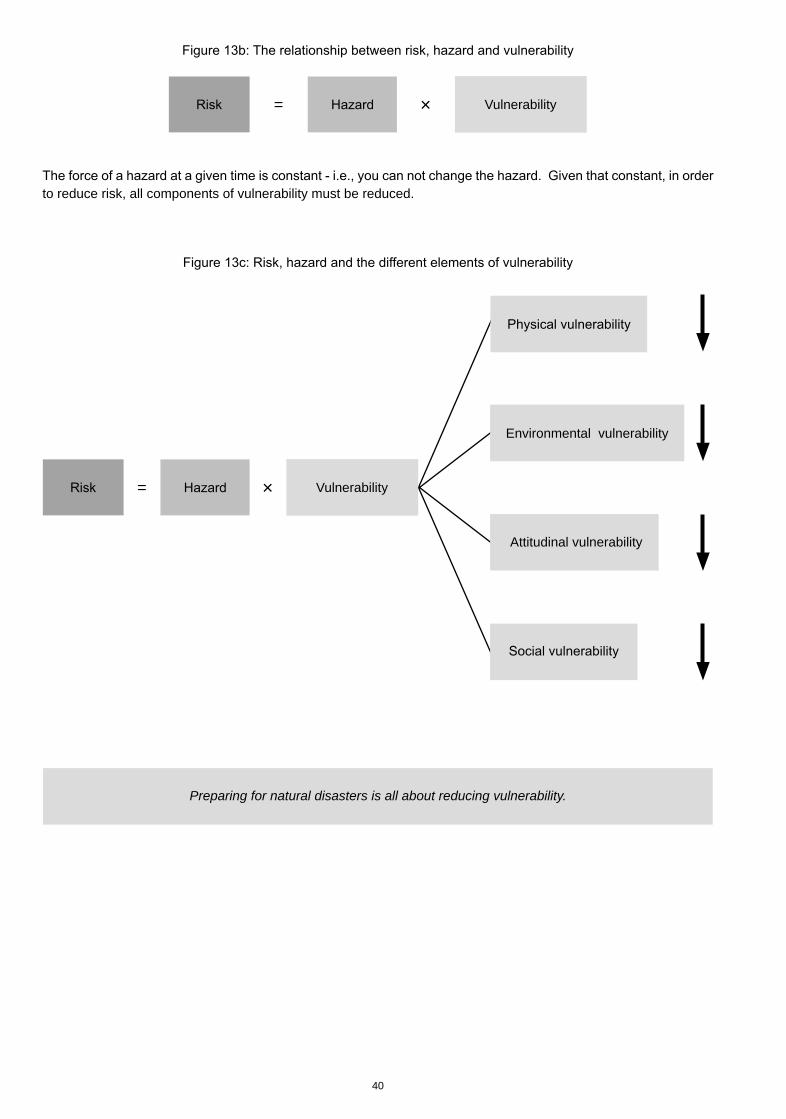
= × Vulnerability
to reduce risk, all components of vulnerability must be reduced.
Preparing for natural disasters is all about reducing vulnerability.
Environmental vulnerability
Attitudinal vulnerability
= × Vulnerability
41
Earthquakes:
13
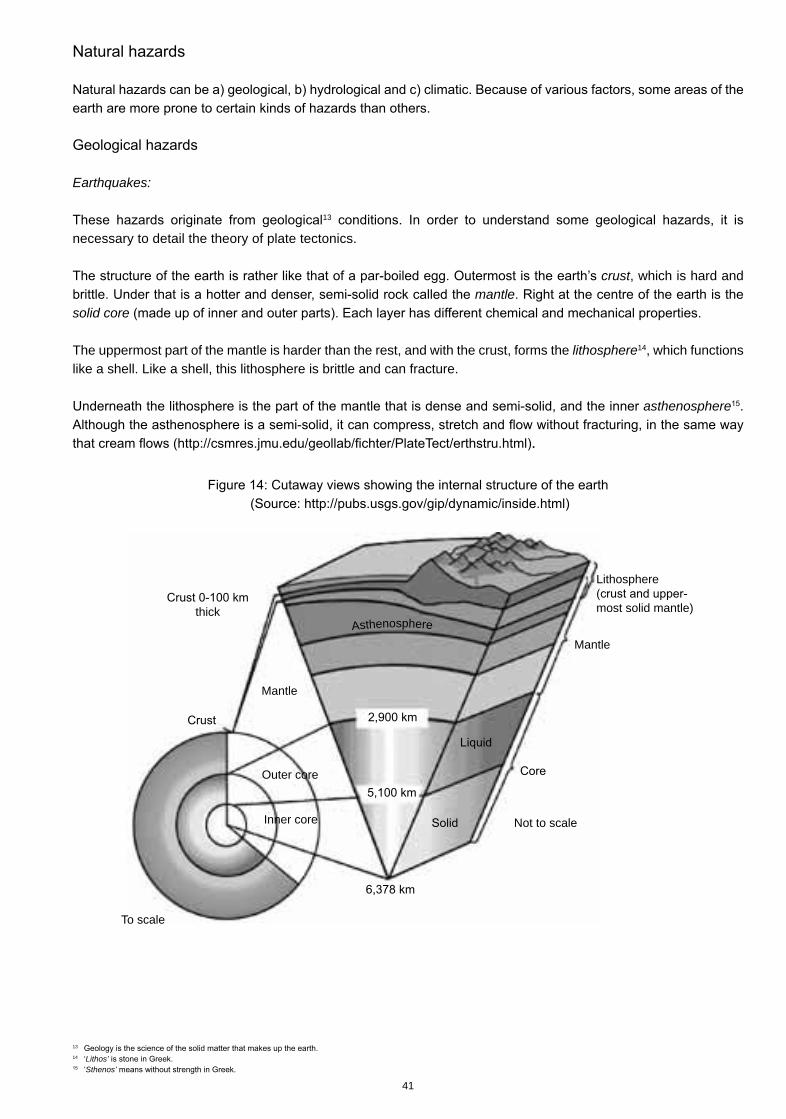
necessary to detail the theory of plate tectonics.
crust, which is hard and mantle
solid core
The uppermost part of the mantle is harder than the rest, and with the crust, forms the lithosphere14, which functions like a shell. Like a shell, this lithosphere is brittle and can fracture.
asthenosphere .
.
13
14 Lithos’Sthenos’
thick
Mantle
Outer core
Inner core
To scale
Mantle
Lithosphere
most solid mantle)
Not to scale
Asthenosphere
42
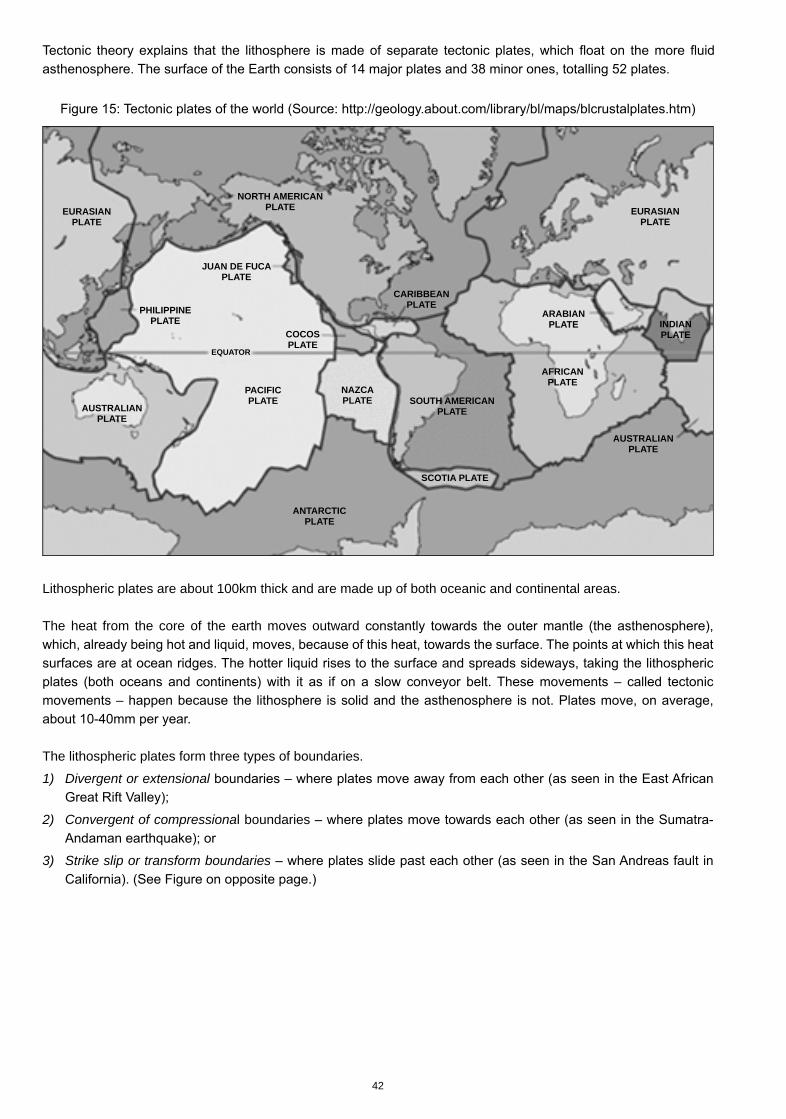
Lithospheric plates are about 100km thick and are made up of both oceanic and continental areas.
The heat from the core of the earth moves outward
The lithospheric plates form three types of boundaries.
1) Divergent or extensional
2) Convergent of compressional boundaries –
3) Strike slip or transform boundaries –
EURASIAN
PLATE
PHILIPPINE
PLATE
JUAN DE FUCA
PLATE
COCOS
PLATEEQUATOR
PACIFIC
PLATE
CARIBBEAN
PLATEARABIAN
PLATE
AFRICAN
PLATE
EURASIAN
PLATE
INDIAN
PLATE
AUSTRALIAN
PLATE
NAZCA
PLATE SOUTH AMERICAN
PLATE
SCOTIA PLATE
ANTARCTIC
PLATE
AUSTRALIAN
PLATE
NORTH AMERICAN
PLATE
43
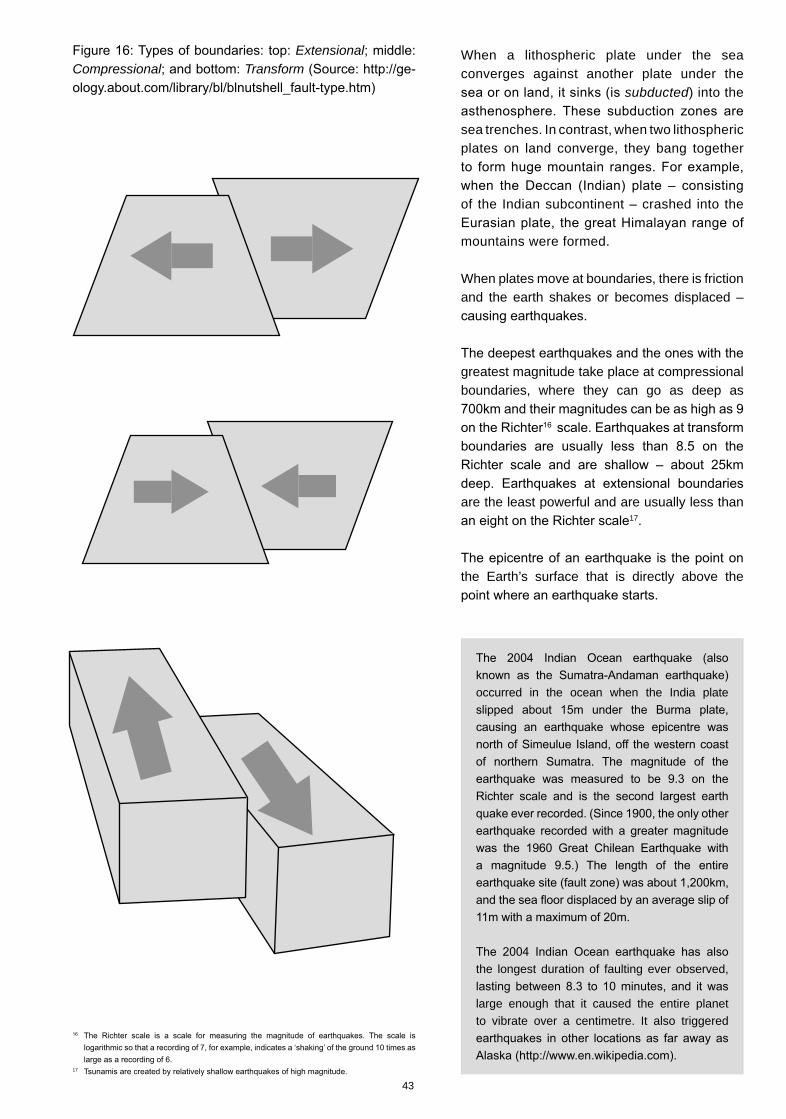
When a lithospheric plate under the sea converges against another plate under the
subducted) into the
sea trenches. In contrast, when two lithospheric plates on land converge, they bang together
of the Indian subcontinent – crashed into the
mountains were formed.
When plates move at boundaries, there is friction and the earth shakes or becomes displaced –
greatest magnitude take place at compressional boundaries, where they can go as deep as
are the least powerful and are usually less than 17.
the Earth’s surface that is directly above the
occurred in the ocean when the India plate
the longest duration of faulting ever observed,
large enough that it caused the entire planet to vibrate over a centimetre. It also triggered
17
ExtensionalCompressional Transform
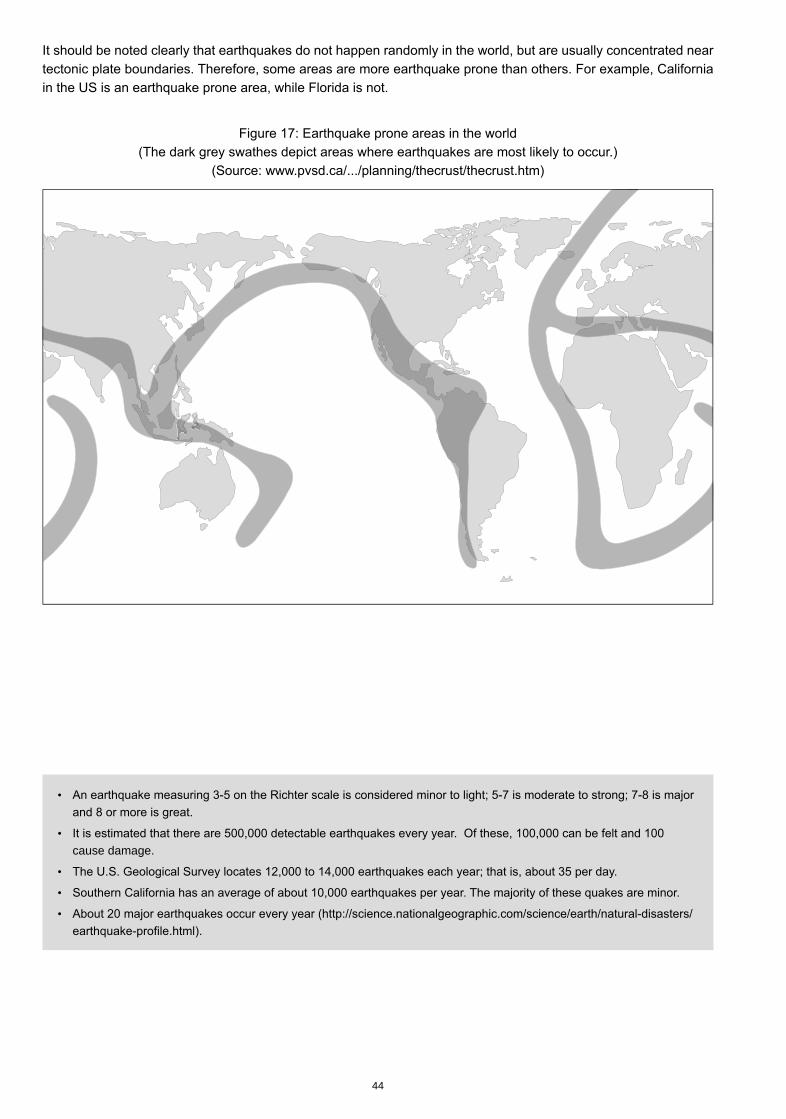
44
cause damage.
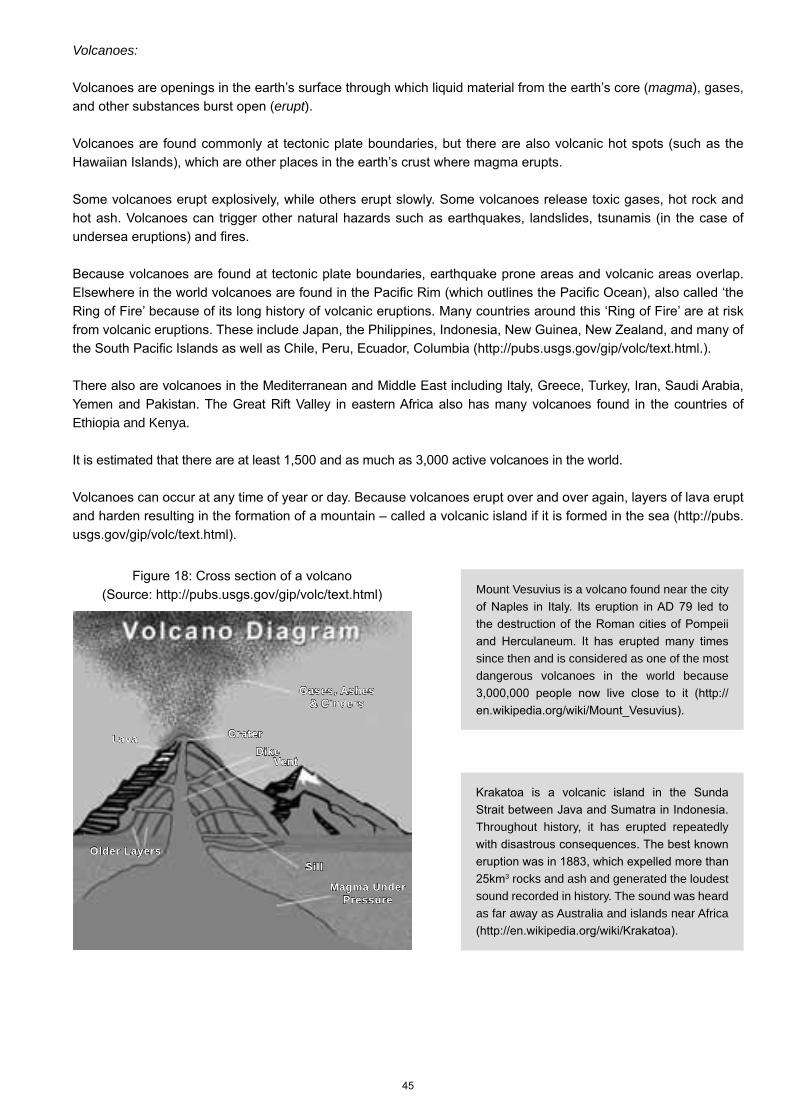
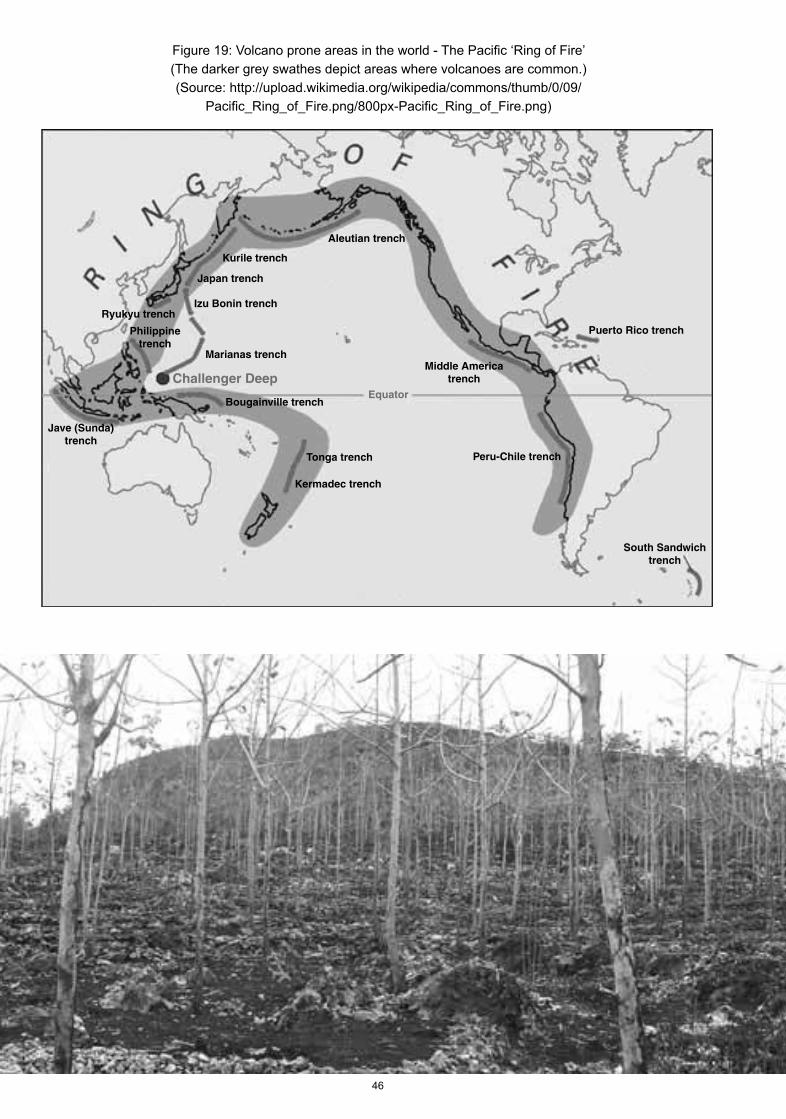
Volcanoes:
magma), gases, erupt).
Ethiopia and Kenya.
Mount Vesuvius is a volcano found near the city
since then and is considered as one of the most dangerous volcanoes in the world because
Throughout history, it has erupted repeatedly
3 rocks and ash and generated the loudest sound recorded in history. The sound was heard as far away as Australia and islands near Africa
LavaCrater
DikeVent
Gases, Ashes
& Cinders
Older Layers
Sill
Magma Under
Pressure
Jave (Sunda)trench
Philippinetrench
Ryukyu trenchIzu Bonin trench
Japan trench
Kurile trench
Aleutian trench
Marianas trench
Bougainville trench
Tonga trench Peru-Chile trench
Puerto Rico trench
Kermadec trench
Challenger DeepMiddle America
trenchEquator
South Sandwichtrench
47
Landslides:
Landslides are mass movements of rock, debris and soil down a slope of land. In nature, landslides can be caused
and rainfall and erosion from rivers can also cause landslides.
landslides. The large amount of soil loosened and released by a land slide can, on occasion, be carried down as
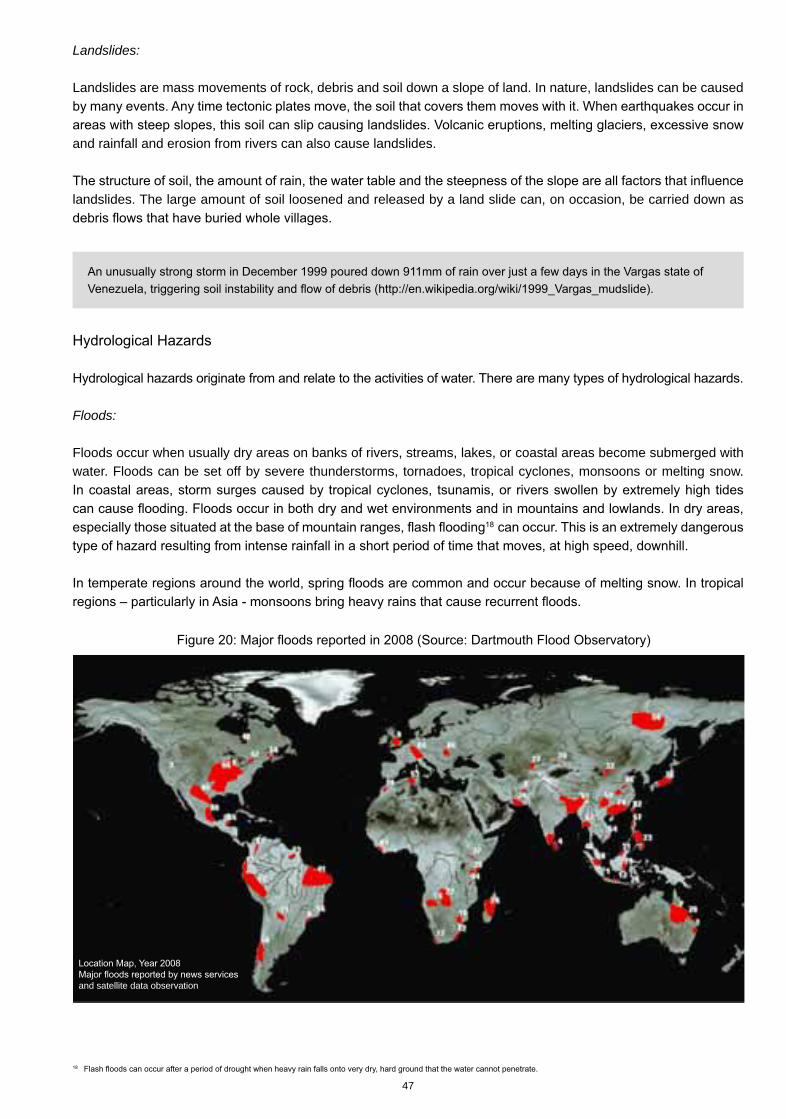
Floods:
Floods occur when usually dry areas on banks of rivers, streams, lakes, or coastal areas become submerged with water. Floods can be set off by severe thunderstorms, tornadoes, tropical cyclones, monsoons or melting snow.
and satellite data observation
2008 - Global Flood Archive - Dartmouth Flood observatory
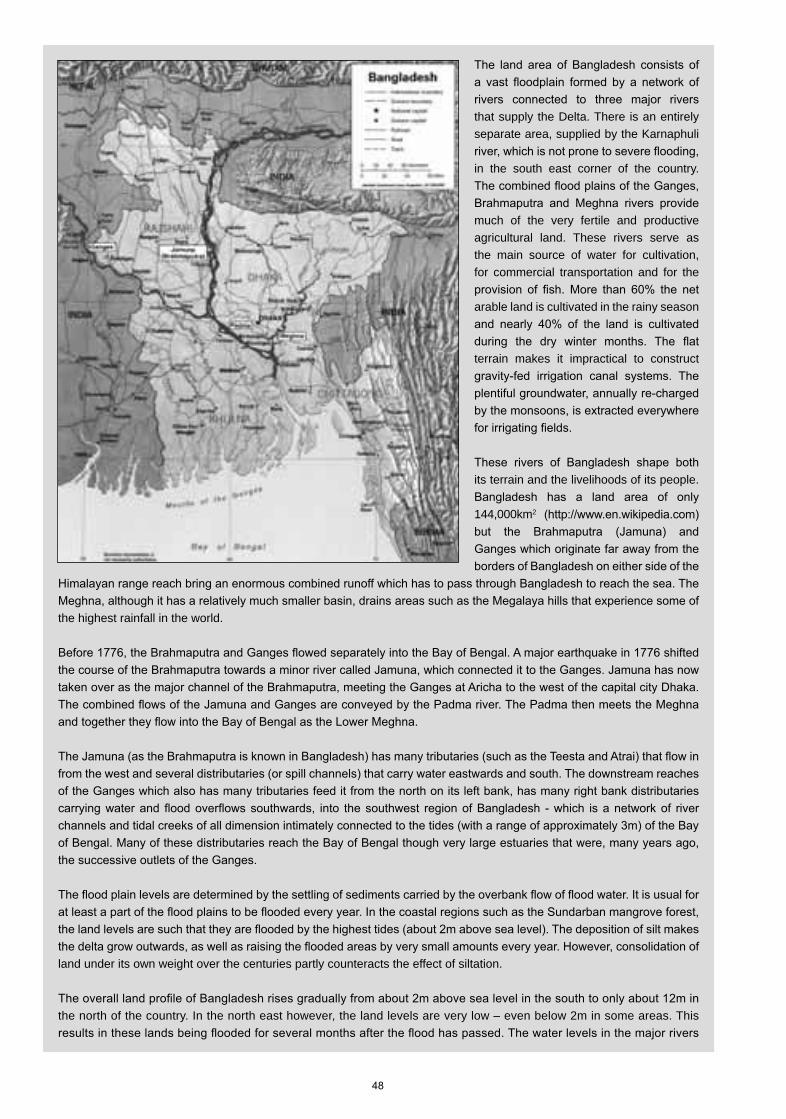
that supply the Delta. There is an entirely separate area, supplied by the Karnaphuli
in the south east corner of the country.
much of the very fertile and productive agricultural land. These rivers serve as the main source of water for cultivation, for commercial transportation and for the
arable land is cultivated in the rainy season
terrain makes it impractical to construct
its terrain and the livelihoods of its people.
144,000km2
the highest rainfall in the world.
land under its own weight over the centuries partly counteracts the effect of siltation.
the north of the country. In the north east however, the land levels are very low – even below 2m in some areas. This

Number of reported droughts
0
> 10
Drought:
human needs, agriculture and ecosystems.
and southeastern parts of the island are fed only by a single monsoon – the north east monsoon which
causing a drought.
2
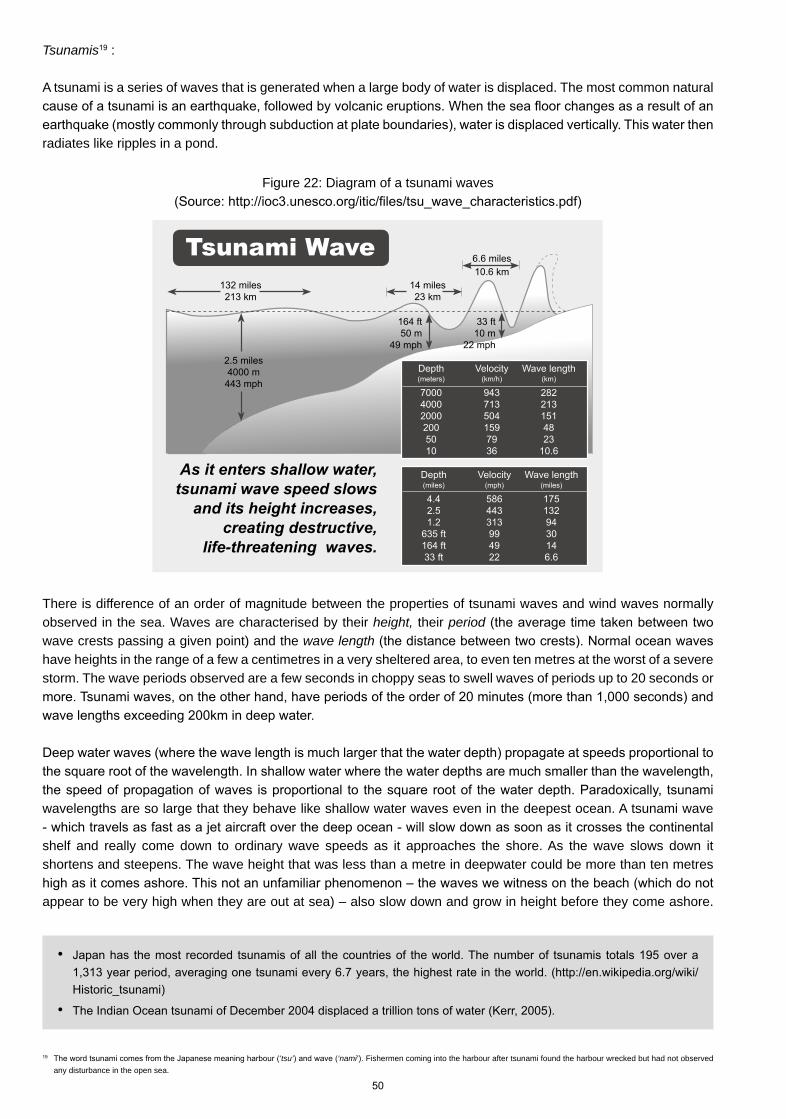
Tsunamis :
A tsunami is a series of waves that is generated when a large body of water is displaced. The most common natural
radiates like ripples in a pond.
There is difference of an order of magnitude between the properties of tsunami waves and wind waves normally observed in the sea. Waves are characterised by their height, their periodwave crests passing a given point) and the wave lengthhave heights in the range of a few a centimetres in a very sheltered area, to even ten metres at the worst of a severe storm. The wave periods observed are a few seconds in choppy seas to swell waves of periods up to 20 seconds or
wavelengths are so large that they behave like shallow water waves even in the deepest ocean. A tsunami wave
shelf and really come down to ordinary wave speeds as it approaches the shore. As the wave slows down it shortens and steepens. The wave height that was less than a metre in deepwater could be more than ten metres
appear to be very high when they are out at sea) – also slow down and grow in height before they come ashore.
tsu’ ‘nami’). Fishermen coming into the harbour after tsunami found the harbour wrecked but had not observed
any disturbance in the open sea.
Figure 22: Diagram of a tsunami waves
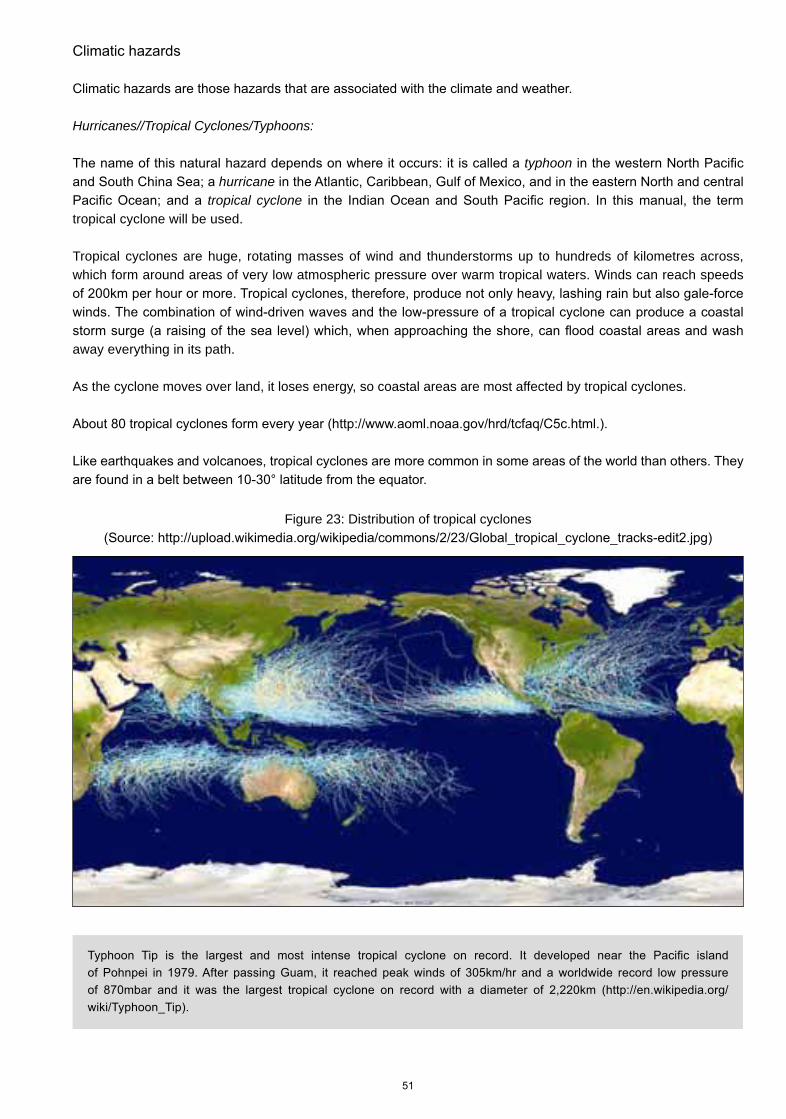
Hurricanes//Tropical Cyclones/Typhoons:
typhoonhurricane
tropical cyclonetropical cyclone will be used.
Tropical cyclones are huge, rotating masses of wind and thunderstorms up to hundreds of kilometres across, which form around areas of very low atmospheric pressure over warm tropical waters. Winds can reach speeds
away everything in its path.
As the cyclone moves over land, it loses energy, so coastal areas are most affected by tropical cyclones.
Figure 23: Distribution of tropical cyclones
s:
spell during which vegetation becomes dry enough to burn. Volcanic eruptions, lightning and changes in climatic
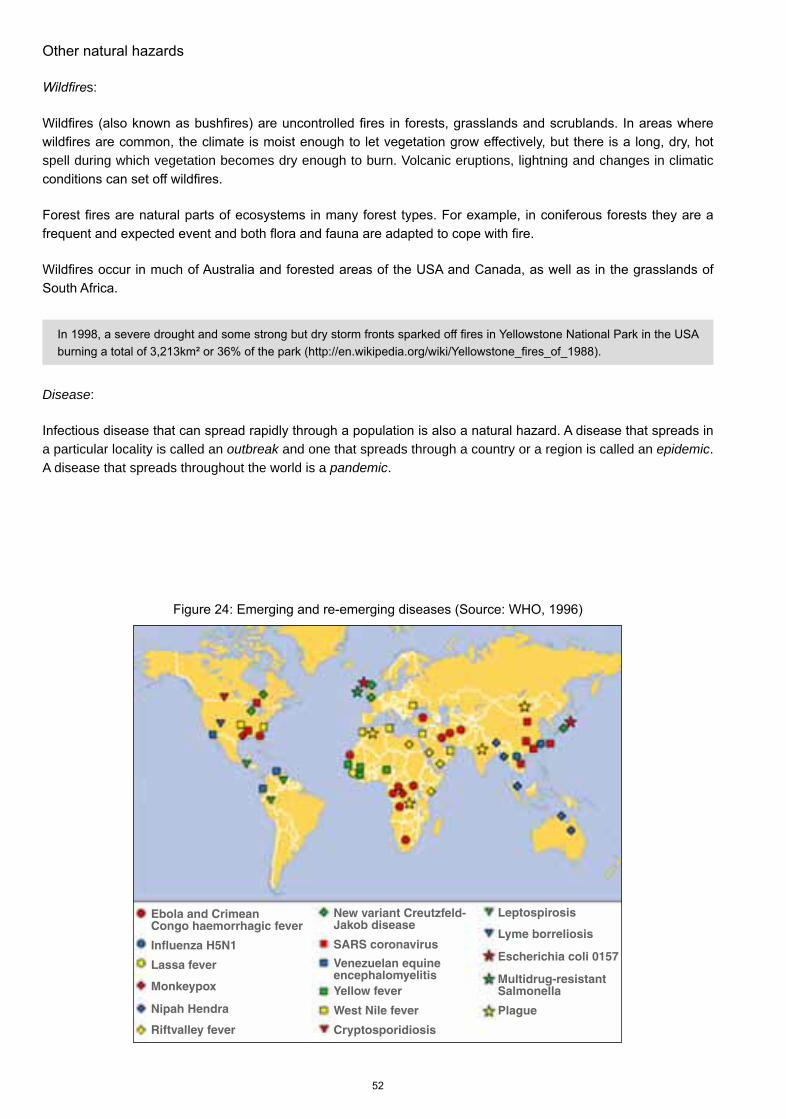
Disease:
a particular locality is called an outbreak and one that spreads through a country or a region is called an epidemic. A disease that spreads throughout the world is a pandemic.
Ebola and Crimean Congo haemorrhagic fever
Influenza H5N1
Lassa fever
Monkeypox
Nipah Hendra
Riftvalley fever
New variant Creutzfeld-Jakob disease
SARS coronavirus
Venezuelan equineencephalomyelitisYellow fever
West Nile fever
Cryptosporidiosis
Leptospirosis
Lyme borreliosis
Escherichia coli 0157
Multidrug-resistantSalmonella
Plague
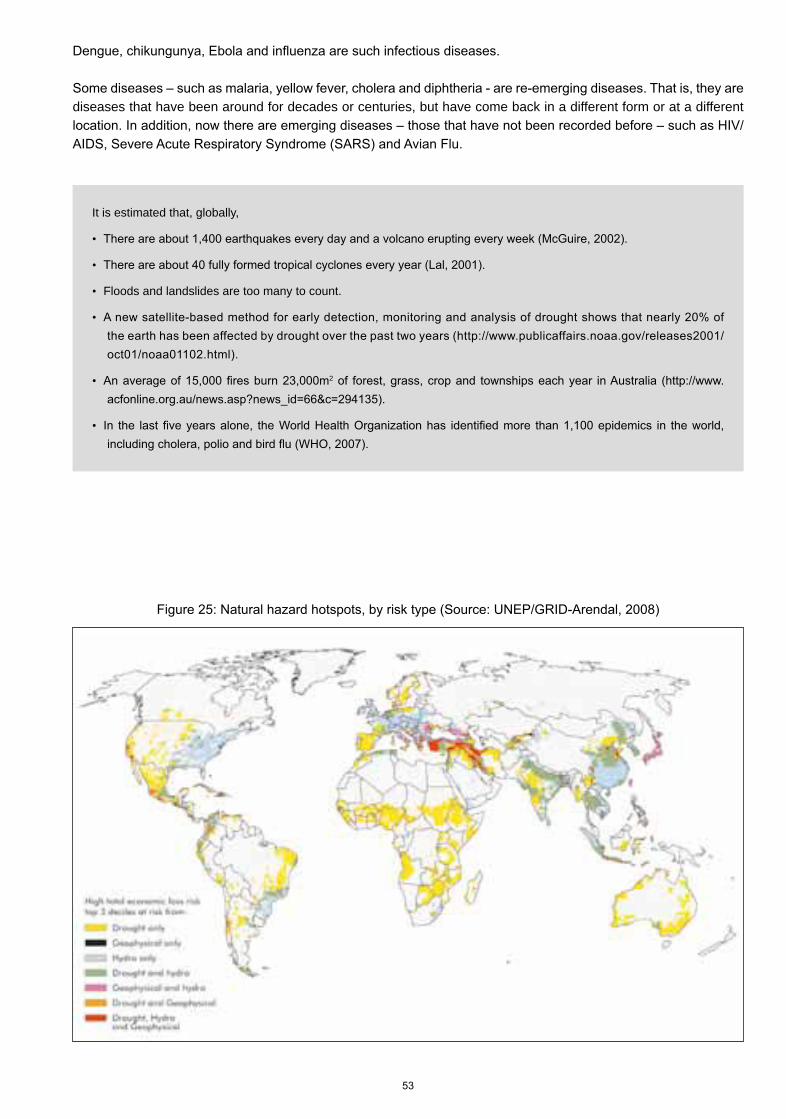
It is estimated that, globally,
Floods and landslides are too many to count.
2
diseases that have been around for decades or centuries, but have come back in a different form or at a different
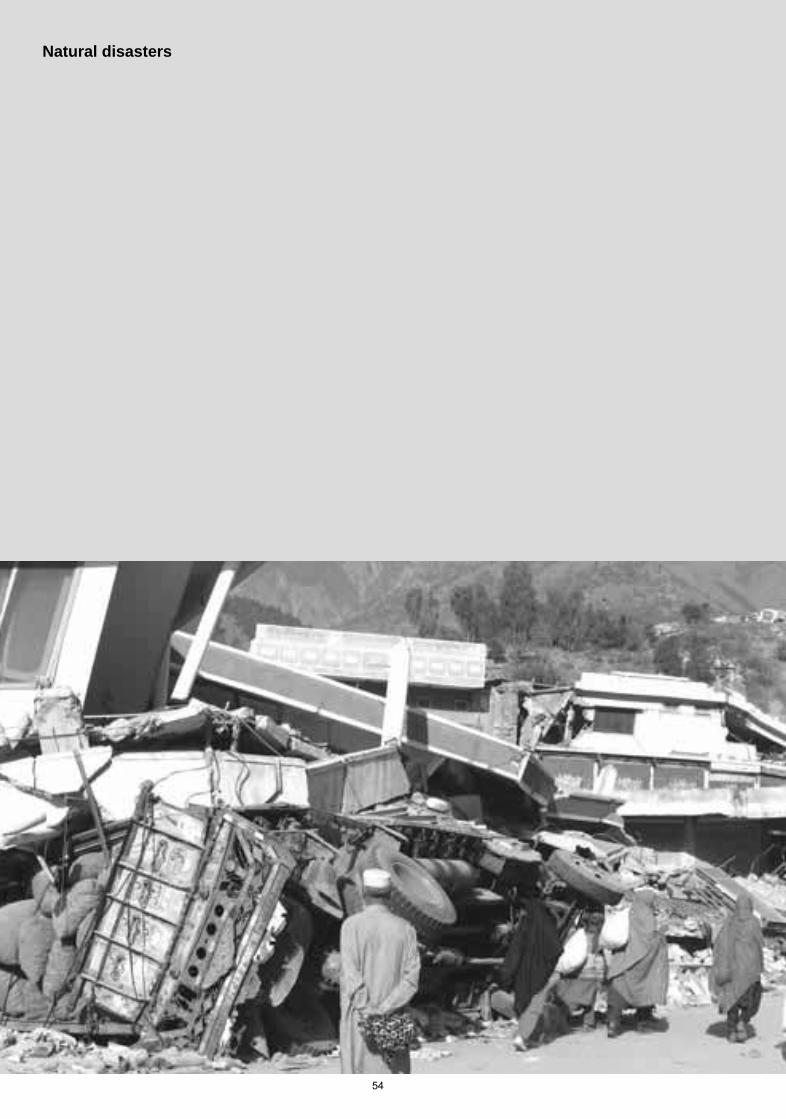
Natural disasters
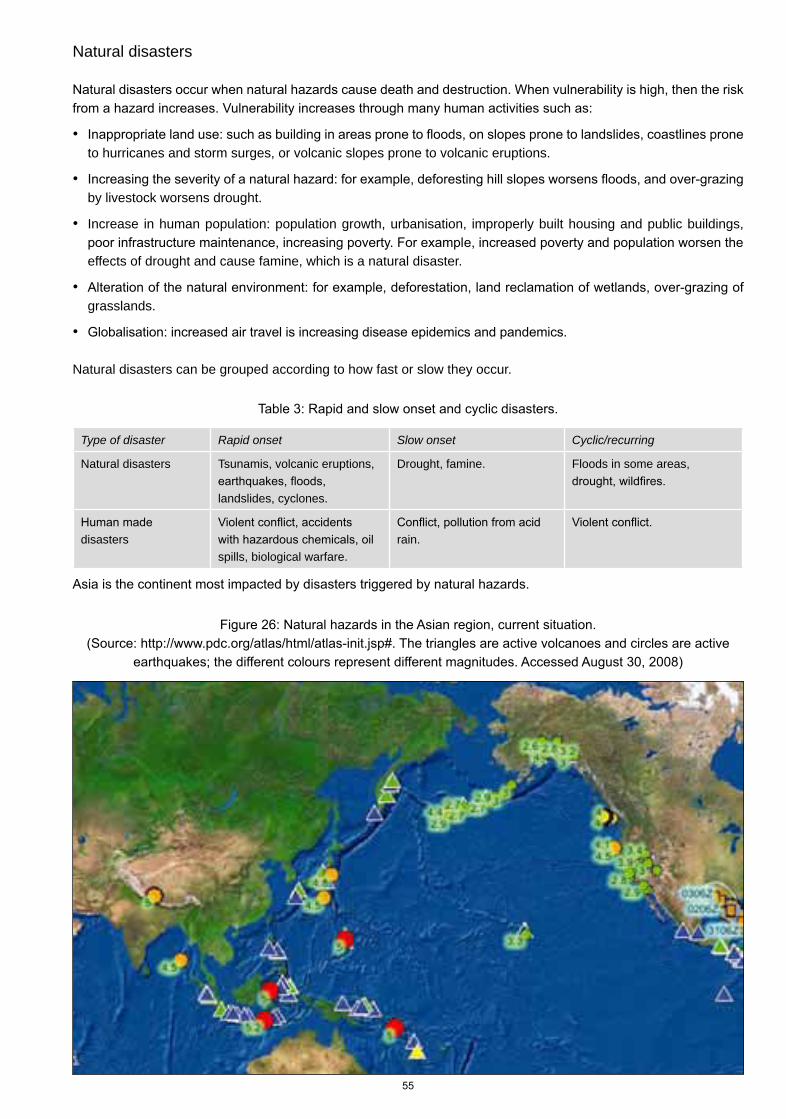
Natural disasters
to hurricanes and storm surges, or volcanic slopes prone to volcanic eruptions.
by livestock worsens drought.
Increase in human population: population growth, urbanisation, improperly built housing and public buildings,
effects of drought and cause famine, which is a natural disaster.
grasslands.
Natural disasters can be grouped according to how fast or slow they occur.
Type of disaster Rapid onset Slow onset Cyclic/recurring
Natural disasters Tsunamis, volcanic eruptions,
landslides, cyclones.
Drought, famine. Floods in some areas,
disastersspills, biological warfare.
rain.
Type of natural disaster Year Location No of human deaths
Volcano Mount Tambora, Indonesia
Landslide
Flood
Famine
Tsunami 2004 Indian Ocean
Tropical cyclone
20th century Worldwide > 300,000,000
20th century Worldwide
Type of natural disaster Year Location Damage in USD
Volcano
Landslide
Flood
Famine Australia
Tsunami 2004 Indian Ocean
Tropical cyclone
Indonesia 17,000,000,000
2007 Worldwide 10 billion for the year.
Type of natural disaster
Location No of human deaths and displacements Damage in USD
Tropical stormMyanmar 40,000 other people are reported missing.
10 billion
though the number could be as high as 11 million.
Floodsmonsoon season
Two million displaced.
Not yet estimated.
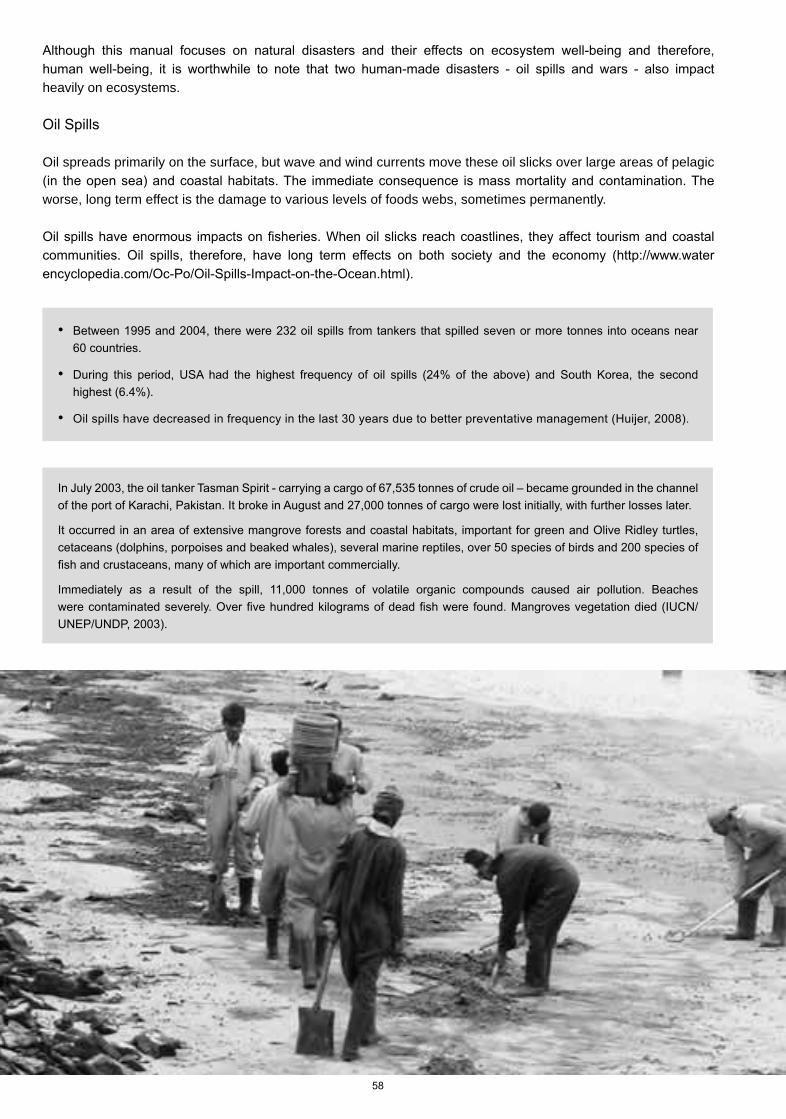
heavily on ecosystems.
Oil spreads primarily on the surface, but wave and wind currents move these oil slicks over large areas of pelagic
worse, long term effect is the damage to various levels of foods webs, sometimes permanently.
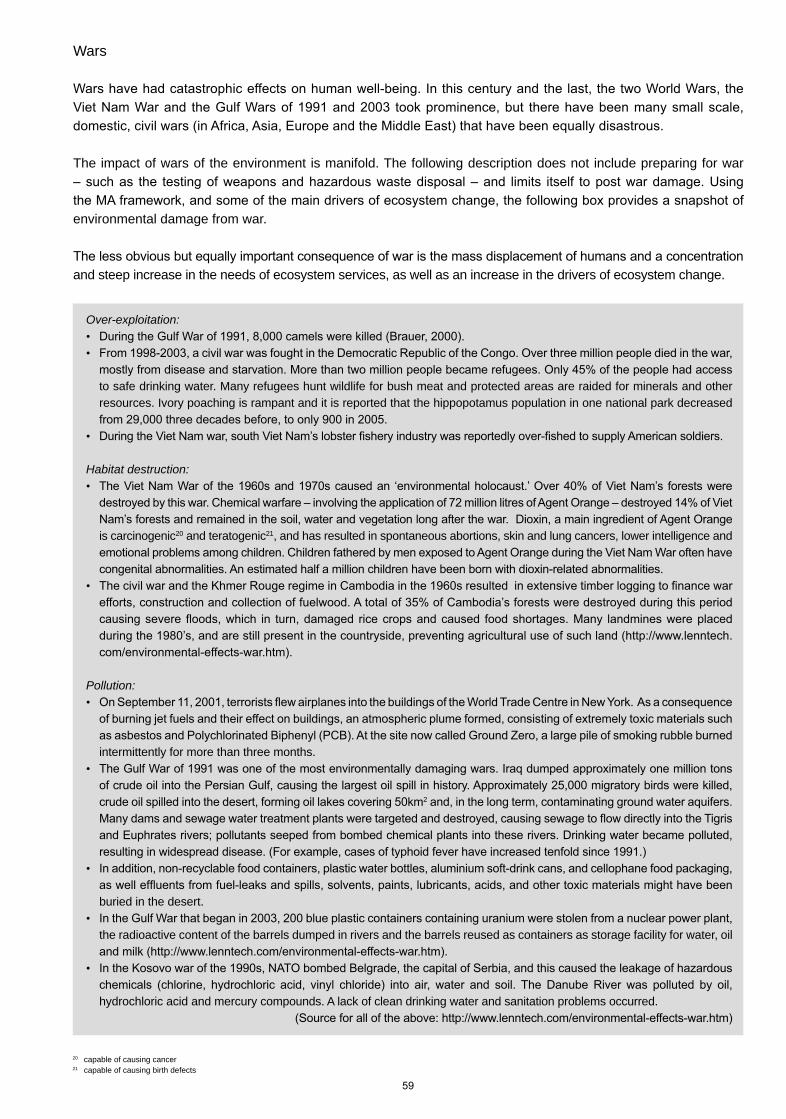
Wars
The impact of wars of the environment is manifold. The following description does not include preparing for war
environmental damage from war.
and steep increase in the needs of ecosystem services, as well as an increase in the drivers of ecosystem change.
Over-exploitation:
to safe drinking water. Many refugees hunt wildlife for bush meat and protected areas are raided for minerals and other resources. Ivory poaching is rampant and it is reported that the hippopotamus population in one national park decreased
Habitat destruction:
is carcinogenic20 and teratogenic21, and has resulted in spontaneous abortions, skin and lung cancers, lower intelligence and
Pollution:
intermittently for more than three months.
2
buried in the desert.
the radioactive content of the barrels dumped in rivers and the barrels reused as containers as storage facility for water, oil
hydrochloric acid and mercury compounds. A lack of clean drinking water and sanitation problems occurred.
20 capable of causing cancer 21 capable of causing birth defects
Global warming and climate change
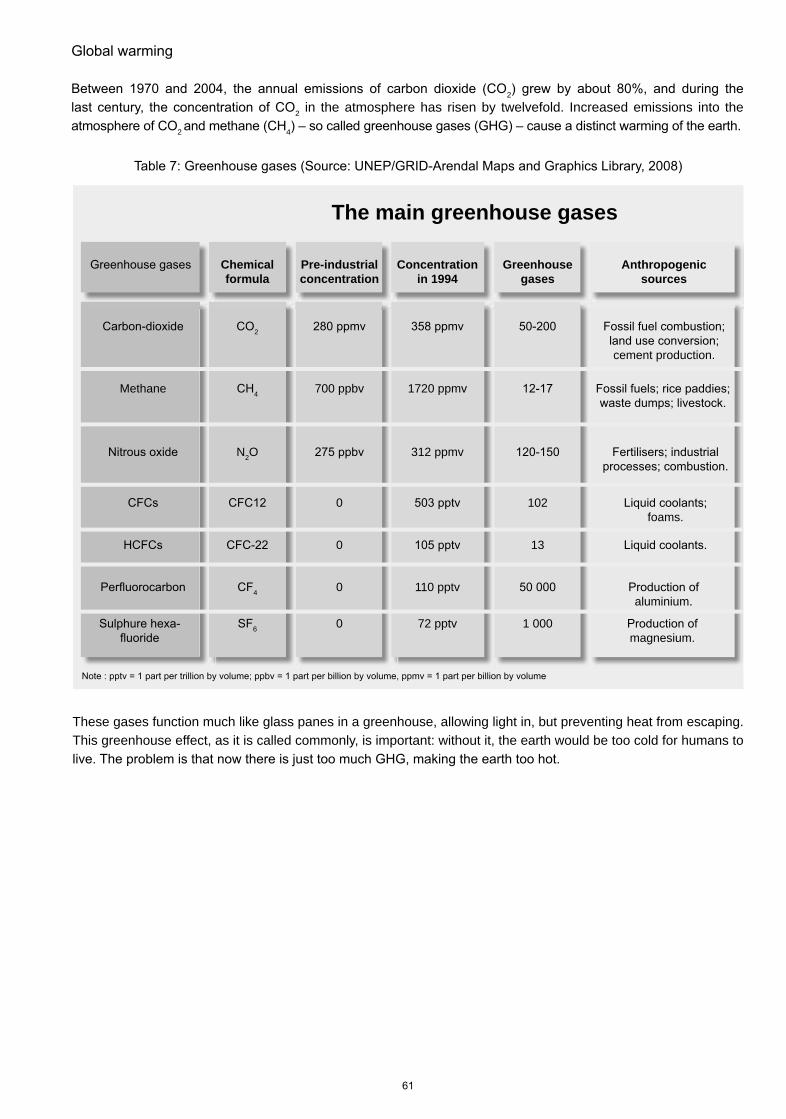
2
2 in the atmosphere has risen by twelvefold. Increased emissions into the
2 4
These gases function much like glass panes in a greenhouse, allowing light in, but preventing heat from escaping. This greenhouse effect, as it is called commonly, is important: without it, the earth would be too cold for humans to
The main greenhouse gases
Methane
Chemical
formula
2
4
N2O
4
Pre-industrial
concentration
700 ppbv
0
0
0
0
Concentration
in 1994
1720 ppmv
312 ppmv
110 pptv
72 pptv
Greenhouse
gases
102
13
1 000
Anthropogenic
sources
cement production.
foams.
aluminium.
magnesium.
2 in the
use of coal and oil, countless vehicles that use up gallons of petrol, and industries that are emitting enormous
2
2) are being cut down. Every year,
2 are emitted into the
In the meantime, trash and garbage are heaped as solid
The result of these emissions and increased greenhouse effect is a distinct warming of the earth. During the last
measured as the largest increase in thousand years.
kept constant at levels of year 2000, the earth will still
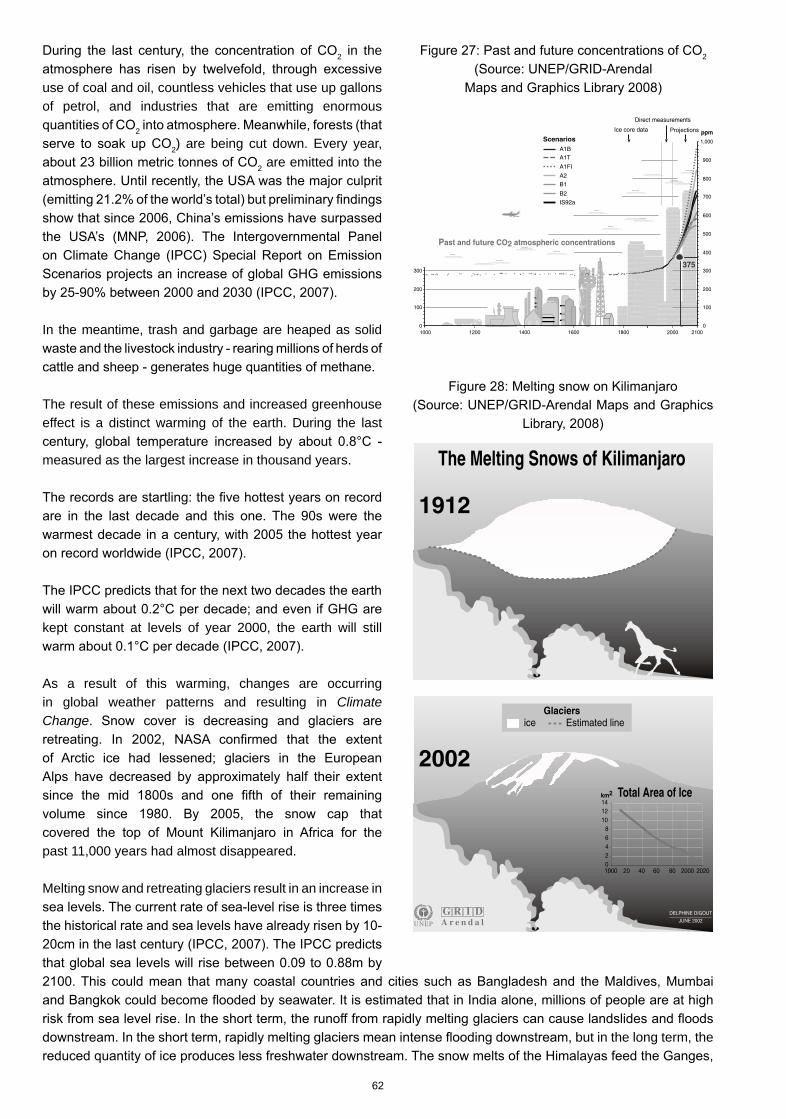
As a result of this warming, changes are occurring in global weather patterns and resulting in ClimateChange
past 11,000 years had almost disappeared.
Melting snow and retreating glaciers result in an increase in
2
2002
1912
The Melting Snows of Kilimanjaro
Total Area of Ice
1900 20 40 60 80 2000 202002468
101214km2
JUNE 2002
DELPHINE DIGOUT
UNEP
G R I DA r e n d a l
GlaciersEstimated lineice
but in the long term, the
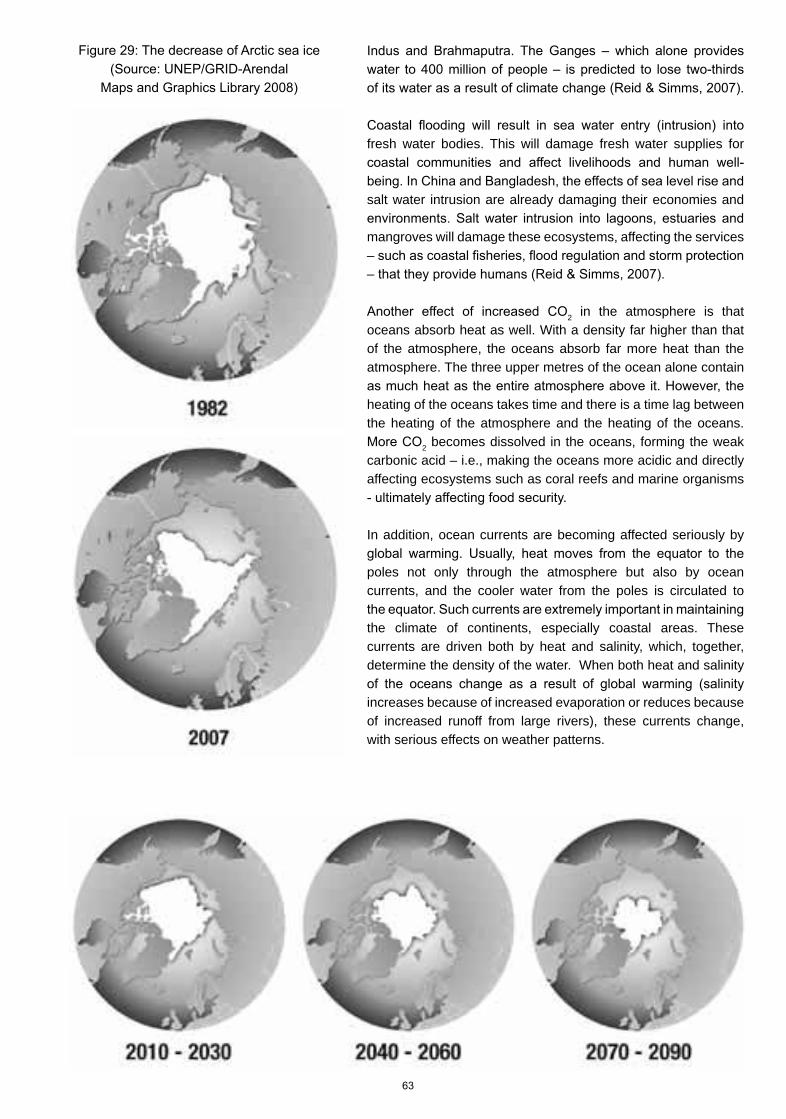
fresh water bodies. This will damage fresh water supplies for
salt water intrusion are already damaging their economies and
mangroves will damage these ecosystems, affecting the services
2 in the atmosphere is that oceans absorb heat as well. With a density far higher than that of the atmosphere, the oceans absorb far more heat than the atmosphere. The three upper metres of the ocean alone contain
heating of the oceans takes time and there is a time lag between the heating of the atmosphere and the heating of the oceans.
2 becomes dissolved in the oceans, forming the weak carbonic acid – i.e., making the oceans more acidic and directly affecting ecosystems such as coral reefs and marine organisms
In addition, ocean currents are becoming affected seriously by
poles not only through the atmosphere but also by ocean currents, and the cooler water from the poles is circulated to
the climate of continents, especially coastal areas. These currents are driven both by heat and salinity, which, together, determine the density of the water. When both heat and salinity
increases because of increased evaporation or reduces because of increased runoff from large rivers), these currents change, with serious effects on weather patterns.
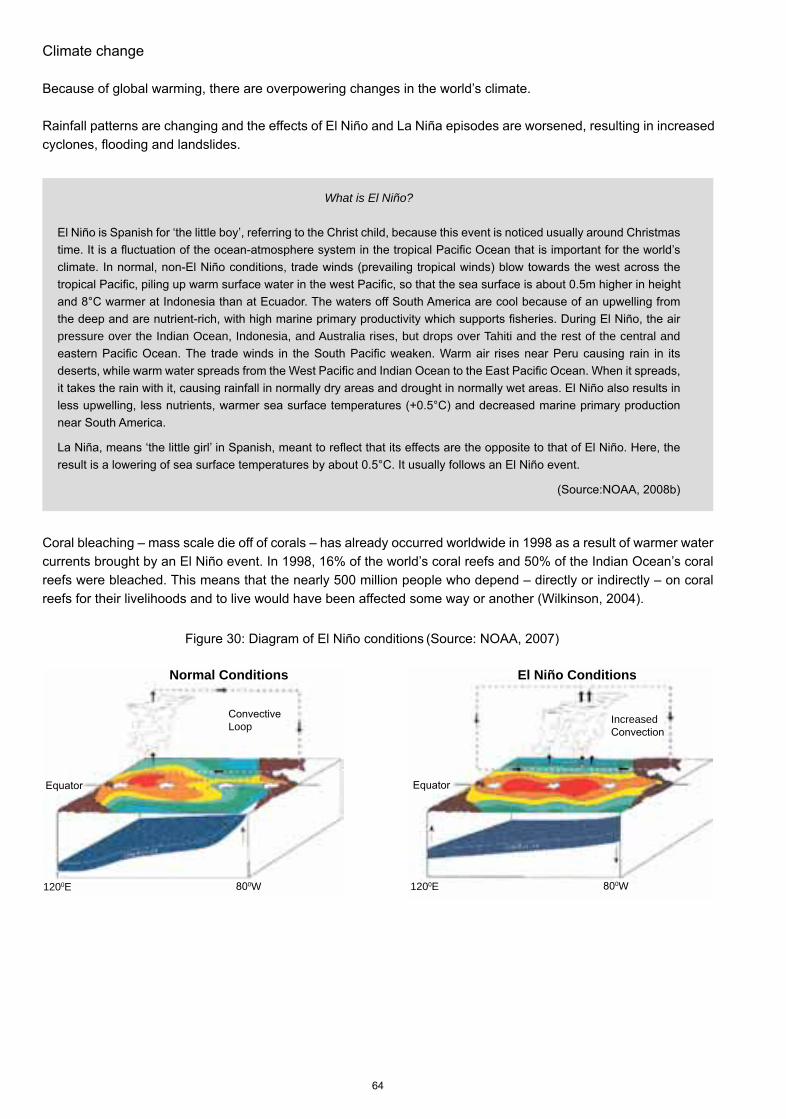
What is El Niño?
pressure over the Indian Ocean, Indonesia, and Australia rises, but drops over Tahiti and the rest of the central and
Normal Conditions El Niño Conditions
1200E 1200E0W 0W
LoopIncreased
Lakes and rivers are also warming, and while wet areas are often becoming wetter, dry areas are often becoming dryer. It is predicted that tropical areas will get hotter, that arid areas will become deserts, while temperate regions could become tropical. Dry areas becoming dryer leads to increased droughts and heat waves. These, in turn, lead
water security.
the natural balance of many ecosystems, with the result that the goods and services that they provide to humans will also be changed or reduced. This will undoubtedly have a serious impact on crops, which, in turn, will lead to food shortages and eventually famine.
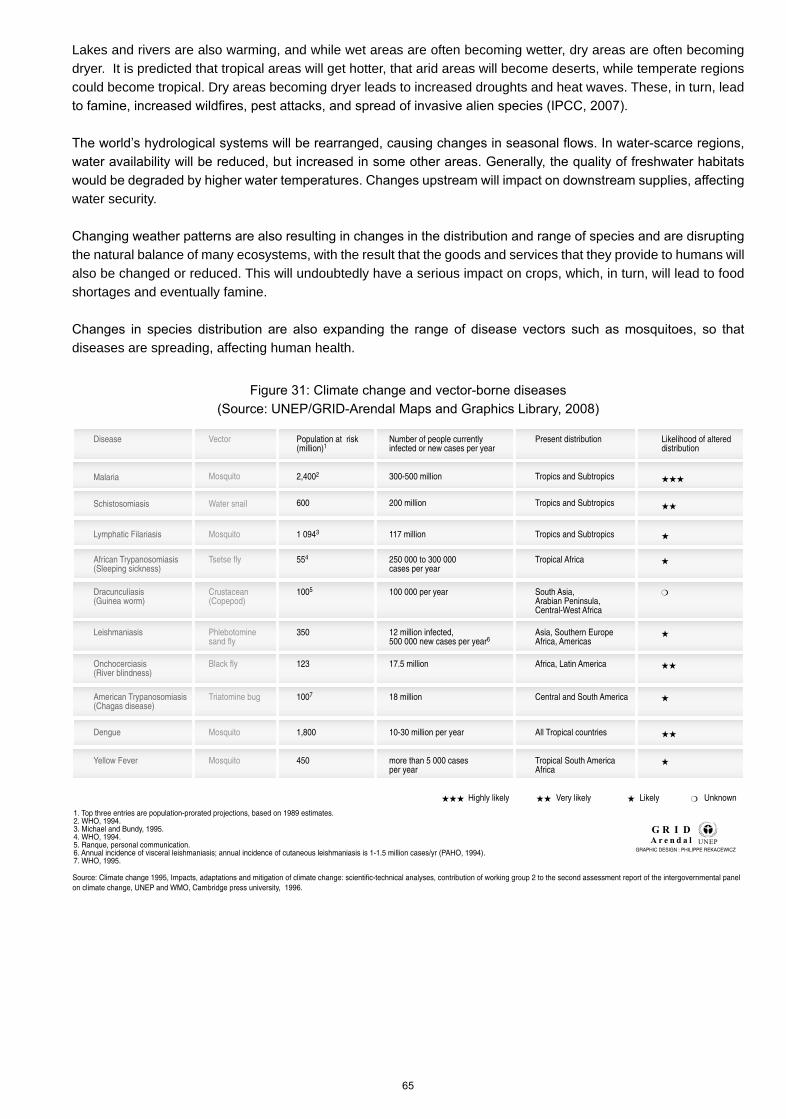
diseases are spreading, affecting human health.
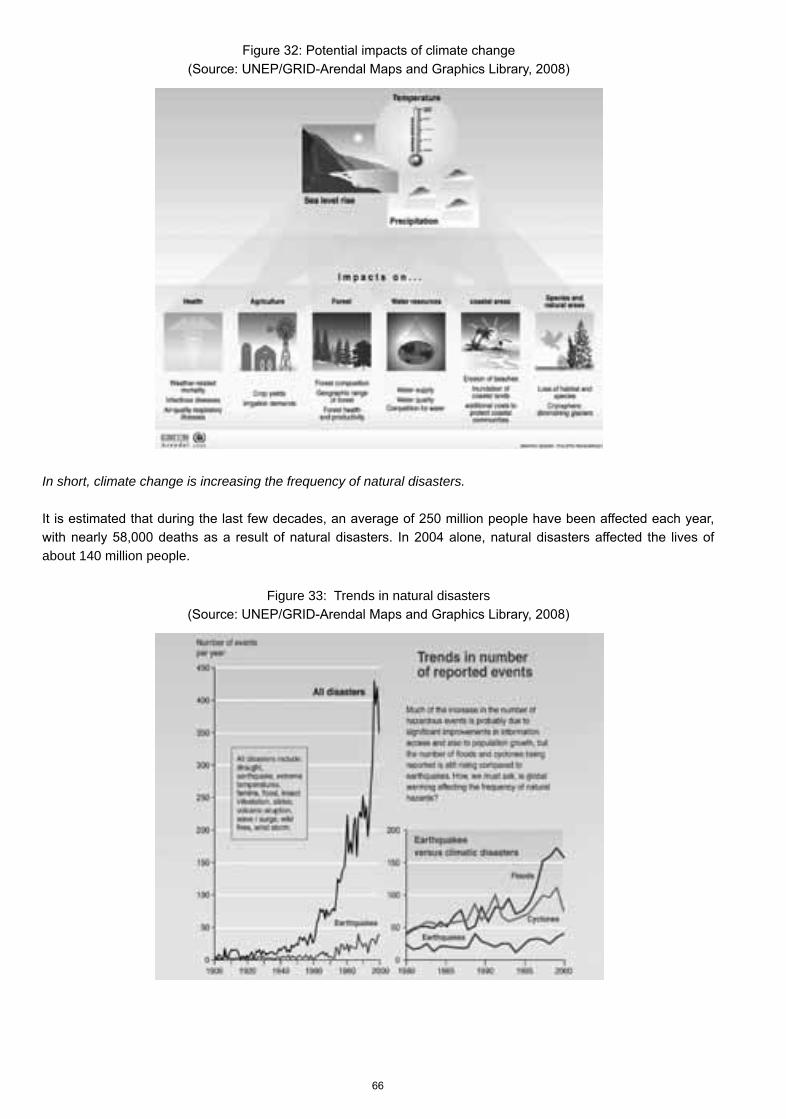
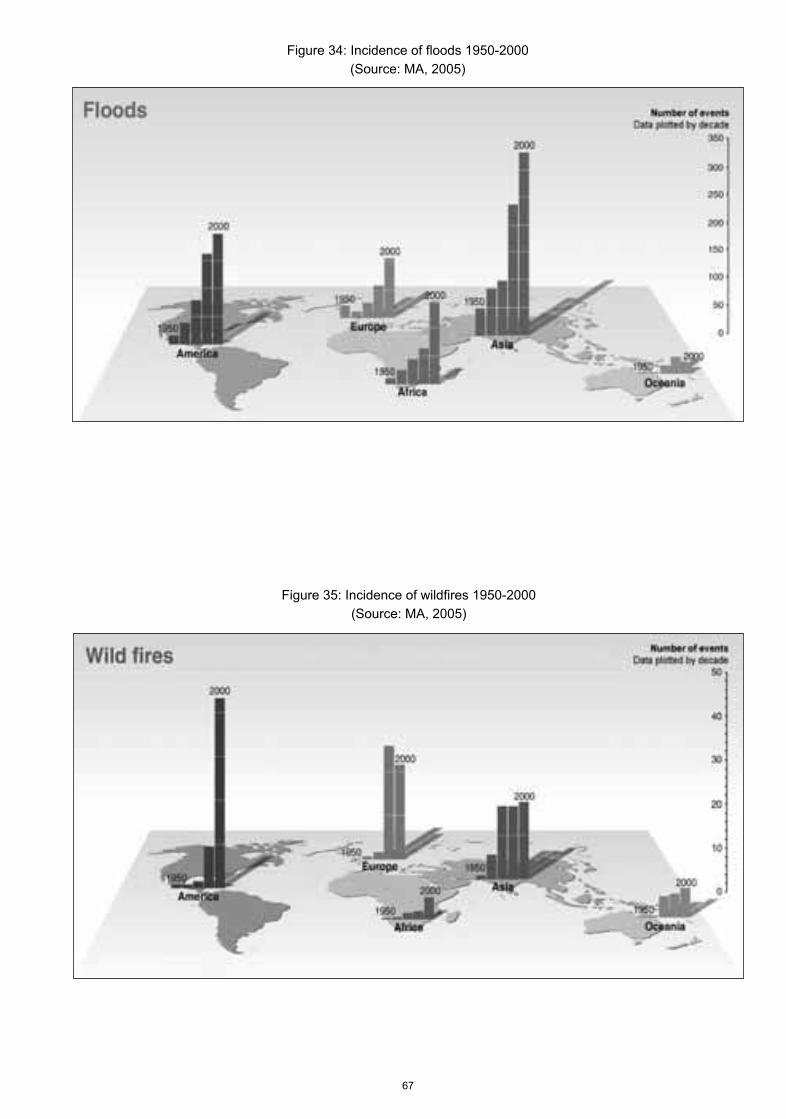
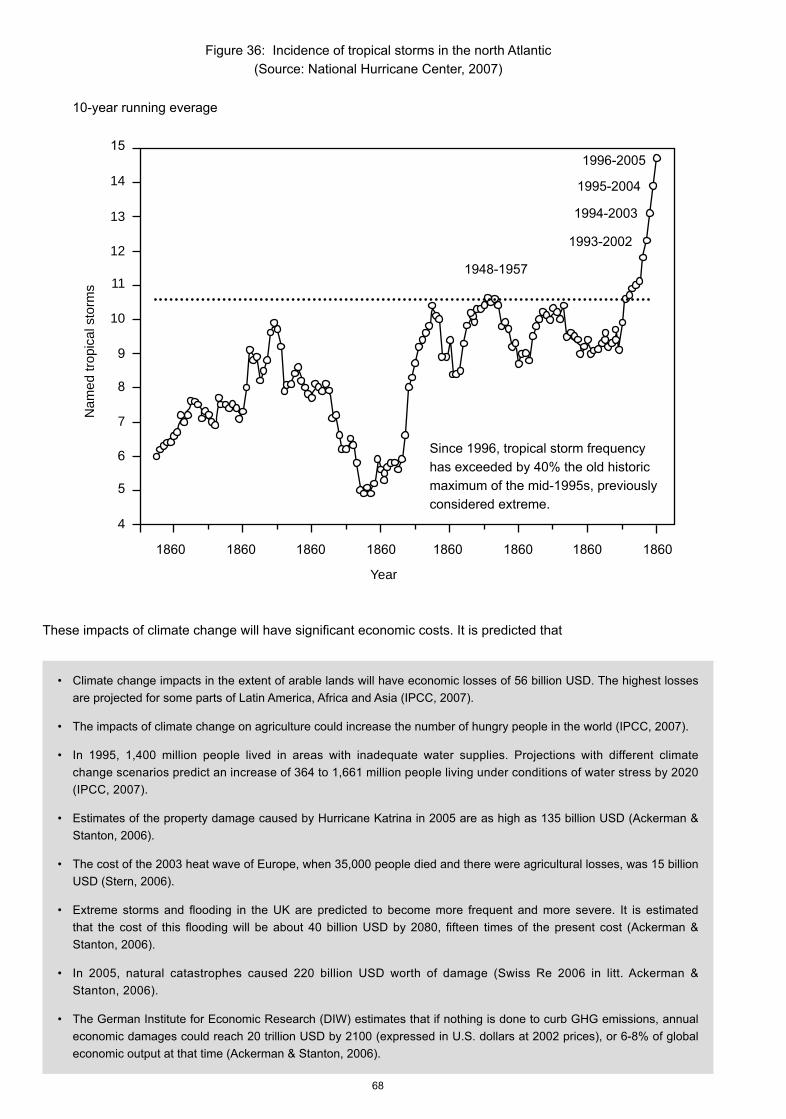
In short, climate change is increasing the frequency of natural disasters.
about 140 million people.
Figure 33: Trends in natural disasters
Nam
ed tr
opic
al s
torm
s
4
7
10
11
12
13
14
Year
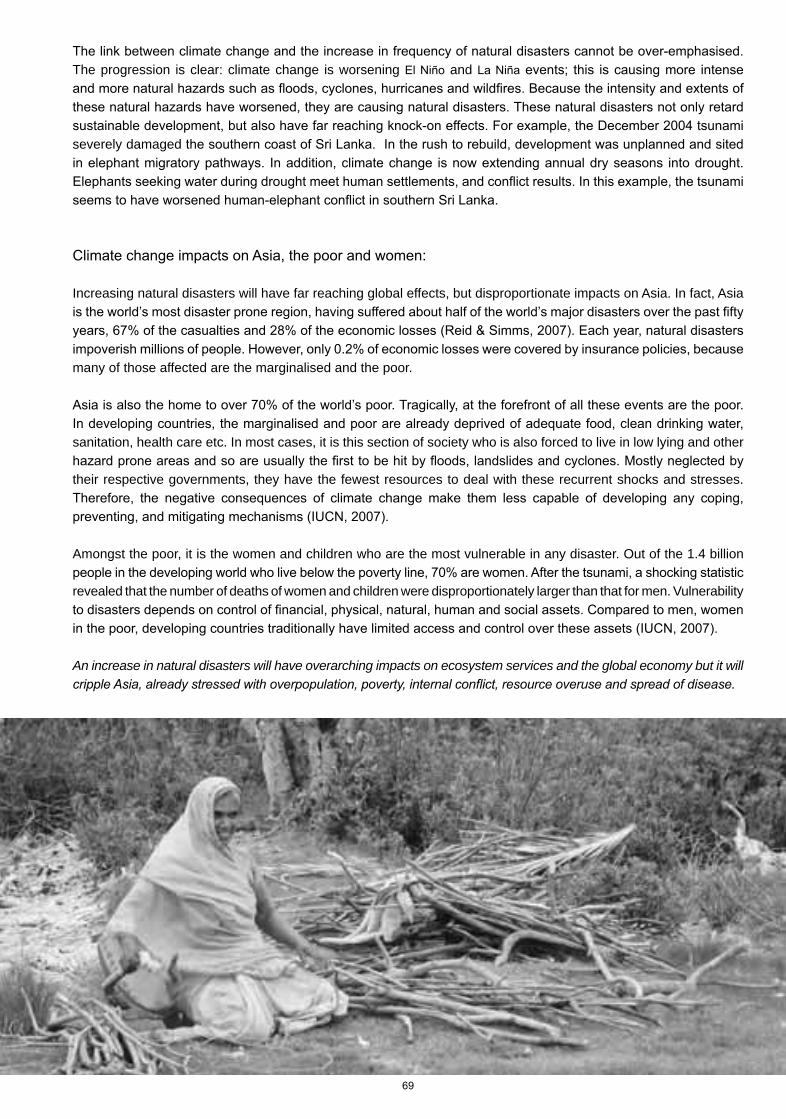
The progression is clear: climate change is worsening and
severely damaged
Increasing natural disasters will have far reaching global effects, but disproportionate impacts on Asia. In fact, Asia
many of those affected are the marginalised and the poor.
sanitation, health care etc. In most cases, it is this section of society who is also forced to live in low lying and other
their respective governments, they have the fewest resources to deal with these recurrent shocks and stresses.
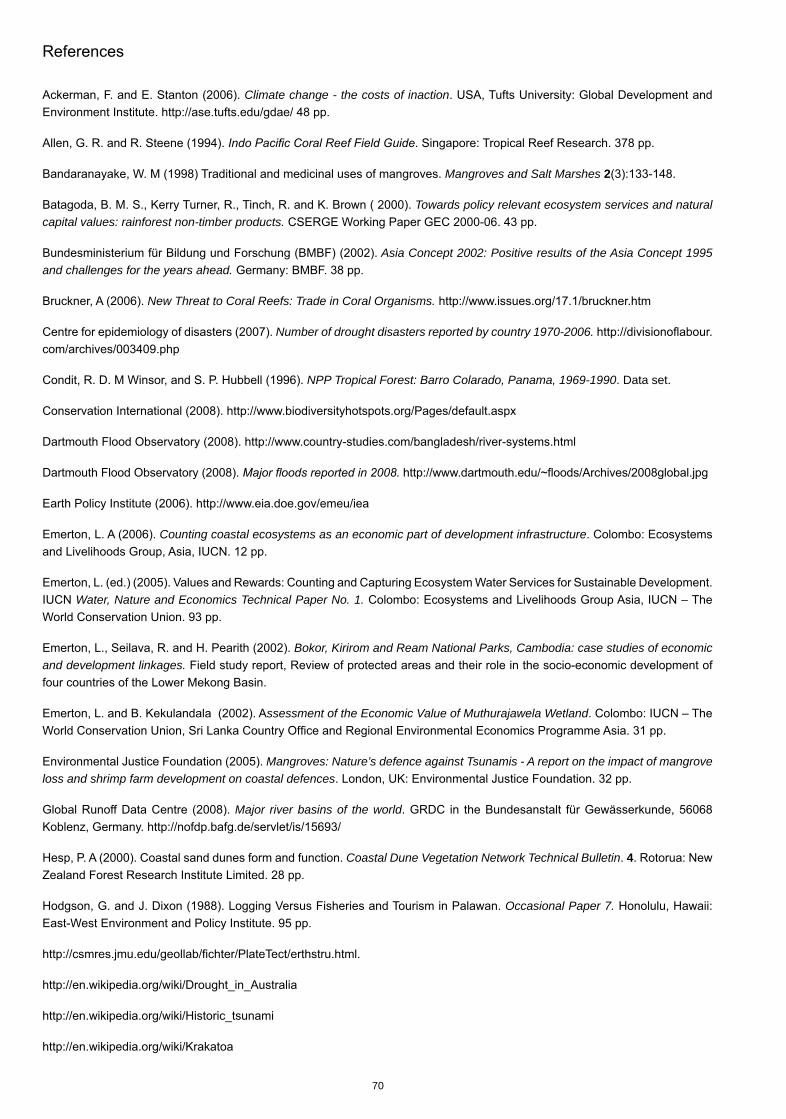
Amongst the poor, it is the women and children who are the most vulnerable in any disaster. Out of the 1.4 billion
revealed that the number of deaths of women and children were disproportionately larger than that for men. Vulnerability
An increase in natural disasters will have overarching impacts on ecosystem services and the global economy but it will
70
Climate change - the costs of inaction
Mangroves and Salt Marshes 2
Towards policy relevant ecosystem services and natural capital values: rainforest non-timber products.
Asia Concept 2002: Positive results of the Asia Concept 1995 and challenges for the years ahead.
New Threat to Coral Reefs: Trade in Coral Organisms.
Number of drought disasters reported by country 1970-2006.
NPP Tropical Forest: Barro Colarado, Panama, 1969-1990. Data set.
Counting coastal ecosystems as an economic part of development infrastructure
Water, Nature and Economics Technical Paper No. 1.
Bokor, Kirirom and Ream National Parks, Cambodia: case studies of economic and development linkages.
ssessment of the Economic Value of Muthurajawela Wetland
Mangroves: Nature’s defence against Tsunamis - A report on the impact of mangrove loss and shrimp farm development on coastal defences
Major river basins of the world
Coastal Dune Vegetation Network Technical Bulletin. 4
Occasional Paper 7.

71
Trends in oil spills from tanker ships 1995-2004.
Valuing Forests: A Review of Methods and Applications in Developing Countries. London: Environmental Economics
Working group III Summary for policymakers.
72
Tasman Spirit oil spill Karachi, Pakistan, Assessment report
Linking Coastal Ecosystems and Human Well-Being: Learning from conceptual frameworks and empirical results
The International workshop on vulnerability and global environmental change workshop summary. Stockholm Environmental Institute.
Advances in Marine Biology40:
Science 307:201.
Current Science 80
AnnualReview of Ecology, Evolution and Systematics 36
Ecosystems and Well-being Synthesis report.
Megadiversity: Earth’s Biologically Wealthiest Nation
Netherlands Environmental Assessment Agency: China now no. 1 in CO2 emissions; USA in second position
BioScience 56
Ecology of dunes, salt marsh and shingle
Smithsonian contributions to the Marine Sciences
Analysis of the Recreational Value of the Coral-surrounded Hon Mun Islands in Vietnam.
the environment
136
20(1): 17 – 41.
Trends in Ecology and Evolution 19
73
. Intercoast Network: Mangrove Edition. 1
World Atlas of Seagrasses
Natural hazard hotspots by risk type.
Climate change and vector-borne diseases.
Main greenhouse gases.
Melting snow on Kilimanjaro
Past and future CO2 concentrations.
Potential climate change impacts.
and climate projections
Trends in natural disasters
Tropical cyclone frequency
World poverty distribution
BioScience 51
Economic Valuation of Forests of Himachal Pradesh. International Institute for Environmental Development. 7 pp.
Corals of the World
The World Health Report 199
The World Health Report 2007
Status of Coral Reefs of the World
Earthtrends database.
The Economic Values of the World’s Wetlands
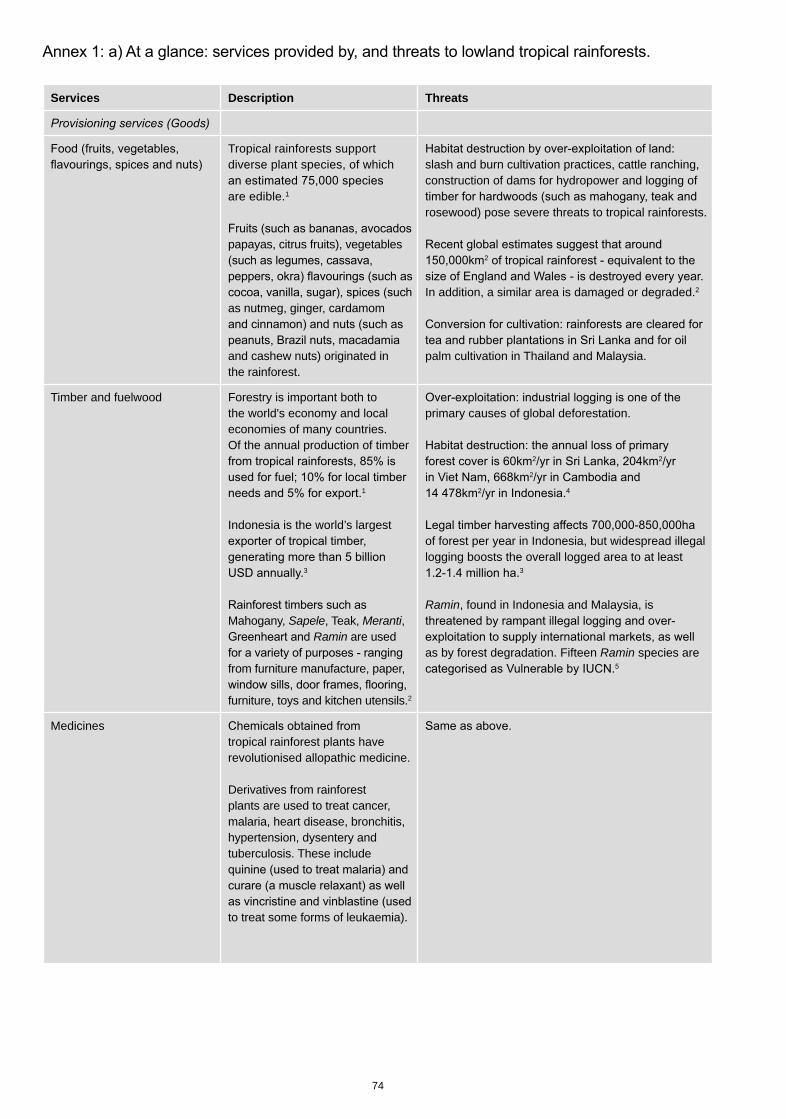
74
Services Description Threats
Tropical rainforests support diverse plant species, of which
are edible.1
papayas, citrus fruits), vegetables
as nutmeg, ginger, cardamom
and cashew nuts) originated in the rainforest.
slash and burn cultivation practices, cattle ranching, construction of dams for hydropower and logging of
rosewood) pose severe threats to tropical rainforests.
2
In addition, a similar area is damaged or degraded.2
palm cultivation in Thailand and Malaysia.
Timber and fuelwood Forestry is important both to the world's economy and local economies of many countries. Of the annual production of timber
1
Indonesia is the world’s largest
3
Mahogany, Sapele, Teak, Meranti,Ramin are used
from furniture manufacture, paper,
furniture, toys and kitchen utensils.2
primary causes of global deforestation.
2 2
2
2 4
of forest per year in Indonesia, but widespread illegal logging boosts the overall logged area to at least
3
Ramin, found in Indonesia and Malaysia, is
as by forest degradation. Fifteen Ramin species are
Medicinestropical rainforest plants have revolutionised allopathic medicine.
Derivatives from rainforest plants are used to treat cancer, malaria, heart disease, bronchitis, hypertension, dysentery and tuberculosis. These include
to treat some forms of leukaemia).
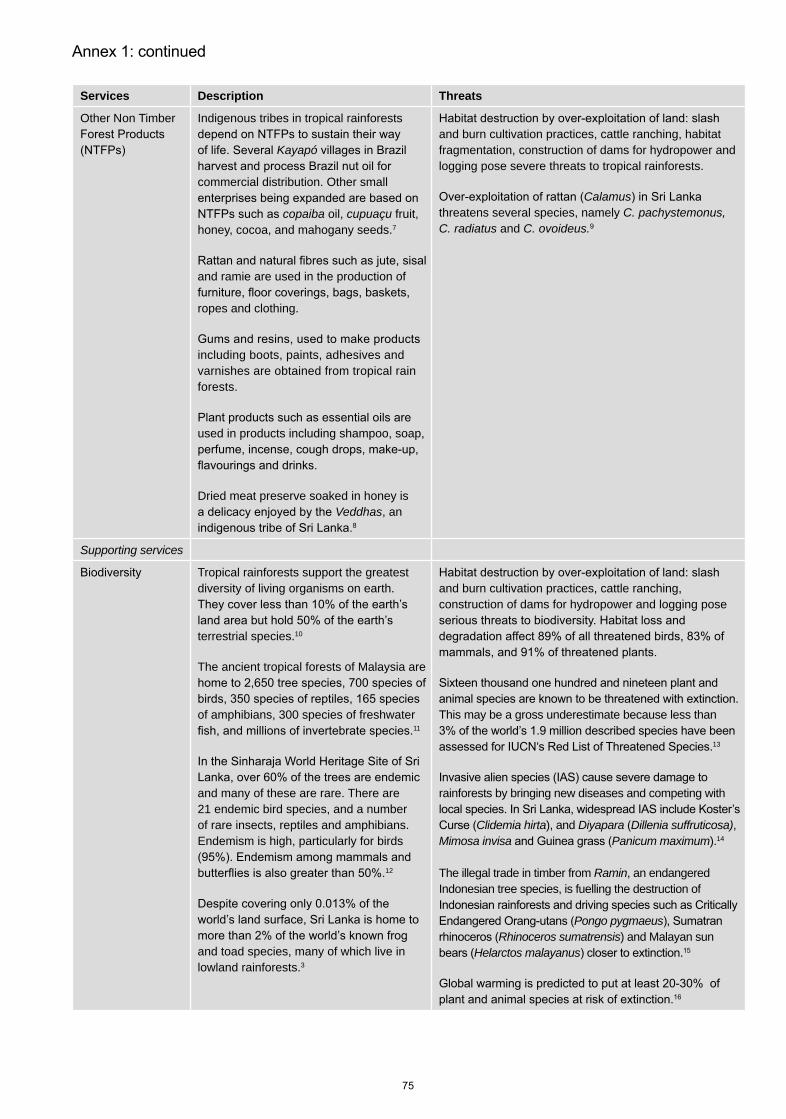
Services Description Threats
Other Non Timber Indigenous tribes in tropical rainforests
Kayapó
commercial distribution. Other small
copaiba oil, cupuaçu fruit,honey, cocoa, and mahogany seeds.7
and ramie are used in the production of
ropes and clothing.
including boots, paints, adhesives and varnishes are obtained from tropical rain forests.
used in products including shampoo, soap,
Dried meat preserve soaked in honey is Veddhas, an
and burn cultivation practices, cattle ranching, habitat fragmentation, construction of dams for hydropower and logging pose severe threats to tropical rainforests.
Calamusthreatens several species, namely C. pachystemonus, C. radiatus and C. ovoideus.
Supporting services
Tropical rainforests support the greatest diversity of living organisms on earth.
terrestrial species.10
The ancient tropical forests of Malaysia are
of amphibians, 300 species of freshwater 11
and many of these are rare. There are 21 endemic bird species, and a number of rare insects, reptiles and amphibians. Endemism is high, particularly for birds
12
and toad species, many of which live in lowland rainforests.3
and burn cultivation practices, cattle ranching, construction of dams for hydropower and logging pose
This may be a gross underestimate because less than
’ 13
rainforests by bringing new diseases and competing with
Clidemia hirta), and Diyapara Dillenia suffruticosa),Mimosa invisa Panicum maximum).14
The illegal trade in timber from Ramin, an endangered Indonesian tree species, is fuelling the destruction of
Pongo pygmaeusRhinoceros sumatrensis) and Malayan sun
Helarctos malayanus
Services Description Threats
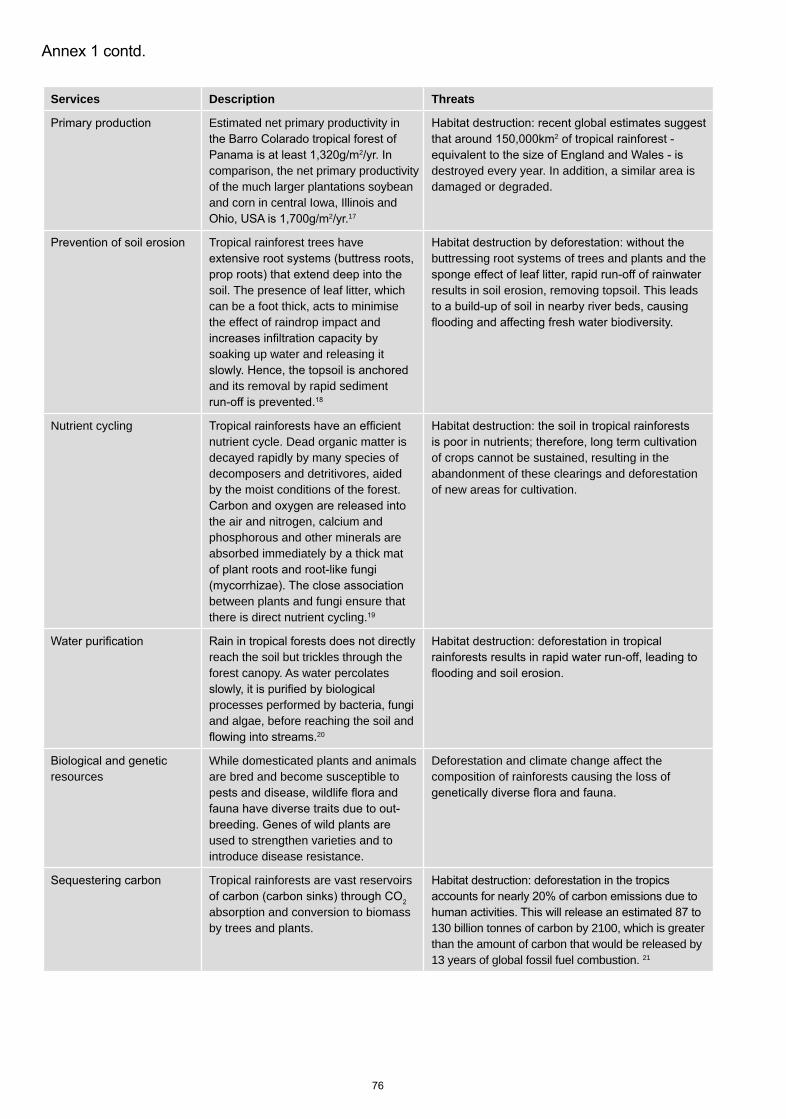
Estimated net primary productivity in
2
comparison, the net primary productivity of the much larger plantations soybean and corn in central Iowa, Illinois and
2 17
2
destroyed every year. In addition, a similar area is damaged or degraded.
Tropical rainforest trees have
soil. The presence of leaf litter, which can be a foot thick, acts to minimise the effect of raindrop impact and
soaking up water and releasing it
and its removal by rapid sediment
buttressing root systems of trees and plants and the
results in soil erosion, removing topsoil. This leads
Nutrient cyclingnutrient cycle. Dead organic matter is decayed rapidly by many species of decomposers and detritivores, aided by the moist conditions of the forest.
the air and nitrogen, calcium and phosphorous and other minerals are absorbed immediately by a thick mat
between plants and fungi ensure that there is direct nutrient cycling.
of crops cannot be sustained, resulting in the abandonment of these clearings and deforestation of new areas for cultivation.
reach the soil but trickles through the forest canopy. As water percolates
processes performed by bacteria, fungi and algae, before reaching the soil and
20
resourcesWhile domesticated plants and animals are bred and become susceptible to
used to strengthen varieties and to introduce disease resistance.
Deforestation and climate change affect the composition of rainforests causing the loss of
Tropical rainforests are vast reservoirs
2
absorption and conversion to biomass by trees and plants. 130 billion tonnes of carbon by 2100, which is greater
than the amount of carbon that would be released by 13 years of global fossil fuel combustion. 21

77
Services Description Threats
Regulating services
into the atmosphere results in the rise of surface temperatures, which alters
forests help stabilise the climate through
2 by trees and plants.
Functioning as water pumps, tropical rainforests add to local humidity through transpiration which releases
this vapour precipitates as rain over the rainforest but often, clouds are carried a great distance to precipitate as rain
Europe and Australia.
7
Flood regulationas epiphytes) act collectively as a giant
epiphytes and percolates slowly to
thick layer of leaf litter. This method
is trapped and released steadily, replenishing ground water and keeping
1
the soil surface and is lost rapidly from the area in
Cultural services
communitiesLowland tropical rainforests support many indigenous communities.
remarkable diversity of the rainforest
groups with 170 different languages.
Other tropical forest groups include the Mentawai people of Indonesia,22 the Bajau 23 and the Wanniyala-Aetto 24
There were an estimated ten million Indians living in
there are less than 200,000.
Deforestation and other factors such as the search for minerals and oil are forcing indigenous people into a steadily decreasing area. Many of the groups have to give up their original way of life, their culture and their religion, because of the destruction of rainforests.
Tourism Tropical rainforests are of great economic value in the tourism industry.
habitat degradation. Intentional removal or addition
Ecosystems and Well-being Synthesis report.
17
Assessment Report of the Intergovernmental Panel on Climate Change
NPP Tropical Forest: Barro Colarado, Panama, 1969-1990. Data set
136
montane forests
Services Description Threats
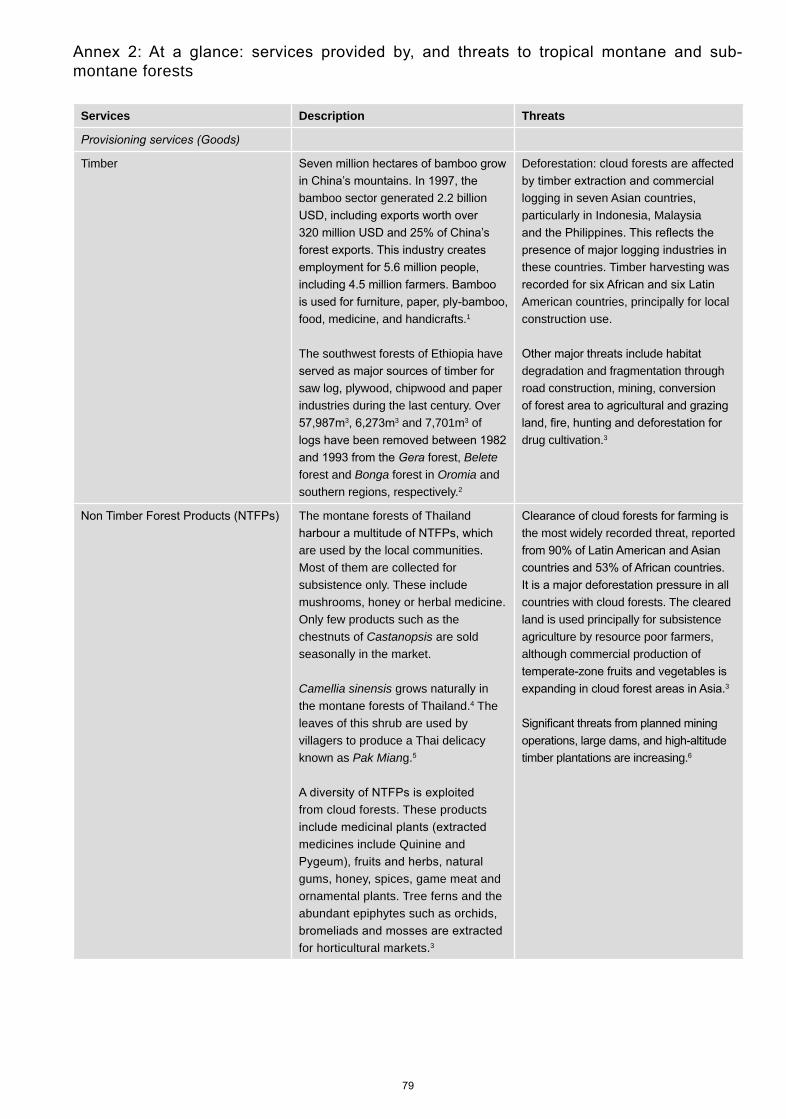
Timber
bamboo sector generated 2.2 billion
food, medicine, and handicrafts.1
The southwest forests of Ethiopia have
saw log, plywood, chipwood and paper industries during the last century. Over
3 3 and 7,701m3 of
forest, Belete forest and Bonga forest in Oromia and southern regions, respectively.2
Deforestation: cloud forests are affected
logging in seven Asian countries, particularly in Indonesia, Malaysia
these countries. Timber harvesting was
American countries, principally for local construction use.
degradation and fragmentation through road construction, mining, conversion
drug cultivation.3
The montane forests of Thailand
are used by the local communities. Most of them are collected for subsistence only. These include mushrooms, honey or herbal medicine. Only few products such as the chestnuts of Castanopsis are sold seasonally in the market.
Camellia sinensis grows naturally in the montane forests of Thailand.4 The leaves of this shrub are used by villagers to produce a Thai delicacy known as Pak Miang.
from cloud forests. These products
medicines include Quinine and
gums, honey, spices, game meat and ornamental plants. Tree ferns and the abundant epiphytes such as orchids,
for horticultural markets.3
the most widely recorded threat, reported
countries with cloud forests. The cleared land is used principally for subsistence agriculture by resource poor farmers, although commercial production of
3
timber plantations are increasing.
Services Description Threats
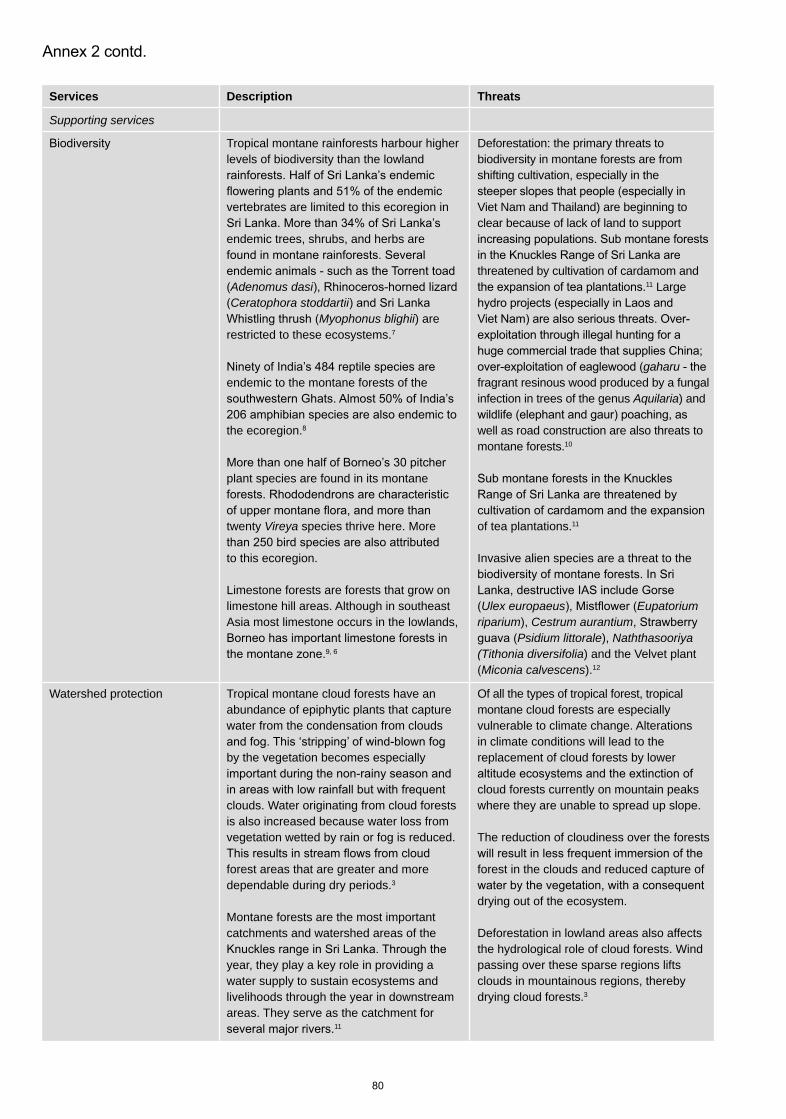
Supporting services
Tropical montane rainforests harbour higher levels of biodiversity than the lowland
vertebrates are limited to this ecoregion in
endemic trees, shrubs, and herbs are
Adenomus dasiCeratophora stoddartii
Myophonus blighii) are restricted to these ecosystems.7
endemic to the montane forests of the
the ecoregion.
plant species are found in its montane
twenty Vireya species thrive here. More
to this ecoregion.
Limestone forests are forests that grow on limestone hill areas. Although in southeast Asia most limestone occurs in the lowlands,
Deforestation: the primary threats to biodiversity in montane forests are from shifting cultivation, especially in the
Viet Nam and Thailand) are beginning to clear because of lack of land to support
threatened by cultivation of cardamom and 11 Large
gaharufragrant resinous wood produced by a fungal infection in trees of the genus Aquilaria) and
well as road construction are also threats to montane forests.10
of tea plantations.11
Invasive alien species are a threat to the
Ulex europaeus Eupatoriumriparium), Cestrum aurantium
Psidium littorale), Naththasooriya(Tithonia diversifolia) and the Velvet plant Miconia calvescens).12
Watershed protection Tropical montane cloud forests have an abundance of epiphytic plants that capture water from the condensation from clouds
by the vegetation becomes especially
clouds. Water originating from cloud forests is also increased because water loss from vegetation wetted by rain or fog is reduced.
forest areas that are greater and more dependable during dry periods.3
Montane forests are the most important catchments and watershed areas of the
year, they play a key role in providing a water supply to sustain ecosystems and livelihoods through the year in downstream areas. They serve as the catchment for
11
Of all the types of tropical forest, tropical montane cloud forests are especially vulnerable to climate change. Alterations in climate conditions will lead to the replacement of cloud forests by lower
cloud forests currently on mountain peaks where they are unable to spread up slope.
The reduction of cloudiness over the forests
forest in the clouds and reduced capture of
drying out of the ecosystem.
Deforestation in lowland areas also affects the hydrological role of cloud forests. Wind passing over these sparse regions lifts clouds in mountainous regions, thereby drying cloud forests.3
Services Description Threats
Supporting services contd.
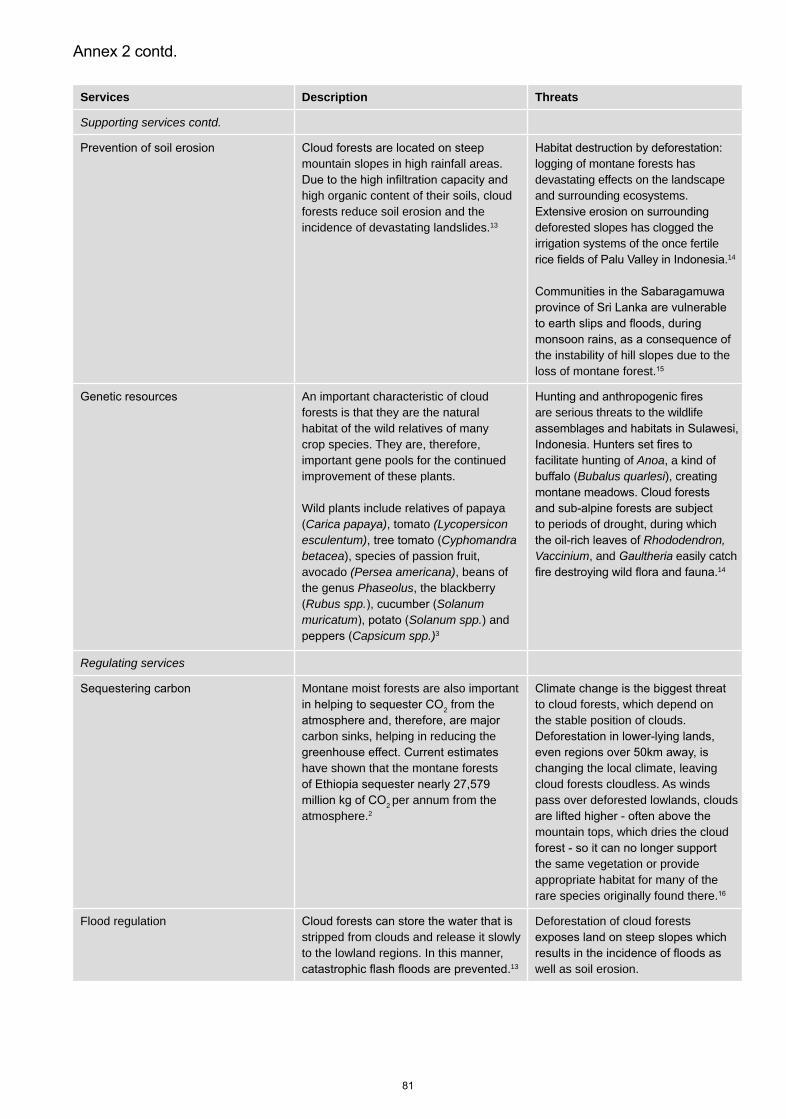
mountain slopes in high rainfall areas.
high organic content of their soils, cloud forests reduce soil erosion and the incidence of devastating landslides.13
logging of montane forests has devastating effects on the landscape and surrounding ecosystems.
deforested slopes has clogged the irrigation systems of the once fertile
14
the instability of hill slopes due to the loss of montane forest.
An important characteristic of cloud forests is that they are the natural habitat of the wild relatives of many crop species. They are, therefore, important gene pools for the continued improvement of these plants.
Wild plants include relatives of papaya Carica papaya), tomato (Lycopersicon
esculentum) Cyphomandrabetacea), species of passion fruit, avocado (Persea americana), beans of the genus Phaseolus, the blackberry Rubus spp. Solanum
muricatum Solanum spp.) and Capsicum spp.)3
are serious threats to the wildlife
facilitate hunting of Anoa, a kind of Bubalus quarlesi), creating
to periods of drought, during which Rhododendron,
Vaccinium, and easily catch 14
Regulating services
Montane moist forests are also important
2 from the
carbon sinks, helping in reducing the
have shown that the montane forests
2 per annum from the atmosphere.2
to cloud forests, which depend on the stable position of clouds.
changing the local climate, leaving cloud forests cloudless. As winds pass over deforested lowlands, clouds
mountain tops, which dries the cloud
the same vegetation or provide appropriate habitat for many of the rare species originally found there.
Flood regulationstripped from clouds and release it slowly to the lowland regions. In this manner,
13
Deforestation of cloud forests
well as soil erosion.
Services Description Threats
Cultural services
Tourist attractions Tourists are attracted by the beauty of the mountain environment as well as rare species characteristic of montane rainforests.
potential include the Monteverde cloud
3
affect cloud forests through trail making and littering. Tourists also remove souvenirs from the forest. The building of attractions such as golf courses results in the destruction of cloud forests.13
Cloud Forest AgendaBulletin
of the School of Oriental and African Studies, University of London 35
,
Services Description Threats
Timber and fuelwoodof monsoon forests. The principal plant species in the monsoon forests of
Shorea robusta, known commonly as Sal, hence these areas are also known as Sal forests. Sal is one of the most important timber yielding plant species and is used for railway sleepers, piles, beams and other load bearing parts of bridge structures, telephone poles, wheels and bodies of carts and other similar load carriers, motor trucks and structures of houses.1
Tectona grandis) is found commonly as a species in monsoon forests in India
used to make furniture, boat decks, indoor 2
3 of wood is obtained annually from the tropical dry
3
Fuelwood is the only source of cooking fuel in households of the Uttara Kannada
average, each household collects about
the form of fallen twigs or dry branches from the moist deciduous, dry evergreen and dry deciduous forests that are characteristic of the area.4
Sal forests are the most threatened due to the high demand of timber, easy access and geographic location. Sal forests undergo rapid
leaf litter collection, encroachment and unsustainable collection of economically
of forest under encroachment is
with an estimated 100,000 encroachers threatening the area.1
Teak is not considered a rare species in countries such as Thailand and India, but
lead to forest degradation. Illegal felling
border is of international concern.
Chloroxylon swietenia) and Diospyros ebenum) are now rare
household ornaments and utensils, fodder and for medicinal purposes.
by medical practitioners for ailments. Fruits from Shorea robusta are used to treat diarrhoeal diseases and the stem sap can be used to treat skin diseases.
is used for the treatment of snake bites and
with medicinal properties are used to treat both humans and livestock.
collect grass for use as fodder. The
pasture conversion, which results in
constructed for hydropower.
of fuelwood by indigenous people,
poaching of animals for the wildlife trade).
Invasive alien species are spreading in disturbed forest areas.7
Services Description Threats
In the Uttara Kannada district, mushrooms, Emblica
Karanda Carissacarandas)
commercially. Other valuable food sources include wild mangoes, lime, chilli peppers,
and Ebony Diospyros melanoxylon).
Anogeissus latifolia Acacia sinuata) is used to make shampoos.
(Phoenix sylvestris) are used to produce baskets, rooms,
4
pasture conversion, which results in
constructed for hydropower.
of fuelwood by indigenous people,
poaching of animals for the wildlife trade).
Invasive alien species are spreading in disturbed forest areas.7
Supporting services
are endemic to the island. Two mammal species Neohylomys hainanensis)
Hylopetes electilis)
Hylobates concolor), the Selenarctos thibetanus), and
Talpa insularis).
are home to one of Asia’s largest mammals Elephas maximus), whose
Panthera pardusMelursus ursinus).
India support the only surviving population of Panthera leo persica).10
centre of endemism in Madagascar and have high biological importance. Endemic mammal
Propithecus tattersalli),Eulemur mongoz), Western
Nesomys lambertoni)Microcebus ravelobensis),
M. tavaratra),M. myoxinus),
Propithecus diadema perrieri),Lepilemur
edwardsi) and a species of forest mouse, Macrotarsomys ingens. The dry deciduous forests are one of the primary habitats for the island’s largest predator, the Fossa Cryptoprocta ferox).11
threat from conversion to plantations
in decreasing prey for tigers that turn to
the local people against these predations has affected the tiger population.12
deforestation caused by agriculture,
and encroachment into protected areas.
threatened, including Asian elephants,
Semnopithecus vetulus
Loris tardigradus).13
depleted wildlife biodiversity in the southeastern Indochinese dry evergreen
Rhinoceros sondaicus), one of two populations of this species on earth.14
Invasive alien species are rampant
Bubalus bubalis)is a common invasive animal in forest
Lantana camaraChromolaena odorata), Leucaena
leucocephalaMikania micrantha).
Services Description Threats
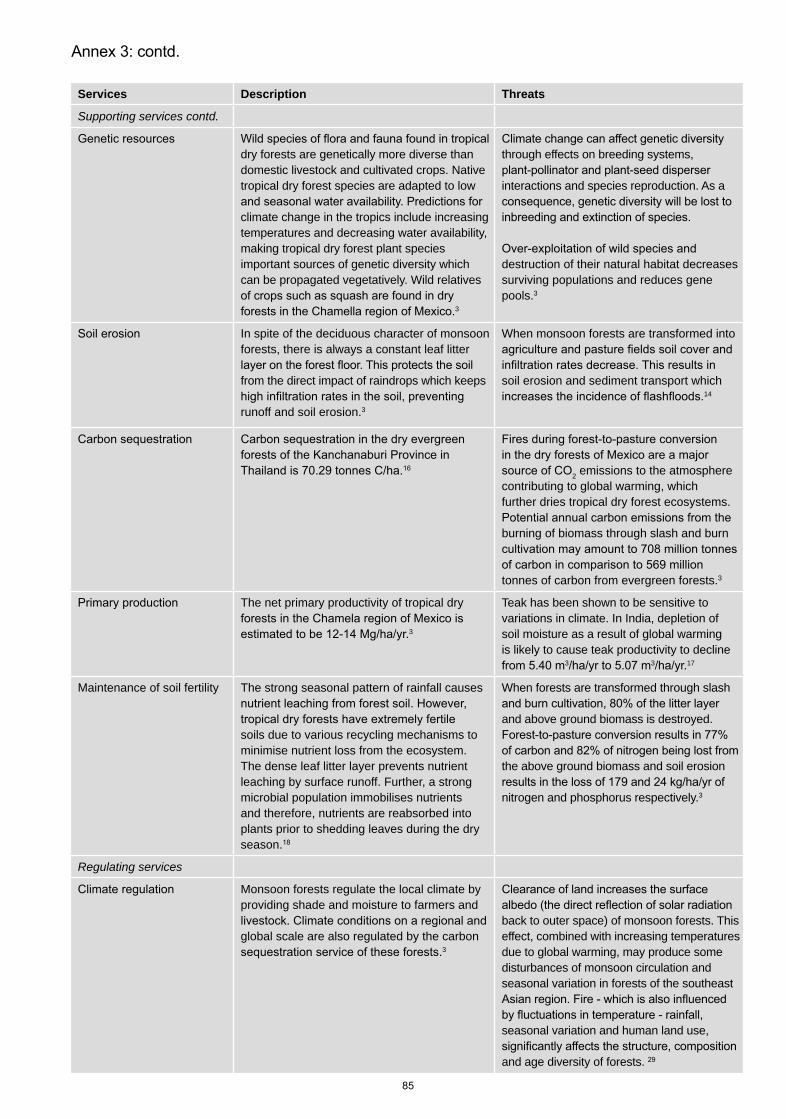
Supporting services contd.
dry forests are genetically more diverse than domestic livestock and cultivated crops. Native tropical dry forest species are adapted to low
climate change in the tropics include increasing temperatures and decreasing water availability, making tropical dry forest plant species important sources of genetic diversity which can be propagated vegetatively. Wild relatives
3
through effects on breeding systems,
interactions and species reproduction. As a
destruction of their natural habitat decreases surviving populations and reduces gene pools.3
In spite of the deciduous character of monsoon forests, there is always a constant leaf litter
from the direct impact of raindrops which keeps
runoff and soil erosion.3
When monsoon forests are transformed into
soil erosion and sediment transport which 14
2 emissions to the atmosphere contributing to global warming, which further dries tropical dry forest ecosystems.
burning of biomass through slash and burn
tonnes of carbon from evergreen forests.3
The net primary productivity of tropical dry
3
Teak has been shown to be sensitive to variations in climate. In India, depletion of soil moisture as a result of global warming is likely to cause teak productivity to decline
3 3 17
Maintenance of soil fertility The strong seasonal pattern of rainfall causes
soils due to various recycling mechanisms to minimise nutrient loss from the ecosystem. The dense leaf litter layer prevents nutrient leaching by surface runoff. Further, a strong microbial population immobilises nutrients and therefore, nutrients are reabsorbed into plants prior to shedding leaves during the dry season.
When forests are transformed through slash
and above ground biomass is destroyed.
the above ground biomass and soil erosion
nitrogen and phosphorus respectively.3
Regulating services
Monsoon forests regulate the local climate by providing shade and moisture to farmers and
global scale are also regulated by the carbon 3
back to outer space) of monsoon forests. This effect, combined with increasing temperatures due to global warming, may produce some disturbances of monsoon circulation and seasonal variation in forests of the southeast
seasonal variation and human land use,
and age diversity of forests.
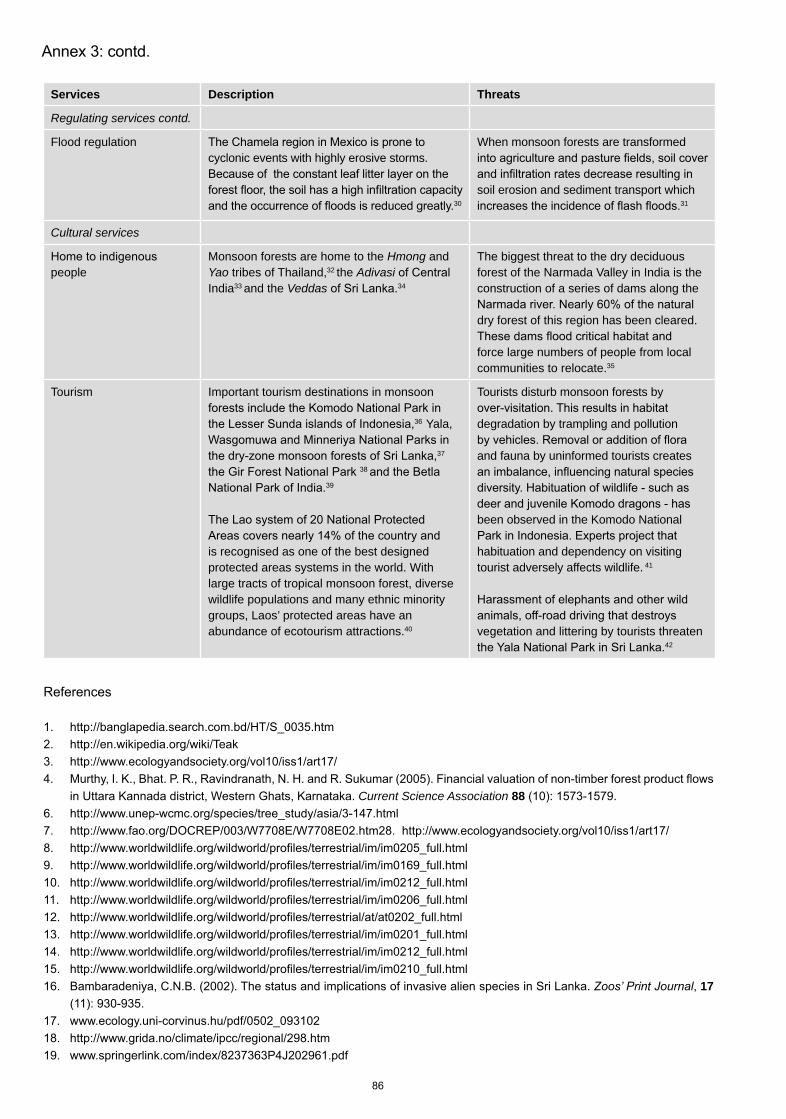
Services Description Threats
Regulating services contd.
Flood regulationcyclonic events with highly erosive storms.
30
When monsoon forests are transformed
soil erosion and sediment transport which 31
Cultural services
peopleMonsoon forests are home to the Hmong andYao tribes of Thailand,32 the AdivasiIndia33 and the Veddas 34
The biggest threat to the dry deciduous forest of the Narmada Valley in India is the construction of a series of dams along the
dry forest of this region has been cleared.
force large numbers of people from local communities to relocate.
Tourism Important tourism destinations in monsoon
Yala,
37
is recognised as one of the best designed protected areas systems in the world. With large tracts of tropical monsoon forest, diverse wildlife populations and many ethnic minority groups, Laos’ protected areas have an abundance of ecotourism attractions.40
Tourists disturb monsoon forests by
degradation by trampling and pollution
and fauna by uninformed tourists creates
been observed in the Komodo National
habituation and dependency on visiting tourist adversely affects wildlife. 41
vegetation and littering by tourists threaten 42
Current Science Association 88
, 17
Services Description Threats
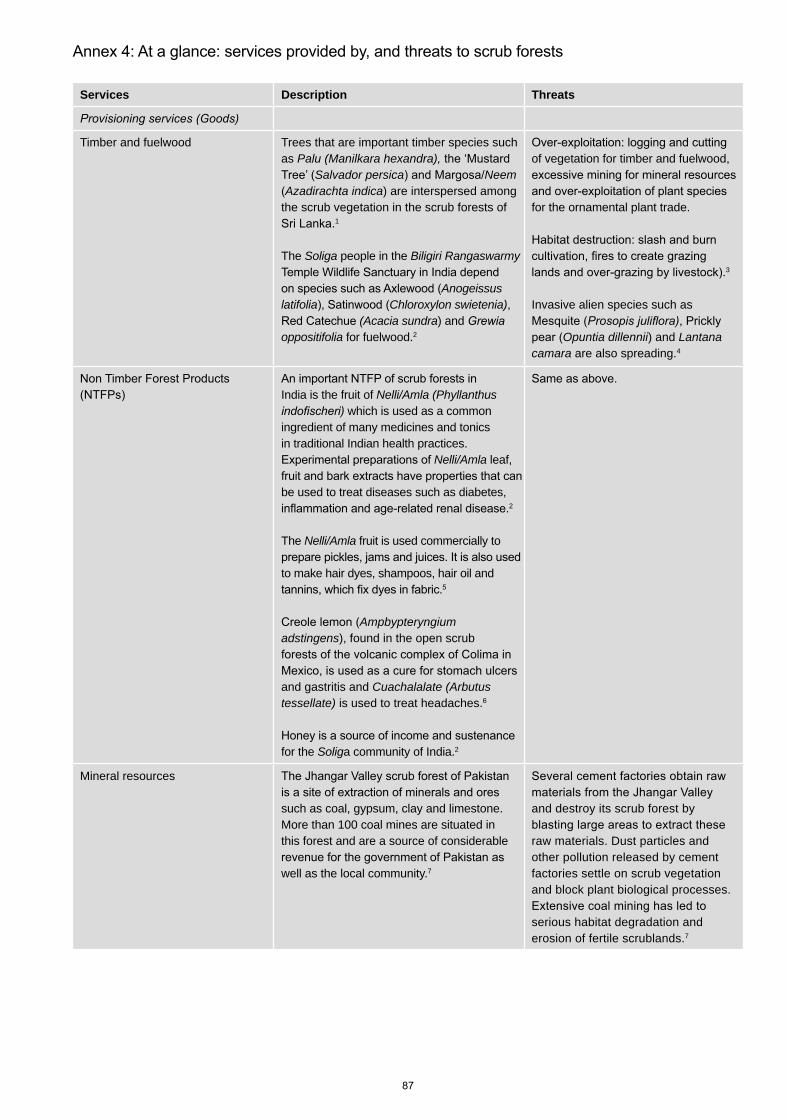
Timber and fuelwood Trees that are important timber species such as Palu (Manilkara hexandra),
Salvador persica NeemAzadirachta indica) are interspersed among
the scrub vegetation in the scrub forests of 1
The Soliga people in the Biligiri Rangaswarmy
Anogeissus latifolia Chloroxylon swietenia),
(Acacia sundra) and oppositifolia for fuelwood.2
of vegetation for timber and fuelwood,
for the ornamental plant trade.
3
Invasive alien species such as
Opuntia dillennii) and Lantanacamara are also spreading.4
India is the fruit of Nelli/Amla (Phyllanthus which is used as a common
ingredient of many medicines and tonics in traditional Indian health practices.
Nelli/Amla leaf,
be used to treat diseases such as diabetes, 2
The Nelli/Amla fruit is used commercially to
to make hair dyes, shampoos, hair oil and
Ampbypteryngiumadstingens), found in the open scrub
and gastritis and Cuachalalate (Arbutus tessellate) is used to treat headaches.
for the Soliga community of India.2
Mineral resources
such as coal, gypsum, clay and limestone. More than 100 coal mines are situated in this forest and are a source of considerable
well as the local community.7
and destroy its scrub forest by
raw materials. Dust particles and other pollution released by cement factories settle on scrub vegetation and block plant biological processes.
serious habitat degradation and erosion of fertile scrublands.7
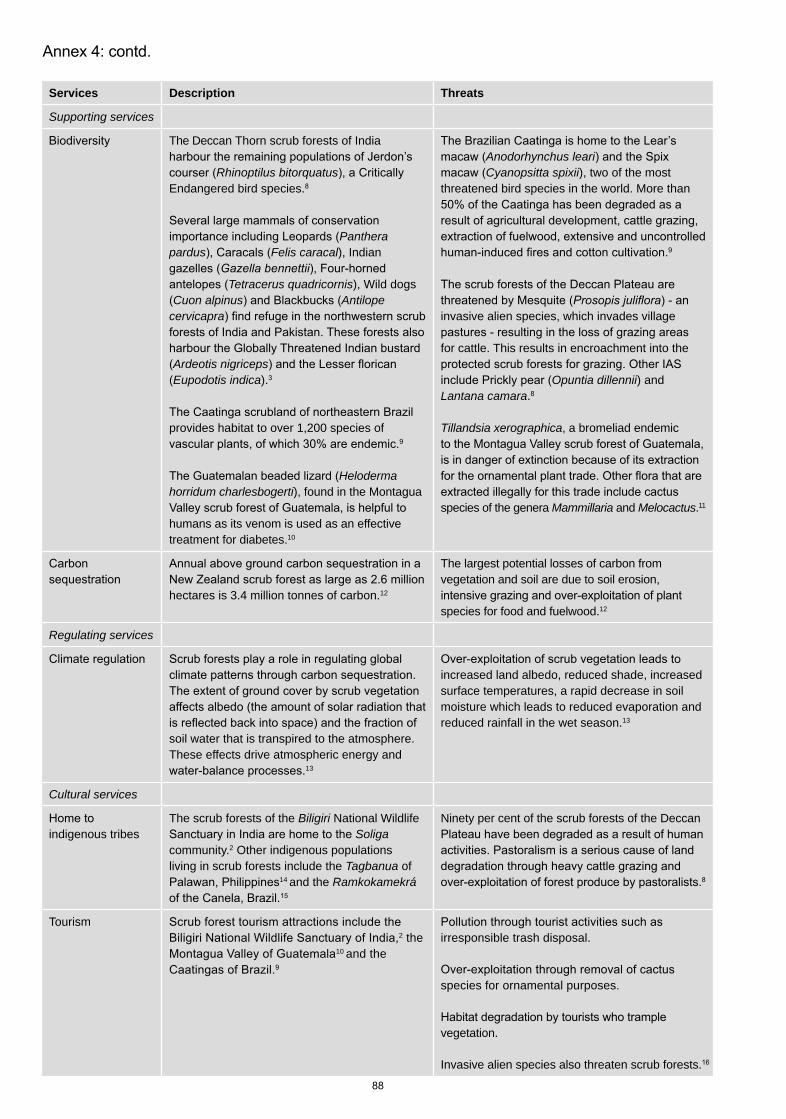
Services Description Threats
Supporting services
The Deccan Thorn scrub forests of India
Rhinoptilus bitorquatusEndangered bird species.
Pantherapardus Felis caracal), Indian
Tetracerus quadricornis), Wild dogs Cuon alpinus Antilope
cervicapra
Ardeotis nigricepsEupodotis indica).3
provides habitat to over 1,200 species of
Heloderma horridum charlesbogerti), found in the Montagua
humans as its venom is used as an effective treatment for diabetes.10
Anodorhynchus leariCyanopsitta spixii), two of the most
threatened bird species in the world. More than
invasive alien species, which invades village
for cattle. This results in encroachment into the
Opuntia dillennii) and Lantana camara.
Tillandsia xerographica, a bromeliad endemic
species of the genera Mammillaria and Melocactus.11
hectares is 3.4 million tonnes of carbon.12
The largest potential losses of carbon from vegetation and soil are due to soil erosion,
species for food and fuelwood.12
Regulating services
soil water that is transpired to the atmosphere. These effects drive atmospheric energy and
13
increased land albedo, reduced shade, increased surface temperatures, a rapid decrease in soil moisture which leads to reduced evaporation and reduced rainfall in the wet season.13
Cultural services
indigenous tribesThe scrub forests of the Biligiri National Wildlife
Soligacommunity.2 Other indigenous populations living in scrub forests include the Tagbanua of
14 and the Ramkokamekrá
Ninety per cent of the scrub forests of the Deccan
Tourism2 the
10 and the irresponsible trash disposal.
species for ornamental purposes.
vegetation.
Invasive alien species also threaten scrub forests.
2.
Forest. Economic Botany 52
17
AmlaIndia. Conservation & Society, 2
Services Description Threats
Timberare easy to fell, handle and saw into planks. The wood is used as building and packaging timber and in the making of chipboard and hard board.1
cattle, logging of forests to clear land for agricultural purposes and to build highways and roads.
their ornamental value).2
Eupatorium adenophorum) and Cryptomeria japonica)
are spreading.3
Non timber forest products
derived from their foliage, bark, roots, seeds, resins and cones.
the world’s paper industry and is the raw material for cellophane, viscose and wood
1
The wood, foliage and resin of conifers yield essential oils, which are important ingredients in perfumes, shampoos, disinfectants and cleaning products.
Cedrusdeodara in India has reduced the necessity
are used as a source of dye.
ingredient in gourmet dishes in Asian cuisine,
var. depressa) are a key ingredient of gin.
Edible mushrooms harvested from coniferous forests are an important source of income.
Tricholoma matsutake), which grows in coniferous forests of in
4
the weakening of coniferous trees which become prone to disease and die.
cattle, logging of forests to clear land for agricultural purposes and to build highways and roads.
their ornamental value.
Invasive alien species are also spreading.2
Mineral resources
mineral wealth. Its mineral resources include
minerals such as sand, gravel and sulphur are abundant in this region.
and results in severe habitat destruction.7
Services Description Threats
Supporting services
Although they are not as rich in biodiversity as lowland tropical rainforests, tropical coniferous forests
Cervus unicolor),Muntiacus muntjac), Wild
Sus scrofa), Asiatic black bear Selenarctos thibetanusCapricornis sumatrensis) are some
Hyla arenicolor) and the Ambystoma
mexicanum)
Leguminosae family.2
cedar (Cedrela odorata)Swietenia humilis Fraxinus
uhdei ),(Tilia mexicana) Abies
religiosa), ),Talauma spp. and Magnolia iltisiana.
In deforested coniferous forests, grass species
native forest wildlife and livestock.
Eupatorium adenophorumCryptomeria japonica) are critical threats
in Nepal.3
network over the soil. This thick mat and the roots of coniferous trees provide mechanical stability of the soil. This prevents soil erosion on mountain slopes.10
The mountainous terrain on which coniferous forests are located favours high rates of erosion and the occurrence of landslides. The removal of vegetation by deforestation for farming, agriculture and timber increases the threat of
Tropical coniferous forests play an
percolates slowly into the soil due to the dense layer of pine needles and
water to nearby towns.11
Deforestation in coniferous forests worsens the threat of soil erosion. Intense erosion of the mountain slopes contributes to poor water retention, and therefore, the lack of water availability for wildlife and humans.
Forty three percent of plantations in the tropics are of coniferous species, which are immense sinks of atmospheric carbon.12
on coniferous forests due to increasing global temperatures as a result of climate change. This will lead to a decline in coniferous species.13
Regulating services
Flood regulationanchor the soil on mountain slopes and provide a mechanical barrier to surface runoff during the wet season and this
11
Degeneration of the barrier provided by conifers is due to mechanical soil compaction caused by the cutting of skid trails, construction of roads, movement of logs, the pressure of heavy logging machinery and trampling by animals while
11
play a critical role in climate regulation. In Murree
and Patriata intercept moisture laden air during the monsoon season which
regions.
monsoon season.14
tropical coniferous forests can be colonised by
their cold climate. An increase in temperature has the potential to alter microbial activity with
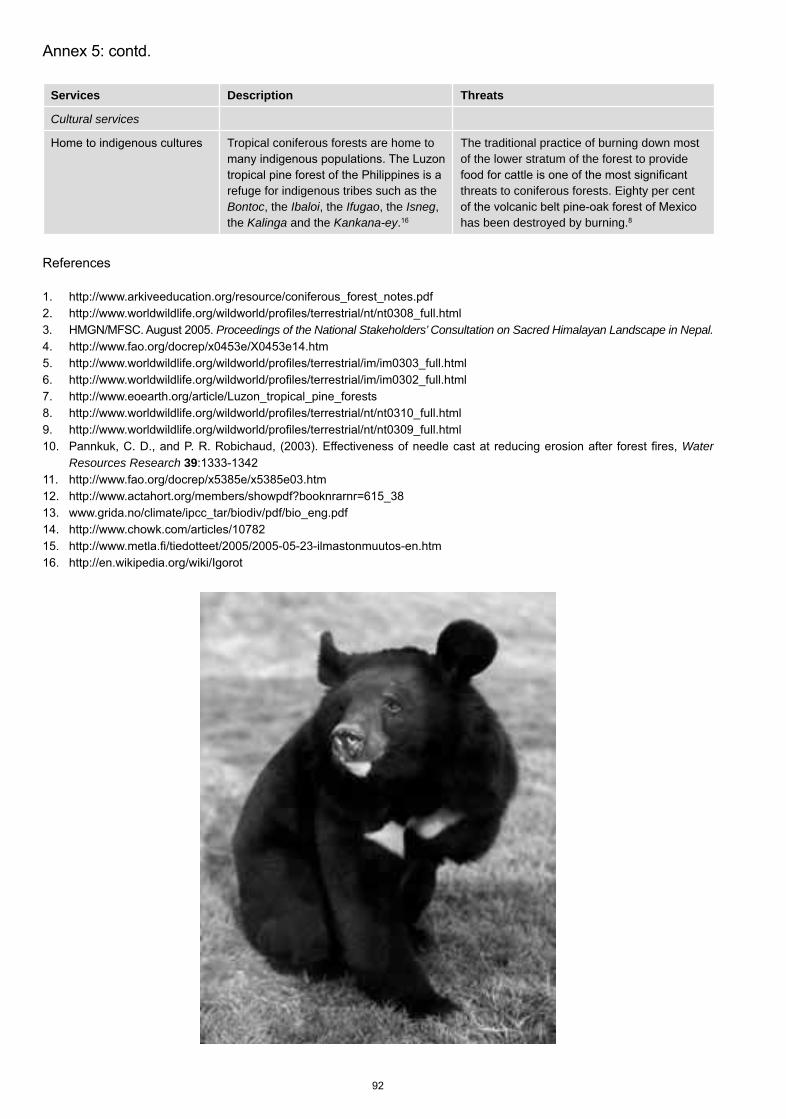
Services Description Threats
Cultural services
Tropical coniferous forests are home to
refuge for indigenous tribes such as the Bontoc, the Ibaloi, the Ifugao, the Isneg,the Kalinga and the Kankana-ey.
The traditional practice of burning down most of the lower stratum of the forest to provide
threats to coniferous forests. Eighty per cent
has been destroyed by burning.
Proceedings of the National Stakeholders’ Consultation on Sacred Himalayan Landscape in Nepal.
Water Resources Research 39
Services Description Threats
Foodare edible. These trees are important agricultural crops for products such as apples, pears, cherries, peaches, apricots, plums, almonds, walnuts, pecans, pistachios and olives. The nuts and fruits
Aleurites fordiisources of oil.1
logging, conversion of land for agriculture, clearance of land for cattle
harvesting of tree species for non timber forest products such as cork and uncontrolled cutting of timber species).2
Betulaplatyphylla) and the Dahurian birch Betula davurica) are also threats.3
Timber More than 70 tree species including the Pinus koraiensis), the
Picea koraiensis)Fraxinus mandshurica)
4
from every part of the tree and include
Quercus suberacceptable for use as a bottle stopper for
wild honey, essential oils from foliage and tannins are derived from temperate
Acer saccharum Betulalenta) trees provide important sources of
from organisms associated closely with
Tuber spp Lentinula edodes) and
Morchella spp.) produced by fungi, as well as silk produced by caterpillars feeding on the foliage of
Morus spp. Quercusspp.Tussah silk was produced each year
oil, obtained from the Asian tung tree Aleurites fordii
varnishes, paints, linoleum, resins,
greases, brake linings and in cleaning and polishing compounds.1
Services Description Threats
Provisioning services contd.
Medicine
medicinal properties.
Trametes versicolor) is used in cancer treatments
used to treat pulmonary disorders and has been shown to have cholesterol lowering properties. It is also used as an immune stimulant, an antibiotic, an antiviral against hepatitis and in infections of the respiratory, urinary and digestive tract.
Laetiporus sulphureus
Fomitopsis pinicola) is used to regulate fevers and for liver and spleen support.1
conversion of land to agriculture,
species for non timber forest products such as cork and uncontrolled cutting of timber species).2
Betula platyphylla) and the Betula davurica) are
also threats.3
Supporting services
From autumn to spring, the Umbrella bamboos Fargesia robusta and Yushania chungii) attract
home to mammals such as the Endangered Presbytis bieti), Lesser panda
Ailurus fulgens Neofelisnebulosa Selenarctos thibetanus Budorcas taxicolor).
Cymbidium whiteae),Paphiopedilum
fairrieanum) and P. wardii, and maple species Acer oblongum)
and Acer hookeri.
Rhododendron simiarum Pinus taiwanensisTorreya grandis).7
Larix gmeliniiPinus sylvestris) that are more
germination will invade cleared areas and dominate the forest.3
Services Description Threats
Supporting services contd.
Fertile soil The soil of these forests is rich in organic matter derived from the annual accumulation
conifer needles. A host of bacteria and fungi play a crucial role in slowly decomposing and recycling the organic matter on and within the
agriculture results in the loss of the leaf litter and pine needle layer and this reduces the
of soil, resulting in the loss of nutrients.
resulting in the slow percolation of rainfall to
layer of leaf litter and pine needles. This effect minimises surface runoff. Forest tree species buttress the soil and provide a mechanical barrier to surface runoff, thus preventing soil
10
The clearance of forest land for shifting cultivation and poppy cultivation in the Northern
has caused severe soil erosion, loss of habitat and biological diversity.11
2 in 2003.12
forests are huge carbon sinks because of their vast land coverage and slow rate of litter decomposition in the soil. These forests
in forest vegetation and 74 billion tonnes of carbon stored in the forest soil.3
stock in forest biomass is released by burning
global warming.3
The forest canopy ensures that rainfall
streams into the soil and underground
regions. The water table depth beneath
deeper than beneath bare land.10
Deforestation of land for agriculture and cattle
loss of freshwater.13
Regulating services
vegetation increase humidity and reduce
absorbed by the transpiration of trees. Trees also serve as windbreaks, thereby reducing wind speeds. These forests play a role in regulating global climate conditions by
1
face changes in species composition due to climate change. As air temperatures increase and rainfall decreases, the Korean pine (P. koraiensis) will likely disappear from the
predominantly hardwood forest.14
Flood regulation The forest vegetation and leaf litter that intercept rainfall and the mechanical barrier provided by the roots of trees and shrubs protect the forests and surrounding regions
10
13
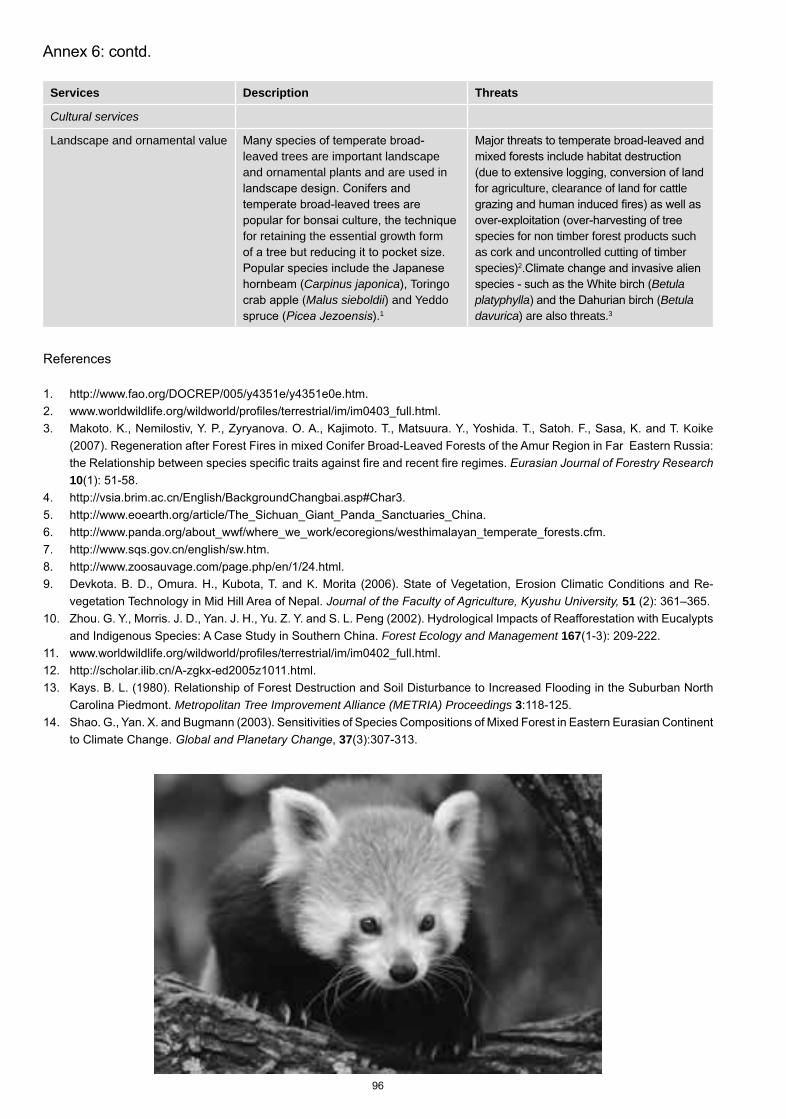
Services Description Threats
Cultural services
Landscape and ornamental valueleaved trees are important landscape and ornamental plants and are used in
for retaining the essential growth form
Carpinus japonica), Toringo Malus sieboldii) and Yeddo
).1
for agriculture, clearance of land for cattle
species for non timber forest products such as cork and uncontrolled cutting of timber species)2
Betula platyphylla Betula davurica) are also threats.3
T. Koike
10
K. 51
Forest Ecology and Management 167
Metropolitan Tree Improvement Alliance (METRIA) Proceedings 3
, 37
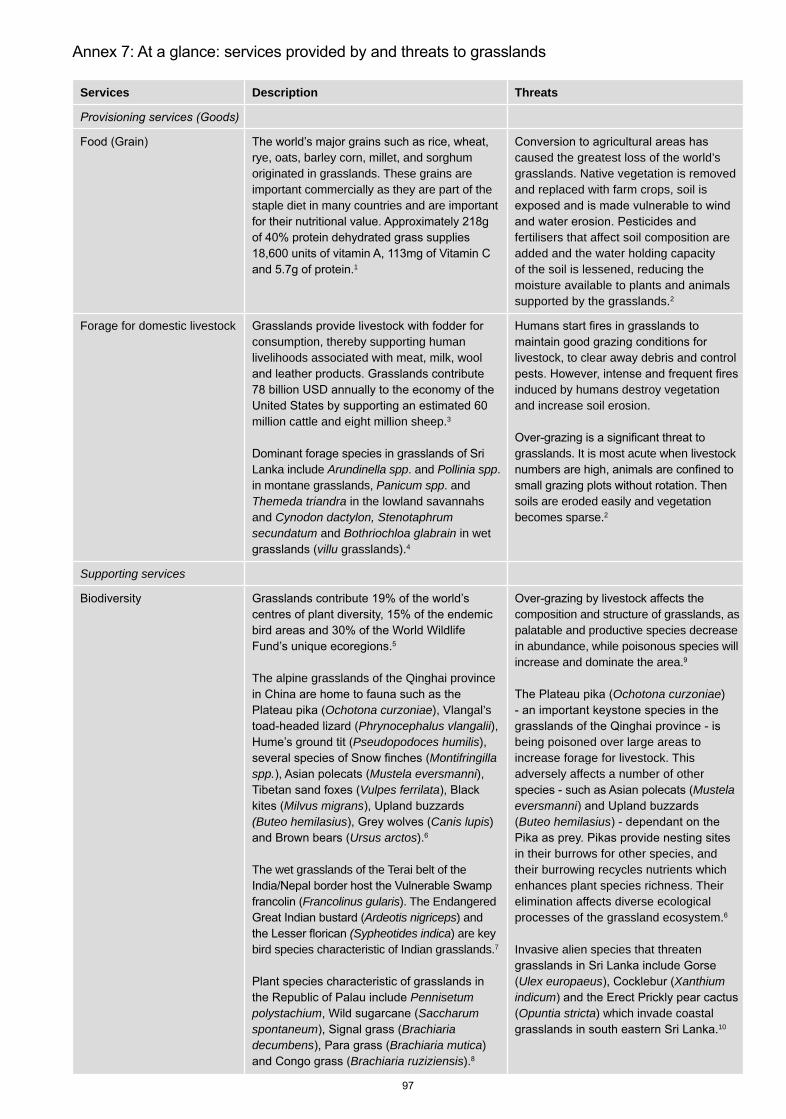
Services Description Threats
rye, oats, barley corn, millet, and sorghum originated in grasslands. These grains are important commercially as they are part of the staple diet in many countries and are important
1
caused the greatest loss of the world’s grasslands. Native vegetation is removed and replaced with farm crops, soil is
fertilisers that affect soil composition are added and the water holding capacity of the soil is lessened, reducing the moisture available to plants and animals supported by the grasslands.2
Forage for domestic livestockconsumption, thereby supporting human livelihoods associated with meat, milk, wool
million cattle and eight million sheep.3
Lanka include Arundinella spp. and Pollinia spp.in montane grasslands, Panicum spp. and Themeda triandra in the lowland savannahs and Cynodon dactylon, Stenotaphrumsecundatum and Bothriochloa glabrain in wet
villu grasslands).4
livestock, to clear away debris and control
induced by humans destroy vegetation and increase soil erosion.
grasslands. It is most acute when livestock
soils are eroded easily and vegetation becomes sparse.2
Supporting services
The alpine grasslands of the Qinghai province
Ochotona curzoniae), Vlangal’s Phrynocephalus vlangalii),
Pseudopodoces humilis),Montifringilla
spp. Mustela eversmanni),Vulpes ferrilata
Milvus migrans(Buteo hemilasius Canis lupis)
Ursus arctos).
The wet grasslands of the Terai belt of the
Francolinus gularis). The Endangered Ardeotis nigriceps) and
(Sypheotides indica) are key bird species characteristic of Indian grasslands.7
Pennisetumpolystachium Saccharumspontaneum Brachiariadecumbens Brachiaria mutica)
Brachiaria ruziziensis).
composition and structure of grasslands, as palatable and productive species decrease in abundance, while poisonous species will increase and dominate the area.
Ochotona curzoniae)
being poisoned over large areas to increase forage for livestock. This adversely affects a number of other
Mustela eversmanniButeo hemilasius
in their burrows for other species, and their burrowing recycles nutrients which enhances plant species richness. Their elimination affects diverse ecological processes of the grassland ecosystem.
Invasive alien species that threaten
Ulex europaeus XanthiumindicumOpuntia stricta) which invade coastal
10
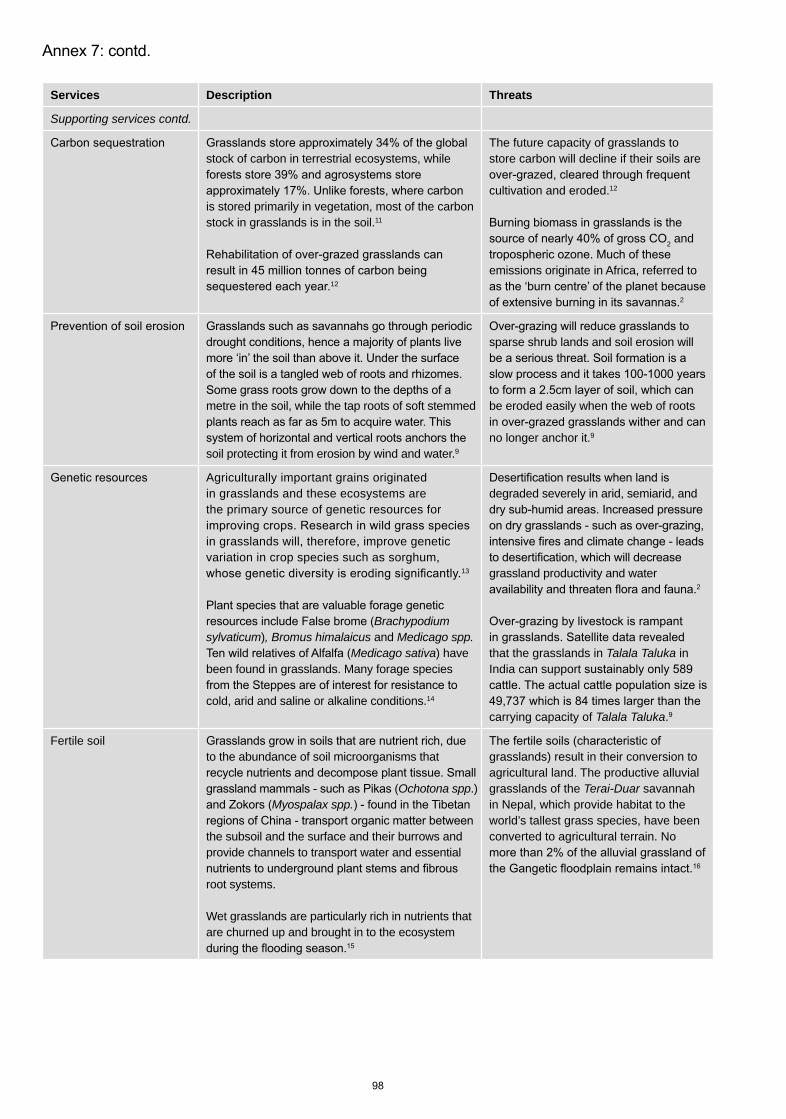
Services Description Threats
Supporting services contd.
stock of carbon in terrestrial ecosystems, while
is stored primarily in vegetation, most of the carbon stock in grasslands is in the soil.11
12
The future capacity of grasslands to store carbon will decline if their soils are
cultivation and eroded.12
2 and
emissions originate in Africa, referred to
2
metre in the soil, while the tap roots of soft stemmed
soil protecting it from erosion by wind and water.
sparse shrub lands and soil erosion will
be eroded easily when the web of roots
no longer anchor it.
Agriculturally important grains originated in grasslands and these ecosystems are the primary source of genetic resources for
in grasslands will, therefore, improve genetic variation in crop species such as sorghum,
13
Brachypodium sylvaticum), Bromus himalaicus and Medicago spp.
Medicago sativa) have been found in grasslands. Many forage species
cold, arid and saline or alkaline conditions.14
degraded severely in arid, semiarid, and
grassland productivity and water 2
that the grasslands in Talala Taluka in India can support
carrying capacity of Talala Taluka.
Fertile soilto the abundance of soil microorganisms that
Ochotona spp.) Myospalax spp.
the subsoil and the surface and their burrows and provide channels to transport water and essential
root systems.
Wet grasslands are particularly rich in nutrients that are churned up and brought in to the ecosystem
grasslands) result in their conversion to agricultural land. The productive alluvial grasslands of the Terai-Duar savannah in Nepal, which provide habitat to the world’s tallest grass species, have been converted to agricultural terrain. No
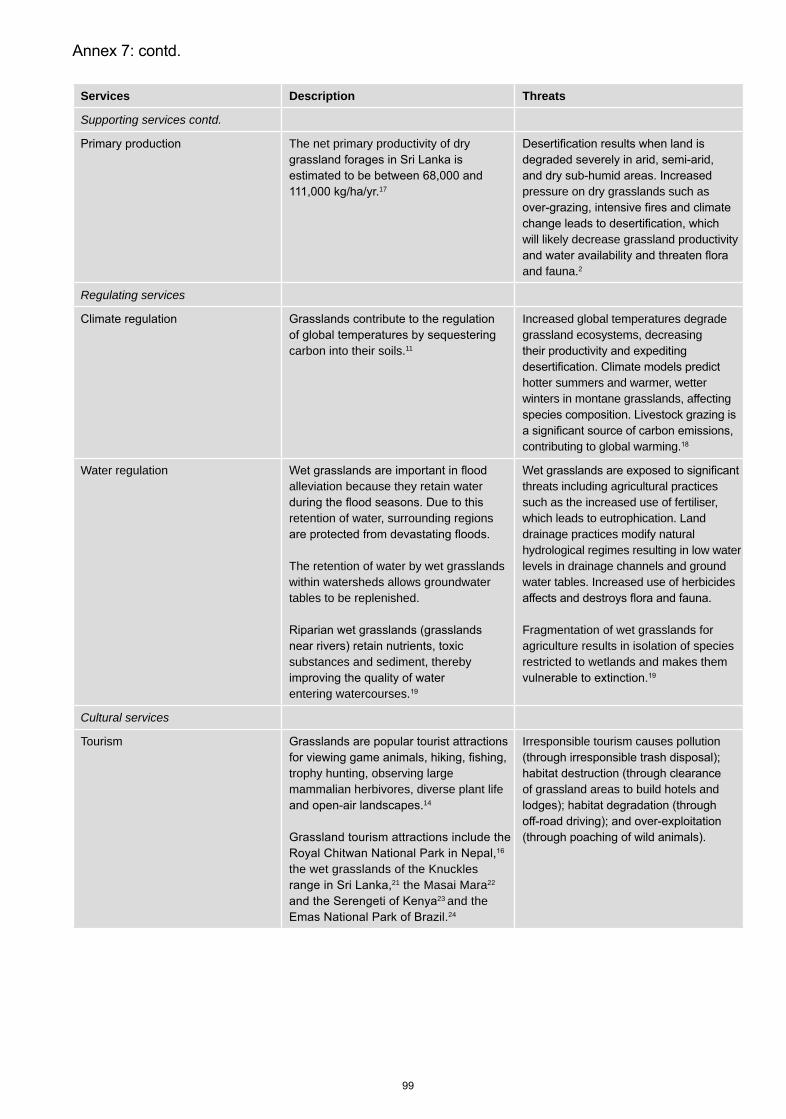
Services Description Threats
Supporting services contd.
The net primary productivity of dry
17 pressure on dry grasslands such as
will likely decrease grassland productivity
and fauna.2
Regulating services
carbon into their soils.11
Increased global temperatures degrade grassland ecosystems, decreasing
hotter summers and warmer, wetter winters in montane grasslands, affecting
contributing to global warming.
Water regulationalleviation because they retain water
retention of water, surrounding regions
The retention of water by wet grasslands within watersheds allows groundwater tables to be replenished.
substances and sediment, thereby
entering watercourses.
threats including agricultural practices such as the increased use of fertiliser, which leads to eutrophication. Land drainage practices modify natural hydrological regimes resulting in low water levels in drainage channels and ground water tables. Increased use of herbicides
Fragmentation of wet grasslands for agriculture results in isolation of species restricted to wetlands and makes them
Cultural services
Tourism
trophy hunting, observing large mammalian herbivores, diverse plant life
14
the wet grasslands of the Knuckles 21 the Masai Mara22
23 and the 24
Irresponsible tourism causes pollution
of grassland areas to build hotels and
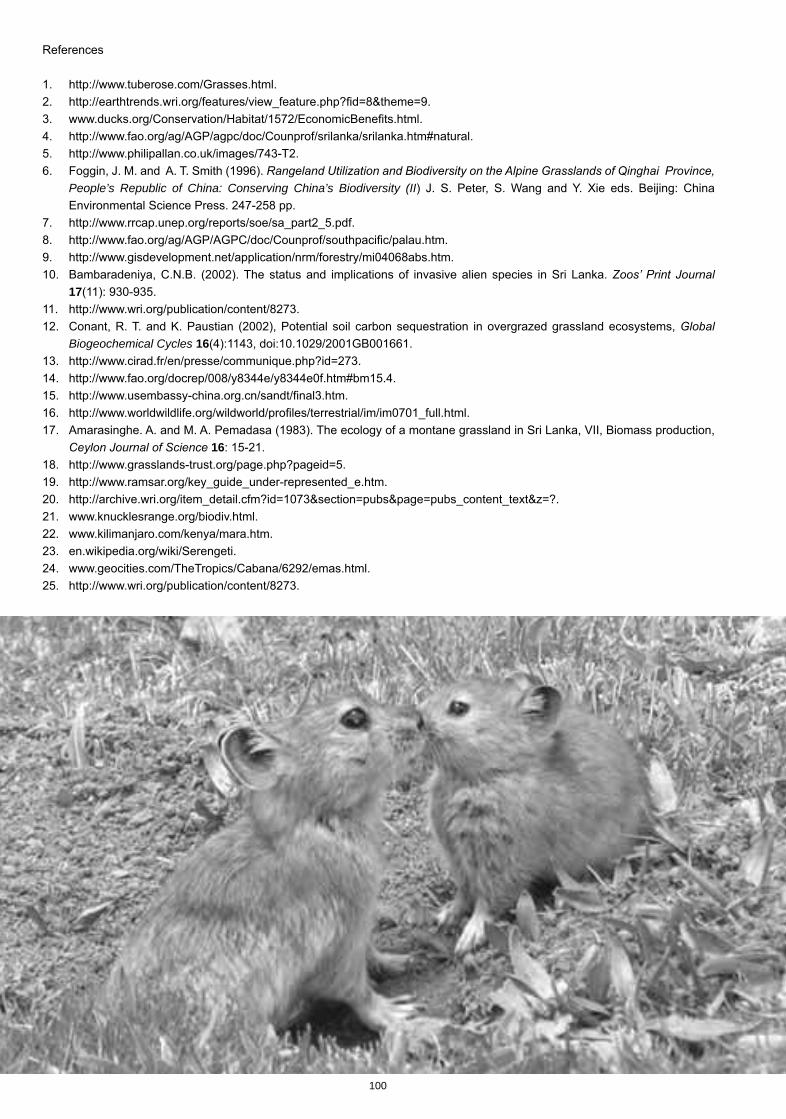
100
People’s Republic of China: Conserving China’s Biodiversity (II
17
Biogeochemical Cycles 16
16
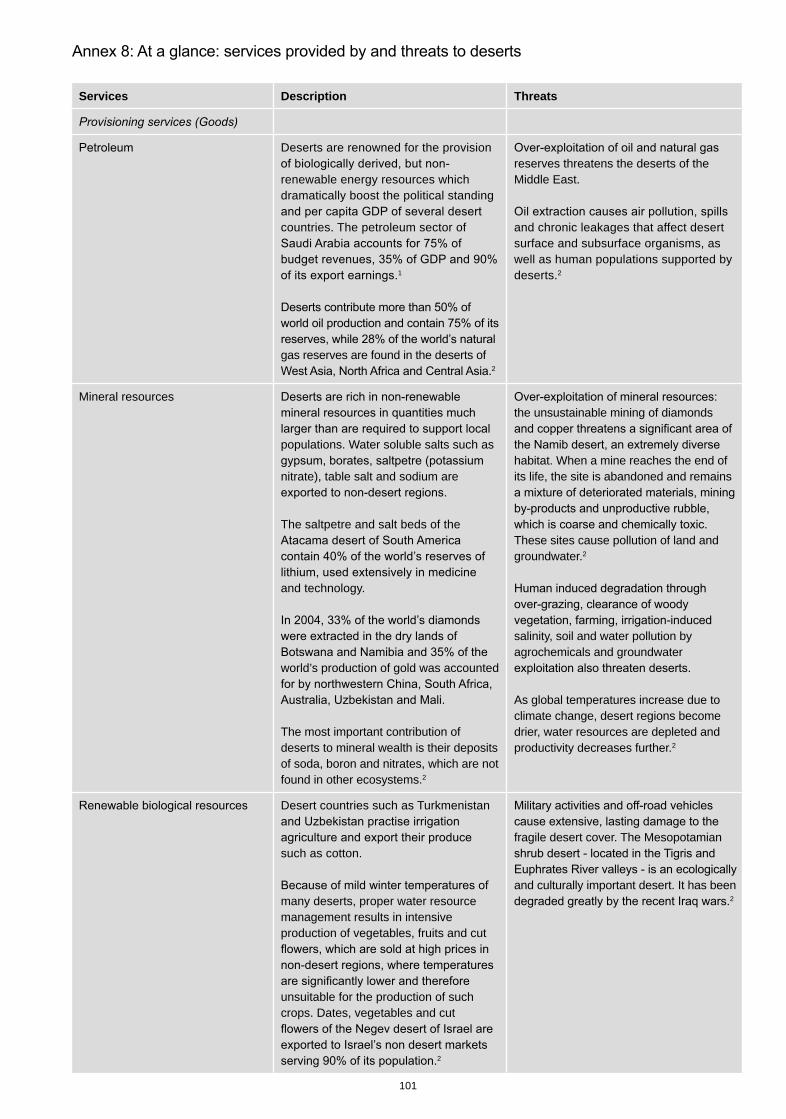
101
Services Description Threats
Deserts are renowned for the provision
renewable energy resources which dramatically boost the political standing
countries. The petroleum sector of
1
gas reserves are found in the deserts of 2
reserves threatens the deserts of the Middle East.
and chronic leakages that affect desert surface and subsurface organisms, as well as human populations supported by deserts.2
Mineral resources
populations. Water soluble salts such as
nitrate), table salt and sodium are
The saltpetre and salt beds of the
and technology.
world’s production of gold was accounted
The most important contribution of deserts to mineral wealth is their deposits of soda, boron and nitrates, which are not found in other ecosystems.2
the unsustainable mining of diamonds
habitat. When a mine reaches the end of its life, the site is abandoned and remains
These sites cause pollution of land and groundwater.2
salinity, soil and water pollution by agrochemicals and groundwater
As global temperatures increase due to climate change, desert regions become drier, water resources are depleted and productivity decreases further.2
Desert countries such as Turkmenistan
such as cotton.
many deserts, proper water resource management results in intensive production of vegetables, fruits and cut
unsuitable for the production of such crops. Dates, vegetables and cut
2
fragile desert cover. The Mesopotamian
and culturally important desert. It has been 2
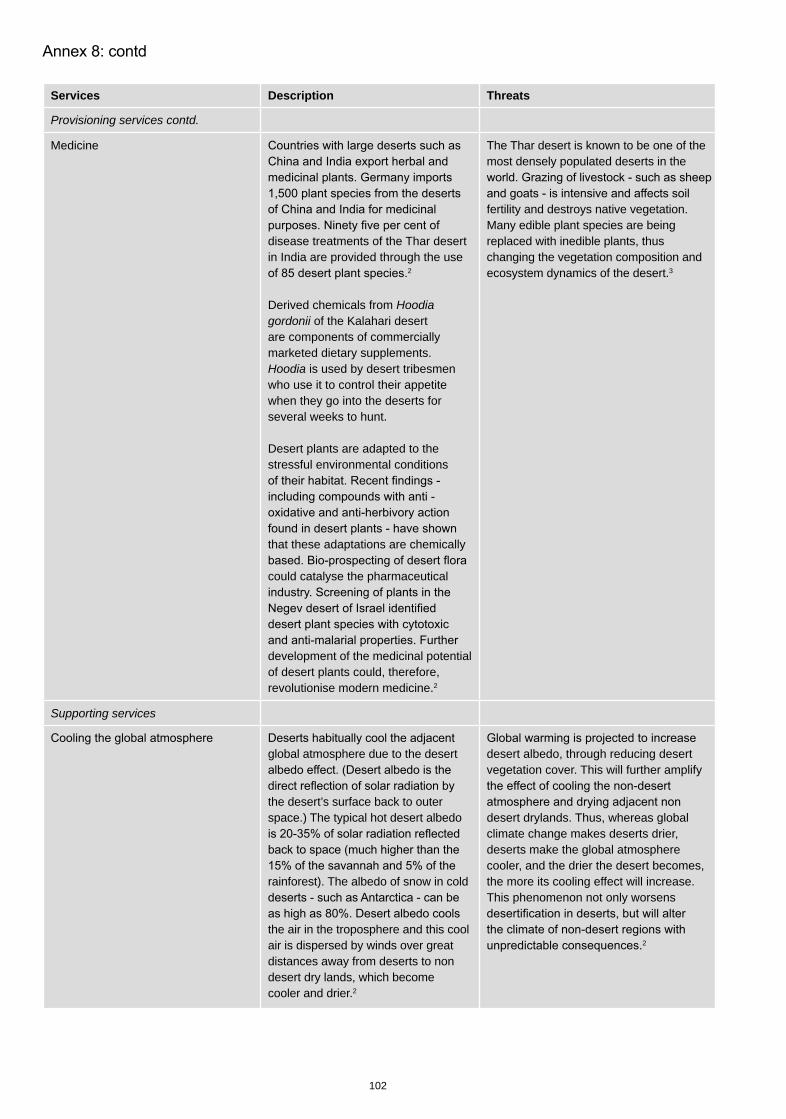
102
Services Description Threats
Provisioning services contd.
Medicine
disease treatments of the Thar desert in India are provided through the use
2
Derived chemicals from Hoodiagordonii of the Kalahari desert are components of commercially marketed dietary supplements. Hoodia is used by desert tribesmen who use it to control their appetite when they go into the deserts for several weeks to hunt.
Desert plants are adapted to the stressful environmental conditions
that these adaptations are chemically
could catalyse the pharmaceutical
development of the medicinal potential of desert plants could, therefore, revolutionise modern medicine.2
The Thar desert is known to be one of the most densely populated deserts in the
fertility and destroys native vegetation. Many edible plant species are being replaced with inedible plants, thus changing the vegetation composition and ecosystem dynamics of the desert.3
Supporting services
global atmosphere due to the desert
the desert’s surface back to outer space.) The typical hot desert albedo
rainforest). The albedo of snow in cold
the air in the troposphere and this cool air is dispersed by winds over great distances away from deserts to non desert dry lands, which become cooler and drier.2
desert albedo, through reducing desert vegetation cover. This will further amplify
desert drylands. Thus, whereas global climate change makes deserts drier, deserts make the global atmosphere cooler, and the drier the desert becomes, the more its cooling effect will increase. This phenomenon not only worsens
2
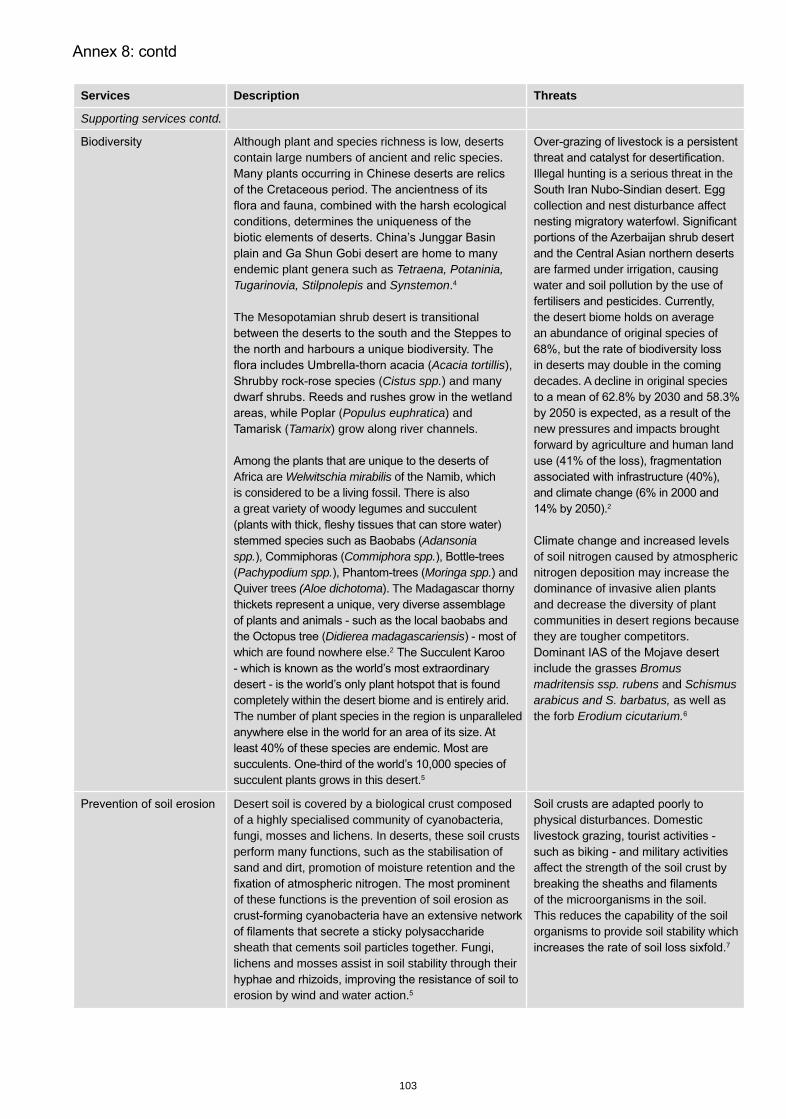
103
Services Description Threats
Supporting services contd.
Although plant and species richness is low, deserts contain large numbers of ancient and relic species.
endemic plant genera such as Tetraena, Potaninia, Tugarinovia, Stilpnolepis and Synstemon.4
The Mesopotamian shrub desert is transitional
Acacia tortillis),Cistus spp.) and many
Populus euphratica) and Tamarix) grow along river channels.
Africa are Welwitschia mirabilis of the Namib, which is considered to be a living fossil. There is also a great variety of woody legumes and succulent
Adansonia spp. Commiphora spp.Pachypodium spp. Moringa spp.) and
Quiver trees (Aloe dichotoma). The Madagascar thorny
Didierea madagascariensiswhich are found nowhere else.2
completely within the desert biome and is entirely arid. The number of plant species in the region is unparalleled
succulent plants grows in this desert.
Illegal hunting is a serious threat in the
collection and nest disturbance affect
are farmed under irrigation, causing water and soil pollution by the use of
the desert biome holds on average an abundance of original species of
in deserts may double in the coming decades. A decline in original species
new pressures and impacts brought forward by agriculture and human land
2
of soil nitrogen caused by atmospheric nitrogen deposition may increase the dominance of invasive alien plants and decrease the diversity of plant communities in desert regions because they are tougher competitors.
include the grasses Bromusmadritensis ssp. rubens and Schismus arabicus and S. barbatus, as well as the forb Erodium cicutarium.
Desert soil is covered by a biological crust composed of a highly specialised community of cyanobacteria, fungi, mosses and lichens. In deserts, these soil crusts perform many functions, such as the stabilisation of sand and dirt, promotion of moisture retention and the
of these functions is the prevention of soil erosion as
sheath that cements soil particles together. Fungi, lichens and mosses assist in soil stability through their
erosion by wind and water action.
physical disturbances. Domestic
affect the strength of the soil crust by
of the microorganisms in the soil. This reduces the capability of the soil organisms to provide soil stability which
7
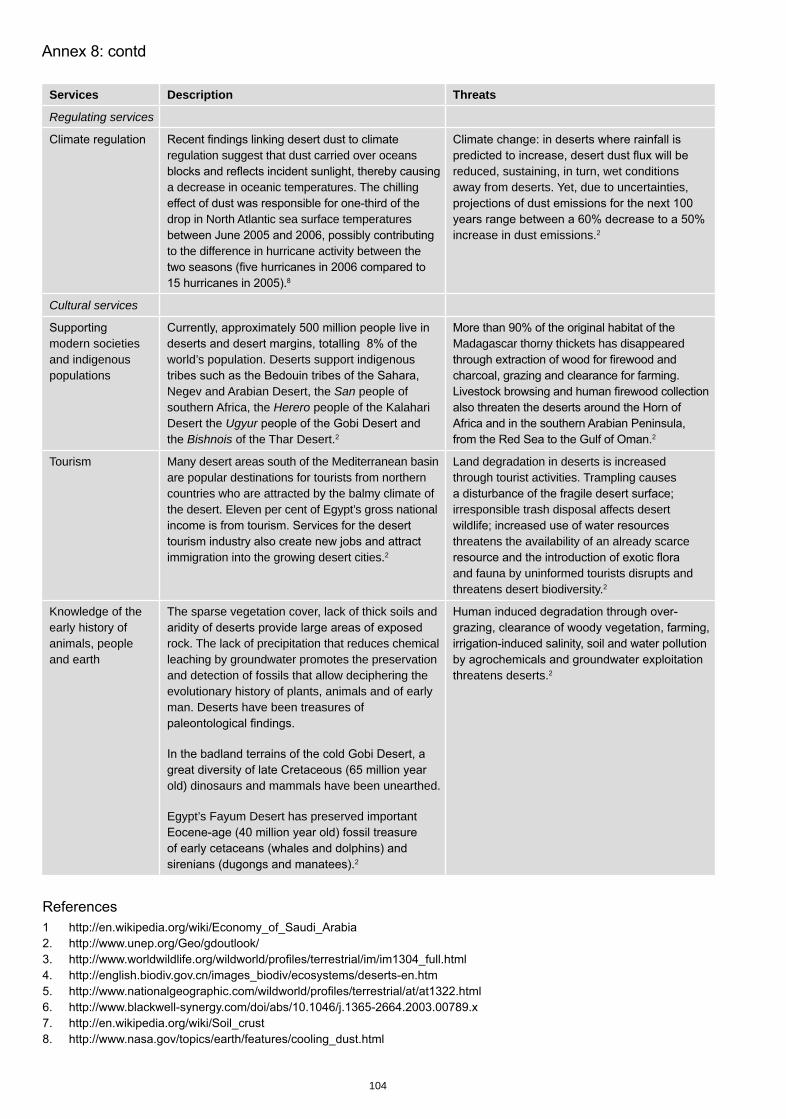
104
Services Description Threats
Regulating services
regulation suggest that dust carried over oceans
a decrease in oceanic temperatures. The chilling
drop in North Atlantic sea surface temperatures
to the difference in hurricane activity between the
reduced, sustaining, in turn, wet conditions away from deserts. Yet, due to uncertainties,
increase in dust emissions.2
Cultural services
modern societies and indigenous populations
world’s population. Deserts support indigenous
Negev and Arabian Desert, the San people of southern Africa, the Herero people of the Kalahari Desert the Ugyurthe Bishnois of the Thar Desert.2
Madagascar thorny thickets has disappeared
2
Tourism Many desert areas south of the Mediterranean basin are popular destinations for tourists from northern countries who are attracted by the balmy climate of the desert. Eleven per cent of Egypt’s gross national
immigration into the growing desert cities.2
Land degradation in deserts is increased through tourist activities. Trampling causes
irresponsible trash disposal affects desert
threatens the availability of an already scarce
and fauna by uninformed tourists disrupts and threatens desert biodiversity.2
Knowledge of the early history of animals, people and earth
The sparse vegetation cover, lack of thick soils and
rock. The lack of precipitation that reduces chemical leaching by groundwater promotes the preservation and detection of fossils that allow deciphering the evolutionary history of plants, animals and of early man. Deserts have been treasures of
old) dinosaurs and mammals have been unearthed.
Egypt’s Fayum Desert has preserved important
2
threatens deserts.2
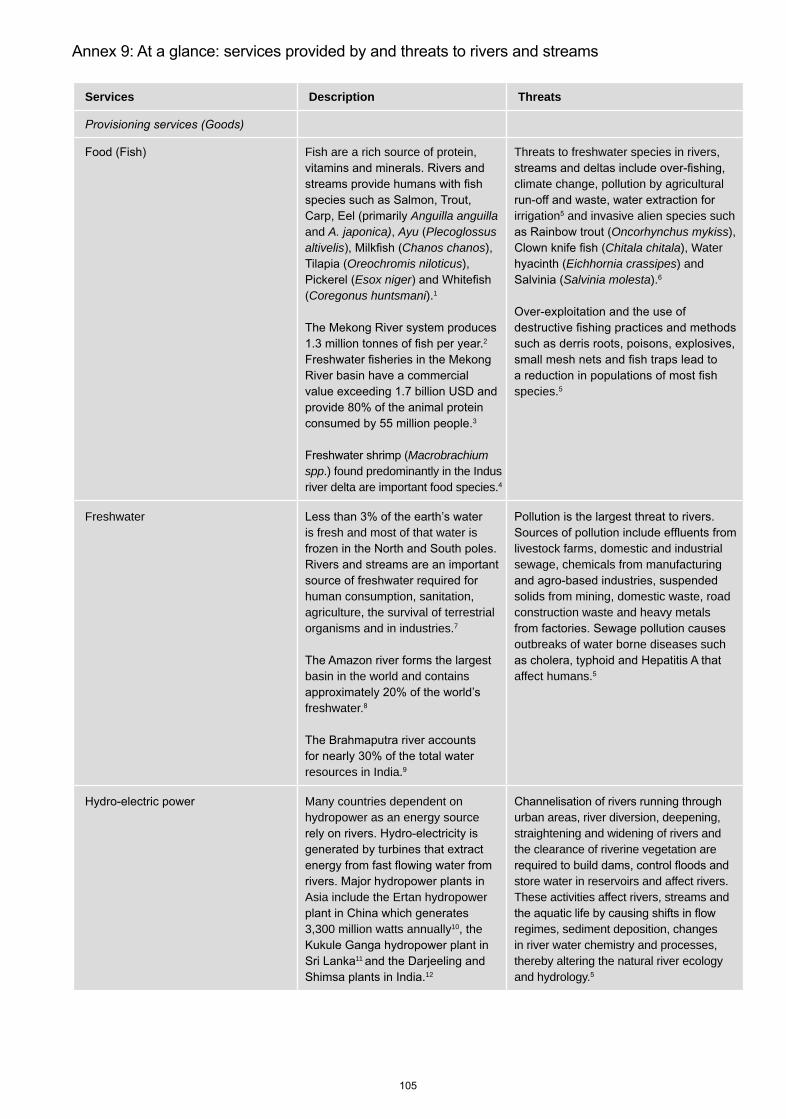
Services Description Threats
Fish are a rich source of protein,
Anguilla anguilla and A. japonica), Ayu Plecoglossusaltivelis Chanos chanos),
Oreochromis niloticus),Esox niger
Coregonus huntsmani).1
2
3
Macrobrachium spp.) found predominantly in the Indus river delta are important food species.4
Threats to freshwater species in rivers,
climate change, pollution by agricultural
irrigation and invasive alien species such Oncorhynchus mykiss),
Chitala chitala), Water Eichhornia crassipes) and Salvinia molesta).
species.
Freshwateris fresh and most of that water is
human consumption, sanitation, agriculture, the survival of terrestrial organisms and in industries.7
basin in the world and contains
freshwater.
resources in India.
livestock farms, domestic and industrial sewage, chemicals from manufacturing
solids from mining, domestic waste, road construction waste and heavy metals
outbreaks of water borne diseases such
affect humans.
Many countries dependent on hydropower as an energy source
Asia include the Ertan hydropower
3,300 million watts annually10, the
11
12
urban areas, river diversion, deepening, straightening and widening of rivers and the clearance of riverine vegetation are
store water in reservoirs and affect rivers. These activities affect rivers, streams and
regimes, sediment deposition, changes in river water chemistry and processes, thereby altering the natural river ecology and hydrology.
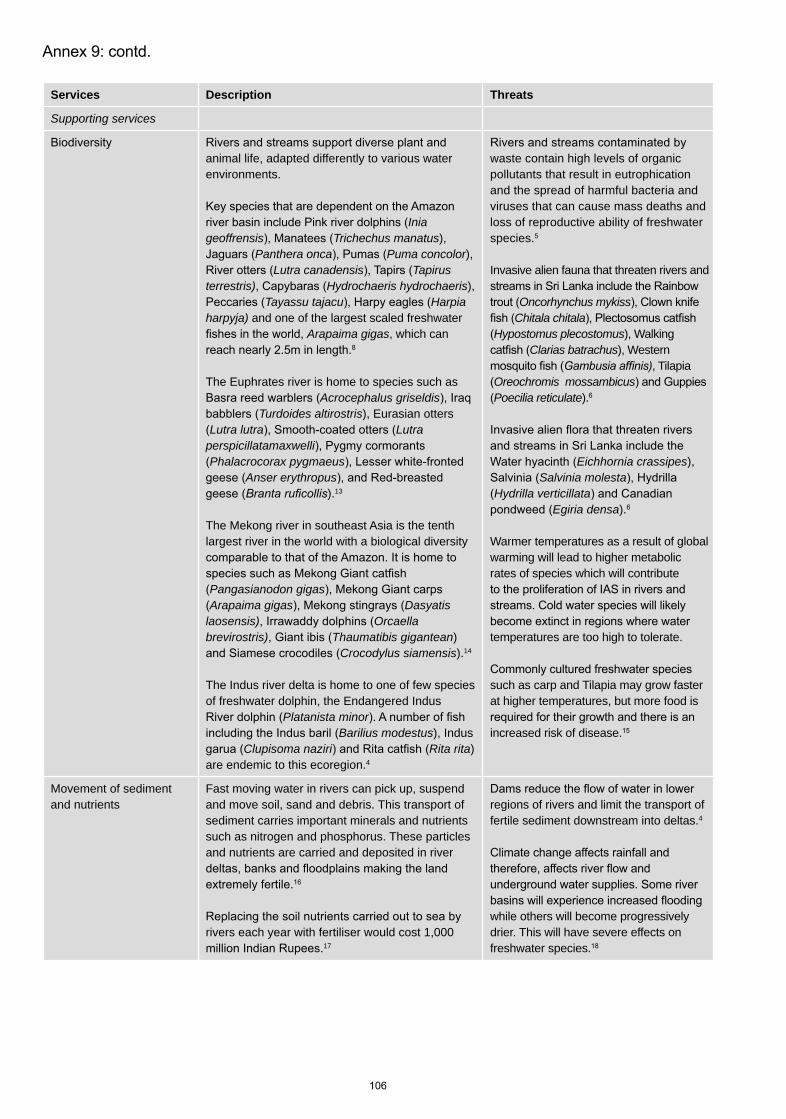
Services Description Threats
Supporting services
animal life, adapted differently to various water environments.
Inia geoffrensis Trichechus manatus),
Panthera onca Puma concolor), Lutra canadensis Tapirus
terrestris) Hydrochaeris hydrochaeris), Tayassu tajacu Harpia
harpyja) and one of the largest scaled freshwater Arapaima gigas, which can
The Euphrates river is home to species such as Acrocephalus griseldis
Turdoides altirostris), Eurasian otters Lutra lutra Lutra
perspicillatamaxwelliPhalacrocorax pygmaeus
Anser erythropus).13
The Mekong river in southeast Asia is the tenth largest river in the world with a biological diversity
Pangasianodon gigasArapaima gigas Dasyatis
laosensis) Orcaellabrevirostris) Thaumatibis gigantean)
Crocodylus siamensis).14
The Indus river delta is home to one of few species of freshwater dolphin, the Endangered Indus
Platanista minorBarilius modestus), Indus
Clupisoma naziri Rita rita)are endemic to this ecoregion.4
waste contain high levels of organic pollutants that result in eutrophication and the spread of harmful bacteria and viruses that can cause mass deaths and loss of reproductive ability of freshwater species.
Invasive alien fauna that threaten rivers and
Oncorhynchus mykissChitala chitala
Hypostomus plecostomus), Walking Clarias batrachus), Western
, Tilapia Oreochromis mossambicusPoecilia reticulate).
Eichhornia crassipes),Salvinia molesta
Hydrilla verticillataEgiria densa).
Warmer temperatures as a result of global warming will lead to higher metabolic rates of species which will contribute
temperatures are too high to tolerate.
such as carp and Tilapia may grow faster at higher temperatures, but more food is
increased risk of disease.
Movement of sediment and nutrients
Fast moving water in rivers can pick up, suspend and move soil, sand and debris. This transport of sediment carries important minerals and nutrients such as nitrogen and phosphorus. These particles and nutrients are carried and deposited in river
rivers each year with fertiliser would cost 1,000 17
regions of rivers and limit the transport of fertile sediment downstream into deltas.4
while others will become progressively drier. This will have severe effects on freshwater species.
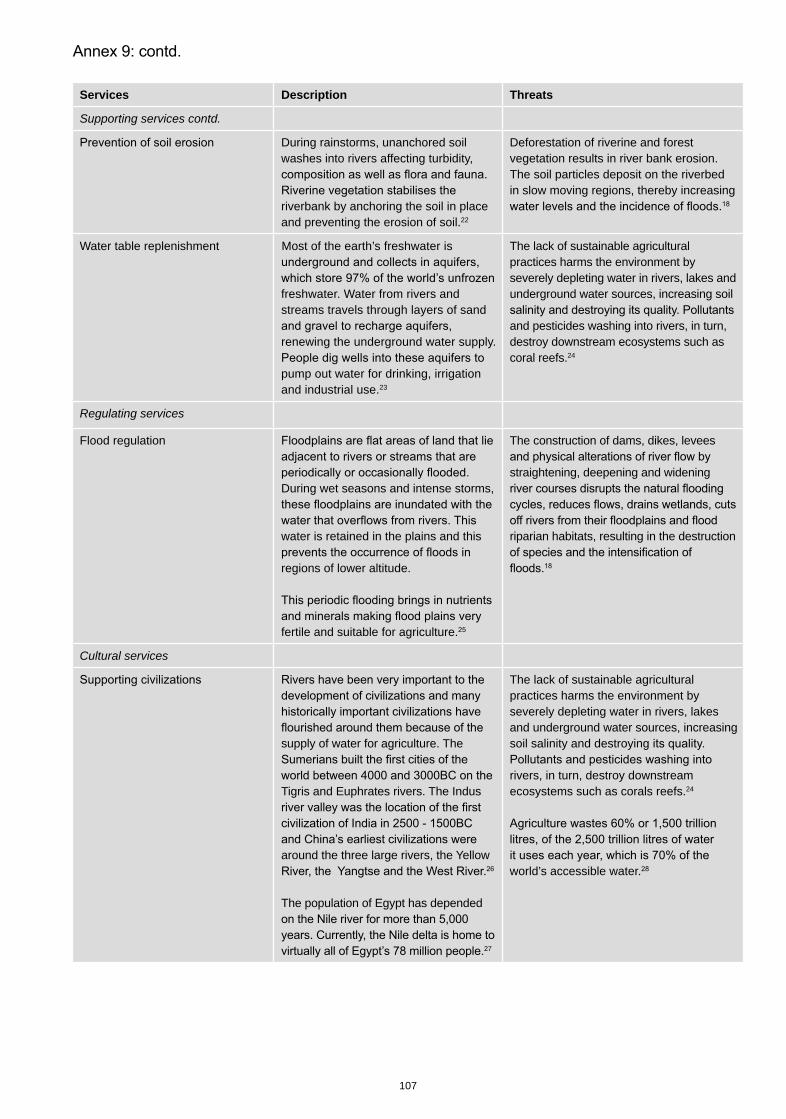
107
Services Description Threats
Supporting services contd.
During rainstorms, unanchored soil washes into rivers affecting turbidity,
riverbank by anchoring the soil in place and preventing the erosion of soil.22
Deforestation of riverine and forest vegetation results in river bank erosion. The soil particles deposit on the riverbed in slow moving regions, thereby increasing
Water table replenishment Most of the earth’s freshwater is
freshwater. Water from rivers and streams travels through layers of sand
renewing the underground water supply.
pump out water for drinking, irrigation and industrial use.23
The lack of sustainable agricultural practices harms the environment by severely depleting water in rivers, lakes and underground water sources, increasing soil
and pesticides washing into rivers, in turn, destroy downstream ecosystems such as coral reefs.24
Regulating services
Flood regulation
During wet seasons and intense storms,
water is retained in the plains and this
regions of lower altitude.
fertile and suitable for agriculture.
The construction of dams, dikes, levees
straightening, deepening and widening
riparian habitats, resulting in the destruction
Cultural services
supply of water for agriculture. The
Tigris and Euphrates rivers. The Indus
around the three large rivers, the Yellow
The population of Egypt has depended
27
The lack of sustainable agricultural practices harms the environment by severely depleting water in rivers, lakes and underground water sources, increasing soil salinity and destroying
rivers, in turn, destroy downstreamecosystems such as corals reefs.24
world’s accessible water.
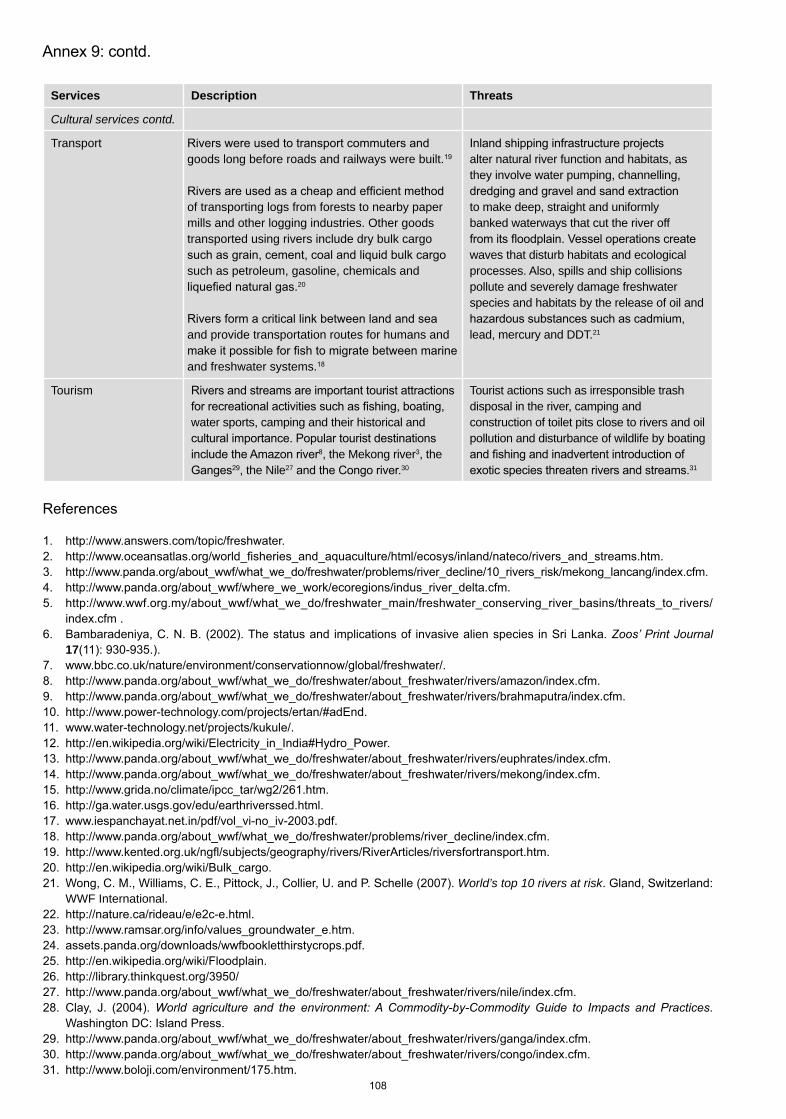
Services Description Threats
Cultural services contd.
Transportgoods long before roads and railways were built.
of transporting logs from forests to nearby paper mills and other logging industries. Other goods transported using rivers include dry bulk cargo
such as petroleum, gasoline, chemicals and 20
and provide transportation routes for humans and
and freshwater systems.
alter natural river function and habitats, as they involve water pumping, channelling,
to make deep, straight and uniformly banked waterways that cut the river off
waves that disturb habitats and ecological processes. Also, spills and ship collisions pollute and severely damage freshwater species and habitats by the release of oil and
lead, mercury and DDT.21
Tourism
water sports, camping and their historical and
, the Mekong river3, the , the Nile27 30
Tourist actions such as irresponsible trash disposal in the river, camping and construction of toilet pits close to rivers and oil pollution and disturbance of wildlife by boating
31
17
World’s top 10 rivers at riskWWF International.
.
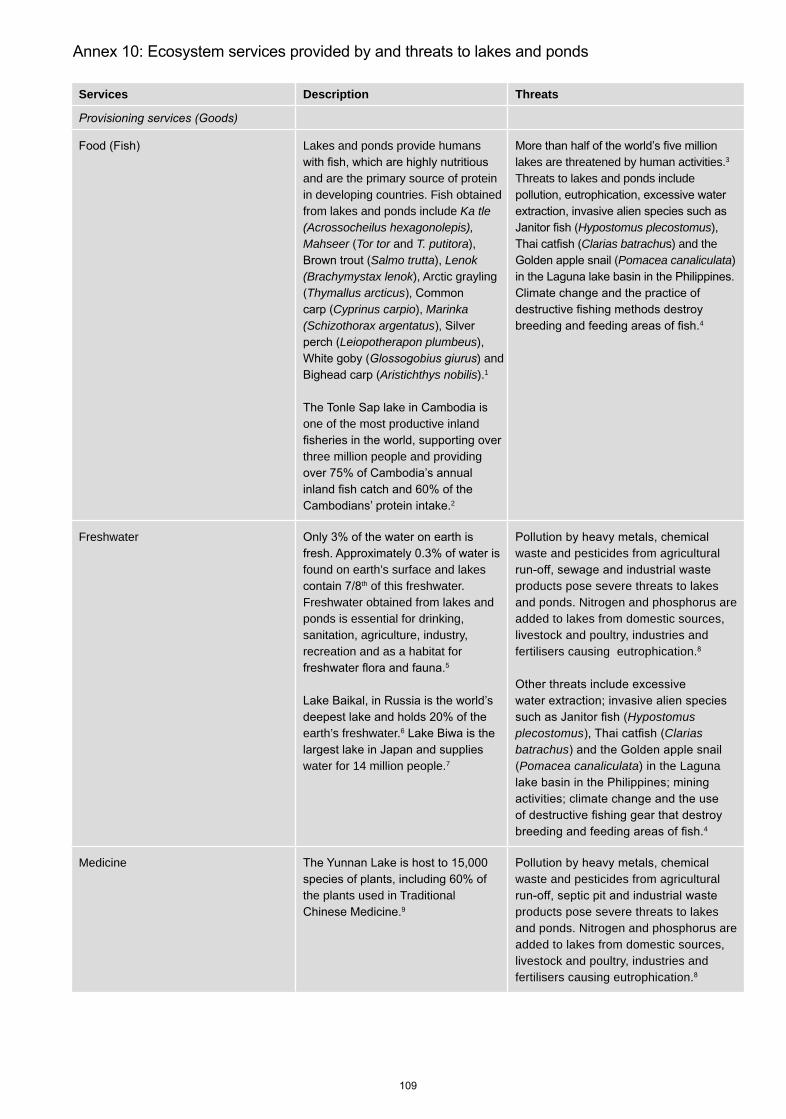
Services Description Threats
Lakes and ponds provide humans
and are the primary source of protein in developing countries. Fish obtained from lakes and ponds include Ka tle (Acrossocheilus hexagonolepis), Mahseer Tor tor and T. putitora),
Salmo trutta), Lenok (Brachymystax lenok), Arctic grayling Thymallus arcticus
Cyprinus carpio), Marinka (Schizothorax argentatus
Leiopotherapon plumbeus), ) and
Aristichthys nobilis).1
one of the most productive inland
three million people and providing
2
lakes are threatened by human activities.3
Threats to lakes and ponds include
Hypostomus plecostomus),Clarias batrachus) and the
Pomacea canaliculata)
4
Freshwater
found on earth’s surface and lakes th of this freshwater.
Freshwater obtained from lakes and ponds is essential for drinking, sanitation, agriculture, industry, recreation and as a habitat for
earth’s freshwater.
water for 14 million people.7
waste and pesticides from agricultural
products pose severe threats to lakes and ponds. Nitrogen and phosphorus are added to lakes from domestic sources, livestock and poultry, industries and fertilisers causing eutrophication.
Hypostomus plecostomus Clarias batrachusPomacea canaliculata) in the Laguna
4
Medicine
the plants used in Traditional waste and pesticides from agricultural
products pose severe threats to lakes and ponds. Nitrogen and phosphorus are added to lakes from domestic sources, livestock and poultry, industries and fertilisers causing eutrophication.
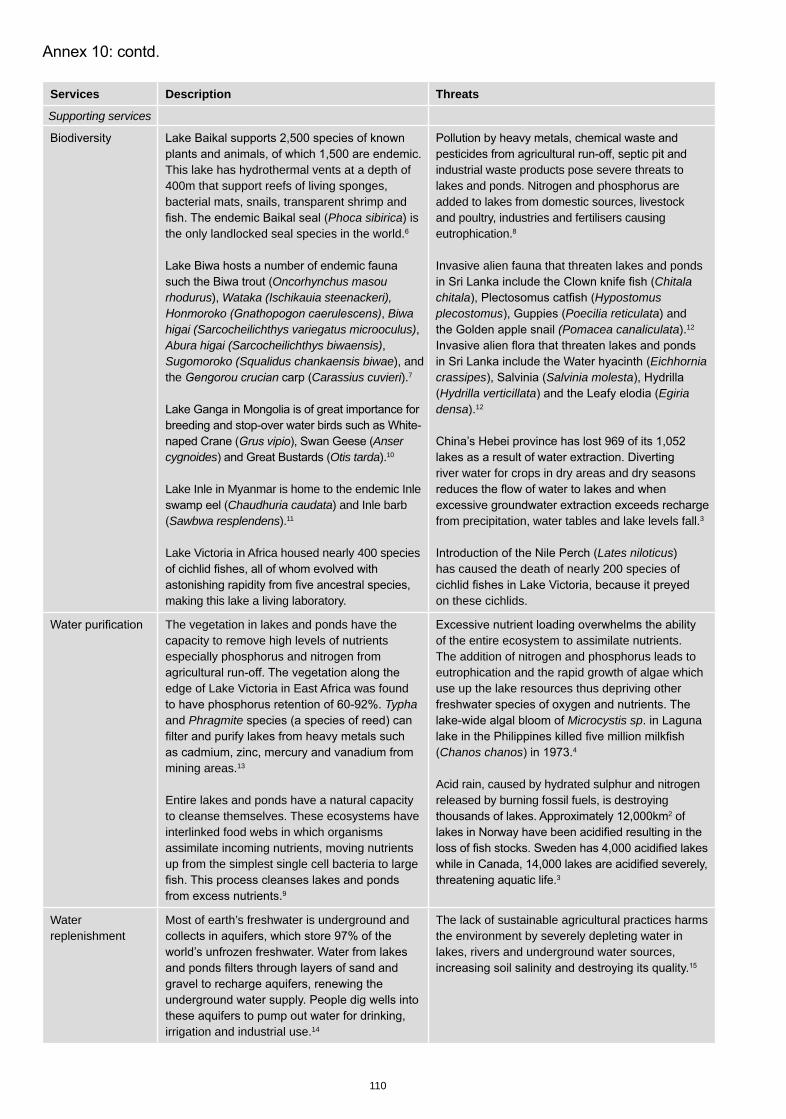
110
Services Description Threats
Supporting services
This lake has hydrothermal vents at a depth of 400m that support reefs of living sponges, bacterial mats, snails, transparent shrimp and
Phoca sibirica) is the only landlocked seal species in the world.
Oncorhynchus masou rhodurus), Wataka (Ischikauia steenackeri),
, Biwa higai (Sarcocheilichthys variegatus microoculus),Abura higai (Sarcocheilichthys biwaensis),Sugomoroko (Squalidus chankaensis biwae), and the Carassius cuvieri).7
Anser cygnoides Otis tarda).10
Lake Inle in Myanmar is home to the endemic Inle Chaudhuria caudata) and Inle barb
Sawbwa resplendens).11
Lake Victoria in Africa housed nearly 400 species
making this lake a living laboratory.
industrial waste products pose severe threats to lakes and ponds. Nitrogen and phosphorus are added to lakes from domestic sources, livestock and poultry, industries and fertilisers causing eutrophication.
Invasive alien fauna that threaten lakes and ponds Chitala
chitala Hypostomusplecostomus Poecilia reticulata) and
(Pomacea canaliculata).12
Eichhorniacrassipes Salvinia molestaHydrilla verticillata Egiria
densa).12
river water for crops in dry areas and dry seasons
from precipitation, water tables and lake levels fall.3
Lates niloticus)has caused the death of nearly 200 species of
on these cichlids.
The vegetation in lakes and ponds have the capacity to remove high levels of nutrients especially phosphorus and nitrogen from
edge of Lake Victoria in East Africa was found Typha
and Phragmite
mining areas.13
Entire lakes and ponds have a natural capacity to cleanse themselves. These ecosystems have interlinked food webs in which organisms assimilate incoming nutrients, moving nutrients up from the simplest single cell bacteria to large
of the entire ecosystem to assimilate nutrients. The addition of nitrogen and phosphorus leads to eutrophication and the rapid growth of algae which use up the lake resources thus depriving other
Microcystis sp. in Laguna
Chanos chanos 4
Acid rain, caused by hydrated sulphur and nitrogen released by burning fossil fuels, is destroying
2 of
3
Water replenishment
Most of earth’s freshwater is underground and
irrigation and industrial use.14
The lack of sustainable agricultural practices harms the environment by severely depleting water in lakes, rivers and underground water sources,
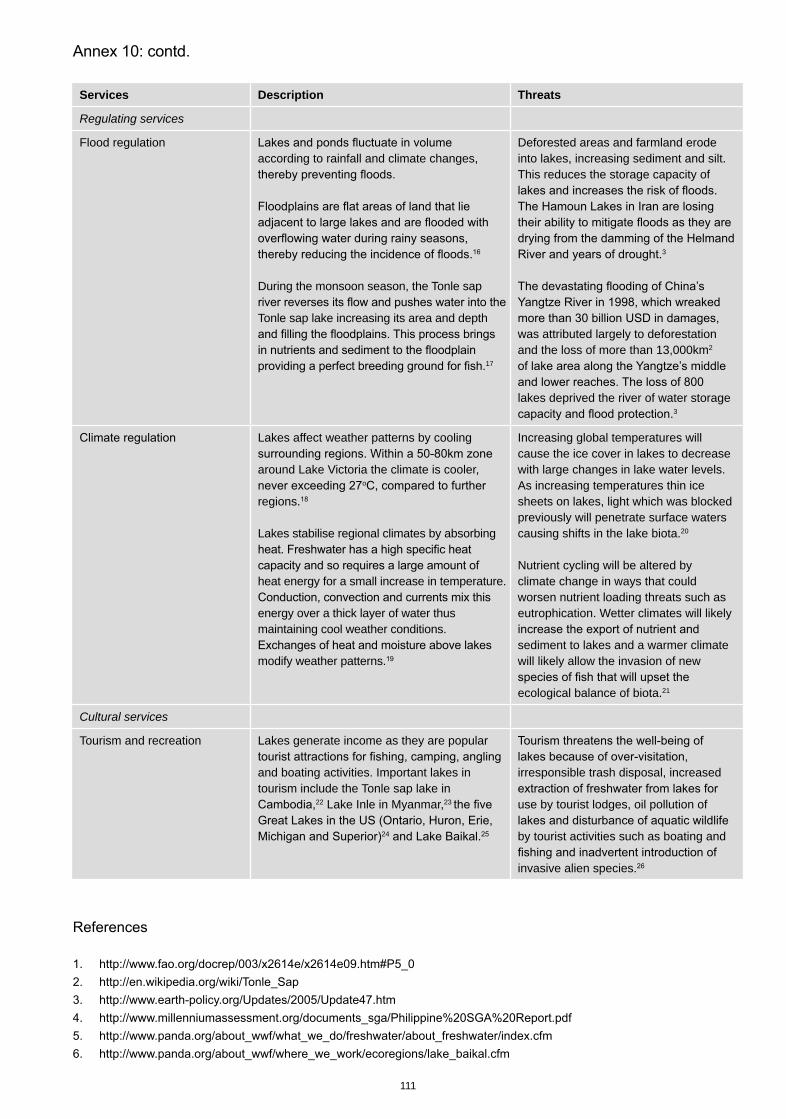
111
Services Description Threats
Regulating services
Flood regulationaccording to rainfall and climate changes,
During the monsoon season, the Tonle sap
Tonle sap lake increasing its area and depth
17
Deforested areas and farmland erode into lakes, increasing sediment and silt. This reduces the storage capacity of
3
was attributed largely to deforestation and the loss of more than 13,000km2
lakes deprived the river of water storage 3
Lakes affect weather patterns by cooling
around Lake Victoria the climate is cooler, o
regions.
Lakes stabilise regional climates by absorbing
heat energy for a small increase in temperature.
energy over a thick layer of water thus maintaining cool weather conditions.
modify weather patterns.
Increasing global temperatures will cause the ice cover in lakes to decrease with large changes in lake water levels. As increasing temperatures thin ice sheets on lakes, light which was blocked previously will penetrate surface waters causing shifts in the lake biota.20
Nutrient cycling will be altered by climate change in ways that could worsen nutrient loading threats such as eutrophication. Wetter climates will likely
sediment to lakes and a warmer climate will likely allow the invasion of new
ecological balance of biota.21
Cultural services
Tourism and recreation Lakes generate income as they are popular
and boating activities. Important lakes in tourism include the Tonle sap lake in
22 Lake Inle in Myanmar,23
24
irresponsible trash disposal, increased
use by tourist lodges, oil pollution of
by tourist activities such as boating and
invasive alien species.
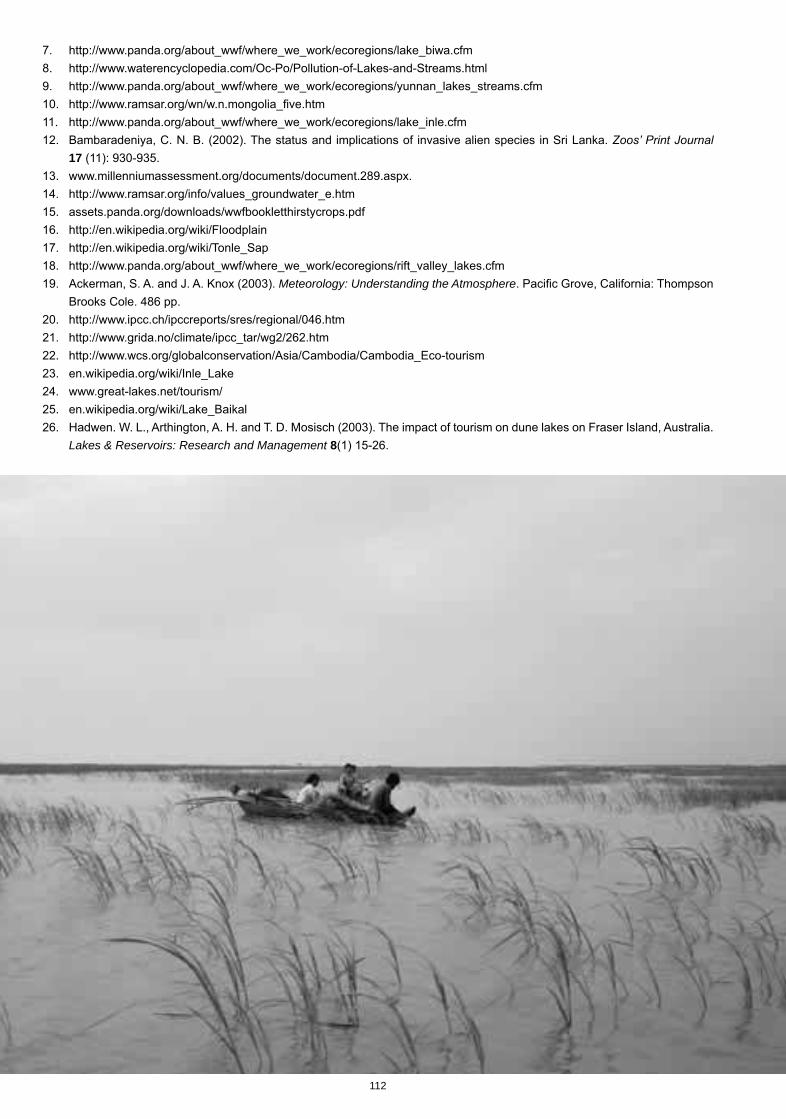
112
17
Meteorology: Understanding the Atmosphere
Lakes & Reservoirs: Research and Management 8
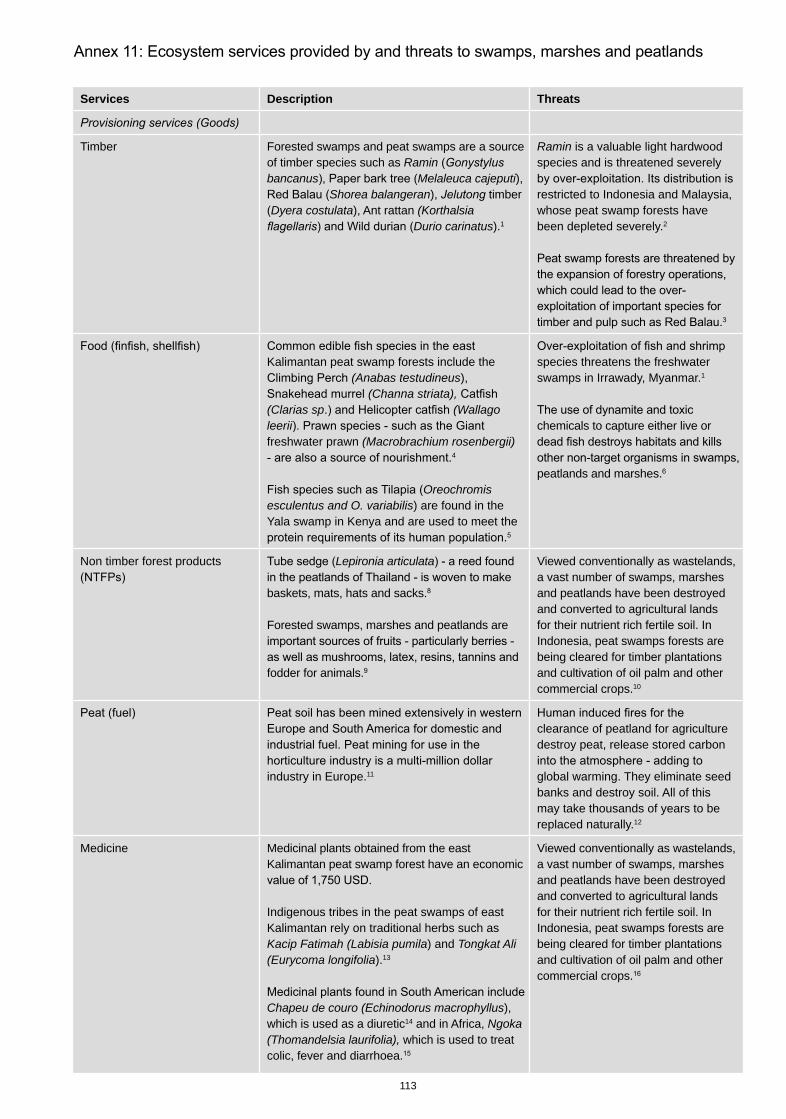
113
Services Description Threats
Timber Forested swamps and peat swamps are a source of timber species such as Raminbancanus Melaleuca cajeputi),
Shorea balangeran), timber Dyera costulata), Ant rattan (Korthalsia
Durio carinatus).1
Ramin is a valuable light hardwood species and is threatened severely
restricted to Indonesia and Malaysia, whose peat swamp forests have been depleted severely.2
3
Kalimantan peat swamp forests include the (Anabas testudineus),
(Channa striata), (Clarias sp (Wallago leeriifreshwater prawn (Macrobrachium rosenbergii)
4
Oreochromisesculentus and O. variabilis) are found in the Yala swamp in Kenya and are used to meet the
species threatens the freshwater swamps in Irrawady, Myanmar.1
chemicals to capture either live or
peatlands and marshes.
Non timber forest products Lepironia articulata
baskets, mats, hats and sacks.
Forested swamps, marshes and peatlands are
fodder for animals.
Viewed conventionally as wastelands, a vast number of swamps, marshes and peatlands have been destroyed and converted to agricultural lands for their nutrient rich fertile soil. In Indonesia, peat swamps forests are being cleared for timber plantations and cultivation of oil palm and other commercial crops.10
industry in Europe.11
clearance of peatland for agriculture destroy peat, release stored carbon
global warming. They eliminate seed banks and destroy soil. All of this may take thousands of years to be replaced naturally.12
Medicine Medicinal plants obtained from the east Kalimantan peat swamp forest have an economic
Indigenous tribes in the peat swamps of east Kalimantan rely on traditional herbs such as Kacip Fatimah (Labisia pumila) and Tongkat Ali (Eurycoma longifolia).13
Chapeu de couro (Echinodorus macrophyllus), which is used as a diuretic14 and in Africa, Ngoka (Thomandelsia laurifolia), which is used to treat colic, fever and diarrhoea.
Viewed conventionally as wastelands, a vast number of swamps, marshes and peatlands have been destroyed and converted to agricultural lands for their nutrient rich fertile soil. In Indonesia, peat swamps forests are being cleared for timber plantations and cultivation of oil palm and other commercial crops.
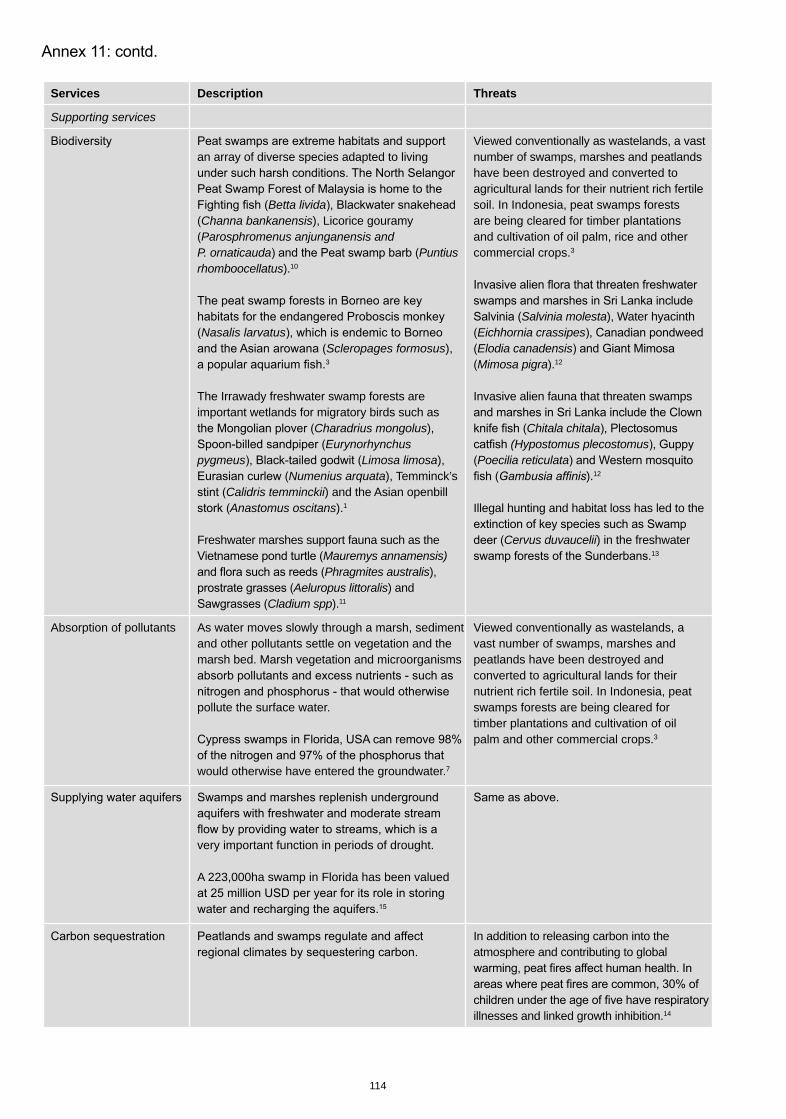
114
Services Description Threats
Supporting services
an array of diverse species adapted to living
Betta lividaChanna bankanensis), Licorice gouramy Parosphromenus anjunganensis and
P. ornaticauda Puntius rhomboocellatus).10
Nasalis larvatusScleropages formosus),3
The Irrawady freshwater swamp forests are important wetlands for migratory birds such as
Charadrius mongolus), Eurynorhynchus
pygmeus Limosa limosa), Numenius arquata), Temminck’s
Calidris temminckii) and the Asian openbill Anastomus oscitans).1
Freshwater marshes support fauna such as the Mauremys annamensis)Phragmites australis),
Aeluropus littoralis) and Cladium spp).11
Viewed conventionally as wastelands, a vast number of swamps, marshes and peatlands have been destroyed and converted to agricultural lands for their nutrient rich fertile soil. In Indonesia, peat swamps forests are being cleared for timber plantations and cultivation of oil palm, rice and other commercial crops.3
Salvinia molesta), Water hyacinth Eichhornia crassipesElodia canadensisMimosa pigra).12
Invasive alien fauna that threaten swamps
Chitala chitala(Hypostomus plecostomus
Poecilia reticulata).12
Illegal hunting and habitat loss has led to the
Cervus duvaucelii) in the freshwater 13
Absorption of pollutants As water moves slowly through a marsh, sediment and other pollutants settle on vegetation and the marsh bed. Marsh vegetation and microorganisms
pollute the surface water.
would otherwise have entered the groundwater.7
Viewed conventionally as wastelands, a vast number of swamps, marshes and peatlands have been destroyed and converted to agricultural lands for their nutrient rich fertile soil. In Indonesia, peat swamps forests are being cleared for timber plantations and cultivation of oil palm and other commercial crops.3
very important function in periods of drought.
A 223,000ha swamp in Florida has been valued
In addition to releasing carbon into the atmosphere and contributing to global
illnesses and linked growth inhibition.14
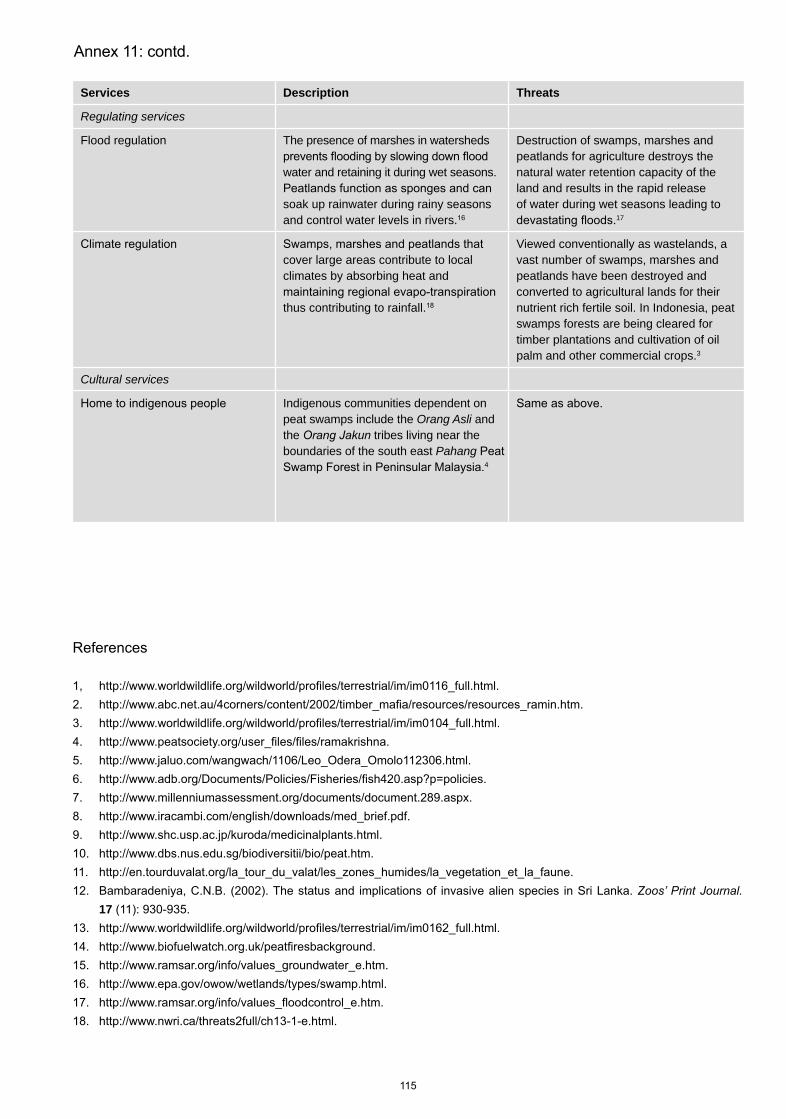
Services Description Threats
Regulating services
Flood regulation The presence of marshes in watersheds
water and retaining it during wet seasons.
soak up rainwater during rainy seasons and control water levels in rivers.
Destruction of swamps, marshes and peatlands for agriculture destroys the natural water retention capacity of the land and results in the rapid release of water during wet seasons leading to
17
cover large areas contribute to local climates by absorbing heat and
thus contributing to rainfall.
Viewed conventionally as wastelands, a vast number of swamps, marshes and peatlands have been destroyed and converted to agricultural lands for their nutrient rich fertile soil. In Indonesia, peat swamps forests are being cleared for timber plantations and cultivation of oil palm and other commercial crops.3
Cultural services
Indigenous communities dependent on peat swamps include the Orang Asli and the tribes living near the boundaries of the south east Pahang
4
17
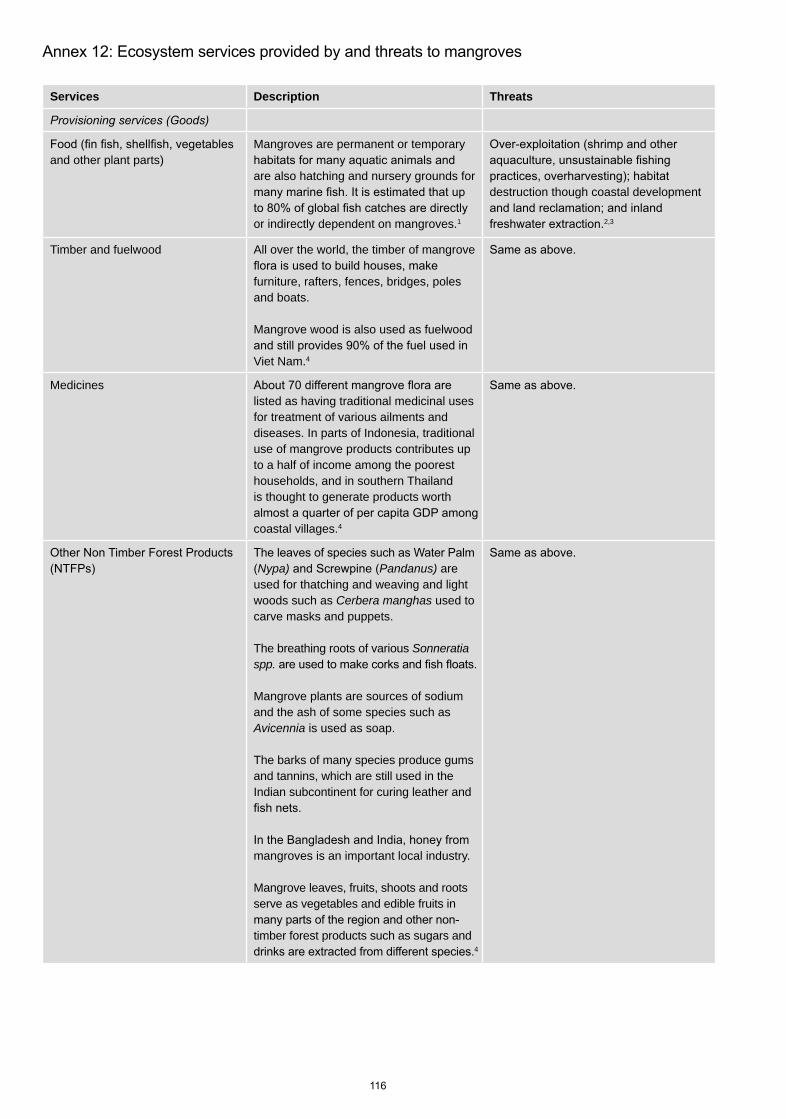
Services Description Threats
and other plant parts)Mangroves are permanent or temporary
are also hatching and nursery grounds for
or indirectly dependent on mangroves.1
destruction though coastal development
2,3
Timber and fuelwood All over the world, the timber of mangrove
furniture, rafters, fences, bridges, poles and boats.
Mangrove wood is also used as fuelwood
Viet Nam.4
Medicineslisted as having traditional medicinal uses for treatment of various ailments and diseases. In parts of Indonesia, traditional use of mangrove products contributes up to a half of income among the poorest households, and in southern Thailand is thought to generate products worth
coastal villages.4
Nypa) Pandanus) are used for thatching and weaving and light woods such as Cerbera manghas used to carve masks and puppets.
The breathing roots of various Sonneratia spp.
Mangrove plants are sources of sodium and the ash of some species such as Avicennia is used as soap.
The barks of many species produce gums and tannins, which are still used in the Indian subcontinent for curing leather and
mangroves is an important local industry.
Mangrove leaves, fruits, shoots and roots serve as vegetables and edible fruits in
timber forest products such as sugars and 4
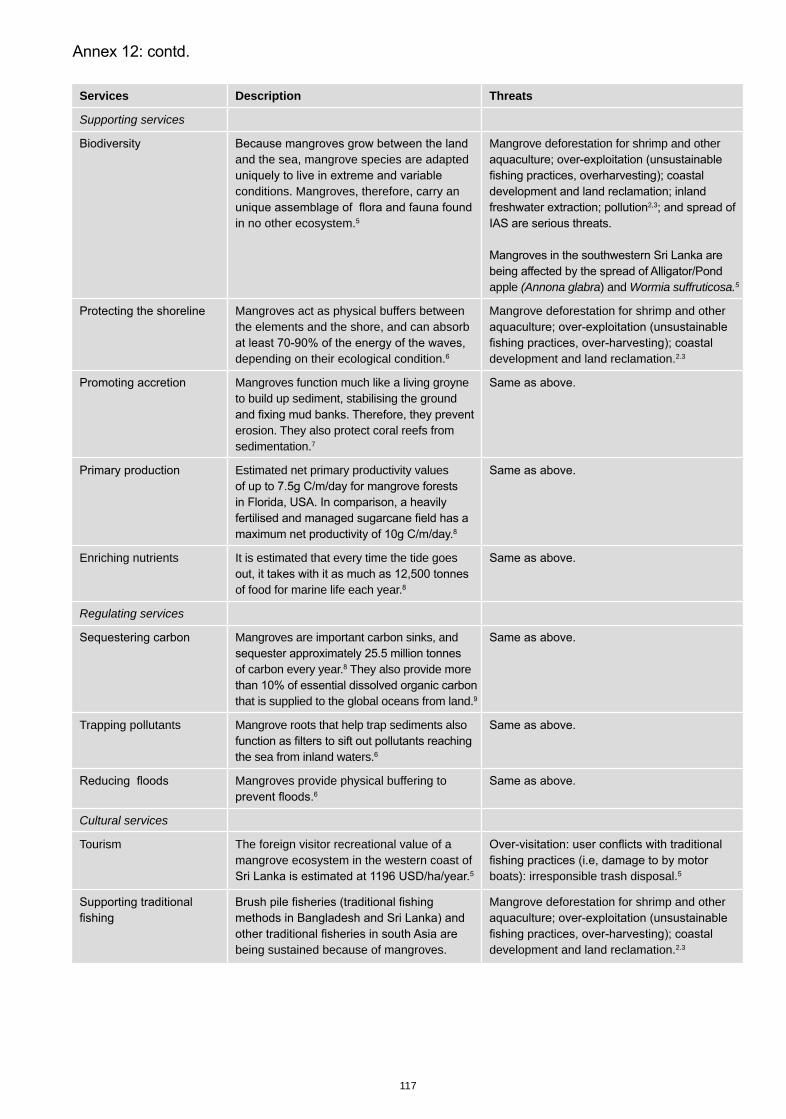
117
Services Description Threats
Supporting services
and the sea, mangrove species are adapted
conditions. Mangroves, therefore, carry an
in no other ecosystem.
Mangrove deforestation for shrimp and other
2,3
apple (Annona glabra) and Wormia suffruticosa.5
Mangroves act as physical buffers between the elements and the shore, and can absorb
depending on their ecological condition.
Mangrove deforestation for shrimp and other
development and land reclamation.2.3
Mangroves function much like a living groyne to build up sediment, stabilising the ground
erosion. They also protect coral reefs from sedimentation.7
Estimated net primary productivity values
Enriching nutrients It is estimated that every time the tide goes
of food for marine life each year.
Regulating services
Mangroves are important carbon sinks, and
of carbon every year. They also provide more
that is supplied to the global oceans from land.
Trapping pollutants Mangrove roots that help trap sediments also
the sea from inland waters.
Mangroves provide physical buffering to
Cultural services
Tourism The foreign visitor recreational value of a mangrove ecosystem in the western coast of
boats): irresponsible trash disposal.
being sustained because of mangroves.
Mangrove deforestation for shrimp and other
development and land reclamation.2.3
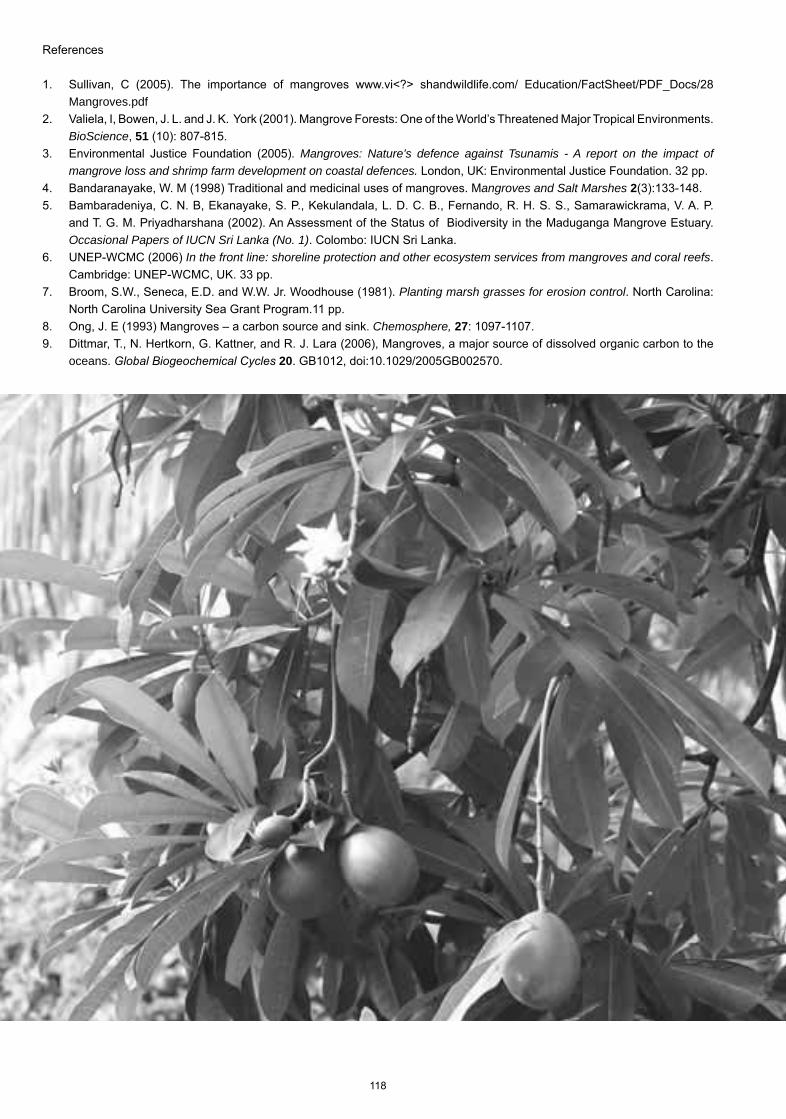
Mangroves.pdf
BioScience, 51
Mangroves: Nature’s defence against Tsunamis - A report on the impact of mangrove loss and shrimp farm development on coastal defences.
angroves and Salt Marshes 2
Occasional Papers of IUCN Sri Lanka (No. 1)In the front line: shoreline protection and other ecosystem services from mangroves and coral reefs.
Planting marsh grasses for erosion control
Chemosphere, 27
oceans. 20
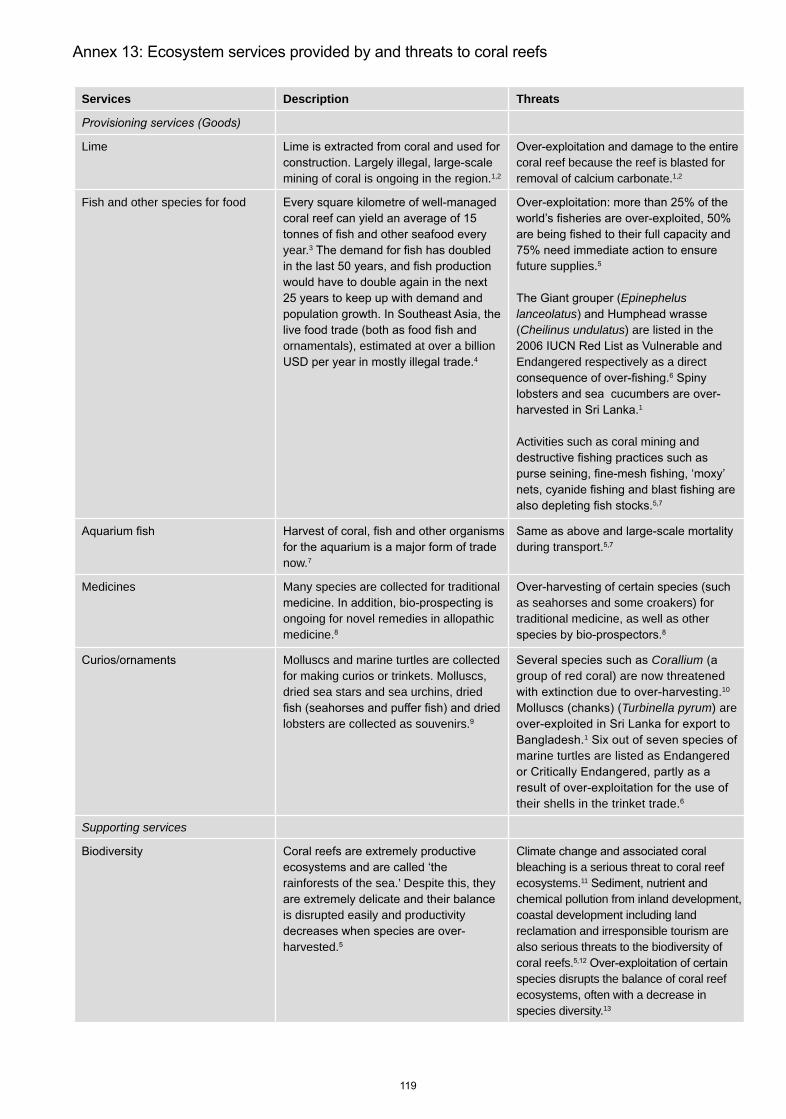
Services Description Threats
Lime
mining of coral is ongoing in the region.1,2
coral reef because the reef is blasted for removal of calcium carbonate.1,2
Fish and other species for food
year.3
ornamentals), estimated at over a billion 4
future supplies.
EpinepheluslanceolatusCheilinus undulatus) are listed in the
Endangered respectively as a direct
1
Activities such as coral mining and
now.7
during transport.
Medicines Many species are collected for traditional
ongoing for novel remedies in allopathic medicine.
as seahorses and some croakers) for traditional medicine, as well as other
Molluscs and marine turtles are collected for making curios or trinkets. Molluscs, dried sea stars and sea urchins, dried
lobsters are collected as souvenirs.
Coralliumgroup of red coral) are now threatened
10
Turbinella pyrum) are
1
marine turtles are listed as Endangered
their shells in the trinket trade.
Supporting services
rainforests of the sea.’ Despite this, they
is disrupted easily and productivity
harvested.
bleaching is a serious threat to coral reef ecosystems.11
chemical pollution from inland development, coastal development including land reclamation and irresponsible tourism are also serious threats to the biodiversity of coral reefs.species disrupts the balance of coral reef ecosystems, often with a decrease in species diversity.13
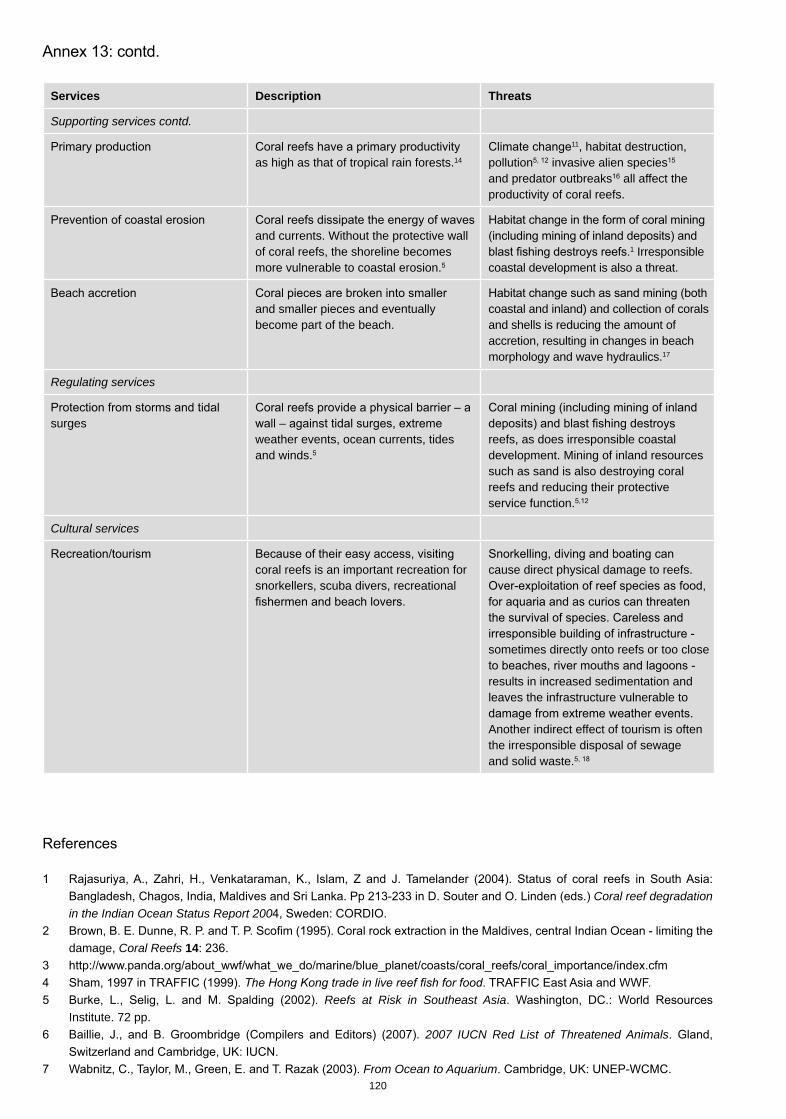
120
Services Description Threats
Supporting services contd.
as high as that of tropical rain forests.14
11, habitat destruction, pollution invasive alien speciesand predator outbreaks all affect the productivity of coral reefs.
and currents. Without the protective wall of coral reefs, the shoreline becomes more vulnerable to coastal erosion.
1 Irresponsible coastal development is also a threat.
and smaller pieces and eventually become part of the beach.
coastal and inland) and collection of corals and shells is reducing the amount of accretion, resulting in changes in beach morphology and wave hydraulics.17
Regulating services
surgesweather events, ocean currents, tides and winds.
reefs, as does irresponsible coastal development. Mining of inland resources such as sand is also destroying coral reefs and reducing their protective service function.
Cultural services
coral reefs is an important recreation for snorkellers, scuba divers, recreational
cause direct physical damage to reefs.
sometimes directly onto reefs or too close
results in increased sedimentation and leaves the infrastructure vulnerable to
Another indirect effect of tourism is often the irresponsible disposal of sewage and solid waste.
Coral reef degradation in the Indian Ocean Status Report 200
damage, Coral Reefs 14
Reefs at Risk in Southeast AsiaInstitute. 72 pp.
2007 IUCN Red List of Threatened Animals
From Ocean to Aquarium
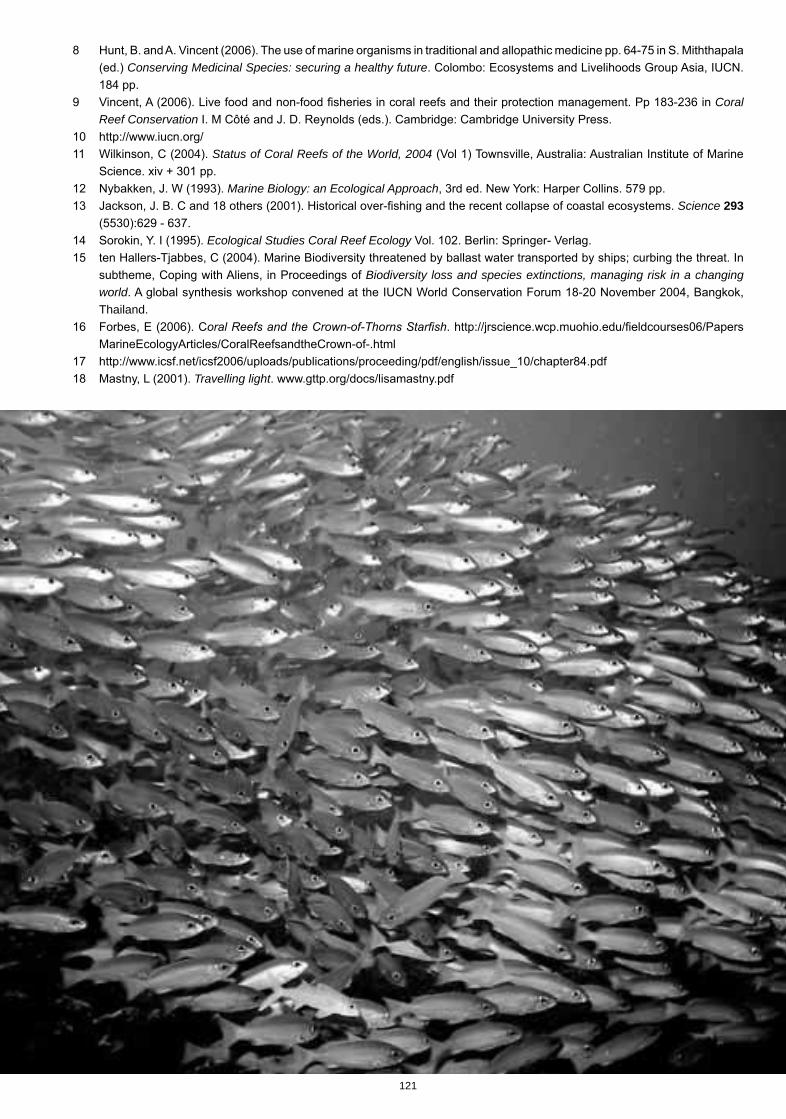
121
Conserving Medicinal Species: securing a healthy future
CoralReef Conservation
Status of Coral Reefs of the World, 2004
Marine Biology: an Ecological ApproachScience 293
Ecological Studies Coral Reef Ecology
Biodiversity loss and species extinctions, managing risk in a changing worldThailand.
Travelling light
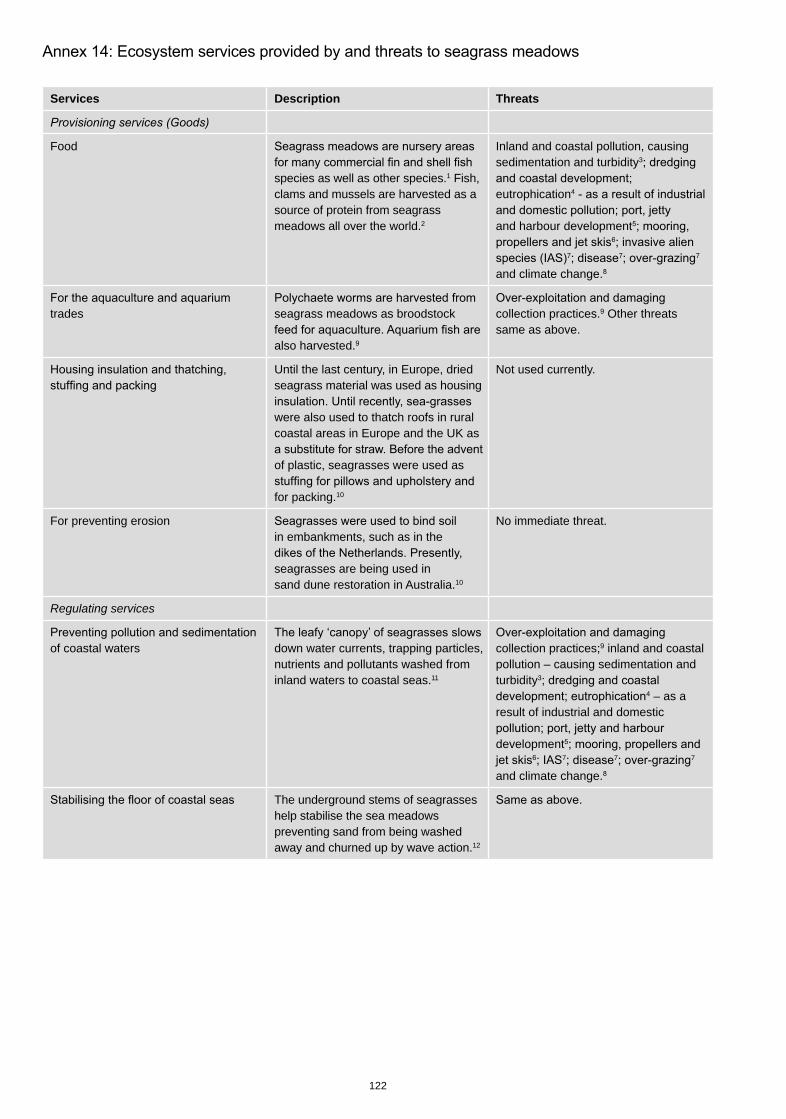
122
Services Description Threats
Food
species as well as other species.1 Fish, clams and mussels are harvested as a source of protein from seagrass meadows all over the world.2
Inland and coastal pollution, causing sedimentation and turbidity3
eutrophication4
and harbour development
7 7 7
and climate change.
trades seagrass meadows as broodstock
also harvested.
collection practices. Other threats same as above.
Until the last century, in Europe, dried seagrass material was used as housing
were also used to thatch roofs in rural coastal areas in Europe and the UK as
of plastic, seagrasses were used as
for packing.10
Not used currently.
For preventing erosionin embankments, such as in the
seagrasses are being used in sand dune restoration in Australia.10
No immediate threat.
Regulating services
of coastal waters down water currents, trapping particles, nutrients and pollutants washed from inland waters to coastal seas.11
collection practices inland and coastal pollution – causing sedimentation and turbidity3
4 – as a result of industrial and domestic
development7 7 7
and climate change.
The underground stems of seagrasses help stabilise the sea meadows preventing sand from being washed away and churned up by wave action.12
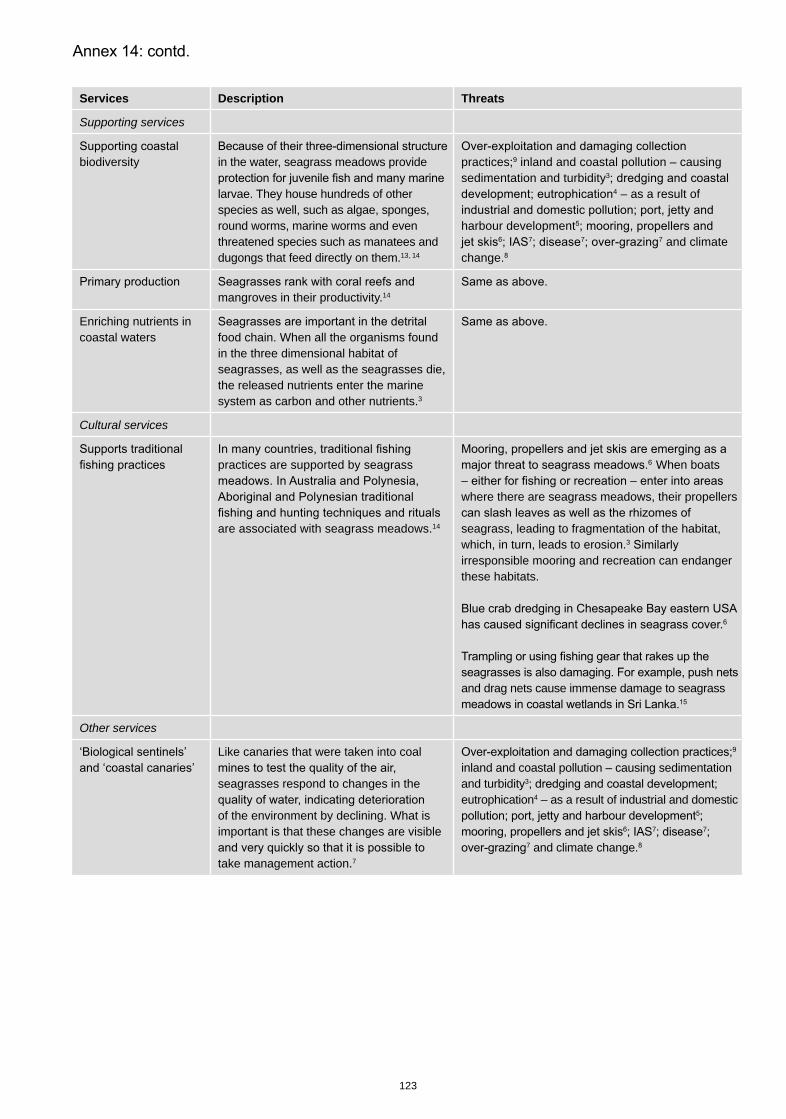
123
Services Description Threats
Supporting services
biodiversity in the water, seagrass meadows provide
larvae. They house hundreds of other species as well, such as algae, sponges, round worms, marine worms and even threatened species such as manatees and dugongs that feed directly on them.13, 14
practices inland and coastal pollution – causing sedimentation and turbidity3
4 – as a result of
harbour development7 7 7 and climate
change.
mangroves in their productivity.14
Enriching nutrients in coastal waters food chain. When all the organisms found
in the three dimensional habitat of seagrasses, as well as the seagrasses die, the released nutrients enter the marine system as carbon and other nutrients.3
Cultural services
practices are supported by seagrass
are associated with seagrass meadows.14
When boats
where there are seagrass meadows, their propellers
seagrass, leading to fragmentation of the habitat, which, in turn, leads to erosion.3
irresponsible mooring and recreation can endanger these habitats.
and drag nets cause immense damage to seagrass
Other services
Like canaries that were taken into coal
seagrasses respond to changes in the
of the environment by declining. What is important is that these changes are visible
take management action.7
inland and coastal pollution – causing sedimentation and turbidity3
eutrophication4 – as a result of industrial and domestic
7 7
7 and climate change.
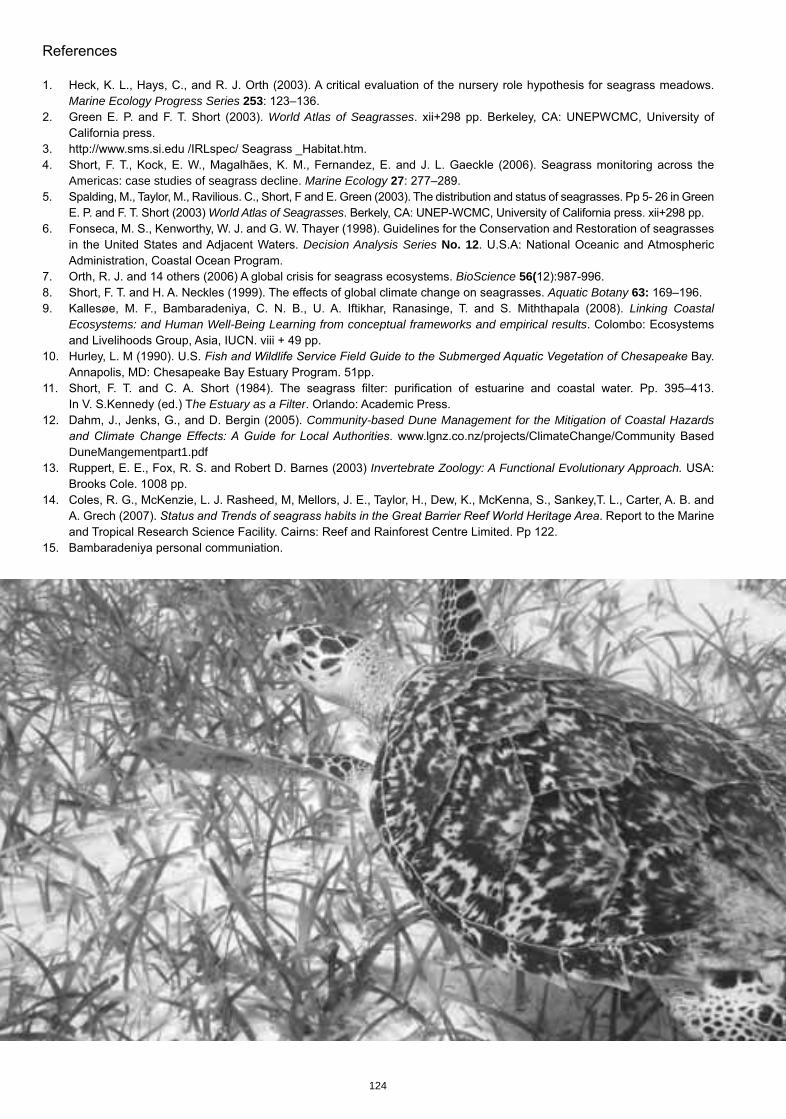
124
Marine Ecology Progress Series 253
World Atlas of Seagrasses
Americas: case studies of seagrass decline. Marine Ecology 27
World Atlas of Seagrasses
Decision Analysis Series No. 12
BioScience 56(
Aquatic Botany 63:
Linking Coastal Ecosystems: and Human Well-Being Learning from conceptual frameworks and empirical results
he Estuary as a FilterCommunity-based Dune Management for the Mitigation of Coastal Hazards
DuneMangementpart1.pdfInvertebrate Zoology: A Functional Evolutionary Approach.
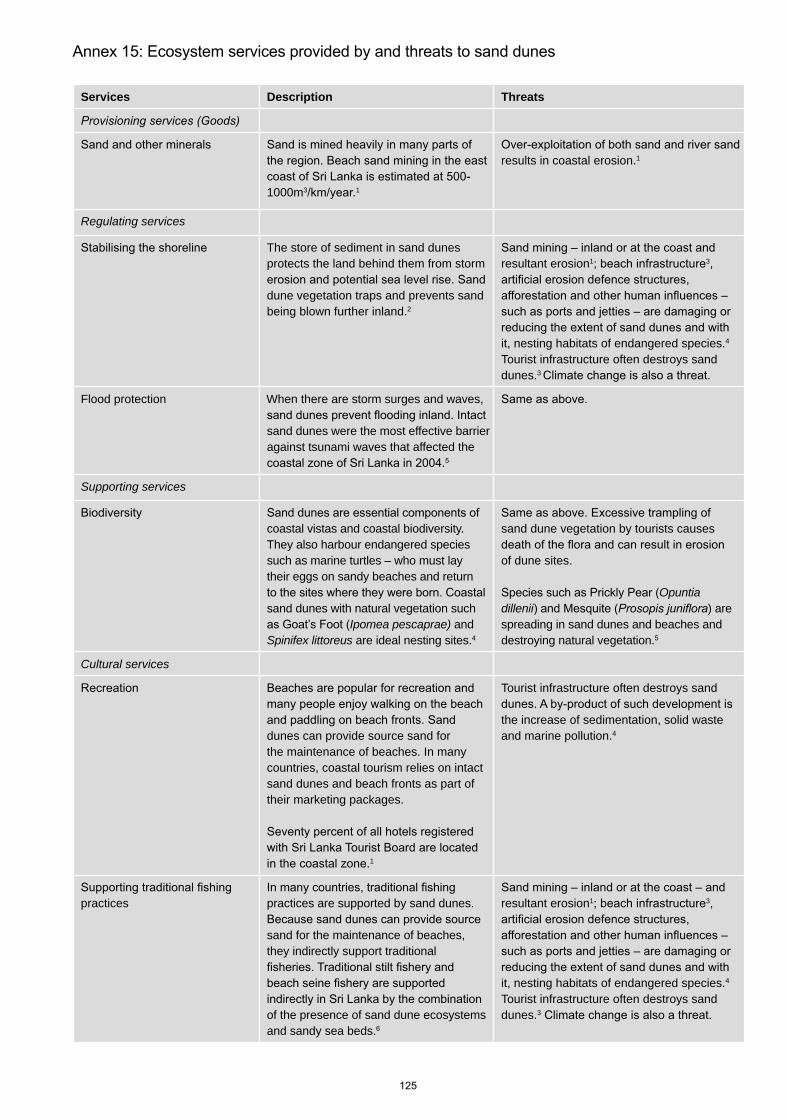
Services Description Threats
1000m3 1
results in coastal erosion.1
Regulating services
The store of sediment in sand dunes protects the land behind them from storm
dune vegetation traps and prevents sand being blown further inland.2
resultant erosion1 3,
it, nesting habitats of endangered species.4
Tourist infrastructure often destroys sand dunes.3
Flood protection When there are storm surges and waves,
sand dunes were the most effective barrier against tsunami waves that affected the
Supporting services
coastal vistas and coastal biodiversity. They also harbour endangered species such as marine turtles – who must lay their eggs on sandy beaches and return
sand dunes with natural vegetation such Ipomea pescaprae) and
Spinifex littoreus are ideal nesting sites.4
sand dune vegetation by tourists causes
of dune sites.
Opuntia dillenii ) are spreading in sand dunes and beaches and destroying natural vegetation.
Cultural services
dunes can provide source sand for the maintenance of beaches. In many countries, coastal tourism relies on intact sand dunes and beach fronts as part of their marketing packages.
1
Tourist infrastructure often destroys sand
the increase of sedimentation, solid waste and marine pollution.4
practices practices are supported by sand dunes.
sand for the maintenance of beaches, they indirectly support traditional
of the presence of sand dune ecosystems and sandy sea beds.
resultant erosion1 3,
it, nesting habitats of endangered species.4
Tourist infrastructure often destroys sand dunes.3
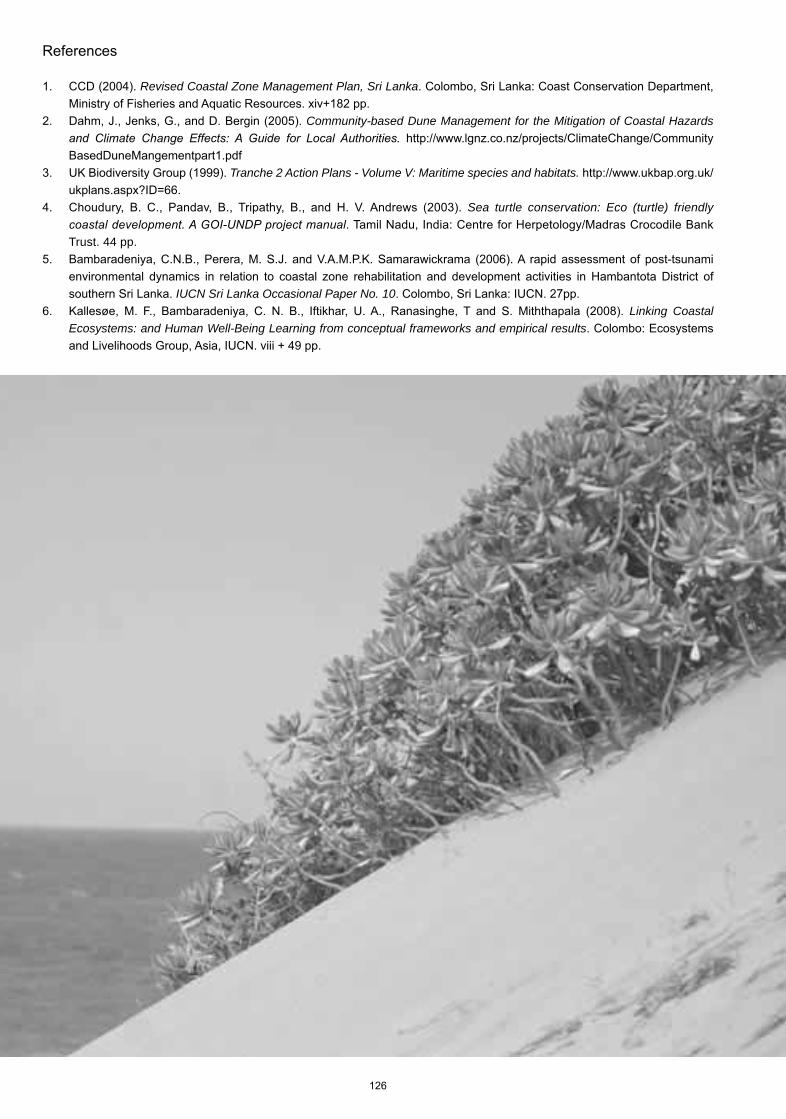
Revised Coastal Zone Management Plan, Sri Lanka
Community-based Dune Management for the Mitigation of Coastal Hazards
Tranche 2 Action Plans - Volume V: Maritime species and habitats.
Sea turtle conservation: Eco (turtle) friendly
Trust. 44 pp.
IUCN Sri Lanka Occasional Paper No. 10Linking Coastal
Ecosystems: and Human Well-Being Learning from conceptual frameworks and empirical results
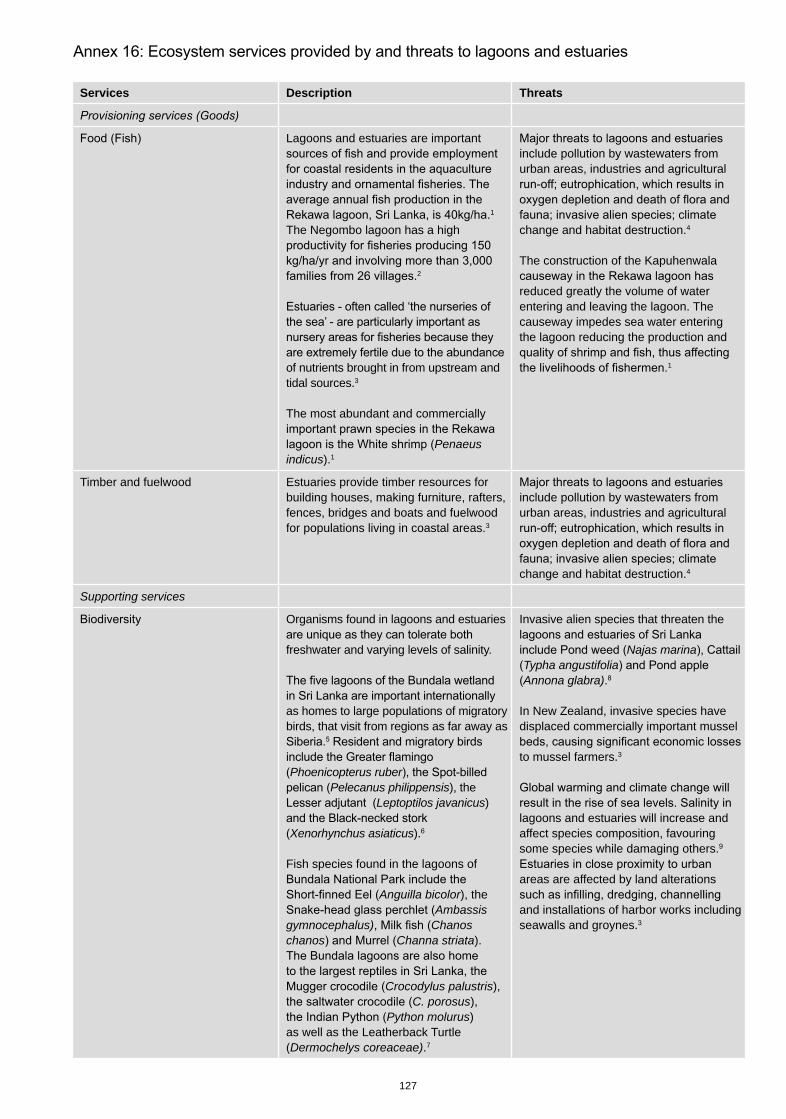
127
Services Description Threats
Lagoons and estuaries are important
1
The Negombo lagoon has a high
2
of nutrients brought in from upstream and tidal sources.3
The most abundant and commercially
Penaeusindicus).1
include pollution by wastewaters from urban areas, industries and agricultural
change and habitat destruction.4
The construction of the Kapuhenwala
reduced greatly the volume of water entering and leaving the lagoon. The causeway impedes sea water entering the lagoon reducing the production and
1
Timber and fuelwood Estuaries provide timber resources for building houses, making furniture, rafters, fences, bridges and boats and fuelwood for populations living in coastal areas.3
include pollution by wastewaters from urban areas, industries and agricultural
change and habitat destruction.4
Supporting services
Organisms found in lagoons and estuaries
freshwater and varying levels of salinity.
as homes to large populations of migratory birds, that visit from regions as far away as
Phoenicopterus ruberPelecanus philippensis), the
Leptoptilos javanicus)
Xenorhynchus asiaticus).
Fish species found in the lagoons of
Anguilla bicolor), the Ambassis
gymnocephalus) Chanoschanos Channa striata).
Crocodylus palustris),C. porosus),
Python molurus)as well as the Leatherback Turtle Dermochelys coreaceae).7
Invasive alien species that threaten the
Najas marinaTypha angustifoliaAnnona glabra).
In New Zealand, invasive species have displaced commercially important mussel
to mussel farmers.3
lagoons and estuaries will increase and affect species composition, favouring some species while damaging others.
areas are affected by land alterations
and installations of harbor works including seawalls and groynes.3
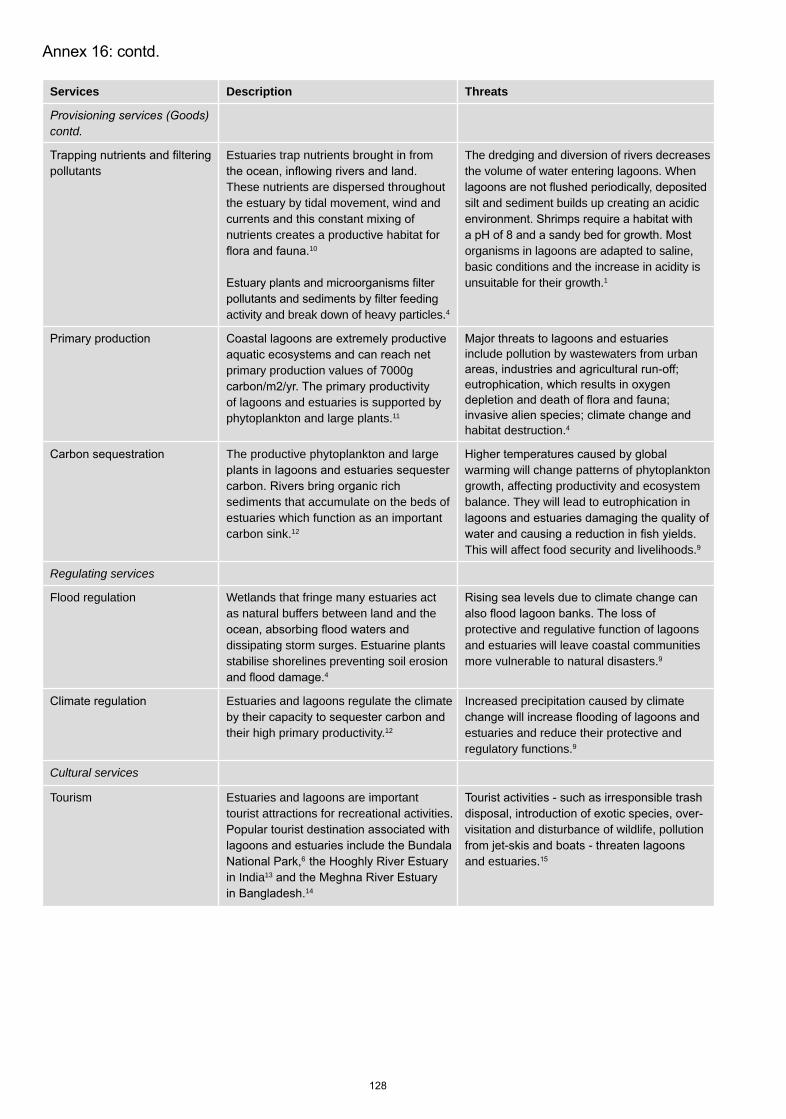
Services Description Threats
contd.
pollutantsEstuaries trap nutrients brought in from
These nutrients are dispersed throughout the estuary by tidal movement, wind and
nutrients creates a productive habitat for 10
activity and break down of heavy particles.4
The dredging and diversion of rivers decreases the volume of water entering lagoons. When
silt and sediment builds up creating an acidic
organisms in lagoons are adapted to saline, basic conditions and the increase in acidity is unsuitable for their growth.1
primary production values of 7000g
of lagoons and estuaries is supported by phytoplankton and large plants.11
include pollution by wastewaters from urban
habitat destruction.4
The productive phytoplankton and large
sediments that accumulate on the beds of estuaries which function as an important carbon sink.12
warming will change patterns of phytoplankton growth, affecting productivity and ecosystem balance. They will lead to eutrophication in
This will affect food security and livelihoods.
Regulating services
Flood regulation Wetlands that fringe many estuaries act as natural buffers between land and the
dissipating storm surges. Estuarine plants stabilise shorelines preventing soil erosion
4
protective and regulative function of lagoons and estuaries will leave coastal communities more vulnerable to natural disasters.
Estuaries and lagoons regulate the climate
their high primary productivity.12
Increased precipitation caused by climate
estuaries and reduce their protective and regulatory functions.
Cultural services
Tourism Estuaries and lagoons are important tourist attractions for recreational activities.
in India13
14
visitation and disturbance of wildlife, pollution
and estuaries.
17
Catena 57
130
Page
number
Caption Credit
Frontpiece
© Vimukthi Weeratunge
4
7
Pistia stratiotes ©
11 Nypa
12 © Vimukthi Weeratunge
14
© Vimukthi Weeratunge
© Eric Wikramanyake
17
Tropical coniferous forest, Nepal. © Eric Wikramanyake
21 © Eric Wikramanyake
24 © Vimukthi Weeratunge
27 Corallium
© Vimukthi Weeratunge
30
31 © Thushan Kapurusinghe
33
Opuntia dillenii
34
Dried lava from a volcano forming a mountain, Yogyakarta, Indonesia.
tsunami, Thailand.
endemic to the rainforests of Indonesia and insular Malaysia.© Karl Lehmann
Ceratophora stoddartii),endemic to montane
Panthera pardus kotiya
Asiatic black bear (Ursus thibetanus) threatened by trade for its gall bladder
100 Ochotona curzoniae
112
Cerbera mangus
121
124 Eretmochelys imbricata).


Ecosystems and Livelihoods Group Asia
IUCN 4/1 Adams Avenue
Colombo 4 Sri Lanka
Phone: + 94 11 2559634 Fax: +94 11- 2559637
E-mail: [email protected]://data.iucn.org/places/asia/coastalinfo/
© 2008 IUCN, International Union for Conservation of Nature and Natural Resources
Opinions expressed in this paper do not necessarily reflect the official views of IUCN or its members.
The IUCN Asia region covers 23 countries, stretching from Pakistan in the West to Japan in the East, Indonesia in the South to Mongolia in the North. IUCN maintains offices in Bangladesh, Cambodia, China, Lao PDR, Nepal, Pakistan, Sri Lanka, Thailand and Viet Nam. The Asia Regional Office is in Bangkok, Thailand.
IUCN’s seven regional thematic programmes, known collectively as the Ecosystems and Livelihoods Group (ELG), are based in two clusters: one in Colombo, Sri Lanka (environmental economics, marine and coastal, species conservation), and one in Bangkok, Thailand (environmental law, forests, protected areas, wetlands and water resources).
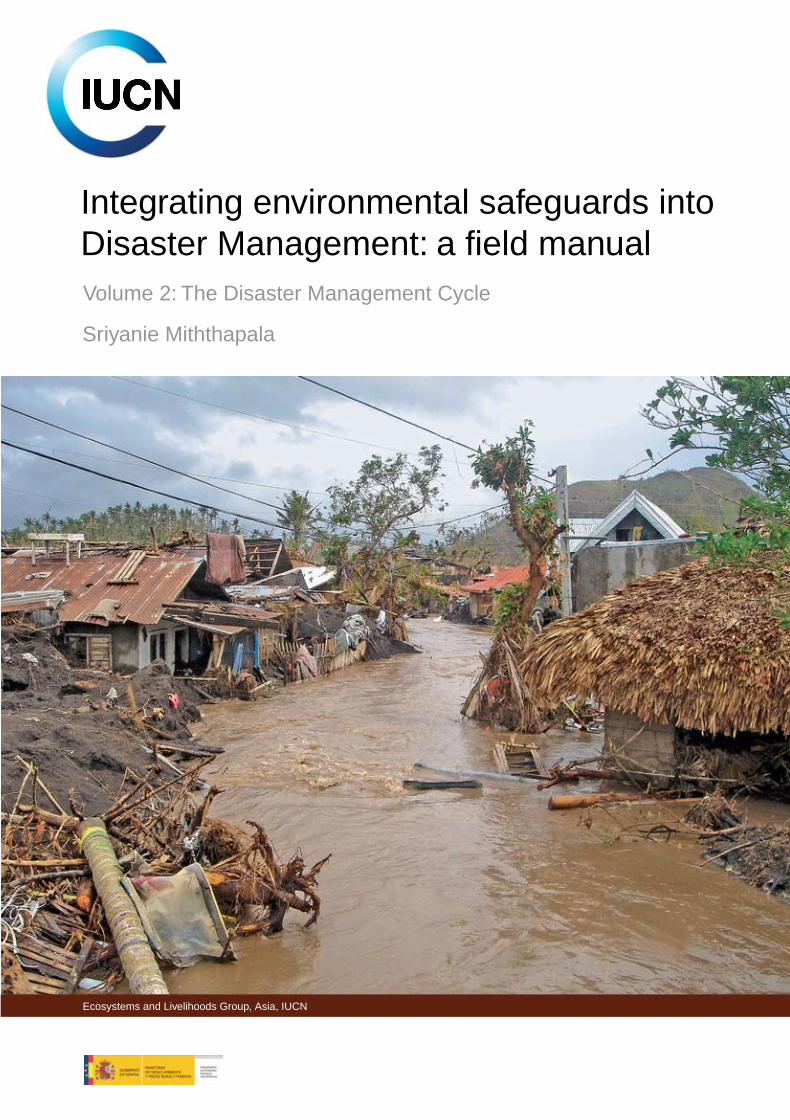
Integrating environmental safeguards into Disaster Management: a field manual
Sriyanie Miththapala
Volume 2: The Disaster Management Cycle
Ecosystems and Livelihoods Group Asia
IUCN 4/1 Adams Avenue
Colombo 4 Sri Lanka
Phone: + 94 11 2559634 Fax: +94 11- 2559637
E-mail: [email protected]://data.iucn.org/places/asia/coastalinfo/
© 2008 IUCN, International Union for Conservation of Nature and Natural Resources
Opinions expressed in this paper do not necessarily reflect the official views of IUCN or its members.
The IUCN Asia region covers 23 countries, stretching from Pakistan in the West to Japan in the East, Indonesia in the South to Mongolia in the North. IUCN maintains offices in Bangladesh, Cambodia, China, Lao PDR, Nepal, Pakistan, Sri Lanka, Thailand and Viet Nam. The Asia Regional Office is in Bangkok, Thailand.
IUCN’s seven regional thematic programmes, known collectively as the Ecosystems and Livelihoods Group (ELG), are based in two clusters: one in Colombo, Sri Lanka (environmental economics, marine and coastal, species conservation), and one in Bangkok, Thailand (environmental law, forests, protected areas, wetlands and water resources).
Ecosystems and Livelihoods Group, Asia, IUCN
9698
- I
UC
N B
ook
(Dis
aste
r M
anag
emen
t V
ol.
2) 1
75#
10/3
/200
9

Integrating environmental safeguards into Disaster Management: a field manualVolume 2: The Disaster Management Cycle
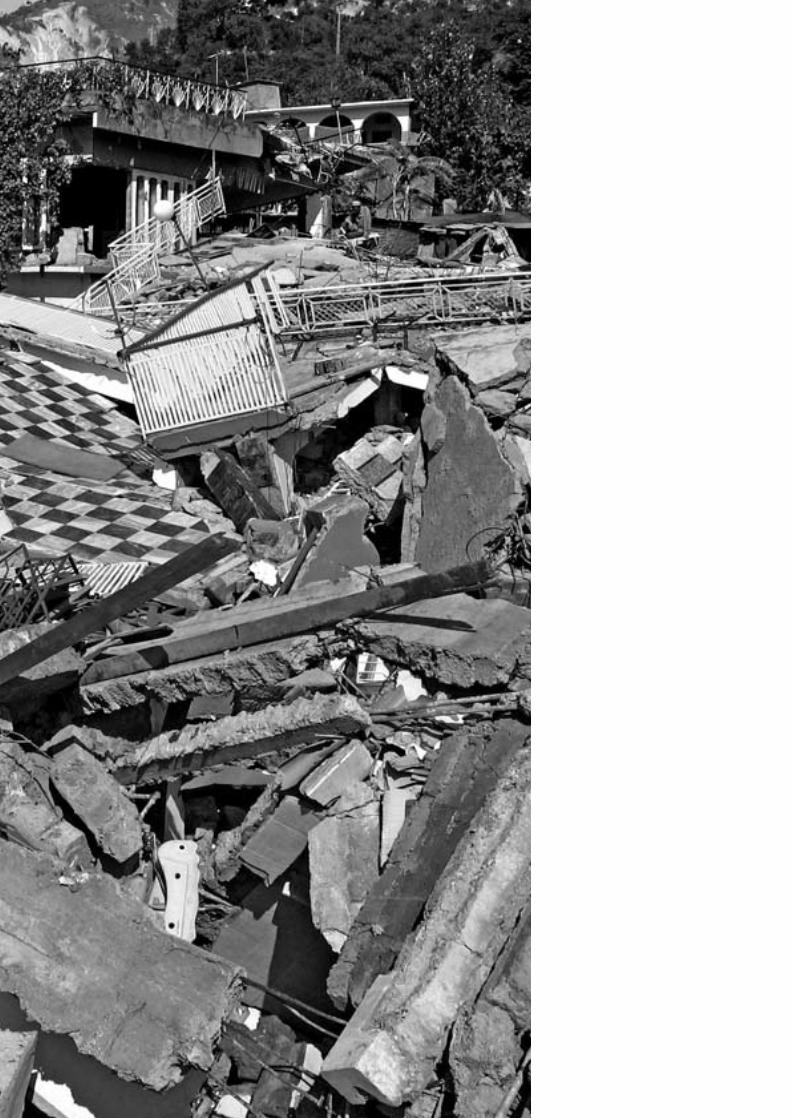

i
Integrating environmental safeguards into Disaster Management: a field manual
Sriyanie Miththapala
Volume 2: The Disaster Management Cycle
Ecosystems and Livelihoods Group, Asia, IUCN
ii
This document was produced under the project ‘Rehabilitating coastal ecosystems in a post-tsunami context: Consolidation Phase’ carried out with financial support from the Autonomous Organisation for National Parks (Organismo Autónomo Parques Nacionales - OAPN) of the Ministry of Environment of Spain. The designation of geographical entities in this technical report, and the presentation of the material, do not imply the expression of any opinion whatsoever on the part of IUCN or OAPN concerning the legal status of any country, territory, or area, or of its authorities, or concerning the delimitation of its frontiers or boundaries. The views expressed in this publication do not necessarily reflect those of IUCN or OAPN.
Published by: Ecosystems and Livelihoods Group Asia, IUCN, International Union for Conservation of Nature and Natural Resources.
Copyright: © 2008, International Union for Conservation of Nature and Natural Resources.
Citation: Miththapala S (2008). Incorporating environmental safeguards into disaster risk management. Volume 2: The Disaster Management Cycle. Colombo: Ecosystems and Livelihoods Group, Asia, IUCN. viii+43 pp.
Reproduction of this publication for educational or other non-commercial purposes is authorized without prior written permission from the copyright holder provided the source is fully acknowledged.
Reproduction of this publication for resale or other commercial purposes is prohibited without prior written permission of the copyright holder.
ISBN: 987-955-8177-87-7 Cover Photo: Aftermath of typhoon Reming, Albay, Philippines © Efren E. Mariano, CARE
Design: Sriyanie Miththapala
Produced by: Ecosystems and Livelihoods Group Asia, IUCN.
Printed by: Karunaratne & Sons (Pvt) Ltd. 67 UDA Industrial Estate Katuwana Road Homagama [email protected]
Available from: Ecosystems and Livelihoods Group, Asia IUCN 4/1, Adams Avenue Colombo 4 Sri Lanka Phone: +(9411) 255 9634-5 Fax: +(9411) 255 9637 email: [email protected] website: http://data.iucn.org/places/asia/coastalinfo/
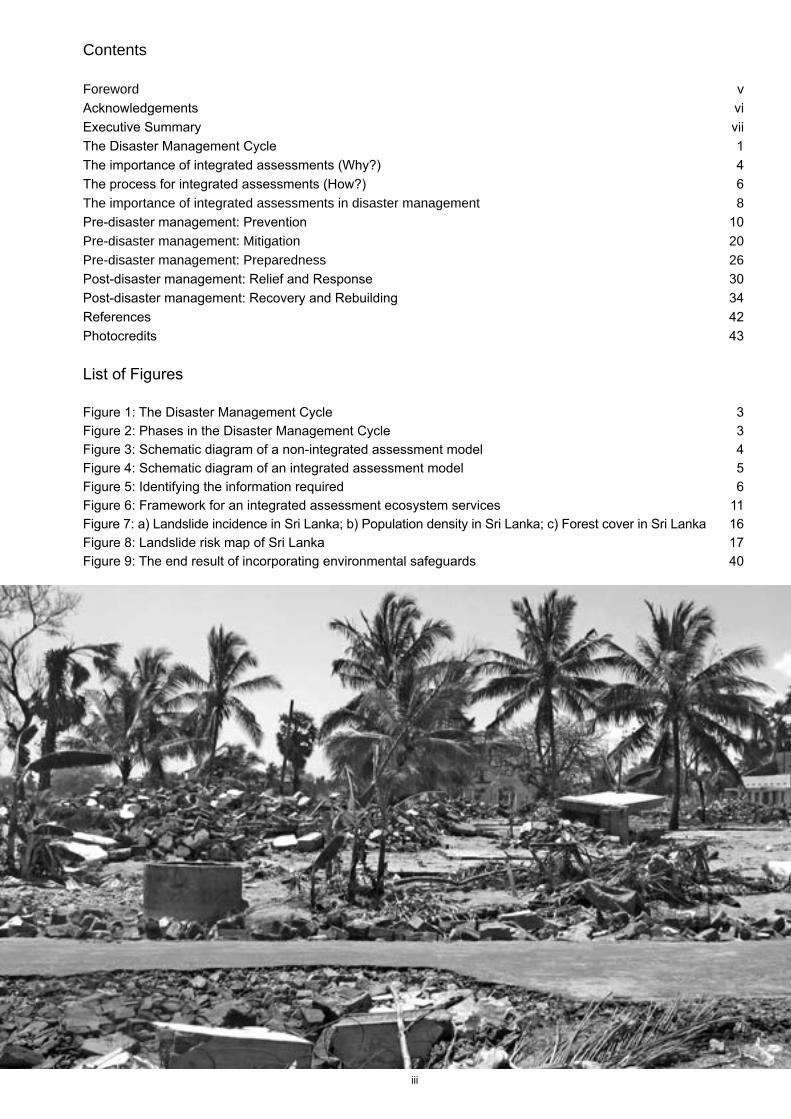
iii
Contents
Foreword vAcknowledgements viExecutive Summary viiThe Disaster Management Cycle 1The importance of integrated assessments (Why?) 4The process for integrated assessments (How?) 6The importance of integrated assessments in disaster management 8Pre-disaster management: Prevention 10Pre-disaster management: Mitigation 20Pre-disaster management: Preparedness 26Post-disaster management: Relief and Response 30Post-disaster management: Recovery and Rebuilding 34References 42Photocredits 43
List of Figures
Figure 1: The Disaster Management Cycle 3Figure 2: Phases in the Disaster Management Cycle 3Figure 3: Schematic diagram of a non-integrated assessment model 4Figure 4: Schematic diagram of an integrated assessment model 5Figure 5: Identifying the information required 6Figure 6: Framework for an integrated assessment ecosystem services 11Figure 7: a) Landslide incidence in Sri Lanka; b) Population density in Sri Lanka; c) Forest cover in Sri Lanka 16Figure 8: Landslide risk map of Sri Lanka 17Figure 9: The end result of incorporating environmental safeguards 40
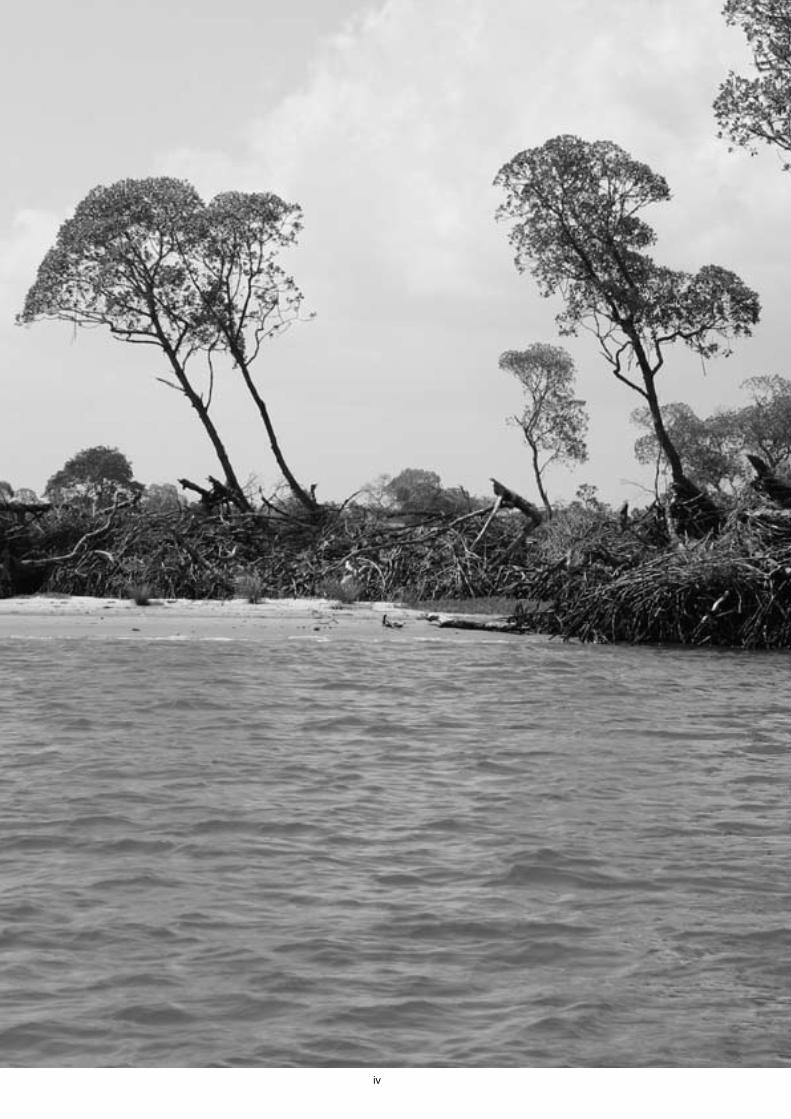
iv
v
Foreword
The devastation caused by the 2004 Asian tsunami and the subsequent world response were unprecedented. IUCN acted promptly and undertook many initiatives to combat the destruction of local ecosystems. IUCN Asia led this process and many of its country offices and programmes played their due role. Since then, the Ecosys-tems and Livelihoods Group of IUCN Asia, based in Colombo, has continued to play an important role in the post-tsunami scenario. The interventions have now evolved from emergency response and rapid environmental assessments to disaster risk reduction programming. Disaster risk reduction for most organisations is a relatively new area, though mainstream aid and humanitarian organisations are adept at disaster response. While most of us are working at different levels of the DRR spectrum, the objective remains a common one: ensuring human well being.
IUCN Asia is working in the DRR sector with a two-pronged approach: to infuse environmental safeguards into the mainstream disaster risk reduction programme; and to integrate disaster risk reduction into conservation and sustainable development programming.
Over the years, varied methodologies, frameworks and approaches have been used towards this end. We have had many successes and also failures in this process and keep learning and modifying our strategies. Here, the key is to continue sharing our lessons learned and helping each other in incorporating these in our respective strategies.
We are happy to share that in the course of the above process, IUCN has developed a manual, ‘Incorporating en-vironmental safeguards into disaster risk management’ through the financial support of OAPN, Ministry of Environ-ment, Spain. This manual comprises three-volumes detailing ecosystem linkage with human well-being; present-ing approaches to integrate environmental considerations into mainstream disaster management programmes; and providing tools, including worksheets, for planning and implementation of environmentally-infused disaster risk management initiatives.
In addition, we are exploring the possibilities of developing hazard-specific modules to help incorporate environ-mental safeguards into community-based disaster management initiatives aiming at enhancing community resil-ience for disaster management.
We are grateful to Dr. Sriyanie Miththapala whose dedicated research, commitment and determined efforts made it possible to produce this three-volume manual.
The manual is a working document, your comments and feedback will be received gratefully. We intend to keep working to make this as relevant, practical and user-friendly as possible. We do hope that this manual will contrib-ute positively towards achieving the main objective of all the organisations and agencies involved in this sector which is sustainable human well being.
Ali Raza RizviRegional Group HeadEcosystems and Livelihoods Group Asia, IUCNColombo, Sri Lanka
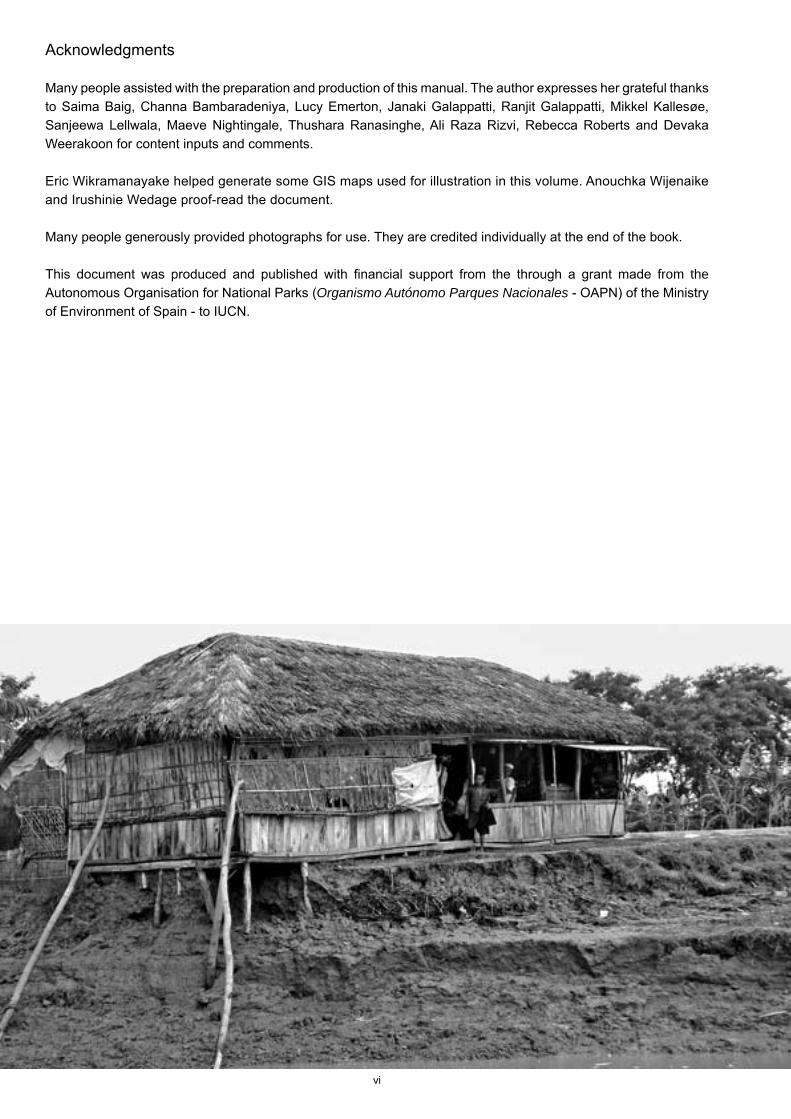
vi
Acknowledgments
Many people assisted with the preparation and production of this manual. The author expresses her grateful thanks to Saima Baig, Channa Bambaradeniya, Lucy Emerton, Janaki Galappatti, Ranjit Galappatti, Mikkel Kallesøe, Sanjeewa Lellwala, Maeve Nightingale, Thushara Ranasinghe, Ali Raza Rizvi, Rebecca Roberts and Devaka Weerakoon for content inputs and comments.
Eric Wikramanayake helped generate some GIS maps used for illustration in this volume. Anouchka Wijenaike and Irushinie Wedage proof-read the document.
Many people generously provided photographs for use. They are credited individually at the end of the book.
This document was produced and published with financial support from the through a grant made from the Autonomous Organisation for National Parks (Organismo Autónomo Parques Nacionales - OAPN) of the Ministry of Environment of Spain - to IUCN.
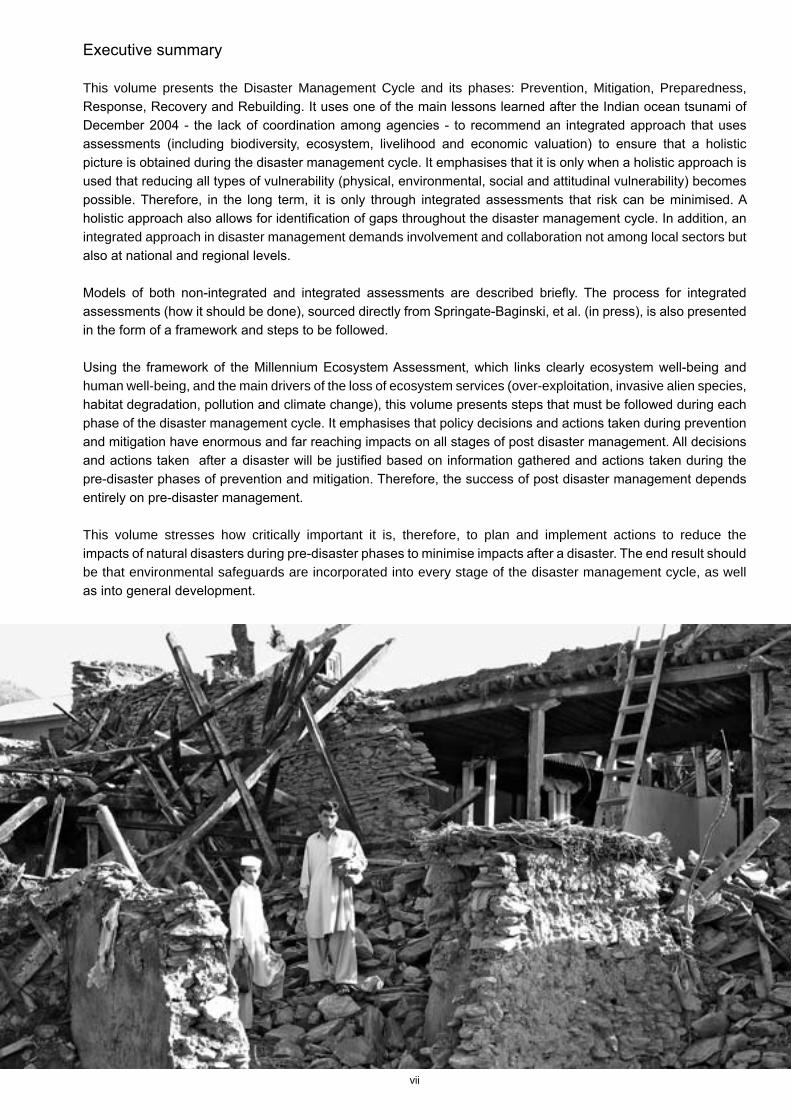
vii
Executive summary
This volume presents the Disaster Management Cycle and its phases: Prevention, Mitigation, Preparedness, Response, Recovery and Rebuilding. It uses one of the main lessons learned after the Indian ocean tsunami of December 2004 - the lack of coordination among agencies - to recommend an integrated approach that uses assessments (including biodiversity, ecosystem, livelihood and economic valuation) to ensure that a holistic picture is obtained during the disaster management cycle. It emphasises that it is only when a holistic approach is used that reducing all types of vulnerability (physical, environmental, social and attitudinal vulnerability) becomes possible. Therefore, in the long term, it is only through integrated assessments that risk can be minimised. A holistic approach also allows for identification of gaps throughout the disaster management cycle. In addition, an integrated approach in disaster management demands involvement and collaboration not among local sectors but also at national and regional levels.
Models of both non-integrated and integrated assessments are described briefly. The process for integrated assessments (how it should be done), sourced directly from Springate-Baginski, et al. (in press), is also presented in the form of a framework and steps to be followed.
Using the framework of the Millennium Ecosystem Assessment, which links clearly ecosystem well-being and human well-being, and the main drivers of the loss of ecosystem services (over-exploitation, invasive alien species, habitat degradation, pollution and climate change), this volume presents steps that must be followed during each phase of the disaster management cycle. It emphasises that policy decisions and actions taken during prevention and mitigation have enormous and far reaching impacts on all stages of post disaster management. All decisions and actions taken after a disaster will be justified based on information gathered and actions taken during the pre-disaster phases of prevention and mitigation. Therefore, the success of post disaster management depends entirely on pre-disaster management.
This volume stresses how critically important it is, therefore, to plan and implement actions to reduce the impacts of natural disasters during pre-disaster phases to minimise impacts after a disaster. The end result should be that environmental safeguards are incorporated into every stage of the disaster management cycle, as well as into general development.

viii
1
The second volume of this manual deals with each of the components of the disaster management cycle, lists steps and raises questions that must be asked at each step in order to integrate environmental concerns into disaster management. The steps and questions are designed round the framework of the Millennium Ecosystem Assessment and its identified threats.
The Disaster Management Cycle (the DRM cycle)
The Indian Ocean tsunami of December 26, 2004 was one of the most horrific tragedies of recent human history. The details of the tsunami’s immediate impacts in coastal countries of Asia and Africa were shocking: 186,983,000 people died and 42,883 were reported missing. There was a massive displacement of populations, as well as extensive damage to infrastructure and coastal natural resources. In India, 235,377 homes were reported to have been damaged or destroyed; in Indonesia, 141,000; in Sri Lanka 103,836; in the Maldives, 8,074; in Thailand, 4,806; in the Seychelles, 500 and in Somalia 1,400; and. In the province of Aceh, Indonesia alone, 600,000 people lost their livelihoods (http://www.un.org/News/Press/docs/2005/hab196.doc.htm; http://en.wikipedia.org/wiki/2004_Indian_Ocean_earthquake).
In addition to this enormous toll on human lives and livelihoods, the tsunami also damaged ecosystems that provided vital protection to coastal communities. Terrestrial coastal ecosystems and wetlands, as well as key marine ecosystems - such as coral reefs and sea-grass beds - suffered seriously from the tsunami. The loss of these ecosystems resulted in the loss of ecosystem services and thereby reduced the options of people to rebuild their livelihoods.
The goals of disaster management are to
1. ‘Reduce, or avoid, the potential losses from hazards2. Assure prompt and appropriate assistance to victims of disaster and 3. Achieve rapid and effective recovery’ (GDRC, 2008).
The devastation caused by the tsunami has served to highlight the dangers of other, recurrent natural hazards - such as intense rainstorms, cyclones, floods, fires, and worsened droughts - which are predicted to increase in the future. (Refer to section on Climate change in Volume 1.) Because natural hazards cannot be stopped, learning to reduce vulnerability to these hazards and reducing/eradicating natural disasters that stem from these recurrent natural hazards becomes important. Learning to manage these disasters – disaster management – therefore, becomes critically important.
‘Four provinces of Andaman Sea coast of Thailand impacted by the tsunami - namely Trang, Krabi, Phang Nga and Ranong - were selected and a rapid assessment was carried out to review indicative costs associated with the loss of ecosystem services including environmental goods, reef-based fisheries (a joint value of mangroves, reefs and sea grasses) as well as the costs of physical rehabilitation of damaged ecosystems.
The results of the study showed that there were significant economic costs related to damages to coastal ecosystems. In particular, Phang Nga, which suffered the highest damages to its coastal ecosystems, also suffered the highest economic costs ranging from 10.47-11.15 million USD. Damages to non-timber forest products from mangroves were 607,010 USD; damages to reef fisheries 262,060-942,650 USD; the loss of coastal protection by damage to coral reefs was 9,213,000 USD and to mangroves, 286,470 USD. It was estimated that the economic costs of damages to mangroves in Phang Nga to almost 6.1 million USD, in Net Present Value.1’
This study showed empirically that ecosystem services are not only of direct value to people, but also offer tremendous indirect benefits in terms of supporting and regulating services (IUCN/UNEP, 2006).
1 Net Present Value is the sum of discounted net benefits - i.e. benefits minus costs - which shows whether a project generates more benefits than it incurs costs.
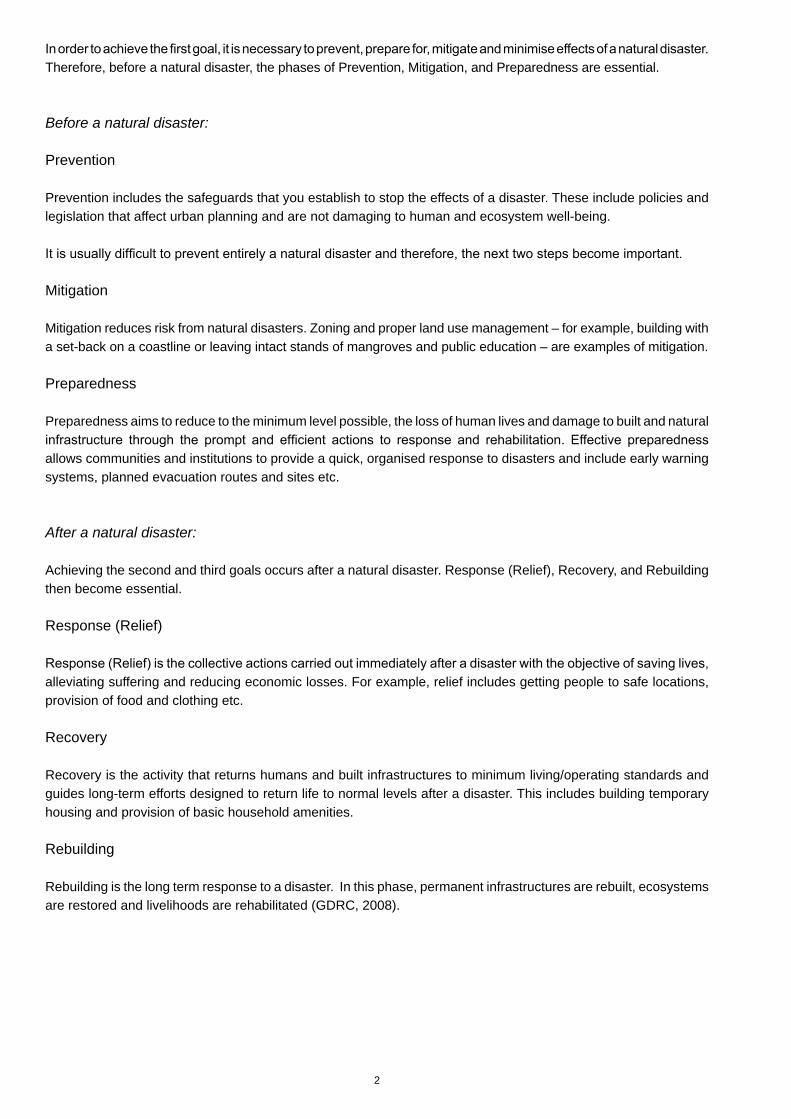
2
In order to achieve the first goal, it is necessary to prevent, prepare for, mitigate and minimise effects of a natural disaster. Therefore, before a natural disaster, the phases of Prevention, Mitigation, and Preparedness are essential.
Before a natural disaster:
Prevention
Prevention includes the safeguards that you establish to stop the effects of a disaster. These include policies and legislation that affect urban planning and are not damaging to human and ecosystem well-being.
It is usually difficult to prevent entirely a natural disaster and therefore, the next two steps become important.
Mitigation
Mitigation reduces risk from natural disasters. Zoning and proper land use management – for example, building with a set-back on a coastline or leaving intact stands of mangroves and public education – are examples of mitigation.
Preparedness
Preparedness aims to reduce to the minimum level possible, the loss of human lives and damage to built and natural infrastructure through the prompt and efficient actions to response and rehabilitation. Effective preparedness allows communities and institutions to provide a quick, organised response to disasters and include early warning systems, planned evacuation routes and sites etc.
After a natural disaster:
Achieving the second and third goals occurs after a natural disaster. Response (Relief), Recovery, and Rebuilding then become essential.
Response (Relief)
Response (Relief) is the collective actions carried out immediately after a disaster with the objective of saving lives, alleviating suffering and reducing economic losses. For example, relief includes getting people to safe locations, provision of food and clothing etc.
Recovery
Recovery is the activity that returns humans and built infrastructures to minimum living/operating standards and guides long-term efforts designed to return life to normal levels after a disaster. This includes building temporary housing and provision of basic household amenities.
Rebuilding
Rebuilding is the long term response to a disaster. In this phase, permanent infrastructures are rebuilt, ecosystems are restored and livelihoods are rehabilitated (GDRC, 2008).
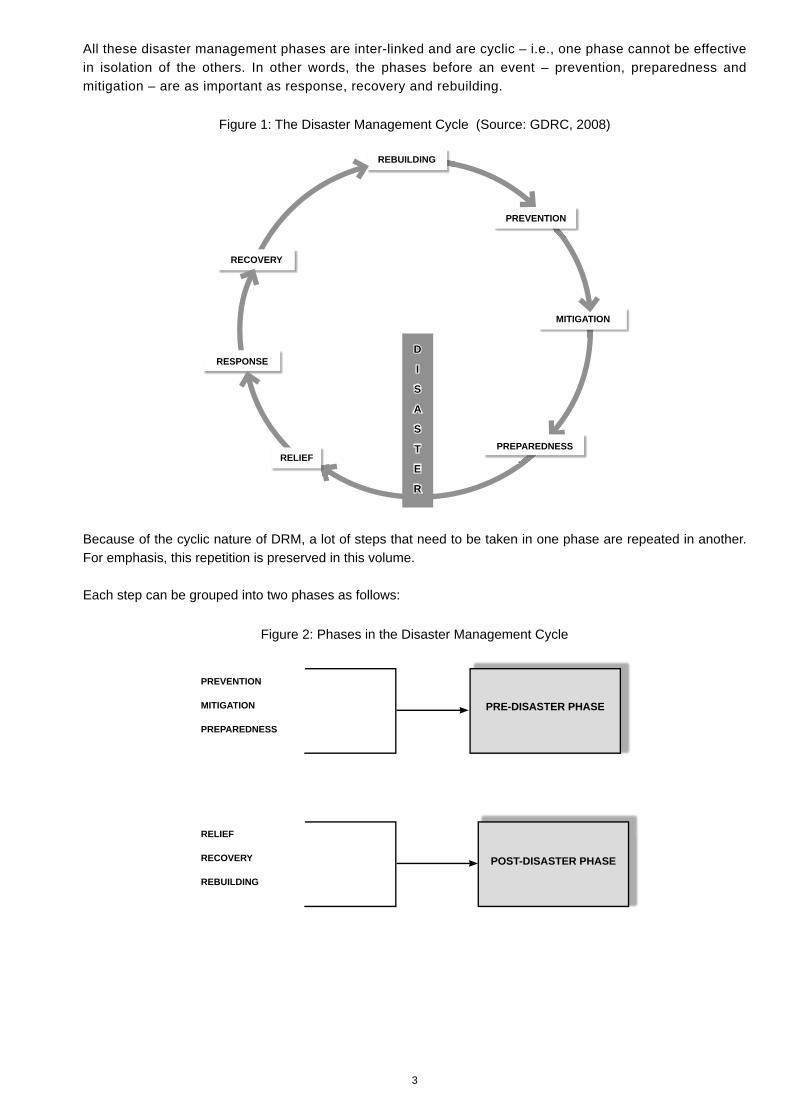
3
All these disaster management phases are inter-linked and are cyclic – i.e., one phase cannot be effective in isolation of the others. In other words, the phases before an event – prevention, preparedness and mitigation – are as important as response, recovery and rebuilding.
Because of the cyclic nature of DRM, a lot of steps that need to be taken in one phase are repeated in another. For emphasis, this repetition is preserved in this volume.
Each step can be grouped into two phases as follows:
Figure 1: The Disaster Management Cycle (Source: GDRC, 2008)
Figure 2: Phases in the Disaster Management Cycle
RECOVERY
RESPONSE
PREPAREDNESS
MITIGATION
PREVENTION
REBUILDING
RELIEF
D
I
S
A
S
T
E
R
PRE-DISASTER PHASE
PREVENTION
MITIGATION
PREPAREDNESS
RELIEF
RECOVERY
REBUILDING
POST-DISASTER PHASE
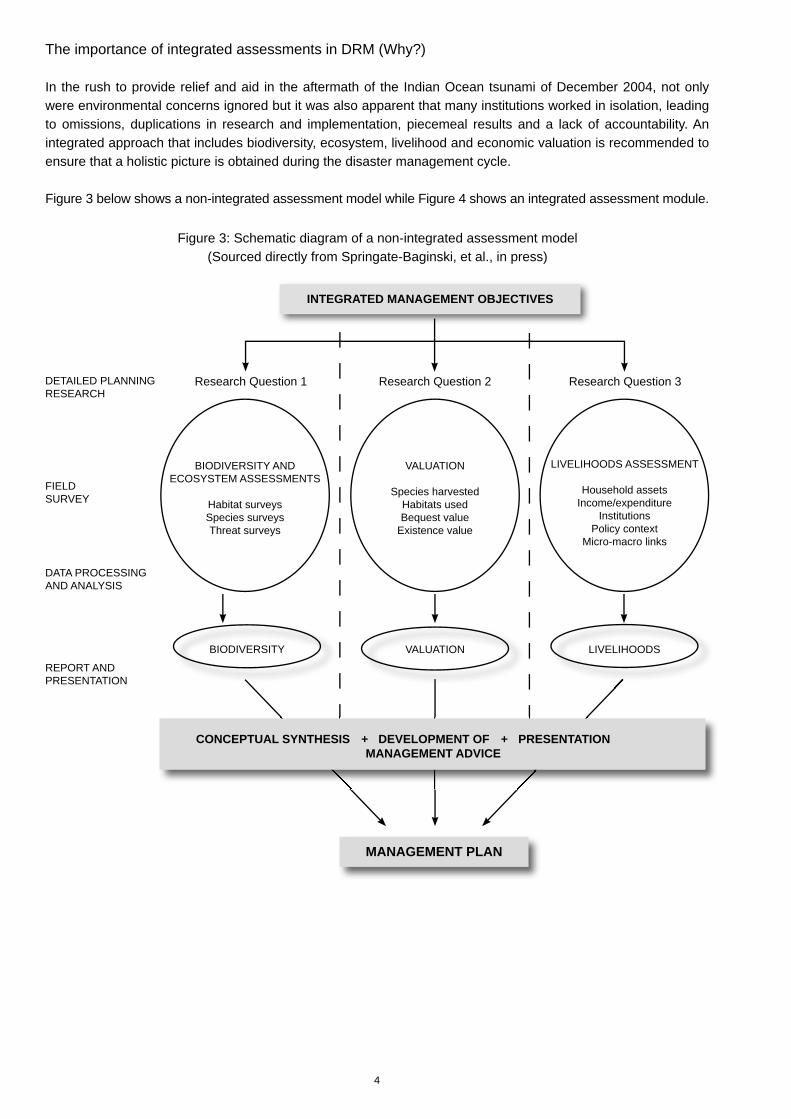
4
The importance of integrated assessments in DRM (Why?)
In the rush to provide relief and aid in the aftermath of the Indian Ocean tsunami of December 2004, not only were environmental concerns ignored but it was also apparent that many institutions worked in isolation, leading to omissions, duplications in research and implementation, piecemeal results and a lack of accountability. An integrated approach that includes biodiversity, ecosystem, livelihood and economic valuation is recommended to ensure that a holistic picture is obtained during the disaster management cycle.
Figure 3 below shows a non-integrated assessment model while Figure 4 shows an integrated assessment module.
Figure 3: Schematic diagram of a non-integrated assessment model (Sourced directly from Springate-Baginski, et al., in press)
INTEGRATED MANAGEMENT OBJECTIVES
BIODIVERSITY AND ECOSYSTEM ASSESSMENTS
Habitat surveysSpecies surveysThreat surveys
VALUATION
Species harvestedHabitats usedBequest value
Existence value
LIVELIHOODS ASSESSMENT
Household assetsIncome/expenditure
InstitutionsPolicy context
Micro-macro links
BIODIVERSITY VALUATION LIVELIHOODS
Research Question 1 Research Question 2 Research Question 3DETAILED PLANNING RESEARCH
FIELD SURVEY
DATA PROCESSING AND ANALYSIS
REPORT AND PRESENTATION
MANAGEMENT PLAN
CONCEPTUAL SYNTHESIS + DEVELOPMENT OF + PRESENTATION MANAGEMENT ADVICE
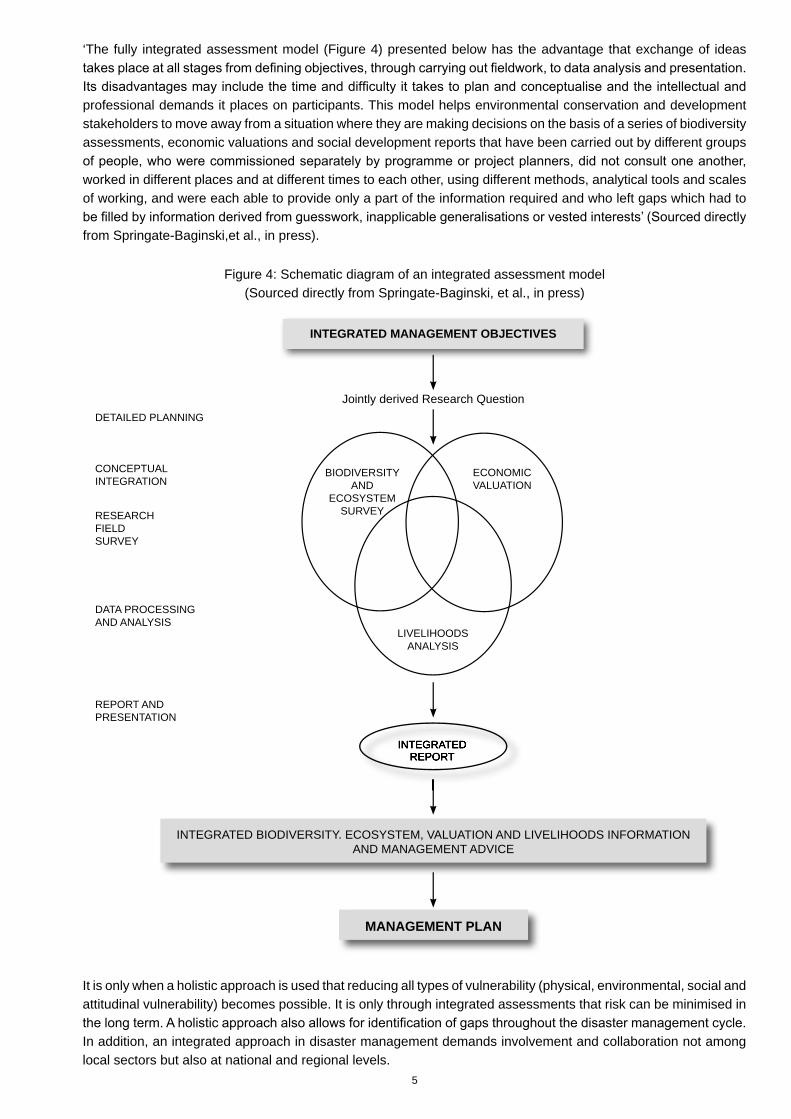
5
DETAILED PLANNING
CONCEPTUAL INTEGRATION
RESEARCHFIELD SURVEY
DATA PROCESSING AND ANALYSIS
REPORT AND PRESENTATION
INTEGRATED MANAGEMENT OBJECTIVES
BIODIVERSITY AND
ECOSYSTEM SURVEY
ECONOMIC VALUATION
LIVELIHOODS ANALYSIS
Jointly derived Research Question
INTEGRATED BIODIVERSITY. ECOSYSTEM, VALUATION AND LIVELIHOODS INFORMATION AND MANAGEMENT ADVICE
‘The fully integrated assessment model (Figure 4) presented below has the advantage that exchange of ideas takes place at all stages from defi ning objectives, through carrying out fi eldwork, to data analysis and presentation. Its disadvantages may include the time and diffi culty it takes to plan and conceptualise and the intellectual and professional demands it places on participants. This model helps environmental conservation and development stakeholders to move away from a situation where they are making decisions on the basis of a series of biodiversity assessments, economic valuations and social development reports that have been carried out by different groups of people, who were commissioned separately by programme or project planners, did not consult one another, worked in different places and at different times to each other, using different methods, analytical tools and scales of working, and were each able to provide only a part of the information required and who left gaps which had to be fi lled by information derived from guesswork, inapplicable generalisations or vested interests’ (Sourced directly from Springate-Baginski,et al., in press).
It is only when a holistic approach is used that reducing all types of vulnerability (physical, environmental, social and attitudinal vulnerability) becomes possible. It is only through integrated assessments that risk can be minimised in the long term. A holistic approach also allows for identifi cation of gaps throughout the disaster management cycle. In addition, an integrated approach in disaster management demands involvement and collaboration not among local sectors but also at national and regional levels.
Figure 4: Schematic diagram of an integrated assessment model(Sourced directly from Springate-Baginski, et al., in press)
INTEGRATEDREPORT
INTEGRATEDREPORT
MANAGEMENT PLAN
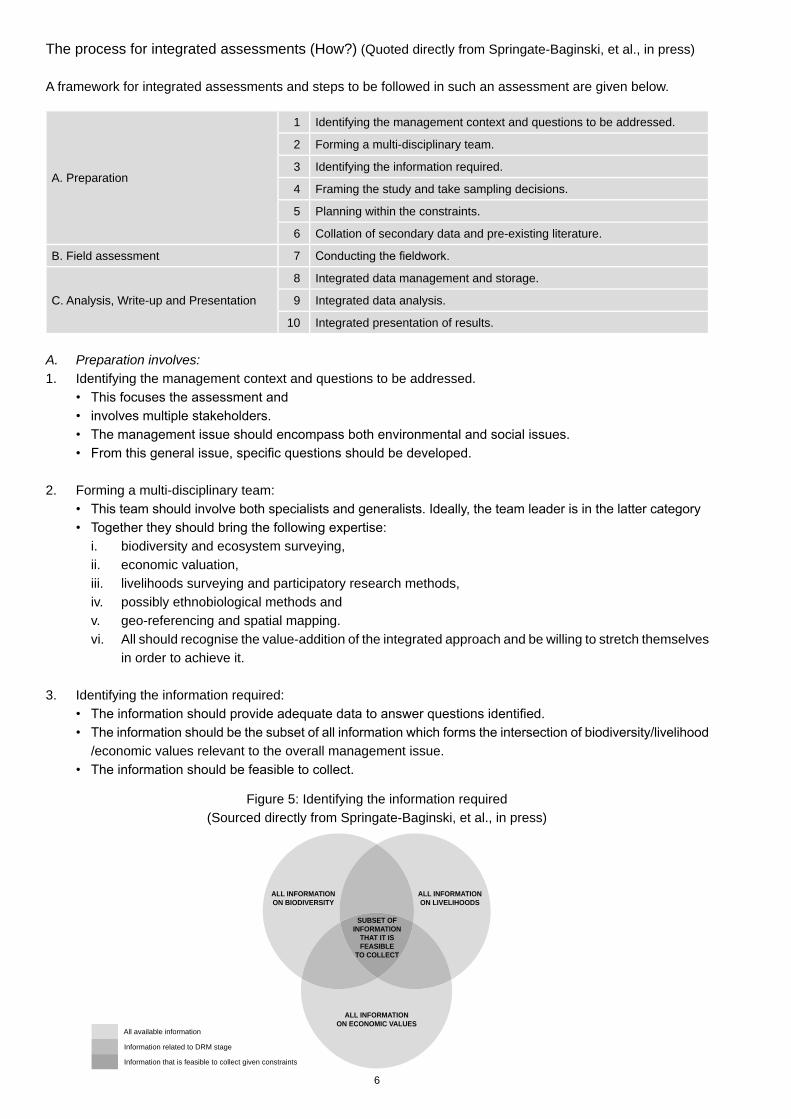
6
The process for integrated assessments (How?) (Quoted directly from Springate-Baginski, et al., in press)
A framework for integrated assessments and steps to be followed in such an assessment are given below.
A. Preparation
1 Identifying the management context and questions to be addressed.
2 Forming a multi-disciplinary team.
3 Identifying the information required.
4 Framing the study and take sampling decisions.
5 Planning within the constraints.
6 Collation of secondary data and pre-existing literature.
B. Field assessment 7 Conducting the fi eldwork.
C. Analysis, Write-up and Presentation
8 Integrated data management and storage.
9 Integrated data analysis.
10 Integrated presentation of results.
A. Preparation involves:1. Identifying the management context and questions to be addressed. • This focuses the assessment and • involves multiple stakeholders. • The management issue should encompass both environmental and social issues. • From this general issue, specifi c questions should be developed.
2. Forming a multi-disciplinary team: • This team should involve both specialists and generalists. Ideally, the team leader is in the latter category • Together they should bring the following expertise: i. biodiversity and ecosystem surveying, ii. economic valuation, iii. livelihoods surveying and participatory research methods, iv. possibly ethnobiological methods and v. geo-referencing and spatial mapping. vi. All should recognise the value-addition of the integrated approach and be willing to stretch themselves
in order to achieve it.
3. Identifying the information required: • The information should provide adequate data to answer questions identifi ed. • The information should be the subset of all information which forms the intersection of biodiversity/livelihood
/economic values relevant to the overall management issue. • The information should be feasible to collect.
ALL INFORMATION ON BIODIVERSITY
ALL INFORMATION ON LIVELIHOODS
ALL INFORMATION ON ECONOMIC VALUES
SUBSET OF INFORMATION
THAT IT IS FEASIBLE
TO COLLECT
Figure 5: Identifying the information required (Sourced directly from Springate-Baginski, et al., in press)
All available information
Information related to DRM stage
Information that is feasible to collect given constraints
7
4. Framing the study and taking sampling decisions: Framing is • Defining the assessment boundaries (defining the methodology); • Defining the geographic boundary (defining space); and • Defining a temporal boundary (defining time). Sampling is • Selecting species groups to survey; • Defining the socio-economic boundaries; and • Identifying which ecosystem values to quantify.
5. Planning within the constraints: There are many constraints within which integrated assessments have to be carried out. • Time constraints (deadlines, other obligations); • Funding constraints (budget); • Expertise constraints (skills and experience of team); • Political constraints (permits, permissions, access, conflicts); • Institutional constraints (networks etc.); • Social, cultural constraints (festivals, languages, customs); and • Natural constraints (seasonal factors and risks).
6. Collating secondary data and existing literature: It is important during a survey to gather existing information. a. Gathering Information: • Types of information: – Species information should aim to include information on taxonomy, geographic range, population size
and trends; – Trade and value of species or species products: CITES, livelihoods reports; – Resource use: livelihoods reports, FAO; – Wealth/poverty status: census data, livelihoods reports, government/district data, health statistics (from
health organisations) or studies from NGOs/medical centres in the area; – Livelihoods information: World Health Organisation, government agencies; – Maps: government mapping agency, aerial photography companies, NGOs that have produced maps
as part of their reports. • Sources: reports and ‘grey literature’ of government and other agencies, government data and maps,
online databases (‘red list’, books and miscellaneous materials). • Follow an integrated search - materials may be relevant to one or more disciplines. • Refer to key informants/experts for help. b. Reviewing Information: Clarify current state of knowledge and information gaps.
B. Field assessment: 7. Conducting the fieldwork: • Develop an integrated fieldwork plan; • Develop and adapt integrated field tools; • Train the fieldwork team and pilot the plan and tools; • Do the fieldwork; • Maintain rapport with respondents based on mutual respect. Observe research ethics; • Maintain field team networking and communication.
8
C. Analysis, Write-up and Presentation:
8. Integrated data management and storage protocols: • Data should be carefully and systematically compiled into a user-friendly archive, inter-referenced and
backed up. • Data loss is a surprisingly common problem. In an age of effortless back-up it is hardly professional. It is
easy to avoid by establishing a regular back-up system. • The ‘clean’ dataset should be kept separate from sets used for analysis.
9. Integrated data analysis: • Each aspect of the assessment should be analysed • Then the analysis should be integrated through team discussions.
10. Integrated presentation of results. This should include: • Recommendations from analysis of results; • Internal feedback; • Local feedback; • National feedback.
The importance of integrated assessments in disaster management
An integrated approach that includes biodiversity, ecosystem, livelihood and economic valuation is essential to ensure that a holistic picture is obtained during the entire disaster management cycle.
It is only when a holistic approach is used that reducing all types of vulnerability (physical, environmental, social and attitudinal vulnerability (see Volume 1) - becomes possible. It is only through integrated assessments that risk can be minimised in the long term. A holistic approach also allows for identification of gaps throughout the disaster management cycle. In addition, an integrated approach in disaster management demands involvement and collaboration not among local sectors but also at national and regional levels, leading to development that is geared at a landscape level, yielding the ‘big picture.’ This ultimately, is the most effective approach.
‘After the Indian ocean tsunami of 2004, a serious problem that emerged was a lack of coordination among agencies: between government and non-government agencies, among donors and between national and local governments.
This lack of coordination extended to various sectors as well. For example, the fisheries sector had little influence on national governments regarding the issue of boats (see page 33, this volume). Meanwhile, environmental organisations tried to convert the converted by reaching out only to the environmental community, developing guidelines and checklists which few outside their sector, value or even read. They found it difficult to accept the unfortunate fact that the very word ‘environment’ is viewed by the mainstream development sector as an ill-afforded luxury. Architects designed houses that did not reflect cultural needs or were environmentally friendly; builders paid scant respect to existing laws and environmental standards.’
The end result was, largely, confusion, duplications and omissions, that retarded recovery and hindered restoration (IUCN, 2006).
9

10
Pre-disaster management: Prevention
Prevention includes the safeguards that you establish to stop the effects of a disaster. These include assessments, policies and legislation that affect urban planning and are not damaging to human and ecosystem well-being.
RECOVERY
RESPONSE
PREPAREDNESS
MITIGATION
PREVENTION
REBUILDING
RELIEF
D
I
S
A
S
T
E
R
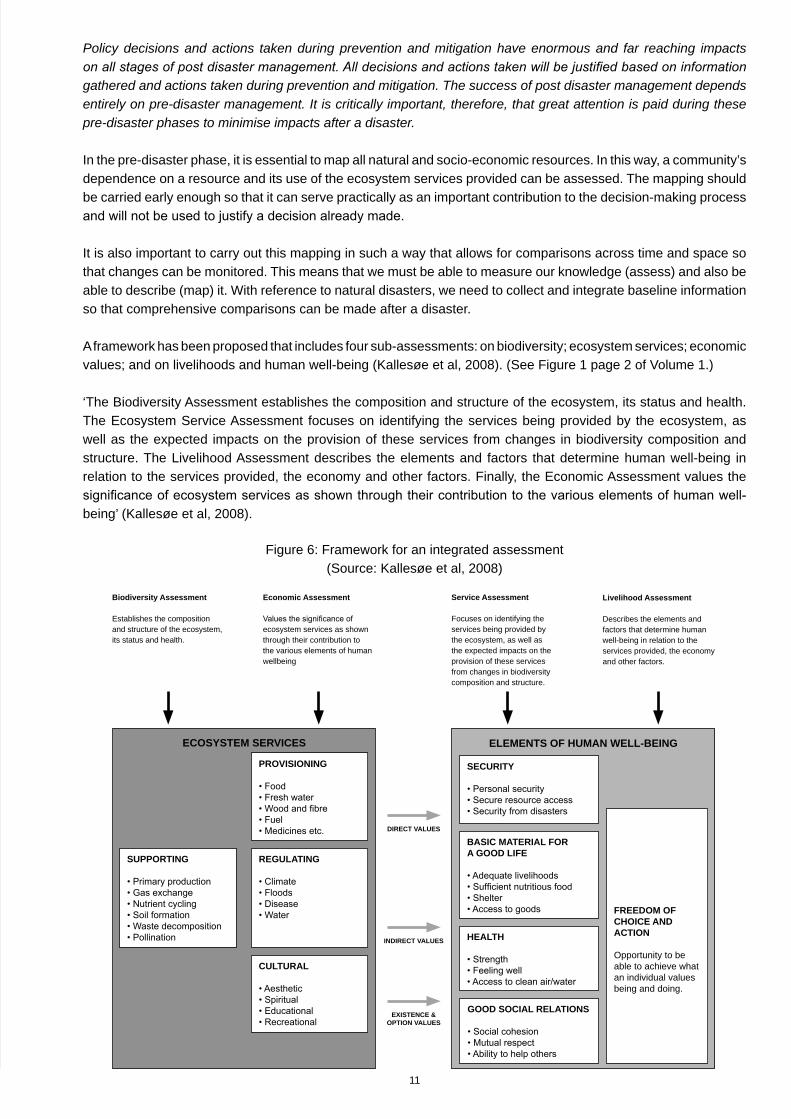
11
Policy decisions and actions taken during prevention and mitigation have enormous and far reaching impacts on all stages of post disaster management. All decisions and actions taken will be justified based on information gathered and actions taken during prevention and mitigation. The success of post disaster management depends entirely on pre-disaster management. It is critically important, therefore, that great attention is paid during these pre-disaster phases to minimise impacts after a disaster.
In the pre-disaster phase, it is essential to map all natural and socio-economic resources. In this way, a community’s dependence on a resource and its use of the ecosystem services provided can be assessed. The mapping should be carried early enough so that it can serve practically as an important contribution to the decision-making process and will not be used to justify a decision already made.
It is also important to carry out this mapping in such a way that allows for comparisons across time and space so that changes can be monitored. This means that we must be able to measure our knowledge (assess) and also be able to describe (map) it. With reference to natural disasters, we need to collect and integrate baseline information so that comprehensive comparisons can be made after a disaster.
A framework has been proposed that includes four sub-assessments: on biodiversity; ecosystem services; economic values; and on livelihoods and human well-being (Kallesøe et al, 2008). (See Figure 1 page 2 of Volume 1.)
‘The Biodiversity Assessment establishes the composition and structure of the ecosystem, its status and health. The Ecosystem Service Assessment focuses on identifying the services being provided by the ecosystem, as well as the expected impacts on the provision of these services from changes in biodiversity composition and structure. The Livelihood Assessment describes the elements and factors that determine human well-being in relation to the services provided, the economy and other factors. Finally, the Economic Assessment values the significance of ecosystem services as shown through their contribution to the various elements of human well-being’ (Kallesøe et al, 2008).
Figure 6: Framework for an integrated assessment(Source: Kallesøe et al, 2008)
Biodiversity Assessment
Establishes the composition and structure of the ecosystem, its status and health.
Economic Assessment
Values the significance of ecosystem services as shown through their contribution to the various elements of human wellbeing
ECOSYSTEM SERVICES
PROVISIONING
• Food• Fresh water• Wood and fibre• Fuel• Medicines etc.
REGULATING
• Climate• Floods• Disease• Water
CULTURAL
• Aesthetic• Spiritual• Educational• Recreational
FREEDOM OF CHOICE AND ACTION
Opportunity to be able to achieve what an individual values being and doing.
SUPPORTING
• Primary production• Gas exchange• Nutrient cycling • Soil formation• Waste decomposition• Pollination
BASIC MATERIAL FORA GOOD LIFE
• Adequate livelihoods• Sufficient nutritious food• Shelter• Access to goods
SECURITY
• Personal security• Secure resource access• Security from disasters
HEALTH
• Strength• Feeling well• Access to clean air/water
GOOD SOCIAL RELATIONS
• Social cohesion• Mutual respect• Ability to help others
Service Assessment
Focuses on identifying the services being provided by the ecosystem, as well as the expected impacts on the provision of these services from changes in biodiversity composition and structure.
Livelihood Assessment
Describes the elements and factors that determine human well-being in relation to the services provided, the economy and other factors.
ELEMENTS OF HUMAN WELL-BEING
DIRECT VALUES
INDIRECT VALUES
EXISTENCE & OPTION VALUES
12
A combined integrated assessment of all four components allows managers to establish a baseline on the status of ecosystem well-being and human well-being in order that informed and planned decisions are made in relation to management interventions.
A working checklist for an integrated assessment is presented in Annex 1, but the steps listed below should be followed in the process of collecting information:
a) Biodiversity Assessment: (see Volume 3 for detailed techniques)
Step 1: Identify the extent and type of natural habitats. • What is the type of ecosystem: lowland rain forest, coral reef, sand dune, mangrove? • What is the distribution and extent of habitats within these ecosystems?
Step 2: Identify species diversity (species richness2 and abundance3) of plants and animals. • How many different species of animals? • How many different species of plants? • How many individuals per species of animal? • How many individuals per species of plant?
b) Ecosystem Services Assessment:
Step 3: Identify ecosystem services provided: for example, • What are the provisioning services: i.e., what are the goods provided by the ecosystem – food,
timber, fuelwood, medicines, other non timber forest products (NTFPs), water etc. What is the number of households/individuals that use/depend on the above services?
• What are the supporting services: i.e., how much primary production is there? In addition, the yield (amount of fish catch, fruit yield) also indicates the how good the supporting service is.
• What are the regulating services: i.e., is the ecosystem providing protection from natural hazards, such as prevention of floods and sequestering carbon?
• What are the cultural services provided by the ecosystem? Is it used for recreation/tourism/education?
Step 4: Use indicators to assess the above. For example, • The quality and quantity of fish, vegetables and fruits, for example, indicate the extent of the
ecosystem’s provisioning services. • Species diversity and quality of vegetation indicate the extent of the ecosystem’s supporting
services. • The extent of tree cover (i.e. number of trees per km2, height and the width of the trunk etc.),
vegetation stands, protection by vegetation of built infrastructure etc. indicates the extent of the ecosystem’s regulating services.
• Assess the demand for recreation and education: i.e., the number of tourist-related built infrastructure and educational facilities such as outreach stations indicate the extent of the ecosystem’s cultural services. In addition, the extent of traditional knowledge practiced also indicates the extent of the ecosystem’s cultural services.
Step 5: Assess direct drivers of ecosystem loss. For example, • Is there over-exploitation? Are there harmful fishing practices (dynamiting, small net fishing),
illegal felling of trees, coral mining, overuse of a single resource? (This can be assessed if a reduction of numbers is noted in Step 4.)
• Is there habitat destruction? Is there clear-felling, filling of wetlands, land reclamation, road and infrastructure building or any other alternative use?
• Are invasive alien species spreading? • Is there pollution? Has solid waste accumulated? Is there water pollution: foul smell, foaming,
eutrophication?
2 Species richness is the number of different species in a habitat.3 Species abundance is the number of individuals of each species.
13
c) Socio-economic Assessment (Livelihoods and Economics): Step 7: Assess household benefits from ecosystem services. • Does the household benefit from any provisioning services? If so, which and for what purposes? • Does the household benefit from any supporting services? If so, which? • Does the household benefit from any regulating services? If so, which? • Does the household benefit from any cultural services? If so, which? Step 8: Identify livelihood dependence on provisioning services. • For provisioning services, list how much of the household cash and non-cash income is obtained
from natural resources as part of their whole income. • From where do households get the cash and non-cash income that is not obtained from the
provisioning services of ecosystems (what are the other livelihoods)? • What is the proportion of cash and non-cash income from provisioning services to cash and non-
cash income from livelihoods not related to natural resources? • For provisioning services, list how much (what percentage) of natural resources are used by the
household and how much (what percentage) is proportion is sold/traded. • Is there seasonal variation in provisioning services during the year? If so, when?
Step 9: Assess the impacts from ecosystem loss on human well-being. • What are the impacts of ecosystem losses on the livelihood of dependent households/individuals/
communities? • Would the safety (food security, adequate and safe water supply, protection from extreme weather
events etc) of households/individuals be affected by ecosystem loss? • Would the health of their households be affected negatively by ecosystem loss (through loss of
provisioning/supporting/regulating services)? • Would the social relations of their households suffer with ecosystem loss? (i.e., reduce time
allocated for community common work, initiate/increase conflict with each other for resource extraction etc)?
• Would their freedom of choice and action be reduced with ecosystem loss? • Would their household lose basic materials for good life with ecosystem loss? • Will government expenditure on social welfare and security increase due to loss of environmental
services?
Step 10: Ensure that gender sensitivity is mainstreamed into the above steps, as relevant. • For example, traditionally, it is women who collect fuelwood and women who collect water.
Therefore, they are likely to know best about use, quantities and quality.
14
Once integrated assessments have been carried out, mapped assets have to be ranked. Ranking, however, is country-specific exercise, although three general criteria may be used a) uses and economic value, b) uniqueness, and c) pre-existing threats.
The following questions may be asked based on the above criteria:
1. Which species/ecosystem has the most number of uses? 2. Which species/ecosystem is the most economically valuable?3. Which species/ecosystem is the most over-exploited? 4. Which is the greatest threat to ecosystem services? 5. Which is the ecosystem service that impacts the most number of people? 6. Which sector of the community is most affected by the above?
• Assets which serve a greater number of uses and produce economic value may be assigned a higher importance rank than those which serve less uses and produce less economic value.
• Unique assets are more important than those which are more common (and hence easier to replace). the post-disaster scenario than those which were not under threat.
• After this, policy and legislation protecting ecosystems and services become important. Both local legislation and international treaties have impacts on the conservation of the natural environment.
The next phase in prevention is risk analysis and hazard mapping.
Hazard Mapping Assessment
Hazard maps show where a natural hazard is likely to occur. They also map the intensity of occurrence.
Most often hazard mapping is defined as ‘the process of establishing geographically where and to what extent particular phenomena are likely to pose a threat to people, property, infrastructure, and economic activities’ (Coburn et al., 1994). However, this omits the integral need to assess threats to ecosystems as well.
Therefore, with the integration of environmental issues into disaster management, this definition should read to mean that hazard mapping is the process that establishes where and to what extent a natural hazard is likely to pose a threat to humans, biodiversity, property and infrastructure (both natural - ecosystems and man-made), to livelihoods and economic activities.
The following questions need to be asked
• What: what kind of hazard occurs? For example, a heavy rain causes a flood, a landslide or a debris flow. • Where: where does the hazard occur? For example, tidal surges affect coastal areas; landslides are more
common on hill slopes. Which ecosystems are affected? • How large is the scale of the hazard? • How intense is it? For example, there is a heavy rain of 500mm in one day, or lava flow of 300,000m3. • How does the phenomenon develop or spread? Is it rapid, slow onset or cyclic? • When does it occur or when is it likely to occur? • What is the frequency or probability of occurrence? For example, there is a heavy rain that occurs once for 30
years, or a great volcanic eruption that occurs once for 200 years. • Who suffers from a disaster? • How high is the grade of disaster? • How many deaths, building damage or collapse? • How much is the total loss?
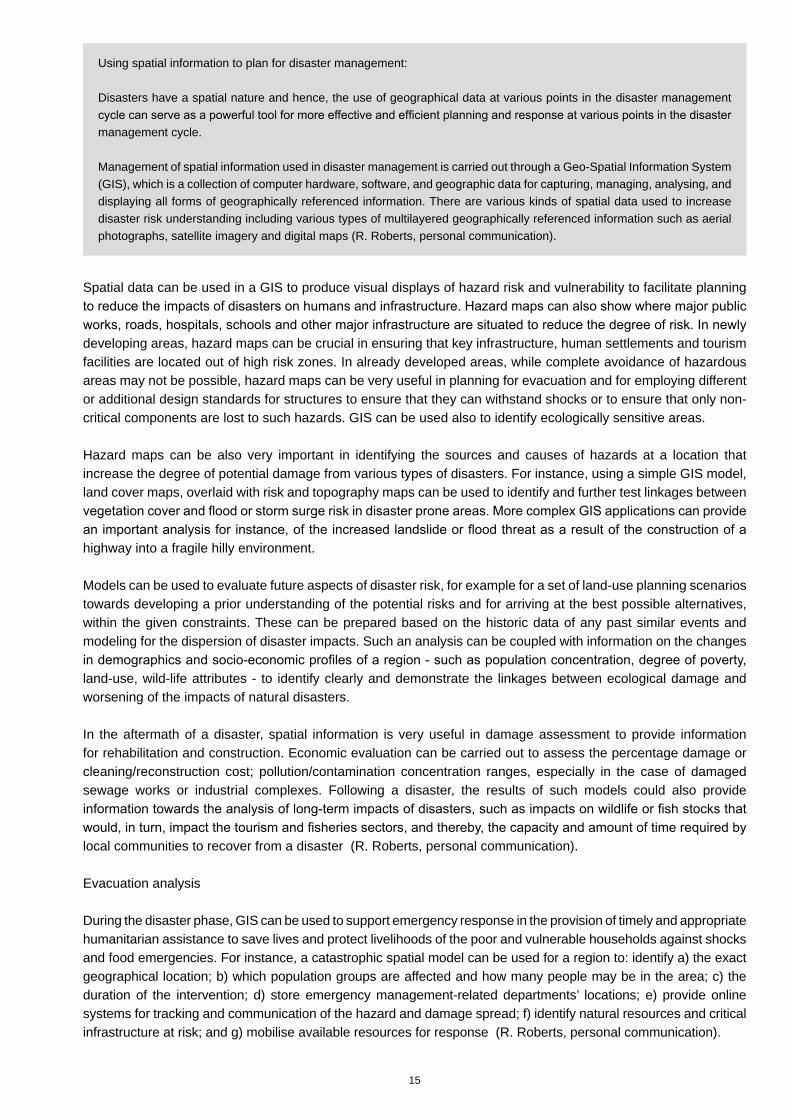
15
Using spatial information to plan for disaster management:
Disasters have a spatial nature and hence, the use of geographical data at various points in the disaster management cycle can serve as a powerful tool for more effective and efficient planning and response at various points in the disaster management cycle.
Management of spatial information used in disaster management is carried out through a Geo-Spatial Information System (GIS), which is a collection of computer hardware, software, and geographic data for capturing, managing, analysing, and displaying all forms of geographically referenced information. There are various kinds of spatial data used to increase disaster risk understanding including various types of multilayered geographically referenced information such as aerial photographs, satellite imagery and digital maps (R. Roberts, personal communication).
Spatial data can be used in a GIS to produce visual displays of hazard risk and vulnerability to facilitate planning to reduce the impacts of disasters on humans and infrastructure. Hazard maps can also show where major public works, roads, hospitals, schools and other major infrastructure are situated to reduce the degree of risk. In newly developing areas, hazard maps can be crucial in ensuring that key infrastructure, human settlements and tourism facilities are located out of high risk zones. In already developed areas, while complete avoidance of hazardous areas may not be possible, hazard maps can be very useful in planning for evacuation and for employing different or additional design standards for structures to ensure that they can withstand shocks or to ensure that only non-critical components are lost to such hazards. GIS can be used also to identify ecologically sensitive areas.
Hazard maps can be also very important in identifying the sources and causes of hazards at a location that increase the degree of potential damage from various types of disasters. For instance, using a simple GIS model, land cover maps, overlaid with risk and topography maps can be used to identify and further test linkages between vegetation cover and flood or storm surge risk in disaster prone areas. More complex GIS applications can provide an important analysis for instance, of the increased landslide or flood threat as a result of the construction of a highway into a fragile hilly environment.
Models can be used to evaluate future aspects of disaster risk, for example for a set of land-use planning scenarios towards developing a prior understanding of the potential risks and for arriving at the best possible alternatives, within the given constraints. These can be prepared based on the historic data of any past similar events and modeling for the dispersion of disaster impacts. Such an analysis can be coupled with information on the changes in demographics and socio-economic profiles of a region - such as population concentration, degree of poverty, land-use, wild-life attributes - to identify clearly and demonstrate the linkages between ecological damage and worsening of the impacts of natural disasters.
In the aftermath of a disaster, spatial information is very useful in damage assessment to provide information for rehabilitation and construction. Economic evaluation can be carried out to assess the percentage damage or cleaning/reconstruction cost; pollution/contamination concentration ranges, especially in the case of damaged sewage works or industrial complexes. Following a disaster, the results of such models could also provide information towards the analysis of long-term impacts of disasters, such as impacts on wildlife or fish stocks that would, in turn, impact the tourism and fisheries sectors, and thereby, the capacity and amount of time required by local communities to recover from a disaster (R. Roberts, personal communication).
Evacuation analysis
During the disaster phase, GIS can be used to support emergency response in the provision of timely and appropriate humanitarian assistance to save lives and protect livelihoods of the poor and vulnerable households against shocks and food emergencies. For instance, a catastrophic spatial model can be used for a region to: identify a) the exact geographical location; b) which population groups are affected and how many people may be in the area; c) the duration of the intervention; d) store emergency management-related departments’ locations; e) provide online systems for tracking and communication of the hazard and damage spread; f) identify natural resources and critical infrastructure at risk; and g) mobilise available resources for response (R. Roberts, personal communication).
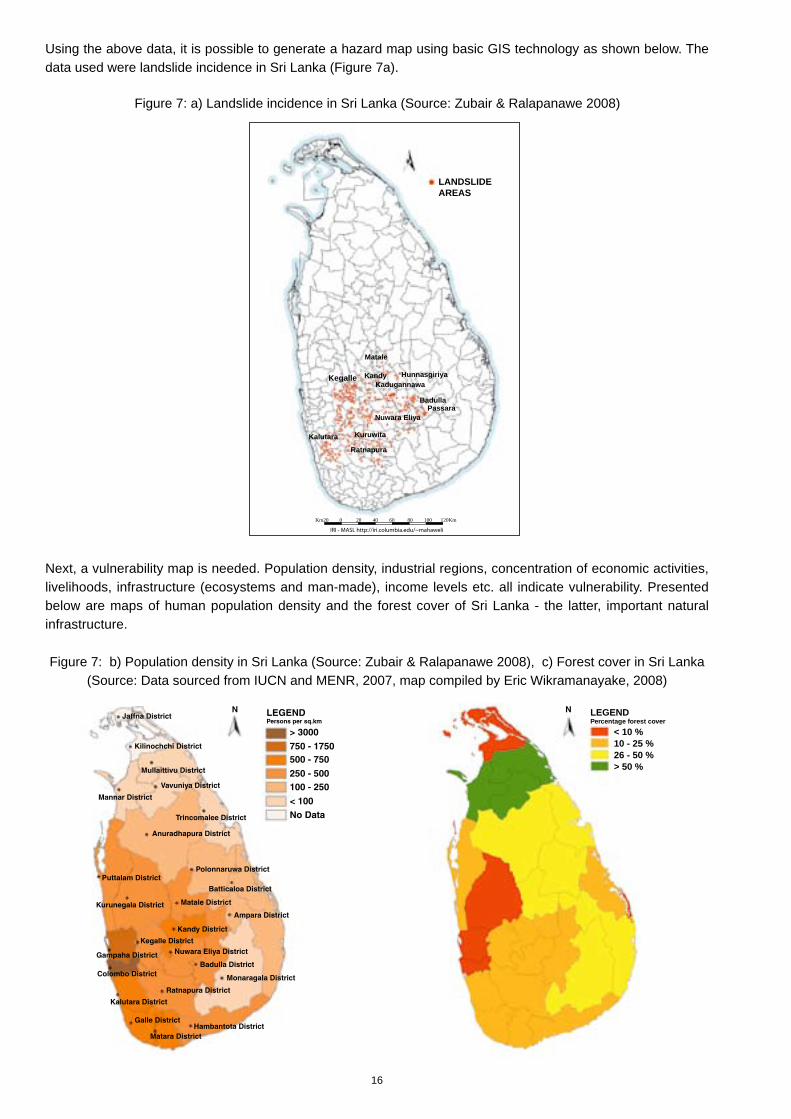
16
Using the above data, it is possible to generate a hazard map using basic GIS technology as shown below. The data used were landslide incidence in Sri Lanka (Figure 7a).
Next, a vulnerability map is needed. Population density, industrial regions, concentration of economic activities, livelihoods, infrastructure (ecosystems and man-made), income levels etc. all indicate vulnerability. Presented below are maps of human population density and the forest cover of Sri Lanka - the latter, important natural infrastructure.
Figure 7: a) Landslide incidence in Sri Lanka (Source: Zubair & Ralapanawe 2008)
Figure 7: b) Population density in Sri Lanka (Source: Zubair & Ralapanawe 2008), c) Forest cover in Sri Lanka (Source: Data sourced from IUCN and MENR, 2007, map compiled by Eric Wikramanayake, 2008)
Ratnapura
Km20 0 20 40 60 80 100 120Km
IRI - MASL http://iri.columbia.edu/~mahaweli
LANDSLIDE AREAS
Kuruwita
Nuwara Eliya
KadugannawaHunnasgiriya
PassaraBadulla
Kandy
Matale
Kegalle
Kalutara
< 10 %10 - 25 %26 - 50 %> 50 %
LEGENDPercentage forest cover
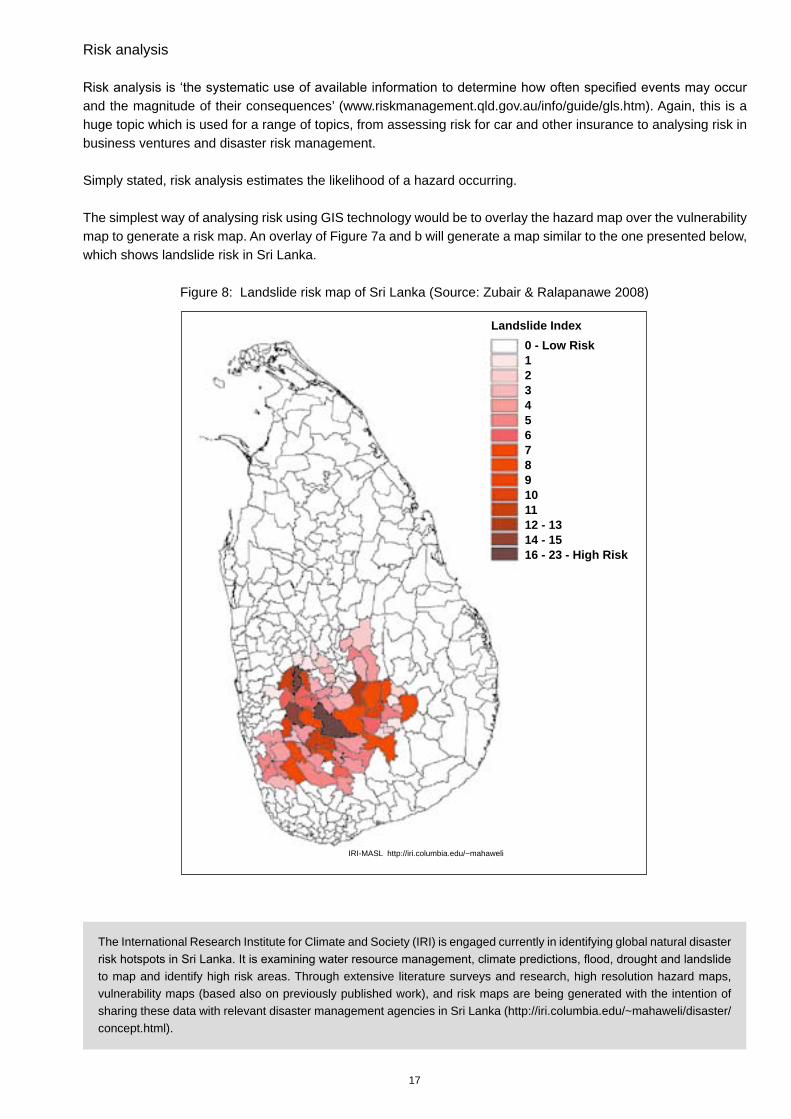
17
Risk analysis
Risk analysis is ‘the systematic use of available information to determine how often specified events may occur and the magnitude of their consequences’ (www.riskmanagement.qld.gov.au/info/guide/gls.htm). Again, this is a huge topic which is used for a range of topics, from assessing risk for car and other insurance to analysing risk in business ventures and disaster risk management.
Simply stated, risk analysis estimates the likelihood of a hazard occurring.
The simplest way of analysing risk using GIS technology would be to overlay the hazard map over the vulnerability map to generate a risk map. An overlay of Figure 7a and b will generate a map similar to the one presented below, which shows landslide risk in Sri Lanka.
Figure 8: Landslide risk map of Sri Lanka (Source: Zubair & Ralapanawe 2008)
The International Research Institute for Climate and Society (IRI) is engaged currently in identifying global natural disaster risk hotspots in Sri Lanka. It is examining water resource management, climate predictions, flood, drought and landslide to map and identify high risk areas. Through extensive literature surveys and research, high resolution hazard maps, vulnerability maps (based also on previously published work), and risk maps are being generated with the intention of sharing these data with relevant disaster management agencies in Sri Lanka (http://iri.columbia.edu/~mahaweli/disaster/concept.html).
Landslide Index0 - Low Risk123456789101112 - 1314 - 1516 - 23 - High Risk
IRI-MASL http://iri.columbia.edu/~mahaweli
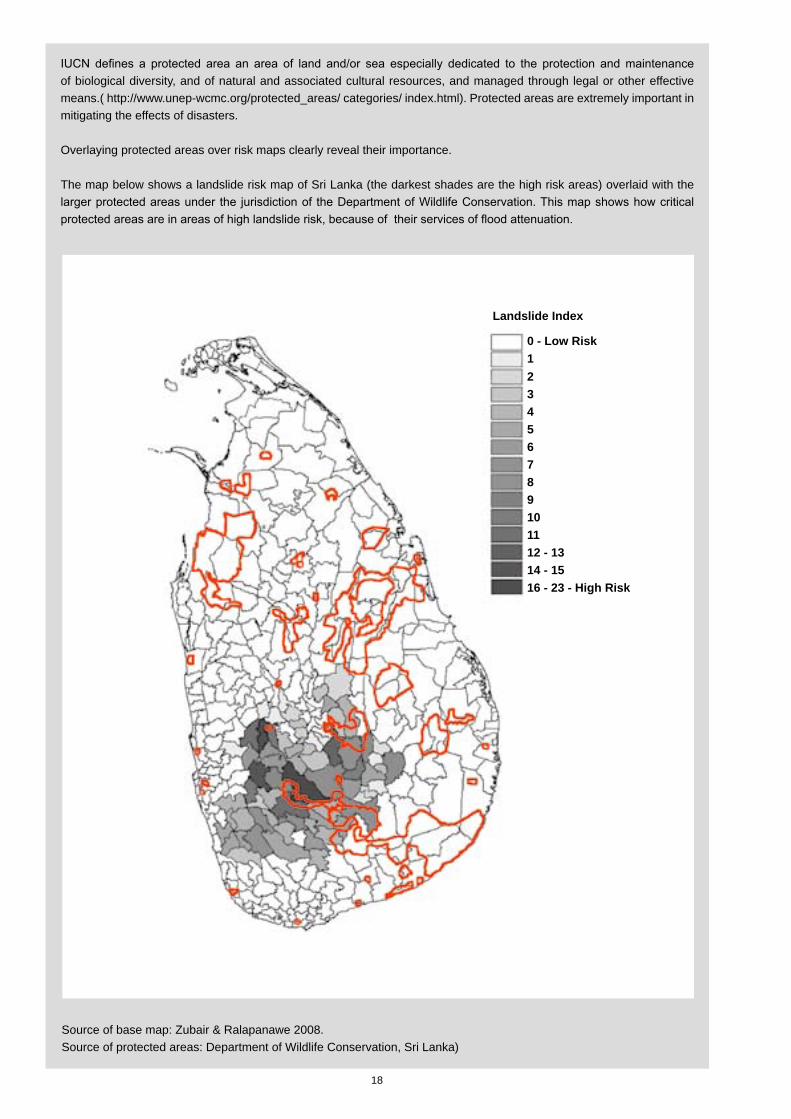
18
IUCN defines a protected area an area of land and/or sea especially dedicated to the protection and maintenance of biological diversity, and of natural and associated cultural resources, and managed through legal or other effective means.( http://www.unep-wcmc.org/protected_areas/ categories/ index.html). Protected areas are extremely important in mitigating the effects of disasters.
Overlaying protected areas over risk maps clearly reveal their importance.
The map below shows a landslide risk map of Sri Lanka (the darkest shades are the high risk areas) overlaid with the larger protected areas under the jurisdiction of the Department of Wildlife Conservation. This map shows how critical protected areas are in areas of high landslide risk, because of their services of flood attenuation.
Source of base map: Zubair & Ralapanawe 2008. Source of protected areas: Department of Wildlife Conservation, Sri Lanka)
Landslide Index
0 - Low Risk123456789101112 - 1314 - 1516 - 23 - High Risk
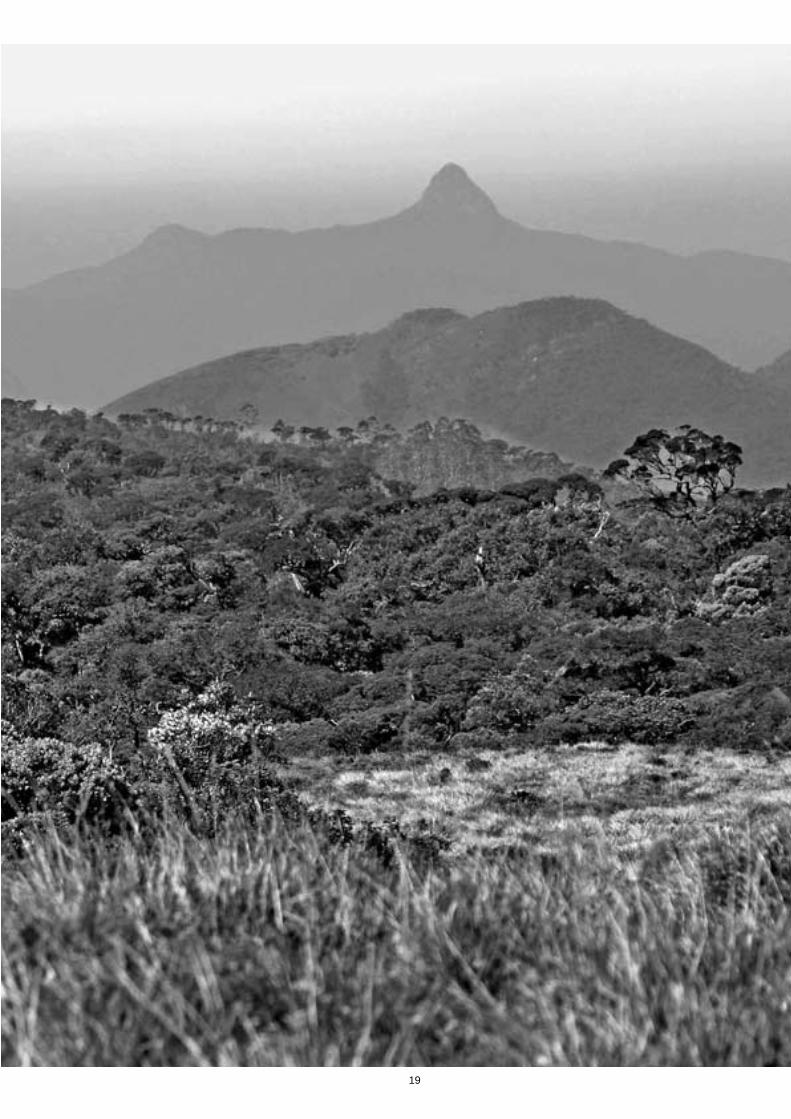
19
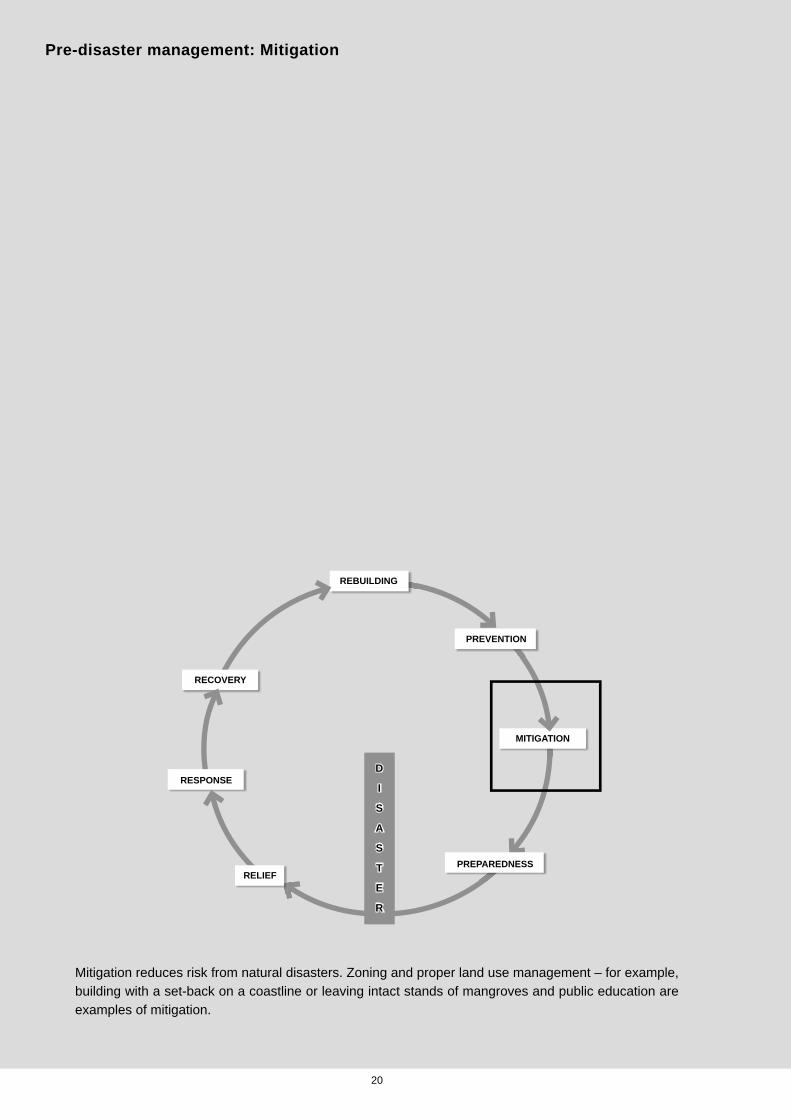
20
Pre-disaster management: Mitigation
Mitigation reduces risk from natural disasters. Zoning and proper land use management – for example, building with a set-back on a coastline or leaving intact stands of mangroves and public education are examples of mitigation.
RECOVERY
RESPONSE
PREPAREDNESS
MITIGATION
PREVENTION
REBUILDING
RELIEF
D
I
S
A
S
T
E
R
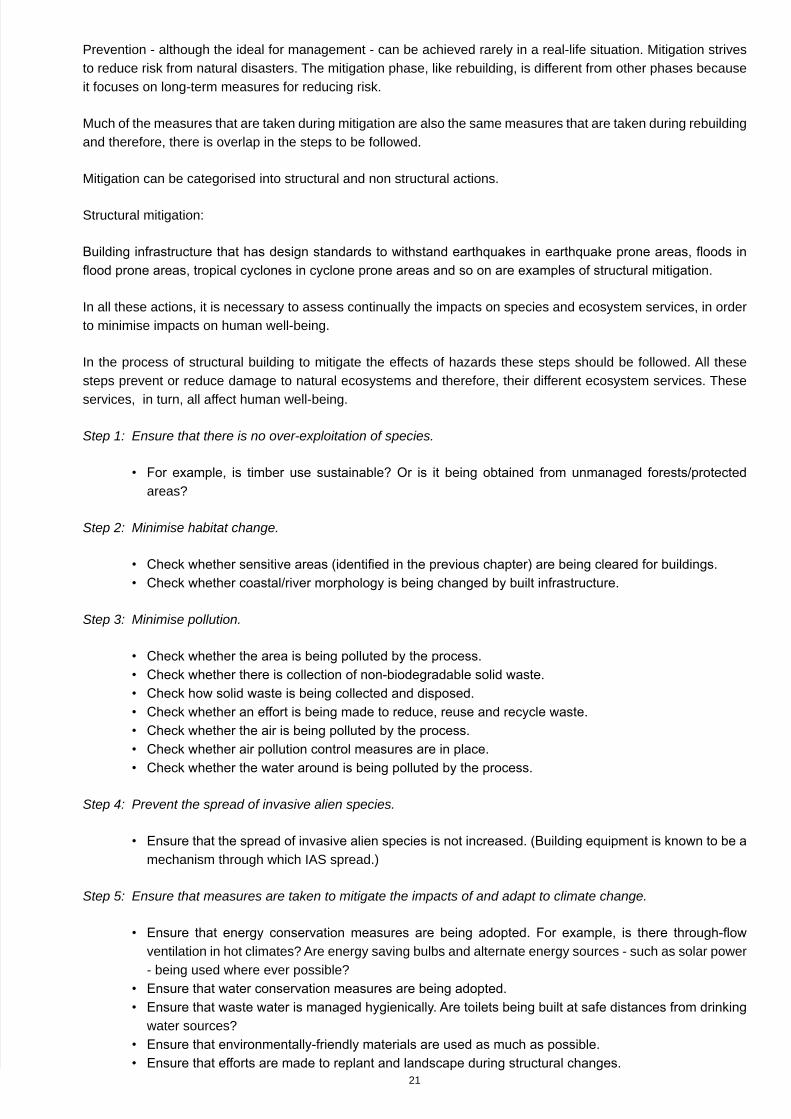
21
Prevention - although the ideal for management - can be achieved rarely in a real-life situation. Mitigation strives to reduce risk from natural disasters. The mitigation phase, like rebuilding, is different from other phases because it focuses on long-term measures for reducing risk.
Much of the measures that are taken during mitigation are also the same measures that are taken during rebuilding and therefore, there is overlap in the steps to be followed.
Mitigation can be categorised into structural and non structural actions.
Structural mitigation:
Building infrastructure that has design standards to withstand earthquakes in earthquake prone areas, floods in flood prone areas, tropical cyclones in cyclone prone areas and so on are examples of structural mitigation.
In all these actions, it is necessary to assess continually the impacts on species and ecosystem services, in order to minimise impacts on human well-being.
In the process of structural building to mitigate the effects of hazards these steps should be followed. All these steps prevent or reduce damage to natural ecosystems and therefore, their different ecosystem services. These services, in turn, all affect human well-being.
Step 1: Ensure that there is no over-exploitation of species.
• For example, is timber use sustainable? Or is it being obtained from unmanaged forests/protected areas?
Step 2: Minimise habitat change.
• Check whether sensitive areas (identified in the previous chapter) are being cleared for buildings. • Check whether coastal/river morphology is being changed by built infrastructure.
Step 3: Minimise pollution.
• Check whether the area is being polluted by the process. • Check whether there is collection of non-biodegradable solid waste. • Check how solid waste is being collected and disposed. • Check whether an effort is being made to reduce, reuse and recycle waste. • Check whether the air is being polluted by the process. • Check whether air pollution control measures are in place. • Check whether the water around is being polluted by the process.
Step 4: Prevent the spread of invasive alien species.
• Ensure that the spread of invasive alien species is not increased. (Building equipment is known to be a mechanism through which IAS spread.)
Step 5: Ensure that measures are taken to mitigate the impacts of and adapt to climate change.
• Ensure that energy conservation measures are being adopted. For example, is there through-flow ventilation in hot climates? Are energy saving bulbs and alternate energy sources - such as solar power - being used where ever possible?
• Ensure that water conservation measures are being adopted. • Ensure that waste water is managed hygienically. Are toilets being built at safe distances from drinking
water sources? • Ensure that environmentally-friendly materials are used as much as possible. • Ensure that efforts are made to replant and landscape during structural changes.
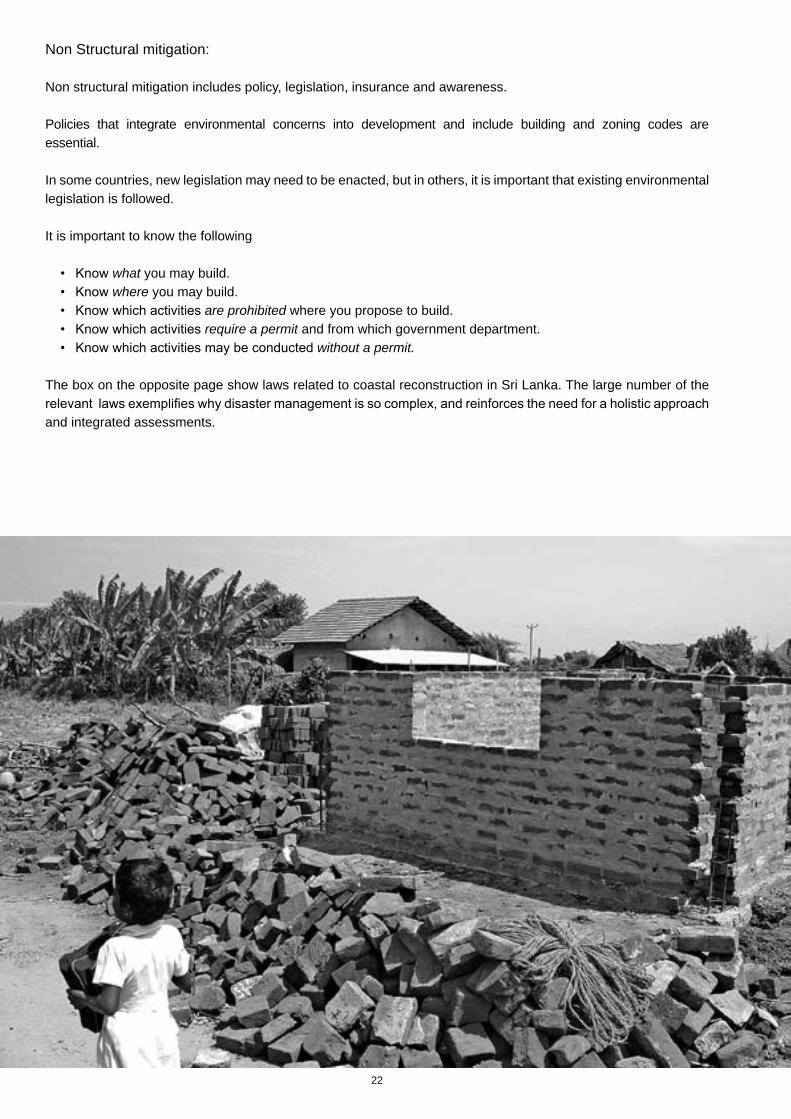
22
Non Structural mitigation:
Non structural mitigation includes policy, legislation, insurance and awareness.
Policies that integrate environmental concerns into development and include building and zoning codes are essential.
In some countries, new legislation may need to be enacted, but in others, it is important that existing environmental legislation is followed.
It is important to know the following
• Know what you may build. • Know where you may build. • Know which activities are prohibited where you propose to build. • Know which activities require a permit and from which government department. • Know which activities may be conducted without a permit.
The box on the opposite page show laws related to coastal reconstruction in Sri Lanka. The large number of the relevant laws exemplifies why disaster management is so complex, and reinforces the need for a holistic approach and integrated assessments.
23
Laws relevant to reconstruction in Sri Lanka
• Agrarian Development Act No. 46 of 2000 Section 32 of this Act prohibits the conversion of paddy land for a purpose other than agricultural cultivation without the written permission of the Commissioner General shall be a punishable offence under this Act.
• Antiquities Ordinance No. 9 of 1940 as amended provides for the Director General of Archaeology to declare certain areas as Archaeological Reserves. Encroachment of any kind, for whatever purpose is deemed an offence under Section 34 of the Ordinance.
• Antiquities (Amendment) Act No. 24 of 1998 Section 40 (g) empowers the Director General of Archaeology to conduct an Archaeological Impact Assessment of areas that may be affected by development, industrial or other projects proposed by the Government or any person and implement any mitigatory measures that may be required. Sections 43 (A) and 43 (B) govern the Impact Assessment Procedure to be complied with in the event the Director General deems it necessary.
• Coast Conservation Act No. 57 of 1981 (CCA) as amended (Section 42 of the CCA) defines the coastal zone.• Coast Conservation Act No. 57 of 1981 (CCA) as amended (Section 14 of the CCA) lists activities that are prescribed within the
coastal zone. • Coast Conservation Regulation No. 1 of 1982 as set out in Gazette Notification No. 260/ 22 – 1983 sets out in details the regulations
pertaining to development activities that are permitted and prohibited.• Common Law of Sri Lanka.• Customary Laws of Sri Lanka.• Criminal Procedure Code No 15 of 1979 Section 98 in concurrence with Section 261 of the Penal Code further elaborates on
Public Nuisance.• Fauna & Flora Protection Ordinance No. 2 of 1937 as amended, (FFPO) specifies the areas under the jurisdiction of the Department
of Wildlife Conservation in which no construction or developmental activities can occur.• Fauna & Flora Protection Ordinance No. 2 of 1937 as amended, (FFPO) specifies the areas under the jurisdiction of the Department
of Wildlife Conservation in which a permit is required from the Director of Wildlife Conservation for construction or developmental activities can occur.
• Fauna & Flora Protection Ordinance No. 2 of 1937 as amended, (FFPO) specifies activities which are prohibited within national, reserves, sanctuaries and buffer zones as well as fauna and flora that are protected nationally.
• Forests Ordinance No. 16 of 1907 as amended specifies the areas and activities prohibited in designated forest areas. The felling of tress, cultivation and the construction of buildings and roads are prohibited activities together with poaching, cattle grazing etc.
• Fisheries and Aquatic Resources Act No. 2 of 1996 Section 36 specifies areas that are demarcated and protected as Fishery Reserves. Any development activity in a fishery reserve requires the permission and approval of the Director of Fisheries and Aquatic Resources.
• Land Acquisition Act No. 9 of 1950 as amended should be complied with when considering land use and allocation.• Land Development Ordinance No. 19 of 1935 as amended should be complied with when considering land use and allocation.• Land Grants (Special Provisions) Act No. 43 of 1979 as amended should be complied with when considering land use and allocation.• Land Settlement Ordinance No. 20 of 1931 as amended should be complied with when considering land use and allocation.• Marine Pollution Prevention Act No. 59 of 1981 authorises the Marine Pollution Prevention Authority (MPPA) to implement and take
necessary steps to prevent Marine Pollution.• Municipal Councils Ordinance No. 29 of 1947 should be complied with when considering land use and allocation.• National Environmental Act No. 47 of 1980 as amended, Gazette No. 772/ 22 – 1993 sets out in detail the projects and undertakings
for which approval is required and Environmental Impact Assessments necessary, whether they be wholly or partly outside the Coastal Zone as defined by the CCA.
• National Environmental Act No. 47 of 1980 as amended. Section 33 defines pollution and waste. • National Heritage Wilderness Act, No 3 of 1988 defines areas of exceptional ecological value that need protection. • National Housing Development Authority Act No. 17 of 1979 as amended empowers the National Housing Development Authority it
in terms of Section 4 of the Act to engage in all housing and construction issues at a National level and its powers and functions are more specifically set out in Section 5 of the Act.
• Nuisance Ordinance enacted in 1862 with provisions to protect pollution and public nuisance.• Penal Code enacted in 1880 Section 261 provides for environmental protection where any person/ s is prohibited from causing public
nuisance such as noise, odour, and other irritant that causes harassment to society.• Pradeshiya Sabha Act No. 15 of 1987 should be complied with when considering land use and allocation.• Acquisition of Land Act No. 33 of 1950 as amended should be complied with when considering land use and allocation.• State Lands Ordinance No. 8 of 1947 as amended should be complied with when considering land use and allocation.• State Lands (Recovery and Possession) Act No. 7 of 1979 as amended should be complied with when considering land use
and allocation.• Urban Development Authority Law No 41 of 1978 as amended. The area lying within the limits of one kilometre (1 km) landwards of
the Mean High Water line of the sea is suitable for development and by order of the Government of Sri Lanka declared to be an Urban Development Area.
• Urban Development Authority Law No 41 of 1978 as amended promotes integrated planning and implementation of economic, social and physical development in areas declared as urban development areas, all development activity within the said areas as set out in Section 8 of the UDA Law shall fall within the purview of the UDA.
• Urban Councils Ordinance No. 61 of 1939 as amended should be complied with when considering land use and allocation.• Urban Development Authority Planning and Building Regulations 1986 as set out in Gazette No. 392/ 9 sets out the regulations
covering any development activity, including reconstruction and rebuilding within the area demarcated as falling within One kilometre landwards from the Mean High Water line as set out in Gazette No. 223/ 16 – 1982 as mentioned more specifically above.
(Source: EFL 2005, in IUCN 2005)
24
Mitigation related to Climate Change
The term mitigation in relation to climate change has a different, distinct meaning. Mitigation in climate change relates specifically to reduction in carbon emissions. Stringent energy saving measures, improving energy supplies, optimising equipment to work at 100% efficiency - all reduce the quantity of CO2 emitted. Hydropower, wind and solar power emit no CO2 and are, therefore, carbon clean.
Another option is to use carbon neutral energy such as dendro power (energy generated by burning plants grown for the purpose) and bio-fuels (fuels obtained from plants, animals and their by-products: manure, garden waste and crop residues). In carbon neutral energy processes, plants absorb the same amount of CO2 that is emitted into the air on burning. However, the increase in the use of carbon neutral energy has given rise to considerable debate and conflict. Deforestation to grow monocultures of energy generating crops and competition for land use between agricultural and energy crops negates the advantages of growing crops to generate bio-fuels.
It is also important to ensure that there is reduction of carbon emissions when mitigation is practised in disaster management. • Are energy conservation measures in place? • Is carbon clean energy (hydropower, wind and solar power) being used as possible options for energy? • Is carbon neutral energy (dendro power) being used judiciously as possible options for energy? • Are carbon offsets being established - i.e. is there a definite effort to replant and reforest particularly if trees have
been cut down?
It is also important to know which international treaties have been ratified by a respective country and to follow these.
For non-structural mitigation, the following steps need to be followed.
Step 1: Enforce strictly design standards and building codes.
Step 2: Enforce strictly zoning legislation.
• Is zoning legislation that steers development away from ecologically sensitive areas being adopted? • Is zoning legislation that steers development away from hazard prone areas obtained from hazard
mapping or areas subject to flooding, storm surge or coastal erosion being adopted? • Have set backs that have been legislated been maintained? This is particularly relevant for coastal areas.
Step 3: Enforce strictly existing laws and policies related to environmental management.
• Are existing laws and policies that relate to environmental management and protection being followed? • Is clearance of natural habitats such as mangroves, scrubland and forests being avoided? • Is building on/filling lowland wetlands and watershed areas being avoided? • Is destruction by clearing only for the essential, minimal area per building? • Is it being ensured that natural water courses, watershed areas, flood plains etc. are not blocked by
construction?
Step 4: Actively restore and conserve ecosystems.
• Are efforts being made to restore and conserve ecosystems as part of the reconstruction process? • Are Environmental Impact Assessments required? • Have native species been chosen actively in place of exotics? • Are IAS being eradicated actively and prevented from spreading? • Are multi-use, locally beneficial species being introduced? • Are mono-cultures being avoided?

25
The number of vehicles in Asia doubles every five to seven years, increasing by three times by 2030 the energy consumption in the transport sector. Alternate fuel and higher efficiencies that generate simultaneously local and global benefits (i.e., reducing congestion as well as air pollution) are essential in the region. The Asian Development Bank is working in 11 Asian cities (including Changzhou and Harbin in China; Colombo, Sri Lanka; Dhaka, Bangladesh; and Kathmandu, Nepal) on pilot urban transport projects to address this (ADB, 2007).
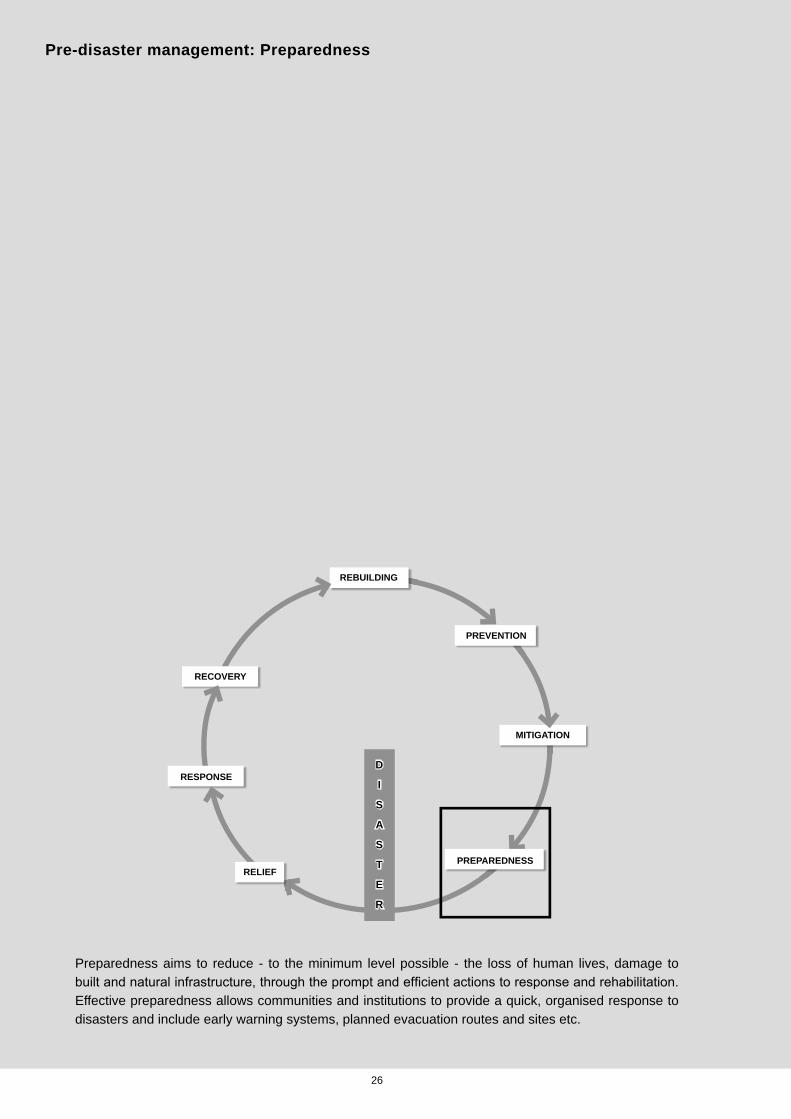
26
Pre-disaster management: Preparedness
Preparedness aims to reduce - to the minimum level possible - the loss of human lives, damage to built and natural infrastructure, through the prompt and effi cient actions to response and rehabilitation. Effective preparedness allows communities and institutions to provide a quick, organised response to disasters and include early warning systems, planned evacuation routes and sites etc.
RECOVERY
RESPONSE
PREPAREDNESS
MITIGATION
PREVENTION
REBUILDING
RELIEF
D
I
S
A
S
T
E
R
27
Preparing for a disaster involves a long process of planning what the response should be to a natural disaster. Understanding what hazards are, what the risks are, setting up early warning systems – i.e., becoming informed - is the first step. Information and decisions made under the Prevention and Mitigation phases will form the basis on which the Preparation phase is planned.
Planning for an emergency – how you would respond (i.e., what are the early warning systems), when and with whom, preparing emergency checklists, assembling emergency kits are the next steps in preparedness. Knowing where to evacuate to is the final stage in preparedness. It is not within the purview of this manual to detail these areas and there are many other manuals that describe them (http://secap480.un.org/search?q=early+warning+systems&Submit=Search&ie=utf8&site=un_org&output=xml_no_dtd&client=UN_Website_English&num=10&proxystylesheet=UN_Website_English&oe=utf8; http://www.redcross.org/).
In all these steps, again, it is vital that environmental concerns are incorporated; otherwise, much damage can be inflicted in the next, Response phase.
There is overlap in the steps that are taken at this stage and at the prevention phase, but specifically, the following steps should be followed.
Step 1: Identify clearly where temporary shelters will be put up in the event of a natural disaster.
• Ensure that environmentally sensitive areas are not cleared in the event of a disaster. • Ensure that protected areas are not encroached up in the event of a disaster. • Ensure that coastal morphology is not changed when temporary shelters are set up in the event of a
disaster.
Step 2: Identify the sources from which natural resources such as timber and fuelwood will be obtained in the event of a disaster.
• Ensure that timber is not sourced illegally but instead, obtained from sustainably managed forests. • Ensure that fuelwood will not be obtained illegally from protected areas.
Step 3: Identify locations at which sanitation facilities will be built/put up in the event of a disaster.
• Will toilets be built at safe distances from drinking water sources? • Will toilets be built without contaminating ground water or water sources such as streams and rivers? • How will waste water be managed in the event of a disaster?
Step 4: Identify locations at which solid waste will be disposed of in the event of a disaster – both from post disaster debris and from shelters.
• Ensure that locations are identified for use in the event of a disaster for the safe dumping of solid waste.
• Know where hazardous materials can be disposed of in the event of a disaster.
Step 5: Ensure that emergency kits minimise disposable waste.
Step 6: Ensure that gender sensitivity is incorporated into all the above steps.
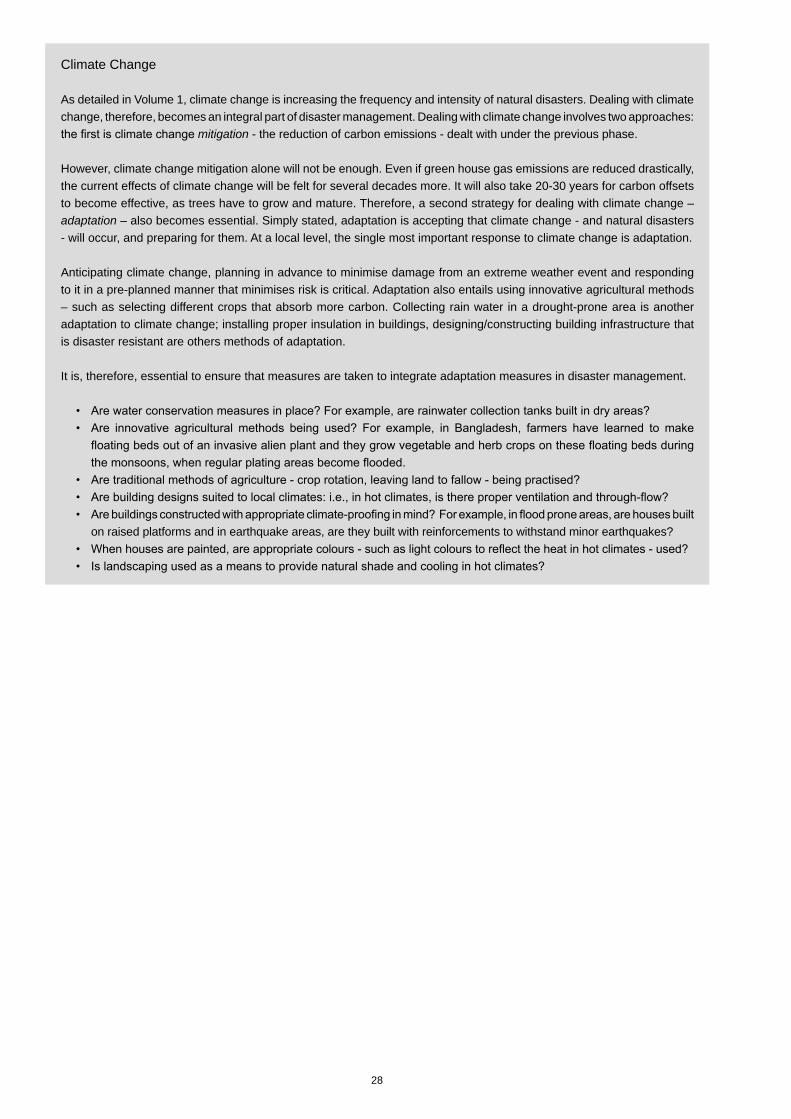
28
Climate Change
As detailed in Volume 1, climate change is increasing the frequency and intensity of natural disasters. Dealing with climate change, therefore, becomes an integral part of disaster management. Dealing with climate change involves two approaches: the first is climate change mitigation - the reduction of carbon emissions - dealt with under the previous phase.
However, climate change mitigation alone will not be enough. Even if green house gas emissions are reduced drastically, the current effects of climate change will be felt for several decades more. It will also take 20-30 years for carbon offsets to become effective, as trees have to grow and mature. Therefore, a second strategy for dealing with climate change – adaptation – also becomes essential. Simply stated, adaptation is accepting that climate change - and natural disasters - will occur, and preparing for them. At a local level, the single most important response to climate change is adaptation.
Anticipating climate change, planning in advance to minimise damage from an extreme weather event and responding to it in a pre-planned manner that minimises risk is critical. Adaptation also entails using innovative agricultural methods – such as selecting different crops that absorb more carbon. Collecting rain water in a drought-prone area is another adaptation to climate change; installing proper insulation in buildings, designing/constructing building infrastructure that is disaster resistant are others methods of adaptation.
It is, therefore, essential to ensure that measures are taken to integrate adaptation measures in disaster management.
• Are water conservation measures in place? For example, are rainwater collection tanks built in dry areas? • Are innovative agricultural methods being used? For example, in Bangladesh, farmers have learned to make
floating beds out of an invasive alien plant and they grow vegetable and herb crops on these floating beds during the monsoons, when regular plating areas become flooded.
• Are traditional methods of agriculture - crop rotation, leaving land to fallow - being practised? • Are building designs suited to local climates: i.e., in hot climates, is there proper ventilation and through-flow? • Are buildings constructed with appropriate climate-proofing in mind? For example, in flood prone areas, are houses built
on raised platforms and in earthquake areas, are they built with reinforcements to withstand minor earthquakes? • When houses are painted, are appropriate colours - such as light colours to reflect the heat in hot climates - used? • Is landscaping used as a means to provide natural shade and cooling in hot climates?
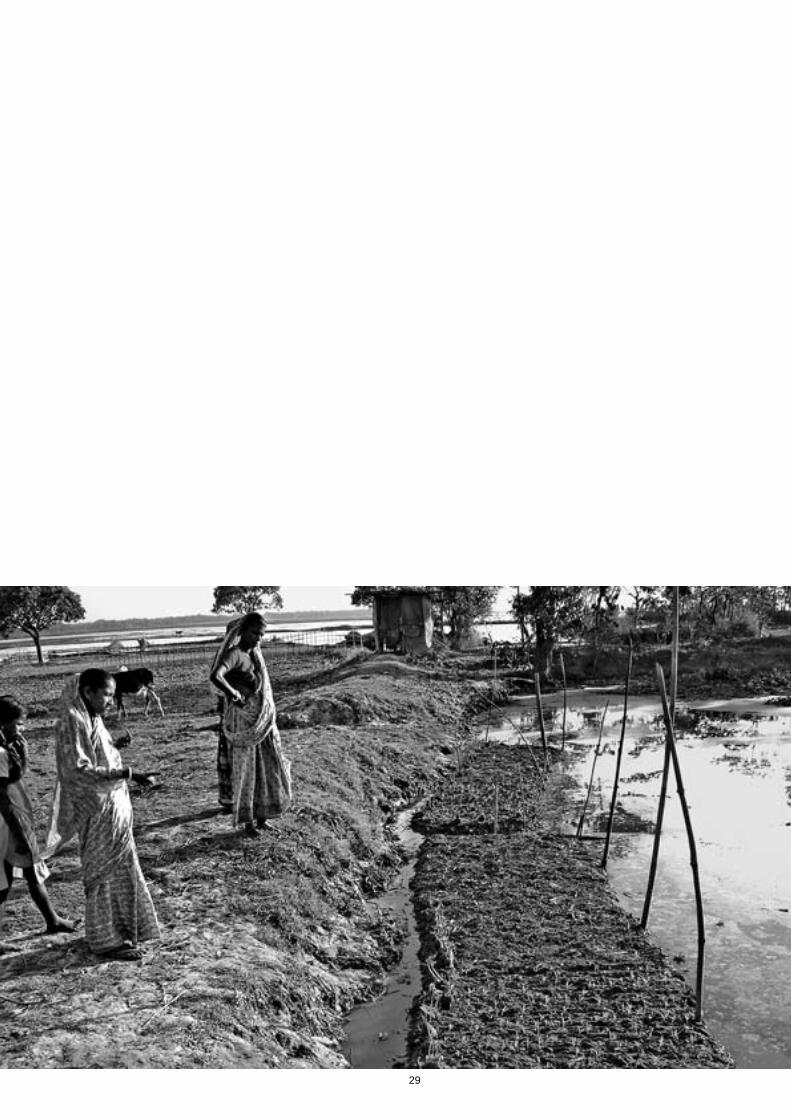
29
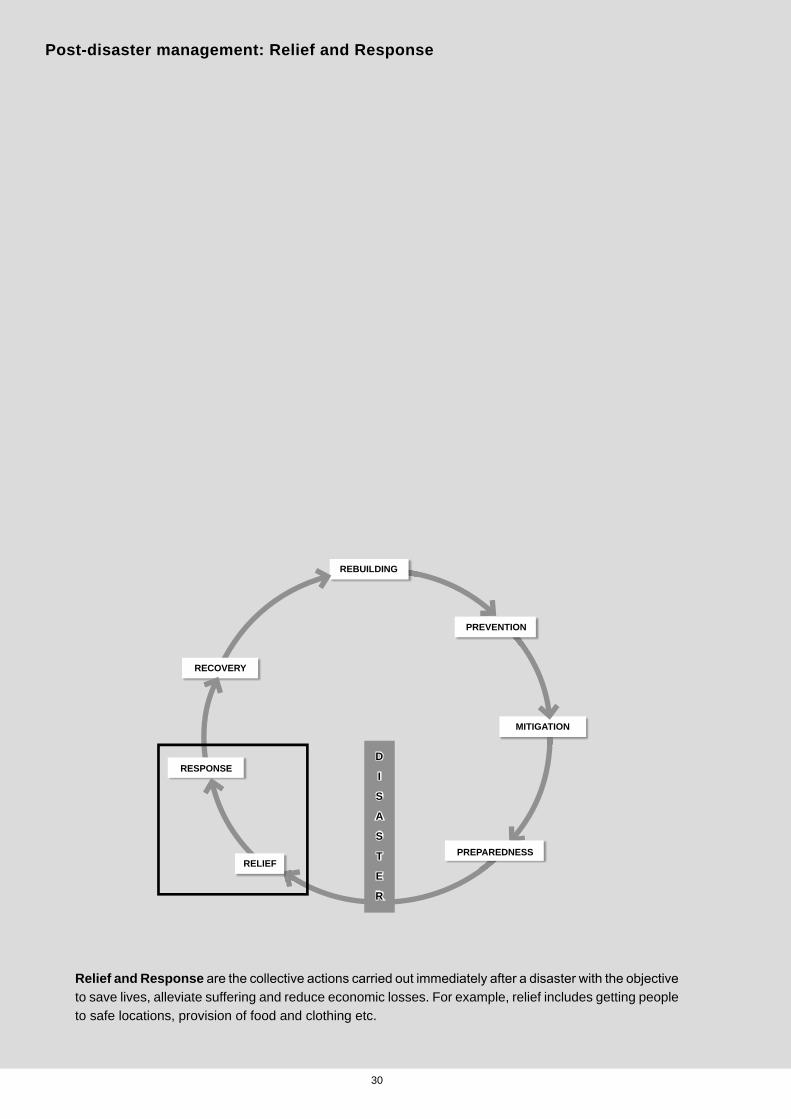
30
Post-disaster management: Relief and Response
Relief and Response are the collective actions carried out immediately after a disaster with the objective to save lives, alleviate suffering and reduce economic losses. For example, relief includes getting people to safe locations, provision of food and clothing etc.
RECOVERY
RESPONSE
PREPAREDNESS
MITIGATION
PREVENTION
REBUILDING
RELIEF
D
I
S
A
S
T
E
R
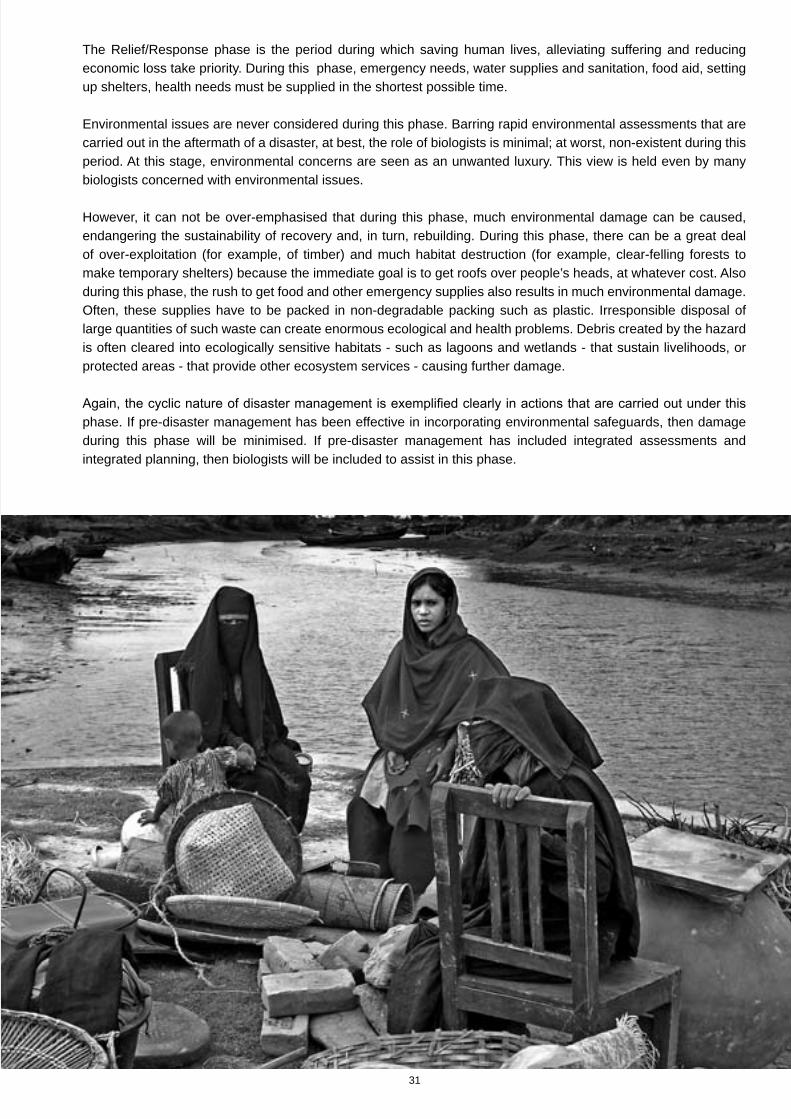
31
The Relief/Response phase is the period during which saving human lives, alleviating suffering and reducing economic loss take priority. During this phase, emergency needs, water supplies and sanitation, food aid, setting up shelters, health needs must be supplied in the shortest possible time.
Environmental issues are never considered during this phase. Barring rapid environmental assessments that are carried out in the aftermath of a disaster, at best, the role of biologists is minimal; at worst, non-existent during this period. At this stage, environmental concerns are seen as an unwanted luxury. This view is held even by many biologists concerned with environmental issues.
However, it can not be over-emphasised that during this phase, much environmental damage can be caused, endangering the sustainability of recovery and, in turn, rebuilding. During this phase, there can be a great deal of over-exploitation (for example, of timber) and much habitat destruction (for example, clear-felling forests to make temporary shelters) because the immediate goal is to get roofs over people’s heads, at whatever cost. Also during this phase, the rush to get food and other emergency supplies also results in much environmental damage. Often, these supplies have to be packed in non-degradable packing such as plastic. Irresponsible disposal of large quantities of such waste can create enormous ecological and health problems. Debris created by the hazard is often cleared into ecologically sensitive habitats - such as lagoons and wetlands - that sustain livelihoods, or protected areas - that provide other ecosystem services - causing further damage.
Again, the cyclic nature of disaster management is exemplified clearly in actions that are carried out under this phase. If pre-disaster management has been effective in incorporating environmental safeguards, then damage during this phase will be minimised. If pre-disaster management has included integrated assessments and integrated planning, then biologists will be included to assist in this phase.
32
As mentioned before, it is during this phase that the cyclic nature of disaster management becomes very clear. Without Prevention (i.e., without mapping and valuing assets, without identifying resource use, dependency and livelihoods) it is not possible for Mitigation and Preparedness to be effective. Without Mitigation and Preparedness (i.e., without clear, empirically and analytically derived policies) the Relief/Response phase can cause great environmental damage, leading to settlements that are unsustainable in the long term and cause great damage in the short term. For example, if environmentally sensitive areas have been identified in the Prevention stage and zoned for no building in the Mitigation phase, then during the Preparedness phase, alternative areas will be identified for putting up shelters in the Relief/Response phase.
The following steps should be followed in the Response phase.
Step 1: Avoid over-exploitation of natural products.
• Ensure that fuelwood and timber are obtained according to plans set during the Preparedness phase. • Ensure that natural resource extraction for shelter and food is carried out according to existing
legislation.
Step 2: Avoid unplanned habitat change.
• Put up shelters only in areas that have been identified for the purpose. • Avoid clearing natural habitats if they have not been identified for clearance in the Prevention phase.
Step 3: Minimise solid waste pollution.
• Dispose of solid waste at locations identified in the previous phase. • Start a process of separating degradable from non-degradable waste and recyclable and reusable waste. • Ensure that incineration is not used as a method of waste disposal, as this contributes to global warming
and air pollution. • Actively train persons at shelters to dispose of waste responsibly.
Step 4: Minimise water pollution.
• Build toilets only in locations identified in the Preparedness phase. • Manage waste water only in the manner identified in the previous phase.
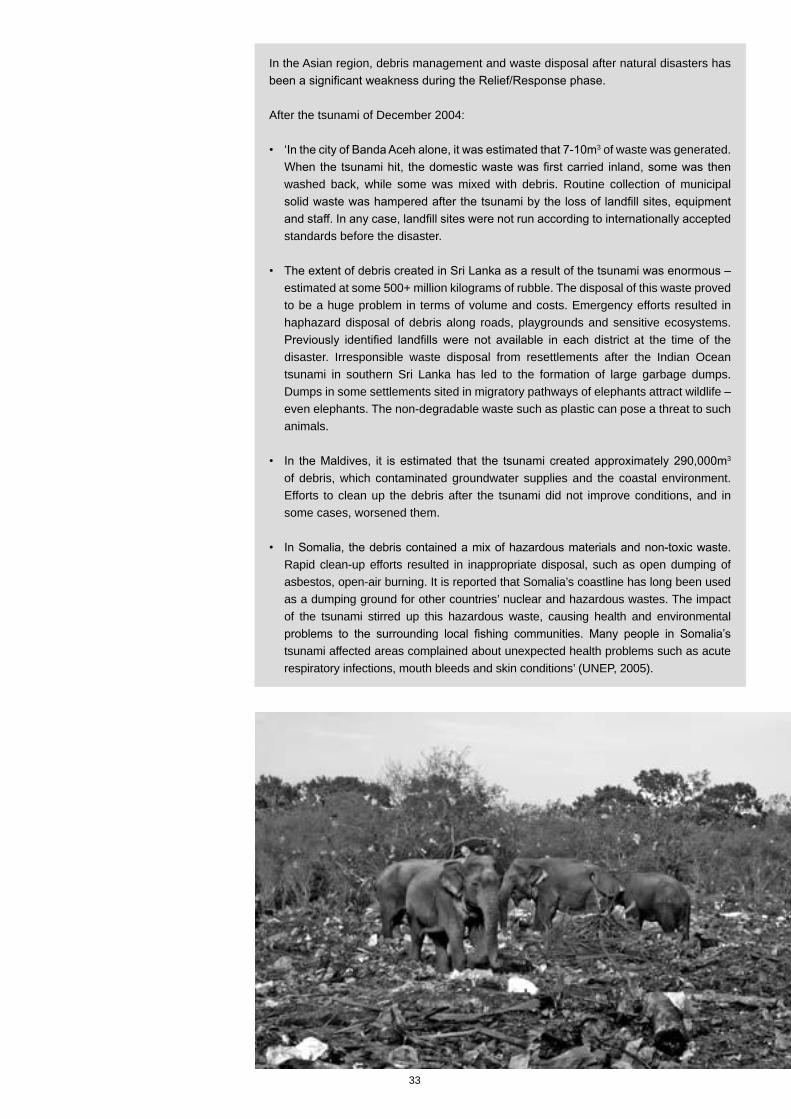
33
In the Asian region, debris management and waste disposal after natural disasters has been a significant weakness during the Relief/Response phase.
After the tsunami of December 2004:
• ‘In the city of Banda Aceh alone, it was estimated that 7-10m3 of waste was generated. When the tsunami hit, the domestic waste was first carried inland, some was then washed back, while some was mixed with debris. Routine collection of municipal solid waste was hampered after the tsunami by the loss of landfill sites, equipment and staff. In any case, landfill sites were not run according to internationally accepted standards before the disaster.
• The extent of debris created in Sri Lanka as a result of the tsunami was enormous – estimated at some 500+ million kilograms of rubble. The disposal of this waste proved to be a huge problem in terms of volume and costs. Emergency efforts resulted in haphazard disposal of debris along roads, playgrounds and sensitive ecosystems. Previously identified landfills were not available in each district at the time of the disaster. Irresponsible waste disposal from resettlements after the Indian Ocean tsunami in southern Sri Lanka has led to the formation of large garbage dumps. Dumps in some settlements sited in migratory pathways of elephants attract wildlife – even elephants. The non-degradable waste such as plastic can pose a threat to such animals.
• In the Maldives, it is estimated that the tsunami created approximately 290,000m3 of debris, which contaminated groundwater supplies and the coastal environment. Efforts to clean up the debris after the tsunami did not improve conditions, and in some cases, worsened them.
• In Somalia, the debris contained a mix of hazardous materials and non-toxic waste. Rapid clean-up efforts resulted in inappropriate disposal, such as open dumping of asbestos, open-air burning. It is reported that Somalia’s coastline has long been used as a dumping ground for other countries’ nuclear and hazardous wastes. The impact of the tsunami stirred up this hazardous waste, causing health and environmental problems to the surrounding local fishing communities. Many people in Somalia’s tsunami affected areas complained about unexpected health problems such as acute respiratory infections, mouth bleeds and skin conditions’ (UNEP, 2005).
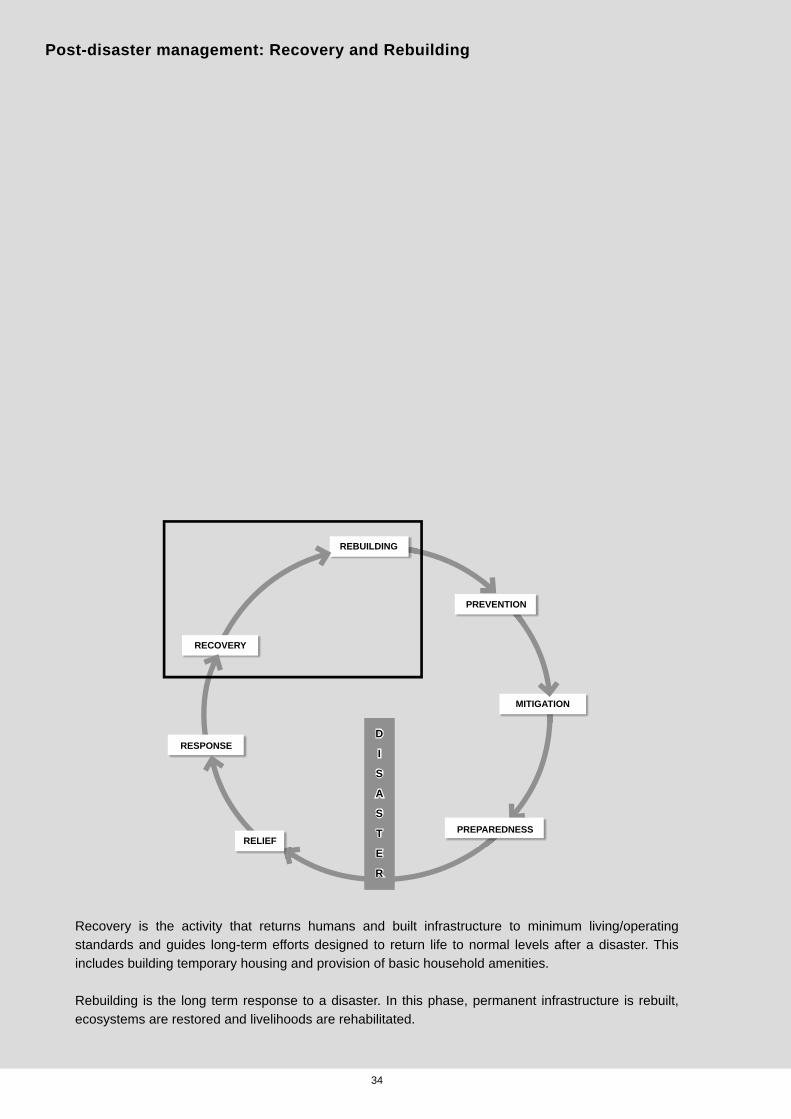
34
Post-disaster management: Recovery and Rebuilding
Recovery is the activity that returns humans and built infrastructure to minimum living/operating standards and guides long-term efforts designed to return life to normal levels after a disaster. This includes building temporary housing and provision of basic household amenities.
Rebuilding is the long term response to a disaster. In this phase, permanent infrastructure is rebuilt, ecosystems are restored and livelihoods are rehabilitated.
RECOVERY
RESPONSE
PREPAREDNESS
MITIGATION
PREVENTION
REBUILDING
RELIEF
D
I
S
A
S
T
E
R
35
Recovery deals with short term responses and Rebuilding, with long term responses. In the short term, temporary housing sites, temporary housing material, arranging for safe removal of debris, decontamination of water etc. are needed.
In the long term, permanent solutions for housing and sanitation, as well as the basic amenities of life are needed.
In both these phases, it is essential to keep in mind the five major drivers of ecosystem loss: over-exploitation, invasive alien species, habitat degradation, pollution and climate change. Every effort must be made to reduce impacts from these threats.
The Indian Ocean tsunami of 2004: a missed opportunity
The Indian Ocean tsunami of 2004 was a disaster of unprecedented proportions and sparked off a massive process of reconstruction, which aimed to meet the urgent need to rebuild shattered settlements and infrastructure. In many cases, these efforts were carried out with little regard for the environment and with little coordination amongst agencies. Yet post-tsunami reconstruction did not create these environmental problems – it merely brought a series of long-term issues sharply into focus. The rapid pace of post-tsunami reconstruction has meant that since January 2004, many of the environmental impacts of haphazard coastal zone development have been illustrated graphically over a short period of time. Although the tsunami provided an opportunity to demonstrate a truly environmentally sustainable approach to coastal zone development, and to apply the many lessons and best practices that have been learned over recent decades, in reality, these critically-needed inputs were most often lacking. This is despite the fact that many people had recognised publicly the need to incorporate environmental concerns into the reconstruction process, and a massive rise in public awareness about ecosystem values (IUCN, 2006).
Numerous guidelines and recommendations were provided to coastal developers, and despite the fact that some tsunami-affected countries have a comprehensive set of laws and regulations governing development in the coastal zone, these do not for the most part seem to have been followed in the post-tsunami reconstruction process.
Indiscriminate dumping of tsunami debris in wetlands has decreased fish catch; decreased water depth and diminished water storage during the drought period. A sudden increase in the extraction of timber and land requirements for housing units has resulted in deforestation. This, in turn, has resulted, in some areas, in habitat loss for species such as elephants, thereby increasing human-elephant conflict, and not only depleting livelihoods (damaging crops) but also causing deaths of both humans and elephants. Increased sand mining for building is another issue that has the potential to severely affect coastal morphology. The over-supply of boats and fine-meshed nets, and consequential over-fishing has the potential to wreak havoc on the fisheries sector. Improper management of solid waste at the shelter sites is a serious and ever-increasing health hazard. These environmental concerns were overridden either to achieve rapid results on the ground or by some cosmetic work to satisfy internal environmental standards, if any. That sound environmental conditions are essential to the sustainable revival of communities and to long term livelihoods and economic security has been ignored largely. Frequently, the environment is seen as a stumbling block to rehabilitating efficiently disaster victims. In addition, governmental environment agencies have little influence in decision-making processes (IUCN, 2006).
Although post tsunami reconstruction has wound down, as described in Volume, 1 natural disasters will recur. It is essential that we learn from the missed opportunity of post-tsunami reconstruction and ensure that present and future disaster management incorporate environmental safeguards as integral components of their work plans and strategies (IUCN, 2006).
36
The following steps should be followed in the processes of both recovery and rebuilding (short-term and long-term responses).
Step 1: Ensure that you carry out a post-disaster integrated assessment in order to obtain a complete picture of the state of the ecosystem well-being and human well-being after the disaster.
• Comparison of these data with the baseline data obtained in the Prevention stage will allow for clear analysis and informed decision-making. Refer to Volume 3 for a worksheet that can be adjusted to suit this stage. The economic valuation and livelihoods data from pre and post disaster assessment will feed into the ecosystem and biodiversity assessment data.
Step 2: Ensure that there is no over-exploitation of species.
• For example, is timber and sand extraction sustainable and legal?
Step 3: Ensure that existing legislation is followed.
• Sometimes there are only a few laws related to building and protected areas; in contrast, sometimes there are a plethora of relevant laws as shown in the box under the Mitigation section. (See page 23.)
In Aceh, the 800,000ha Gunung Leuser National Park - part of a World Heritage Site - is a biodiversity hotspot, with some 700 different animal species and about 4,500 plant species. It is home to some 4% percent of all known bird species. The ecosystem is also rich in tropical hardwood trees, which fetch a high price on international markets.
After the 2004 tsunami, workers were illegally logging timber for temporary shelters. All Indonesian forests are over-logged by a factor of three, mostly through illegal logging. Eight million cubic metres of timber was needed for rebuilding (equal to four times the size of Singapore) WWF, Conservation International and others started a ‘Timber Aid’ programme. British Red Cross, Oxfam, and Premiere Urgence imported sustainably-logged timber from Australia and New Zealand, instead of using timber from unmanaged forests (WWF, 2005).
The Indian ocean tsunami of December 2004 served to highlight the lack of proper regulatory policies and laws in affected Asian countries. ‘Only India and Sri Lanka have laws or regulations in force specifically governing the coastal zone. India’s Coastal Regulation Zone Notification totally prohibits development in mangrove ecosystems, but for various reasons the Notification is not enforced consistently. In Sri Lanka, the Coast Conservation Act governs the coastal zone, but mangroves are governed by the Forest Act, which opens the door to conflicts of jurisdiction under the two laws and inadequate enforcement of both. In July 2006, Thailand finalised a draft ICM law, which may be considered for adoption in 2007. Indonesia is in the process of preparing an ICM law. The Maldives does not currently have a regulatory regime for ICM or for mangroves’ (IUCN, 2006).
In 2001, an earthquake hit Bhuj city in Gujarat, in India. Good seismic codes of practice exist in India, but they were not enforced nor was building construction inspected properly, leading to heavy damage of 179 high-rise buildings in Ahmedabad, 230km from the epicentre.
In contrast, in 1977, a group of volunteers from AWARE built 1,500 houses in Andra Pradesh, India, following a cyclone that damaged coastal areas. These houses used government cyclone-proof designs, and of these, 98% withstood a stronger cyclone that hit the region in 1990 (http://www.proventionconsortium.org/themes/default/pdfs/tools_for_mainstreaming_GN12.pdf).
Step 4: Ensure that proper design standards are followed.
• Avoid using designs that are not appropriate and lack use of environmentally-friendly materials and climate-proofing.
• Avoid forcing culturally unsuitable designs onto communities. i.e., designs should be drawn up with community input.
• Ensure that gender concerns are integrated into designs, while making them environmentally-friendly and climate-proof.
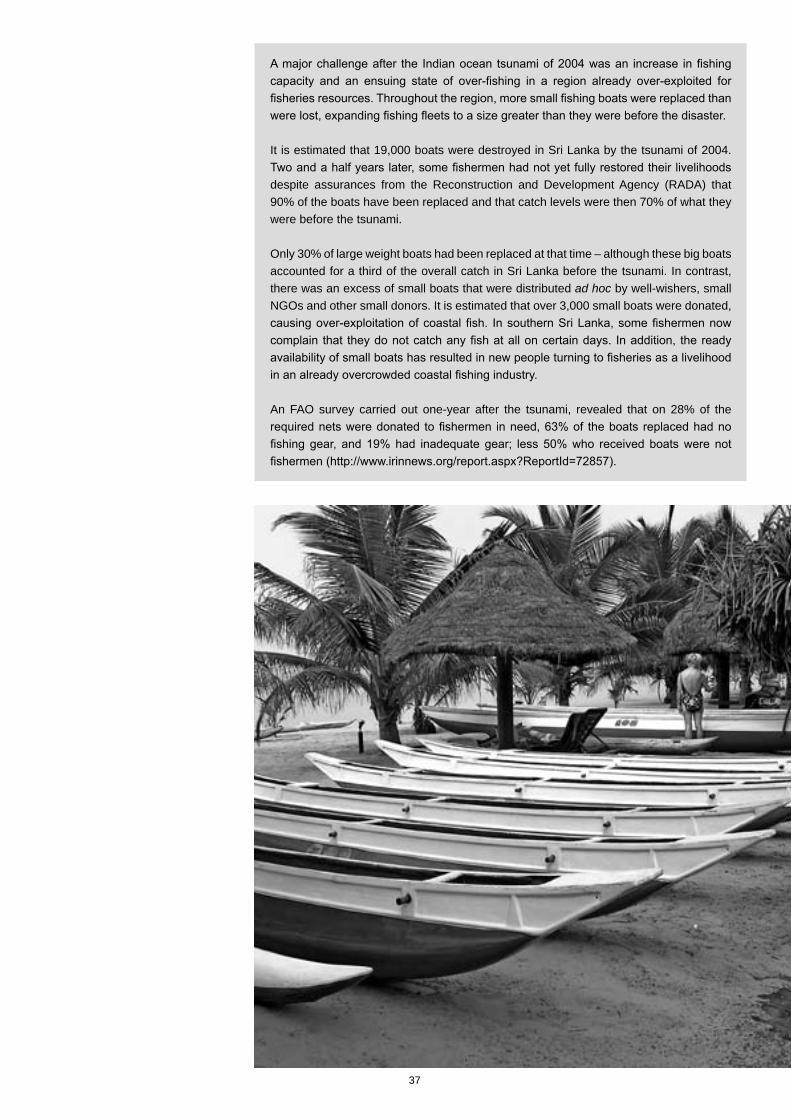
37
A major challenge after the Indian ocean tsunami of 2004 was an increase in fishing capacity and an ensuing state of over-fishing in a region already over-exploited for fisheries resources. Throughout the region, more small fishing boats were replaced than were lost, expanding fishing fleets to a size greater than they were before the disaster.
It is estimated that 19,000 boats were destroyed in Sri Lanka by the tsunami of 2004. Two and a half years later, some fishermen had not yet fully restored their livelihoods despite assurances from the Reconstruction and Development Agency (RADA) that 90% of the boats have been replaced and that catch levels were then 70% of what they were before the tsunami.
Only 30% of large weight boats had been replaced at that time – although these big boats accounted for a third of the overall catch in Sri Lanka before the tsunami. In contrast, there was an excess of small boats that were distributed ad hoc by well-wishers, small NGOs and other small donors. It is estimated that over 3,000 small boats were donated, causing over-exploitation of coastal fish. In southern Sri Lanka, some fishermen now complain that they do not catch any fish at all on certain days. In addition, the ready availability of small boats has resulted in new people turning to fisheries as a livelihood in an already overcrowded coastal fishing industry.
An FAO survey carried out one-year after the tsunami, revealed that on 28% of the required nets were donated to fishermen in need, 63% of the boats replaced had no fishing gear, and 19% had inadequate gear; less 50% who received boats were not fishermen (http://www.irinnews.org/report.aspx?ReportId=72857).
38
Step 5: Minimise habitat change.
• Ensure that sensitive areas/ecologically and economically valuable areas (identified in the Prevention stage) are not cleared for buildings or resettlements.
• Ensure that coastal/mountain morphology is not changed by built infrastructure.
Step 9: Prevent the spread of invasive alien species.
• Check whether IAS are spreading. Building equipment is known to a mechanism through which IAS spread.
Step 6: Minimise pollution.
• Check whether the area is being polluted by the process. • Check whether there is collection of non-biodegradable solid waste. • Check how solid waste is being collected and disposed. • Check whether an effort is being made to reduce, reuse and recycle waste. • Check whether the air is being polluted by the process. • Check whether air pollution control measures are in place.
Step 7: Be careful about disposal of debris.
• Before disposing debris, contact the relevant authorities for identification of recommended disposal sites. • Prevent irresponsible dumping of waste. • Provide safety training and involve communities in sorting waste.
Step 8: Create awareness among communities about responsible disposal of waste.
• This is very important for long term mitigation.
Some post tsunami permanent settlements in Southern Sri Lanka have been sited in areas known to be used as migratory pathways by elephants. This has likely worsened the human-elephant conflict: deaths, damage to crops and houses (IUCN, 2006).
In southern Sri Lanka, Prickly Pear (Opuntia dillenii) has spread in sand dunes and beaches after the tsunami, preventing the regeneration of natural beach vegetation such as Spinifex. Salvinia and Water hyacinth (Eichhornia crassipes) have spread in lagoons and estuaries (Bambaradeniya et al., 2006).
Tsunami debris in Koh Phra Thong, Thailand generated large quantities of solid and liquid waste, from damaged sewage tanks, cesspits and overflowing mains, together with waste material blocking water drainage systems and sewers, increasing the threat of water borne diseases.
‘Deeply concerned about the waste disposal mechanism and its cascading effect, the International Union for the Conservation of Nature (IUCN) took up the challenge of creating awareness about solid waste disposal among community members. IUCN has, to date, trained over eighty people in waste management practices in the island of Phra Thong, to say “no’” to plastic bags, to separate waste into recyclable, non-recyclable and reusable waste, to sell waste for income generation and to use fruit scraps and other organic garbage to make detergents’ (IUCN, 2006).
39
Step 10: Ensure that water is not polluted.
• Are resources protected from further contamination, such as faecal waste? • Are organic and inorganic debris disposed of in a proper manner so that water bodies are not polluted? • Do housing and new construction ensure good sanitation facilities and sewage systems? • Do construction designs ensure good drainage systems in place as approved by relevant local authorities?
Step 11: Ensure that measures are taken to mitigate the impacts of and to adapt to climate change.
• Are communities that are most vulnerable to natural disasters identified? (See Hazard and Risk mapping, this volume.)
• Have women been identified as an important group for climate change mitigation and adaptation? • Are energy conservation measures being adopted? For example, is there through-flow ventilation in
hot climates? Are energy-saving bulbs and alternate energy sources-such as solar power-being used where ever possible?
• Are water conservation measures are being adopted? For example, in drought prone areas, is there provision for rain water harvesting?
• Is waste water managed hygienically? Are toilets being built at safe distances from drinking water sources? • Are environmentally-friendly materials used as much as possible?
Step 12: Ensure that ecosystems and natural habitats are conserved, restored and created.
• Are efforts being made to replant and landscape during structural changes? • Is ecosystem restoration being carried out with reference to existing national laws and with reference
to existing resource maps? • Is ecosystem restoration being carried out by matching local needs and priorities the services that
ecosystems provide, rather than implementing land use patterns in a top-down manner? • Are native, multiple-use and locally beneficial species being used while carrying out restoration? • Are efforts being made to ensure that replanting is carried out only in suitable areas? For example,
mangrove replanting in many areas in Asia was carried out in areas where there previously had been no mangroves or where sand dunes - essential for the prevention of coastal erosion - were flattened for this purpose.
• Are efforts being made to ensure that only indigenous species - native to the specific area - being used? For example, using plant species found in the wet zone of Sri Lanka to replant areas of the dry zone will be doomed to fail, as these plants will lack xeromorphic4 adaptations necessary for the dry zone.
• Are efforts in place to ensure that identified IAS are never used? • Are all relevant government departments - such as the Forest Department, the Coast Conservation
Department, Environmental Authority, Urban Authority and the Department of Wildlife Conservation - consulted from the beginning and do they play a central role in restoration together with the local communities?
• Is a landscape approach to restoration adopted? Ecosystems do not function as closed units but as open systems that are affected by ecological process that occur on a larger scale. Because of this, it is necessary to look at the broader picture, not just the specific restoration site alone.
4 Xeromorphic adaptations allow plants to conserve water.
Various development and humanitarian agencies were responsible for setting up new settlements after the tsunami. Although each organisation adhered to standards that required sewage collection tanks to be sited a certain distance from buildings, because of a lack of coordination, the distance between the tanks built by one organisation and the houses built by another did not meet the minimum required standard. This was observed in northern Sri Lanka (Ali Raza Rizvi, personal communication).
In Rajastan, India, village communities are trained to build rainwater cisterns. During the monsoons, rainwater is collected by channels which run into the cisterns. Each cistern can store 40,000 litres and is shared by three families. When full, the cistern can provide drinking water for these families all year round. It can also be used to store water brought in by tankers in times of drought (Reid & Simms, 2007).
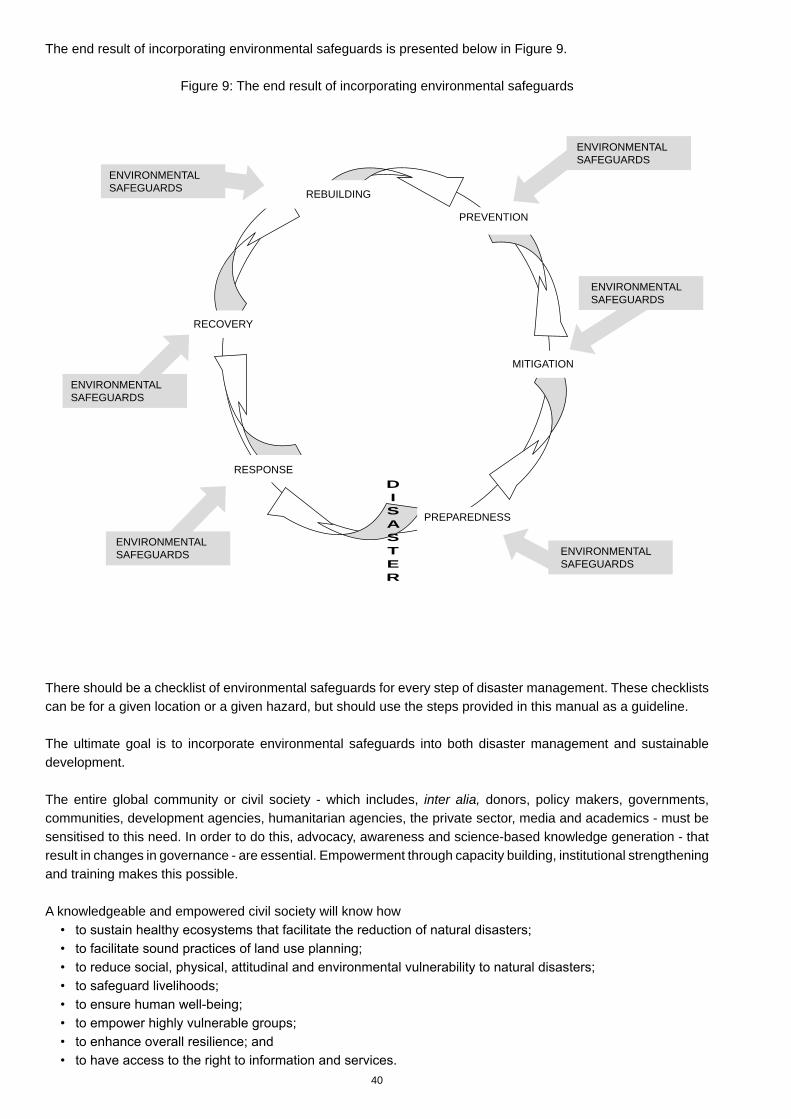
40
The end result of incorporating environmental safeguards is presented below in Figure 9.
There should be a checklist of environmental safeguards for every step of disaster management. These checklists can be for a given location or a given hazard, but should use the steps provided in this manual as a guideline.
The ultimate goal is to incorporate environmental safeguards into both disaster management and sustainable development.
The entire global community or civil society - which includes, inter alia, donors, policy makers, governments, communities, development agencies, humanitarian agencies, the private sector, media and academics - must be sensitised to this need. In order to do this, advocacy, awareness and science-based knowledge generation - that result in changes in governance - are essential. Empowerment through capacity building, institutional strengthening and training makes this possible.
A knowledgeable and empowered civil society will know how • to sustain healthy ecosystems that facilitate the reduction of natural disasters; • to facilitate sound practices of land use planning; • to reduce social, physical, attitudinal and environmental vulnerability to natural disasters; • to safeguard livelihoods; • to ensure human well-being; • to empower highly vulnerable groups; • to enhance overall resilience; and • to have access to the right to information and services.
Figure 9: The end result of incorporating environmental safeguards
REBUILDING
PREVENTION
MITIGATION
PREPAREDNESS
RESPONSEDISASTER
RECOVERY
ENVIRONMENTALSAFEGUARDS
ENVIRONMENTALSAFEGUARDS
ENVIRONMENTALSAFEGUARDS
ENVIRONMENTALSAFEGUARDS
ENVIRONMENTALSAFEGUARDS
ENVIRONMENTALSAFEGUARDS
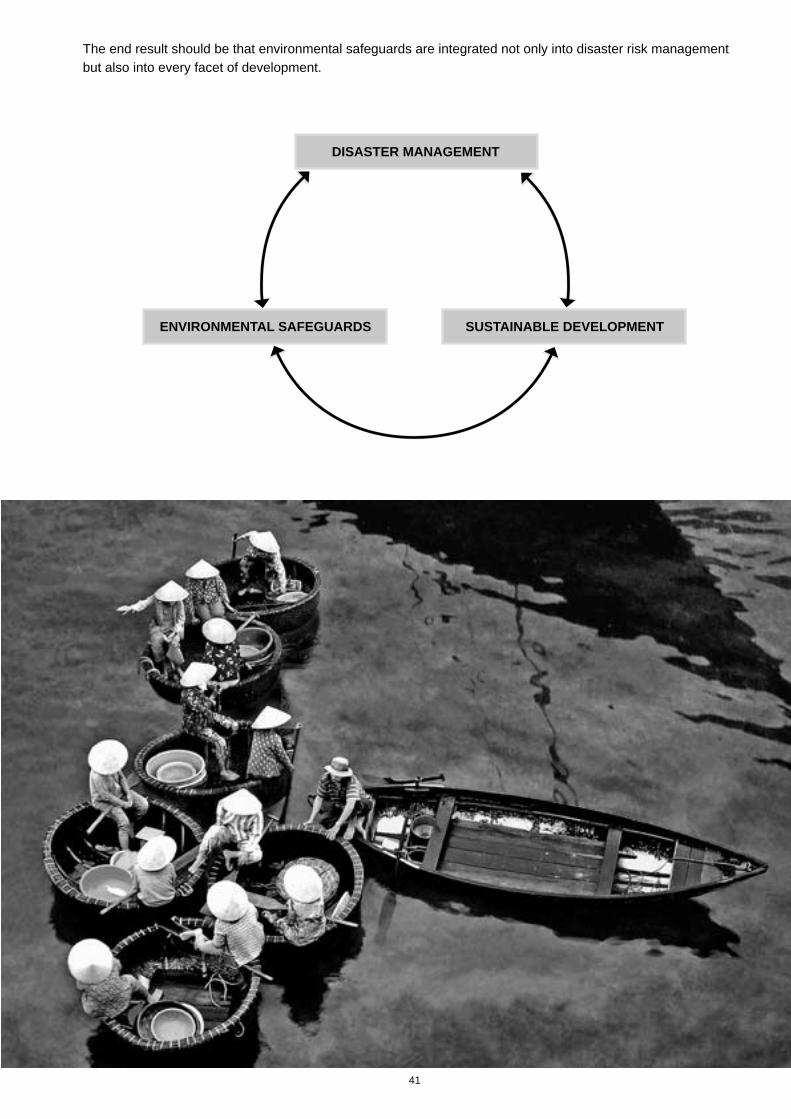
41
The end result should be that environmental safeguards are integrated not only into disaster risk management but also into every facet of development.
DISASTER MANAGEMENT
SUSTAINABLE DEVELOPMENTENVIRONMENTAL SAFEGUARDS
42
References
Asian Development Bank (2007). Regional Technical Assistance Report. Project Number: 40292 http://www.adb.org/Documents/TARs/REG/40292-REG-TAR.pdf
Bambaradeniya, C. N. B., Perera, M. S.J. and V. A. M. P. K. Samarawickrama (2006). A rapid assessment of post-tsunami environmental dynamics in relation to coastal zone rehabilitation and development activities in Hambantota District of southern Sri Lanka. IUCN Sri Lanka Occasional Paper No. 10. Colombo, Sri Lanka: IUCN. 27pp.
Coburn, A. W., Spence, R. J. S. and A. Pomores (1994). Disaster Mitigation. 2nd ed. Cambridge: Cambridge Architectural Research Ltd. pp 64.
GDRC (2008) http://www.gdrc.org/uem/disasters/1-dm_cycle.html
http://en.wikipedia.org/wiki/2004_Indian_Ocean_earthquake
http://iri.columbia.edu/~mahaweli/disaster/concept.html
http://secap480.un.org/search?q=early+warning+systems&Submit=Search&ie=utf8&site=un_org&output=xml_no_dtd&client=UN_Website_English&num=10&proxystylesheet=UN_Website_English&oe=utf8
http://www.irinnews.org/report.aspx?ReportId=72857
http://www.proventionconsortium.org/themes/default/pdfs/tools_for_mainstreaming_GN12.pdf
http://www.redcross.org/
http:// www.riskmanagement.qld.gov.au/info/guide/gls.htm
http://www.unep-wcmc.org/protected_areas/ categories/ index.html
http://www.undp.bg/uploads/documents/1196_638_en.pdf
http://www.un.org/News/Press/docs/2005/hab196.doc.htm
IUCN (2006). Coastal Ecosystems 2: November 2006. http://data.iucn.org/places/asia/coastalinfo/docs/Coastal_Ecosystems_newsletter2.pdf
IUCN (2006a). Environmental stories after the Tsunami. http://data.iucn.org/places/asia/coastalinfo/docs
IUCN (2005). Series on Best Practice Guidelines (Sri Lanka) After the Tsunami: Knowing about Environmental Policies and Legislation Information Paper No. 9 http://data.iucn.org/places/asia/coastalinfo/docs/Best_practice_guidelines_9_environmental_laws.pdf
IUCN and UNEP (2006) Counting the Environmental Costs of Natural Disasters: Evaluating Tsunami-Related Damages to Coastal Ecosystems in Thailand. Prepared by Usman A. Iftikhar. Colombo: Ecosystems and Livelihoods Group Asia, The World Conservation Union (IUCN). 36 pp.
Kallesøe, M. F., Bambaradeniya, C. N. B. , Iftikhar, U. A., Ranasinghe, T. and S. Miththapala (2008). Linking Coastal Ecosystems and Human Well-Being: Learning from conceptual frameworks and empirical results. Colombo: Ecosystems and Livelihoods Group, Asia, IUCN. viii + 49 pp.
OECS (2003) Technical Manual for Post-disaster Rapid Environmental Assessments, Volume 1 & 2. http://www.caribank.org/titanweb/cdb/webcms.nsf/AllDoc/9E2B73C29C5CB1A1042573D100546360/$File/OECSManualVolume_1_Final.pdf
Reid, H., Simms, A. and V. Johnson (2007). Up in smoke? Asia and the Pacific. The threat from climate change to human development and the environment. International Institute for Environment and Development. 95 pp.
Springate-Baginski, O., Darwall, W., Emerton, L., Allison, E., McIvor, A. and C. Bambaradeniya (in press). A Toolkit for Integrated Wetland Assessment. Cambridge: Freshwater Biodiversity Assessment Unit, International Union for Conservation of Nature.
UNEP (2005). After the Tsunami: Rapid Environmental Assessment. http://www.unep.org/tsunami/situation_rpt.asp. 140 pp.
Wikramanayake, E (2008). Forest cover in Sri Lanka. Unpublished map.
World Widlife Fund (2005). One Year After the Tsunami: Building Back the Right Way. http://www.worldwildlife.org/who/media/press/2005/WWFPresitem823.html
Zubair, L. and V. Ralapanawe (2008) Identification of Global Natural Disaster Risk Hotspots - Sri Lanka Case Study http://iri.columbia.edu/~mahaweli/disaster/concept.html

43
Photocredits
Page number
Caption Credit
Frontpiece Earthquake damage, Pakistan. © Karl Schuler, IUCN
iii Tsunami damage, east coast Sri Lanka. © IUCN Sri Lanka
iv Mangrove destruction by the tsunami, southern Sri Lanka © Vimukthi Weeratunge
vi Erosion as a result of floods in Bangladesh. © Mahbubur Rahman Masum, IUCN Bangladesh
vii Earthquake damage in Pakistan. © Karl Schuler, IUCN
9 Fisherman casting net, Sri Lanka. © Luxmanan Nadarajah
13 Sprats for sale in Sri Lanka. © Sriyanie Miththapala
19 Adam’s Peak, in Peak Wilderness Sanctuary, Sri Lanka © Gehan de Silva Wijeyeratne
22 Rebuilding after the tsunami, southern Sri Lanka. © IUCN Sri Lanka
25 Traffic and crowds in Hanoi, Viet Nam. © Sriyanie Miththapala
29 Floating beds, Bangladesh. © Haseeb Irfanullah/IUCN Bangladesh
31 People looking for shelter after floods, Bangladesh. © Mahbubur Rahman Masum, IUCN Bangladesh
33 Elephants near garbage dump, southern Sri Lanka. © Prithiviraj Fernando
37 Donated boats, west coast of Sri Lanka. © Hasantha Lokugamage, Jetwing Hotels
41 Fisherwomen, Viet Nam. © IUCN Viet Nam
43 Community based mangrove restoration, southern Sri Lanka. © Vimukthi Weeratunge

Integrating environmental safeguards into Disaster Management: a field manual
Integrating environmental safeguards into D
isaster Managem
ent: a field manual
Volum
e 2: The D
isaster Managem
ent Cycle
Sriyanie Miththapala
Volume 2: The Disaster Management Cycle
Ecosystems and Livelihoods Group Asia
IUCN 4/1 Adams Avenue
Colombo 4 Sri Lanka
Phone: + 94 11 2559634 Fax: +94 11- 2559637
E-mail: [email protected]://data.iucn.org/places/asia/coastalinfo/
© 2008 IUCN, International Union for Conservation of Nature and Natural Resources
Opinions expressed in this paper do not necessarily reflect the official views of IUCN or its members.
The IUCN Asia region covers 23 countries, stretching from Pakistan in the West to Japan in the East, Indonesia in the South to Mongolia in the North. IUCN maintains offices in Bangladesh, Cambodia, China, Lao PDR, Nepal, Pakistan, Sri Lanka, Thailand and Viet Nam. The Asia Regional Office is in Bangkok, Thailand.
IUCN’s seven regional thematic programmes, known collectively as the Ecosystems and Livelihoods Group (ELG), are based in two clusters: one in Colombo, Sri Lanka (environmental economics, marine and coastal, species conservation), and one in Bangkok, Thailand (environmental law, forests, protected areas, wetlands and water resources).
Ecosystems and Livelihoods Group, Asia, IUCN
9368
- I
UC
N B
ook
(Dis
aste
r M
anag
emen
t V
ol.
1) 1
75#
15/1
/200
9
Integrating environmental safeguards into Disaster Management: a field manual
Compiled by Sriyanie Miththapala
Volume 3: Tools, techniques and relevant resources
Ecosystems and Livelihoods Group, Asia, IUCN

Integrating environmental safeguards into Disaster Management: field manualVolume 3: Tools, techniques and relevant resources
i
compiled by Sriyanie Miththapala
Ecosystems and Livelihoods Group, Asia, IUCN
Integrating environmental safeguards into Disaster Management: field manualVolume 3: Tools, techniques and relevant resources
ii
This document was produced under the project ‘Rehabilitating coastal ecosystems in a post-tsunami context: Consolidation Phase’ carried out with financial support from the Autonomous Organisation for National Parks (Organismo Autónomo Parques Nacionales - OAPN) of the Ministry of Environment of Spain. The designation of geographical entities in this technical report, and the presentation of the material, do not imply the expression of any opinion whatsoever on the part of IUCN or OAPN concerning the legal status of any country, territory, or area, or of its authorities, or concerning the delimitation of its frontiers or boundaries. The views expressed in this publication do not necessarily reflect those of IUCN or OAPN.
Published by: Ecosystems and Livelihoods Group Asia, IUCN, International Union for Conservation of Nature and Natural Resources.
Copyright: © 2009, International Union for Conservation of Nature and Natural Resources.
Citation: Miththapala S (2009). Incorporating environmental safeguards into disaster risk management. Volume 3: Tools, techniques and other resources. Colombo: Ecosystems and Livelihoods Group, Asia, IUCN. viii+142 pp.
Reproduction of this publication for educational or other non-commercial purposes is authorized without prior written permission from the copyright holder provided the source is fully acknowledged.
Reproduction of this publication for resale or other commercial purposes is prohibited without prior written permission of the copyright holder.
ISBN: 978-955-8177-88-4 Cover Photo: Damage from the Indian Ocean tsunami of 2004, eastern coast, Sri Lanka © IUCN, Sri Lanka.
Design: Sriyanie Miththapala
Produced by: Ecosystems and Livelihoods Group Asia, IUCN.
Printed by: Karunaratne & Sons (Pvt) Ltd. 67 UDA Industrial Estate Katuwana Road Homagama Sri Lanka [email protected]
Available from: Ecosystems and Livelihoods Group, Asia IUCN 4/1, Adams Avenue Colombo 4 Sri Lanka Phone: +(9411) 255 9634-5 Fax: +(9411) 255 9637 email: [email protected] website: http://www.iucn.org/about/work/initiatives/about_work_global_ini_
mangr/oapn/index.cfm
iii
Contents
Foreword vAcknowledgements viExecutive summary viiNeeds for integrated assessments 2Worksheet for integrated assessments 6Analysing data 14Biodiversity assessment techniques 18Rapid environmental impact assessments 28Economic valuation methodology 34Livelihoods assessment methodology 54CRISTAL - a community-based risk screening tool 76IUCN’s best practice guidelines for environmentally sound reconstruction after the tsunami 78Community-based Disaster Risk Management 112 The Cairo Principles 114The Hyogo Framework of Action 124Asian Disaster Preparedness Center (ADPC) 128Environmental Personnel Network and Disaster Environment Working Group for Asia 130The Sphere Standards 132The UNHCR handbook for emergencies 134Guidelines for gender sensitive disaster management 138Photocredits 140
List of Figures
Figure 1: Species recruitment curve 23Figure 2: Decision making matrix for EIA 29Figure 3: Strategic environmental assessment 31Figure 4: Environmental protection in disaster response 32Figure 5: Steps, stages and methods for the valuation of wetlands 35Figure 6: The total economic cost of wetlands 37Figure 7: Methods for wetland valuation 38
List of Tables
Table 1: Contextual differences between normal and disaster assessments 31Table 2: The REA process in context 32Table 3: Rating damage intensity 33Table 4: Overall damage assessment 33Table 5: Response options 33Table 6: Valuation checklist #1: identifying and listing wetland values 51Table 7: Valuation checklist #2: selecting wetland costs and benefits to be valued 51Table 8: Valuation checklist #3: choosing wetland valuation techniques 52Table 9: Valuation checklist #4: identifying data needs and sources 52Table 10: Three-day data collection and analysis process 56Table 11: Key emergency indicators 135Table 12: Typical infrastructure requirements 135Table 13: Site planning for emergencies 136
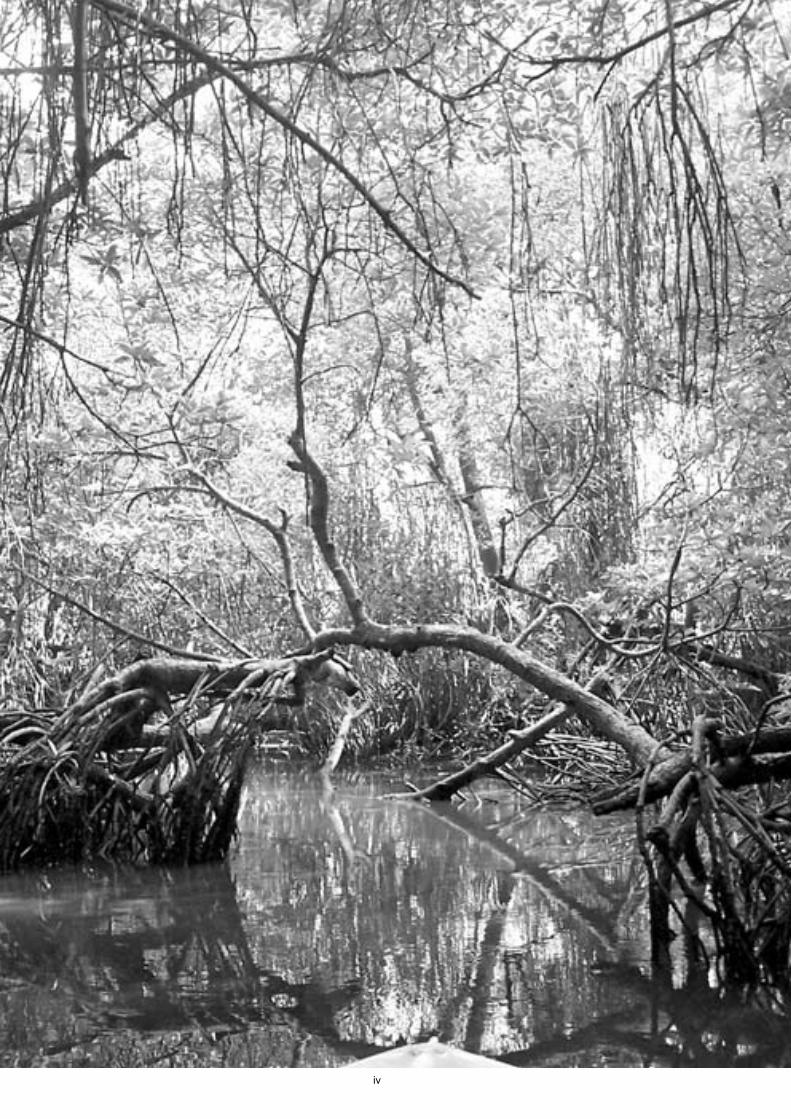
iv
v
Foreword
The devastation caused by the 2004 Asian tsunami and the subsequent world response were unprecedented. IUCN acted promptly and undertook many initiatives to combat the destruction of local ecosystems. IUCN Asia led this process and many of its country offices and programmes played their due role. Since then, the Ecosystems and Livelihoods Group of IUCN Asia, based in Colombo, has continued to play an important role in the post-tsunami scenario. The interventions have now evolved from emergency response and rapid environmental assessments to disaster risk reduction programming. Disaster risk reduction for most organisations is a relatively new area, though mainstream aid and humanitarian organisations are adept at disaster response. While most of us are working at different levels of the DRR spectrum, the objective remains a common one: ensuring human well being.
IUCN Asia is working in the DRR sector with a two-pronged approach: to infuse environmental safeguards into the mainstream disaster risk reduction programme; and to integrate disaster risk reduction into conservation and sustainable development programming.
Over the years, varied methodologies, frameworks and approaches have been used towards this end. We have had many successes and also failures in this process and keep learning and modifying our strategies. Here, the key is to continue sharing our lessons learned and helping each other in incorporating these in our respective strategies.
We are happy to share that in the course of the above process, IUCN has developed a manual, ‘Incorporating environmental safeguards into disaster risk management’ through the financial support of OAPN, Ministry of Environment, Spain. This manual comprises three-volumes detailing ecosystem linkage with human well-being; presenting approaches to integrate environmental considerations into mainstream disaster management programmes; and providing tools, including worksheets, for planning and implementation of environmentally-infused disaster risk management initiatives.
In addition, we are exploring the possibilities of developing hazard-specific modules to help incorporate environmental safeguards into community-based disaster management initiatives aiming at enhancing community resilience for disaster management.
We are grateful to Dr. Sriyanie Miththapala whose dedicated research, commitment and determined efforts made it possible to produce this three-volume manual.
The manual is a working document, your comments and feedback will be received gratefully. We intend to keep working to make this as relevant, practical and user-friendly as possible. We do hope that this manual will contribute positively towards achieving the main objective of all the organisations and agencies involved in this sector which is sustainable human well being.
Ali Raza RizviRegional Group HeadEcosystems and Livelihoods Group Asia, IUCNColombo, Sri Lanka
vi
Acknowledgments
Many people assisted with the preparation and production of this manual. The author expresses her grateful thanks to Saima Baig, Channa Bambaradeniya, Lucy Emerton, Janaki Galappatti, Ranjit Galappatti, Usman Ifthikar, Mikkel Kallesøe, Soosaipillai Karunakaran, Sanjeewa Lellwala, Maeve Nightingale, Thushara Ranasinghe, Ali Raza Rizvi and Devaka Weerakoon for content inputs and comments. Shehani Peris proof-read the document.
Many people generously provided photographs for use. They are credited individually at the end of the book.
This document was produced and published with financial support through a grant made from theAutonomous Organisation for National Parks (Organismo Autónomo Parques Nacionales - OAPN) of the Ministryof Environment of Spain - to IUCN.
vii
Executive summary
The first two volumes of this field manual focused on providing background reference material and detailing steps that should be taken during the disaster management cycle in order to integrate environmental safeguards into disaster management. In the second volume, the importance of carrying out integrated assessments was described.
In this volume, a worksheet is presented in a way that it can be copied and used in the field. Initially, a list of needs for carrying out integrated assessments is itemised. Technical documents that describe assessment techniques for each of the sections of integrated assessments - viz biodiversity and ecosystem services, environmental impact assessments, livelihoods and economic valuation - follow as resource material.
Simple methods for analysing data obtained from integrated assessments are presented.
Also presented in this volume is the methodology for Rapid Environmental Impact Assessments and a summary about Strategic Environmental Assessments. Another tool for use - the CRISTAL tool for community-based risk assessment - is also described briefly.
Reproduced in this volume is a series of best practice guidelines prepared after the Indian Ocean tsunami by the International Union for the Conservation of Nature (IUCN, Sri Lanka Office) to make post tsunami restoration work environmentally sound and sustainable. The guidelines present the issues, impacts, the needs, guiding principles and key steps to follow for a series of 14 topics: 1) Where to build; 2) Invasive alien species; 3) Materials for reconstruction; 4) Beach clean ups; 5) Solid waste management; 6) Recovery of marine ecosystems; 7) Restoring tourism; 8) Preparing for natural disasters; 9) Environmental laws; 10) Restoring terrestrial ecosystems; 11) Water pollution; 12) Restoring wetlands; 13) Restoring home gardens and 14) Safeguarding marine protected areas. These guidelines can be adapted easily to fit a specific situation at a specific locale.
Briefs about the Cairo Principles, the Hyogo Framework of Action and Sphere Humanitarian Charter and Minimum Standards in Disaster Response are also presented. Background information on the Emergency Personnel Network (EPN) and the Disaster Environment Working Group for Asia (DEWGA) is also given. The UNHCR handbook for emergencies is also summarised. Finally, guidelines for gender sensitive disaster management are also reproduced as reference material.

viii
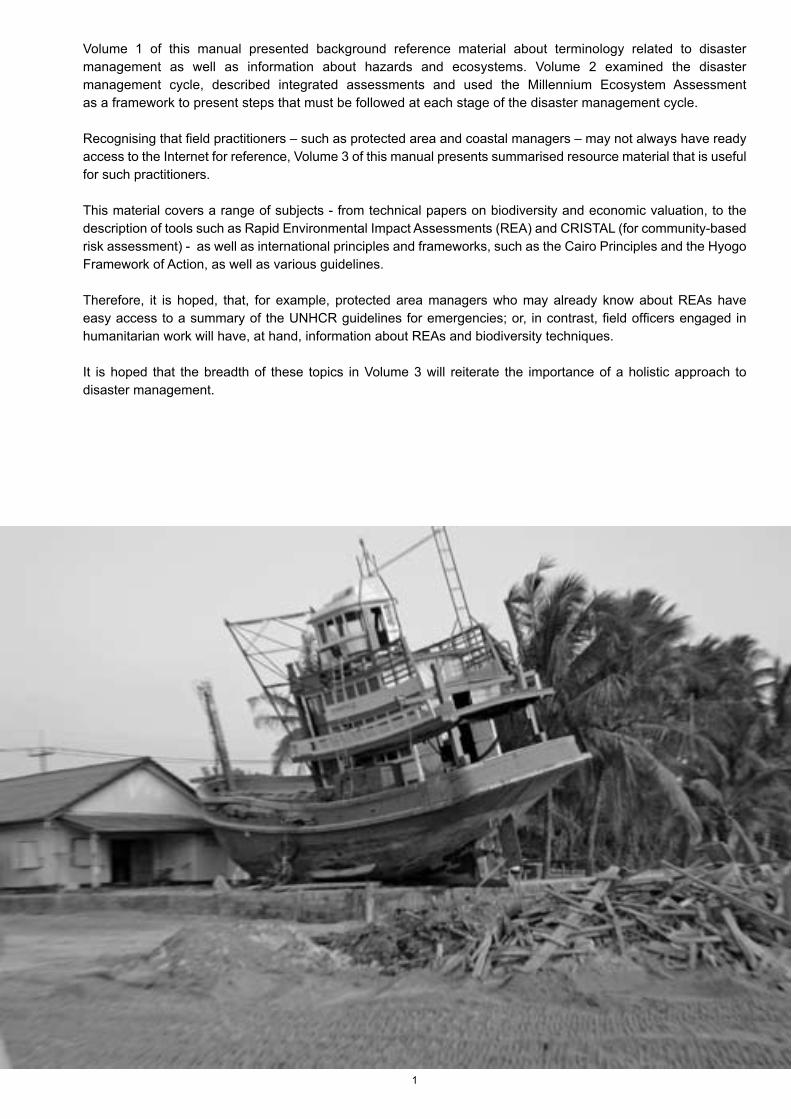
1
Volume 1 of this manual presented background reference material about terminology related to disaster management as well as information about hazards and ecosystems. Volume 2 examined the disaster management cycle, described integrated assessments and used the Millennium Ecosystem Assessment as a framework to present steps that must be followed at each stage of the disaster management cycle.
Recognising that field practitioners – such as protected area and coastal managers – may not always have ready access to the Internet for reference, Volume 3 of this manual presents summarised resource material that is useful for such practitioners.
This material covers a range of subjects - from technical papers on biodiversity and economic valuation, to the description of tools such as Rapid Environmental Impact Assessments (REA) and CRISTAL (for community-based risk assessment) - as well as international principles and frameworks, such as the Cairo Principles and the Hyogo Framework of Action, as well as various guidelines.
Therefore, it is hoped, that, for example, protected area managers who may already know about REAs have easy access to a summary of the UNHCR guidelines for emergencies; or, in contrast, field officers engaged in humanitarian work will have, at hand, information about REAs and biodiversity techniques.
It is hoped that the breadth of these topics in Volume 3 will reiterate the importance of a holistic approach to disaster management.

2
Needs for integrated assessments
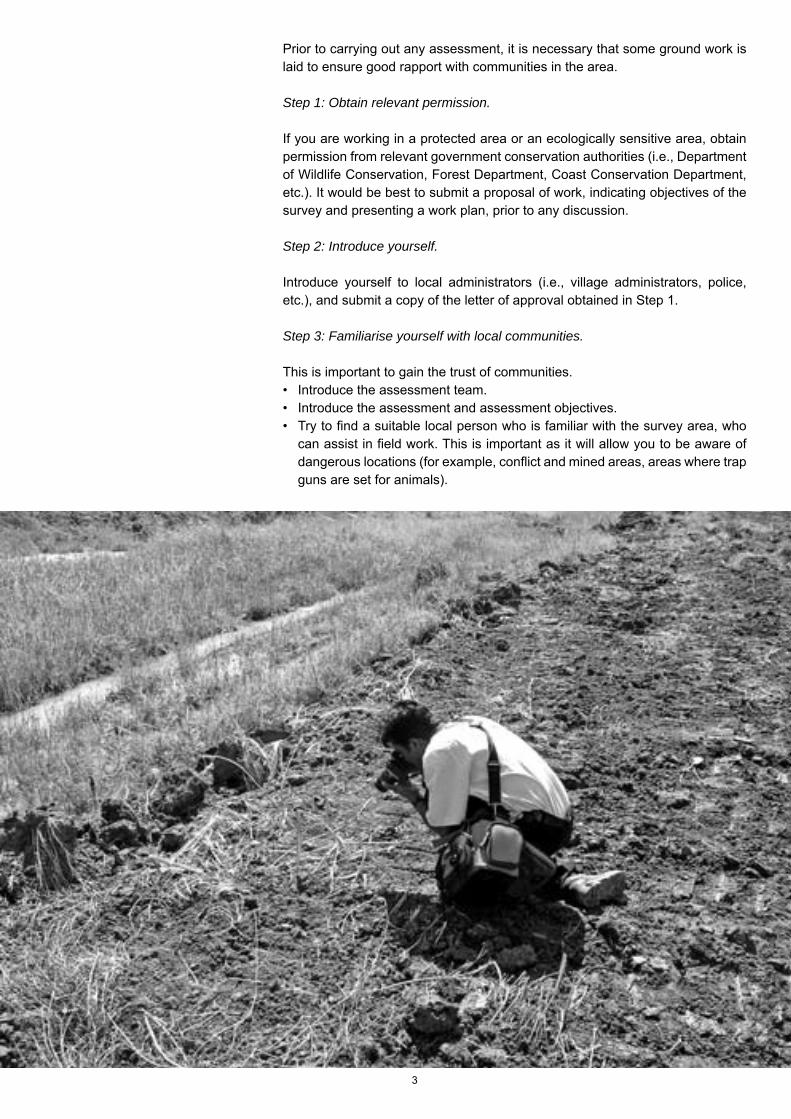
3
Prior to carrying out any assessment, it is necessary that some ground work is laid to ensure good rapport with communities in the area.
Step 1: Obtain relevant permission.
If you are working in a protected area or an ecologically sensitive area, obtain permission from relevant government conservation authorities (i.e., Department of Wildlife Conservation, Forest Department, Coast Conservation Department, etc.). It would be best to submit a proposal of work, indicating objectives of the survey and presenting a work plan, prior to any discussion.
Step 2: Introduce yourself.
Introduce yourself to local administrators (i.e., village administrators, police, etc.), and submit a copy of the letter of approval obtained in Step 1.
Step 3: Familiarise yourself with local communities.
This is important to gain the trust of communities.• Introduce the assessment team.• Introduce the assessment and assessment objectives. • Try to find a suitable local person who is familiar with the survey area, who
can assist in field work. This is important as it will allow you to be aware of dangerous locations (for example, conflict and mined areas, areas where trap guns are set for animals).
4
Step 4: Do not offend communities nor affect the habitats of flora and/or the habitats and behaviour of fauna.
• Ensure that the survey does not disrupt community activities nor offend individuals.
• Ensure privacy when collecting data. • Ensure that the survey does not contribute to the decline of species, through
unnecessary collection of specimens in the field. When surveying animals, identification of species is possible through the use of field guides or good digital photographs that can be used later for identification. When live- trapping methods are used, ensure that traps are visited frequently, so that animals can be identified and released before they become hypo/ hyperthermic or exhausted.
Step 5: Draw a map of the area.
• Use community knowledge to draw a map of the area;• Add GPS coordinates to the above map;• Verify the map against published maps.
Step 6: Carry out semi-structured interviews1 to obtain required biodiversity and ecosystem service information such as:
• Local habitat/ecosystem classifications and their significance based on local knowledge (use local names);
• Dependence of local communities on their surrounding landcapes/ resource use, livelihoods in the area;
• Resource use; • Services (water purification, waste recycling, etc.) of local ecosystems; • Direct drivers of biodiversity loss (pollution, invasive alien species, habitat
loss and degradation etc.);• Indirect drivers of biodiversity loss (population, urbanisation, etc.);• Constraints, issues, pressures related to resource use (for example, legislation,
permits, etc.);• Land ownership/tenure; • Indigenous knowledge and practices;• Human wildlife conflicts/pest and disease outbreaks and trends;Use the worksheet in the following section for all of the above.
Step 7: For at least ten households per village, carry out a questionnaire survey2 to obtain required economic and livelihood information such as:
• Household size and composition;• Length of residence in respective village, and place of origin;• Education level of family members;• Demography;• Equipment owned by households (tools, transport, boats, gear, etc.)• Monthly cash income and seasonal variation;• Livestock ownership;• Land area (total, farmed and own/leased);• Major livelihoods (for example, farming, fisheries, livestock, business,
government/ private sector employment); • Annual production, cost of extraction/and processing, proportion sold
and used for subsistence and trends;
1 A semi-structured interview is an interview with an individual or individuals that follows a pre-defined set of question parameters, but still allows for a degree of freedom in exploring a range of issues.
2 A questionnaire survey is a survey where a questionnnaire is filled in.
Necessary human resources
Experts • A biodiversity expert with
taxonomic and identification knowledge of major faunal and flora groups;
• An environmental economist; and
• A livelihoods expert.
Community It should be ensured that community participation involves a mixed group of people and should include• All ethnic groups;• All religions; • Women;• Different age groups; • Representatives from all
sectors (for example, fishermen/carpenters/farmers/livestock keepers/NTFP collectors/hunters, etc.)
• Tribal communities/marginalised groups;
• Representatives from all clubs and societies, etc.;
• Local community members who are knowledgeable about their surrounds;
• Elderly people who know about the history and natural history of the village/community and how it has changed over time;
• Village religious leaders (who should at least be informed about the activity);
• Village level government officers (who should at least be informed about the activity).
5
Necessary equipment
For community-based biodiversity assessments• Field note book/pen
or pencil;• Map/aerial image of the
village if available;• Compass;• Transect cord (cut and
wrapped to the length of the desired transect);
• Binoculars;• Hand held GPS;• Field identification guides
for major taxonomic groups;• Butterfly net for capture and
release of species that can not be identified in flight;
• Fish net for capture and release of fish;
• Large clear plastic bottles with wide mouths for capturing fauna to take digital photographs for later identification;
• Digital camera with macro lens; and
• Prepared assessment sheets.
For socioeconomic/livelihoods assessment• Bristol boards/flipcharts;• Beads/pebbles;• Coloured felt pens; and • Prepared questionnaire
sheets.
• Form of product/s marketed (raw material/secondary products/value added or not);
• Marketing mechanism;• Relative importance different ecosystems for different livelihoods (livelihood
value); and • Monitory value of direct uses (food, fuel wood, timber, etc.) and value of
indirect uses (cost of water purification, cost of waste recycling, etc.). Use the worksheet in the following section for the above.
Step 7: Find out other relevant information such as:
• Other development organisations and NGOs working in village and their aims and objectives;
• Businesses operating in the village.
Step 8: Carry out a transect walk.
• Using the village map, and in consultation with community participants, define a transect covering all habitat types such as primary forests, fallow land, crop land, slash and burn cultivation, sacred/spirit forests, rivers etc.
• Try to cross the highest possible number of boundaries between such types. • In order to ensure that you do not return along the same route, define a
circular transect.• The team should walk through the transect, ensuring that measures are taken
to make the transect walk safe (for example, from trap guns, land mines, animal attacks etc.).
• Record geo-reference points where necessary (at least at 100m intervals), record habitat/ecosystem/ landscape type (stream, marsh, grassland, forest, pasture etc.) and take photographs referring the recorded geo-reference.
• Record the following while walking: (This is called opportunistic observation.) • Plant species (local name/uses/abundance/life form/habitat etc.); Animals (local name of the animal, sighted/heard/signs/faeces/foot prints/
nests/feathers etc.); • Invasive alien species (local name/impact/uses etc.); • Pollution (point sources/grey water/noises/smells etc.); • Degraded lands, harmful practices to environment etc. This should include
oil and chemical storage tanks (both above ground and underground), garbage and sewage disposal/treatment facilities/ underground sewers, areas with unexploded ordinances - i.e., former military training areas and storage facilities.
• Any other issues/opportunities as listed in the worksheet; • Any NTFP collected (part (seed/bark/leaves) season/amount/purpose/
history of use and extraction etc.); • Communal resources (water/mineral resources/grazing lands etc.); • Wildlife related damages (animal/type of damage and gross estimate
of damage).• When it is not possible to identify species, take reference digital photographs
with an included scale, for subsequent identification.
Step 9: Carry out focal group discussions.
• Meet representatives of each sector to elicit relevant information (for example, of fish species caught and relative abundance, crops etc.).
• Ask about specific use of habitats, landscapes.• Ask about specific threats to each of their sectors.
(Adapted from Bambaradeniya, unpublished report).
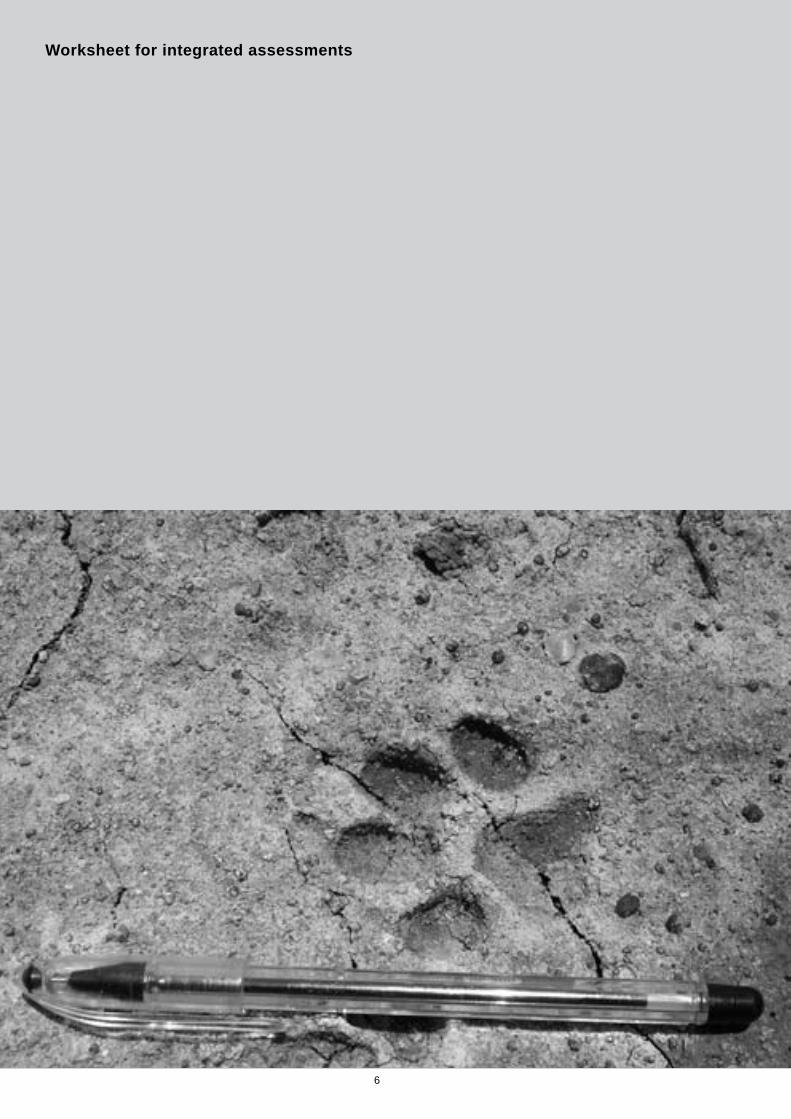
6
Worksheet for integrated assessments
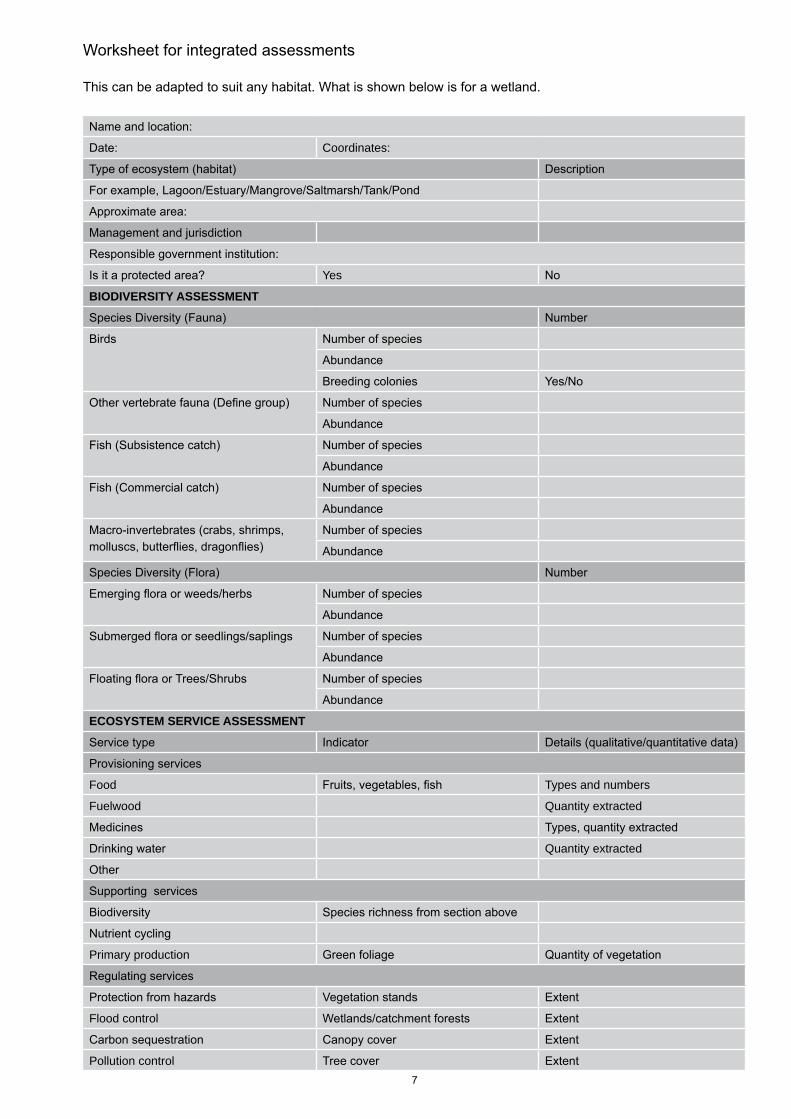
7
Worksheet for integrated assessments
This can be adapted to suit any habitat. What is shown below is for a wetland.
Name and location:
Date: Coordinates:
Type of ecosystem (habitat) Description
For example, Lagoon/Estuary/Mangrove/Saltmarsh/Tank/Pond
Approximate area:
Management and jurisdiction
Responsible government institution:
Is it a protected area? Yes No
BIODIVERSITY ASSESSMENT
Species Diversity (Fauna) Number
Birds Number of species
Abundance
Breeding colonies Yes/No
Other vertebrate fauna (Define group) Number of species
Abundance
Fish (Subsistence catch) Number of species
Abundance
Fish (Commercial catch) Number of species
Abundance
Macro-invertebrates (crabs, shrimps, molluscs, butterflies, dragonflies)
Number of species
Abundance
Species Diversity (Flora) Number
Emerging flora or weeds/herbs Number of species
Abundance
Submerged flora or seedlings/saplings Number of species
Abundance
Floating flora or Trees/Shrubs Number of species
Abundance
ECOSYSTEM SERVICE ASSESSMENT
Service type Indicator Details (qualitative/quantitative data)
Provisioning services
Food Fruits, vegetables, fish Types and numbers
Fuelwood Quantity extracted
Medicines Types, quantity extracted
Drinking water Quantity extracted
Other
Supporting services
Biodiversity Species richness from section above
Nutrient cycling
Primary production Green foliage Quantity of vegetation
Regulating services
Protection from hazards Vegetation stands Extent
Flood control Wetlands/catchment forests Extent
Carbon sequestration Canopy cover Extent
Pollution control Tree cover Extent
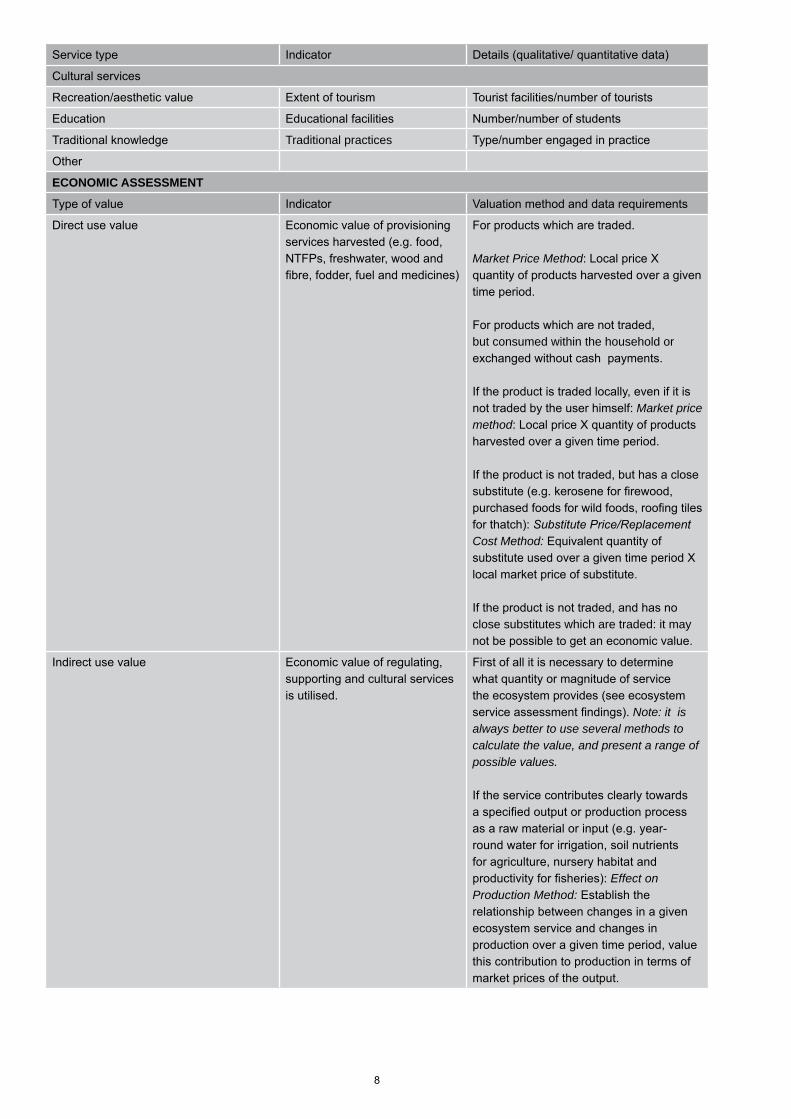
8
Service type Indicator Details (qualitative/ quantitative data)
Cultural services
Recreation/aesthetic value Extent of tourism Tourist facilities/number of tourists
Education Educational facilities Number/number of students
Traditional knowledge Traditional practices Type/number engaged in practice
Other
ECONOMIC ASSESSMENT
Type of value Indicator Valuation method and data requirements
Direct use value Economic value of provisioning services harvested (e.g. food, NTFPs, freshwater, wood and fibre, fodder, fuel and medicines)
For products which are traded.
Market Price Method: Local price X quantity of products harvested over a given time period.
For products which are not traded, but consumed within the household or exchanged without cash payments.
If the product is traded locally, even if it is not traded by the user himself: Market price method: Local price X quantity of products harvested over a given time period.
If the product is not traded, but has a close substitute (e.g. kerosene for firewood, purchased foods for wild foods, roofing tiles for thatch): Substitute Price/Replacement Cost Method: Equivalent quantity of substitute used over a given time period X local market price of substitute.
If the product is not traded, and has no close substitutes which are traded: it may not be possible to get an economic value.
Indirect use value Economic value of regulating, supporting and cultural services is utilised.
First of all it is necessary to determine what quantity or magnitude of service the ecosystem provides (see ecosystem service assessment findings). Note: it is always better to use several methods to calculate the value, and present a range of possible values.
If the service contributes clearly towards a specified output or production process as a raw material or input (e.g. year-round water for irrigation, soil nutrients for agriculture, nursery habitat and productivity for fisheries): Effect on Production Method: Establish the relationship between changes in a given ecosystem service and changes in production over a given time period, value this contribution to production in terms of market prices of the output.
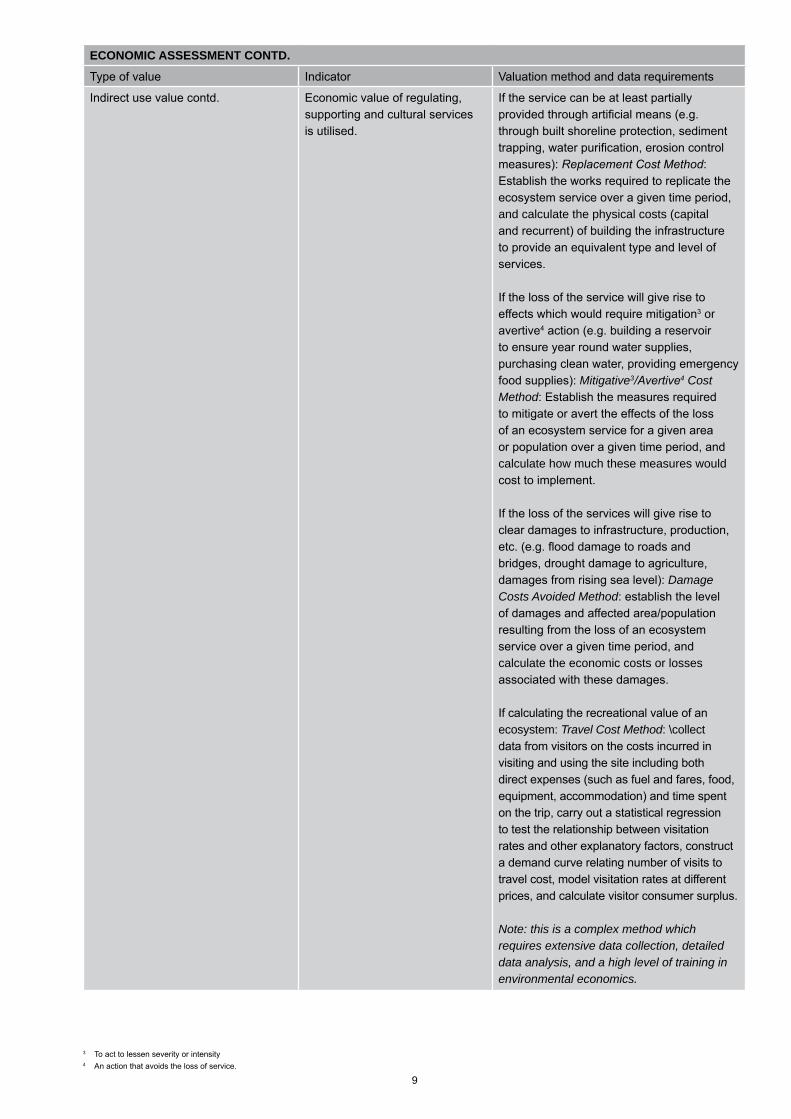
9
3 To act to lessen severity or intensity4 An action that avoids the loss of service.
ECONOMIC ASSESSMENT CONTD.
Type of value Indicator Valuation method and data requirements
Indirect use value contd. Economic value of regulating, supporting and cultural services is utilised.
If the service can be at least partially provided through artificial means (e.g. through built shoreline protection, sediment trapping, water purification, erosion control measures): Replacement Cost Method: Establish the works required to replicate the ecosystem service over a given time period, and calculate the physical costs (capital and recurrent) of building the infrastructure to provide an equivalent type and level of services.
If the loss of the service will give rise to effects which would require mitigation3 or avertive4 action (e.g. building a reservoir to ensure year round water supplies, purchasing clean water, providing emergency food supplies): Mitigative3/Avertive4 Cost Method: Establish the measures required to mitigate or avert the effects of the loss of an ecosystem service for a given area or population over a given time period, and calculate how much these measures would cost to implement.
If the loss of the services will give rise to clear damages to infrastructure, production, etc. (e.g. flood damage to roads and bridges, drought damage to agriculture, damages from rising sea level): Damage Costs Avoided Method: establish the level of damages and affected area/population resulting from the loss of an ecosystem service over a given time period, and calculate the economic costs or losses associated with these damages.
If calculating the recreational value of an ecosystem: Travel Cost Method: \collect data from visitors on the costs incurred in visiting and using the site including both direct expenses (such as fuel and fares, food, equipment, accommodation) and time spent on the trip, carry out a statistical regression to test the relationship between visitation rates and other explanatory factors, construct a demand curve relating number of visits to travel cost, model visitation rates at different prices, and calculate visitor consumer surplus.
Note: this is a complex method which requires extensive data collection, detailed data analysis, and a high level of training in environmental economics.
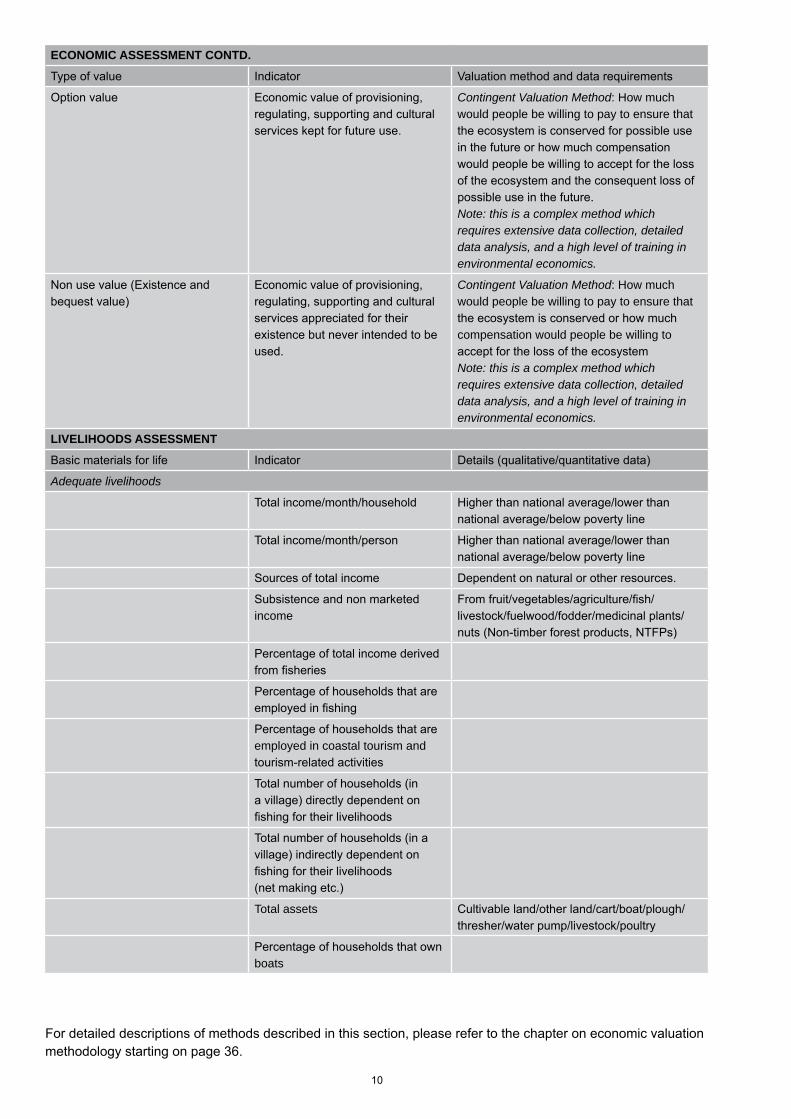
10
ECONOMIC ASSESSMENT CONTD.
Type of value Indicator Valuation method and data requirements
Option value Economic value of provisioning, regulating, supporting and cultural services kept for future use.
Contingent Valuation Method: How much would people be willing to pay to ensure that the ecosystem is conserved for possible use in the future or how much compensation would people be willing to accept for the loss of the ecosystem and the consequent loss of possible use in the future.Note: this is a complex method which requires extensive data collection, detailed data analysis, and a high level of training in environmental economics.
Non use value (Existence and bequest value)
Economic value of provisioning, regulating, supporting and cultural services appreciated for their existence but never intended to be used.
Contingent Valuation Method: How much would people be willing to pay to ensure that the ecosystem is conserved or how much compensation would people be willing to accept for the loss of the ecosystemNote: this is a complex method which requires extensive data collection, detailed data analysis, and a high level of training in environmental economics.
LIVELIHOODS ASSESSMENT
Basic materials for life Indicator Details (qualitative/quantitative data)
Adequate livelihoods
Total income/month/household Higher than national average/lower than national average/below poverty line
Total income/month/person Higher than national average/lower than national average/below poverty line
Sources of total income Dependent on natural or other resources.
Subsistence and non marketed income
From fruit/vegetables/agriculture/fish/livestock/fuelwood/fodder/medicinal plants/nuts (Non-timber forest products, NTFPs)
Percentage of total income derived from fisheries
Percentage of households that are employed in fishing
Percentage of households that are employed in coastal tourism andtourism-related activities
Total number of households (in a village) directly dependent on fishing for their livelihoods
Total number of households (in a village) indirectly dependent on fishing for their livelihoods(net making etc.)
Total assets Cultivable land/other land/cart/boat/plough/thresher/water pump/livestock/poultry
Percentage of households that own boats
For detailed descriptions of methods described in this section, please refer to the chapter on economic valuation methodology starting on page 36.
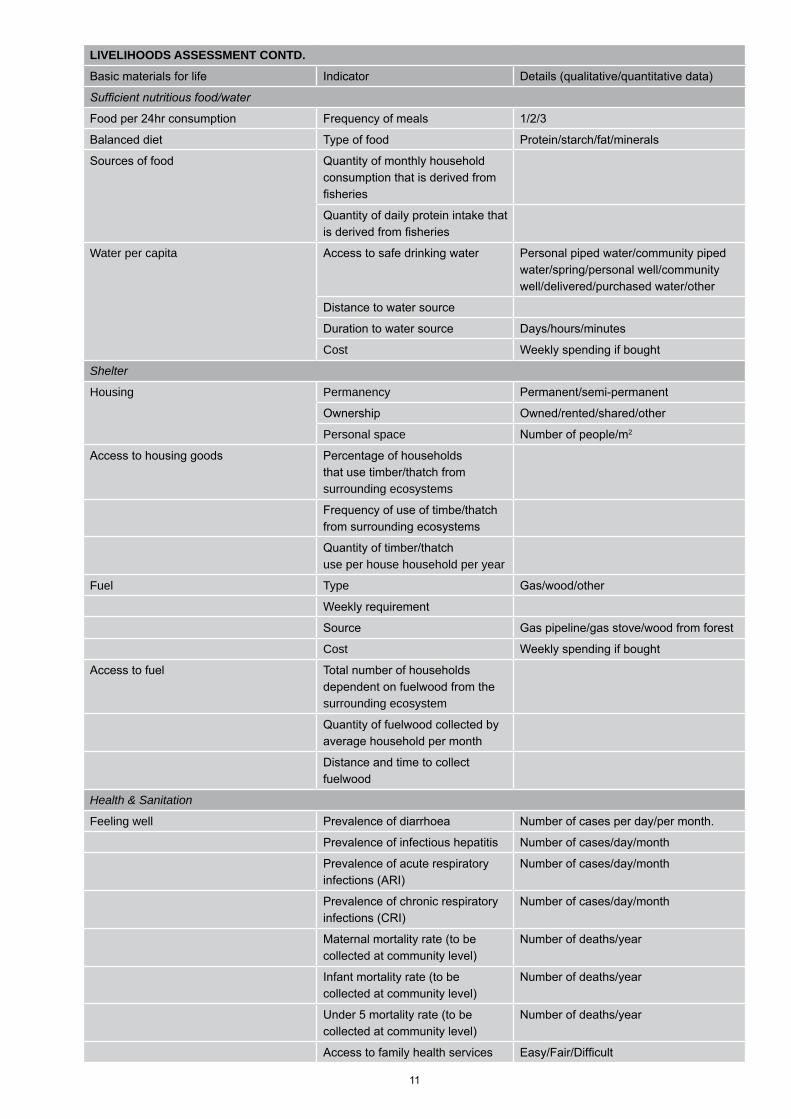
11
LIVELIHOODS ASSESSMENT CONTD.
Basic materials for life Indicator Details (qualitative/quantitative data)
Sufficient nutritious food/water
Food per 24hr consumption Frequency of meals 1/2/3
Balanced diet Type of food Protein/starch/fat/minerals
Sources of food Quantity of monthly household consumption that is derived from fisheries
Quantity of daily protein intake that is derived from fisheries
Water per capita Access to safe drinking water Personal piped water/community piped water/spring/personal well/community well/delivered/purchased water/other
Distance to water source
Duration to water source Days/hours/minutes
Cost Weekly spending if bought
Shelter
Housing Permanency Permanent/semi-permanent
Ownership Owned/rented/shared/other
Personal space Number of people/m2
Access to housing goods Percentage of households that use timber/thatch from surrounding ecosystems
Frequency of use of timbe/thatch from surrounding ecosystems
Quantity of timber/thatchuse per house household per year
Fuel Type Gas/wood/other
Weekly requirement
Source Gas pipeline/gas stove/wood from forest
Cost Weekly spending if bought
Access to fuel Total number of households dependent on fuelwood from the surrounding ecosystem
Quantity of fuelwood collected by average household per month
Distance and time to collect fuelwood
Health & Sanitation
Feeling well Prevalence of diarrhoea Number of cases per day/per month.
Prevalence of infectious hepatitis Number of cases/day/month
Prevalence of acute respiratory infections (ARI)
Number of cases/day/month
Prevalence of chronic respiratory infections (CRI)
Number of cases/day/month
Maternal mortality rate (to be collected at community level)
Number of deaths/year
Infant mortality rate (to be collected at community level)
Number of deaths/year
Under 5 mortality rate (to be collected at community level)
Number of deaths/year
Access to family health services Easy/Fair/Difficult
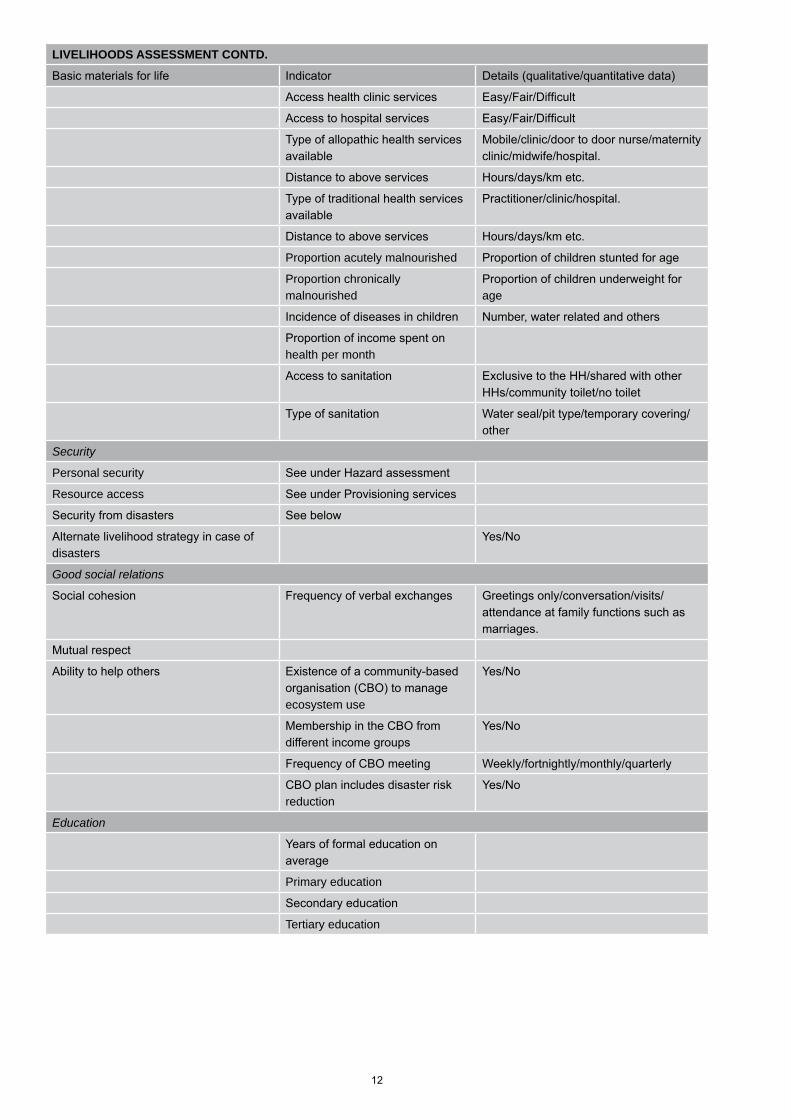
12
LIVELIHOODS ASSESSMENT CONTD.
Basic materials for life Indicator Details (qualitative/quantitative data)
Access health clinic services Easy/Fair/Difficult
Access to hospital services Easy/Fair/Difficult
Type of allopathic health services available
Mobile/clinic/door to door nurse/maternity clinic/midwife/hospital.
Distance to above services Hours/days/km etc.
Type of traditional health services available
Practitioner/clinic/hospital.
Distance to above services Hours/days/km etc.
Proportion acutely malnourished Proportion of children stunted for age
Proportion chronically malnourished
Proportion of children underweight for age
Incidence of diseases in children Number, water related and others
Proportion of income spent on health per month
Access to sanitation Exclusive to the HH/shared with other HHs/community toilet/no toilet
Type of sanitation Water seal/pit type/temporary covering/other
Security
Personal security See under Hazard assessment
Resource access See under Provisioning services
Security from disasters See below
Alternate livelihood strategy in case of disasters
Yes/No
Good social relations
Social cohesion Frequency of verbal exchanges Greetings only/conversation/visits/attendance at family functions such as marriages.
Mutual respect
Ability to help others Existence of a community-based organisation (CBO) to manage ecosystem use
Yes/No
Membership in the CBO from different income groups
Yes/No
Frequency of CBO meeting Weekly/fortnightly/monthly/quarterly
CBO plan includes disaster risk reduction
Yes/No
Education
Years of formal education on average
Primary education
Secondary education
Tertiary education
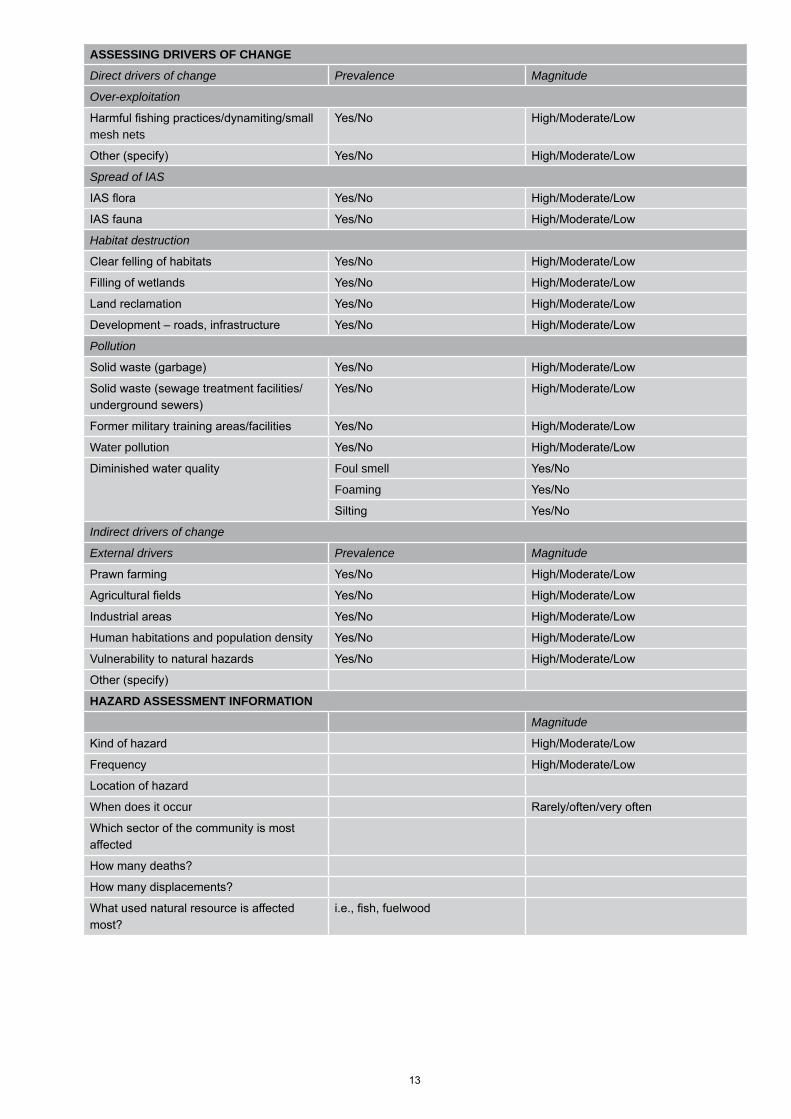
13
ASSESSING DRIVERS OF CHANGE
Direct drivers of change Prevalence Magnitude
Over-exploitation
Harmful fishing practices/dynamiting/small mesh nets
Yes/No High/Moderate/Low
Other (specify) Yes/No High/Moderate/Low
Spread of IAS
IAS flora Yes/No High/Moderate/Low
IAS fauna Yes/No High/Moderate/Low
Habitat destruction
Clear felling of habitats Yes/No High/Moderate/Low
Filling of wetlands Yes/No High/Moderate/Low
Land reclamation Yes/No High/Moderate/Low
Development – roads, infrastructure Yes/No High/Moderate/Low
Pollution
Solid waste (garbage) Yes/No High/Moderate/Low
Solid waste (sewage treatment facilities/ underground sewers)
Yes/No High/Moderate/Low
Former military training areas/facilities Yes/No High/Moderate/Low
Water pollution Yes/No High/Moderate/Low
Diminished water quality Foul smell Yes/No
Foaming Yes/No
Silting Yes/No
Indirect drivers of change
External drivers Prevalence Magnitude
Prawn farming Yes/No High/Moderate/Low
Agricultural fields Yes/No High/Moderate/Low
Industrial areas Yes/No High/Moderate/Low
Human habitations and population density Yes/No High/Moderate/Low
Vulnerability to natural hazards Yes/No High/Moderate/Low
Other (specify)
HAZARD ASSESSMENT INFORMATION
Magnitude
Kind of hazard High/Moderate/Low
Frequency High/Moderate/Low
Location of hazard
When does it occur Rarely/often/very often
Which sector of the community is most affected
How many deaths?
How many displacements?
What used natural resource is affected most?
i.e., fish, fuelwood
14
Analysing data
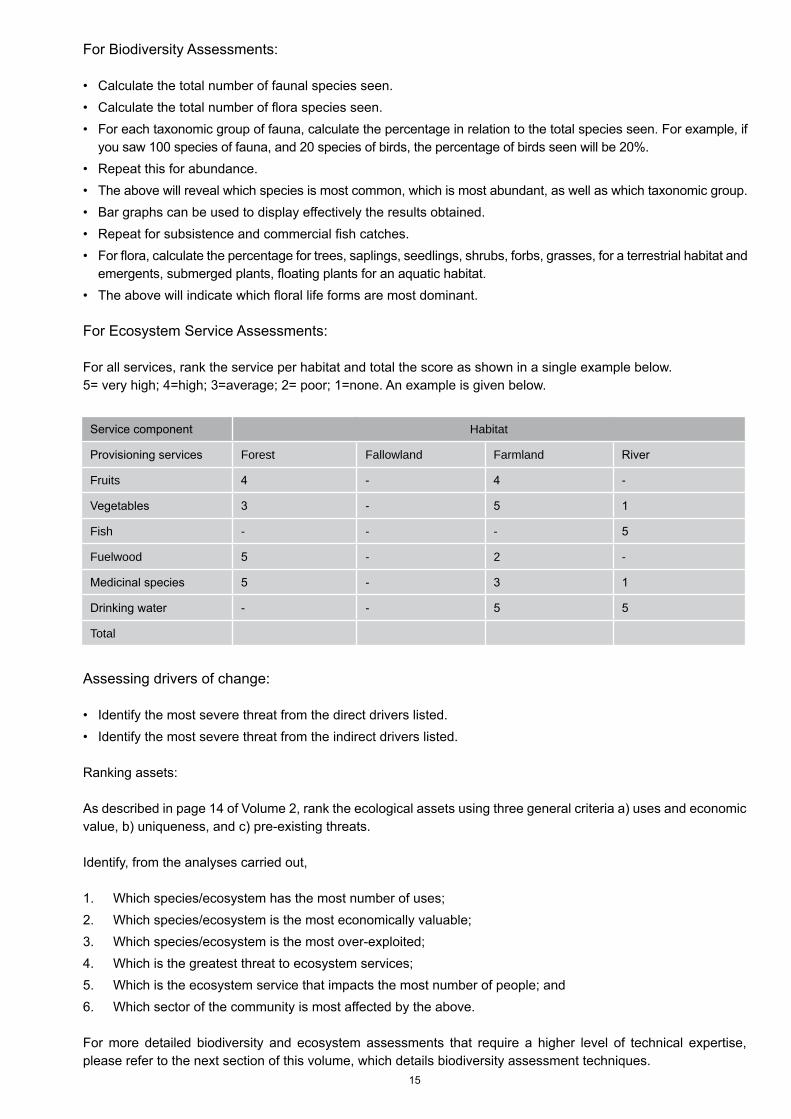
15
For Biodiversity Assessments:
• Calculate the total number of faunal species seen.• Calculate the total number of flora species seen.• For each taxonomic group of fauna, calculate the percentage in relation to the total species seen. For example, if
you saw 100 species of fauna, and 20 species of birds, the percentage of birds seen will be 20%. • Repeat this for abundance. • The above will reveal which species is most common, which is most abundant, as well as which taxonomic group. • Bar graphs can be used to display effectively the results obtained. • Repeat for subsistence and commercial fish catches.• For flora, calculate the percentage for trees, saplings, seedlings, shrubs, forbs, grasses, for a terrestrial habitat and
emergents, submerged plants, floating plants for an aquatic habitat. • The above will indicate which floral life forms are most dominant.
For Ecosystem Service Assessments:
For all services, rank the service per habitat and total the score as shown in a single example below. 5= very high; 4=high; 3=average; 2= poor; 1=none. An example is given below.
Service component Habitat
Provisioning services Forest Fallowland Farmland River
Fruits 4 - 4 -
Vegetables 3 - 5 1
Fish - - - 5
Fuelwood 5 - 2 -
Medicinal species 5 - 3 1
Drinking water - - 5 5
Total
Assessing drivers of change:
• Identify the most severe threat from the direct drivers listed. • Identify the most severe threat from the indirect drivers listed.
Ranking assets:
As described in page 14 of Volume 2, rank the ecological assets using three general criteria a) uses and economic value, b) uniqueness, and c) pre-existing threats.
Identify, from the analyses carried out,
1. Which species/ecosystem has the most number of uses; 2. Which species/ecosystem is the most economically valuable;3. Which species/ecosystem is the most over-exploited; 4. Which is the greatest threat to ecosystem services; 5. Which is the ecosystem service that impacts the most number of people; and 6. Which sector of the community is most affected by the above.
For more detailed biodiversity and ecosystem assessments that require a higher level of technical expertise, please refer to the next section of this volume, which details biodiversity assessment techniques.
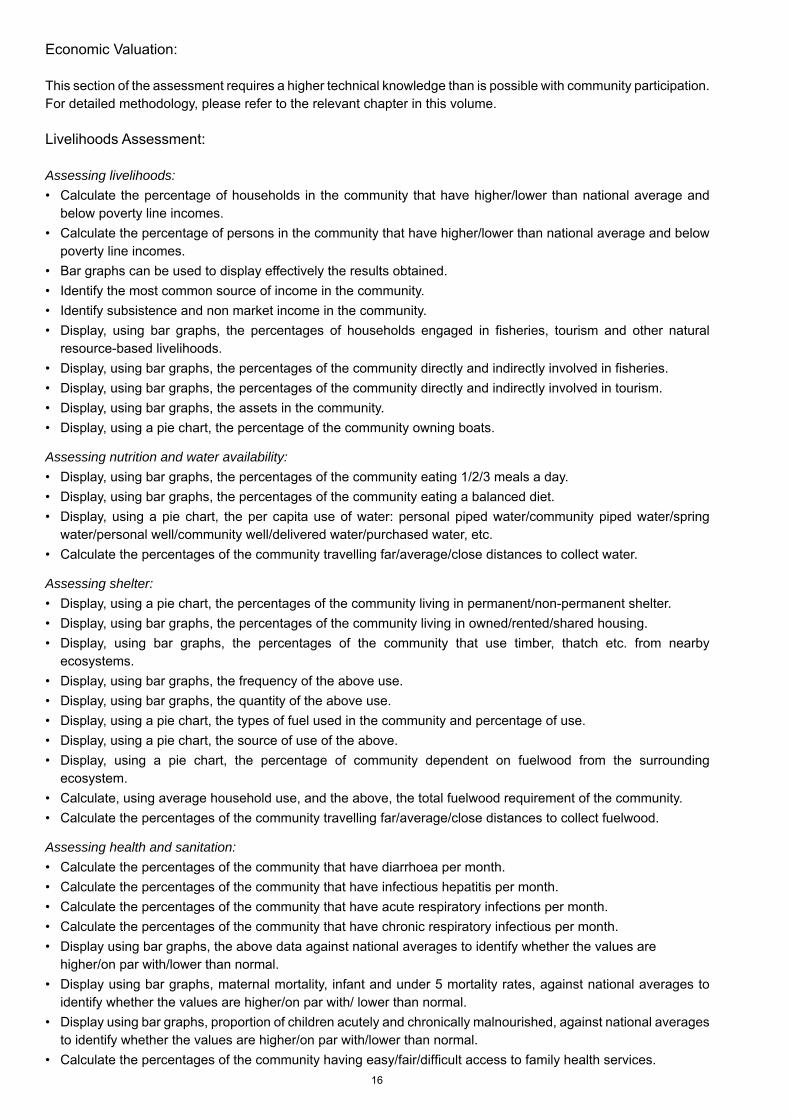
16
Economic Valuation:
This section of the assessment requires a higher technical knowledge than is possible with community participation. For detailed methodology, please refer to the relevant chapter in this volume.
Livelihoods Assessment:
Assessing livelihoods:• Calculate the percentage of households in the community that have higher/lower than national average and
below poverty line incomes.• Calculate the percentage of persons in the community that have higher/lower than national average and below
poverty line incomes.• Bar graphs can be used to display effectively the results obtained. • Identify the most common source of income in the community.• Identify subsistence and non market income in the community.• Display, using bar graphs, the percentages of households engaged in fisheries, tourism and other natural
resource-based livelihoods.• Display, using bar graphs, the percentages of the community directly and indirectly involved in fisheries. • Display, using bar graphs, the percentages of the community directly and indirectly involved in tourism.• Display, using bar graphs, the assets in the community. • Display, using a pie chart, the percentage of the community owning boats.
Assessing nutrition and water availability:• Display, using bar graphs, the percentages of the community eating 1/2/3 meals a day.• Display, using bar graphs, the percentages of the community eating a balanced diet.• Display, using a pie chart, the per capita use of water: personal piped water/community piped water/spring
water/personal well/community well/delivered water/purchased water, etc.• Calculate the percentages of the community travelling far/average/close distances to collect water.
Assessing shelter:• Display, using a pie chart, the percentages of the community living in permanent/non-permanent shelter. • Display, using bar graphs, the percentages of the community living in owned/rented/shared housing. • Display, using bar graphs, the percentages of the community that use timber, thatch etc. from nearby
ecosystems.• Display, using bar graphs, the frequency of the above use. • Display, using bar graphs, the quantity of the above use. • Display, using a pie chart, the types of fuel used in the community and percentage of use.• Display, using a pie chart, the source of use of the above. • Display, using a pie chart, the percentage of community dependent on fuelwood from the surrounding
ecosystem. • Calculate, using average household use, and the above, the total fuelwood requirement of the community. • Calculate the percentages of the community travelling far/average/close distances to collect fuelwood.
Assessing health and sanitation:• Calculate the percentages of the community that have diarrhoea per month.• Calculate the percentages of the community that have infectious hepatitis per month.• Calculate the percentages of the community that have acute respiratory infections per month.• Calculate the percentages of the community that have chronic respiratory infectious per month.• Display using bar graphs, the above data against national averages to identify whether the values are
higher/on par with/lower than normal. • Display using bar graphs, maternal mortality, infant and under 5 mortality rates, against national averages to
identify whether the values are higher/on par with/ lower than normal. • Display using bar graphs, proportion of children acutely and chronically malnourished, against national averages
to identify whether the values are higher/on par with/lower than normal. • Calculate the percentages of the community having easy/fair/difficult access to family health services.
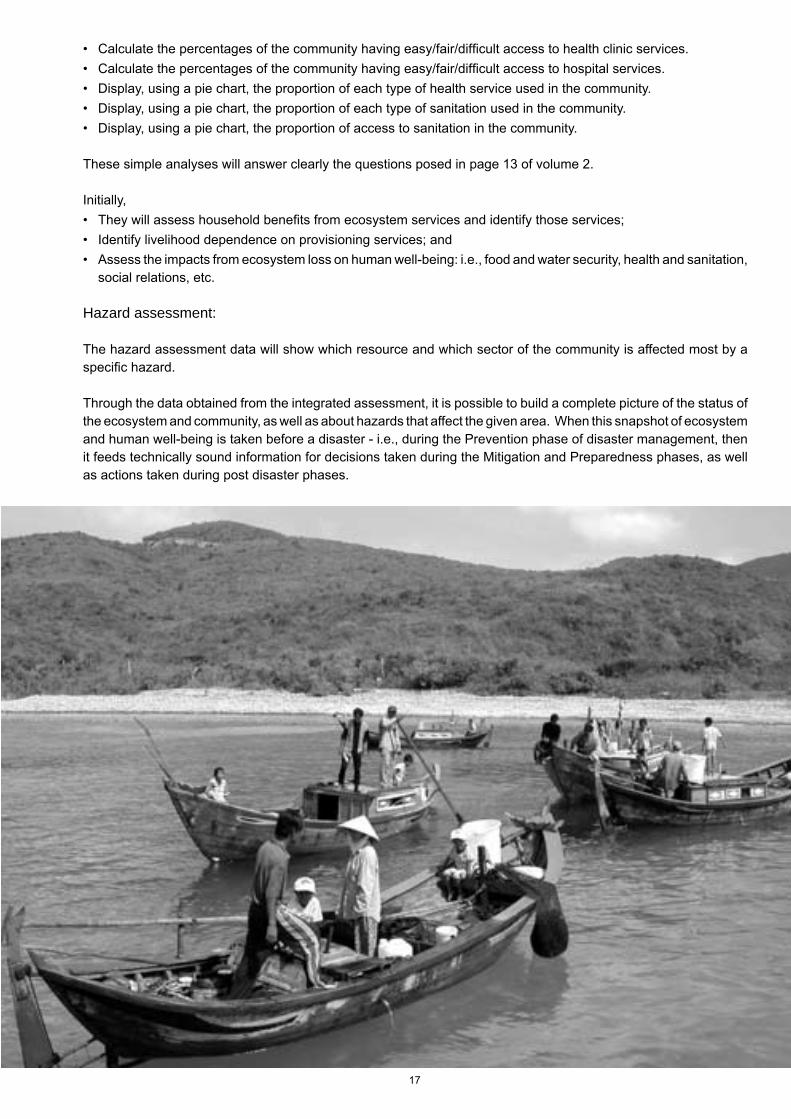
17
• Calculate the percentages of the community having easy/fair/difficult access to health clinic services.• Calculate the percentages of the community having easy/fair/difficult access to hospital services.• Display, using a pie chart, the proportion of each type of health service used in the community.• Display, using a pie chart, the proportion of each type of sanitation used in the community.• Display, using a pie chart, the proportion of access to sanitation in the community.
These simple analyses will answer clearly the questions posed in page 13 of volume 2.
Initially, • They will assess household benefits from ecosystem services and identify those services; • Identify livelihood dependence on provisioning services; and • Assess the impacts from ecosystem loss on human well-being: i.e., food and water security, health and sanitation,
social relations, etc.
Hazard assessment:
The hazard assessment data will show which resource and which sector of the community is affected most by a specific hazard.
Through the data obtained from the integrated assessment, it is possible to build a complete picture of the status of the ecosystem and community, as well as about hazards that affect the given area. When this snapshot of ecosystem and human well-being is taken before a disaster - i.e., during the Prevention phase of disaster management, then it feeds technically sound information for decisions taken during the Mitigation and Preparedness phases, as well as actions taken during post disaster phases.

18
Biodiversity Assessment Techniques
19
Biodiversity Assessment Techniques (for coastal ecosystems)5
Note that this is a technical annexe that requires advanced knowledge of field biology.
Inventorying and monitoring biodiversity – an overview
Why undertake a biological inventory? Carrying out a biological inventory, like any other inventory, allows for the assessment of what biological entities are there in a given area. It establishes the composition and structure of the ecosystem, its status and health provides baseline information for informed decision making for disaster management, as well as sustainable development. Biological assessments also allows for the recognition of priority conservation areas. The analyses of data gathered from biological assessments facilitates sustainable harvesting of species. These assessments also serve to provide information for promoting nature-based tourism and increasing awareness about the environment. The ecosystem service assessment focuses on identifying the services being provided by the ecosystem, as well as the expected impacts on the provision of these services from changes in biodiversity composition and structure.
Measuring (Inventorying) versus Monitoring: There is an important difference between measuring biodiversity and monitoring changes in biodiversity. Measuring/inventorying biodiversity provides a snapshot of biodiversity (for example, yields a number of plant and animal species) at the time of measurement. It is useful for spatial comparisons of biodiversity. In contrast, monitoring involves measuring trends and changes over time, which would allow the researcher to determine the impacts of anthropogenic or natural factors on biodiversity. Monitoring also assesses whether management interventions are achieving the desired conservation goals and allows for adaptation of management. An inventory provides the necessary baseline data for monitoring the effects of anthropogenic disturbance or natural phenomena such as climate change on the biota.
Given below is a summary of biodiversity assessment techniques:
Rapid assessments:
Rapid field surveys: These may be carried out by two or more observers, where opportunistic observations on plants and animals may be made through transect walks in and around a particular ecosystem. The morpho-species concept (categorising species according to morphological features) may be adopted for invertebrate groups (for example, crabs, molluscs, dragonflies) that do not have sufficient information for field identification.
Secondary information: Information on the biodiversity of a particular site can be compiled through the review of secondary information such as published papers and articles, unpublished reports, as well as field notes maintained by protected area managers/rangers. Information on species could also be gathered through interviews with local communities (key informants).
Detailed assessments:
Pure inventory:This involves a one-off activity to record the presence of plants and animals in a particular area, through systematic assessment techniques for different taxa (see following sections for details on specific sampling techniques for different taxa).
Dynamic inventory:This involves the repetition of the pure inventory techniques at frequent and uniform intervals (for example, every month, every quarter, and every year) to document temporal changes in biodiversity in a particular area.
5 Citation: Bambaradeniya, C. N. B (2007). Biodiversity Assessment Techniques (For Coastal Ecosystems) Colombo: Ecosystems and Livelihoods Group, Asia, IUCN. pp viii + 49. Unpublished document.
20
General methodology for a biodiversity survey:
a. Selection of suitable personnel: - Naturalists, para-taxonomists6; - Botanists; - Ecologists; and - Suitable members from the local community (for example, NTFP collectors, hunters). b. Gathering secondary information - Previous work on the particular location/surrounding areas; - Field guides on fauna and flora; and - Spatial information (land use/vegetation maps, satellite images, aerial photographs, etc.).
c. Reconnaissance survey: - Familiarising the team with the study area; - Identifying major habitats and vegetation types; - Selecting representative sampling sites; - Verifying the practical application of pre-determined sampling techniques for fauna and flora; and - Establishing contacts with local authorities/communities.
d. Design and confirm field sampling techniques for fauna and flora: - Selecting taxa to be surveyed and finalise sampling techniques; and - Designing field data templates for different taxa.
e. Finalise sampling period and frequency: - Number of field visits/days and frequency of field visits to capture temporal changes related to seasonal events.
f. Field survey: - Sampling of habitats, fauna and flora; - Trying to identify vertebrates in the field itself, using field guides; - Collecting faunal specimens sparingly (for species that needs to be verified in the laboratory); - Collecting specimens of plants and preparing herbarium sheets for confirmation of identification; - Sampling fauna should encompass both diurnal and nocturnal times; - Identifying specific ecosystem services and dose-response relationships; - Documenting conservation issues/threats to biodiversity; and - Obtaining relevant geo-referenced information using a GPS instrument (i.e., boundaries of different habitat
types, breeding sites of animal species, sites with specific threats to biodiversity, etc.).
g. Analyses of data: - Using ecological diversity indices, univariate analyses (describing central tendency, dispersion, distribution,
and multivariate analysis - for example, MANOVA, PCA, Cluster analysis); - Evaluating ecosystem services related to biodiversity in the area, and analysing dose-response relationships; - Identifying critical habitats for the conservation of biodiversity and ecosystem services for human
well-being; - Selecting suitable indicators for monitoring of biodiversity; - Categorising conservation issues/threats, and identify severity using indicators; and - Synthesise geo-referenced information for relevant spatial maps.
h. Data presentation: - Presenting key information using visual tools (graphs, tables, charts, etc.); - Preparing spatial maps with the aid of GIS technology (habitat/vegetation/land-use types); - Locating threatened/endemic species; critical habitats; threat zones; rank areas according to ecosystem
services etc.; and - Obtaining a compendium of indicators to monitor biodiversity, and threats to conservation.
6 Parataxonomists: (local assistants trained by professional biologists
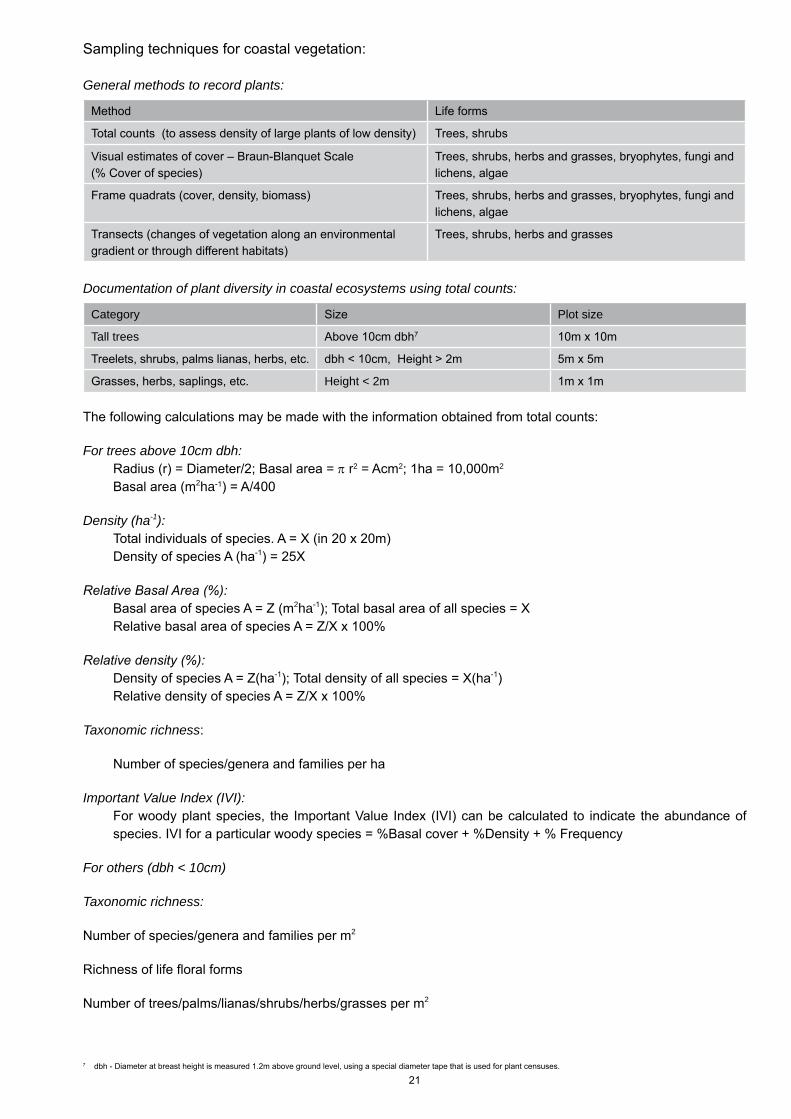
21
Sampling techniques for coastal vegetation:
General methods to record plants:
Method Life forms
Total counts (to assess density of large plants of low density) Trees, shrubs
Visual estimates of cover – Braun-Blanquet Scale (% Cover of species)
Trees, shrubs, herbs and grasses, bryophytes, fungi and lichens, algae
Frame quadrats (cover, density, biomass) Trees, shrubs, herbs and grasses, bryophytes, fungi and lichens, algae
Transects (changes of vegetation along an environmental gradient or through different habitats)
Trees, shrubs, herbs and grasses
Documentation of plant diversity in coastal ecosystems using total counts:
Category Size Plot size
Tall trees Above 10cm dbh7 10m x 10m
Treelets, shrubs, palms lianas, herbs, etc. dbh < 10cm, Height > 2m 5m x 5m
Grasses, herbs, saplings, etc. Height < 2m 1m x 1m
The following calculations may be made with the information obtained from total counts:
For trees above 10cm dbh: Radius (r) = Diameter/2; Basal area = π r2 = Acm2; 1ha = 10,000m2
Basal area (m2ha-1) = A/400
Density (ha-1): Total individuals of species. A = X (in 20 x 20m) Density of species A (ha-1) = 25X
Relative Basal Area (%): Basal area of species A = Z (m2ha-1); Total basal area of all species = X Relative basal area of species A = Z/X x 100%
Relative density (%): Density of species A = Z(ha-1); Total density of all species = X(ha-1) Relative density of species A = Z/X x 100%
Taxonomic richness:
Number of species/genera and families per ha
Important Value Index (IVI):For woody plant species, the Important Value Index (IVI) can be calculated to indicate the abundance of species. IVI for a particular woody species = %Basal cover + %Density + % Frequency
For others (dbh < 10cm)
Taxonomic richness:
Number of species/genera and families per m2
Richness of life floral forms
Number of trees/palms/lianas/shrubs/herbs/grasses per m2
7 dbh - Diameter at breast height is measured 1.2m above ground level, using a special diameter tape that is used for plant censuses.
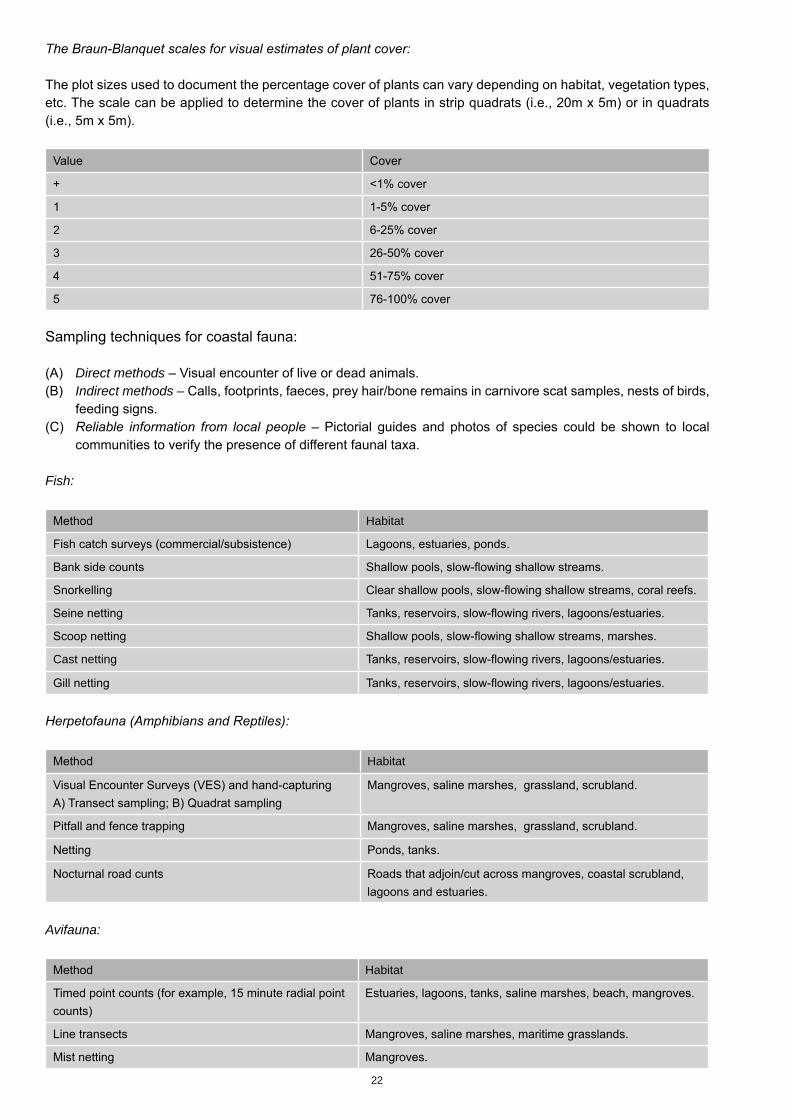
22
The Braun-Blanquet scales for visual estimates of plant cover:
The plot sizes used to document the percentage cover of plants can vary depending on habitat, vegetation types, etc. The scale can be applied to determine the cover of plants in strip quadrats (i.e., 20m x 5m) or in quadrats (i.e., 5m x 5m).
Value Cover
+ <1% cover
1 1-5% cover
2 6-25% cover
3 26-50% cover
4 51-75% cover
5 76-100% cover
Sampling techniques for coastal fauna:
(A) Direct methods – Visual encounter of live or dead animals.(B) Indirect methods – Calls, footprints, faeces, prey hair/bone remains in carnivore scat samples, nests of birds,
feeding signs.(C) Reliable information from local people – Pictorial guides and photos of species could be shown to local
communities to verify the presence of different faunal taxa.
Fish:
Method Habitat
Fish catch surveys (commercial/subsistence) Lagoons, estuaries, ponds.
Bank side counts Shallow pools, slow-flowing shallow streams.
Snorkelling Clear shallow pools, slow-flowing shallow streams, coral reefs.
Seine netting Tanks, reservoirs, slow-flowing rivers, lagoons/estuaries.
Scoop netting Shallow pools, slow-flowing shallow streams, marshes.
Cast netting Tanks, reservoirs, slow-flowing rivers, lagoons/estuaries.
Gill netting Tanks, reservoirs, slow-flowing rivers, lagoons/estuaries.
Herpetofauna (Amphibians and Reptiles):
Method Habitat
Visual Encounter Surveys (VES) and hand-capturing A) Transect sampling; B) Quadrat sampling
Mangroves, saline marshes, grassland, scrubland.
Pitfall and fence trapping Mangroves, saline marshes, grassland, scrubland.
Netting Ponds, tanks.
Nocturnal road cunts Roads that adjoin/cut across mangroves, coastal scrubland, lagoons and estuaries.
Avifauna:
Method Habitat
Timed point counts (for example, 15 minute radial point counts)
Estuaries, lagoons, tanks, saline marshes, beach, mangroves.
Line transects Mangroves, saline marshes, maritime grasslands.
Mist netting Mangroves.
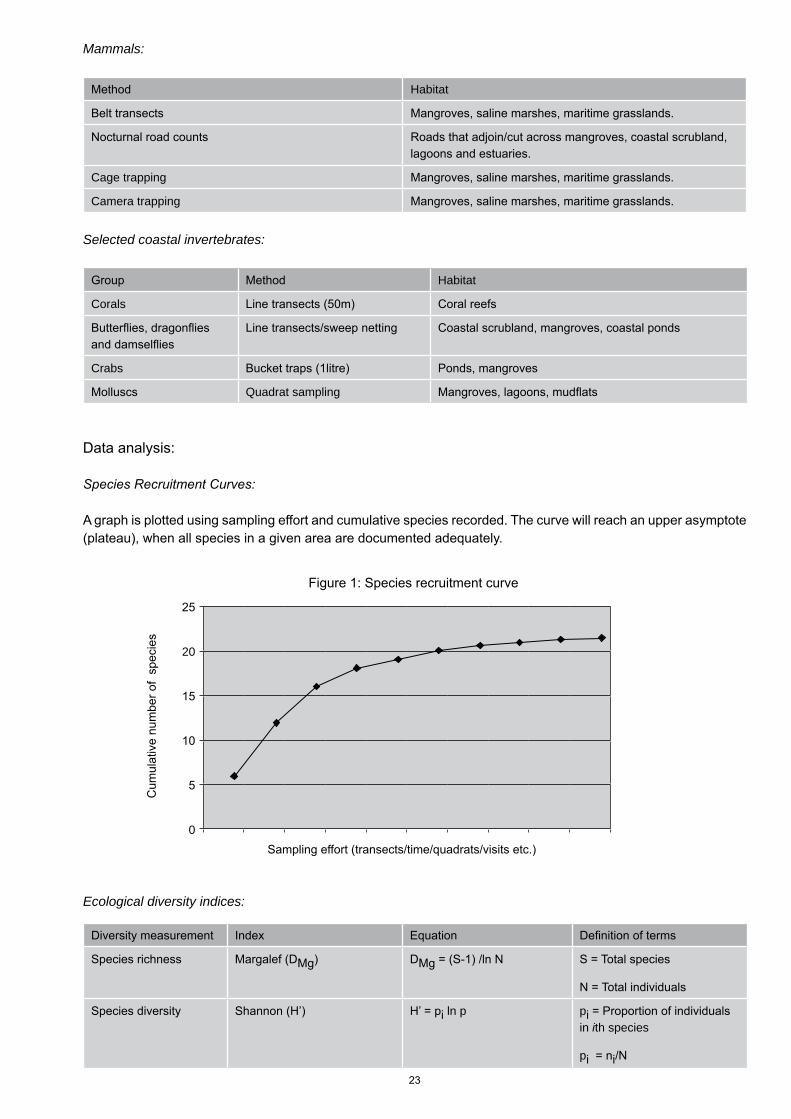
23
Mammals:
Method Habitat
Belt transects Mangroves, saline marshes, maritime grasslands.
Nocturnal road counts Roads that adjoin/cut across mangroves, coastal scrubland, lagoons and estuaries.
Cage trapping Mangroves, saline marshes, maritime grasslands.
Camera trapping Mangroves, saline marshes, maritime grasslands.
Selected coastal invertebrates:
Group Method Habitat
Corals Line transects (50m) Coral reefs
Butterflies, dragonflies and damselflies
Line transects/sweep netting Coastal scrubland, mangroves, coastal ponds
Crabs Bucket traps (1litre) Ponds, mangroves
Molluscs Quadrat sampling Mangroves, lagoons, mudflats
Data analysis:
Species Recruitment Curves:
A graph is plotted using sampling effort and cumulative species recorded. The curve will reach an upper asymptote (plateau), when all species in a given area are documented adequately.
Ecological diversity indices:
Diversity measurement Index Equation Definition of terms
Species richness Margalef (DMg) DMg = (S-1) /ln N S = Total species
N = Total individuals
Species diversity Shannon (H’) H’ = pi ln p pi = Proportion of individuals in ith species
pi = ni/N
Cum
ulat
ive
num
ber o
f sp
ecie
s
Sampling effort (transects/time/quadrats/visits etc.)
25
20
15
10
5
0
Figure 1: Species recruitment curve
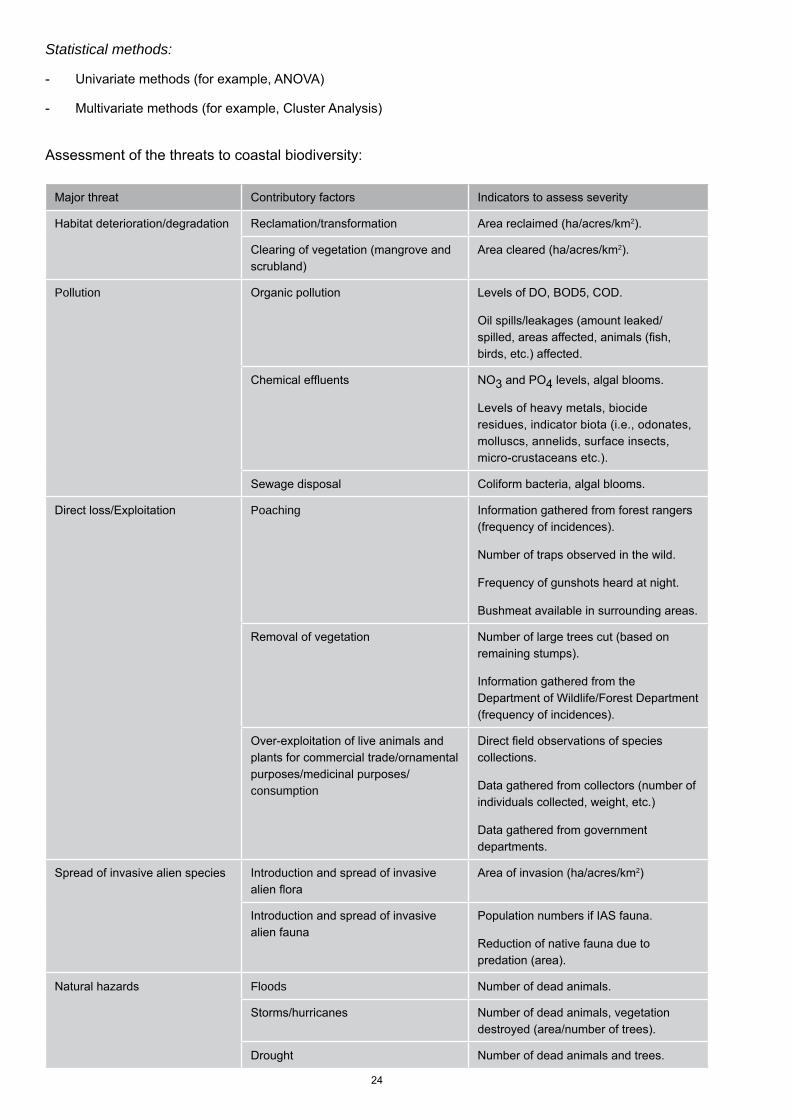
24
Statistical methods:
- Univariate methods (for example, ANOVA)
- Multivariate methods (for example, Cluster Analysis)
Assessment of the threats to coastal biodiversity:
Major threat Contributory factors Indicators to assess severity
Habitat deterioration/degradation Reclamation/transformation Area reclaimed (ha/acres/km2).
Clearing of vegetation (mangrove and scrubland)
Area cleared (ha/acres/km2).
Pollution Organic pollution Levels of DO, BOD5, COD.
Oil spills/leakages (amount leaked/ spilled, areas affected, animals (fish, birds, etc.) affected.
Chemical effluents NO3 and PO4 levels, algal blooms.
Levels of heavy metals, biocide residues, indicator biota (i.e., odonates, molluscs, annelids, surface insects, micro-crustaceans etc.).
Sewage disposal Coliform bacteria, algal blooms.
Direct loss/Exploitation Poaching Information gathered from forest rangers (frequency of incidences).
Number of traps observed in the wild.
Frequency of gunshots heard at night.
Bushmeat available in surrounding areas.
Removal of vegetation Number of large trees cut (based on remaining stumps).
Information gathered from the Department of Wildlife/Forest Department (frequency of incidences).
Over-exploitation of live animals and plants for commercial trade/ornamental purposes/medicinal purposes/consumption
Direct field observations of species collections.
Data gathered from collectors (number of individuals collected, weight, etc.)
Data gathered from government departments.
Spread of invasive alien species Introduction and spread of invasive alien flora
Area of invasion (ha/acres/km2)
Introduction and spread of invasive alien fauna
Population numbers if IAS fauna.
Reduction of native fauna due to predation (area).
Natural hazards Floods Number of dead animals.
Storms/hurricanes Number of dead animals, vegetation destroyed (area/number of trees).
Drought Number of dead animals and trees.
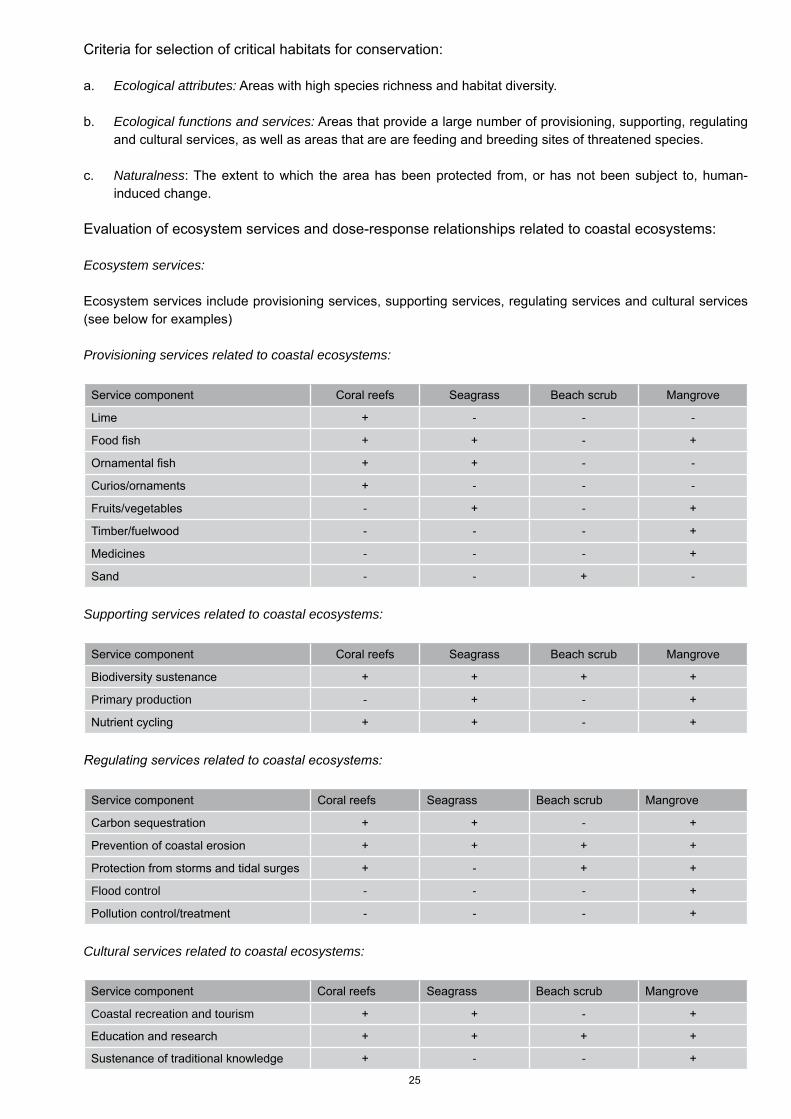
25
Criteria for selection of critical habitats for conservation:
a. Ecological attributes: Areas with high species richness and habitat diversity.
b. Ecological functions and services: Areas that provide a large number of provisioning, supporting, regulating and cultural services, as well as areas that are are feeding and breeding sites of threatened species.
c. Naturalness: The extent to which the area has been protected from, or has not been subject to, human-induced change.
Evaluation of ecosystem services and dose-response relationships related to coastal ecosystems:
Ecosystem services:
Ecosystem services include provisioning services, supporting services, regulating services and cultural services (see below for examples)
Provisioning services related to coastal ecosystems:
Service component Coral reefs Seagrass Beach scrub Mangrove
Lime + - - -
Food fish + + - +
Ornamental fish + + - -
Curios/ornaments + - - -
Fruits/vegetables - + - +
Timber/fuelwood - - - +
Medicines - - - +
Sand - - + -
Supporting services related to coastal ecosystems:
Service component Coral reefs Seagrass Beach scrub Mangrove
Biodiversity sustenance + + + +
Primary production - + - +
Nutrient cycling + + - +
Regulating services related to coastal ecosystems:
Service component Coral reefs Seagrass Beach scrub Mangrove
Carbon sequestration + + - +
Prevention of coastal erosion + + + +
Protection from storms and tidal surges + - + +
Flood control - - - +
Pollution control/treatment - - - +
Cultural services related to coastal ecosystems:
Service component Coral reefs Seagrass Beach scrub Mangrove
Coastal recreation and tourism + + - +
Education and research + + + +
Sustenance of traditional knowledge + - - +
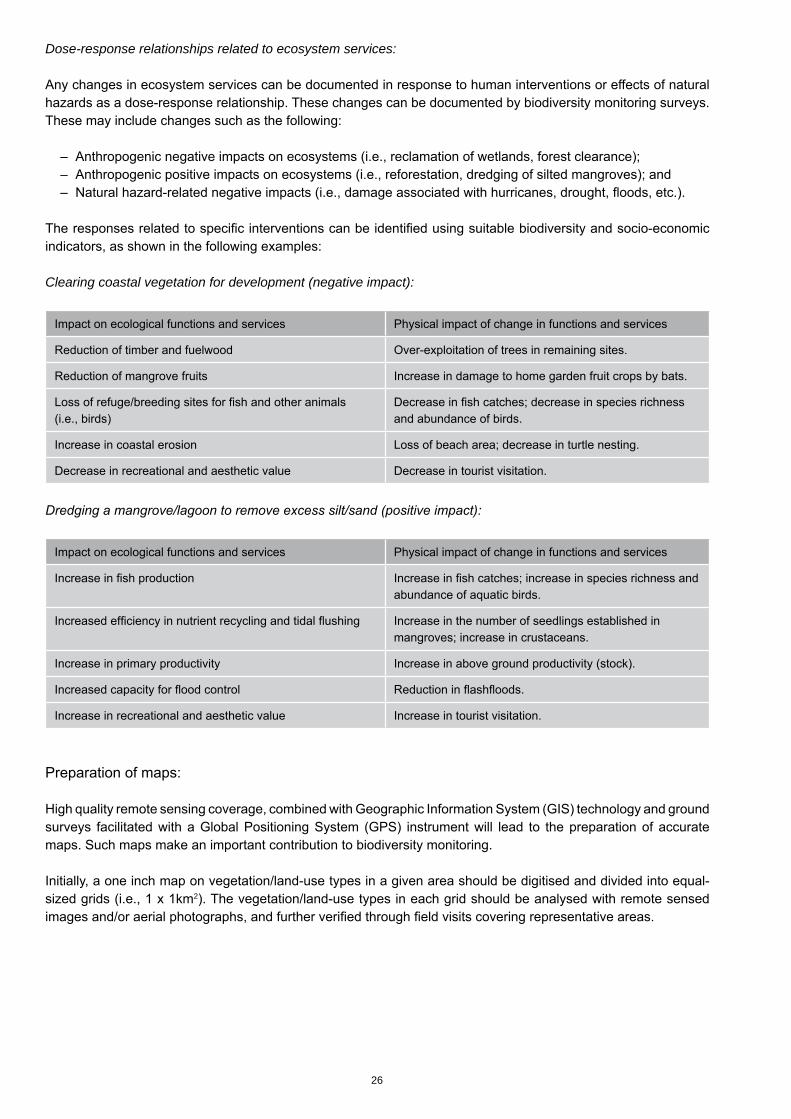
26
Dose-response relationships related to ecosystem services:
Any changes in ecosystem services can be documented in response to human interventions or effects of natural hazards as a dose-response relationship. These changes can be documented by biodiversity monitoring surveys. These may include changes such as the following:
– Anthropogenic negative impacts on ecosystems (i.e., reclamation of wetlands, forest clearance); – Anthropogenic positive impacts on ecosystems (i.e., reforestation, dredging of silted mangroves); and – Natural hazard-related negative impacts (i.e., damage associated with hurricanes, drought, floods, etc.).
The responses related to specific interventions can be identified using suitable biodiversity and socio-economic indicators, as shown in the following examples:
Clearing coastal vegetation for development (negative impact):
Impact on ecological functions and services Physical impact of change in functions and services
Reduction of timber and fuelwood Over-exploitation of trees in remaining sites.
Reduction of mangrove fruits Increase in damage to home garden fruit crops by bats.
Loss of refuge/breeding sites for fish and other animals (i.e., birds)
Decrease in fish catches; decrease in species richness and abundance of birds.
Increase in coastal erosion Loss of beach area; decrease in turtle nesting.
Decrease in recreational and aesthetic value Decrease in tourist visitation.
Dredging a mangrove/lagoon to remove excess silt/sand (positive impact):
Impact on ecological functions and services Physical impact of change in functions and services
Increase in fish production Increase in fish catches; increase in species richness and abundance of aquatic birds.
Increased efficiency in nutrient recycling and tidal flushing Increase in the number of seedlings established in mangroves; increase in crustaceans.
Increase in primary productivity Increase in above ground productivity (stock).
Increased capacity for flood control Reduction in flashfloods.
Increase in recreational and aesthetic value Increase in tourist visitation.
Preparation of maps:
High quality remote sensing coverage, combined with Geographic Information System (GIS) technology and ground surveys facilitated with a Global Positioning System (GPS) instrument will lead to the preparation of accurate maps. Such maps make an important contribution to biodiversity monitoring.
Initially, a one inch map on vegetation/land-use types in a given area should be digitised and divided into equal-sized grids (i.e., 1 x 1km2). The vegetation/land-use types in each grid should be analysed with remote sensed images and/or aerial photographs, and further verified through field visits covering representative areas.

27
References
Kitching, R. L., Vickerman, G., Laidlaw, M. and K. Hurley (2000). The Comparative Assessment of Arthropod and Tree Biodiversity in Old-World Forests: The Rainforest CRC/Earthwatch Protocol Manual. CRC, Cairns: Cooperative Research Centre for Tropical Rainforest Ecology and Management. Technical Report. Rainforest. 70pp.
Magurran, A (1988). Ecological Diversity and its Measurement. Princeton: Princeton University Press. 179 pp.
Noss, R. F. (1990). Indicators for monitoring biodiversity: A hierarchical approach. Conservation Biology 4 (4):355-365.
Sutherland, W. J (1996). Ecological census techniques – A handbook. Cambridge, UK: Cambridge University press. 448 pp.
UNEP (2006), Marine and coastal ecosystems and human well-being: a synthesis report on the findings of the millennium ecosystem assessment. UNEP. 76pp.
Wilson, E. O (1988). Biodiversity. Washington DC: National Academic Press. 521pp.
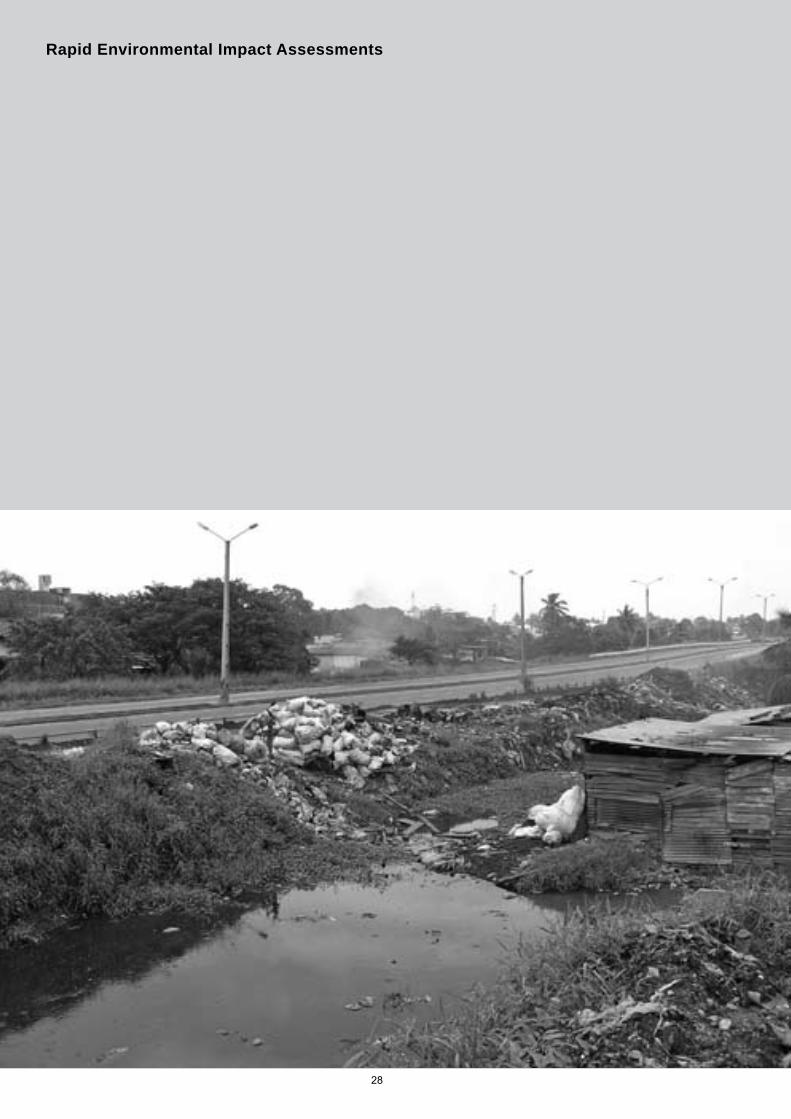
28
Rapid Environmental Impact Assessments
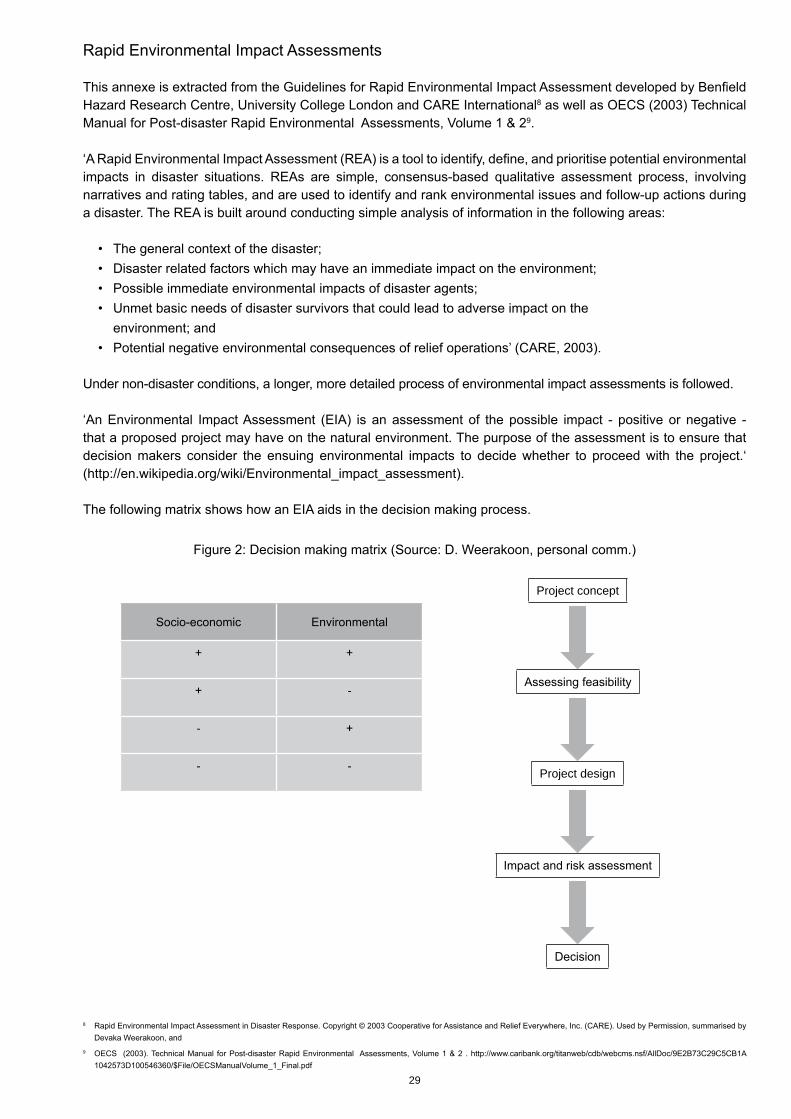
29
Rapid Environmental Impact Assessments
This annexe is extracted from the Guidelines for Rapid Environmental Impact Assessment developed by Benfield Hazard Research Centre, University College London and CARE International8 as well as OECS (2003) Technical Manual for Post-disaster Rapid Environmental Assessments, Volume 1 & 29.
‘A Rapid Environmental Impact Assessment (REA) is a tool to identify, define, and prioritise potential environmental impacts in disaster situations. REAs are simple, consensus-based qualitative assessment process, involving narratives and rating tables, and are used to identify and rank environmental issues and follow-up actions during a disaster. The REA is built around conducting simple analysis of information in the following areas:
• The general context of the disaster; • Disaster related factors which may have an immediate impact on the environment; • Possible immediate environmental impacts of disaster agents; • Unmet basic needs of disaster survivors that could lead to adverse impact on the environment; and • Potential negative environmental consequences of relief operations’ (CARE, 2003).
Under non-disaster conditions, a longer, more detailed process of environmental impact assessments is followed.
‘An Environmental Impact Assessment (EIA) is an assessment of the possible impact - positive or negative - that a proposed project may have on the natural environment. The purpose of the assessment is to ensure that decision makers consider the ensuing environmental impacts to decide whether to proceed with the project.‘ (http://en.wikipedia.org/wiki/Environmental_impact_assessment).
The following matrix shows how an EIA aids in the decision making process.
8 Rapid Environmental Impact Assessment in Disaster Response. Copyright © 2003 Cooperative for Assistance and Relief Everywhere, Inc. (CARE). Used by Permission, summarised by Devaka Weerakoon, and
9 OECS (2003). Technical Manual for Post-disaster Rapid Environmental Assessments, Volume 1 & 2 . http://www.caribank.org/titanweb/cdb/webcms.nsf/AllDoc/9E2B73C29C5CB1A 1042573D100546360/$File/OECSManualVolume_1_Final.pdf
Figure 2: Decision making matrix (Source: D. Weerakoon, personal comm.)
Socio-economic Environmental
+ +
+ -
- +
- -
Project concept
Assessing feasibility
Impact and risk assessment
Project design
Decision
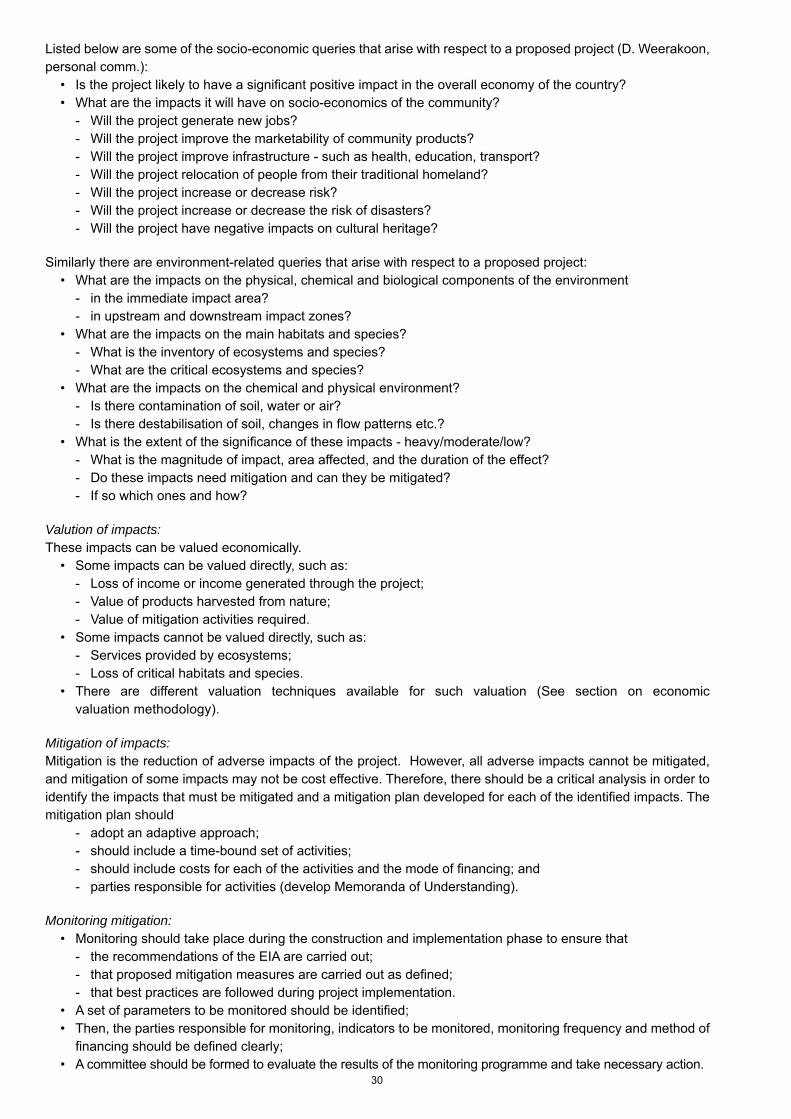
30
Listed below are some of the socio-economic queries that arise with respect to a proposed project (D. Weerakoon, personal comm.): • Is the project likely to have a significant positive impact in the overall economy of the country? • What are the impacts it will have on socio-economics of the community? - Will the project generate new jobs? - Will the project improve the marketability of community products? - Will the project improve infrastructure - such as health, education, transport? - Will the project relocation of people from their traditional homeland? - Will the project increase or decrease risk? - Will the project increase or decrease the risk of disasters? - Will the project have negative impacts on cultural heritage?
Similarly there are environment-related queries that arise with respect to a proposed project: • What are the impacts on the physical, chemical and biological components of the environment - in the immediate impact area? - in upstream and downstream impact zones? • What are the impacts on the main habitats and species? - What is the inventory of ecosystems and species? - What are the critical ecosystems and species? • What are the impacts on the chemical and physical environment? - Is there contamination of soil, water or air? - Is there destabilisation of soil, changes in flow patterns etc.? • What is the extent of the significance of these impacts - heavy/moderate/low? - What is the magnitude of impact, area affected, and the duration of the effect? - Do these impacts need mitigation and can they be mitigated? - If so which ones and how?
Valution of impacts:These impacts can be valued economically. • Some impacts can be valued directly, such as: - Loss of income or income generated through the project; - Value of products harvested from nature; - Value of mitigation activities required. • Some impacts cannot be valued directly, such as: - Services provided by ecosystems; - Loss of critical habitats and species. • There are different valuation techniques available for such valuation (See section on economic
valuation methodology).
Mitigation of impacts:Mitigation is the reduction of adverse impacts of the project. However, all adverse impacts cannot be mitigated, and mitigation of some impacts may not be cost effective. Therefore, there should be a critical analysis in order to identify the impacts that must be mitigated and a mitigation plan developed for each of the identified impacts. The mitigation plan should - adopt an adaptive approach; - should include a time-bound set of activities; - should include costs for each of the activities and the mode of financing; and - parties responsible for activities (develop Memoranda of Understanding).
Monitoring mitigation: • Monitoring should take place during the construction and implementation phase to ensure that - the recommendations of the EIA are carried out; - that proposed mitigation measures are carried out as defined; - that best practices are followed during project implementation. • A set of parameters to be monitored should be identified; • Then, the parties responsible for monitoring, indicators to be monitored, monitoring frequency and method of
financing should be defined clearly; • A committee should be formed to evaluate the results of the monitoring programme and take necessary action.
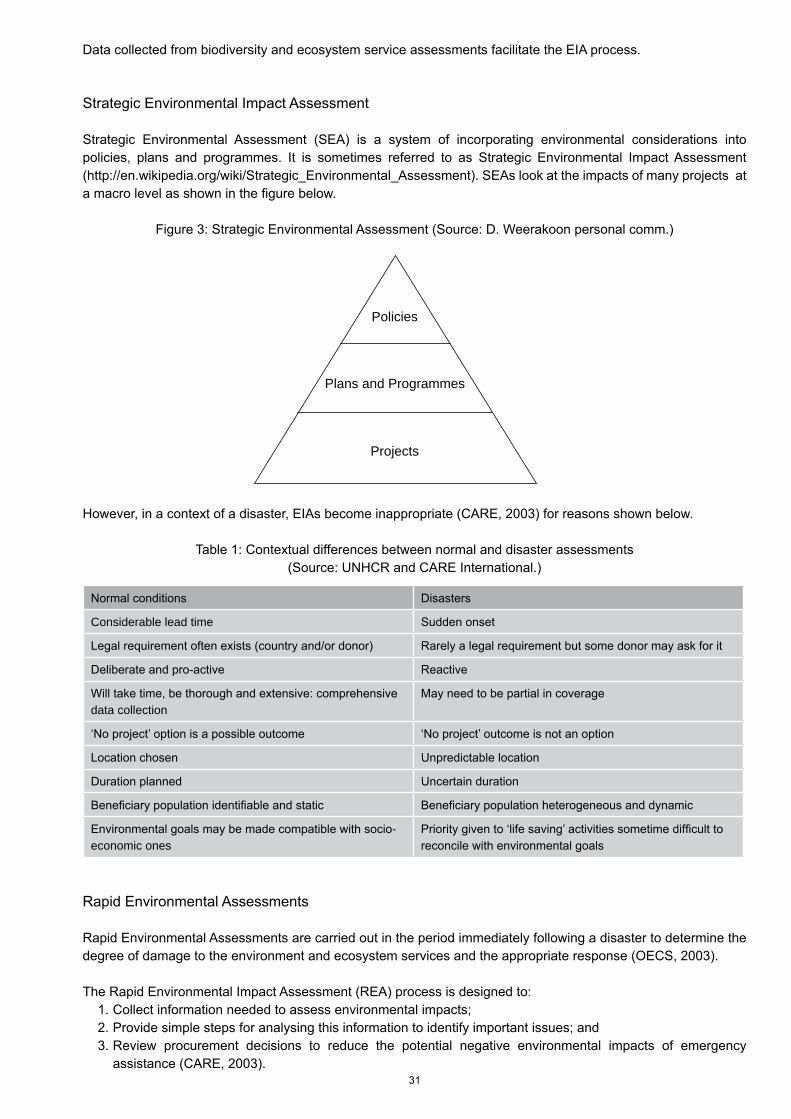
31
Data collected from biodiversity and ecosystem service assessments facilitate the EIA process.
Strategic Environmental Impact Assessment
Strategic Environmental Assessment (SEA) is a system of incorporating environmental considerations into policies, plans and programmes. It is sometimes referred to as Strategic Environmental Impact Assessment (http://en.wikipedia.org/wiki/Strategic_Environmental_Assessment). SEAs look at the impacts of many projects at a macro level as shown in the figure below.
Figure 3: Strategic Environmental Assessment (Source: D. Weerakoon personal comm.)
However, in a context of a disaster, EIAs become inappropriate (CARE, 2003) for reasons shown below.
Table 1: Contextual differences between normal and disaster assessments (Source: UNHCR and CARE International.)
Normal conditions Disasters
Considerable lead time Sudden onset
Legal requirement often exists (country and/or donor) Rarely a legal requirement but some donor may ask for it
Deliberate and pro-active Reactive
Will take time, be thorough and extensive: comprehensive data collection
May need to be partial in coverage
‘No project’ option is a possible outcome ‘No project’ outcome is not an option
Location chosen Unpredictable location
Duration planned Uncertain duration
Beneficiary population identifiable and static Beneficiary population heterogeneous and dynamic
Environmental goals may be made compatible with socio-economic ones
Priority given to ‘life saving’ activities sometime difficult to reconcile with environmental goals
Rapid Environmental Assessments
Rapid Environmental Assessments are carried out in the period immediately following a disaster to determine the degree of damage to the environment and ecosystem services and the appropriate response (OECS, 2003).
The Rapid Environmental Impact Assessment (REA) process is designed to: 1. Collect information needed to assess environmental impacts; 2. Provide simple steps for analysing this information to identify important issues; and 3. Review procurement decisions to reduce the potential negative environmental impacts of emergency
assistance (CARE, 2003).
Plans and Programmes
Policies
Projects
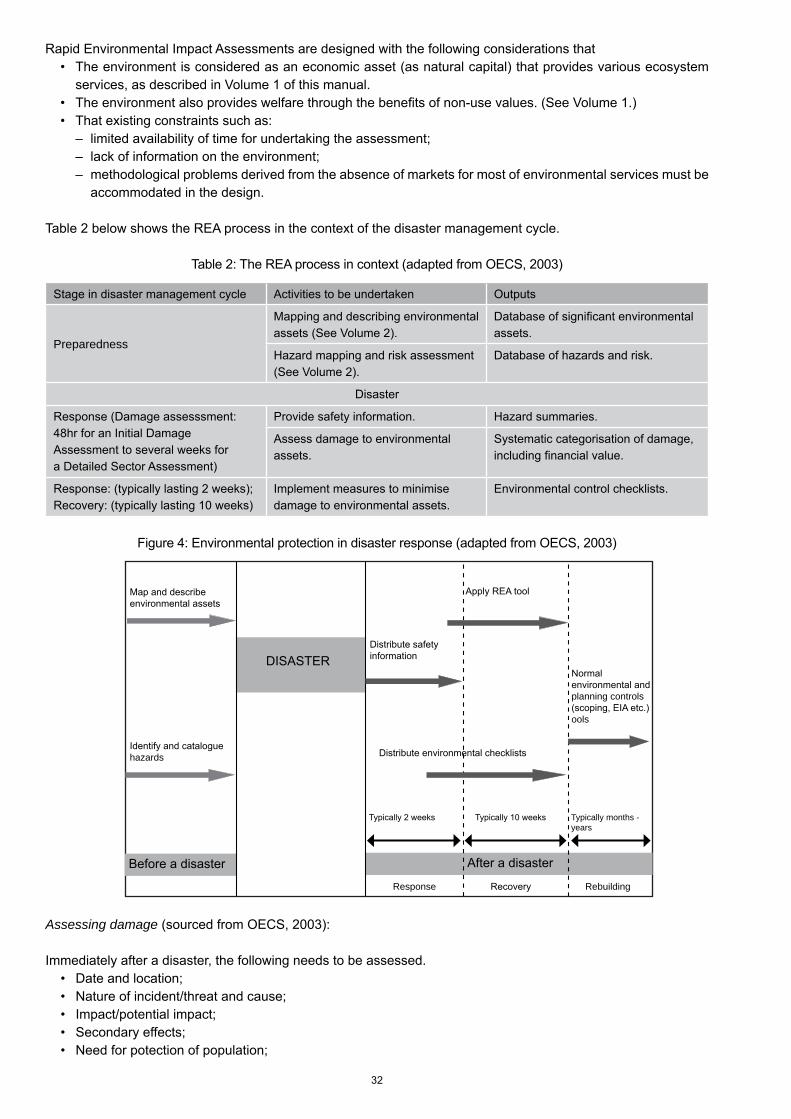
32
Rapid Environmental Impact Assessments are designed with the following considerations that • The environment is considered as an economic asset (as natural capital) that provides various ecosystem
services, as described in Volume 1 of this manual. • The environment also provides welfare through the benefits of non-use values. (See Volume 1.) • That existing constraints such as: – limited availability of time for undertaking the assessment; – lack of information on the environment; – methodological problems derived from the absence of markets for most of environmental services must be
accommodated in the design.
Table 2 below shows the REA process in the context of the disaster management cycle.
Table 2: The REA process in context (adapted from OECS, 2003)
Stage in disaster management cycle Activities to be undertaken Outputs
Preparedness
Mapping and describing environmental assets (See Volume 2).
Database of significant environmental assets.
Hazard mapping and risk assessment (See Volume 2).
Database of hazards and risk.
Disaster
Response (Damage assesssment: 48hr for an Initial DamageAssessment to several weeks fora Detailed Sector Assessment)
Provide safety information. Hazard summaries.
Assess damage to environmental assets.
Systematic categorisation of damage, including financial value.
Response: (typically lasting 2 weeks);Recovery: (typically lasting 10 weeks)
Implement measures to minimise damage to environmental assets.
Environmental control checklists.
Figure 4: Environmental protection in disaster response (adapted from OECS, 2003)
Assessing damage (sourced from OECS, 2003):
Immediately after a disaster, the following needs to be assessed. • Date and location; • Nature of incident/threat and cause; • Impact/potential impact; • Secondary effects; • Need for potection of population;
Map and describe environmental assets
Identify and catalogue hazards
DISASTER
Apply REA tool
Distribute safety information
Normal environmental and planning controls (scoping, EIA etc.)ools
Distribute environmental checklists
Typically 2 weeks Typically 10 weeks Typically months -years
Before a disaster
Response Recovery Rebuilding
After a disaster
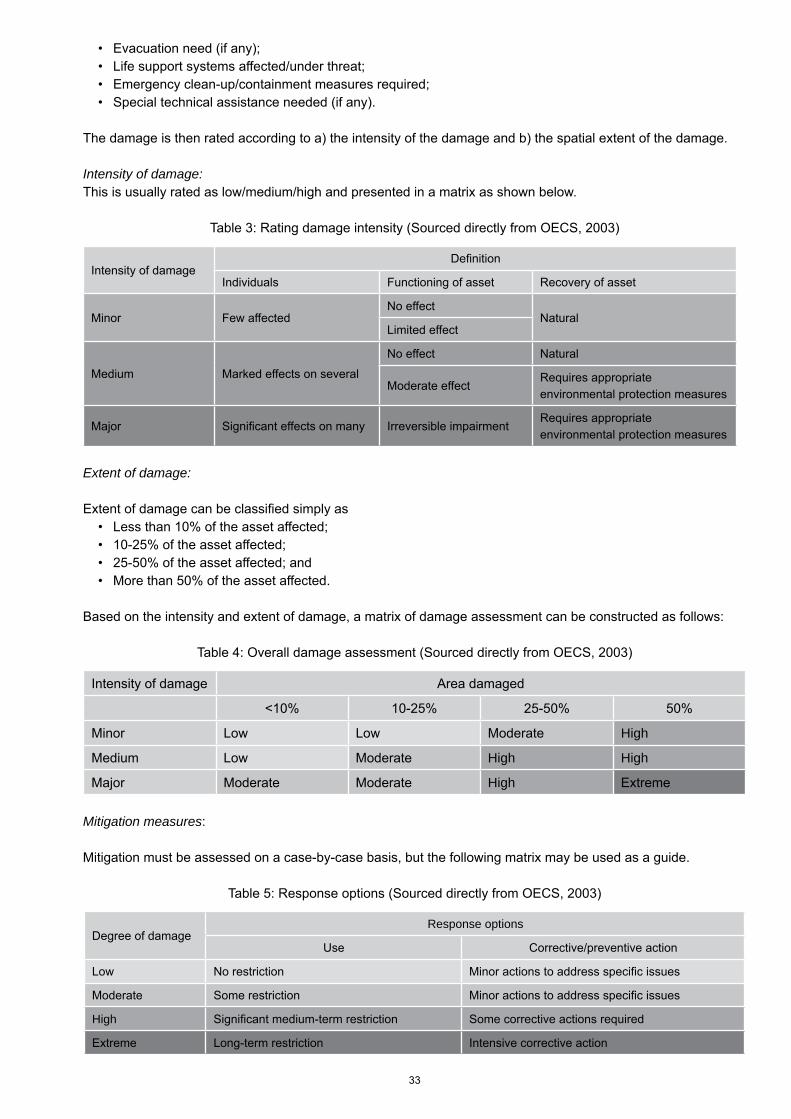
33
• Evacuation need (if any); • Life support systems affected/under threat; • Emergency clean-up/containment measures required; • Special technical assistance needed (if any).
The damage is then rated according to a) the intensity of the damage and b) the spatial extent of the damage.
Intensity of damage:This is usually rated as low/medium/high and presented in a matrix as shown below.
Table 3: Rating damage intensity (Sourced directly from OECS, 2003)
Intensity of damageDefinition
Individuals Functioning of asset Recovery of asset
Minor Few affectedNo effect
NaturalLimited effect
Medium Marked effects on several
No effect Natural
Moderate effectRequires appropriate environmental protection measures
Major Significant effects on many Irreversible impairmentRequires appropriate environmental protection measures
Extent of damage:
Extent of damage can be classified simply as • Less than 10% of the asset affected; • 10-25% of the asset affected; • 25-50% of the asset affected; and • More than 50% of the asset affected.
Based on the intensity and extent of damage, a matrix of damage assessment can be constructed as follows:
Table 4: Overall damage assessment (Sourced directly from OECS, 2003)
Intensity of damage Area damaged
<10% 10-25% 25-50% 50%
Minor Low Low Moderate High
Medium Low Moderate High High
Major Moderate Moderate High Extreme
Mitigation measures:
Mitigation must be assessed on a case-by-case basis, but the following matrix may be used as a guide.
Table 5: Response options (Sourced directly from OECS, 2003)
Degree of damageResponse options
Use Corrective/preventive action
Low No restriction Minor actions to address specific issues
Moderate Some restriction Minor actions to address specific issues
High Significant medium-term restriction Some corrective actions required
Extreme Long-term restriction Intensive corrective action
34
Economic Valuation Methodology
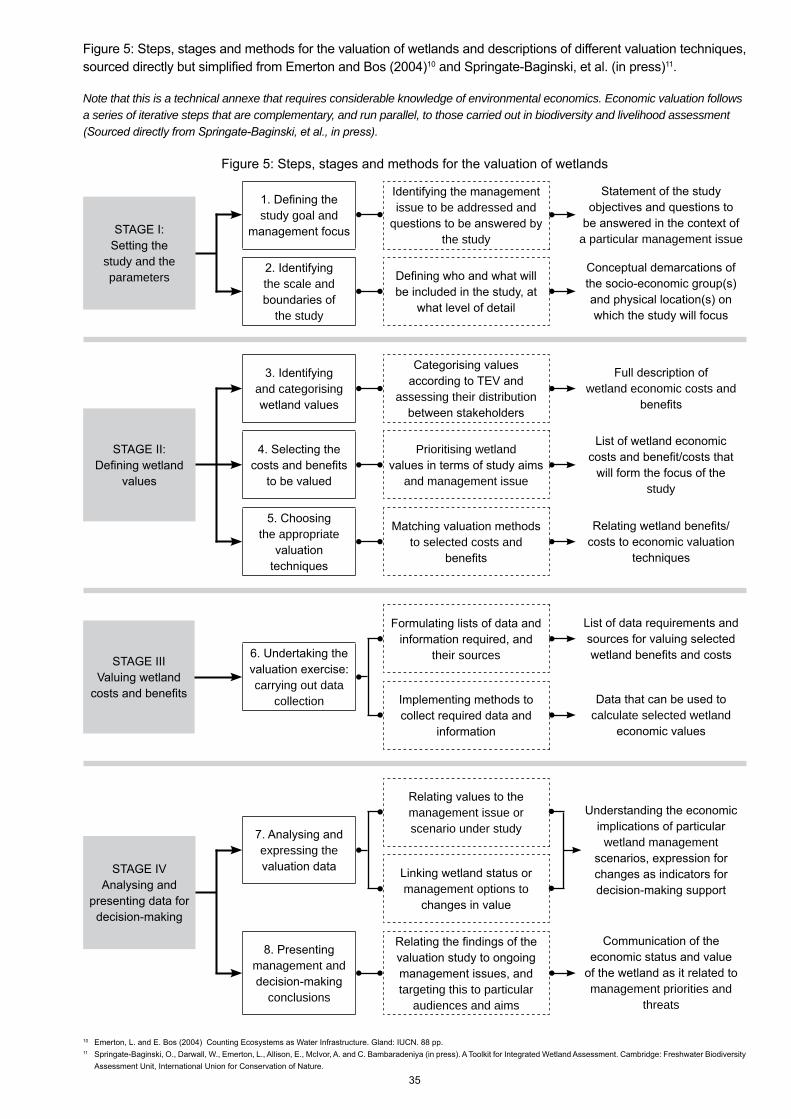
35
Figure 5: Steps, stages and methods for the valuation of wetlands and descriptions of different valuation techniques, sourced directly but simplified from Emerton and Bos (2004)10 and Springate-Baginski, et al. (in press)11.
Note that this is a technical annexe that requires considerable knowledge of environmental economics. Economic valuation follows a series of iterative steps that are complementary, and run parallel, to those carried out in biodiversity and livelihood assessment (Sourced directly from Springate-Baginski, et al., in press).
Figure 5: Steps, stages and methods for the valuation of wetlands
10 Emerton, L. and E. Bos (2004) Counting Ecosystems as Water Infrastructure. Gland: IUCN. 88 pp.11 Springate-Baginski, O., Darwall, W., Emerton, L., Allison, E., McIvor, A. and C. Bambaradeniya (in press). A Toolkit for Integrated Wetland Assessment. Cambridge: Freshwater Biodiversity
Assessment Unit, International Union for Conservation of Nature.
STAGE I:Setting the
study and the parameters
1. Defining the study goal and
management focus
Identifying the management issue to be addressed and
questions to be answered by the study
Statement of the study objectives and questions to
be answered in the context of a particular management issue
2. Identifying the scale and boundaries of
the study
Defining who and what will be included in the study, at
what level of detail
Conceptual demarcations of the socio-economic group(s) and physical location(s) on which the study will focus
STAGE II:Defining wetland
values
3. Identifying and categorising wetland values
Categorising values according to TEV and
assessing their distribution between stakeholders
Full description of wetland economic costs and
benefits
4. Selecting the costs and benefits
to be valued
Prioritising wetland values in terms of study aims
and management issue
List of wetland economic costs and benefit/costs that
will form the focus of the study
5. Choosing the appropriate
valuation techniques
Matching valuation methods to selected costs and
benefits
Relating wetland benefits/costs to economic valuation
techniques
STAGE IIIValuing wetland
costs and benefits
6. Undertaking the valuation exercise: carrying out data
collection
Formulating lists of data and information required, and
their sources
List of data requirements and sources for valuing selected wetland benefits and costs
Implementing methods to collect required data and
information
Data that can be used to calculate selected wetland
economic values
STAGE IVAnalysing and
presenting data for decision-making
7. Analysing and expressing the valuation data
Relating values to the management issue or scenario under study
Understanding the economic implications of particular
wetland management scenarios, expression for changes as indicators for decision-making support
8. Presenting management and decision-making
conclusions
Linking wetland status or management options to
changes in value
Relating the findings of the valuation study to ongoing management issues, and targeting this to particular
audiences and aims
Communication of the economic status and value
of the wetland as it related to management priorities and
threats
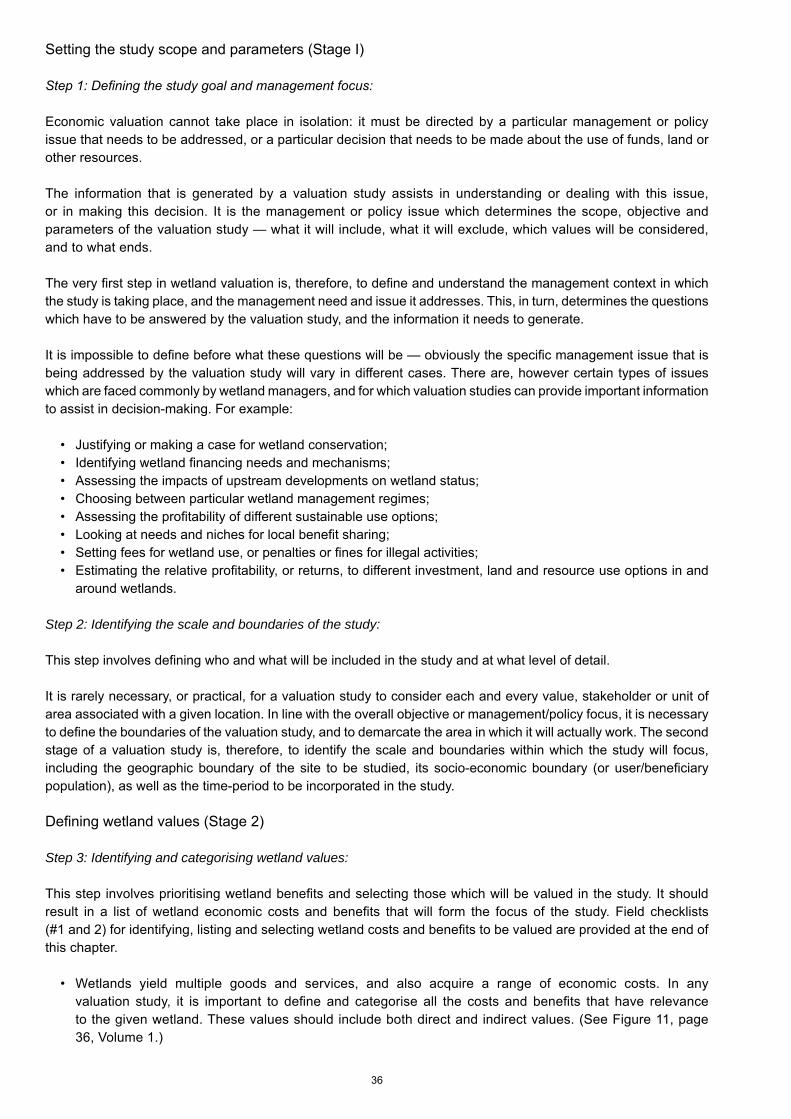
36
Setting the study scope and parameters (Stage I)
Step 1: Defining the study goal and management focus:
Economic valuation cannot take place in isolation: it must be directed by a particular management or policy issue that needs to be addressed, or a particular decision that needs to be made about the use of funds, land or other resources.
The information that is generated by a valuation study assists in understanding or dealing with this issue, or in making this decision. It is the management or policy issue which determines the scope, objective and parameters of the valuation study — what it will include, what it will exclude, which values will be considered, and to what ends.
The very first step in wetland valuation is, therefore, to define and understand the management context in which the study is taking place, and the management need and issue it addresses. This, in turn, determines the questions which have to be answered by the valuation study, and the information it needs to generate.
It is impossible to define before what these questions will be — obviously the specific management issue that is being addressed by the valuation study will vary in different cases. There are, however certain types of issues which are faced commonly by wetland managers, and for which valuation studies can provide important information to assist in decision-making. For example:
• Justifying or making a case for wetland conservation; • Identifying wetland financing needs and mechanisms; • Assessing the impacts of upstream developments on wetland status; • Choosing between particular wetland management regimes; • Assessing the profitability of different sustainable use options; • Looking at needs and niches for local benefit sharing; • Setting fees for wetland use, or penalties or fines for illegal activities; • Estimating the relative profitability, or returns, to different investment, land and resource use options in and
around wetlands.
Step 2: Identifying the scale and boundaries of the study:
This step involves defining who and what will be included in the study and at what level of detail.
It is rarely necessary, or practical, for a valuation study to consider each and every value, stakeholder or unit of area associated with a given location. In line with the overall objective or management/policy focus, it is necessary to define the boundaries of the valuation study, and to demarcate the area in which it will actually work. The second stage of a valuation study is, therefore, to identify the scale and boundaries within which the study will focus, including the geographic boundary of the site to be studied, its socio-economic boundary (or user/beneficiary population), as well as the time-period to be incorporated in the study.
Defining wetland values (Stage 2)
Step 3: Identifying and categorising wetland values:
This step involves prioritising wetland benefits and selecting those which will be valued in the study. It should result in a list of wetland economic costs and benefits that will form the focus of the study. Field checklists (#1 and 2) for identifying, listing and selecting wetland costs and benefits to be valued are provided at the end of this chapter.
• Wetlands yield multiple goods and services, and also acquire a range of economic costs. In any valuation study, it is important to define and categorise all the costs and benefits that have relevance to the given wetland. These values should include both direct and indirect values. (See Figure 11, page 36, Volume 1.)
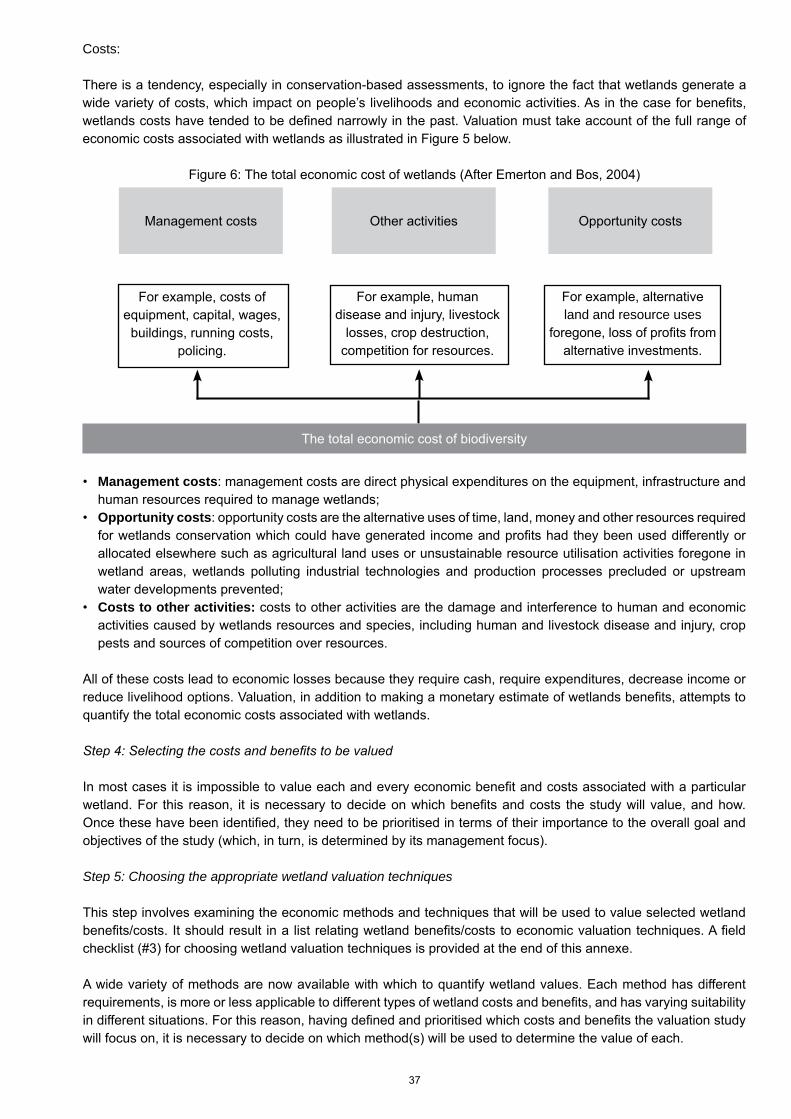
37
Costs:
There is a tendency, especially in conservation-based assessments, to ignore the fact that wetlands generate a wide variety of costs, which impact on people’s livelihoods and economic activities. As in the case for benefits, wetlands costs have tended to be defined narrowly in the past. Valuation must take account of the full range of economic costs associated with wetlands as illustrated in Figure 5 below.
Figure 6: The total economic cost of wetlands (After Emerton and Bos, 2004)
• Management costs: management costs are direct physical expenditures on the equipment, infrastructure and human resources required to manage wetlands;
• Opportunity costs: opportunity costs are the alternative uses of time, land, money and other resources required for wetlands conservation which could have generated income and profits had they been used differently or allocated elsewhere such as agricultural land uses or unsustainable resource utilisation activities foregone in wetland areas, wetlands polluting industrial technologies and production processes precluded or upstream water developments prevented;
• Costs to other activities: costs to other activities are the damage and interference to human and economic activities caused by wetlands resources and species, including human and livestock disease and injury, crop pests and sources of competition over resources.
All of these costs lead to economic losses because they require cash, require expenditures, decrease income or reduce livelihood options. Valuation, in addition to making a monetary estimate of wetlands benefits, attempts to quantify the total economic costs associated with wetlands.
Step 4: Selecting the costs and benefits to be valued
In most cases it is impossible to value each and every economic benefit and costs associated with a particular wetland. For this reason, it is necessary to decide on which benefits and costs the study will value, and how. Once these have been identified, they need to be prioritised in terms of their importance to the overall goal and objectives of the study (which, in turn, is determined by its management focus).
Step 5: Choosing the appropriate wetland valuation techniques
This step involves examining the economic methods and techniques that will be used to value selected wetland benefits/costs. It should result in a list relating wetland benefits/costs to economic valuation techniques. A field checklist (#3) for choosing wetland valuation techniques is provided at the end of this annexe.
A wide variety of methods are now available with which to quantify wetland values. Each method has different requirements, is more or less applicable to different types of wetland costs and benefits, and has varying suitability in different situations. For this reason, having defined and prioritised which costs and benefits the valuation study will focus on, it is necessary to decide on which method(s) will be used to determine the value of each.
Management costs Other activities Opportunity costs
For example, costs of equipment, capital, wages, buildings, running costs,
policing.
For example, human disease and injury, livestock
losses, crop destruction, competition for resources.
For example, alternative land and resource uses
foregone, loss of profits from alternative investments.
The total economic cost of biodiversity
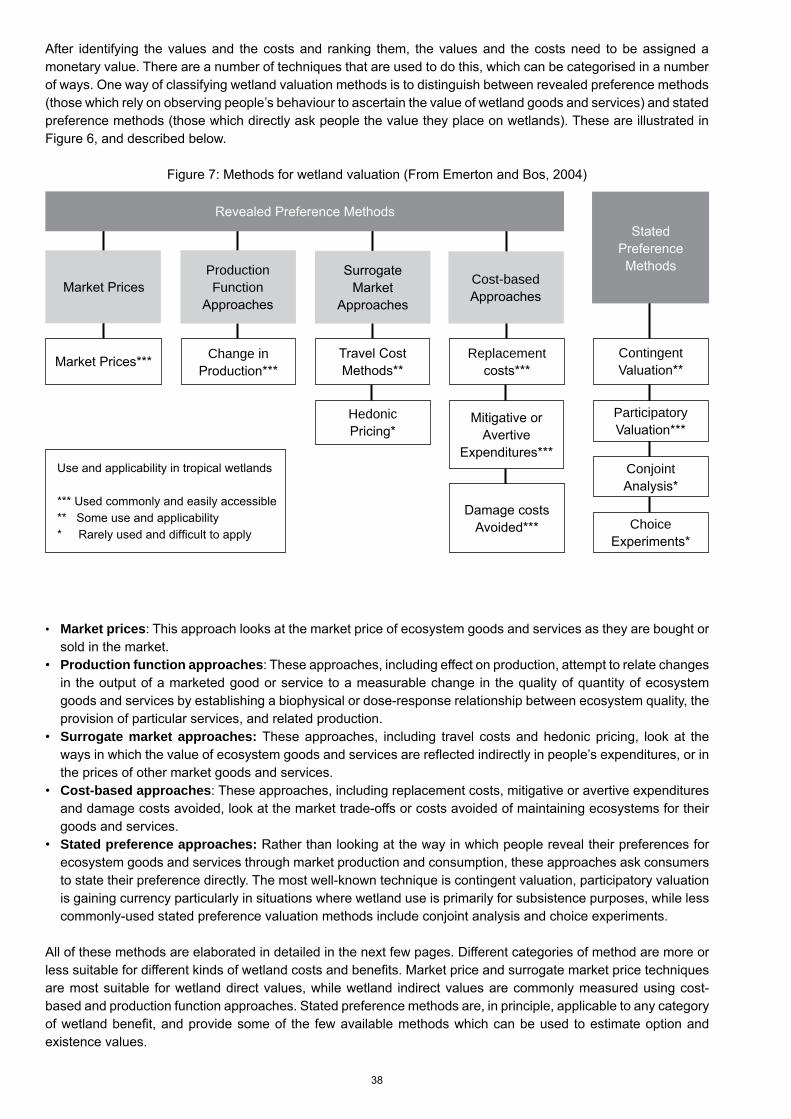
38
After identifying the values and the costs and ranking them, the values and the costs need to be assigned a monetary value. There are a number of techniques that are used to do this, which can be categorised in a number of ways. One way of classifying wetland valuation methods is to distinguish between revealed preference methods (those which rely on observing people’s behaviour to ascertain the value of wetland goods and services) and stated preference methods (those which directly ask people the value they place on wetlands). These are illustrated in Figure 6, and described below.
Figure 7: Methods for wetland valuation (From Emerton and Bos, 2004)
Revealed Preference MethodsStated
Preference MethodsProduction
FunctionApproaches
Surrogate Market
Approaches
Cost-based Approaches
Market Prices*** Change inProduction***
Travel Cost Methods**
Replacement costs***
Hedonic Pricing*
Mitigative or Avertive
Expenditures***
Damage costs Avoided***
Contingent Valuation**
ParticipatoryValuation***
ConjointAnalysis*
ChoiceExperiments*
Market Prices
Use and applicability in tropical wetlands
*** Used commonly and easily accessible** Some use and applicability* Rarely used and difficult to apply
• Market prices: This approach looks at the market price of ecosystem goods and services as they are bought or sold in the market.
• Production function approaches: These approaches, including effect on production, attempt to relate changes in the output of a marketed good or service to a measurable change in the quality of quantity of ecosystem goods and services by establishing a biophysical or dose-response relationship between ecosystem quality, the provision of particular services, and related production.
• Surrogate market approaches: These approaches, including travel costs and hedonic pricing, look at the ways in which the value of ecosystem goods and services are reflected indirectly in people’s expenditures, or in the prices of other market goods and services.
• Cost-based approaches: These approaches, including replacement costs, mitigative or avertive expenditures and damage costs avoided, look at the market trade-offs or costs avoided of maintaining ecosystems for their goods and services.
• Stated preference approaches: Rather than looking at the way in which people reveal their preferences for ecosystem goods and services through market production and consumption, these approaches ask consumers to state their preference directly. The most well-known technique is contingent valuation, participatory valuation is gaining currency particularly in situations where wetland use is primarily for subsistence purposes, while less commonly-used stated preference valuation methods include conjoint analysis and choice experiments.
All of these methods are elaborated in detailed in the next few pages. Different categories of method are more or less suitable for different kinds of wetland costs and benefits. Market price and surrogate market price techniques are most suitable for wetland direct values, while wetland indirect values are commonly measured using cost-based and production function approaches. Stated preference methods are, in principle, applicable to any category of wetland benefit, and provide some of the few available methods which can be used to estimate option and existence values.
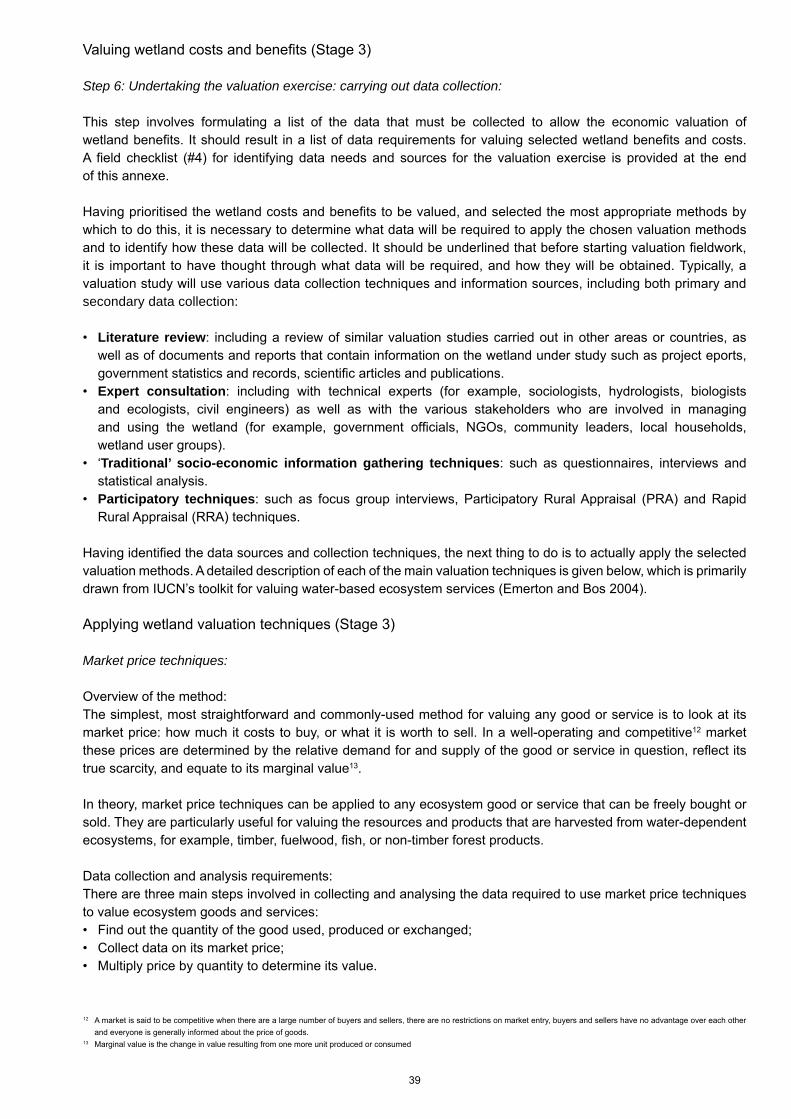
39
Valuing wetland costs and benefits (Stage 3)
Step 6: Undertaking the valuation exercise: carrying out data collection:
This step involves formulating a list of the data that must be collected to allow the economic valuation of wetland benefits. It should result in a list of data requirements for valuing selected wetland benefits and costs. A field checklist (#4) for identifying data needs and sources for the valuation exercise is provided at the end of this annexe.
Having prioritised the wetland costs and benefits to be valued, and selected the most appropriate methods by which to do this, it is necessary to determine what data will be required to apply the chosen valuation methods and to identify how these data will be collected. It should be underlined that before starting valuation fieldwork, it is important to have thought through what data will be required, and how they will be obtained. Typically, a valuation study will use various data collection techniques and information sources, including both primary and secondary data collection:
• Literature review: including a review of similar valuation studies carried out in other areas or countries, as well as of documents and reports that contain information on the wetland under study such as project eports, government statistics and records, scientific articles and publications.
• Expert consultation: including with technical experts (for example, sociologists, hydrologists, biologists and ecologists, civil engineers) as well as with the various stakeholders who are involved in managing and using the wetland (for example, government officials, NGOs, community leaders, local households, wetland user groups).
• ‘Traditional’ socio-economic information gathering techniques: such as questionnaires, interviews and statistical analysis.
• Participatory techniques: such as focus group interviews, Participatory Rural Appraisal (PRA) and Rapid Rural Appraisal (RRA) techniques.
Having identified the data sources and collection techniques, the next thing to do is to actually apply the selected valuation methods. A detailed description of each of the main valuation techniques is given below, which is primarily drawn from IUCN’s toolkit for valuing water-based ecosystem services (Emerton and Bos 2004).
Applying wetland valuation techniques (Stage 3)
Market price techniques:
Overview of the method:The simplest, most straightforward and commonly-used method for valuing any good or service is to look at its market price: how much it costs to buy, or what it is worth to sell. In a well-operating and competitive12 market these prices are determined by the relative demand for and supply of the good or service in question, reflect its true scarcity, and equate to its marginal value13.
In theory, market price techniques can be applied to any ecosystem good or service that can be freely bought or sold. They are particularly useful for valuing the resources and products that are harvested from water-dependent ecosystems, for example, timber, fuelwood, fish, or non-timber forest products.
Data collection and analysis requirements:There are three main steps involved in collecting and analysing the data required to use market price techniques to value ecosystem goods and services:• Find out the quantity of the good used, produced or exchanged;• Collect data on its market price;• Multiply price by quantity to determine its value.
12 A market is said to be competitive when there are a large number of buyers and sellers, there are no restrictions on market entry, buyers and sellers have no advantage over each other and everyone is generally informed about the price of goods.
13 Marginal value is the change in value resulting from one more unit produced or consumed
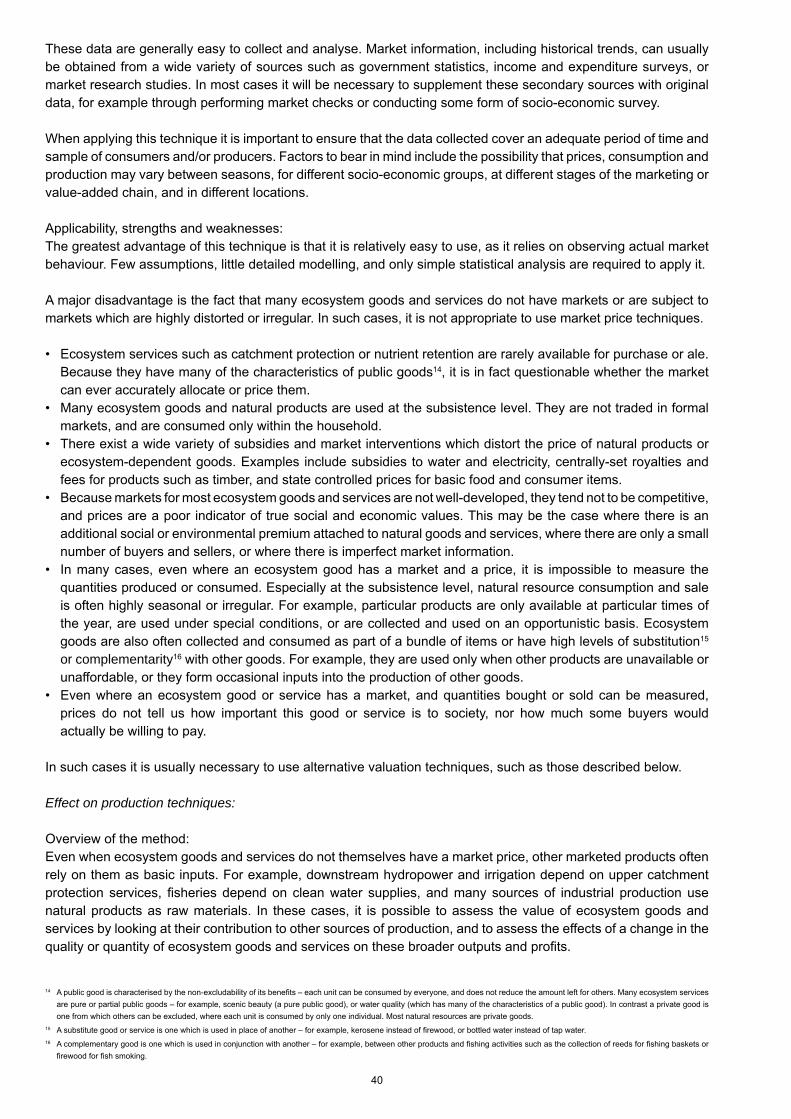
40
These data are generally easy to collect and analyse. Market information, including historical trends, can usually be obtained from a wide variety of sources such as government statistics, income and expenditure surveys, or market research studies. In most cases it will be necessary to supplement these secondary sources with original data, for example through performing market checks or conducting some form of socio-economic survey.
When applying this technique it is important to ensure that the data collected cover an adequate period of time and sample of consumers and/or producers. Factors to bear in mind include the possibility that prices, consumption and production may vary between seasons, for different socio-economic groups, at different stages of the marketing or value-added chain, and in different locations.
Applicability, strengths and weaknesses:The greatest advantage of this technique is that it is relatively easy to use, as it relies on observing actual market behaviour. Few assumptions, little detailed modelling, and only simple statistical analysis are required to apply it.
A major disadvantage is the fact that many ecosystem goods and services do not have markets or are subject to markets which are highly distorted or irregular. In such cases, it is not appropriate to use market price techniques.
• Ecosystem services such as catchment protection or nutrient retention are rarely available for purchase or ale. Because they have many of the characteristics of public goods14, it is in fact questionable whether the market can ever accurately allocate or price them.
• Many ecosystem goods and natural products are used at the subsistence level. They are not traded in formal markets, and are consumed only within the household.
• There exist a wide variety of subsidies and market interventions which distort the price of natural products or ecosystem-dependent goods. Examples include subsidies to water and electricity, centrally-set royalties and fees for products such as timber, and state controlled prices for basic food and consumer items.
• Because markets for most ecosystem goods and services are not well-developed, they tend not to be competitive, and prices are a poor indicator of true social and economic values. This may be the case where there is an additional social or environmental premium attached to natural goods and services, where there are only a small number of buyers and sellers, or where there is imperfect market information.
• In many cases, even where an ecosystem good has a market and a price, it is impossible to measure the quantities produced or consumed. Especially at the subsistence level, natural resource consumption and sale is often highly seasonal or irregular. For example, particular products are only available at particular times of the year, are used under special conditions, or are collected and used on an opportunistic basis. Ecosystem goods are also often collected and consumed as part of a bundle of items or have high levels of substitution15 or complementarity16 with other goods. For example, they are used only when other products are unavailable or unaffordable, or they form occasional inputs into the production of other goods.
• Even where an ecosystem good or service has a market, and quantities bought or sold can be measured, prices do not tell us how important this good or service is to society, nor how much some buyers would actually be willing to pay.
In such cases it is usually necessary to use alternative valuation techniques, such as those described below.
Effect on production techniques:
Overview of the method:Even when ecosystem goods and services do not themselves have a market price, other marketed products often rely on them as basic inputs. For example, downstream hydropower and irrigation depend on upper catchment protection services, fisheries depend on clean water supplies, and many sources of industrial production use natural products as raw materials. In these cases, it is possible to assess the value of ecosystem goods and services by looking at their contribution to other sources of production, and to assess the effects of a change in the quality or quantity of ecosystem goods and services on these broader outputs and profits.
14 A public good is characterised by the non-excludability of its benefits – each unit can be consumed by everyone, and does not reduce the amount left for others. Many ecosystem services are pure or partial public goods – for example, scenic beauty (a pure public good), or water quality (which has many of the characteristics of a public good). In contrast a private good is one from which others can be excluded, where each unit is consumed by only one individual. Most natural resources are private goods.
15 A substitute good or service is one which is used in place of another – for example, kerosene instead of firewood, or bottled water instead of tap water.16 A complementary good is one which is used in conjunction with another – for example, between other products and fishing activities such as the collection of reeds for fishing baskets or
firewood for fish smoking.
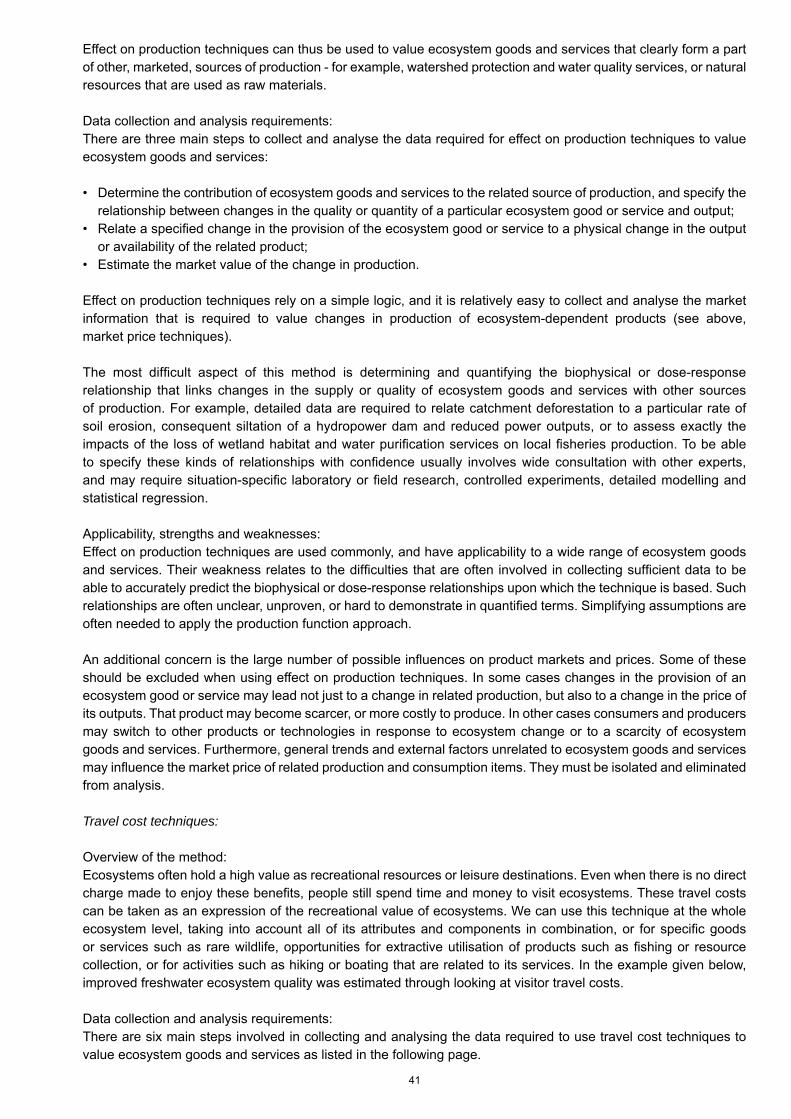
41
Effect on production techniques can thus be used to value ecosystem goods and services that clearly form a part of other, marketed, sources of production - for example, watershed protection and water quality services, or natural resources that are used as raw materials.
Data collection and analysis requirements:There are three main steps to collect and analyse the data required for effect on production techniques to value ecosystem goods and services:
• Determine the contribution of ecosystem goods and services to the related source of production, and specify the relationship between changes in the quality or quantity of a particular ecosystem good or service and output;
• Relate a specified change in the provision of the ecosystem good or service to a physical change in the output or availability of the related product;
• Estimate the market value of the change in production.
Effect on production techniques rely on a simple logic, and it is relatively easy to collect and analyse the market information that is required to value changes in production of ecosystem-dependent products (see above, market price techniques).
The most difficult aspect of this method is determining and quantifying the biophysical or dose-response relationship that links changes in the supply or quality of ecosystem goods and services with other sources of production. For example, detailed data are required to relate catchment deforestation to a particular rate of soil erosion, consequent siltation of a hydropower dam and reduced power outputs, or to assess exactly the impacts of the loss of wetland habitat and water purification services on local fisheries production. To be able to specify these kinds of relationships with confidence usually involves wide consultation with other experts, and may require situation-specific laboratory or field research, controlled experiments, detailed modelling and statistical regression.
Applicability, strengths and weaknesses:Effect on production techniques are used commonly, and have applicability to a wide range of ecosystem goods and services. Their weakness relates to the difficulties that are often involved in collecting sufficient data to be able to accurately predict the biophysical or dose-response relationships upon which the technique is based. Such relationships are often unclear, unproven, or hard to demonstrate in quantified terms. Simplifying assumptions are often needed to apply the production function approach.
An additional concern is the large number of possible influences on product markets and prices. Some of these should be excluded when using effect on production techniques. In some cases changes in the provision of an ecosystem good or service may lead not just to a change in related production, but also to a change in the price of its outputs. That product may become scarcer, or more costly to produce. In other cases consumers and producers may switch to other products or technologies in response to ecosystem change or to a scarcity of ecosystem goods and services. Furthermore, general trends and external factors unrelated to ecosystem goods and services may influence the market price of related production and consumption items. They must be isolated and eliminated from analysis.
Travel cost techniques:
Overview of the method:Ecosystems often hold a high value as recreational resources or leisure destinations. Even when there is no direct charge made to enjoy these benefits, people still spend time and money to visit ecosystems. These travel costs can be taken as an expression of the recreational value of ecosystems. We can use this technique at the whole ecosystem level, taking into account all of its attributes and components in combination, or for specific goods or services such as rare wildlife, opportunities for extractive utilisation of products such as fishing or resource collection, or for activities such as hiking or boating that are related to its services. In the example given below, improved freshwater ecosystem quality was estimated through looking at visitor travel costs.
Data collection and analysis requirements:There are six main steps involved in collecting and analysing the data required to use travel cost techniques to value ecosystem goods and services as listed in the following page.
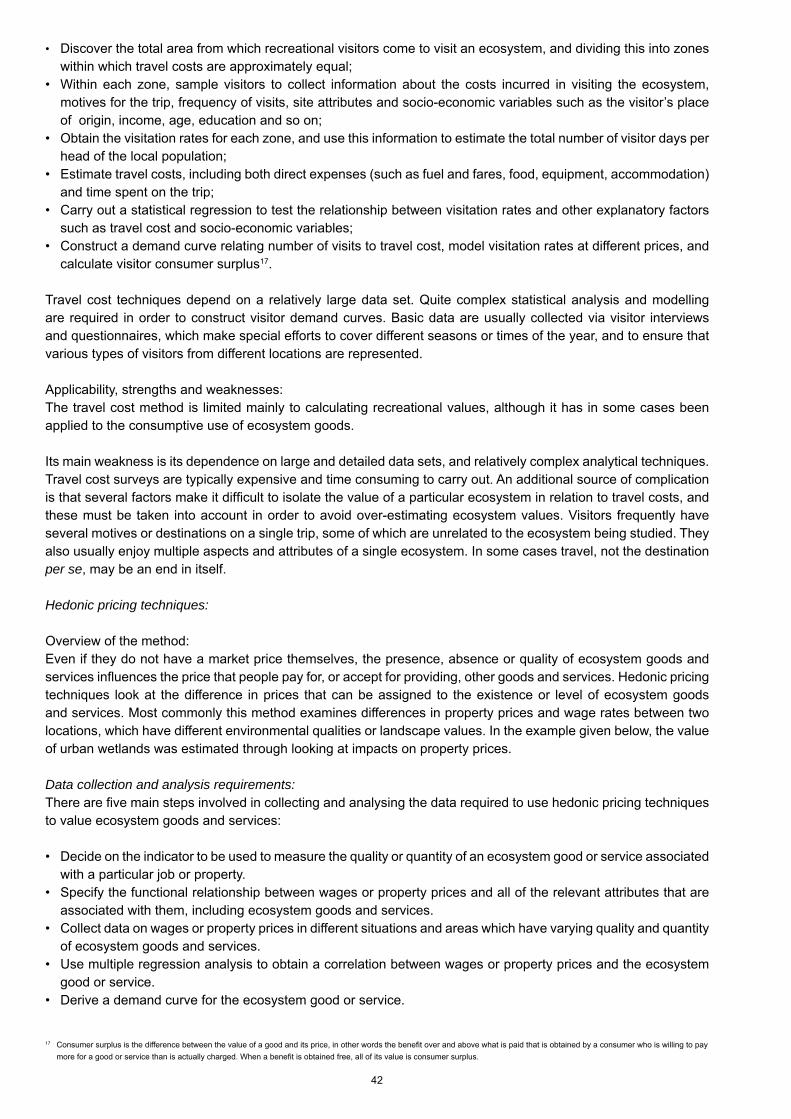
42
• Discover the total area from which recreational visitors come to visit an ecosystem, and dividing this into zones within which travel costs are approximately equal;
• Within each zone, sample visitors to collect information about the costs incurred in visiting the ecosystem, motives for the trip, frequency of visits, site attributes and socio-economic variables such as the visitor’s place of origin, income, age, education and so on;
• Obtain the visitation rates for each zone, and use this information to estimate the total number of visitor days per head of the local population;
• Estimate travel costs, including both direct expenses (such as fuel and fares, food, equipment, accommodation) and time spent on the trip;
• Carry out a statistical regression to test the relationship between visitation rates and other explanatory factors such as travel cost and socio-economic variables;
• Construct a demand curve relating number of visits to travel cost, model visitation rates at different prices, and calculate visitor consumer surplus17.
Travel cost techniques depend on a relatively large data set. Quite complex statistical analysis and modelling are required in order to construct visitor demand curves. Basic data are usually collected via visitor interviews and questionnaires, which make special efforts to cover different seasons or times of the year, and to ensure that various types of visitors from different locations are represented.
Applicability, strengths and weaknesses:The travel cost method is limited mainly to calculating recreational values, although it has in some cases been applied to the consumptive use of ecosystem goods.
Its main weakness is its dependence on large and detailed data sets, and relatively complex analytical techniques. Travel cost surveys are typically expensive and time consuming to carry out. An additional source of complication is that several factors make it difficult to isolate the value of a particular ecosystem in relation to travel costs, and these must be taken into account in order to avoid over-estimating ecosystem values. Visitors frequently have several motives or destinations on a single trip, some of which are unrelated to the ecosystem being studied. They also usually enjoy multiple aspects and attributes of a single ecosystem. In some cases travel, not the destination per se, may be an end in itself.
Hedonic pricing techniques:
Overview of the method:Even if they do not have a market price themselves, the presence, absence or quality of ecosystem goods and services influences the price that people pay for, or accept for providing, other goods and services. Hedonic pricing techniques look at the difference in prices that can be assigned to the existence or level of ecosystem goods and services. Most commonly this method examines differences in property prices and wage rates between two locations, which have different environmental qualities or landscape values. In the example given below, the value of urban wetlands was estimated through looking at impacts on property prices.
Data collection and analysis requirements:There are five main steps involved in collecting and analysing the data required to use hedonic pricing techniques to value ecosystem goods and services:
• Decide on the indicator to be used to measure the quality or quantity of an ecosystem good or service associated with a particular job or property.
• Specify the functional relationship between wages or property prices and all of the relevant attributes that are associated with them, including ecosystem goods and services.
• Collect data on wages or property prices in different situations and areas which have varying quality and quantity of ecosystem goods and services.
• Use multiple regression analysis to obtain a correlation between wages or property prices and the ecosystem good or service.
• Derive a demand curve for the ecosystem good or service.
17 Consumer surplus is the difference between the value of a good and its price, in other words the benefit over and above what is paid that is obtained by a consumer who is willing to pay more for a good or service than is actually charged. When a benefit is obtained free, all of its value is consumer surplus.
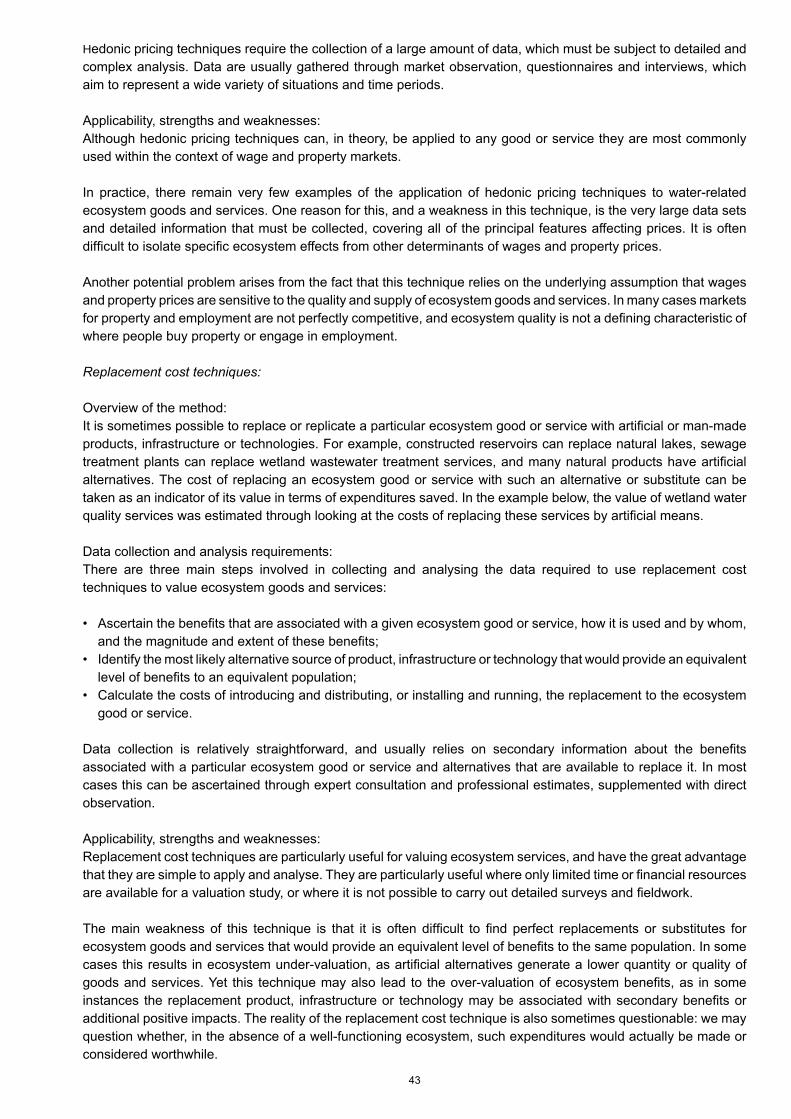
43
Hedonic pricing techniques require the collection of a large amount of data, which must be subject to detailed and complex analysis. Data are usually gathered through market observation, questionnaires and interviews, which aim to represent a wide variety of situations and time periods.
Applicability, strengths and weaknesses:Although hedonic pricing techniques can, in theory, be applied to any good or service they are most commonly used within the context of wage and property markets.
In practice, there remain very few examples of the application of hedonic pricing techniques to water-related ecosystem goods and services. One reason for this, and a weakness in this technique, is the very large data sets and detailed information that must be collected, covering all of the principal features affecting prices. It is often difficult to isolate specific ecosystem effects from other determinants of wages and property prices.
Another potential problem arises from the fact that this technique relies on the underlying assumption that wages and property prices are sensitive to the quality and supply of ecosystem goods and services. In many cases markets for property and employment are not perfectly competitive, and ecosystem quality is not a defining characteristic of where people buy property or engage in employment.
Replacement cost techniques:
Overview of the method:It is sometimes possible to replace or replicate a particular ecosystem good or service with artificial or man-made products, infrastructure or technologies. For example, constructed reservoirs can replace natural lakes, sewage treatment plants can replace wetland wastewater treatment services, and many natural products have artificial alternatives. The cost of replacing an ecosystem good or service with such an alternative or substitute can be taken as an indicator of its value in terms of expenditures saved. In the example below, the value of wetland water quality services was estimated through looking at the costs of replacing these services by artificial means.
Data collection and analysis requirements:There are three main steps involved in collecting and analysing the data required to use replacement cost techniques to value ecosystem goods and services:
• Ascertain the benefits that are associated with a given ecosystem good or service, how it is used and by whom, and the magnitude and extent of these benefits;
• Identify the most likely alternative source of product, infrastructure or technology that would provide an equivalent level of benefits to an equivalent population;
• Calculate the costs of introducing and distributing, or installing and running, the replacement to the ecosystem good or service.
Data collection is relatively straightforward, and usually relies on secondary information about the benefits associated with a particular ecosystem good or service and alternatives that are available to replace it. In most cases this can be ascertained through expert consultation and professional estimates, supplemented with direct observation.
Applicability, strengths and weaknesses:Replacement cost techniques are particularly useful for valuing ecosystem services, and have the great advantage that they are simple to apply and analyse. They are particularly useful where only limited time or financial resources are available for a valuation study, or where it is not possible to carry out detailed surveys and fieldwork.
The main weakness of this technique is that it is often difficult to find perfect replacements or substitutes for ecosystem goods and services that would provide an equivalent level of benefits to the same population. In some cases this results in ecosystem under-valuation, as artificial alternatives generate a lower quantity or quality of goods and services. Yet this technique may also lead to the over-valuation of ecosystem benefits, as in some instances the replacement product, infrastructure or technology may be associated with secondary benefits or additional positive impacts. The reality of the replacement cost technique is also sometimes questionable: we may question whether, in the absence of a well-functioning ecosystem, such expenditures would actually be made or considered worthwhile.
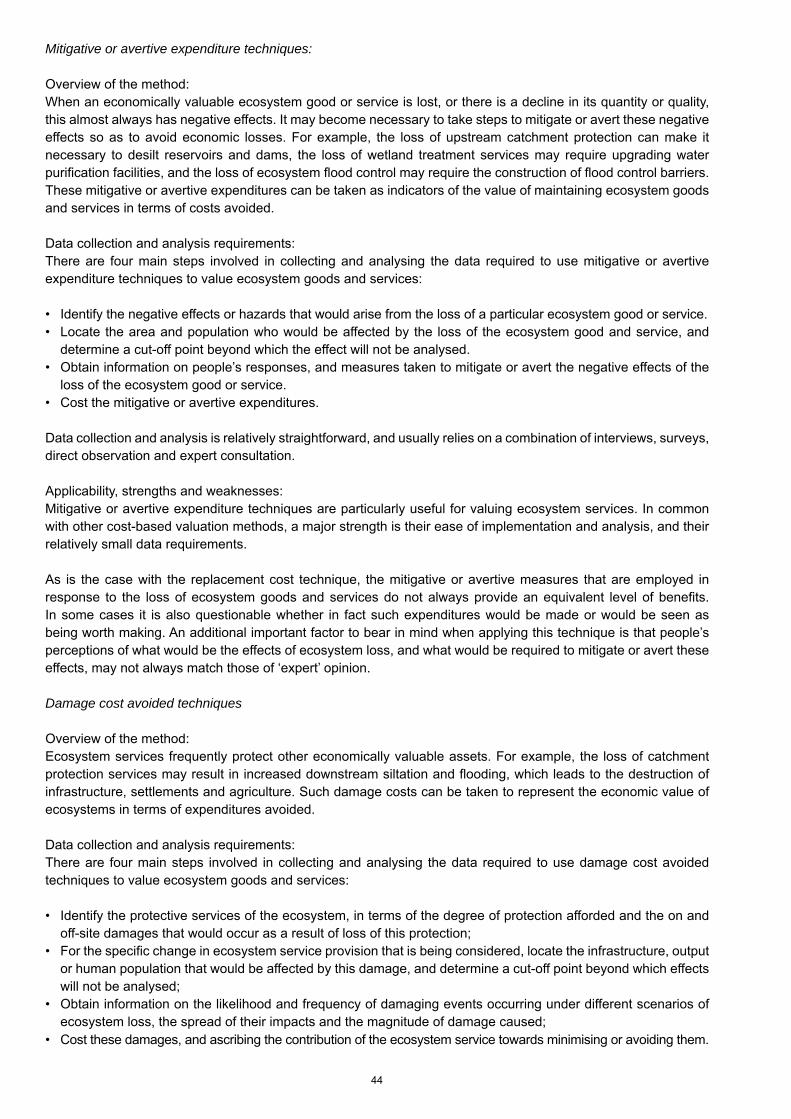
44
Mitigative or avertive expenditure techniques:
Overview of the method:When an economically valuable ecosystem good or service is lost, or there is a decline in its quantity or quality, this almost always has negative effects. It may become necessary to take steps to mitigate or avert these negative effects so as to avoid economic losses. For example, the loss of upstream catchment protection can make it necessary to desilt reservoirs and dams, the loss of wetland treatment services may require upgrading water purification facilities, and the loss of ecosystem flood control may require the construction of flood control barriers. These mitigative or avertive expenditures can be taken as indicators of the value of maintaining ecosystem goods and services in terms of costs avoided.
Data collection and analysis requirements:There are four main steps involved in collecting and analysing the data required to use mitigative or avertive expenditure techniques to value ecosystem goods and services:
• Identify the negative effects or hazards that would arise from the loss of a particular ecosystem good or service.• Locate the area and population who would be affected by the loss of the ecosystem good and service, and
determine a cut-off point beyond which the effect will not be analysed.• Obtain information on people’s responses, and measures taken to mitigate or avert the negative effects of the
loss of the ecosystem good or service.• Cost the mitigative or avertive expenditures.
Data collection and analysis is relatively straightforward, and usually relies on a combination of interviews, surveys, direct observation and expert consultation.
Applicability, strengths and weaknesses:Mitigative or avertive expenditure techniques are particularly useful for valuing ecosystem services. In common with other cost-based valuation methods, a major strength is their ease of implementation and analysis, and their relatively small data requirements.
As is the case with the replacement cost technique, the mitigative or avertive measures that are employed in response to the loss of ecosystem goods and services do not always provide an equivalent level of benefits. In some cases it is also questionable whether in fact such expenditures would be made or would be seen as being worth making. An additional important factor to bear in mind when applying this technique is that people’s perceptions of what would be the effects of ecosystem loss, and what would be required to mitigate or avert these effects, may not always match those of ‘expert’ opinion.
Damage cost avoided techniques
Overview of the method:Ecosystem services frequently protect other economically valuable assets. For example, the loss of catchment protection services may result in increased downstream siltation and flooding, which leads to the destruction of infrastructure, settlements and agriculture. Such damage costs can be taken to represent the economic value of ecosystems in terms of expenditures avoided.
Data collection and analysis requirements:There are four main steps involved in collecting and analysing the data required to use damage cost avoided techniques to value ecosystem goods and services:
• Identify the protective services of the ecosystem, in terms of the degree of protection afforded and the on and off-site damages that would occur as a result of loss of this protection;
• For the specific change in ecosystem service provision that is being considered, locate the infrastructure, output or human population that would be affected by this damage, and determine a cut-off point beyond which effects will not be analysed;
• Obtain information on the likelihood and frequency of damaging events occurring under different scenarios of ecosystem loss, the spread of their impacts and the magnitude of damage caused;
• Cost these damages, and ascribing the contribution of the ecosystem service towards minimising or avoiding them.
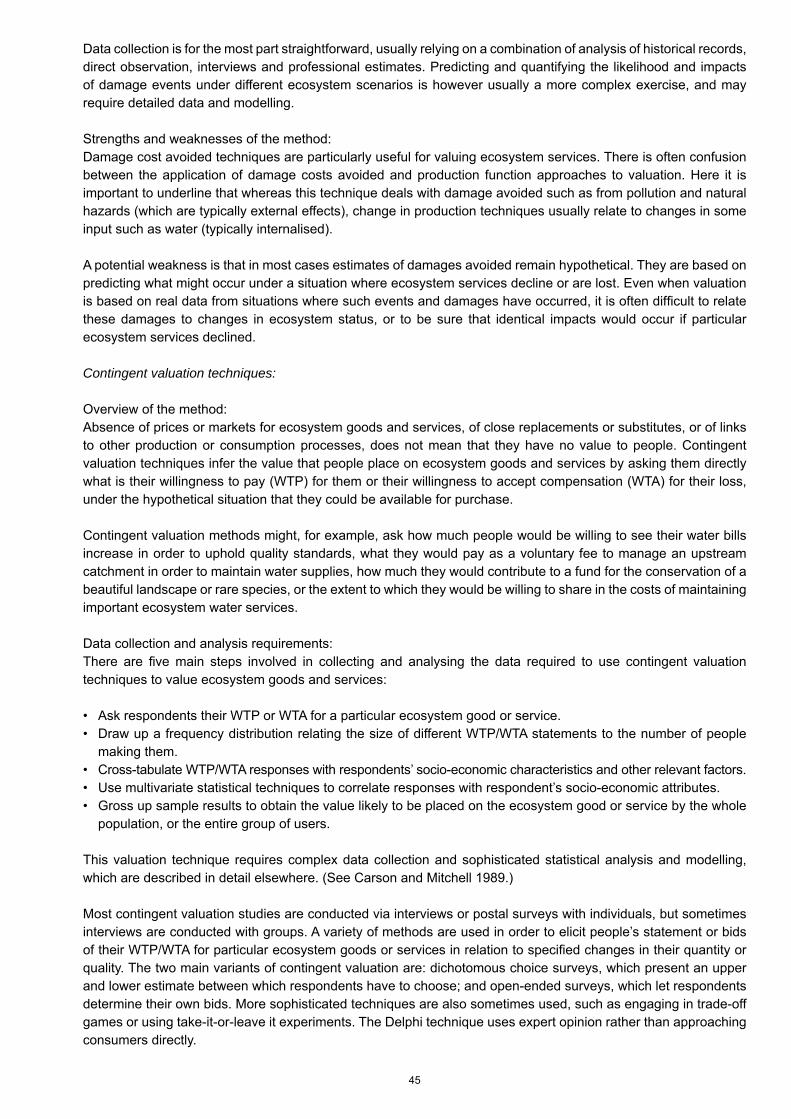
45
Data collection is for the most part straightforward, usually relying on a combination of analysis of historical records, direct observation, interviews and professional estimates. Predicting and quantifying the likelihood and impacts of damage events under different ecosystem scenarios is however usually a more complex exercise, and may require detailed data and modelling.
Strengths and weaknesses of the method:Damage cost avoided techniques are particularly useful for valuing ecosystem services. There is often confusion between the application of damage costs avoided and production function approaches to valuation. Here it is important to underline that whereas this technique deals with damage avoided such as from pollution and natural hazards (which are typically external effects), change in production techniques usually relate to changes in some input such as water (typically internalised).
A potential weakness is that in most cases estimates of damages avoided remain hypothetical. They are based on predicting what might occur under a situation where ecosystem services decline or are lost. Even when valuation is based on real data from situations where such events and damages have occurred, it is often difficult to relate these damages to changes in ecosystem status, or to be sure that identical impacts would occur if particular ecosystem services declined.
Contingent valuation techniques:
Overview of the method:Absence of prices or markets for ecosystem goods and services, of close replacements or substitutes, or of links to other production or consumption processes, does not mean that they have no value to people. Contingent valuation techniques infer the value that people place on ecosystem goods and services by asking them directly what is their willingness to pay (WTP) for them or their willingness to accept compensation (WTA) for their loss, under the hypothetical situation that they could be available for purchase.
Contingent valuation methods might, for example, ask how much people would be willing to see their water bills increase in order to uphold quality standards, what they would pay as a voluntary fee to manage an upstream catchment in order to maintain water supplies, how much they would contribute to a fund for the conservation of a beautiful landscape or rare species, or the extent to which they would be willing to share in the costs of maintaining important ecosystem water services.
Data collection and analysis requirements:There are five main steps involved in collecting and analysing the data required to use contingent valuation techniques to value ecosystem goods and services:
• Ask respondents their WTP or WTA for a particular ecosystem good or service.• Draw up a frequency distribution relating the size of different WTP/WTA statements to the number of people
making them.• Cross-tabulate WTP/WTA responses with respondents’ socio-economic characteristics and other relevant factors.• Use multivariate statistical techniques to correlate responses with respondent’s socio-economic attributes.• Gross up sample results to obtain the value likely to be placed on the ecosystem good or service by the whole
population, or the entire group of users.
This valuation technique requires complex data collection and sophisticated statistical analysis and modelling, which are described in detail elsewhere. (See Carson and Mitchell 1989.)
Most contingent valuation studies are conducted via interviews or postal surveys with individuals, but sometimes interviews are conducted with groups. A variety of methods are used in order to elicit people’s statement or bids of their WTP/WTA for particular ecosystem goods or services in relation to specified changes in their quantity or quality. The two main variants of contingent valuation are: dichotomous choice surveys, which present an upper and lower estimate between which respondents have to choose; and open-ended surveys, which let respondents determine their own bids. More sophisticated techniques are also sometimes used, such as engaging in trade-off games or using take-it-or-leave it experiments. The Delphi technique uses expert opinion rather than approaching consumers directly.
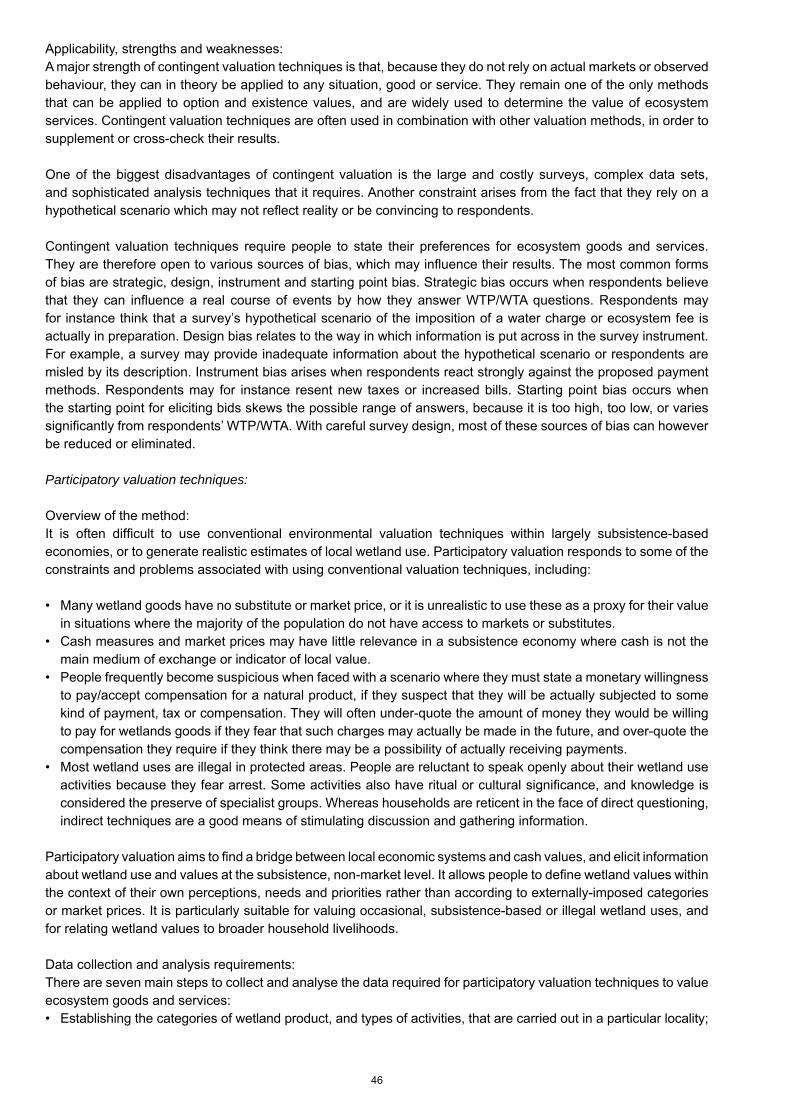
46
Applicability, strengths and weaknesses:A major strength of contingent valuation techniques is that, because they do not rely on actual markets or observed behaviour, they can in theory be applied to any situation, good or service. They remain one of the only methods that can be applied to option and existence values, and are widely used to determine the value of ecosystem services. Contingent valuation techniques are often used in combination with other valuation methods, in order to supplement or cross-check their results.
One of the biggest disadvantages of contingent valuation is the large and costly surveys, complex data sets, and sophisticated analysis techniques that it requires. Another constraint arises from the fact that they rely on a hypothetical scenario which may not reflect reality or be convincing to respondents.
Contingent valuation techniques require people to state their preferences for ecosystem goods and services. They are therefore open to various sources of bias, which may influence their results. The most common forms of bias are strategic, design, instrument and starting point bias. Strategic bias occurs when respondents believe that they can influence a real course of events by how they answer WTP/WTA questions. Respondents may for instance think that a survey’s hypothetical scenario of the imposition of a water charge or ecosystem fee is actually in preparation. Design bias relates to the way in which information is put across in the survey instrument. For example, a survey may provide inadequate information about the hypothetical scenario or respondents are misled by its description. Instrument bias arises when respondents react strongly against the proposed payment methods. Respondents may for instance resent new taxes or increased bills. Starting point bias occurs when the starting point for eliciting bids skews the possible range of answers, because it is too high, too low, or varies significantly from respondents’ WTP/WTA. With careful survey design, most of these sources of bias can however be reduced or eliminated.
Participatory valuation techniques:
Overview of the method:It is often difficult to use conventional environmental valuation techniques within largely subsistence-based economies, or to generate realistic estimates of local wetland use. Participatory valuation responds to some of the constraints and problems associated with using conventional valuation techniques, including:
• Many wetland goods have no substitute or market price, or it is unrealistic to use these as a proxy for their value in situations where the majority of the population do not have access to markets or substitutes.
• Cash measures and market prices may have little relevance in a subsistence economy where cash is not the main medium of exchange or indicator of local value.
• People frequently become suspicious when faced with a scenario where they must state a monetary willingness to pay/accept compensation for a natural product, if they suspect that they will be actually subjected to some kind of payment, tax or compensation. They will often under-quote the amount of money they would be willing to pay for wetlands goods if they fear that such charges may actually be made in the future, and over-quote the compensation they require if they think there may be a possibility of actually receiving payments.
• Most wetland uses are illegal in protected areas. People are reluctant to speak openly about their wetland use activities because they fear arrest. Some activities also have ritual or cultural significance, and knowledge is considered the preserve of specialist groups. Whereas households are reticent in the face of direct questioning, indirect techniques are a good means of stimulating discussion and gathering information.
Participatory valuation aims to find a bridge between local economic systems and cash values, and elicit information about wetland use and values at the subsistence, non-market level. It allows people to define wetland values within the context of their own perceptions, needs and priorities rather than according to externally-imposed categories or market prices. It is particularly suitable for valuing occasional, subsistence-based or illegal wetland uses, and for relating wetland values to broader household livelihoods.
Data collection and analysis requirements:There are seven main steps to collect and analyse the data required for participatory valuation techniques to value ecosystem goods and services:• Establishing the categories of wetland product, and types of activities, that are carried out in a particular locality;
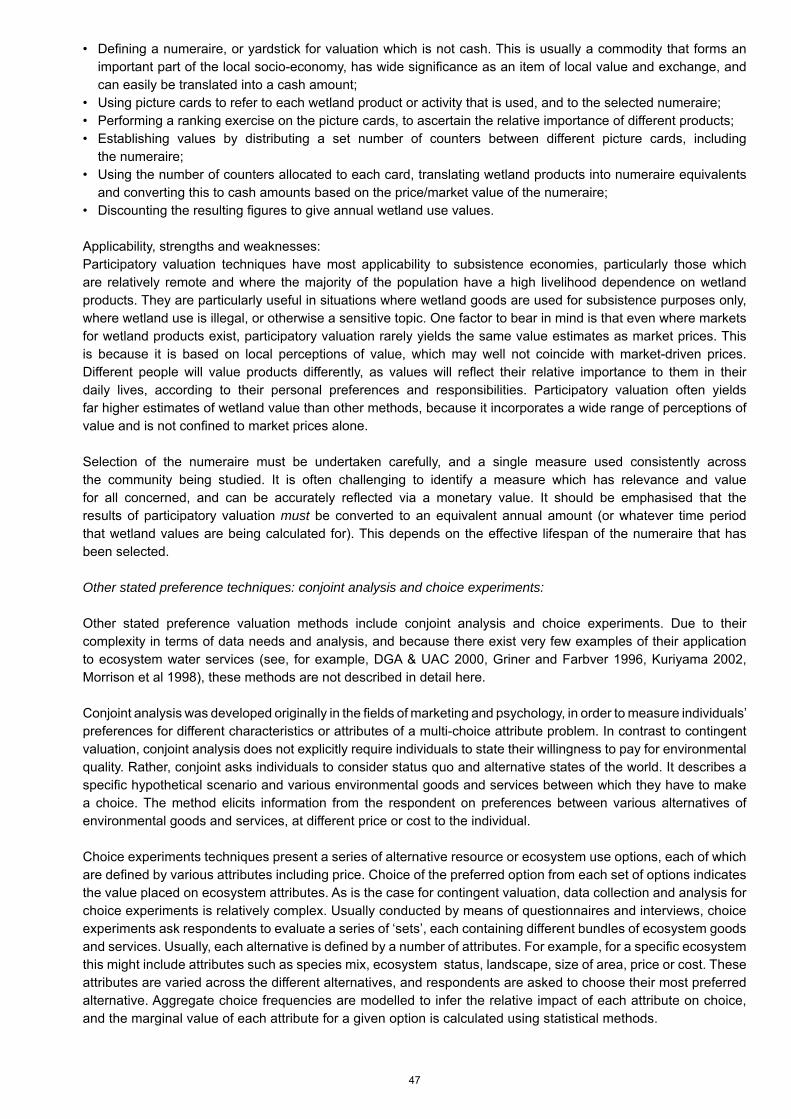
47
• Defining a numeraire, or yardstick for valuation which is not cash. This is usually a commodity that forms an important part of the local socio-economy, has wide significance as an item of local value and exchange, and can easily be translated into a cash amount;
• Using picture cards to refer to each wetland product or activity that is used, and to the selected numeraire;• Performing a ranking exercise on the picture cards, to ascertain the relative importance of different products;• Establishing values by distributing a set number of counters between different picture cards, including
the numeraire;• Using the number of counters allocated to each card, translating wetland products into numeraire equivalents
and converting this to cash amounts based on the price/market value of the numeraire;• Discounting the resulting figures to give annual wetland use values.
Applicability, strengths and weaknesses:Participatory valuation techniques have most applicability to subsistence economies, particularly those which are relatively remote and where the majority of the population have a high livelihood dependence on wetland products. They are particularly useful in situations where wetland goods are used for subsistence purposes only, where wetland use is illegal, or otherwise a sensitive topic. One factor to bear in mind is that even where markets for wetland products exist, participatory valuation rarely yields the same value estimates as market prices. This is because it is based on local perceptions of value, which may well not coincide with market-driven prices. Different people will value products differently, as values will reflect their relative importance to them in their daily lives, according to their personal preferences and responsibilities. Participatory valuation often yieldsfar higher estimates of wetland value than other methods, because it incorporates a wide range of perceptions of value and is not confined to market prices alone.
Selection of the numeraire must be undertaken carefully, and a single measure used consistently across the community being studied. It is often challenging to identify a measure which has relevance and value for all concerned, and can be accurately reflected via a monetary value. It should be emphasised that the results of participatory valuation must be converted to an equivalent annual amount (or whatever time period that wetland values are being calculated for). This depends on the effective lifespan of the numeraire that has been selected.
Other stated preference techniques: conjoint analysis and choice experiments:
Other stated preference valuation methods include conjoint analysis and choice experiments. Due to their complexity in terms of data needs and analysis, and because there exist very few examples of their application to ecosystem water services (see, for example, DGA & UAC 2000, Griner and Farbver 1996, Kuriyama 2002, Morrison et al 1998), these methods are not described in detail here.
Conjoint analysis was developed originally in the fields of marketing and psychology, in order to measure individuals’ preferences for different characteristics or attributes of a multi-choice attribute problem. In contrast to contingent valuation, conjoint analysis does not explicitly require individuals to state their willingness to pay for environmental quality. Rather, conjoint asks individuals to consider status quo and alternative states of the world. It describes a specific hypothetical scenario and various environmental goods and services between which they have to make a choice. The method elicits information from the respondent on preferences between various alternatives of environmental goods and services, at different price or cost to the individual.
Choice experiments techniques present a series of alternative resource or ecosystem use options, each of which are defined by various attributes including price. Choice of the preferred option from each set of options indicates the value placed on ecosystem attributes. As is the case for contingent valuation, data collection and analysis for choice experiments is relatively complex. Usually conducted by means of questionnaires and interviews, choice experiments ask respondents to evaluate a series of ‘sets’, each containing different bundles of ecosystem goods and services. Usually, each alternative is defined by a number of attributes. For example, for a specific ecosystem this might include attributes such as species mix, ecosystem status, landscape, size of area, price or cost. These attributes are varied across the different alternatives, and respondents are asked to choose their most preferred alternative. Aggregate choice frequencies are modelled to infer the relative impact of each attribute on choice, and the marginal value of each attribute for a given option is calculated using statistical methods.
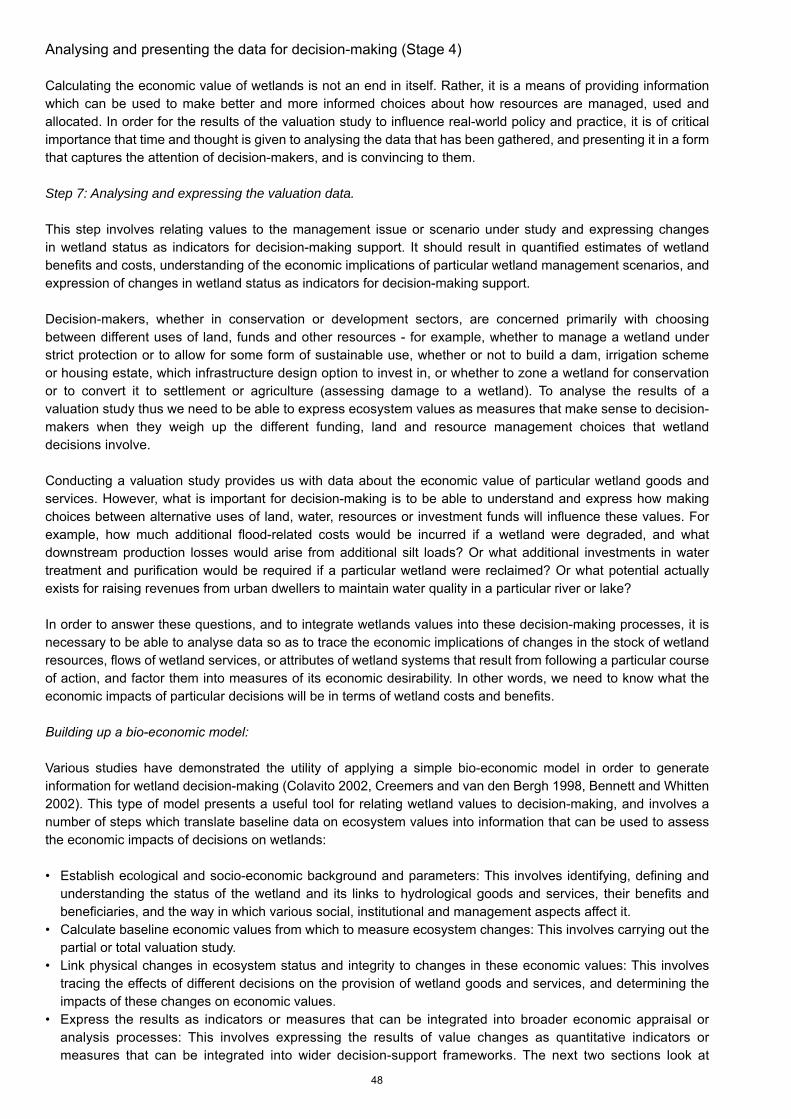
48
Analysing and presenting the data for decision-making (Stage 4)
Calculating the economic value of wetlands is not an end in itself. Rather, it is a means of providing information which can be used to make better and more informed choices about how resources are managed, used and allocated. In order for the results of the valuation study to influence real-world policy and practice, it is of critical importance that time and thought is given to analysing the data that has been gathered, and presenting it in a form that captures the attention of decision-makers, and is convincing to them.
Step 7: Analysing and expressing the valuation data.
This step involves relating values to the management issue or scenario under study and expressing changes in wetland status as indicators for decision-making support. It should result in quantified estimates of wetland benefits and costs, understanding of the economic implications of particular wetland management scenarios, and expression of changes in wetland status as indicators for decision-making support.
Decision-makers, whether in conservation or development sectors, are concerned primarily with choosing between different uses of land, funds and other resources - for example, whether to manage a wetland under strict protection or to allow for some form of sustainable use, whether or not to build a dam, irrigation scheme or housing estate, which infrastructure design option to invest in, or whether to zone a wetland for conservation or to convert it to settlement or agriculture (assessing damage to a wetland). To analyse the results of a valuation study thus we need to be able to express ecosystem values as measures that make sense to decision- makers when they weigh up the different funding, land and resource management choices that wetland decisions involve.
Conducting a valuation study provides us with data about the economic value of particular wetland goods and services. However, what is important for decision-making is to be able to understand and express how making choices between alternative uses of land, water, resources or investment funds will influence these values. For example, how much additional flood-related costs would be incurred if a wetland were degraded, and what downstream production losses would arise from additional silt loads? Or what additional investments in water treatment and purification would be required if a particular wetland were reclaimed? Or what potential actually exists for raising revenues from urban dwellers to maintain water quality in a particular river or lake?
In order to answer these questions, and to integrate wetlands values into these decision-making processes, it is necessary to be able to analyse data so as to trace the economic implications of changes in the stock of wetland resources, flows of wetland services, or attributes of wetland systems that result from following a particular course of action, and factor them into measures of its economic desirability. In other words, we need to know what the economic impacts of particular decisions will be in terms of wetland costs and benefits.
Building up a bio-economic model:
Various studies have demonstrated the utility of applying a simple bio-economic model in order to generate information for wetland decision-making (Colavito 2002, Creemers and van den Bergh 1998, Bennett and Whitten 2002). This type of model presents a useful tool for relating wetland values to decision-making, and involves a number of steps which translate baseline data on ecosystem values into information that can be used to assess the economic impacts of decisions on wetlands:
• Establish ecological and socio-economic background and parameters: This involves identifying, defining and understanding the status of the wetland and its links to hydrological goods and services, their benefits and beneficiaries, and the way in which various social, institutional and management aspects affect it.
• Calculate baseline economic values from which to measure ecosystem changes: This involves carrying out the partial or total valuation study.
• Link physical changes in ecosystem status and integrity to changes in these economic values: This involves tracing the effects of different decisions on the provision of wetland goods and services, and determining the impacts of these changes on economic values.
• Express the results as indicators or measures that can be integrated into broader economic appraisal or analysis processes: This involves expressing the results of value changes as quantitative indicators or measures that can be integrated into wider decision-support frameworks. The next two sections look at
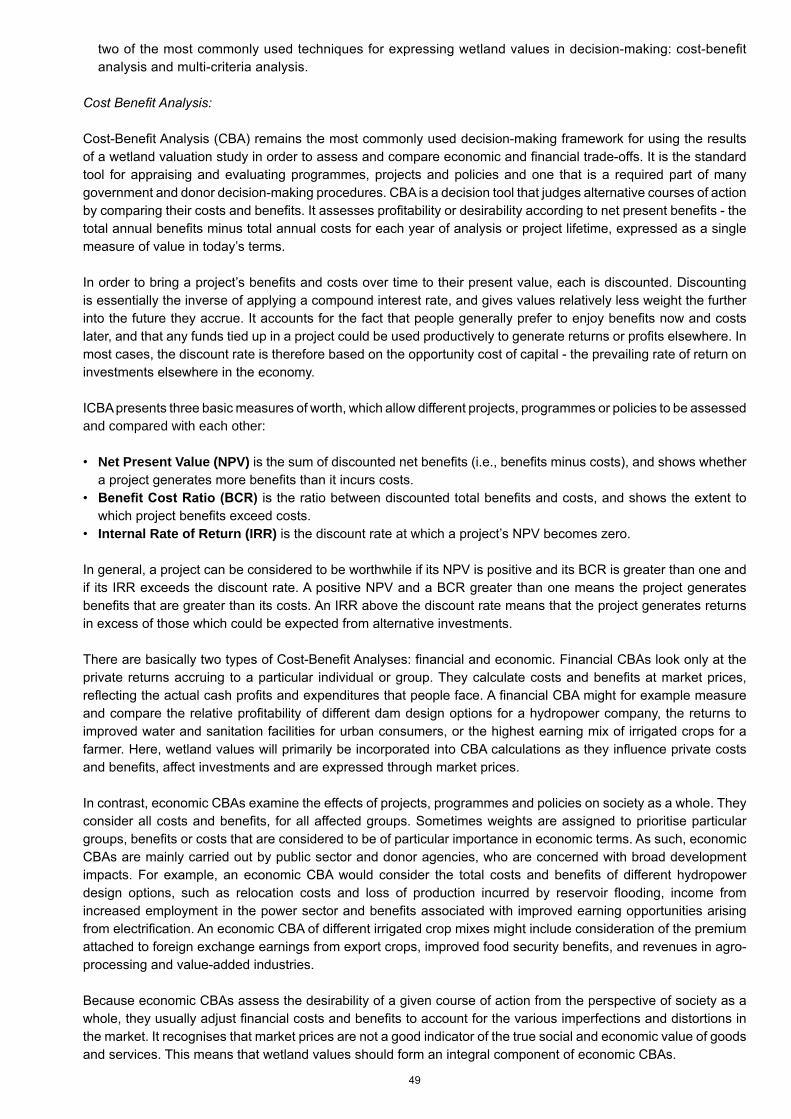
49
two of the most commonly used techniques for expressing wetland values in decision-making: cost-benefit analysis and multi-criteria analysis.
Cost Benefit Analysis:
Cost-Benefit Analysis (CBA) remains the most commonly used decision-making framework for using the results of a wetland valuation study in order to assess and compare economic and financial trade-offs. It is the standard tool for appraising and evaluating programmes, projects and policies and one that is a required part of many government and donor decision-making procedures. CBA is a decision tool that judges alternative courses of action by comparing their costs and benefits. It assesses profitability or desirability according to net present benefits - the total annual benefits minus total annual costs for each year of analysis or project lifetime, expressed as a single measure of value in today’s terms.
In order to bring a project’s benefits and costs over time to their present value, each is discounted. Discounting is essentially the inverse of applying a compound interest rate, and gives values relatively less weight the further into the future they accrue. It accounts for the fact that people generally prefer to enjoy benefits now and costs later, and that any funds tied up in a project could be used productively to generate returns or profits elsewhere. In most cases, the discount rate is therefore based on the opportunity cost of capital - the prevailing rate of return on investments elsewhere in the economy.
ICBA presents three basic measures of worth, which allow different projects, programmes or policies to be assessed and compared with each other:
• Net Present Value (NPV) is the sum of discounted net benefits (i.e., benefits minus costs), and shows whether a project generates more benefits than it incurs costs.
• Benefit Cost Ratio (BCR) is the ratio between discounted total benefits and costs, and shows the extent to which project benefits exceed costs.
• Internal Rate of Return (IRR) is the discount rate at which a project’s NPV becomes zero.
In general, a project can be considered to be worthwhile if its NPV is positive and its BCR is greater than one and if its IRR exceeds the discount rate. A positive NPV and a BCR greater than one means the project generates benefits that are greater than its costs. An IRR above the discount rate means that the project generates returns in excess of those which could be expected from alternative investments.
There are basically two types of Cost-Benefit Analyses: financial and economic. Financial CBAs look only at the private returns accruing to a particular individual or group. They calculate costs and benefits at market prices, reflecting the actual cash profits and expenditures that people face. A financial CBA might for example measure and compare the relative profitability of different dam design options for a hydropower company, the returns to improved water and sanitation facilities for urban consumers, or the highest earning mix of irrigated crops for a farmer. Here, wetland values will primarily be incorporated into CBA calculations as they influence private costs and benefits, affect investments and are expressed through market prices.
In contrast, economic CBAs examine the effects of projects, programmes and policies on society as a whole. They consider all costs and benefits, for all affected groups. Sometimes weights are assigned to prioritise particular groups, benefits or costs that are considered to be of particular importance in economic terms. As such, economic CBAs are mainly carried out by public sector and donor agencies, who are concerned with broad development impacts. For example, an economic CBA would consider the total costs and benefits of different hydropower design options, such as relocation costs and loss of production incurred by reservoir flooding, income from increased employment in the power sector and benefits associated with improved earning opportunities arising from electrification. An economic CBA of different irrigated crop mixes might include consideration of the premium attached to foreign exchange earnings from export crops, improved food security benefits, and revenues in agro-processing and value-added industries.
Because economic CBAs assess the desirability of a given course of action from the perspective of society as a whole, they usually adjust financial costs and benefits to account for the various imperfections and distortions in the market. It recognises that market prices are not a good indicator of the true social and economic value of goods and services. This means that wetland values should form an integral component of economic CBAs.
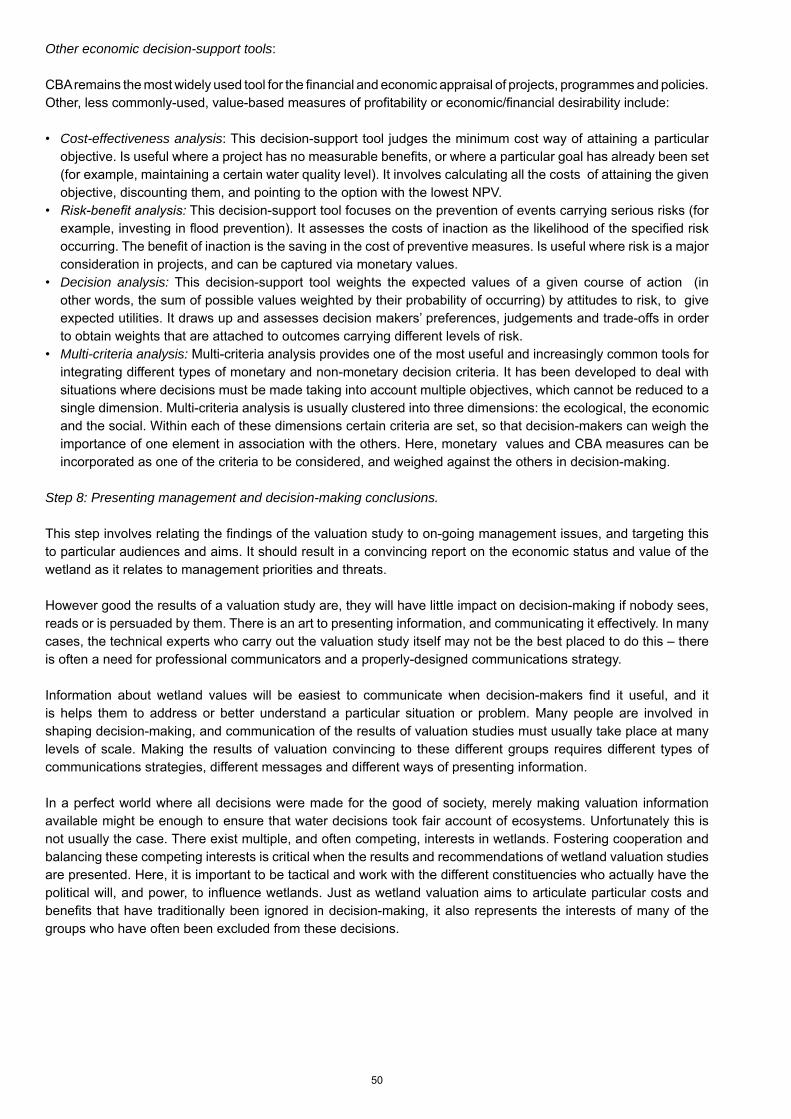
50
Other economic decision-support tools:
CBA remains the most widely used tool for the financial and economic appraisal of projects, programmes and policies. Other, less commonly-used, value-based measures of profitability or economic/financial desirability include:
• Cost-effectiveness analysis: This decision-support tool judges the minimum cost way of attaining a particular objective. Is useful where a project has no measurable benefits, or where a particular goal has already been set (for example, maintaining a certain water quality level). It involves calculating all the costs of attaining the given objective, discounting them, and pointing to the option with the lowest NPV.
• Risk-benefit analysis: This decision-support tool focuses on the prevention of events carrying serious risks (for example, investing in flood prevention). It assesses the costs of inaction as the likelihood of the specified risk occurring. The benefit of inaction is the saving in the cost of preventive measures. Is useful where risk is a major consideration in projects, and can be captured via monetary values.
• Decision analysis: This decision-support tool weights the expected values of a given course of action (in other words, the sum of possible values weighted by their probability of occurring) by attitudes to risk, to give expected utilities. It draws up and assesses decision makers’ preferences, judgements and trade-offs in order to obtain weights that are attached to outcomes carrying different levels of risk.
• Multi-criteria analysis: Multi-criteria analysis provides one of the most useful and increasingly common tools for integrating different types of monetary and non-monetary decision criteria. It has been developed to deal with situations where decisions must be made taking into account multiple objectives, which cannot be reduced to a single dimension. Multi-criteria analysis is usually clustered into three dimensions: the ecological, the economic and the social. Within each of these dimensions certain criteria are set, so that decision-makers can weigh the importance of one element in association with the others. Here, monetary values and CBA measures can be incorporated as one of the criteria to be considered, and weighed against the others in decision-making.
Step 8: Presenting management and decision-making conclusions.
This step involves relating the findings of the valuation study to on-going management issues, and targeting this to particular audiences and aims. It should result in a convincing report on the economic status and value of the wetland as it relates to management priorities and threats.
However good the results of a valuation study are, they will have little impact on decision-making if nobody sees, reads or is persuaded by them. There is an art to presenting information, and communicating it effectively. In many cases, the technical experts who carry out the valuation study itself may not be the best placed to do this – there is often a need for professional communicators and a properly-designed communications strategy.
Information about wetland values will be easiest to communicate when decision-makers find it useful, and it is helps them to address or better understand a particular situation or problem. Many people are involved in shaping decision-making, and communication of the results of valuation studies must usually take place at many levels of scale. Making the results of valuation convincing to these different groups requires different types of communications strategies, different messages and different ways of presenting information.
In a perfect world where all decisions were made for the good of society, merely making valuation information available might be enough to ensure that water decisions took fair account of ecosystems. Unfortunately this is not usually the case. There exist multiple, and often competing, interests in wetlands. Fostering cooperation and balancing these competing interests is critical when the results and recommendations of wetland valuation studies are presented. Here, it is important to be tactical and work with the different constituencies who actually have the political will, and power, to influence wetlands. Just as wetland valuation aims to articulate particular costs and benefits that have traditionally been ignored in decision-making, it also represents the interests of many of the groups who have often been excluded from these decisions.
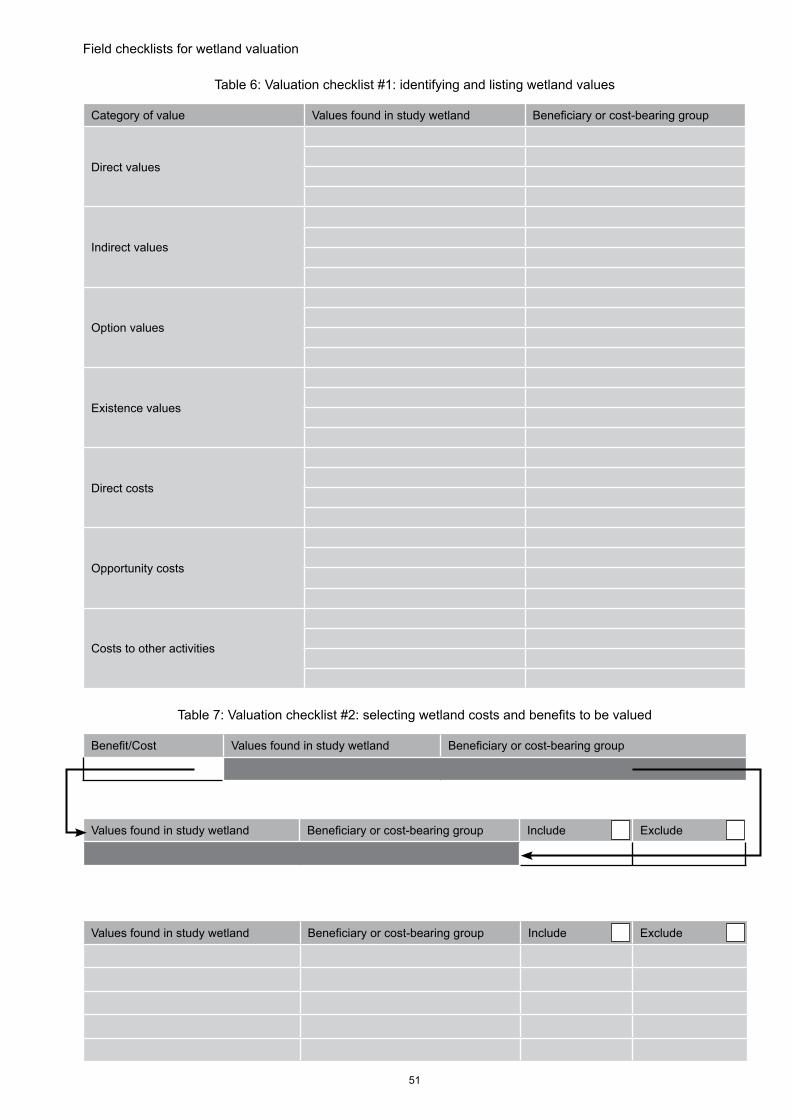
51
Field checklists for wetland valuation
Table 6: Valuation checklist #1: identifying and listing wetland values
Category of value Values found in study wetland Beneficiary or cost-bearing group
Direct values
Indirect values
Option values
Existence values
Direct costs
Opportunity costs
Costs to other activities
Table 7: Valuation checklist #2: selecting wetland costs and benefits to be valued
Benefit/Cost Values found in study wetland Beneficiary or cost-bearing group
Values found in study wetland Beneficiary or cost-bearing group Include Exclude
Values found in study wetland Beneficiary or cost-bearing group Include Exclude

52
Table 8: Valuation checklist #3: choosing wetland valuation techniques
Values found in study wetland Beneficiary or cost-bearing group Include Exclude
Values included in study List of possible valuation techniquesTechnique to be used
Technique not to be used
Values included in study List of possible valuation techniquesTechnique to be used
Technique not to be used
Table 9: Valuation checklist #4: identifying data needs and sources
Values included in study List of possible valuation techniques Technique to be used
Technique not to be used
Values included in study Selected valuation technique Data required Source of data
Values included in study Selected valuation technique Data required Source of data
References
Barbier, E (1994). Valuing environmental functions: tropical wetlands. Land Economics 70(2): 155-73.
Barbier, E., Acreman, M., and D. Knowler (1997). Economic Valuation of Wetlands: A Guide for Policy Makers and Planners. Gland: Ramsar Convention Bureau. 128 pp.
DGA & UAC (2000). Catastro y localizacíon de usos publicos no extractivos o usos in situ del agua, Gobierno de Chile Ministerio de Obras Públicas, Direccion General de Aguas y Universiad Austral de Chile Facultad de Ciencias Forestales, Santiago
Emerton, L (2005). Valuing Domestic Forest Use: Communities and Conservation in Kenya. Nairobi: Centre for Biodiversity, National Museums of Kenya. 45 pp. + appendices.
Emerton, L (1999). Economic Tools for Valuing Wetlands in Eastern Africa. Nairobi: IUCN — The World Conservation Union, Eastern Africa Regional Office. 31 pp.
53
Emerton, L (ed.) (2005). Values and Rewards: Counting and Capturing Ecosystem Water Services for Sustainable Development. IUCN Water, Nature and Economics Technical Paper No. 1, Colombo: IUCN — The World Conservation Union, Ecosystems and Livelihoods Group Asia. 93 pp.
Emerton, L. and E. Bos (2004). VALUE: Counting Ecosystems as Water Infrastructure. Gland: IUCN — The World Conservation Union. 88 pp.
Emerton, L. and B. Kekulandala, (2002). Assessment of the Economic Value of Muthurajawela Wetland. Colombo: IUCN — The World Conservation Union, Sri Lanka Country Office and Regional Environmental Economics Programme Asia. iv + 28pp.
Emerton, L., Iyango, L., Luwum, P., and A. Malinga (1999). The Economic Value of Nakivubo Urban Wetland, Uganda. Nairobi: IUCN - The World Conservation Union, Eastern Africa Regional Office. Nairobi and National Wetlands Programme, Wetlands Inspectorate Division, Ministry of Water, Land and Enviornment, Kampala. 30 pp.
Feather, P., Hellerstein, D. and H. LeRoy (1999). Economic Valuation of Environmental Benefits and the Targeting of Conservation Programs: The Case of the CRP. Resource Economics Division, Economic Research Service. Washington DC.: U.S. Department of Agriculture. Agricultural Economic Report No. 778. 64 pp. Griner, B. P. and S. C. Farber (1996). A conjoint analysis of water quality enhancements and degradations in a western Pennsylvania watershed. Washington DC: United States Environmental Protection Agency.
James, R. F (1991). Wetland Valuation: Guidelines and Techniques, PHPA/AWB Sumatra Wetland Project Report No 31. Bogor, Indonesia: Asian Wetland Bureau.
Kramer, R. A., Richter, D. D., Pattanayak, S. and N. Sharma (1997). Ecological and Economic Analysis of Watershed Protection in Eastern Madagascar. Journal of Environmental Management 49: 277–295.
Kuriyama, K (2002). Measuring the value of the ecosystem in the Kushiro wetland: an empirical study of choice experiments. Forest Economics and Policy working paper #9802. Japan: Hokkaido University, Department of Forest Science. 16 pp.
Mahan, B. L (1997). Valuing Urban Wetlands: A Property Pricing Approach. US Army Corps of Engineers Institute for Water Resources, Evaluation of Environmental IWR Report 97-R-1, Washington DC.
Mitchell, R. and R. Carson (1989). Using Surveys to Value Public Goods: the Contingent Valuation Method, Resources for the Future. Washington DC:resources for the Future. 488 pp.
Morrison, M. D., Bennett, J. W. and R. K. Blamey (1998). Valuing Improved Wetland Quality Using Choice Modelling. Research Report No. 6, Choice Modelling Research Reports. Canberra: School of Economics, and Management, Unversity College, The University of New South Wales,
Pyo, H (2002). The Measurement of the Conservation Value for Korean Wetlands Using the Contingent Valuation Method and Cost-Benefit Analysis. Seoul: Korea Maritime Institute.
Seyam, I. M., Hoekstra, A. Y., Ngabirano, G. S. and H. H. G. Savenije (2001). The Value of Freshwater Wetlands in the Zambezi Basin. Paper presented at Conference on Globalization and Water Resources Management: the Changing Value of Water, AWRA/IWLRI-University of Dundee.
Turpie, J., Smith, B., Emerton, L. and J. Barnes (1999). Economic Valuation of the Zambezi Basin Wetlands. Harare: IUCN - - The World Conservation Union Regional Office for Southern Africa.
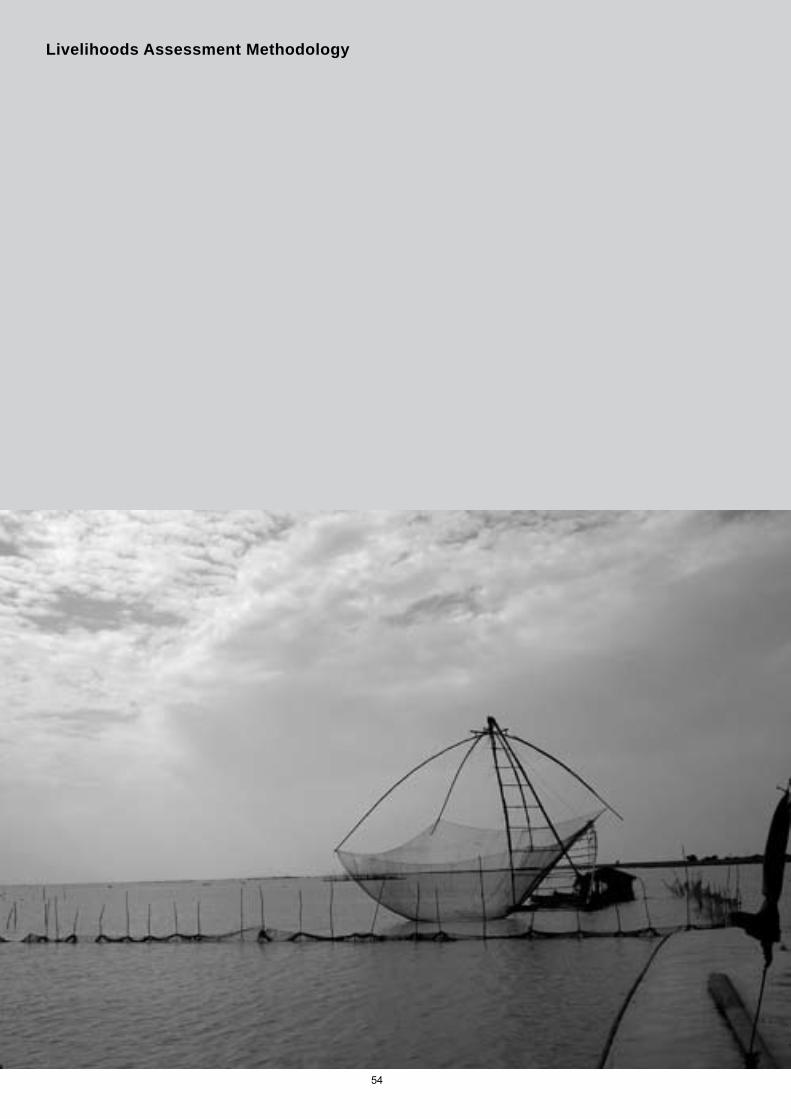
54
Livelihoods Assessment Methodology
55
Steps, stages and methods for the assessment of livelihoods in a village (extracted from CARE 2008)18
Note that this is a technical annexe that requires knowledge of sociology and Participatory Rapid Appraisal (PRA) techniques.
Objectives of socio-economic profiles
The objectives of household livelihoods (HLS) assessment are to:
• Assess livelihood security and the underlying causes of poverty amongst selected target groups at [focal site].• Analyse the underlying causes of poverty in [focal site] in order to promote appropriate livelihood security
programming options.• Identify the most appropriate interventions likely to have the largest sustainable impact related to targeted
outcomes, i.e., social positions, human conditions, and enabling environment.• Train staff on how to develop and conduct an HLS assessment: and • Train staff on a procedure for using the results of an HLS analysis to design a programme or project. This assessment uses a variety of exercises that employ Participatory Rapid Appraisal (PRA) techniques, as described below.
A combination of data collection procedures is used, including:
• Qualitative community profiles of different villages representing different combinations of livelihood systems and potential target groups. Participatory analysis tools used for this assessment include:
- Key informant interviews; - Focus group discussions with separate community groups of men and women; - Wealth ranking exercise aimed at understanding community-perceived social differentiation; - Venn diagramming exercise to understand social and institutional positions of key community institutions; - Household opportunity analysis to identify ‘positive deviant’ households representing success stories in
managing risks; and - CBO case studies to understand the power dynamics between the organisation or institution being studied
and other entities in or around the community. • Household survey of a specified number of households from specified villages.
The qualitative assessment aims at enhancing our understanding about local livelihood systems – the economic, socio-cultural and political context, including human conditions, social positions, and the enabling environment. The teams used a variety of tools to analyse the constraints to food and livelihood insecurity, vulnerabilities, marginalisation, and risks of poor families living within this context. The major objective is to gain maximum in-depth knowledge regarding the underlying causes of poverty among vulnerable populations.
The assessment team can be subdivided into teams of facilitators each with a supervisor, who visit villages, spending two days in each village, facilitating male and female focus group discussions, key informant interviews, household survey questionnaires, CBO case studies, venn diagrams, case studies of relatively resilient households, and wealth ranking exercises. All of the team members can then spend evenings and a full day entering a substantial amount of qualitative data into matrices used for analysis. Table 1 on the following page outlines the three day process for each of two cycles – four villages in each cycle.
18 Extracted from Care (2008) Household livelihoods assessment in Jaffna, Sri Lanka. Volume 1: Report of the findings. Prepared by Tango International.
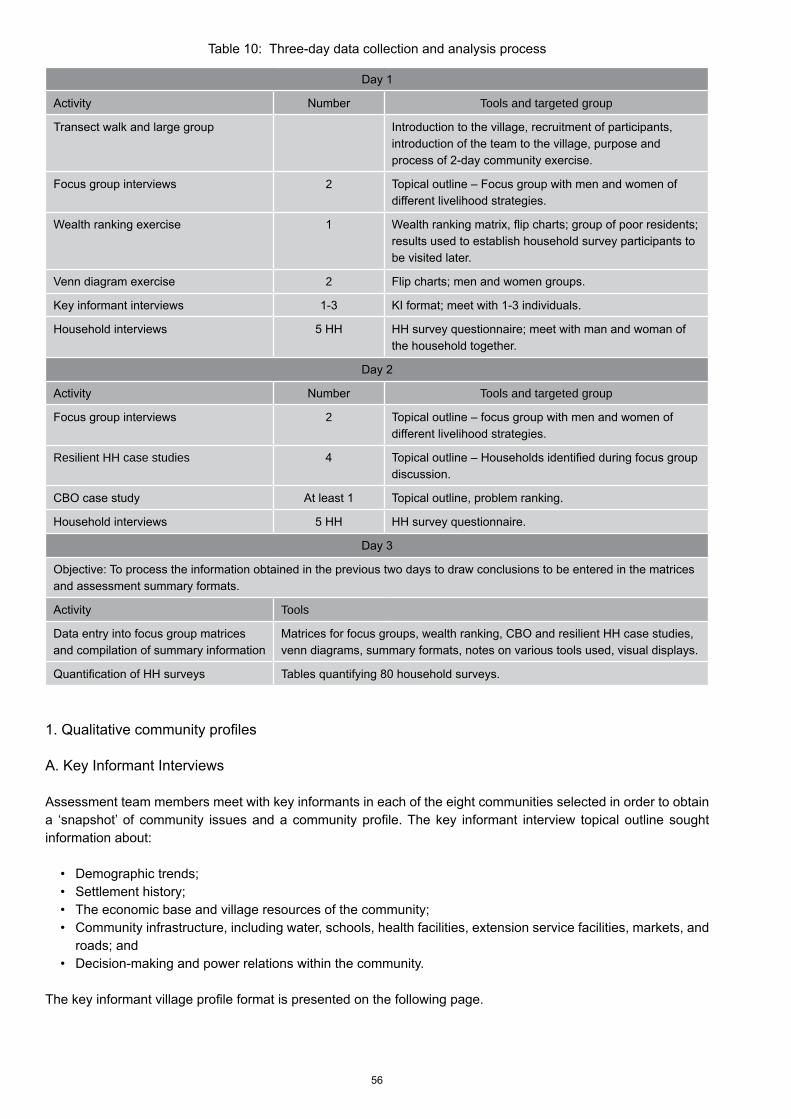
56
Table 10: Three-day data collection and analysis process
Day 1
Activity Number Tools and targeted group
Transect walk and large group Introduction to the village, recruitment of participants, introduction of the team to the village, purpose and process of 2-day community exercise.
Focus group interviews 2 Topical outline – Focus group with men and women of different livelihood strategies.
Wealth ranking exercise 1 Wealth ranking matrix, flip charts; group of poor residents; results used to establish household survey participants to be visited later.
Venn diagram exercise 2 Flip charts; men and women groups.
Key informant interviews 1-3 KI format; meet with 1-3 individuals.
Household interviews 5 HH HH survey questionnaire; meet with man and woman of the household together.
Day 2
Activity Number Tools and targeted group
Focus group interviews 2 Topical outline – focus group with men and women of different livelihood strategies.
Resilient HH case studies 4 Topical outline – Households identified during focus group discussion.
CBO case study At least 1 Topical outline, problem ranking.
Household interviews 5 HH HH survey questionnaire.
Day 3
Objective: To process the information obtained in the previous two days to draw conclusions to be entered in the matrices and assessment summary formats.
Activity Tools
Data entry into focus group matrices and compilation of summary information
Matrices for focus groups, wealth ranking, CBO and resilient HH case studies, venn diagrams, summary formats, notes on various tools used, visual displays.
Quantification of HH surveys Tables quantifying 80 household surveys.
1. Qualitative community profiles
A. Key Informant Interviews Assessment team members meet with key informants in each of the eight communities selected in order to obtain a ‘snapshot’ of community issues and a community profile. The key informant interview topical outline sought information about:
• Demographic trends; • Settlement history; • The economic base and village resources of the community; • Community infrastructure, including water, schools, health facilities, extension service facilities, markets, and
roads; and • Decision-making and power relations within the community.
The key informant village profile format is presented on the following page.
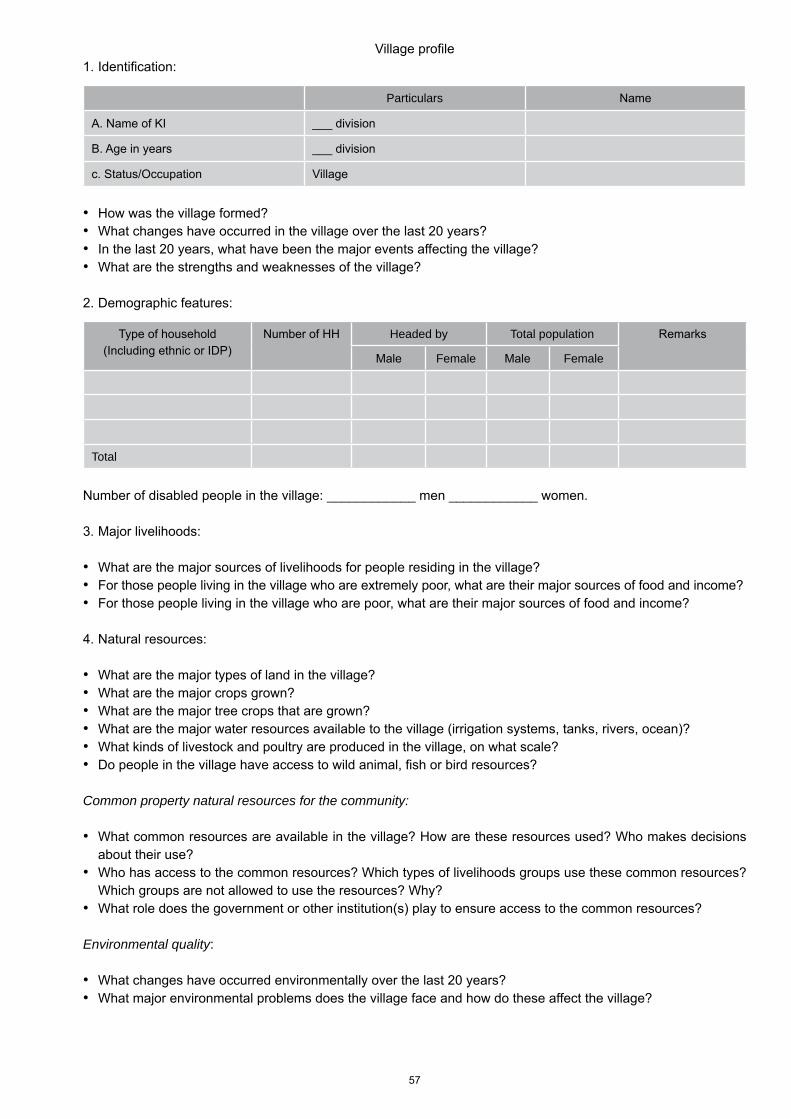
57
Village profile1. Identification:
Particulars Name
A. Name of KI ___ division
B. Age in years ___ division
c. Status/Occupation Village
How was the village formed? •What changes have occurred in the village over the last 20 years?•In the last 20 years, what have been the major events affecting the village?•What are the strengths and weaknesses of the village?•
2. Demographic features:
Type of household(Including ethnic or IDP)
Number of HH Headed by Total population Remarks
Male Female Male Female
Total
Number of disabled people in the village: ____________ men ____________ women.
3. Major livelihoods:
What are the major sources of livelihoods for people residing in the village?•For those people living in the village who are extremely poor, what are their major sources of food and income? •For those people living in the village who are poor, what are their major sources of food and income? •
4. Natural resources:
What are the major types of land in the village?•What are the major crops grown?•What are the major tree crops that are grown?•What are the major water resources available to the village (irrigation systems, tanks, rivers, ocean)?•What kinds of livestock and poultry are produced in the village, on what scale?•Do people in the village have access to wild animal, fish or bird resources?•
Common property natural resources for the community:
What common resources are available in the village? How are these resources used? Who makes decisions •about their use?Who has access to the common resources? Which types of livelihoods groups use these common resources? •Which groups are not allowed to use the resources? Why?What role does the government or other institution(s) play to ensure access to the common resources? •
Environmental quality:
What changes have occurred environmentally over the last 20 years?•What major environmental problems does the village face and how do these affect the village?•
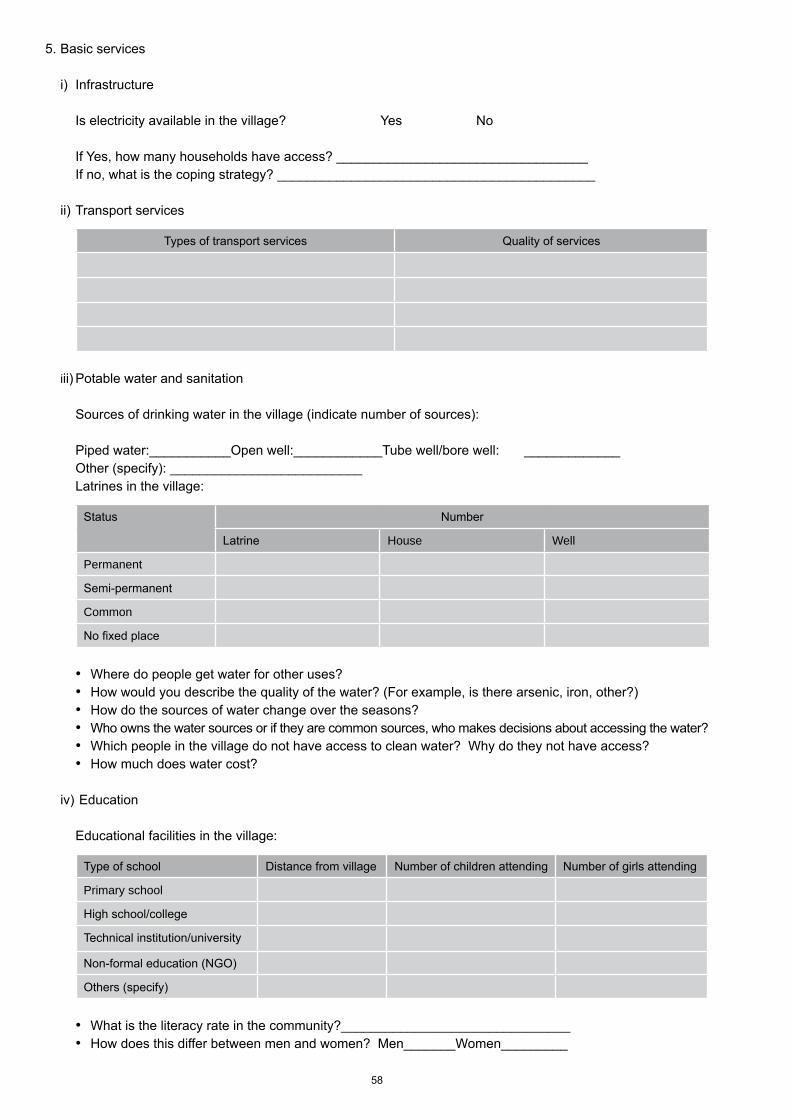
58
5. Basic services
i) Infrastructure
Is electricity available in the village? Yes No
If Yes, how many households have access? __________________________________ If no, what is the coping strategy? ___________________________________________
ii) Transport services
Types of transport services Quality of services
iii) Potable water and sanitation
Sources of drinking water in the village (indicate number of sources):
Piped water:___________Open well:____________Tube well/bore well: _____________ Other (specify): __________________________ Latrines in the village:
Status Number
Latrine House Well
Permanent
Semi-permanent
Common
No fixed place
Where do people get water for other uses?•How would you describe the quality of the water? (For example, is there arsenic, iron, other?)•How do the sources of water change over the seasons? •Who owns the water sources or if they are common sources, who makes decisions about accessing the water? •Which people in the village do not have access to clean water? Why do they not have access?•How much does water cost?•
iv) Education
Educational facilities in the village:
Type of school Distance from village Number of children attending Number of girls attending
Primary school
High school/college
Technical institution/university
Non-formal education (NGO)
Others (specify)
What is the literacy rate in the community?_______________________________ •How does this differ between men and women? Men_______Women_________•
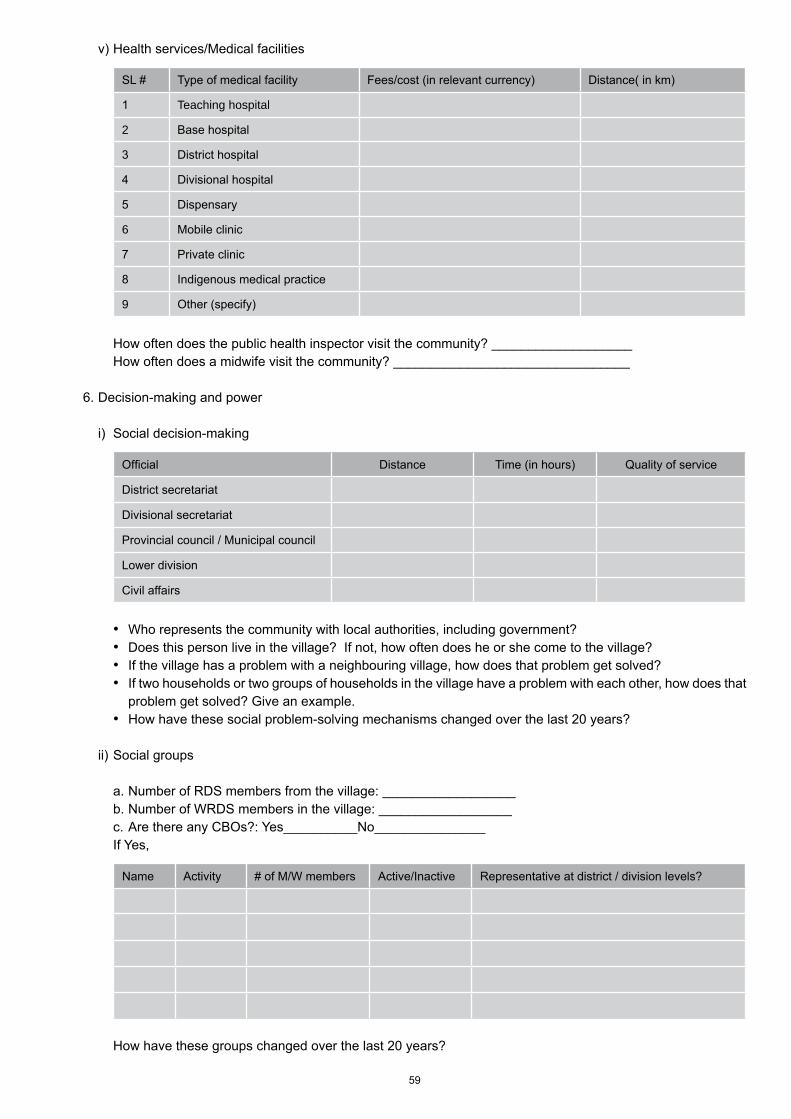
59
v) Health services/Medical facilities
SL # Type of medical facility Fees/cost (in relevant currency) Distance( in km)
1 Teaching hospital
2 Base hospital
3 District hospital
4 Divisional hospital
5 Dispensary
6 Mobile clinic
7 Private clinic
8 Indigenous medical practice
9 Other (specify)
How often does the public health inspector visit the community? ___________________How often does a midwife visit the community? ________________________________
6. Decision-making and power
i) Social decision-making
Official Distance Time (in hours) Quality of service
District secretariat
Divisional secretariat
Provincial council / Municipal council
Lower division
Civil affairs
Who represents the community with local authorities, including government?•Does this person live in the village? If not, how often does he or she come to the village?•If the village has a problem with a neighbouring village, how does that problem get solved?•If two households or two groups of households in the village have a problem with each other, how does that •problem get solved? Give an example.How have these social problem-solving mechanisms changed over the last 20 years?•
ii) Social groups
a. Number of RDS members from the village: __________________ b. Number of WRDS members in the village: __________________ c. Are there any CBOs?: Yes__________No_______________ If Yes,
Name Activity # of M/W members Active/Inactive Representative at district / division levels?
How have these groups changed over the last 20 years?
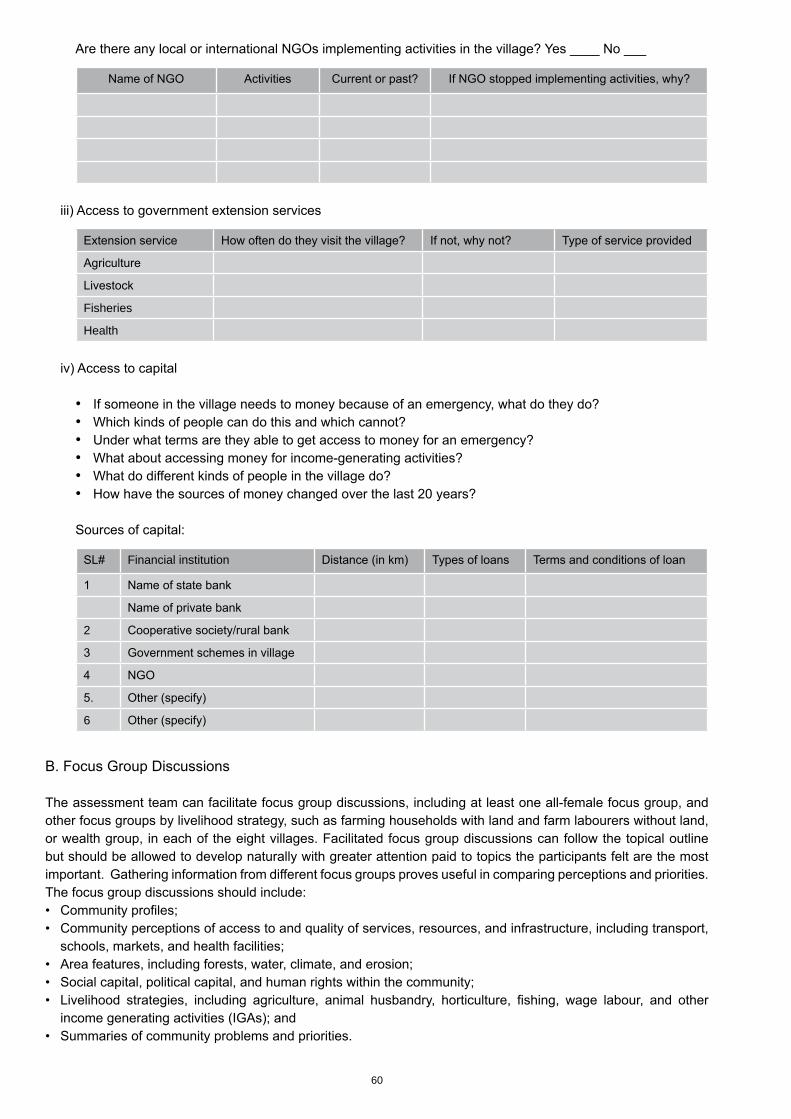
60
Are there any local or international NGOs implementing activities in the village? Yes ____ No ___
Name of NGO Activities Current or past? If NGO stopped implementing activities, why?
iii) Access to government extension services
Extension service How often do they visit the village? If not, why not? Type of service provided
Agriculture
Livestock
Fisheries
Health
iv) Access to capital
If someone in the village needs to money because of an emergency, what do they do?•Which kinds of people can do this and which cannot? •Under what terms are they able to get access to money for an emergency?•What about accessing money for income-generating activities? •What do different kinds of people in the village do?•How have the sources of money changed over the last 20 years?•
Sources of capital:
SL# Financial institution Distance (in km) Types of loans Terms and conditions of loan
1 Name of state bank
Name of private bank
2 Cooperative society/rural bank
3 Government schemes in village
4 NGO
5. Other (specify)
6 Other (specify)
B. Focus Group Discussions
The assessment team can facilitate focus group discussions, including at least one all-female focus group, and other focus groups by livelihood strategy, such as farming households with land and farm labourers without land, or wealth group, in each of the eight villages. Facilitated focus group discussions can follow the topical outline but should be allowed to develop naturally with greater attention paid to topics the participants felt are the most important. Gathering information from different focus groups proves useful in comparing perceptions and priorities. The focus group discussions should include:• Community profiles;• Community perceptions of access to and quality of services, resources, and infrastructure, including transport,
schools, markets, and health facilities;• Area features, including forests, water, climate, and erosion;• Social capital, political capital, and human rights within the community;• Livelihood strategies, including agriculture, animal husbandry, horticulture, fishing, wage labour, and other
income generating activities (IGAs); and• Summaries of community problems and priorities.
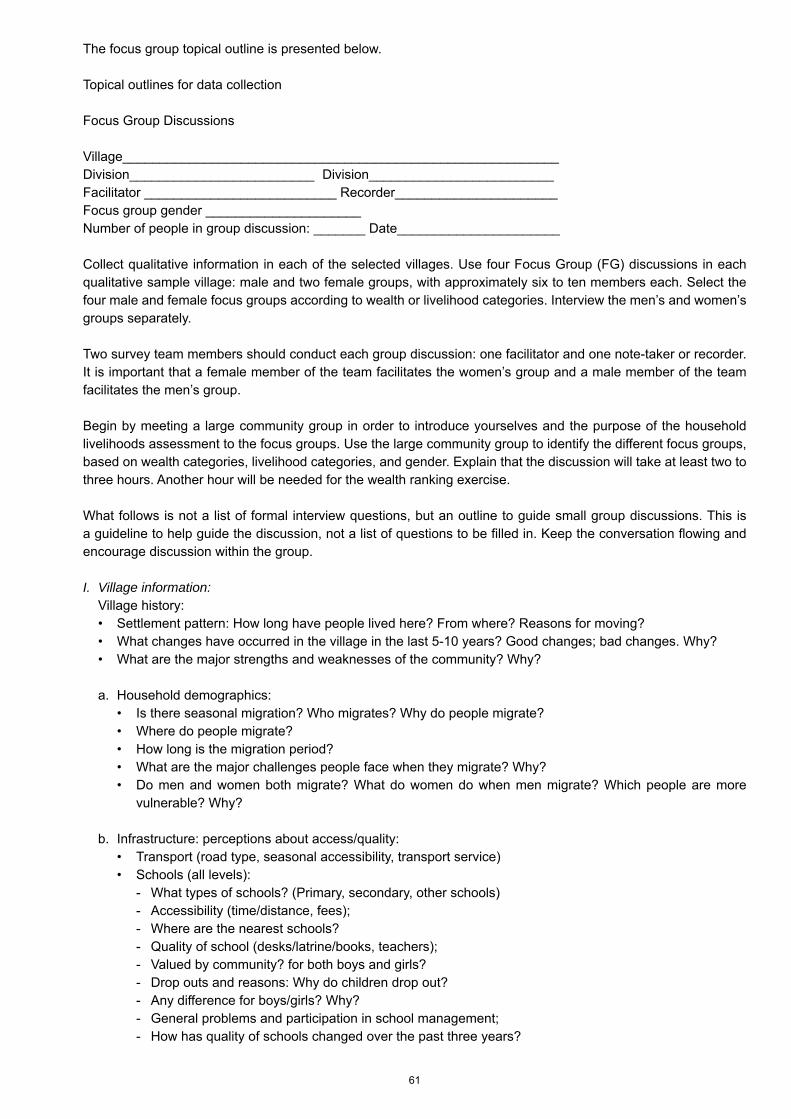
61
The focus group topical outline is presented below.
Topical outlines for data collection
Focus Group Discussions
Village___________________________________________________________ Division_________________________ Division_________________________ Facilitator __________________________ Recorder______________________Focus group gender _____________________Number of people in group discussion: _______ Date______________________
Collect qualitative information in each of the selected villages. Use four Focus Group (FG) discussions in each qualitative sample village: male and two female groups, with approximately six to ten members each. Select the four male and female focus groups according to wealth or livelihood categories. Interview the men’s and women’s groups separately.
Two survey team members should conduct each group discussion: one facilitator and one note-taker or recorder. It is important that a female member of the team facilitates the women’s group and a male member of the team facilitates the men’s group.
Begin by meeting a large community group in order to introduce yourselves and the purpose of the household livelihoods assessment to the focus groups. Use the large community group to identify the different focus groups, based on wealth categories, livelihood categories, and gender. Explain that the discussion will take at least two to three hours. Another hour will be needed for the wealth ranking exercise.
What follows is not a list of formal interview questions, but an outline to guide small group discussions. This is a guideline to help guide the discussion, not a list of questions to be filled in. Keep the conversation flowing and encourage discussion within the group.
I. Village information: Village history: • Settlement pattern: How long have people lived here? From where? Reasons for moving? • What changes have occurred in the village in the last 5-10 years? Good changes; bad changes. Why? • What are the major strengths and weaknesses of the community? Why?
a. Household demographics: • Is there seasonal migration? Who migrates? Why do people migrate? • Where do people migrate? • How long is the migration period? • What are the major challenges people face when they migrate? Why? • Do men and women both migrate? What do women do when men migrate? Which people are more
vulnerable? Why?
b. Infrastructure: perceptions about access/quality: • Transport (road type, seasonal accessibility, transport service) • Schools (all levels): - What types of schools? (Primary, secondary, other schools) - Accessibility (time/distance, fees); - Where are the nearest schools? - Quality of school (desks/latrine/books, teachers); - Valued by community? for both boys and girls? - Drop outs and reasons: Why do children drop out? - Any difference for boys/girls? Why? - General problems and participation in school management; - How has quality of schools changed over the past three years?
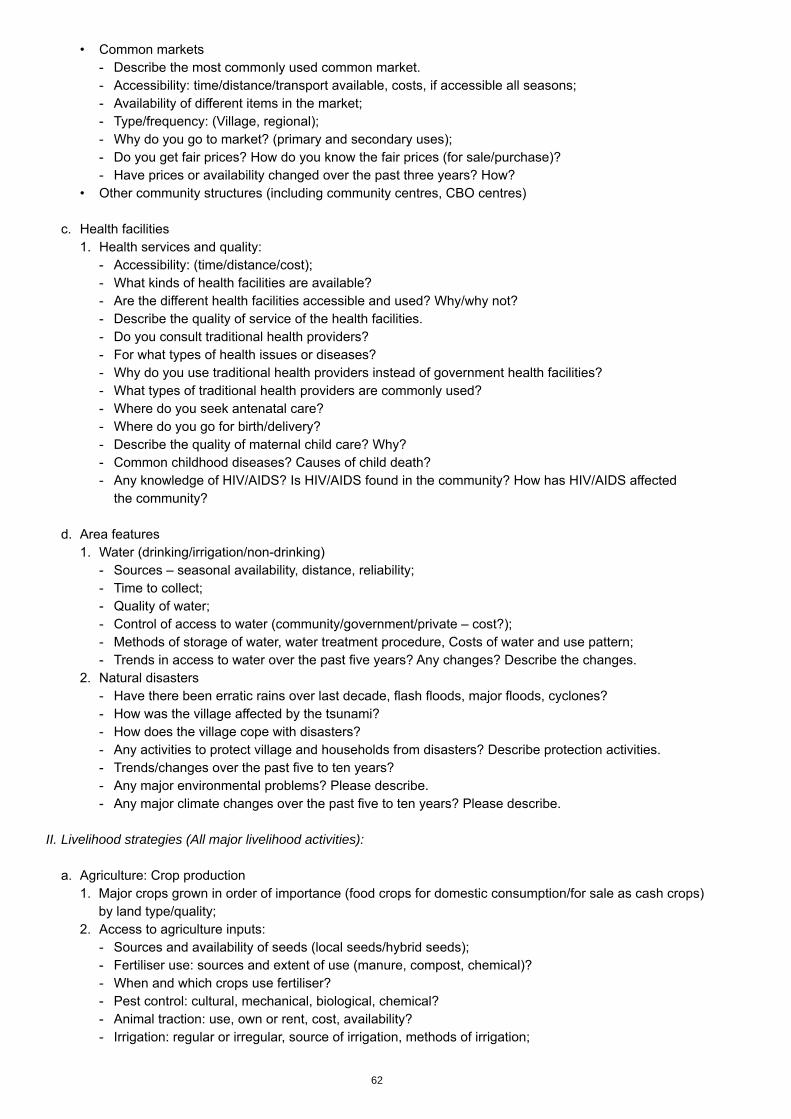
62
• Common markets - Describe the most commonly used common market. - Accessibility: time/distance/transport available, costs, if accessible all seasons; - Availability of different items in the market; - Type/frequency: (Village, regional); - Why do you go to market? (primary and secondary uses); - Do you get fair prices? How do you know the fair prices (for sale/purchase)? - Have prices or availability changed over the past three years? How? • Other community structures (including community centres, CBO centres)
c. Health facilities 1. Health services and quality: - Accessibility: (time/distance/cost); - What kinds of health facilities are available? - Are the different health facilities accessible and used? Why/why not? - Describe the quality of service of the health facilities. - Do you consult traditional health providers? - For what types of health issues or diseases? - Why do you use traditional health providers instead of government health facilities? - What types of traditional health providers are commonly used? - Where do you seek antenatal care? - Where do you go for birth/delivery? - Describe the quality of maternal child care? Why? - Common childhood diseases? Causes of child death? - Any knowledge of HIV/AIDS? Is HIV/AIDS found in the community? How has HIV/AIDS affected
the community? d. Area features 1. Water (drinking/irrigation/non-drinking) - Sources – seasonal availability, distance, reliability; - Time to collect; - Quality of water; - Control of access to water (community/government/private – cost?); - Methods of storage of water, water treatment procedure, Costs of water and use pattern; - Trends in access to water over the past five years? Any changes? Describe the changes. 2. Natural disasters - Have there been erratic rains over last decade, flash floods, major floods, cyclones? - How was the village affected by the tsunami? - How does the village cope with disasters? - Any activities to protect village and households from disasters? Describe protection activities. - Trends/changes over the past five to ten years? - Any major environmental problems? Please describe. - Any major climate changes over the past five to ten years? Please describe.
II. Livelihood strategies (All major livelihood activities):
a. Agriculture: Crop production 1. Major crops grown in order of importance (food crops for domestic consumption/for sale as cash crops)
by land type/quality; 2. Access to agriculture inputs: - Sources and availability of seeds (local seeds/hybrid seeds); - Fertiliser use: sources and extent of use (manure, compost, chemical)? - When and which crops use fertiliser? - Pest control: cultural, mechanical, biological, chemical? - Animal traction: use, own or rent, cost, availability? - Irrigation: regular or irregular, source of irrigation, methods of irrigation;

63
- Which crops are irrigated? - Who has access to inputs; who has no access? 3. Access to government or NGO services - Types of services: credit, extension? - Agricultural extension: access and quality; - Access to credit facilities (formal/informal, terms of repayment, specify NGO, Government,
moneylender; - Type of credit, quality, usefulness, frequency of use. 4. Crop/Food storage - Types, length of storage, amount of losses, reasons for losses; - Measures taken to prevent or control losses. 5. Marketing of agricultural produce – farmgate marketing - Where is the farmgate market? - Which products do you market and when? - Are the prices you receive fair? Why or why not? - Major problems or constraints associated with marketing (Rank). - How has marketing changed in the past five years? Why are there changes? 6. Problems associated with production (Ranking exercise) - Potential solutions to the problems listed above. - Has production been increasing or decreasing? Why? 7. How has the war affected agricultural production? 8. Land tenure systems – ownership/access patterns - Who owns land? What is the average landholding? - Is landlessness a problem? Why? - Is there sharecropping (terms, conditions and trends)? Why? - What are the sharecropping arrangements? (lease, mortgage, etc.) - Is there any conflict over land? Describe. - Trends in access to land.
b. Horticulture 1. What kinds of horticultural activities are practiced? - Homestead gardening? 2. What is normally grown? 3. Who participates in this activity? 4. What are the seasons? 5. Is the production for sale or for consumption (for each crop)? 6. Do most households have gardens or arable land nearby? How far away normally?
c. Animal Husbandry 1. Types of animals raised, in order of importance - Uses of livestock (production, animal traction, slaughter, consumption, sale) - Rearing practices and patterns (hybrid and indigenous livestock types) - When are livestock sold and for what reasons? 2. Availability of pasture: is there any conflict over pasture land, fodder (availability, changes in accessibility). 3. Major animal diseases, availability of veterinary services. 4. Poultry types: - What are your perceptions and knowledge of avian flu? 5. How has the war affected animal husbandry? What types of livestock were most affected? Why? 6. Changing trends in animal husbandry over the past five to ten years. 7. Major constraints and potential solutions.
d. Fishing 1. Types of fishing; 2. Fishing gear owned or funded, boat, nets, costs;
64
3. What is the moneylending and renting system, credit access for fishing and availability - Extension service availability and quality; 4. Fishing production/harvest amounts; 5. Extent of dry fish making; 6. Marketing arrangements, price and seasonal variations; 7. Changes in availability/scarcity? 8. Describe the quality/availability/access to fishing inputs (boats, nets, etc.), markets, and storage facilities; 9. Problems or constraints to production? How to solve these problems? 10. Access to water bodies: What water bodies can households access? - What water bodies do you do not have access to? Why? - Purposes of use of water bodies.
e. Other Income Generating Activities (IGAs) 1. Type of activity, extent of practice, and number of activities practiced: - Artisan production; - Agricultural enterprise; - Weaving; - Petty vending and trading; - Small shops/boutiques; - Service; - Other IGA; 2. When do you do each of these activities? (Year-round, annually?) 3. How much do you earn from each IGA? 4. Demand and use of credit: is credit available? - Source of credit for IGAs (moneylenders, government, NGOs); - Terms of credit (interest rates, loan terms, mortgages); 5. Any support service provided by government? By NGOs? - Any technical skills training? Extension services? Who provides? 6. Availability of wage labour: How many days/month do you participate? - Months/year; 7. Migration for work: where to, why, who goes, when, for how long? 8. Remittances: from where, when? 9. Any constraints in earning enough from this activity? 10. Trends over the past 5-10 years.
f. Wage labour 1. What kinds of daily labour activities do households undertake? 2. Who is involved from the household? 3. How often and when do these activities occur? 4. What kind of compensation do men and women receive? - Differences between men and women’s compensation? 5. What are the major constraints or problems to wage labour activities? Why? 6. What opportunities exist to increase income from wage labour activities? 7. Why are households not pursuing these opportunities? 8. Describe trends and changes in these activities in the last five to ten years.
g. Changes in livelihood strategies in the past several years? - Which households are more successful at making these changes? - What do these households do? - Identify households for the PD case study.
III. Social capital
a. Borrowing or lending relationships: 1. If a household in this livelihoods group faces a crisis or shock, from whom can they go to borrow money
or food? Do you borrow from someone in a different or same social class or social caste? Why? 2. What is owed back after borrowing money or food? What is expected?
65
3. How strong are relationships between social classes or social castes? Please describe the differences. 4. What are major constraints to different groups working with each other? 5. How have social relationships changed in the past five to ten years? Describe.
b. Human Rights 1. Are there any rights that people feel are not being respected? - What kinds of rights are not respected? Why? 2. Are there any groups in the village who are denied equal rights? - Who are these groups? - Why are they denied equal rights? - Who denies them their rights? 3. How have human rights changed in the past five to ten years? 4. What should be done to change this situation? 5. What has the community already accomplished?
IV. Political capital
a. Power relationships: 1. How are decisions made in this community? 2. Please describe how decision-making occurs in this community. - Is decision-making fair and transparent? Why or why not? - Who makes the decisions? 3. Do all households have equal participation in decision-making? - Why or why not? 4. How have power relationships changed in the past five to ten years? b. Political parties or groups: 1. Do some groups have more power than others in this community? - Why or why not? 2. Do any groups control the assets or resources? 3. Have any groups’ assets been lost to another group? Please explain. 4. Please describe any changes in the past five to ten years.
V. Community constraints and solutions:
Rank in order of importance, and address strategies/trends for each.
a. Major problems: Thinking about the issues discussed above and others not discussed, what are the major problems facing the community?
- What are the major causes of these problems? Prioritise – ranking exercise. b. Trends :Are these problems getting worse or better over the last three to five years? - Why is it worse or better?
c. Interviewer summarises key problems discussed, asks if anything was left out.
d. What can the community do?/Is the community doing to solve these problems? - List and rank the most important initiatives.
e. Prosperity If we had the power to change one thing to improve the quality of life in the village, what would we do? - Why? - Who would be positively affected by the change? - Who would be negatively affected? - What is the fundamental cause of this particular problem? - What is the village currently doing at address this particular problem?

66
C. Wealth Ranking Exercise
Select residents comprising men and women from the community were asked to participate in an exercise to determine:
• Perceptions of poverty and vulnerability; • Wealth groupings by community-defined attributes; • Proportions of community residents belonging to the identified wealth categories; and • Specific household identification for participation in the household questionnaire survey, based on
proportionality of wealth groups.
Community residents define three or four wealth categories, ranging from ‘very poor’ to ‘poor’ to ‘middle’ or ‘middle poor’ to ‘better-off’ to ‘rich’. The wealth ranking exercise provided the assessment team with key indicators of poverty and vulnerability by wealth category, including (amongst other variables):
• Food consumption patterns; • Access to land, livestock, and assets; • Income sources; • House types; and • Social capital within the community.
The wealth-ranking format is presented below.Village_________________________________________________________________________ Division_____________________________ Division____________________________________ Group ggender ____________________ Date_________________________________________Facilitator_____________________________ Recorder_________________________________
Wealth categories
Indicators Category 1____________
Category 2____________
Category 3____________
Category 4____________
Food/diet (quality and quantity)
Access to land and size of landholding
Livestock (types and numbers)
House (type/size)
Assets (productive and non-productive)
Types of employment (e.g. fishing, wage labour, govt., business, etc.)
Membership in institutions (including CBOs)
Remittances from abroad
Water and sanitation (Water sources and toilets)
Levels of education
Other
Number and proportion of HH in this category
Observations:
67
D. Venn Diagrams
The research team should also conduct an institutional and social positioning exercise, in order to describe issues around social capital within the community, including community and household inter-relations. Starting with the community at the center, focus group participants should be asked to describe and then to place the most Important institutions serving community and households. Which institutions do community residents deem to be closest to them; which institutions are furthest from their interests or participation? The research team should facilitate two Venn diagram sessions per community, allowing different groups of men and women to reflect on their position vis-à-vis institutions within the community. Residents should be asked to comment why they positioned the institutions in relation to trust and institutional importance.
The Venn diagramming exercise is presented below.
Venn diagramming exercise:
• This is a social and institutional positioning exercise.• Describe community and household relations with key institutions.• Begin with community at the centre.• Describe important community institutions and organisations.• Which institutions are most important from the perspective of the focal group discussion?• Which institutions does the community trust and feel closest to?• From which institutions does the community feel alienated?
Venn diagram exercise process:
• Draw institutions as defined by community.• Draw the most and least important in relation to community and households.• Facilitator asks for reflection and feedback.• Rearrange the Venn diagram.• Why are these institutions positioned in such a way? - Trust and importance of institutions for community• What would be better? - Recommendations• Does everybody in the focal group discussion agree?• Draw two Venn diagrams per community: 1 male and 1 female group.• Compare and contrast male/female Venn diagrams during analysis stage.• Specifically ask about NGOs. - Which NGOs are operating in the community? - What are NGOs doing? Describe NGO programming activities. - How close is community to NGOs? - Assess NGO effectiveness in responding to community priorities and needs.
E. Opportunity analysis of resilient or ‘positive deviant’ households
As part of the focus group discussions, researchers should ask community participants to identify ‘positive deviant’ households representing success stories in managing risks. These households, who share similar attributes to other focal group discussion participants, have nevertheless managed to be more successful, through their adoption of different types of adaptive strategies. The team should interview four such households within each village in an effort to understand the enabling factors contributing to household self-resilience.
The household opportunity analysis topical outline is presented below.
Household opportunity analysis using positive deviance: Topical outline:
Theme: What are the enabling factors that contribute to household self resiliency? 1. Characteristics of this household • Landholdings;
68
• Asset base; • Income sources; • Education.
2. Household decision making by different members of household
3. What shocks have affected this community in the last five years? • How have you prepared for such shocks? • How did you cope with these shocks? • What have you done to recover from these shocks?
4. Capacity to adapt to vulnerability • What opportunities exist and have been used by the household? Probe. • Is there some behaviour that makes your household unique? Please explain. • What are some of the enabling factors for your household to become self-resilient? Probe.
5. What does it mean to be self-resilient in the community?
F. Community Based Organisation (CBO) case study:
The assessment team can garner information from a CBO or other community-based social institution to understand to what level the principles of good governance are practised by that institution. The tool can also be used to capture information to understand the power dynamics that exist in the community between the organisation or institution being studied and other entities in or around the community.
The CBO topical outline is presented below.
Tropical outline for CBO case study:
(The field team leader should make the decision on the type of CBO or village leadership institution)
Name of the Village: __________________________________________Name of the CBO: ___________________________________________ Type of CBO: ______________________________________________
Person(s) interviewed:
Name: _________________________ Position: _________________________Name: _________________________ Position: _________________________Name: _________________________ Position: _________________________Name: _________________________ Position: _________________________Name: _________________________ Position: _________________________Name: _________________________ Position: _________________________Name: _________________________ Position: _________________________Name: _________________________ Position: _________________________
I. History and profile of organisation
a. Organisational purpose - What is the purpose of the organisation? b. Formation - When was the organisation formed? - How was it formed? - How has the organisation changed over the years since it was formed?
69
c. Membership: - What is the composition of the organisation? Who are members of the organisation? d. Organisational Vision: - What is the vision for the organisation? - What does the organisation want to look like in the future, ten years from now?
II. Programme activities:
a. Current activities: - What are the current activities of the organisation? - How long have these activities been underway? - Why have these activities been undertaken? b. Beneficiaries: - Who are the targeted beneficiaries for these activities? c. Completed activities: - What other activities has the organisation undertaken in the past that are now completed? - What was the impact of these activities? d. Planned future activities: - What kinds of activities would the organisation like to undertake in the future? - Why these activities? - What is the organisation doing to make these activities a reality? e. Success story: - Of all of the activities presently undertake or undertaken in the past, of which of these is the organisation
most proud? Why?
III. Resources: a. Human resources - What human resources does the organisation have? - What are the roles of the various officers? b. Material assets - What material resources does the organisation have (buildings, furnishings, office equipment, vehicles)? - How were these obtained? c. Financial assets - What is the current annual budget for the organisation? - What are the sources of revenue? - How have these changed over the years? d. External relations - What relationships does the organisation have for resources, technical support, political support or
other reasons? e. Government relations - Describe your relationship with the government. - Is anybody monitoring your activities? - When was the last time monitoring took place? - What was the impact of the monitoring?
IV. Governance system:
- Who are the leaders of the organisation? - How were they chosen? - For how long do they serve? - What process is in place for changing leadership? - How often are changes in leadership supposed to occur? - Who are the members of the organisation? - How many are men and how many are women? - How much of the village does the membership represent?
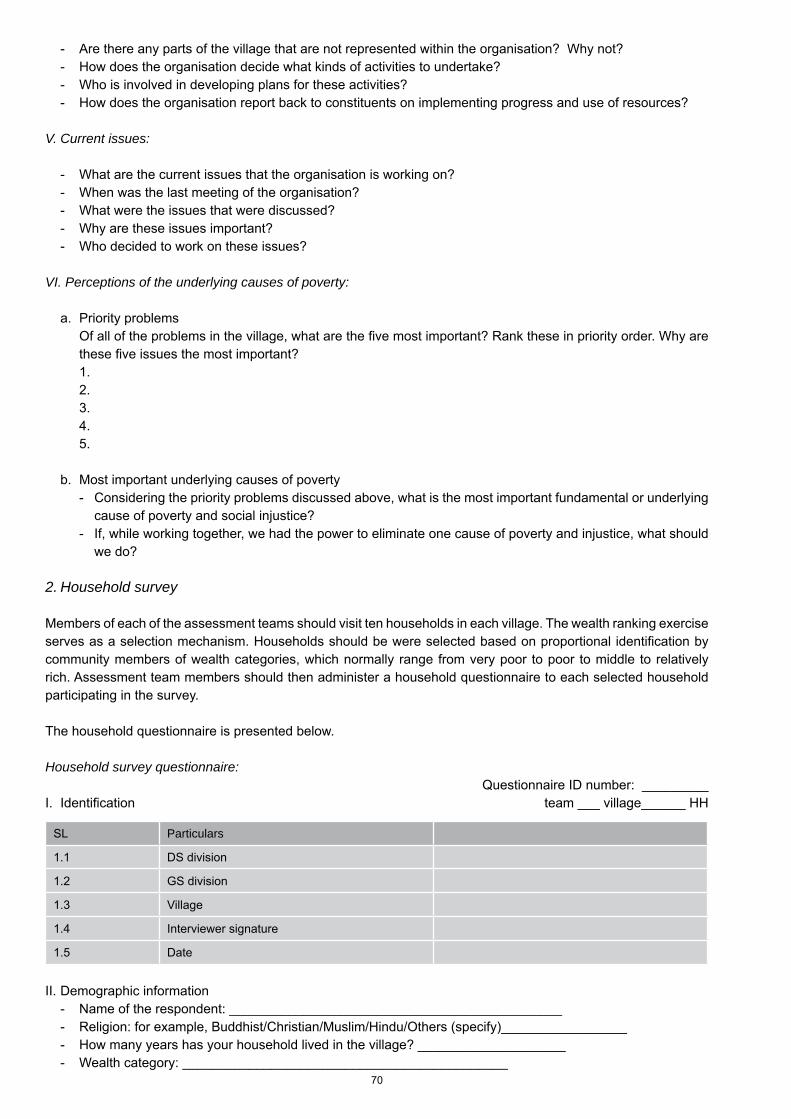
70
- Are there any parts of the village that are not represented within the organisation? Why not? - How does the organisation decide what kinds of activities to undertake? - Who is involved in developing plans for these activities? - How does the organisation report back to constituents on implementing progress and use of resources?
V. Current issues:
- What are the current issues that the organisation is working on? - When was the last meeting of the organisation? - What were the issues that were discussed? - Why are these issues important? - Who decided to work on these issues?
VI. Perceptions of the underlying causes of poverty:
a. Priority problems Of all of the problems in the village, what are the five most important? Rank these in priority order. Why are
these five issues the most important? 1. 2. 3. 4. 5.
b. Most important underlying causes of poverty - Considering the priority problems discussed above, what is the most important fundamental or underlying
cause of poverty and social injustice? - If, while working together, we had the power to eliminate one cause of poverty and injustice, what should
we do?
2. Household survey
Members of each of the assessment teams should visit ten households in each village. The wealth ranking exercise serves as a selection mechanism. Households should be were selected based on proportional identification by community members of wealth categories, which normally range from very poor to poor to middle to relatively rich. Assessment team members should then administer a household questionnaire to each selected household participating in the survey.
The household questionnaire is presented below.
Household survey questionnaire: Questionnaire ID number: _________I. Identification team ___ village______ HH
SL Particulars
1.1 DS division
1.2 GS division
1.3 Village
1.4 Interviewer signature
1.5 Date
II. Demographic information - Name of the respondent: _____________________________________________ - Religion: for example, Buddhist/Christian/Muslim/Hindu/Others (specify)_________________ - How many years has your household lived in the village? ____________________ - Wealth category: ____________________________________________
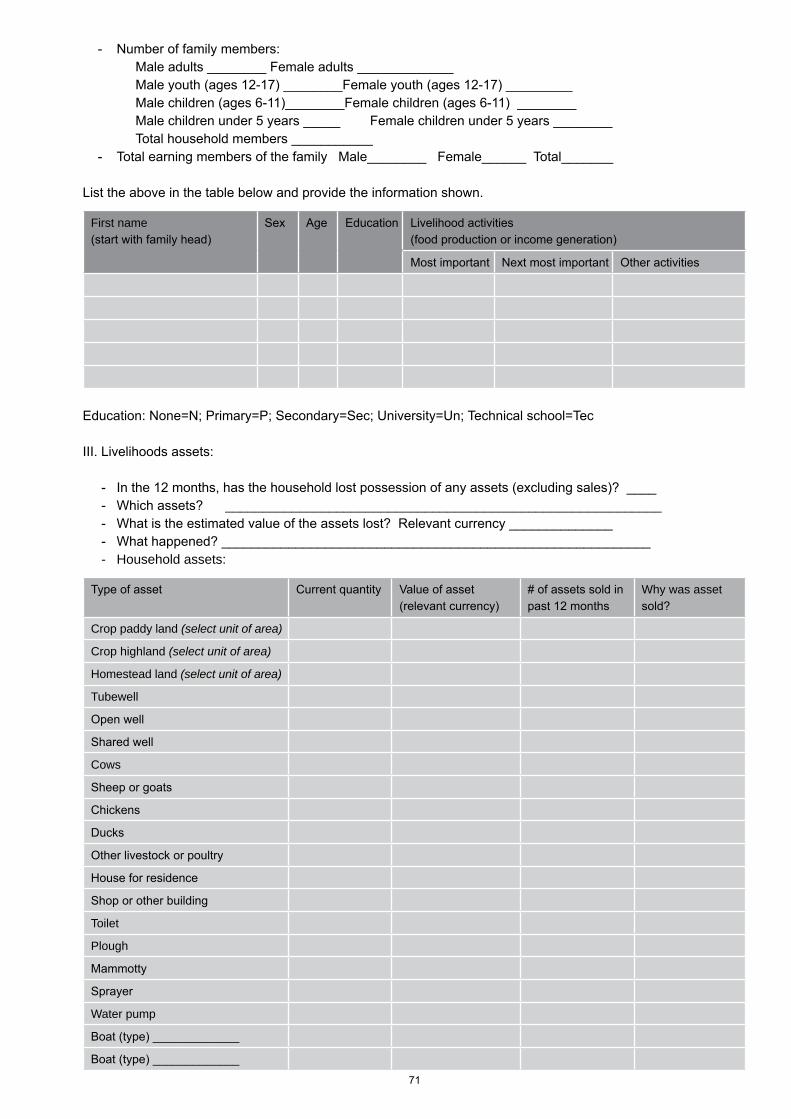
71
- Number of family members: Male adults ________ Female adults _____________ Male youth (ages 12-17) ________Female youth (ages 12-17) _________ Male children (ages 6-11)________Female children (ages 6-11) ________ Male children under 5 years _____ Female children under 5 years ________ Total household members ___________ - Total earning members of the family Male________ Female______ Total_______
List the above in the table below and provide the information shown.
First name (start with family head)
Sex Age Education Livelihood activities (food production or income generation)
Most important Next most important Other activities
Education: None=N; Primary=P; Secondary=Sec; University=Un; Technical school=Tec
III. Livelihoods assets:
- In the 12 months, has the household lost possession of any assets (excluding sales)? ____ - Which assets? ___________________________________________________________ - What is the estimated value of the assets lost? Relevant currency ______________ - What happened? __________________________________________________________ - Household assets:
Type of asset Current quantity Value of asset (relevant currency)
# of assets sold in past 12 months
Why was asset sold?
Crop paddy land (select unit of area)
Crop highland (select unit of area)
Homestead land (select unit of area)
Tubewell
Open well
Shared well
Cows
Sheep or goats
Chickens
Ducks
Other livestock or poultry
House for residence
Shop or other building
Toilet
Plough
Mammotty
Sprayer
Water pump
Boat (type) _____________
Boat (type) _____________
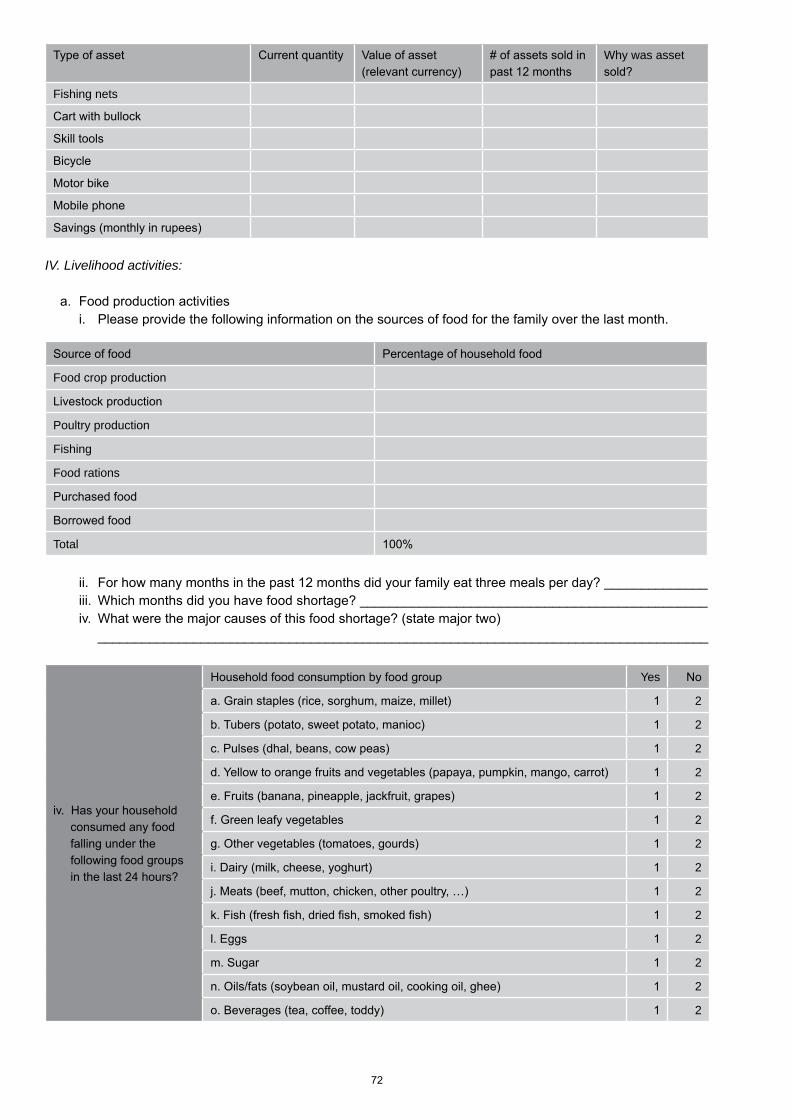
72
Type of asset Current quantity Value of asset (relevant currency)
# of assets sold in past 12 months
Why was asset sold?
Fishing nets
Cart with bullock
Skill tools
Bicycle
Motor bike
Mobile phone
Savings (monthly in rupees)
IV. Livelihood activities:
a. Food production activities i. Please provide the following information on the sources of food for the family over the last month.
Source of food Percentage of household food
Food crop production
Livestock production
Poultry production
Fishing
Food rations
Purchased food
Borrowed food
Total 100%
ii. For how many months in the past 12 months did your family eat three meals per day? ______________ iii. Which months did you have food shortage? _______________________________________________ iv. What were the major causes of this food shortage? (state major two) ___________________________________________________________________________________
iv. Has your household consumed any food falling under the following food groups in the last 24 hours?
Household food consumption by food group Yes No
a. Grain staples (rice, sorghum, maize, millet) 1 2
b. Tubers (potato, sweet potato, manioc) 1 2
c. Pulses (dhal, beans, cow peas) 1 2
d. Yellow to orange fruits and vegetables (papaya, pumpkin, mango, carrot) 1 2
e. Fruits (banana, pineapple, jackfruit, grapes) 1 2
f. Green leafy vegetables 1 2
g. Other vegetables (tomatoes, gourds) 1 2
i. Dairy (milk, cheese, yoghurt) 1 2
j. Meats (beef, mutton, chicken, other poultry, …) 1 2
k. Fish (fresh fish, dried fish, smoked fish) 1 2
l. Eggs 1 2
m. Sugar 1 2
n. Oils/fats (soybean oil, mustard oil, cooking oil, ghee) 1 2
o. Beverages (tea, coffee, toddy) 1 2
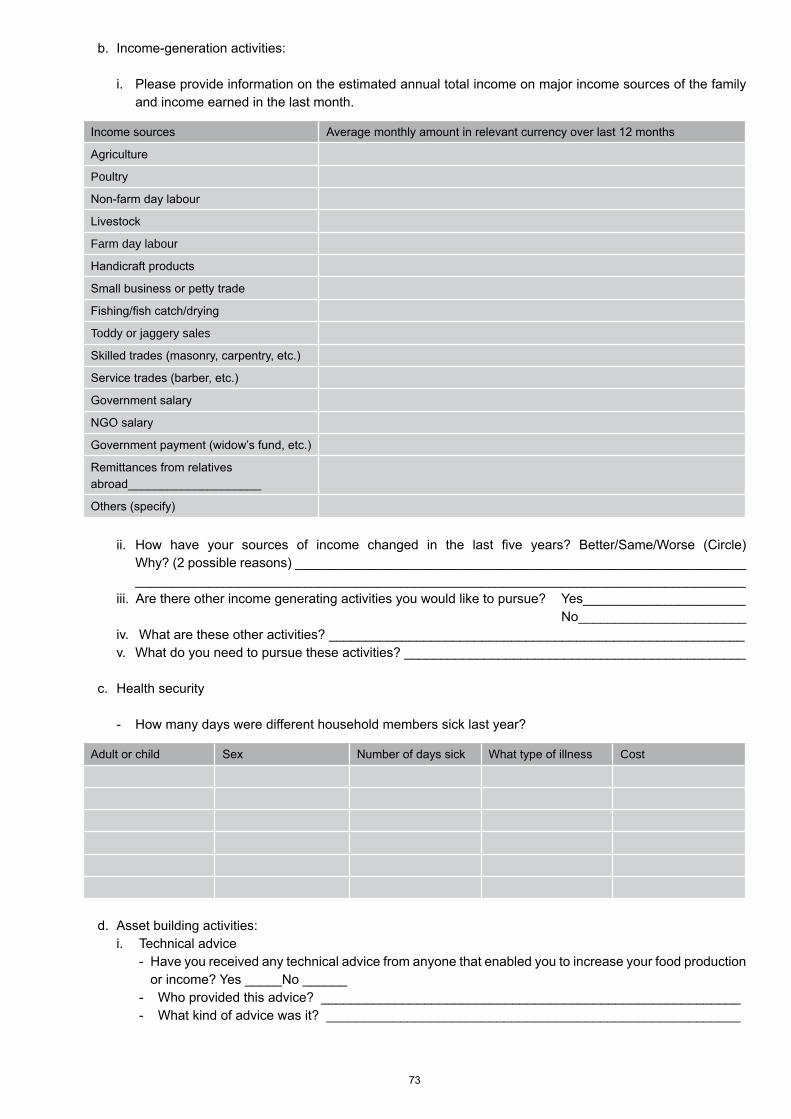
73
b. Income-generation activities: i. Please provide information on the estimated annual total income on major income sources of the family
and income earned in the last month.
Income sources Average monthly amount in relevant currency over last 12 months
Agriculture
Poultry
Non-farm day labour
Livestock
Farm day labour
Handicraft products
Small business or petty trade
Fishing/fish catch/drying
Toddy or jaggery sales
Skilled trades (masonry, carpentry, etc.)
Service trades (barber, etc.)
Government salary
NGO salary
Government payment (widow’s fund, etc.)
Remittances from relatives abroad____________________
Others (specify)
ii. How have your sources of income changed in the last five years? Better/Same/Worse (Circle) Why? (2 possible reasons) ________________________________________________________________________________________________________________________________________________
iii. Are there other income generating activities you would like to pursue? Yes______________________ No_______________________
iv. What are these other activities? _________________________________________________________ v. What do you need to pursue these activities? _______________________________________________
c. Health security
- How many days were different household members sick last year?
Adult or child Sex Number of days sick What type of illness Cost
d. Asset building activities: i. Technical advice - Have you received any technical advice from anyone that enabled you to increase your food production
or income? Yes _____No ______ - Who provided this advice? _________________________________________________________ - What kind of advice was it? ________________________________________________________
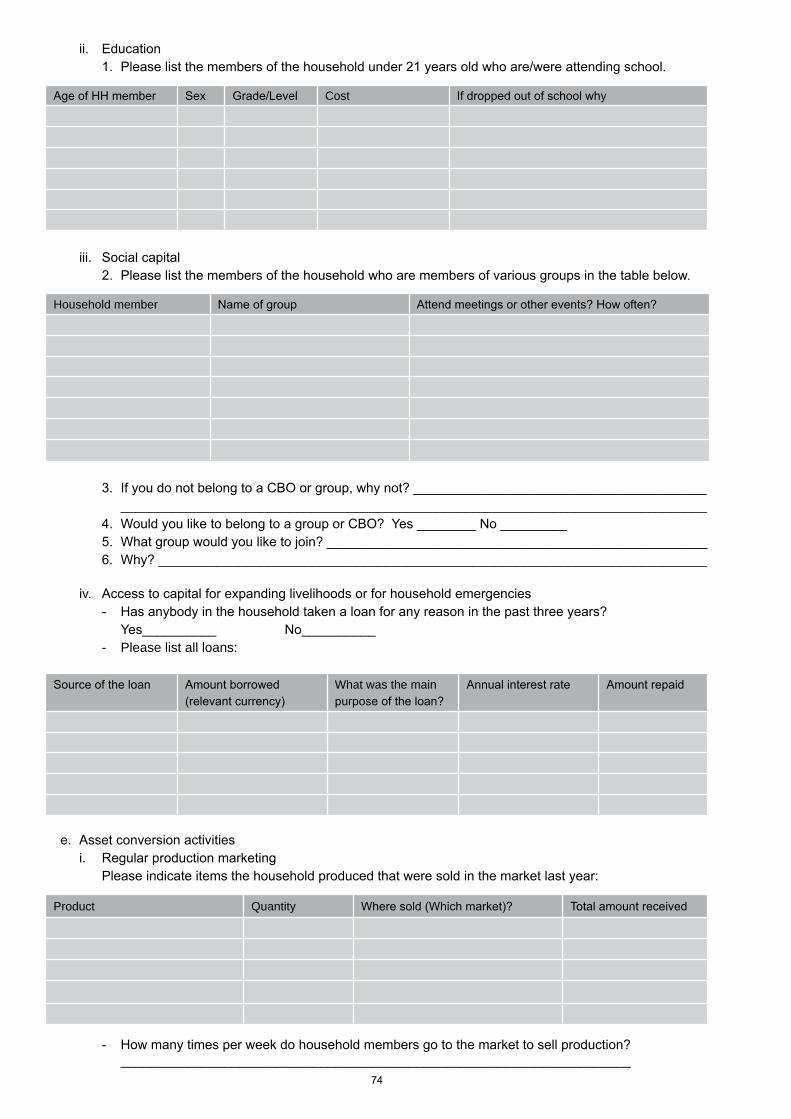
74
ii. Education 1. Please list the members of the household under 21 years old who are/were attending school.
Age of HH member Sex Grade/Level Cost If dropped out of school why
iii. Social capital 2. Please list the members of the household who are members of various groups in the table below.
Household member Name of group Attend meetings or other events? How often?
3. If you do not belong to a CBO or group, why not? ________________________________________ ________________________________________________________________________________ 4. Would you like to belong to a group or CBO? Yes ________ No _________ 5. What group would you like to join? ____________________________________________________ 6. Why? ___________________________________________________________________________
iv. Access to capital for expanding livelihoods or for household emergencies - Has anybody in the household taken a loan for any reason in the past three years? Yes__________ No__________ - Please list all loans:
Source of the loan Amount borrowed(relevant currency)
What was the main purpose of the loan?
Annual interest rate Amount repaid
e. Asset conversion activities i. Regular production marketing Please indicate items the household produced that were sold in the market last year:
Product Quantity Where sold (Which market)? Total amount received
- How many times per week do household members go to the market to sell production? _____________________________________________________________________
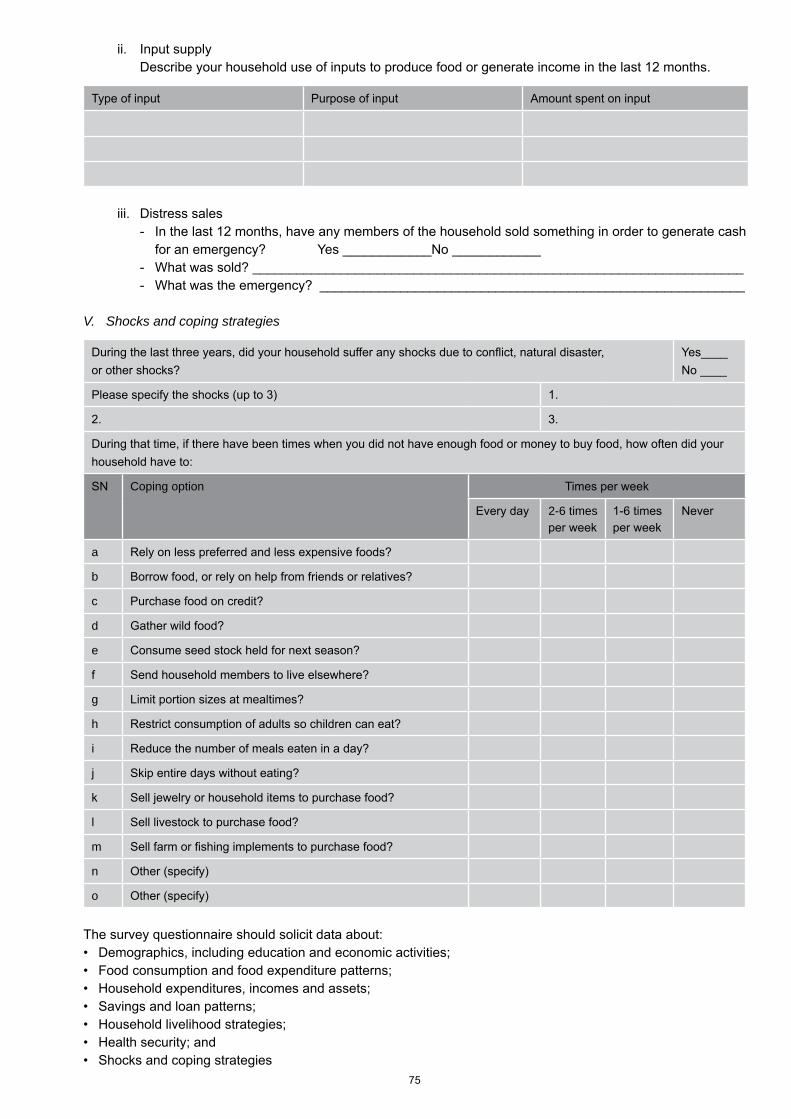
75
ii. Input supply Describe your household use of inputs to produce food or generate income in the last 12 months.
Type of input Purpose of input Amount spent on input
iii. Distress sales - In the last 12 months, have any members of the household sold something in order to generate cash
for an emergency? Yes ____________No ____________ - What was sold? ___________________________________________________________________ - What was the emergency? __________________________________________________________
V. Shocks and coping strategies
During the last three years, did your household suffer any shocks due to conflict, natural disaster, or other shocks?
Yes____No ____
Please specify the shocks (up to 3) 1.
2. 3.
During that time, if there have been times when you did not have enough food or money to buy food, how often did your household have to:
SN Coping option Times per week
Every day 2-6 times per week
1-6 times per week
Never
a Rely on less preferred and less expensive foods?
b Borrow food, or rely on help from friends or relatives?
c Purchase food on credit?
d Gather wild food?
e Consume seed stock held for next season?
f Send household members to live elsewhere?
g Limit portion sizes at mealtimes?
h Restrict consumption of adults so children can eat?
i Reduce the number of meals eaten in a day?
j Skip entire days without eating?
k Sell jewelry or household items to purchase food?
l Sell livestock to purchase food?
m Sell farm or fishing implements to purchase food?
n Other (specify)
o Other (specify)
The survey questionnaire should solicit data about:• Demographics, including education and economic activities;• Food consumption and food expenditure patterns;• Household expenditures, incomes and assets;• Savings and loan patterns;• Household livelihood strategies;• Health security; and• Shocks and coping strategies
76
CRISTAL: a community-based risk screening tool
77
The following is quoted directly from (http://www.mangrovesforthefuture.org/Assets/documents/RTC-Semarang-18-11-2008/Document/RTC-Coastal%20Climate%20Change%20considerations%20and%20Disaster%20Risk%20Reduction/RTC-Summary%20of%20CRISTAL%20(April%205%2007)-18-11-2008.pdf and Hammill, A., www.c3d-unitar.org/c3d_private/modules/knowledgebox/io/file.php-).?entry=235&field=1-).
Ecosystem management and restoration can reduce vulnerability to climate-related disasters but climate-related disasters will worsen. In this context, IUCN, the International Institute for Sustainable Development (IISD), the Stockholm Environmental Institute (SEI-US) and Intercooperation - the Swiss Foundation for Development and International Cooperation developed a decision-support tool called CRISTAL19 to help project planners and managers better understand the links between climate change, livelihoods, and their work. By focusing on community-level projects, CRiSTAL promotes the development of adaptation strategies based on local conditions, strengths and needs. Its goal is to promote the integration of climate change adaptation into community-level projects (Hammill, A., www.c3d-unitar.org/c3d_private/modules/knowledgebox/io/file.php?entry=235&field=1-).
CRISTAL seeks to: help users to understand systematically the links between livelihoods and climate; •enable users to assess a project’s impact on community-level adaptive capacity; and •assist users in making project adjustments to improve its impact on adaptive capacity. •
Designed for community-level project designers and managers, it is user-friendly and offers multiple formats and as part of a suite of tools (Hammill, A., www.c3d-unitar.org/c3d_private/modules/knowledgebox/io/file.php?entry=235&field=1 -).
CRISTAL intends to enhance local adaptive capacity through a better understanding of:
how current climate hazards and climate change affect a project area and local livelihoods; •how people cope, looking specifically at the resources needed to cope with climate stress;•how project activities affect livelihood resources that are vulnerable to climate risk and/or important to local •coping strategies; and how project activities can be adjusted so they adaptive capacity.•
CRISTAL is designed around two modules. The first module synthesises information about climate and livelihoods. It asks two questions:• What is the climate context, examining the impacts of climate change, current hazards, the impacts of hazards
and copies strategies. • What is livelihood context, examining resources, how they are affected by hazards, how important they
are to coping.
Module 2 plans and manages projects for adaptation. Again, it asks two questions:• What are the impacts of project activities on livelihood resources that are a) vulnerable to climate risks; and b)
important to coping.• How can project activities be adjusted to reduce vulnerability and enhance adaptive capacity, and looks at
synergies and barriers.
CRISTAL has been field tested in planned or ongoing natural resource management projects in Mali, Bangladesh, Tanzania, Nicaragua and Sri Lanka.
CRISTAL can be downloaded from http://www.sei-us.org/Cristal/Cristal_Setup.exe.
19 http://www.mangrovesforthefuture.org/Assets/documents/RTC-Semarang-18-11-2008/Document/RTC-Coastal%20Climate%20Change%20considerations%20and%20Disaster%20Risk%20Reduction/RTC-Summary%20of%20CRISTAL%20(April%205%2007)-18-11-2008.pdf
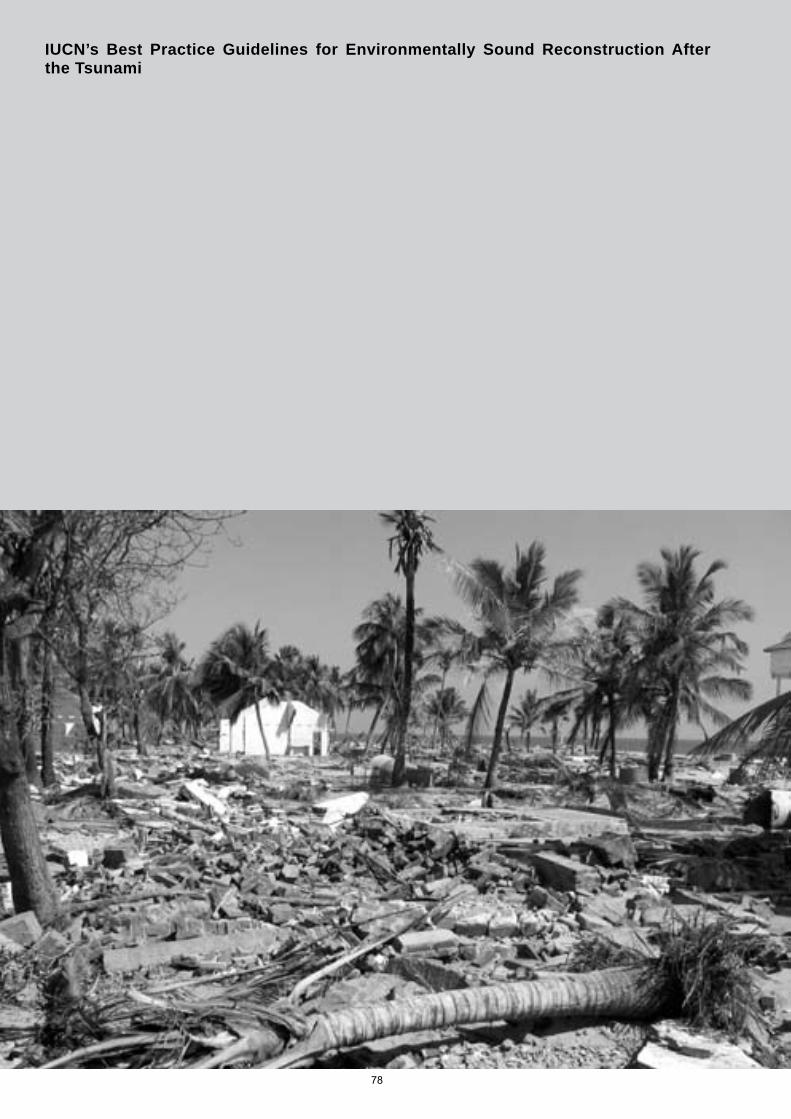
78
IUCN’s Best Practice Guidelines for Environmentally Sound Reconstruction After the Tsunami
79
After the Indian Ocean tsunami of December 2004, IUCN Sri Lanka was requested by various government agencies to produce some documentation on introducing environmental safeguards into post-tsunami reconstruction. A series of 14 best practice guidelines20 were produced, published and disseminated in both national languages as well as in English. The guidelines presented the issues, impacts, the need, guiding principles and key steps to follows for a series of 14 topics: 1) Where to build; 2) Invasive alien species; 3) Materials for reconstruction; 4) Beach clean ups; 5) Solid waste management; 6) Recovery of marine ecosystems; 7) Restoring tourism; 8) Preparing for natural disasters; 9) Environmental laws; 10) Restoring terrestrial ecosystems; 11) Water pollution; 12) Restoring wetlands; 13) Restoring home gardens and 14) Safeguarding marine protected areas.
These guidelines can be adapted easily to fit a specific situation in a specific locale.
Series on Best Practice Guidelines (Sri Lanka) Information paper No. 1 After the tsunami: where to reconstruct environmental issues
The issues:Environmental concerns are not receiving adequate attention in the process of identifying locations for reconstruction and resettlement. • There is an urgent need to rehabilitate displaced human communities and set them on the path to sustainable
lives and livelihoods.A coastal no-build zone of 100m in the south and west and 200m in the north and east has been proposed •by the government.The government of Sri Lanka and other parties are seeking actively suitable land for construction and •alternate building areas.A danger and immediate threat to ecologically and economically important sites such as wetlands and •mangroves could be posed if they are cleared to provide relocation sites for temporary and permanent housing. If this is within or near protected areas, this is illegal under various laws of the country (the Fauna and Flora Protection Ordinance, the Forest Ordinance, the Coast Conservation Act and the National Environmental Act, among other laws).Many state and non-governmental agencies as well as many private individuals are working on reconstruction •and restoration. Knowledge about existing zoning laws and protected habitats is not circulated adequately. Therefore, laws are not always enforced.
The impacts:Habitats such as mangroves are home to a wide range of economically and ecologically important species •such as fish and crustaceans. They provide a range of livelihoods for coastal communities. Already damaged by the tsunami, further loss and clearing of mangroves will, in the long term, worsen the living conditions of coastal communities.Mangroves buffer the coastline against extreme weather and thereby prevent erosion, limit salt-water intrusion •and protect communities against tidal surges and storms. Further loss of coastal vegetation will leave coastal communities even more vulnerable to recurrent extreme weather events such as cyclones and storms.Low lying wetlands function like sponges to retain water and prevent floods. They also trap and retain sediments •that are washed off to the sea from rivers. Wetlands also purify water by filtering sediments and decomposing matter and converting them into usable nutrients. Construction on wetlands could result in flash floods, loss of topsoil, increased sedimentation and a very quick reduction in the capacity of the ecosystem to support coastal livelihoods.Construction on low-lying wetlands would also cause changes to the water-table by reducing the amount of •water retained and reducing the amount that reaches deep. This could lead to increased water-shortage during periods of drought.Construction in wetland areas would reduce drainage and increase the likelihood of flooding.•Housing in wetland areas where water is usually stagnant could also increase diseases such as those that are •borne by mosquitoes.Haphazard and unplanned building will worsen the above impacts.•
20 Citation: IUCN (2005). http://data.iucn.org/places/asia/coastalinfo/best_practise.htm
80
The need:There is an urgent need to select construction sites based on sound guidelines that also integrate environmental concerns. Ensuring that natural ecosystems are not destroyed is essential to securing sustainable livelihoods for coastal populations. Natural ecosystems are also vital in protecting human settlements and maintaining essential services such as flood and storm protection, water supply and quality and easing the effects of floods.
Guiding principles:Uphold and follow the existing laws and policies that relate to environmental management and protection.•Avoid clearing ecologically sensitive sites such as mangroves, scrubland and forests.•Avoid building on/filling lowland wetlands and watershed areas.•Minimise destruction by clearing only the essential, minimal area for each building.•Ensure that natural water courses, watershed areas, flood plains, etc. are not blocked by construction.•Make efforts to restore and conserve ecosystems as part of the reconstruction process.•Integrate environmental concerns in development. The methodology for carrying out very rapid Initial •Environmental Examinations (RIEE) is currently available. It is advisable that such RIEEs should be carried out prior to reconstruction.
Key steps:Prior to selecting sites for construction, consult the Urban Development Authority (UDA) - which has offices in •affected districts - to identify whether the site is ecologically sensitive. (See Box 1 for details.) Consult the Coast Conservation Department (CCD) if the proposed construction is within 300m of the Mean •High Water Line (MHWL). (See Box 3 for details.)Consult the Forest Department if the proposed construction is close to a forest area and/or on mangrove/•wetland state land. (See Box 2 & 3 for a list of proposed conservation areas and details.)Construction within nature reserves protected by the Department of Wildlife Conservation (DWC) (Strict Natural •Reserves, National Parks, Nature reserves, Jungle corridor refuges and Marine reserves) is prohibited. (See Box 2 for a list of protected areas in affected districts.)Consult the DWC if proposed constructions are within a Sanctuary or Buffer zone. (See Box 3.)•Consult the CEA/DWC if proposed constructions are within 200m radius of a Sanctuary or one kilometre •radius of any other protected area.Construction within a buffer zone needs approval under the National Environmental Act. Consult the CEA. •(See Box 3 for details.)Involve affected communities in the process of reconstruction, and invest in providing alternate livelihoods and •immediate source of income as part of the reconstruction process.
Box 1 provided information on the following, related to the UDA:
Location District Name of officer-in-charge Address Contact details
Box 2 detailed protected areas in coastal districts affected by the tsunami:
District Name Status
Protected Areas under the Department of Wildlife Conservation (Source: Department of Wildlife Conservation)
Box 3 gave contact details of focal personnel in relevant organisation such as:
The Urban Development Authority;•The Central Environmental Authority;•The Forest Department;•The Department of Wildlife Conservation;•Coast Conservation Department;•IUCN.•
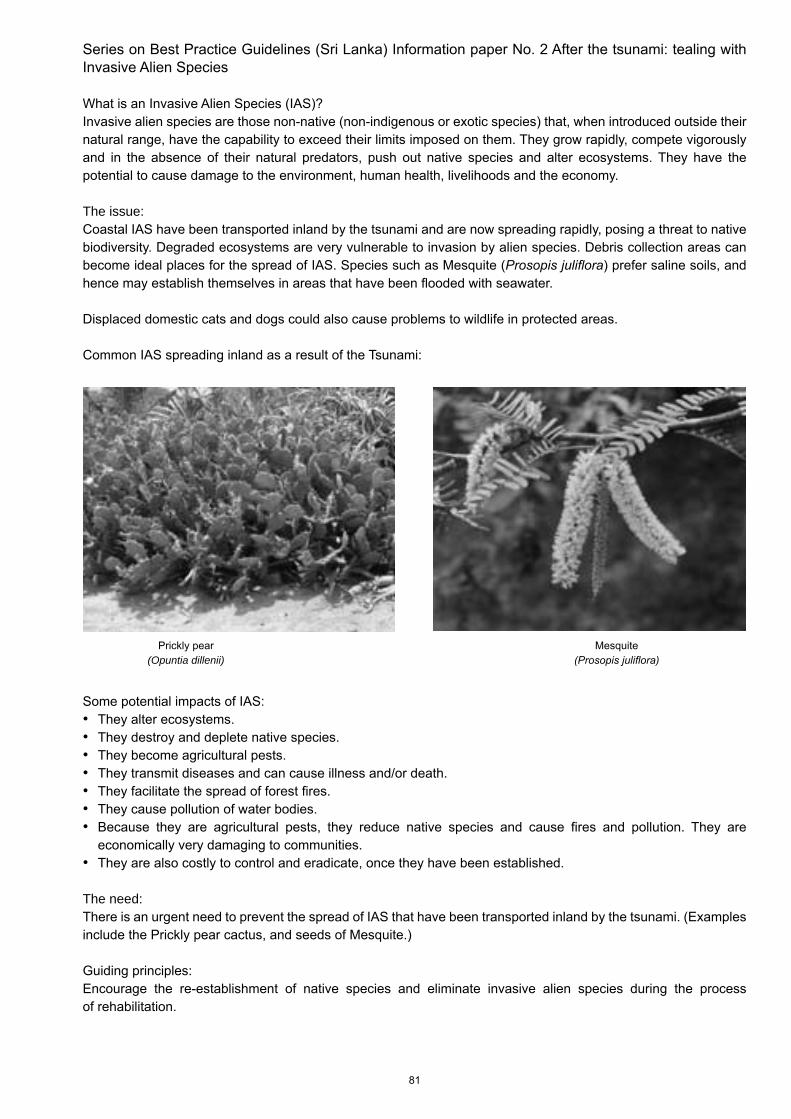
81
Series on Best Practice Guidelines (Sri Lanka) Information paper No. 2 After the tsunami: tealing with Invasive Alien Species
What is an Invasive Alien Species (IAS)?Invasive alien species are those non-native (non-indigenous or exotic species) that, when introduced outside their natural range, have the capability to exceed their limits imposed on them. They grow rapidly, compete vigorously and in the absence of their natural predators, push out native species and alter ecosystems. They have the potential to cause damage to the environment, human health, livelihoods and the economy.
The issue:Coastal IAS have been transported inland by the tsunami and are now spreading rapidly, posing a threat to native biodiversity. Degraded ecosystems are very vulnerable to invasion by alien species. Debris collection areas can become ideal places for the spread of IAS. Species such as Mesquite (Prosopis juliflora) prefer saline soils, and hence may establish themselves in areas that have been flooded with seawater.
Displaced domestic cats and dogs could also cause problems to wildlife in protected areas.
Common IAS spreading inland as a result of the Tsunami:
Prickly pear (Opuntia dillenii)
Mesquite(Prosopis juliflora)
Some potential impacts of IAS:They alter ecosystems.•They destroy and deplete native species.•They become agricultural pests.•They transmit diseases and can cause illness and/or death.•They facilitate the spread of forest fires.•They cause pollution of water bodies.•Because they are agricultural pests, they reduce native species and cause fires and pollution. They are •economically very damaging to communities.They are also costly to control and eradicate, once they have been established.•
The need:There is an urgent need to prevent the spread of IAS that have been transported inland by the tsunami. (Examples include the Prickly pear cactus, and seeds of Mesquite.)
Guiding principles:Encourage the re-establishment of native species and eliminate invasive alien species during the process of rehabilitation.
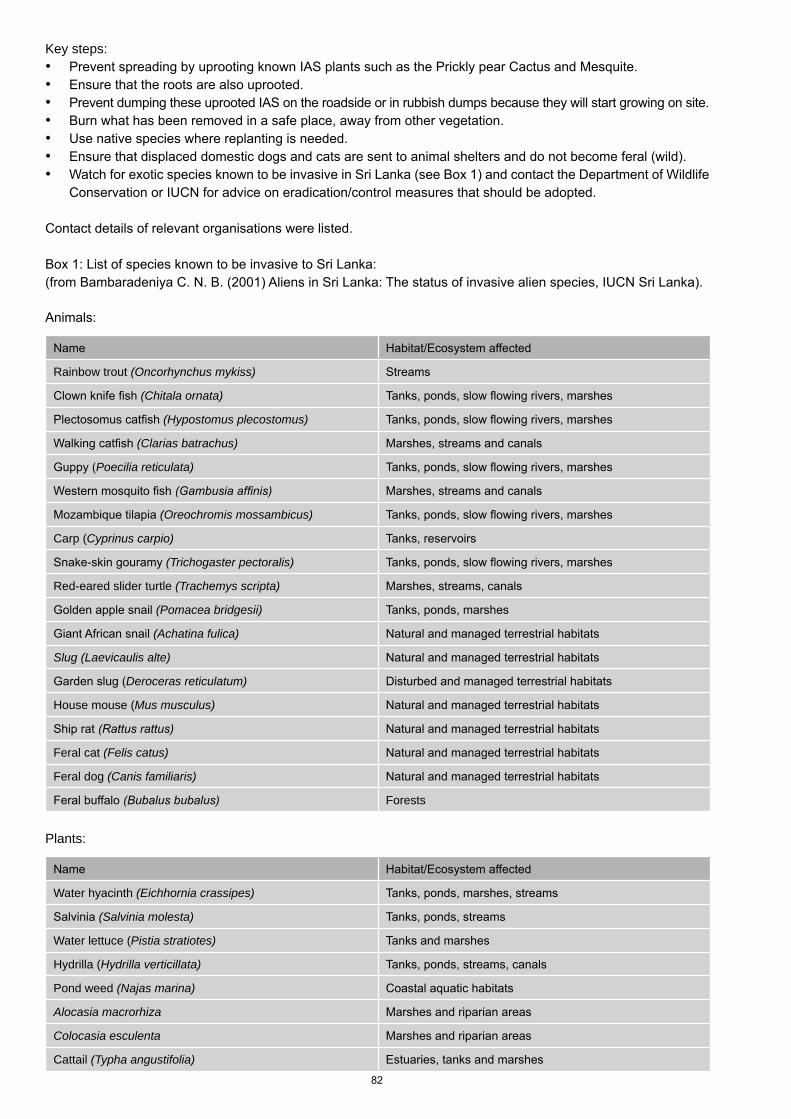
82
Key steps:Prevent spreading by uprooting known IAS plants such as the Prickly pear Cactus and Mesquite.•Ensure that the roots are also uprooted.•Prevent dumping these uprooted IAS on the roadside or in rubbish dumps because they will start growing on site.•Burn what has been removed in a safe place, away from other vegetation.•Use native species where replanting is needed.•Ensure that displaced domestic dogs and cats are sent to animal shelters and do not become feral (wild). •Watch for exotic species known to be invasive in Sri Lanka (see Box 1) and contact the Department of Wildlife •Conservation or IUCN for advice on eradication/control measures that should be adopted.
Contact details of relevant organisations were listed.
Box 1: List of species known to be invasive to Sri Lanka:(from Bambaradeniya C. N. B. (2001) Aliens in Sri Lanka: The status of invasive alien species, IUCN Sri Lanka).
Animals:
Name Habitat/Ecosystem affected
Rainbow trout (Oncorhynchus mykiss) Streams
Clown knife fish (Chitala ornata) Tanks, ponds, slow flowing rivers, marshes
Plectosomus catfish (Hypostomus plecostomus) Tanks, ponds, slow flowing rivers, marshes
Walking catfish (Clarias batrachus) Marshes, streams and canals
Guppy (Poecilia reticulata) Tanks, ponds, slow flowing rivers, marshes
Western mosquito fish (Gambusia affinis) Marshes, streams and canals
Mozambique tilapia (Oreochromis mossambicus) Tanks, ponds, slow flowing rivers, marshes
Carp (Cyprinus carpio) Tanks, reservoirs
Snake-skin gouramy (Trichogaster pectoralis) Tanks, ponds, slow flowing rivers, marshes
Red-eared slider turtle (Trachemys scripta) Marshes, streams, canals
Golden apple snail (Pomacea bridgesii) Tanks, ponds, marshes
Giant African snail (Achatina fulica) Natural and managed terrestrial habitats
Slug (Laevicaulis alte) Natural and managed terrestrial habitats
Garden slug (Deroceras reticulatum) Disturbed and managed terrestrial habitats
House mouse (Mus musculus) Natural and managed terrestrial habitats
Ship rat (Rattus rattus) Natural and managed terrestrial habitats
Feral cat (Felis catus) Natural and managed terrestrial habitats
Feral dog (Canis familiaris) Natural and managed terrestrial habitats
Feral buffalo (Bubalus bubalus) Forests
Plants:
Name Habitat/Ecosystem affected
Water hyacinth (Eichhornia crassipes) Tanks, ponds, marshes, streams
Salvinia (Salvinia molesta) Tanks, ponds, streams
Water lettuce (Pistia stratiotes) Tanks and marshes
Hydrilla (Hydrilla verticillata) Tanks, ponds, streams, canals
Pond weed (Najas marina) Coastal aquatic habitats
Alocasia macrorhiza Marshes and riparian areas
Colocasia esculenta Marshes and riparian areas
Cattail (Typha angustifolia) Estuaries, tanks and marshes
83
Plants contd.
Name Habitat/Ecosystem affected
Phragmites karka Marshes, riverbanks
Annona glabra Coastal lagoons, marshes, riverbanks, stream banks
Cocklebur (Xanthium indicum) Marshes, villus, tank margins
Dillenia suffruticosa Marshes, streambanks, riverbanks
Giant sensitive plant (Mimosa pigra) Riverbanks
Alligator weed (Alternanthera philoxeroides) Fallow fields, marshy/riparian areas
Prickly Lantana (Lantana camera) Shrub Scrubland, degraded open forests
Gorse (Ulex europae) Montane forests, wet grasslands
Mistflower (Eupatorium riparium) Shrub Montane forests
Siam weed (Chromolaena odorata) Forest edge and pathways
Cestrum aurantium Shrub Montane forests
Mesquite (Prosopis juliflora) Thorn scrublands
Prickly pear cactus (Opuntia dillennii) Thorn scrublands
Koster’s curse (Clidemia hirta) Rainforests
Mahogany (Swietenia macrophylla) Disturbed forests
Mimosa invisa Disturbed forests
Ipil ipil (Leucaena leucocephala) Dry-mixed evergreen forests
Clusia rosea Rock outcrop in forests
Congress weed (Parthenium hysterophorus) Fallow fields, marshy areas
Wedelia (Wedelia trilobata) Forest edge
Myroxylon balsamum Dry-mixed evergreen forests
Velvet plant (Miconia calvescens) Disturbed forests
Tithonia diversifolia Secondary forests
Mile-a-minute weed (Mikania micrantha) Disturbed forests and scrubland
Strawberry guava (Psidium littorale) Montane forests
Alstonia macrophylla Secondary forests
Millingtonia hortensis Disturbed forests and scrubland
Imperata cylindrical Disturbed forests and scrubland
Guinea grass (Panicum maximum) Disturbed forests and scrubland
Fern (Pteridium aquilinum) Disturbed montane forests and wet grasslands
Series on Best Practice Guidelines (Sri Lanka) Information paper No. 3: After the tsunami: materials for reconstruction
The issues:Present post-tsunami clearing up and reconstruction efforts may have an adverse impact on the environment and therefore on human well-being.
There is an urgent need to reconstruct almost 80,000 completely destroyed and more than 40,000 partially •destroyed housing units, as well as schools, private and public sector buildings.The construction process itself, as well as human settlements, could give rise to undesirable environmental impacts. •This massive reconstruction process is leading to an enormous increase in the demand for building materials.•As a consequence of this increased demand, there is a sudden and excessive demand for natural resources •such as sand, clay, timber, metal aggregates, coral-based lime, etc.There is already a ban on coastal sand and coral mining and a restriction on river sand mining. The increased •demand for these natural resources is likely to cause an increase in illegal activities.There is a moratorium on logging of timber in forest reserves. The increased demand for timber (for temporary •housing) is already resulting in the clearance of ecologically sensitive areas such as mangroves and may cause an increase in illegal tree felling.It is illegal to clear mangroves, wetlands and forests on state land•
84
The impacts:Extraction of river and coastal sea sand will intensify coastal erosion and seawater moving up rivers •(saline intrusion). Untouched sand dunes provide protection to the coastline. Extraction of sand from these sand dunes will, again, •intensify erosion and leave coastal communities more vulnerable to extreme weather events.Coral reefs, which have been damaged and are already stressed from the impacts of the tsunami, will be •under increased pressure by coral extraction. This would have serious negative impacts, as reefs are known to absorb the majority of wave energy. They not only protect the shoreline from erosion but also build up beaches (accretion) over many centuries.Further damage to coral reefs through extraction for lime will affect and retard the restoration of livelihoods in •coastal communities as part of the ecosystem on which they depend will be destroyed. Destruction of the existing tree stands for timber will, again leave the coastline and coastal communities more •vulnerable to natural disasters. There are clear data to prove that large mangrove stands functioned to reduce the impacts of the tsunami.Destruction of mangroves affects the retention of floodwater and increases surface water run off. This will •intensify extreme floods in urban areas.Increased extraction of clay and to a lesser extent metal aggregates would involve the clearing of more vegetation •leaving soil exposed to erosion.All of the above leaves the coastline and coastal communities more vulnerable to recurrent natural disasters •such as cyclones, heavy storms, floods and droughts.
The need:There is an urgent need to ensure that post-tsunami reconstruction does not further damage already affected ecosystems, which in turn affects coastal communities that are dependent on these ecosystems for their livelihoods.
Guiding principles:Reconstruct according to sound land use principles, based on minimum land use and minimum environmental •impact at an acceptable cost.Follow proper building design and construction practices, including respecting relevant laws and policies.•Reconstruct in a manner that does not further damage the environment.•Environmentally friendly alternatives should be used as raw materials wherever possible for reconstruction.•Ensure that from the beginning, relevant government departments - such as the Coast Conservation Department, •Central Environmental Authority, the Forest Department, the Department of Wildlife Conservation and the Urban Development Authority - are consulted.Ensure that from the beginning, government agencies, local communities, local and national NGOs, humanitarian •and donor agencies etc. integrate environmental concerns into reconstruction.
Key steps to be taken:Immediately stop extraction of coastal sand and coral, and any illegal river sand mining. •Reuse and recycle as much building material as possible. For example, concrete debris could be crushed and •used as a coarse base for road reconstruction, intact tiles can be reused etc.Encourage the use of environmentally friendly alternatives such as recycled wood, recycled glass; use masonry •cement for plastering, etc.Use alternatives to tropical hardwood timber, for example, plantation timber or timber aggregates.•As an immediate measure, explore the possibility of using offshore sand already extracted.•Consult the Central Environmental Authority, Coast Conservation Department and the Geological Survey and •Mines Bureau to explore the possibility of extracting sea sand by offshore dredging and to identify sites that are not environmentally sensitive for offshore dredging.Identify metal aggregate quarry sites (for producing both coarse and fine aggregate) that would cause minimal •environmental damage. Recruit affected communities for the process of reconstruction, thus providing alternate livelihoods and immediate •sources of income.
(Contact details of focal persons in relevant officers were given.)
85
Series on Best Practice Guidelines (Sri Lanka) Information paper No. 4: After the tsunami: cleaning up reefs and beaches
The issues:Coral reefs have been damaged by the tsunami in a variety of ways. Abundant debris and litter on and adjacent to the reefs is causing additional damage.
In some areas, the receding tsunami waters carried with them waste and debris from land. Much of this debris •(both organic and human-made) has been deposited on coral reefs and beaches. Debris can physically damage the reef structures and can also stress the corals, preventing successful recovery •of these important marine ecosystems. Debris and litter on beaches is an eyesore and discourages tourists. It can also injure people walking •on the beach.Human-made litter can be consumed by living organisms, with sometimes fatal consequences, or it can form •potentially lethal obstacles, either causing entrapment or physical harm.
The impacts:Coral reef ecosystems provide habitats, breeding and feeding grounds for many important species of fish •harvested for commercial purposes or as food for families. The livelihoods of many coastal communities already affected by the tsunami in the short term through loss of gear and materials, can therefore also be seriously affected in the longer term by damage to the ecosystem that sustains them. Clean beaches and healthy coral reefs are vital for tourism. Tourism is the fourth largest contributor to Sri •Lanka’s GDP and brought in a revenue of nearly 400 million USD in 2004. About 50% of the registered hotels in affected areas in Sri Lanka were damaged by the tsunami and income from tourism has dropped sharply with losses estimated between 65 - 130 million USD. Debris-filled beaches and coral reefs will retard seriously the revival of coastal tourism, and the much needed revenue this brings to coastal communities.Reefs protect low lying coastal areas from extreme, recurrent weather events such as tropical storms and •cyclones. Damage to these reefs will leave coastal communities vulnerable to recurrent natural disasters and will, therefore, weaken community development.Reef systems act as buffers, protecting coastal areas from erosion. Depleted reef areas can lead to coastal •erosion, which will adversely affect livelihoods and infrastructure.
The need:There is an urgent need to remove the debris and litter that has been deposited on the reefs and beaches as this is preventing the natural recovery of the coral reef ecosystem and thereby retarding the restoration of the livelihoods of coastal communities.
Guiding principles:Ensure that reef clean-up operations are carried out under the guidance of experienced marine specialists. •Contact IUCN for further information and assistance in debris clearance. (See Box 1 for contact details.)Beaches with debris still remaining should be identified and cleaned. Care should be taken during the •reconstruction process not to leave additional debris on the beaches as this can create a negative visual impact, or can be washed into the sea and be deposited on the reefs.Plan, well beforehand, the clean up process so that the necessary equipment and the expertise are available •and necessary approvals obtained.Care and attention towards the living reef is vital – participants should be patient, and move in a slow, non-•destructive way, with the minimum of disturbance to the reef as possible. The cleanups should not cause additional stress to the reef.Human safety is also extremely important. A safety coordinator with first aid training should be appointed, •medical kits should be readily available, emergency telephone numbers should be known, and all participants should be briefed on working signals and any potential hazards.Debris should be sorted, separating recyclable components from non-biodegradable litter. All recyclable debris •should be separated and reused, and all other debris taken to official dumping grounds.Ensure that collected debris is taken away and disposed in designated disposal sites. A list of dumping •sites is given in Box 2. If you are uncertain about where debris should be taken, please check with the relevant authority.
86
Key steps (adapted from Good environmental practices: underwater cleanup: © CORAL)Snorkelling•
- Diving is not always necessary, but planning and setting protocols even when snorkeling is essential. Although snorkellers may work alone, they should follow the same basic safety protocols as divers, have the same cleanup targets, and take similar care of the reefs.
Planning the dive• - Always dive with a buddy and be sure to check equipment and review diver signals beforehand. - Make sure underwater conditions and weather are suitable for diving to ensure safety of divers and underwater
organisms.Gearing up•
In addition to normal dive gear, divers will need: - Mesh sacks; - Gloves for protection from rubbish and sharp objects; - Shears or scissors for cutting fishing line and tin cans.
Dive protocol• - Work slowly and carefully. - Dive in a head-down position with fins up to avoid making contact with the bottom. - Adjust buoyancy throughout the dive as collected garbage gets heavier. - Make sure equipment is secured and the mesh sack is held so that nothing can trail or snag on corals. - One diver should collect garbage with gloves on while another holds the mesh sack. - Place glass, needles and hooks inside other garbage for safety. - Never try to remove anything that cannot be easily lifted, such as tires or car batteries.
Cleanup targets• - Plastics, especially plastic bags; - Cloth items or rice sacks; - Fishing line, netting, and broken lobster pots or fish traps; - Batteries, bottles without marine growth, and tin cans; - Cigarette butts and bottle caps; - Concrete debris; - Wood from furniture, boats; - Organic debris.
What to remove and what to leave• - Be cautious not to remove articles that have already been incorporated into the reef and are helping to
support life.Check it before you bag it•
- Make sure nothing is living in or on each item before removal. - Do not remove bottles that are covered in growth. - Cut open tin cans to ensure that there is nothing living inside. - Hold cups or cans close to sandy parts of the sea bed and shake out sand or silt.
What to leave• - Anything that is ‘stuck’ or encrusted with growth; - Anything, no matter how ugly, which has become overgrown with marine life; - Anything that may be dangerous; - Heavy items - never use your buoyancy control device to lift heavy objects; - Metal drums and containers that might contain hazardous materials.
Plastic fishing line• - Never try to pull fishing lines free. Cut and remove it. - Use shears or scissors rather than a knife. - Wrap the line around an object or hand to control it.
After the dive• - Arrange for garbage to be collected or taken to an official site - do not leave it on the beach.
(Contact details of focal persons in relevant organisations were given.)
87
Series on Best Practice Guidelines (Sri Lanka) Information paper No. 5: After the tsunami: solid waste management
The issue:The recent tsunami damaged buildings, infrastructure and natural vegetation. The debris created from this damage has generated a considerable amount of solid waste, both biodegradable and non-biodegradable.
This solid waste needs to be cleared up and disposed of properly, ensuring that there is no further damage to •the environment.Under normal circumstances, certain wastes – such as hazardous and flammable wastes – are required to be •disposed with extra care. Such wastes released because of the tsunami from damaged industrial plants and fuel stations can be dangerous to human health and damaging to ecosystems. Solid waste can also serve as breeding grounds of disease vectors such as flies and other pests. Because of •this, debris from the tsunami can increase the spread of infectious diseases.Debris detracts from the beauty of the environment.•
The impacts:Dumping of debris into the sea and in lagoons will cause further damage to already damaged ecosystems •and will further retard the recovery of livelihoods such as fisheries that are dependent on the healthy functioning of these ecosystems.Dumping of debris in low lying wetlands will affect their ability to act like sponges to absorb the run off from •rainwater and damage the normal functioning of mangrove ecosystems, which have been proven to act as buffers to protect coastal communities against the action of waves. It will also increase the probability of floods during the rainy season.Debris that is contaminated with chemicals such as petrol, kerosene and diesel, as well as industrial chemicals •can contaminate ground water for many years to come and affect potable sources of water. Numerous coastal sources of fresh water - such as wells and tanks - have already suffered damage due to the infiltration of salt water from the tsunami waves. Already 62,000 wells and other sources of fresh water have been contaminated with salt water. Further contamination can place these communities at high risk from chemical poisoning.Chemical contamination of groundwater from solid waste, can lead to grave water shortages, particularly in arid •areas such as the Hambantota district that are already annually affected by drought. Biodegradable solid and liquid waste - from damaged sewage tanks and cesspits or overflowing mains or •waste material blocking water drainage systems and sewers - can seriously affect sanitation, and increase the risk of spreading water borne diseases such as typhoid, dysentery, cholera, respiratory tract infections and skin diseases.Hazardous wastes such as carcinogens in containers washed out by the tsunami, asbestos from roofs and •medical waste that has been displaced from disposal sites have the potential of causing cancers in the future.The communities most at risk will be those displaced and already severely disadvantaged. •Unsightly debris and dumping debris into the sea can retard the recovery of tourism, the fourth biggest contributor •to the GDP and an industry that supported both directly and indirectly a total of 130,000 jobs in 2004.
The need:There is an urgent need for solid waste to be disposed of effectively and efficiently, to carefully selected sites of disposal, in a manner that does not further damage livelihoods, affect human health or negatively impact the environment.
Guiding principles:Waste needs to be separated into biodegradable (vegetative) waste and non-biodegradable in a rapid manner. •Waste needs to be disposed of safely, both for humans and for the environment. •Recycle and reuse wherever possible.•
Key steps:Before disposing debris, contact the Central Environmental Authority for identification of recommended disposal •sites. (See Box 1 & 2 for details.)Prevent the irresponsible dumping of wastes.•
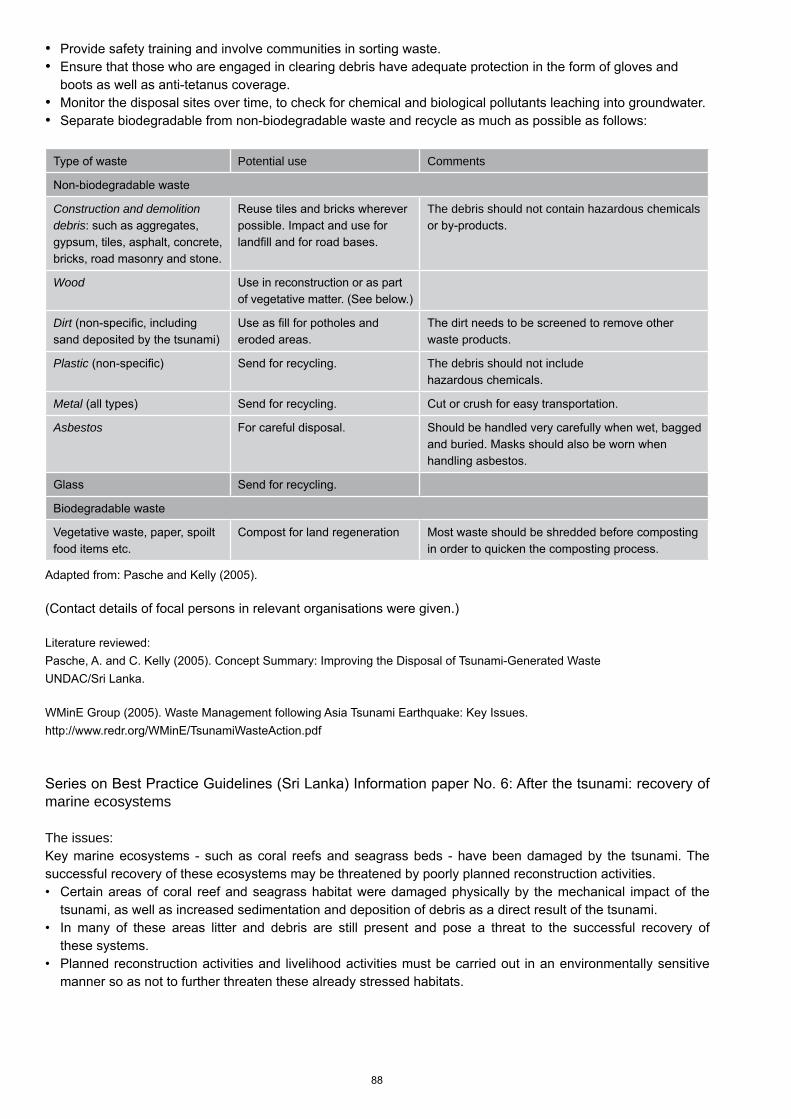
88
Provide safety training and involve communities in sorting waste.•Ensure that those who are engaged in clearing debris have adequate protection in the form of gloves and •boots as well as anti-tetanus coverage.Monitor the disposal sites over time, to check for chemical and biological pollutants leaching into groundwater. •Separate biodegradable from non-biodegradable waste and recycle as much as possible as follows:•
Type of waste Potential use Comments
Non-biodegradable waste
Construction and demolition debris: such as aggregates, gypsum, tiles, asphalt, concrete, bricks, road masonry and stone.
Reuse tiles and bricks wherever possible. Impact and use for landfill and for road bases.
The debris should not contain hazardous chemicals or by-products.
Wood Use in reconstruction or as part of vegetative matter. (See below.)
Dirt (non-specific, including sand deposited by the tsunami)
Use as fill for potholes and eroded areas.
The dirt needs to be screened to remove other waste products.
Plastic (non-specific) Send for recycling. The debris should not includehazardous chemicals.
Metal (all types) Send for recycling. Cut or crush for easy transportation.
Asbestos For careful disposal. Should be handled very carefully when wet, bagged and buried. Masks should also be worn when handling asbestos.
Glass Send for recycling.
Biodegradable waste
Vegetative waste, paper, spoilt food items etc.
Compost for land regeneration Most waste should be shredded before composting in order to quicken the composting process.
Adapted from: Pasche and Kelly (2005).
(Contact details of focal persons in relevant organisations were given.)
Literature reviewed:Pasche, A. and C. Kelly (2005). Concept Summary: Improving the Disposal of Tsunami-Generated WasteUNDAC/Sri Lanka.
WMinE Group (2005). Waste Management following Asia Tsunami Earthquake: Key Issues.http://www.redr.org/WMinE/TsunamiWasteAction.pdf
Series on Best Practice Guidelines (Sri Lanka) Information paper No. 6: After the tsunami: recovery of marine ecosystems
The issues:Key marine ecosystems - such as coral reefs and seagrass beds - have been damaged by the tsunami. The successful recovery of these ecosystems may be threatened by poorly planned reconstruction activities.• Certain areas of coral reef and seagrass habitat were damaged physically by the mechanical impact of the
tsunami, as well as increased sedimentation and deposition of debris as a direct result of the tsunami.• In many of these areas litter and debris are still present and pose a threat to the successful recovery of
these systems.• Planned reconstruction activities and livelihood activities must be carried out in an environmentally sensitive
manner so as not to further threaten these already stressed habitats.
89
The impacts:• Reefs protect low lying coastal areas from extreme weather events such as tropical storms and tsunamis and
need to be maintained for the future security of coastal communities. If marine habitats are not allowed to recover, there will be a severe reduction in the capacity of natural ecosystems, as well as human economic and social systems, to withstand future extreme weather events.
• Marine ecosystems - such as reefs and seagrass beds - support important subsistence and commercial marine species. Failure to rehabilitate these ecosystems will compromise the sustainability of livelihoods in areas affected by the tsunami, both in the short and longer term.
• Illegal use of resources – mining for lime, sand mining in rivers, blast fishing – are still widespread in certain parts of the coast. These damaging methods of extraction seriously affect the productivity of reefs and in turn, affect coastal livelihoods.
• Reef systems and mangroves act as buffers, protecting coastal areas from erosion. The damage of reefs through mining for lime, and sand mining in rivers (which interrupts the natural deposition of sand to beach areas), has lead to severe coastal erosion – measured at one metre per year. This may adversely affect current and planned coastal developments. The rehabilitation of reef systems will reduce the susceptibility of the coastline to erosion.
• Clean beaches and healthy coral reefs are important for tourism. If marine and coastal ecosystems are not effectively rehabilitated the revival of coastal tourism will be negatively affected.
The need:There is an urgent need to facilitate the recovery of tsunami-damaged marine habitats because they providevital economic, livelihood and ecosystem functions.
Guiding principles:• Management of marine ecosystems should focus on stress relief rather than active restoration.• Emphasise the urgent need to remove negative pressures – such as increased sedimentation and pollution
through the inappropriate discharge of waste, unsustainable exploitation of marine resources (damaging fishing practices, sand and coral mining, etc) - on marine ecosystems in order to facilitate natural recovery. This is imperative.
• Allow reef and seagrass habitats to recover naturally. (The composition and structure may change and the recovery rate will depend on external influences.) The active restoration of reef habitats should only be carried out by experienced personnel and is only appropriate in certain circumstances. (See Box 1 for details.)
• Apply an adaptive management approach (for example, modifying and continuously reviewing management techniques in line with up to date information) in the planning and implementation of ecosystem rehabilitation. This is necessary given the complexity and uncertainty of the current situation, and the knowledge gaps that still exist about the post-tsunami status of many marine habitats.
Key steps:• Do not dispose tsunami debris and waste on the shoreline and in marine areas. Use designated waste disposal
sites. (See Box 2 for a list of disposal sites recommended by the CEA.)• Disposal of waste is prohibited under the National Environmental Act No. 47 of 1980 (NEA) as amended,
Marine Pollution Prevention Act No. 59 of 1981, Nuisance Ordinance enacted in 1862, the Penal Code enacted in 1880 and the Criminal Procedure Code No 15 of 1979 in concurrence with Section 261 of the Penal Code. (See Information paper no 9: Knowing about environmental laws and policies.) Even disposal of treated waste requires permits from the Central Environmental Authority and the Coast Conservation Department.
• Existing debris should be removed from coral and seagrass areas. However, it is important that this is done using appropriate methods (see After the tsunami: cleaning up reefs and beaches, Information Paper 4). Contact IUCN for further information on and assistance in debris clearance. (See Box 3 for contact details.) Such clean up operations have already been carried out by IUCN at Hikkaduwa and Unawatuna.
• Damaging resource use practices such as blast fishing, coral mining (which are illegal under the Coast Conservation Act) and other destructive fish harvesting practices targeting ornamental fish should be prevented, so that already stressed marine systems are not degraded further.
90
Box 1: The active restoration of reef habitats should only be carried out by experienced personnel and is only appropriate in certain circumstances.
Contact IUCN for support on coral transplantation. (See Box 2 for details.)
Coral reef restoration may be achieved by enhancing rates of natural colonisation through providing artificial substrates, or by using active restoration techniques such as transplanting coral to areas that are degraded (using either existing substrates or artificial substrates). It is important to remember that:
----
--
Coral restoration techniques tend to be labour intensive and expensive, and are only suitable in special circumstances.Transplanted corals may have lower rates of growth and survivorship than surviving colonies and new recruits. Similarly, species diversity may be lower in transplanted coral colonies.Even if restoration is pursued, removing external pressures on reef systems is the key to ensure the survival of transplanted, as well as existing, corals.The extent to which restoration can be carried out is limited.Natural recovery is recommended strongly as it is faster and will encourage higher species diversity.
Box 2 listed street addresses of disposal sites in each affected coastal district.
Box 3 listed contact details of focal persons in relevant organisations.
Series on Best Practice Guidelines (Sri Lanka) Information paper No. 7: After the tsunami: restoring tourism - environmental issues
The issues:Tourism, the fourth largest contributor, in terms of foreign exchange earnings, to GDP in Sri Lanka, was affected severely by the tsunami.• The tourism industry makes a major contribution to the Sri Lankan economy, at both national and local levels.
Directly and indirectly tourism supports nearly 120,000 jobs per annum and generates about 350 million USD per year in foreign exchange earnings.
• Many hotels were damaged by the tsunami and tourist arrivals to the island decreased drastically. As a consequence, many people lost their jobs and livelihoods are at risk.
• There is a danger that in the rush to restore the tourism industry, environmental concerns may not be addressed adequately.
• Reconstruction is taking place slowly but delays have been encountered mainly due to importation of materials, insurance related issues and confusion about where to rebuild.
• Ecotourism and environmentally-friendly tourism represent a high-value growth market which could be integrated successfully into planning for future tourism sector developments.
The impacts:• The damage from the tsunami to hotels is an estimated 200 million USD to rooms and another 50 million USD
for tourism related structures (souvenirs shops, etc.). The Sri Lanka Tourist Board carried out a survey to estimate the cumulative value of loss based on book values and estimates this at 50 million USD. Neither of these estimates includes attendant losses associated with coastal communities such as the losses to livelihoods or the multiplier effects of tourism on related sectors (such as transport, recreation, restaurants, souvenirs and other support industries) or employment (the many families that rely on earnings from tourism).
• Clean beaches and healthy coral reefs are vital for tourism. The receding tsunami waters carried with them waste and debris from land and much of this – both organic and human-made - has been deposited on coral reefs and beaches. There are also some reports that debris cleared from inland is being dumped in the sea. Debris on beaches and coral reefs will seriously retard the revival of coastal tourism, and the much-needed revenue this brings to coastal communities.
• Nature tourism has been known to cause changes in behaviour patterns in communities from consumptive use of natural resources to non-consumptive use - for example, from collecting turtle eggs for sale to taking tourists to view marine turtles lay eggs. There is a real danger that without regular income, there could be a reversal to previous habits and unsustainable use of natural resources.

91
• Reconstruction without reference to environmental issues could lead to wastage of scarce resources such as energy and water, and the discharge of wastes without attention to recycling. This will, in the long term, have negative impacts on the environment.
The need:Global trends towards nature-based tourism are on the increase. There is also a demand and high willingness to pay for environmentally-friendly tourism on the part of foreign tourists to Sri Lanka. Many hotels in Sri Lanka are already conscious of the need to conserve the environment and to develop non-consumptive and sustainable consumptive use of natural resources. The reconstruction and rehabilitation process offers an unique opportunity to maximise environmental and socially sustainable design and construction, benchmark key performance areas such as energy and water conservation, minimise pollution, ensure adequate land use planning and management, enhance ecosystem conservation, and reduce harmful environmental, social and cultural impacts from tourism.
Guiding principles:• Ensure that policy guidance issued by TAFREN on re-building is followed.• If new construction is envisaged, then obtain fresh approvals from the Coast Conservation Department, the Urban
Development Authority and the Central Environmental Authority, in keeping with relevant Sri Lankan laws.• Ensure that a wide consultative process is followed in planning reconstruction, in order to adhere to legal
requirements and to ensure that all stakeholders are kept informed.• In the long term, aim for globally accredited best practice guidelines in relation to environmental management
such as Green Globe 21 or ISO 14000 accreditation.• Ensure that community based programmes are integrated in to reconstruction in order to maximise corporate
social responsibility.
Key steps (adapted from the Green Globe 21 company standards):• Ensure that all national and local laws are followed before and while reconstructing. (See also ‘After the tsunami:
knowing about environmental policies and legislation.)• Ensure that environmental management, ecosystem conservation and community outreach programmes are
integrated into company policy.• Where complete reconstruction is required, use low-impact designs, materials and construction methods. (See
also After the tsunami: materials for reconstruction, Information Paper 3.)• Set baseline environmental performance benchmarks in key performance areas, in order to ensure vigilant
environmental monitoring. These key areas should include: - Energy conservation and optimisation (such as energy efficient lighting and solar heating); - Water conservation (such as dual flush toilets and low-flow showerheads, collection of rain water); - Waste water management (such as sewage treatment plants); - Maintenance of air quality and reduction of emissions of greenhouse gases (such as banning aerosols and
careful selection of environmentally friendly cleaning agents); - Erosion control and landscaping (such as using only indigenous species, moving away from monoculture); - Reducing, recycling and reusing natural resources (such as composting kitchen waste, recycling glass
and paper); - Switching to using environment-friendly products (such as switching from plastic to glass, wood and ceramic
products; using environment-friendly cleaning agents).• Once these benchmarks are achieved, consider working toward achieving international standards such as
Green Globe 21 standards, for value-addition to the service provided.• Incorporate sustainable use of natural resources and enhancing local livelihoods through community outreach,
training and education programmes and adopting focussed programmes of corporate social responsibility.• Ensure that due consideration in given to designs so that they take into consideration extreme weather events
such as tidal waves and storm surges.• Ensure that natural barriers such as mangroves and sand dunes are protected and enhanced as these acted as
effective barriers against the tsunami.• Establish early warning systems, evacuation and disaster management plans - in case of any eventuality.
(Contact details of focal persons in relevant organisations is given.)
92
Series on Best Practice Guidelines (Sri Lanka) Information paper No. 8: After the tsunami: learning to prepare for natural disasters
Recurrent natural disasters:Tsunamis in the Indian Ocean are not frequent, and a tsunami of the magnitude and impact of the recent tsunami on December 26th 2005 is not likely to recur in the near future. However, climate change experts have predicted that as a result of global warming, recurrent natural disasters - extreme weather events such as intense rainstorms, cyclones, floods, fires, and worsened droughts - will become more frequent.
The issues:Certain communities in Sri Lanka are extremely vulnerable to recurrent natural disasters, which are predicted to become more frequent. Such recurrent natural disasters could weaken social welfare, equity, and sustainable development of coastal communities.
Coastal communities are vulnerable to the after effects of cyclones and storms. In addition, recent research indicates that the structure of the seabed has changed as a consequence of the tsunami and hence, regular monsoonal waves may become stronger. Therefore, these communities are not only already vulnerable, but have been made even more vulnerable after the tsunami.• Communities in the Sabaragamuwa Province are vulnerable to earth slips and floods as a consequence of the
instability of hill slopes. Year in year out, many people are made homeless during monsoonal rains that cause floods and earth slips.
• Communities in the arid zone - particularly in the Hambantota and Mannar districts - are affected severely by drought, as there is little or no rain annually from May to September.
• Ecosystems such as coral reefs and mangroves in the coast as well as forests on slopes have been proven to serve as barriers against natural disasters, acting as natural buffers. Degradation of these ecosystems have left communities more vulnerable to the full forces of these natural disasters.
• Inadequacies in existing methods of communication to spread news quickly of extreme weather events can endanger many lives.
• The lack of disaster management plans including planned methods of evacuation can, again, endanger many lives.• The lack of a permanently established and well-coordinated programme for providing relief and rehabilitation to
people displaced in these recurrent extreme weather events seriously hampers community development.
The impacts:• Most coastal communities have already been affected severely by the tsunami. They are at risk of further
damage from the imminent south west monsoons on south western coast, and/or other tropical storms arising in the Indian Ocean, that are predicted to recur, as a result of climate change. This will worsen the living conditions of communities that have already lost their meagre assets, their resources and livelihoods.
• In 2003, heavy monsoonal rains, accompanied by intense winds caused landslides and flooding in the southern districts of Kalutara, Galle, Matara and Hambantota districts and the Sabaragamuwa province, the extent of which was the worst in 50 years. Massive infrastructural damage was also inflicted, seriously retarding the progress of development in those areas.
• Fifty five thousand people were affected by drought in the Hambantota district in 2001. Due to the drought nearly 15,000ha of arable land was abandoned and damage to livestock was also reported. Even when the rains came the following year, many small-scale farmers were unable to recover because they had had no income. Thus, traditional livelihoods are seriously affected by recurrent natural disasters.
• Change in weather patterns, predicted as a consequence of climate change, results in geographical changes in the range of disease carrying species - such as mosquitoes - with the result that epidemics of vector-borne diseases can spread rapidly. It is estimated that some families may spend 10% of their annual income per episode of malaria, which is substantial when family income has been depleted due to natural disasters.
The need:It is essential that vulnerable communities are empowered to adapt and cope with recurrent natural disasters. Given that coastal communities - already been battered by the tsunami - are now even more vulnerable to extreme
93
weather events, there is an urgent need to ensure that preventative actions are taken now to reduce the after effects of extreme weather events.
Guiding principles (Adapted from the Guidelines for natural disaster prevention, preparedness and mitigation, UNISDR 1994):• Planning in anticipation of an event is better than reacting hurriedly to it. • Some communities (such as those listed above) are more at risk than others and they should be given
priority attention.• Disaster prevention should be integrated into development planning.• Creating awareness and educating vulnerable communities to cope with recurrent natural disasters is essential.• Empowering vulnerable communities by including them in decision-making and creating a sense of community
ownership is also essential.• Environmental protection as a component of sustainable development is urgently needed as a tool for the
management of natural disasters.
Key steps:• Prioritise, through wide stakeholder participation, the needs and capabilities of vulnerable communities to
respond to natural disasters.• Formulate, using wide stakeholder participation, practical disaster preparedness plans for vulnerable communities
such as coastal communities, those at risk from droughts and those at risk from floods and landslides. These plans should include, among other components, early warning systems, rapid and effective communication of warnings, set evacuation routes, set evacuation shelters, apid and planned relief operations.
• Ensure that where infrastructure and buildings need reconstruction/construction, due attention is given to strengthening such structures against recurrent natural disasters. For example, households are not built on sharp and bare slopes in the Sabaragamuwa province and houses on the coast are not built out of temporary materials that are not proof against the elements.
• Actively conserve those ecosystems – such as coral reefs, mangroves sand dunes and lowland rainforests - that provide protection to vulnerable communities. Where necessary, these ecosystems should be restored.
(Contact details of focal persons in relevant organisations were given.)
Series on Best Practice Guidelines (Sri Lanka) Information paper No. 9: After the tsunami: knowing about environmental policies and legislation (prepared in collaboration with the Environmental Foundation Ltd.).
The issue:There is a need to enhance awareness about existing policies and laws concerning tsunami-affected areas, as there is currently a great deal of confusion about what is permissible.• Given the large number of governmental, non-governmental, and international organizations involved in post-
tsunami reconstruction, and the rush to rebuild, many existing policies, laws and regulations are not being given due consideration.
• There is great uncertainty about whether, and which, new policies and regulations have been established post tsunami.
• This has resulted in much confusion about where to reconstruct, and is slowing down the process of rehabilitation.
• It is reported that many people are concerned about the lack of clarity in newly-established policies.• It is reported that many people are going ahead with reconstruction without due regard to established policies,
existing laws and regulations or ecologically sensitive sites.• All the above could further damage already affected ecosystems, thereby exacerbating adverse impacts
on livelihoods.
94
The impacts:Many laws and regulations have been established in Sri Lanka in order to regulate human behaviour so that ecosystems and species, and thereby the goods and services provided by them, are conserved. This, in turn, ensures the protection of livelihoods. Failing to uphold these laws and regulations leads to many far reaching and damaging impacts, including increased vulnerability to coastal erosion and recurrent weather events, decreased agricultural production, and diminishing natural resources, including fish stocks. Laws also ensure that our natural capital is managed sustainably and equitably.
The need:There is an urgent need to ensure that post-tsunami reconstruction is carried out in a timely and equitable manner with reference to existing laws and regulations, as well as to proposed laws and new policies.
Legal definition of the coastal zone:The coastal zone is defined in the Coast Conservation Act no 57 of 1981 ‘as the area lying within a limit of 300m landward from mean high water line (MHWL). In the case of rivers, streams, lagoons or any other body of water connected to the sea, either permanently or periodically, the landward boundary extends to a limit of two kilometres 2km measured perpendicular to the straight base line drawn between the natural entrance points thereof and includes waters of such rivers, streams and lagoons or any other body of water so connected to the sea.’
Guiding principles:• Reconstruct according to existing laws and regulations.• Become aware of and be knowledgeable about new policies and laws with respect to construction and
use of natural resources in affected areas. Contact relevant authorities if in doubt. (See Box 2.)
Key steps to be taken:(A list of ordinances and acts relevant to environmental issue related to reconstruction is given in Box 1. See also ‘Rebuilding after the tsunami keeping it legal’ by the Environmental Foundation Ltd.)
Know the legal boundaries of where reconstruction cannot occur. (See also IUCN Information paper 1: After the tsunami: where to reconstruct – environmental issues)• The government has proposed a no build zone of 100m in the south and west and 200m in the north and east.• Unauthorised construction is banned within the coastal zone as defined by the Coast Conservation Act (CCA).• It is mandatory that a permit be obtained from the Coast Conservation Department (see Section 14 of the
CCA) for any developmental activity (any activity that is likely to alter the physical nature of the Coastal Zone in anyway). These activities include
- building, - deposition of wastes, - removal of sand, sea shells, natural vegetation, sea grass and other substances, - dredging and filling, - land reclaiming and - mining and mineral extraction.
For any of the above activities, the Director of the Coast Conservation Department may call for an Environmental Impact Assessment (EIA).• No construction activities are permitted in National Reserves (under the jurisdiction of the Department of Wildlife
Conservation – see the Fauna and Flora Protection Ordinance No. 2 of 1937 as amended) and Forest Reserves (under the jurisdiction of the Forest Department – see the Forest Ordinance of 1907 as amended), which are state lands.
The following are National Reserves - a Strict Natural Reserve - a National Park - a Nature Reserve - a Jungle Corridor - a refuge - a Marine Reserve - a buffer zone (See Information Paper 1 for a list of protected areas in affected districts.)
95
• Sanctuaries, also declared under the Fauna and Flora Protection Ordinance, may include privately held land. Consult the Department of Wildlife Conservation if reconstruction is proposed in sanctuaries.
• Construction within one mile radius of a national reserve, sanctuary or buffer zone needs permission from the Department of Wildlife Conservation. (See the Fauna and Flora Protection Ordinance No. 2 of 1937 as amended.)
• Any development activity within a fishery reserve requires the permission and approval of the Director of Fisheries and Aquatic Resources. (See the Fisheries and Aquatic Resources Act No. 2 of 1996.)
• Under the National Environmental Act No. 47 of 1980, the environmental impact assessments process is applicable to certain prescribed activities. Under the National Environmental Act No. 47 of 1980, the environmental impact assessment process is applicable to certain prescribed activities. IEE/EIAs are mandatory for the following activities. The list is representative and not complete. Please check with the regional offices of CEA for details.
- All river basin development and irrigation works; - Reclamation of land, wetlands exceeding four hectares; - Conversion of forests covering areas exceeding one hectare into non-forest uses; - Clearing of land exceeding 50ha; - Housing and building construction; - Resettlement; - Water supplies; - Pipelines; - Hotels.• No development or encroachment of any kind is permitted in archaeological reserves declared under the
Antiquities Ordinance No 9 of 1940 as amended (Section 34). The Director General of Archaeology is empowered to conduct an archaeological impact assessment of areas that may be affected by development, industrial or other projects proposed by the government or any person. (Antiquities Ordinance No. 9 of 1940 as amended, Antiquities (Amendment) Act No. 24 of 1998.)
• Using paddy land for a purpose other than agricultural cultivation without the written permission of the Commissioner General is a punishable offence under the Agrarian Development Act No. 46 of 2000 (Section 32).
• Local government approval should be sought prior to reconstruction to ensure that the proposed area does not fall within an area allocated for a public purpose/reservation etc.
• There are also subsidiary laws that must be complied with for land use and allocation.
Know what you may build.• Approval from the local authority under which a land is situated i.e., the Urban Development Authority,
the Municipal Councils, the Urban Councils and the Pradeshiya Sabhas is required when reconstruction and rebuilding take place. Structural and other specifications are taken into consideration when processing an application.
Know which activities are prohibited. (See also IUCN Information Paper 2.)• Extraction of corals. (See Coast Conservation Act No. 57 of 1981 (CCA) as amended.)• Removal of sea sand except in areas identified by Coast Conservation Department under permits granted by
them. (See Coast Conservation Act No. 57 of 1981 (CCA) as amended.)• Removal of river sand. (See Mines and Mineral Act No. 33 of 1993.)• Extraction of any resources from designated protected areas. (See the Fauna and Flora Protection Ordinance
No. 2 of 1937 as amended, the Forest Ordinance of 1907 as amended.)• Extraction or excavation in archaeological reserves (See the Antiquities Ordinance No 9 of 1940 as amended
and Antiquities Ordinance No. 9 of 1940 as amended, Antiquities (Amendment) Act No. 24 of 1998.)• Any development activity that will significantly degrade the quality of any area designated as being exceptional
ecosystems and habitats of threatened species, for enhancing the natural beauty of the wilderness of Sri Lanka. (National Heritage Wilderness Act, No 3 of 1988.)
• Indiscriminate disposal of waste. (National Environmental Act No. 47 of 1980 (NEA as amended), Marine Pollution Prevention Act No. 59 of 1981, Nuisance Ordinance enacted in 1862 The Penal Code enacted in 1880, Criminal Procedure Code No 15 of 1979 in concurrence with Section 261 of the Penal Code further elaborates on Public Nuisance.)
96
Know which activities within the coastal zone require a permit from the CCD.• Dwelling houses and related structures;• Tourism, commercial and industrial structures;• Recreational and/or water sport facilities;• Harbour structures and navigation channels;• Roads, bridges and railway lines;• Public and religious structures;• Shoreline protection work to be carried out by any private individual or group;• Sewage treatment facilities and ocean outfalls;• Aquaculture facilities;• Disposal of solid waste;• Dredging, filling, grading and breaching of sand bars;• Mining and mineral extraction;• Removal of sand or seashells;• Removal of vegetation;• Removal of coral for research purposes;• Power generation projects;• Reclamation and grading;• Construction of conveyance lines;• Construction, mining and breaching related to flood control or hazard control by any private individual or group;• Any other activity likely to alter the physical nature of the Coastal Zone.
Know which activities may be conducted without a permit.• Fishing;• Cultivation of crops that do not destabilise the coast.• Planting of trees and other vegetation. Caution must be used in the choice of species which should, ideally, be
species common in the area.• Construction and maintenance of coastal protection work carried out by the Coast Conservation Department in
accordance with the Coastal Zone Management Plan.
Box 1 presented laws relevant to the reconstruction process. (See Volume 2 page 23 for this list.)
Series on Best Practice Guidelines (Sri Lanka) Information paper No.10: After the tsunami: restoring terrestrial coastal ecosystems
The issues:Terrestrial coastal ecosystems, such as palm plantations, home gardens, mangroves, lagoons and other tree-dominated landscapes (Casuarina plantations, scrub forest, etc.) suffered considerable damage from the tsunami. In some areas these have been further threatened by post-tsunami rehabilitation and reconstruction activities. Limiting further damage to these important ecosystems and restoring them in a participatory and sustainable manner is therefore a key priority.• Terrestrial coastal ecosystems such as mangroves, home gardens, lagoons, palm and other coastal tree
plantations are important livelihood resources for many coastal communities and provide a range of vital ecosystem goods including nutrition, timber, fuelwood, medicines and fisheries. They also provide services such as protecting the coastline, absorbing, storing and releasing carbon in a form that plants can use, and providing habitats for biodiversity.
• These ecosystems have been damaged significantly by the tsunami.• In some areas, post-tsunami rehabilitation and reconstruction activities, for example, through land clearance for
setting up temporary shelters, are further threatening these habitats.• The Sri Lankan government has proposed the development of a no-build coastal green belt aimed at restoring
tree/vegetation cover along coastal areas.• However, restoration activities such as mangrove replanting, establishment of shelterbelt plantations, etc.
need careful thought and implementation, and framed within the broader context of integrated coastal zone management based on the existing land uses prevalent in the area.
97
The impacts:• Habitats such as mangroves are home to a wide range of economically and ecologically important species
such as fish and crustaceans. They provide a range of livelihoods for coastal communities. Already damaged by the tsunami, further loss and clearing of mangroves will, in the long term, worsen the living conditions of coastal communities.
• On the ground assessments have revealed that intact and mature mangrove stands buffered the coastline against damage from the tsunami. Broad intact stands of mangroves, shelterbelt plantations, stablised and vegetated sand dunes are known to protect communities against tidal surges, storms and extreme weather conditions and thereby prevent erosion and limit salt-water intrusion. Further loss of coastal vegetation will leave coastal communities even more vulnerable to recurrent extreme weather events such as cyclones and storms.
• Managed coastal vegetation such as palm (coconut and palmyrah) plantations and home gardens, were affected severely by the tsunami. These managed systems help to support the livelihoods of local people in several areas by providing food, timber and thatching for housing/fencing, fuelwood and sources of other income.
The need:There is an urgent need to restore damaged terrestrial ecosystems as they provide vital goods and services and support local livelihoods.
Guiding principles:• Carry out ecosystem restoration in coastal terrestrial areas with reference to existing national laws.• Carry out ecosystem restoration in coastal terrestrial areas by matching local needs and priorities with the
goods and services that ecosystems provide, rather than implementing predetermined and inflexible land use configurations in a top-down manner.
• Ensure that from the beginning, the process is participatory involving sufficient consultation among all stakeholders within that landscape and builds on traditional knowledge available on the management of natural and managed ecosystems within the local communities.
• Ensure that, from the beginning, all relevant government departments – such as the Forest Department, the Coast Conservation Department, Central Environmental Authority, Urban Development Authority and the Department of Wildlife Conservation – are consulted and play a central role in restoration together with the local communities.
• Ensure that, from the beginning, restoration activities are carried out in a way that does not harm the interests of the poor, the displaced and other marginalised communities. Activities should, therefore, be not only participatory but also transparent and negotiated fairly. Activities should strive to provide direct livelihood benefits in an equitable manner i.e., through the provision of employment for planting, nursery activities, etc.
• Formulate a clear vision that links and balances restoration with medium to long-term benefits to local communities as well as the environment. When restoration options are selected, make every effort to ensure that the trade-offs, wherever they arise, are equitably (not necessarily equally) distributed among all stakeholders and that the balance between ecosystem and human livelihood needs is maintained.
• Adopt a landscape approach to restoration. Ecosystems do not function as closed units but as open systems that are affected by ecological process that occur on a larger scale. Because of this, every effort at restoration should be assessed in the context of the landscape i.e., it is necessary to look at the broader picture, not just the specific restoration site alone.
• Use indigenous, multiple-use and locally beneficial species while carrying out restoration.• Follow adaptive management practices that are based on continuous monitoring and improvement, because
complexity and uncertainty makes it impossible to predict accurately the outcomes of restoration. There is a need to recognise that the balance of goods and services provided by ecosystems today may not be the goods and services required in the future. Thus, adaptive management practices are critical.
Key steps:• Tsunami-debris should be removed from affected ecosystem areas – beaches, home gardens, palm plantations,
lagoons, etc. Fallen timber and other recyclable material (bricks, tiles, etc.) should be salvaged for use or sale. (See After the tsunami: beach and reef clean ups, Information paper 4; and After the tsunami: solid waste management, Information Paper 5, for more details.)
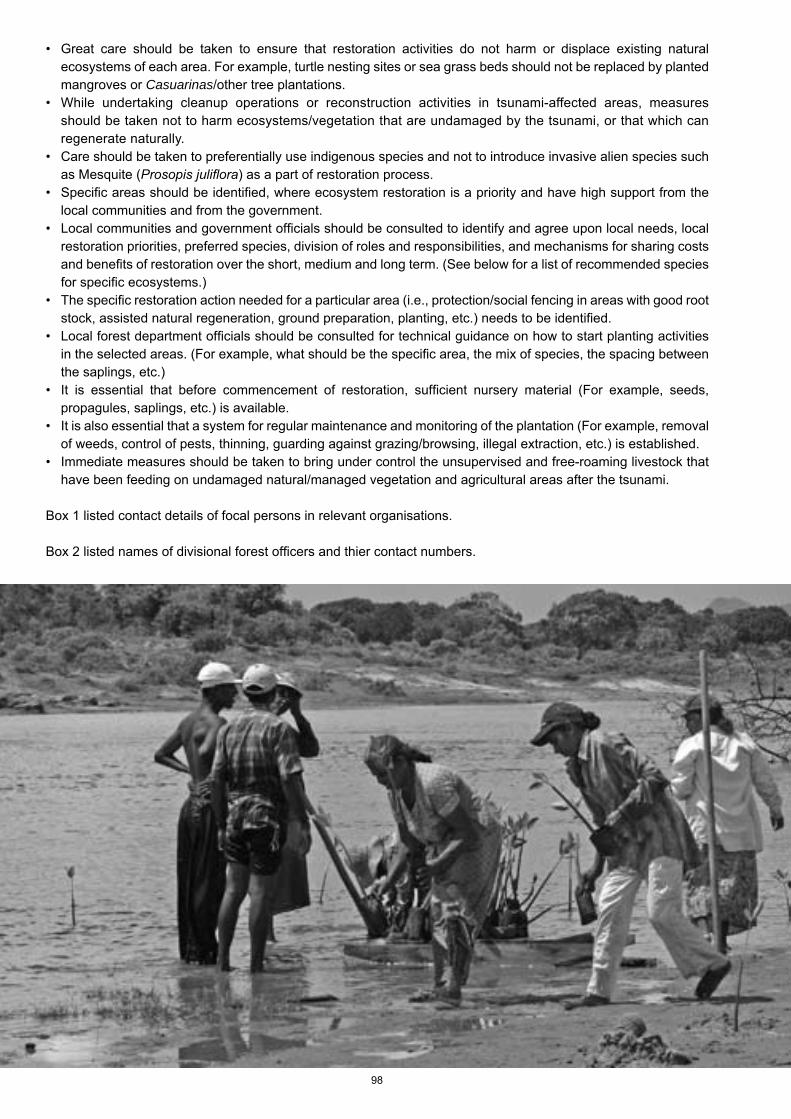
98
• Great care should be taken to ensure that restoration activities do not harm or displace existing natural ecosystems of each area. For example, turtle nesting sites or sea grass beds should not be replaced by planted mangroves or Casuarinas/other tree plantations.
• While undertaking cleanup operations or reconstruction activities in tsunami-affected areas, measures should be taken not to harm ecosystems/vegetation that are undamaged by the tsunami, or that which can regenerate naturally.
• Care should be taken to preferentially use indigenous species and not to introduce invasive alien species such as Mesquite (Prosopis juliflora) as a part of restoration process.
• Specific areas should be identified, where ecosystem restoration is a priority and have high support from the local communities and from the government.
• Local communities and government officials should be consulted to identify and agree upon local needs, local restoration priorities, preferred species, division of roles and responsibilities, and mechanisms for sharing costs and benefits of restoration over the short, medium and long term. (See below for a list of recommended species for specific ecosystems.)
• The specific restoration action needed for a particular area (i.e., protection/social fencing in areas with good root stock, assisted natural regeneration, ground preparation, planting, etc.) needs to be identified.
• Local forest department officials should be consulted for technical guidance on how to start planting activities in the selected areas. (For example, what should be the specific area, the mix of species, the spacing between the saplings, etc.)
• It is essential that before commencement of restoration, sufficient nursery material (For example, seeds, propagules, saplings, etc.) is available.
• It is also essential that a system for regular maintenance and monitoring of the plantation (For example, removal of weeds, control of pests, thinning, guarding against grazing/browsing, illegal extraction, etc.) is established.
• Immediate measures should be taken to bring under control the unsupervised and free-roaming livestock that have been feeding on undamaged natural/managed vegetation and agricultural areas after the tsunami.
Box 1 listed contact details of focal persons in relevant organisations.
Box 2 listed names of divisional forest officers and thier contact numbers.
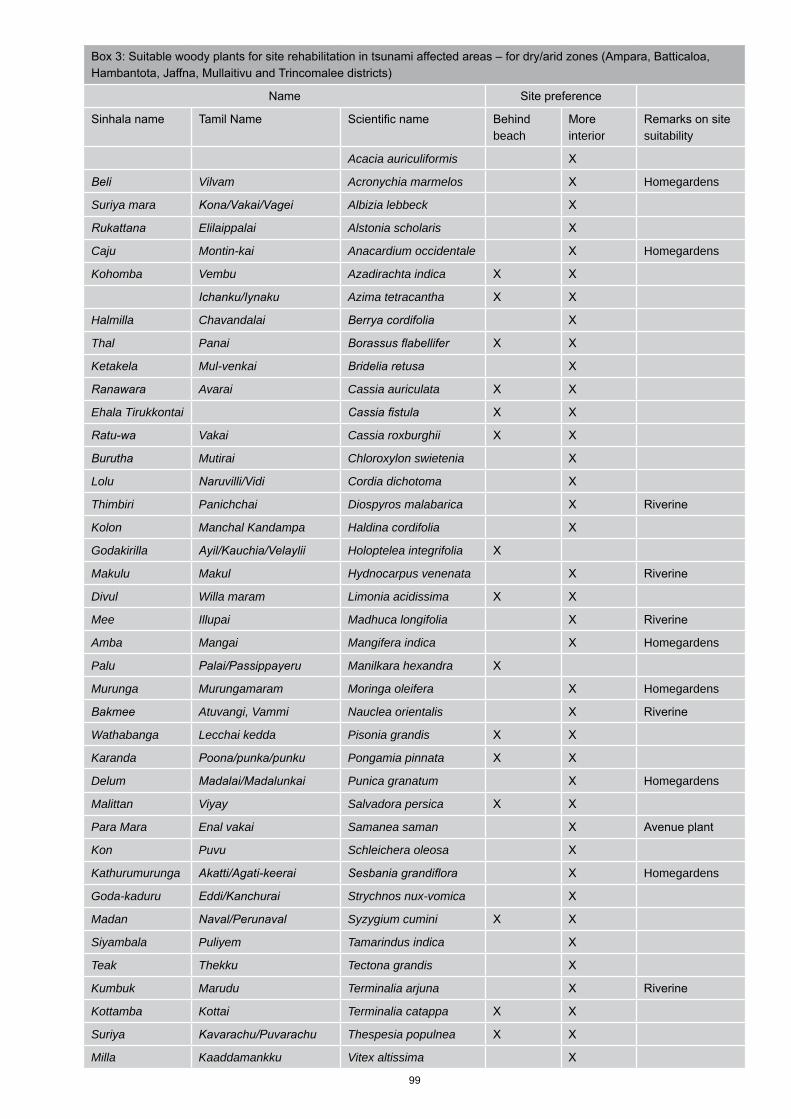
99
Box 3: Suitable woody plants for site rehabilitation in tsunami affected areas – for dry/arid zones (Ampara, Batticaloa, Hambantota, Jaffna, Mullaitivu and Trincomalee districts)
Name Site preference
Sinhala name Tamil Name Scientific name Behind beach
More interior
Remarks on site suitability
Acacia auriculiformis X
Beli Vilvam Acronychia marmelos X Homegardens
Suriya mara Kona/Vakai/Vagei Albizia lebbeck X
Rukattana Elilaippalai Alstonia scholaris X
Caju Montin-kai Anacardium occidentale X Homegardens
Kohomba Vembu Azadirachta indica X X
Ichanku/Iynaku Azima tetracantha X X
Halmilla Chavandalai Berrya cordifolia X
Thal Panai Borassus flabellifer X X
Ketakela Mul-venkai Bridelia retusa X
Ranawara Avarai Cassia auriculata X X
Ehala Tirukkontai Cassia fistula X X
Ratu-wa Vakai Cassia roxburghii X X
Burutha Mutirai Chloroxylon swietenia X
Lolu Naruvilli/Vidi Cordia dichotoma X
Thimbiri Panichchai Diospyros malabarica X Riverine
Kolon Manchal Kandampa Haldina cordifolia X
Godakirilla Ayil/Kauchia/Velaylii Holoptelea integrifolia X
Makulu Makul Hydnocarpus venenata X Riverine
Divul Willa maram Limonia acidissima X X
Mee Illupai Madhuca longifolia X Riverine
Amba Mangai Mangifera indica X Homegardens
Palu Palai/Passippayeru Manilkara hexandra X
Murunga Murungamaram Moringa oleifera X Homegardens
Bakmee Atuvangi, Vammi Nauclea orientalis X Riverine
Wathabanga Lecchai kedda Pisonia grandis X X
Karanda Poona/punka/punku Pongamia pinnata X X
Delum Madalai/Madalunkai Punica granatum X Homegardens
Malittan Viyay Salvadora persica X X
Para Mara Enal vakai Samanea saman X Avenue plant
Kon Puvu Schleichera oleosa X
Kathurumurunga Akatti/Agati-keerai Sesbania grandiflora X Homegardens
Goda-kaduru Eddi/Kanchurai Strychnos nux-vomica X
Madan Naval/Perunaval Syzygium cumini X X
Siyambala Puliyem Tamarindus indica X
Teak Thekku Tectona grandis X
Kumbuk Marudu Terminalia arjuna X Riverine
Kottamba Kottai Terminalia catappa X X
Suriya Kavarachu/Puvarachu Thespesia populnea X X
Milla Kaaddamankku Vitex altissima X
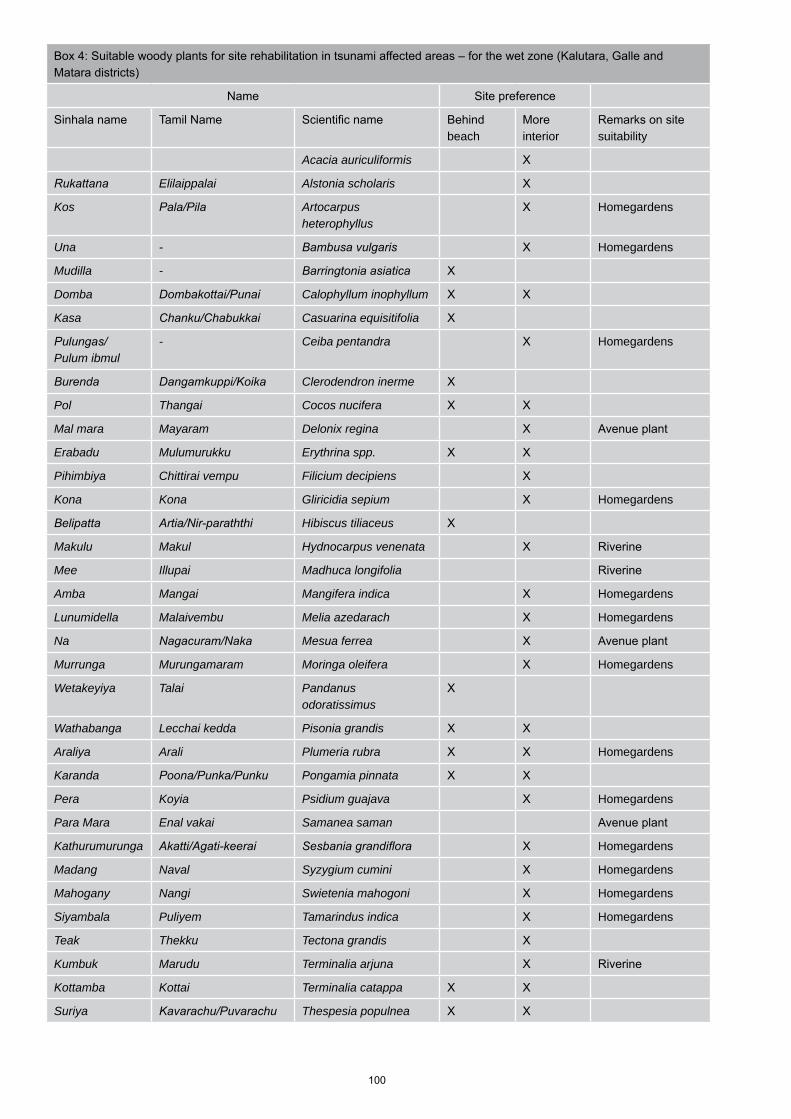
100
Box 4: Suitable woody plants for site rehabilitation in tsunami affected areas – for the wet zone (Kalutara, Galle and Matara districts)
Name Site preference
Sinhala name Tamil Name Scientific name Behind beach
More interior
Remarks on site suitability
Acacia auriculiformis X
Rukattana Elilaippalai Alstonia scholaris X
Kos Pala/Pila Artocarpus heterophyllus
X Homegardens
Una - Bambusa vulgaris X Homegardens
Mudilla - Barringtonia asiatica X
Domba Dombakottai/Punai Calophyllum inophyllum X X
Kasa Chanku/Chabukkai Casuarina equisitifolia X
Pulungas/Pulum ibmul
- Ceiba pentandra X Homegardens
Burenda Dangamkuppi/Koika Clerodendron inerme X
Pol Thangai Cocos nucifera X X
Mal mara Mayaram Delonix regina X Avenue plant
Erabadu Mulumurukku Erythrina spp. X X
Pihimbiya Chittirai vempu Filicium decipiens X
Kona Kona Gliricidia sepium X Homegardens
Belipatta Artia/Nir-paraththi Hibiscus tiliaceus X
Makulu Makul Hydnocarpus venenata X Riverine
Mee Illupai Madhuca longifolia Riverine
Amba Mangai Mangifera indica X Homegardens
Lunumidella Malaivembu Melia azedarach X Homegardens
Na Nagacuram/Naka Mesua ferrea X Avenue plant
Murrunga Murungamaram Moringa oleifera X Homegardens
Wetakeyiya Talai Pandanus odoratissimus
X
Wathabanga Lecchai kedda Pisonia grandis X X
Araliya Arali Plumeria rubra X X Homegardens
Karanda Poona/Punka/Punku Pongamia pinnata X X
Pera Koyia Psidium guajava X Homegardens
Para Mara Enal vakai Samanea saman Avenue plant
Kathurumurunga Akatti/Agati-keerai Sesbania grandiflora X Homegardens
Madang Naval Syzygium cumini X Homegardens
Mahogany Nangi Swietenia mahogoni X Homegardens
Siyambala Puliyem Tamarindus indica X Homegardens
Teak Thekku Tectona grandis X
Kumbuk Marudu Terminalia arjuna X Riverine
Kottamba Kottai Terminalia catappa X X
Suriya Kavarachu/Puvarachu Thespesia populnea X X
101
Series on Best Practice Guidelines (Sri Lanka) Information paper No.11: After the tsunami: water pollution (Prepared in collaboration with the International Water Management Institution - IWMI)
The issue:The Tsunami waters and debris have contaminated groundwater, wells and other water storage tanks.• Most sources of drinking and bathing water including wells, tanks and groundwater in the coastal area were
contaminated with seawater after the tsunami and were salinised initially and inconsumable.• Sludge, dirt and debris were also brought in with the waters and contaminated sources of drinking and
bathing water.• Chemicals such as petrol, kerosene and diesel, as well as industrial chemicals can contaminate ground water
for many years to come and affect potable sources of water.• Manholes and sewers, which overflowed as a result of the tsunami, could also have contaminated freshwater,
increasing the risk of water borne-diseases.• Improper disposal of organic matter and post-tsunami debris could lead to further contamination of water.
Debris is being dumped in abandoned paddy fields, marshy lands and roadsides, creating breeding grounds for mosquitoes and other pests. This could lead to outbreaks of disease in the future.
• Natural flushing and purification of contaminated sources of water has occurred in some affected areas but in other areas it has been too dry, particularly in the southeast and east.
The impacts:• Numerous sources of fresh water in the coastal zone - such as wells and tanks - have already suffered damage
due to the infiltration of salt water from the tsunami waves. Already 62,000 wells and other sources of fresh water have been contaminated with salt water.
• There is considerable potential for negative health impacts such as diarrhoea and dysentery in the short term due to lack of access to adequate supplies of good quality water, general environmental pollution and the lack of sanitation.
The need:Freshwater sources need to be restored completely in order to provide people with access to clean water for domestic and agricultural use. This is a priority need that is being addressed by the Task Force for Rebuilding the Nation (TAFREN). (See Box 1 for details.)
Guiding principles:• Provide all residents with easy access to adequate quantities of clean, safe, freshwater for drinking, preparing
food and bathing.• Immediate solutions will require innovation and improvisation, leading to gradual improvement, progressing
from basic to robust and sustainable services.• Water resources must be protected from further contamination, especially of faecal waste.• Organic and inorganic debris should be disposed of in a proper manner so that water bodies are not polluted.
(See After the tsunami: solid waste management, Information Paper 5.)• All interventions should be undertaken in full consultation with the appropriate authorities such as the Urban
Development Authority (UDA), the Rural Development Authority (RDA), the Government Agent (GA) and the National Water Supply and Drainage Board (NWSDB). They should also be undertaken in accordance with national plans by TAFREN. (See Box 1 for details.)
• All plans should also be devised in full consultation with local communities to ensure needs are met in a culturally acceptable way and in accordance with local practices and water use rights. Such traditions may be over ridden in times of disaster but it is necessary to avoid actions that enhance tensions or lead to conflict.
• Housing and new construction should ensure good sanitation facilities and sewage systems. The UDA may be contacted for further information and guidance. (See Box 2 for contact details.)
• Emergency water-supply responses should be implemented in conjunction with hygiene promotion to reduce the risk of the disaster impacting on health.
• Construction designs should ensure good drainage systems in place as approved by relevant local authorities.• The rebuilding process should take into consideration disaster preparedness for possible future disasters (not
only tsunamis). This should include vulnerability assessments (of people and infrastructure), robust designs and disaster mitigation plans.
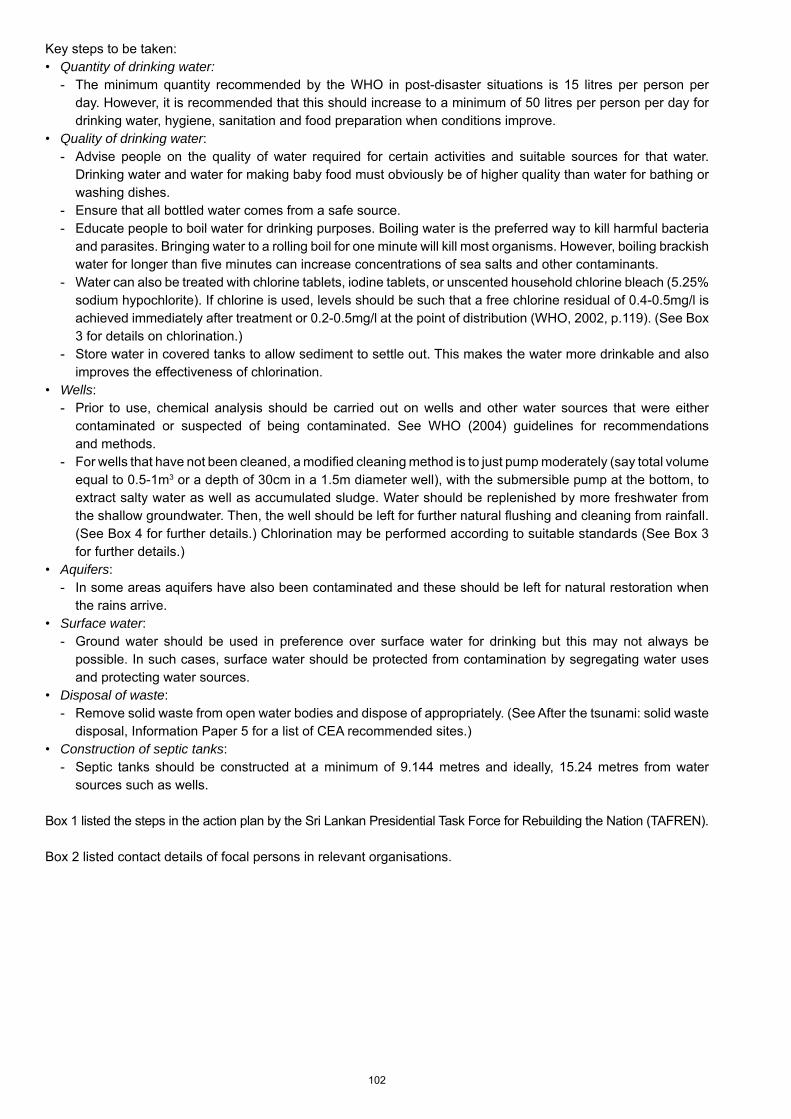
102
Key steps to be taken:• Quantity of drinking water: - The minimum quantity recommended by the WHO in post-disaster situations is 15 litres per person per
day. However, it is recommended that this should increase to a minimum of 50 litres per person per day for drinking water, hygiene, sanitation and food preparation when conditions improve.
• Quality of drinking water: - Advise people on the quality of water required for certain activities and suitable sources for that water.
Drinking water and water for making baby food must obviously be of higher quality than water for bathing or washing dishes.
- Ensure that all bottled water comes from a safe source. - Educate people to boil water for drinking purposes. Boiling water is the preferred way to kill harmful bacteria
and parasites. Bringing water to a rolling boil for one minute will kill most organisms. However, boiling brackish water for longer than five minutes can increase concentrations of sea salts and other contaminants.
- Water can also be treated with chlorine tablets, iodine tablets, or unscented household chlorine bleach (5.25% sodium hypochlorite). If chlorine is used, levels should be such that a free chlorine residual of 0.4-0.5mg/l is achieved immediately after treatment or 0.2-0.5mg/l at the point of distribution (WHO, 2002, p.119). (See Box 3 for details on chlorination.)
- Store water in covered tanks to allow sediment to settle out. This makes the water more drinkable and also improves the effectiveness of chlorination.
• Wells: - Prior to use, chemical analysis should be carried out on wells and other water sources that were either
contaminated or suspected of being contaminated. See WHO (2004) guidelines for recommendations and methods.
- For wells that have not been cleaned, a modified cleaning method is to just pump moderately (say total volume equal to 0.5-1m3 or a depth of 30cm in a 1.5m diameter well), with the submersible pump at the bottom, to extract salty water as well as accumulated sludge. Water should be replenished by more freshwater from the shallow groundwater. Then, the well should be left for further natural flushing and cleaning from rainfall. (See Box 4 for further details.) Chlorination may be performed according to suitable standards (See Box 3 for further details.)
• Aquifers: - In some areas aquifers have also been contaminated and these should be left for natural restoration when
the rains arrive.• Surface water: - Ground water should be used in preference over surface water for drinking but this may not always be
possible. In such cases, surface water should be protected from contamination by segregating water uses and protecting water sources.
• Disposal of waste: - Remove solid waste from open water bodies and dispose of appropriately. (See After the tsunami: solid waste
disposal, Information Paper 5 for a list of CEA recommended sites.)• Construction of septic tanks: - Septic tanks should be constructed at a minimum of 9.144 metres and ideally, 15.24 metres from water
sources such as wells.
Box 1 listed the steps in the action plan by the Sri Lankan Presidential Task Force for Rebuilding the Nation (TAFREN).
Box 2 listed contact details of focal persons in relevant organisations.
103
Box 3: Disinfecting drinking waterThe most common method of disinfecting water in emergency situations is chlorination, because it is the simplest. Calcium hypochlorite it generally used. All chlorine compounds should be handled with care. Free residual chlorine levels of more than 0.3mg/l for more than 30 minutes are required to kill bacteria and most viruses. Chlorination of stored water for consumption is best achieved using a one percent stock solution of chlorine. This contains 10% of chlorine per litre, which is equivalent to 10,000mg/l or 10,000ppm. Skin contact should be avoided when making or using the solution, as should inhalation of fumes. The solution should be made fresh everyday in the following way:
To make one litre of one percent stock solution mix the following quantities with water and make up to one litre in a glass, plastic or wooden container:
Chemical source % available chlorine Quantity required Approximate measures
Bleaching powder 35 30g 2 heaped tablespoons or 8 teaspoons
Stabilised / tropical bleach
25 40g 3 heaped tablespoons or 12 teaspoons
High-test hypochlorite 70 14ml 1 tablespoon solution
Liquid laundry bleach 5 200ml 1 teacup or 6oz milk tin
Liquid laundry bleach 7 145ml 10 tablespoons
Javelle water 1 It is a 1% stock solution
Source: WHO (2002)
Box 4: How to clean contaminated wells:- Wells should only be cleaned and pumped by qualified and trained personnel with reporting to the local authorities
(NWSDB).- Wells should not be pumped to decrease salinity. Natural recovery is the best method for this.- To remove sludge and debris, pump slowly (preferably with a sludge pump at the bottom). The drawdown (the extent of
lowering of water) in the well must not exceed 0.5m for more than 15 minutes.- If the well has been pumped or cleaned before, and the salinity has increased, then the well should not be cleaned again.- When wells are cleaned, salinity at the top and bottom should be monitored, both before and after cleaning.- Do not repeatedly chlorinate wells.- Do not repeatedly empty wells.- Drinking water should be purified separately (for example, by chlorine tablets or by boiling, or by the SODIS (Solar
Disinfection) method.- Wells that are salty or becoming salty should be pumped less or abandoned temporarily.- Abandoned wells should be covered to reduce risk of mosquito breeding, and to indicate that the well is not in use.- Deep wells (more than 5m deep) and wells pumped with motorized pumps should be regularly monitored for salinity as
they stand a greater risk of salinisation.- Wells should not be deepened in the coastal aquifers in an attempt to avoid saltwater.- New deep wells should not be drilled in the coastal aquifers in an attempt to get fresh water.- Stagnant water bodies should be cleaned for debris. In case of suspicion of pollution of the water body (for example, by
visible oil film on the surface) cases should be reported to the authorities who should take action in the clean-up.
104
Series on Best Practice Guidelines (Sri Lanka) Information paper No.12 After the tsunami: restoring terrestrial coastal wetlands (Prepared in collaboration with the International Water Management Institute - IWMI)
Coastal Wetlands:The Ramsar Convention on Wetlands defines wetlands as ‘areas of marsh, fen, peatland or water, whether natural or artificial, permanent or temporary, with water that is static or flowing, fresh, brackish or salt, including areas of marine water the depth of which at low tide does not exceed six metres.’
This information paper restricts itself to discussion on coastal wetlands, and hence, wetlands referred to in this paper will include the following habitats:• Estuarine waters (permanent water in estuaries and estuarine systems);• Inter-tidal mud flats, inter-tidal marshes (including salt marshes, salt meadows, salt flats, raised salt marshes,
tidal brackish and freshwater marshes);• Mangroves and coastal brackish/saline lagoons (brackish to saline lagoons with at least one relatively narrow
connection to the sea).
The issues:Coastal wetlands such as mangroves, lagoons and mudflats, under severe considerable threat due to coastal development demands, suffered considerable damage from the tsunami. In some areas they are further threatened by post-tsunami rehabilitation and reconstruction activities. Minimising the damage to these important wetlands and restoring them in a sustainable manner through participatory mechanisms has become a priority.• Coastal wetlands already under considerable threat were further damaged significantly by the tsunami.• In some areas, post-tsunami rehabilitation and reconstruction activities, for example, through land clearance for
temporary shelters and by infilling through the disposal of rubble, are further threatening these habitats.• The Sri Lankan government has proposed the development of a ‘no-build’ zone along the coast.• Restoration activities such as mangrove replanting, removal of rubble, and preventing pollution need
careful thought and implementation, and should be framed within the broader context of integrated coastal zone management.
The impacts:• Mangroves are home to a wide range of economically important species, such as fish and crustaceans,
supporting a range of livelihoods for coastal communities. Damage caused by the tsunami and further loss and clearing, pollution of lagoons, estuaries and marshes, and indiscriminate infilling will, in the long term, worsen the living conditions of coastal communities who depend on these resources.
• Tsunami-generated debris accumulating in wetlands impedes fishing activities by the reduction in capacity of lagoons and estuaries.
• Natural waterways that facilitate exchange of water between different wetland habitats have been blocked by debris/sediment carried by the tsunami.
• Coastal wetlands not only provide important livelihood resources for rural coastal communities, but also supply other vital ecosystem services, such as protection against extreme weather events and erosion, limits salt-water intrusion and buffers tidal surges and storms. Empirical evidence in some locations has revealed that mature, intact stands of mangroves served as effective barriers against the tsunami waves. Loss of coastal vegetation will leave coastal communities more vulnerable to recurrent extreme weather events such as cyclones and storms.
• Low-lying wetlands function as sponges and limits the impact of floods. Loss of wetland areas can lead to increased flash floods.
• Wetlands trap and retain sediments that are carried in by rivers and floodwaters. Degraded wetlands are less likely to trap and retain sediments and could also contribute sediments to floodwaters through increased erosion. Increased erosion within the wetlands will further reduce the capacity of the ecosystem to support coastal livelihoods.
• Coastal wetlands also function as traps of carbon and other minerals and with time convert them into useable nutrients.
• Coastal wetlands provide many habitats for species uniquely adapted to changes in salinity and water levels. They are important storehouses of biodiversity. We need to recognise that the diverse wetlands affected by the tsunami are part of a connected ecosystem and that many species move between them to feed or breed.
105
The need:There is an urgent need to restore degraded coastal wetland ecosystems as they provide vital goods and services and support local livelihoods.
Guiding principles (adapted from the Ramsar Wetland Convention’s principles and guidelines for wetland restoration):• Carry out wetland restoration in coastal areas with reference to existing national laws.• Carry out wetland restoration within the context of the national wetlands policy and action plan.• Carry out wetland restoration only in areas where similar habitats had been damaged by the tsunami or by
human activities. The establishment of wetlands in other places, such as sandy beaches that did not previously support wetlands, is not recommended and could undermine the successful functions already provided, for example, a reduction in coastal protection currently provided by sand dunes.
• Ensure that the goals and objectives of restoration will achieve as many purposes as possible, in recognition of the fact that wetlands provide a diversity of services (i.e., biodiversity conservation, flood control, water purification, food resources etc).
• Ensure that, from the beginning, the process is transparent and participatory involving effective and fair consultation and negotiation with all stakeholders within the landscape (both nearby as well as upstream).
• Integrate appropriate traditional knowledge into the restoration and management of wetland ecosystems and encourage multiple uses, through the re-establishment of indigenous and locally beneficial species.
• Ensure that, from the beginning, all relevant government departments – such as the Forest Department, the Coast Conservation Department, Central Environmental Authority, Urban Development Authority and the Department of Wildlife Conservation – are consulted and play a central role in restoration together with the local communities.
• Adopt a landscape approach to restoration - ecosystems do not function as closed units but as open systems that are affected by ecological processes that occur on a larger scale. Every effort at restoration should be assessed in the context of the landscape i.e., it is necessary to look at the broader picture and all wetland types within it - not just the local area or one wetland in isolation.
• Follow adaptive management practices that are based on continuous monitoring, learning and improvement, because complexity and uncertainty makes it impossible to predict restoration outcomes accurately. There is a need to recognise that the balance of ecosystem services provided by wetlands may not be the services required for in the future.
Key steps:• Tsunami-debris should be removed from wetlands. Fallen timber and other recyclable material (bricks, tiles,
etc.) should be salvaged for use or sale. [See information papers on beach and reef clean ups (Information Paper 4) and Solid waste management (Information Paper 5) for more details.]
• Great care should be taken to ensure that restoration activities do not harm or displace existing natural wetlands. For example, mangrove replanting or replanting of any other vegetation should not replace turtle nesting sites or seagrass beds.
• While undertaking cleanup operations or reconstruction activities in tsunami-affected areas, measures should be taken to avoid harming wetlands/vegetation that were relatively unscathed by the tsunami, or those that can regenerate naturally.
• Wetland species should be planted only in wetland habitats and not in other areas such as sandy beaches.• Care should be taken to replant with indigenous species suitable for the area and not introduce exotics species
as a part of the restoration process.• Any invasive alien plants such as Prickly pear (Opuntia dillennii) that may have been deposited in coastal
wetland habitats by the tsunami should be removed.• Priority for restoration should be given to specific wetlands that have high support from within the local
communities and from the government.• Local communities and government officials should be consulted to identify and agree upon local needs, local
restoration priorities, preferred species division of roles and responsibilities and mechanisms for sharing costs and benefits of restoration over the short, medium and long term. (See below for a list of recommended species for restoration of wetlands.)
• The specific restoration action needed for a particular area (i.e., protection/social fencing in areas with good nursery stock, assisted natural regeneration, ground preparation, planting, etc.) needs to be identified.
• It is essential that before commencement of restoration sufficient nursery material is available.• It is essential that a system for regular maintenance and monitoring of the restored wetland (for example,
guarding against illegal extraction of vegetation, etc.) be established.
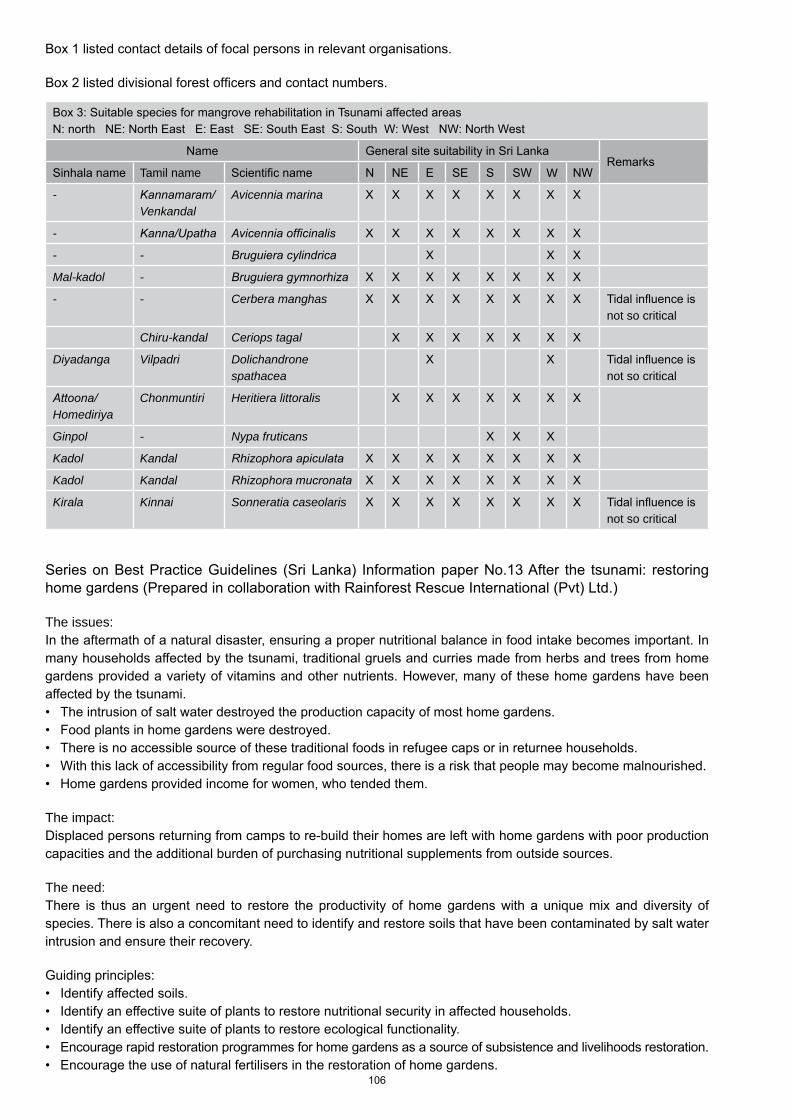
106
Box 1 listed contact details of focal persons in relevant organisations.
Box 2 listed divisional forest officers and contact numbers.
Box 3: Suitable species for mangrove rehabilitation in Tsunami affected areasN: north NE: North East E: East SE: South East S: South W: West NW: North West
Name General site suitability in Sri LankaRemarks
Sinhala name Tamil name Scientific name N NE E SE S SW W NW
- Kannamaram/Venkandal
Avicennia marina X X X X X X X X
- Kanna/Upatha Avicennia officinalis X X X X X X X X
- - Bruguiera cylindrica X X X
Mal-kadol - Bruguiera gymnorhiza X X X X X X X X
- - Cerbera manghas X X X X X X X X Tidal influence is not so critical
Chiru-kandal Ceriops tagal X X X X X X X
Diyadanga Vilpadri Dolichandrone spathacea
X X Tidal influence is not so critical
Attoona/ Homediriya
Chonmuntiri Heritiera littoralis X X X X X X X
Ginpol - Nypa fruticans X X X
Kadol Kandal Rhizophora apiculata X X X X X X X X
Kadol Kandal Rhizophora mucronata X X X X X X X X
Kirala Kinnai Sonneratia caseolaris X X X X X X X X Tidal influence is not so critical
Series on Best Practice Guidelines (Sri Lanka) Information paper No.13 After the tsunami: restoring home gardens (Prepared in collaboration with Rainforest Rescue International (Pvt) Ltd.)
The issues:In the aftermath of a natural disaster, ensuring a proper nutritional balance in food intake becomes important. In many households affected by the tsunami, traditional gruels and curries made from herbs and trees from home gardens provided a variety of vitamins and other nutrients. However, many of these home gardens have been affected by the tsunami.• The intrusion of salt water destroyed the production capacity of most home gardens.• Food plants in home gardens were destroyed.• There is no accessible source of these traditional foods in refugee caps or in returnee households.• With this lack of accessibility from regular food sources, there is a risk that people may become malnourished.• Home gardens provided income for women, who tended them.
The impact:Displaced persons returning from camps to re-build their homes are left with home gardens with poor production capacities and the additional burden of purchasing nutritional supplements from outside sources.
The need:There is thus an urgent need to restore the productivity of home gardens with a unique mix and diversity of species. There is also a concomitant need to identify and restore soils that have been contaminated by salt water intrusion and ensure their recovery.
Guiding principles:• Identify affected soils.• Identify an effective suite of plants to restore nutritional security in affected households.• Identify an effective suite of plants to restore ecological functionality.• Encourage rapid restoration programmes for home gardens as a source of subsistence and livelihoods restoration.• Encourage the use of natural fertilisers in the restoration of home gardens.
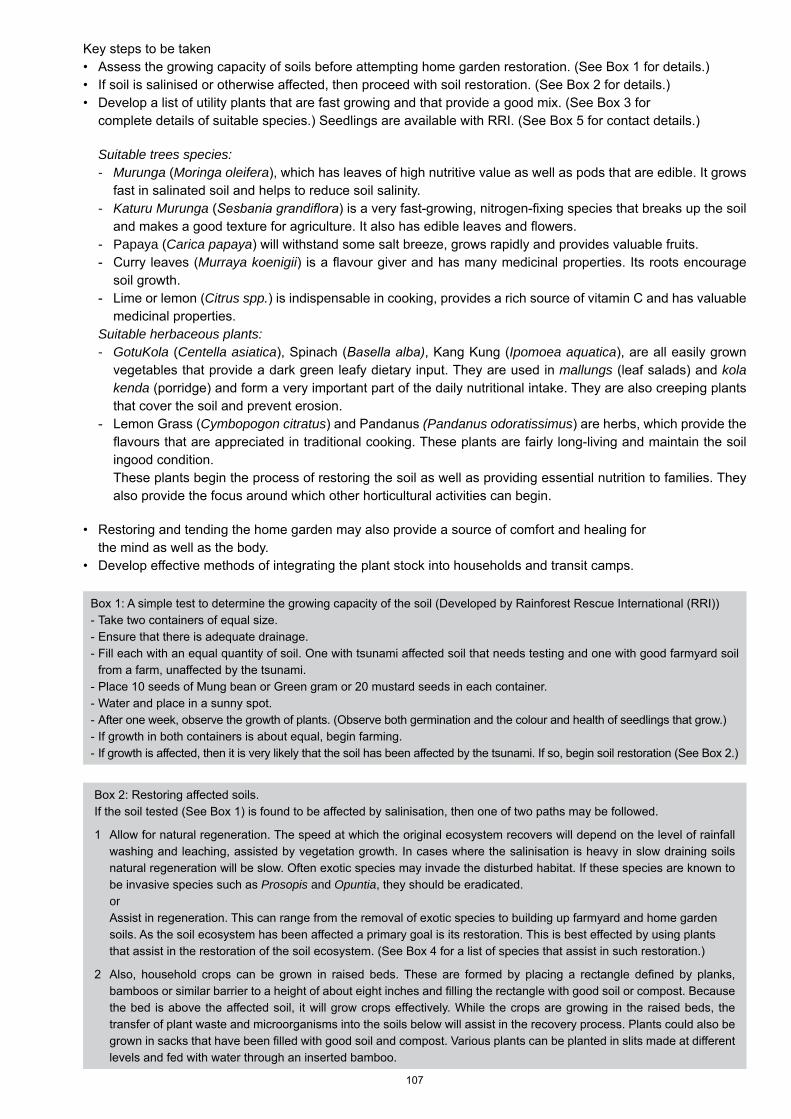
107
Key steps to be taken• Assess the growing capacity of soils before attempting home garden restoration. (See Box 1 for details.)• If soil is salinised or otherwise affected, then proceed with soil restoration. (See Box 2 for details.)• Develop a list of utility plants that are fast growing and that provide a good mix. (See Box 3 for
complete details of suitable species.) Seedlings are available with RRI. (See Box 5 for contact details.)
Suitable trees species: - Murunga (Moringa oleifera), which has leaves of high nutritive value as well as pods that are edible. It grows
fast in salinated soil and helps to reduce soil salinity. - Katuru Murunga (Sesbania grandiflora) is a very fast-growing, nitrogen-fixing species that breaks up the soil
and makes a good texture for agriculture. It also has edible leaves and flowers. - Papaya (Carica papaya) will withstand some salt breeze, grows rapidly and provides valuable fruits. - Curry leaves (Murraya koenigii) is a flavour giver and has many medicinal properties. Its roots encourage
soil growth. - Lime or lemon (Citrus spp.) is indispensable in cooking, provides a rich source of vitamin C and has valuable
medicinal properties. Suitable herbaceous plants: - GotuKola (Centella asiatica), Spinach (Basella alba), Kang Kung (Ipomoea aquatica), are all easily grown
vegetables that provide a dark green leafy dietary input. They are used in mallungs (leaf salads) and kola kenda (porridge) and form a very important part of the daily nutritional intake. They are also creeping plants that cover the soil and prevent erosion.
- Lemon Grass (Cymbopogon citratus) and Pandanus (Pandanus odoratissimus) are herbs, which provide the flavours that are appreciated in traditional cooking. These plants are fairly long-living and maintain the soil ingood condition.
These plants begin the process of restoring the soil as well as providing essential nutrition to families. They also provide the focus around which other horticultural activities can begin.
• Restoring and tending the home garden may also provide a source of comfort and healing for
the mind as well as the body.• Develop effective methods of integrating the plant stock into households and transit camps.
Box 1: A simple test to determine the growing capacity of the soil (Developed by Rainforest Rescue International (RRI))- Take two containers of equal size.- Ensure that there is adequate drainage.- Fill each with an equal quantity of soil. One with tsunami affected soil that needs testing and one with good farmyard soil
from a farm, unaffected by the tsunami.- Place 10 seeds of Mung bean or Green gram or 20 mustard seeds in each container.- Water and place in a sunny spot.- After one week, observe the growth of plants. (Observe both germination and the colour and health of seedlings that grow.)- If growth in both containers is about equal, begin farming.- If growth is affected, then it is very likely that the soil has been affected by the tsunami. If so, begin soil restoration (See Box 2.)
Box 2: Restoring affected soils.If the soil tested (See Box 1) is found to be affected by salinisation, then one of two paths may be followed.
1 Allow for natural regeneration. The speed at which the original ecosystem recovers will depend on the level of rainfall washing and leaching, assisted by vegetation growth. In cases where the salinisation is heavy in slow draining soils natural regeneration will be slow. Often exotic species may invade the disturbed habitat. If these species are known to be invasive species such as Prosopis and Opuntia, they should be eradicated.
or Assist in regeneration. This can range from the removal of exotic species to building up farmyard and home garden
soils. As the soil ecosystem has been affected a primary goal is its restoration. This is best effected by using plants that assist in the restoration of the soil ecosystem. (See Box 4 for a list of species that assist in such restoration.)
2 Also, household crops can be grown in raised beds. These are formed by placing a rectangle defined by planks, bamboos or similar barrier to a height of about eight inches and filling the rectangle with good soil or compost. Because the bed is above the affected soil, it will grow crops effectively. While the crops are growing in the raised beds, the transfer of plant waste and microorganisms into the soils below will assist in the recovery process. Plants could also be grown in sacks that have been filled with good soil and compost. Various plants can be planted in slits made at different levels and fed with water through an inserted bamboo.
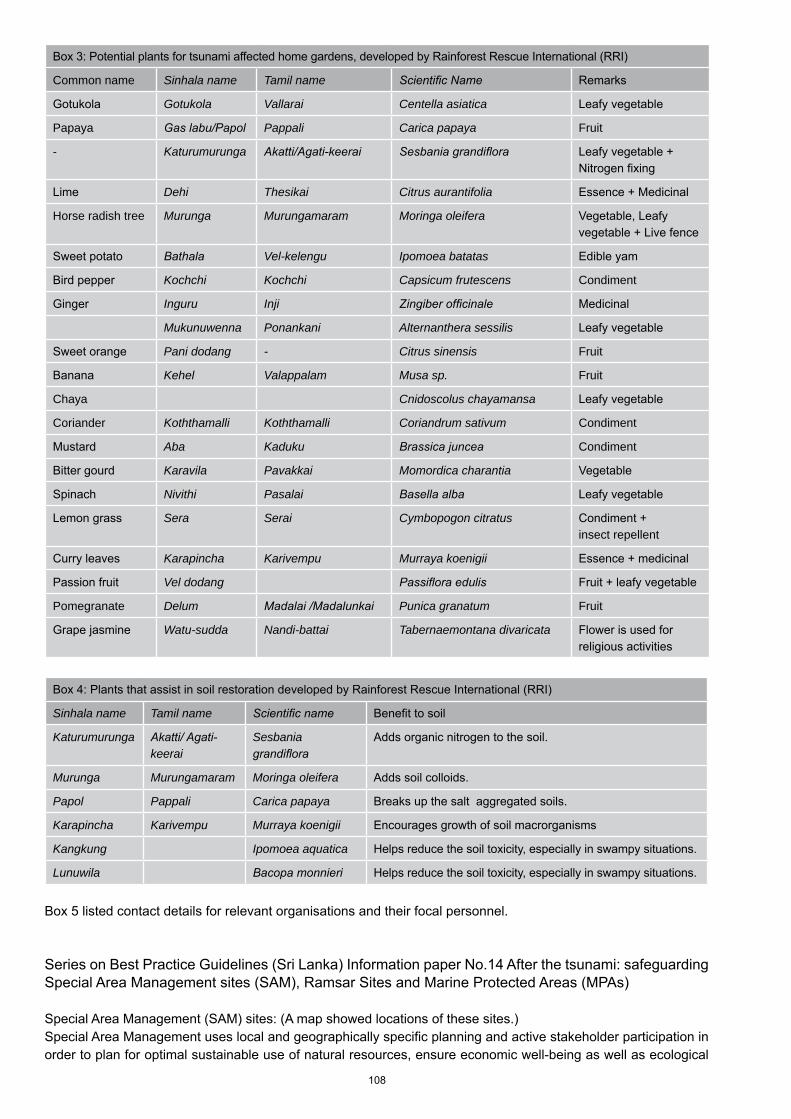
108
Box 3: Potential plants for tsunami affected home gardens, developed by Rainforest Rescue International (RRI)
Common name Sinhala name Tamil name Scientific Name Remarks
Gotukola Gotukola Vallarai Centella asiatica Leafy vegetable
Papaya Gas labu/Papol Pappali Carica papaya Fruit
- Katurumurunga Akatti/Agati-keerai Sesbania grandiflora Leafy vegetable +Nitrogen fixing
Lime Dehi Thesikai Citrus aurantifolia Essence + Medicinal
Horse radish tree Murunga Murungamaram Moringa oleifera Vegetable, Leafyvegetable + Live fence
Sweet potato Bathala Vel-kelengu Ipomoea batatas Edible yam
Bird pepper Kochchi Kochchi Capsicum frutescens Condiment
Ginger Inguru Inji Zingiber officinale Medicinal
Mukunuwenna Ponankani Alternanthera sessilis Leafy vegetable
Sweet orange Pani dodang - Citrus sinensis Fruit
Banana Kehel Valappalam Musa sp. Fruit
Chaya Cnidoscolus chayamansa Leafy vegetable
Coriander Koththamalli Koththamalli Coriandrum sativum Condiment
Mustard Aba Kaduku Brassica juncea Condiment
Bitter gourd Karavila Pavakkai Momordica charantia Vegetable
Spinach Nivithi Pasalai Basella alba Leafy vegetable
Lemon grass Sera Serai Cymbopogon citratus Condiment +insect repellent
Curry leaves Karapincha Karivempu Murraya koenigii Essence + medicinal
Passion fruit Vel dodang Passiflora edulis Fruit + leafy vegetable
Pomegranate Delum Madalai /Madalunkai Punica granatum Fruit
Grape jasmine Watu-sudda Nandi-battai Tabernaemontana divaricata Flower is used for religious activities
Box 4: Plants that assist in soil restoration developed by Rainforest Rescue International (RRI)
Sinhala name Tamil name Scientific name Benefit to soil
Katurumurunga Akatti/ Agati-keerai
Sesbania grandiflora
Adds organic nitrogen to the soil.
Murunga Murungamaram Moringa oleifera Adds soil colloids.
Papol Pappali Carica papaya Breaks up the salt aggregated soils.
Karapincha Karivempu Murraya koenigii Encourages growth of soil macrorganisms
Kangkung Ipomoea aquatica Helps reduce the soil toxicity, especially in swampy situations.
Lunuwila Bacopa monnieri Helps reduce the soil toxicity, especially in swampy situations.
Box 5 listed contact details for relevant organisations and their focal personnel.
Series on Best Practice Guidelines (Sri Lanka) Information paper No.14 After the tsunami: safeguarding Special Area Management sites (SAM), Ramsar Sites and Marine Protected Areas (MPAs)
Special Area Management (SAM) sites: (A map showed locations of these sites.)Special Area Management uses local and geographically specific planning and active stakeholder participation in order to plan for optimal sustainable use of natural resources, ensure economic well-being as well as ecological
109
integrity, and to practise sound natural resource management. This key concept was introduced in the 1980s as a tool for resource management in the coastal zone and has been an integral part of the coastal zone management plan of the Coast Conservation Department, since the 1990s.
Since the late 1990s, nine SAM sites have been chosen based on agreed criteria such as severity of issues relating to resource use, richness of biodiversity, economic significance and the process of participatory management. Work in these sites is already ongoing. Benefits gained from the SAM process include zoning of sites to maximise ecological protection yet allowing sustainable use, poverty alleviation by provision of facilities for the enhancement of livelihoods, social upliftment through various community-based training programmes and improvement of water quality and waste management. A further 27 sites have been proposed using the same criteria and are identified as high priority areas. These SAM sites are managed under the aegis of the Coast Conservation Department and the Coast Conservation Act of No. 57 of 1981 and its amendments.
Listed after this was the district, location and name of SAM and proposed SAM sites.
Marine Protected Areas (MPAs): (A map showed locations of these sites.)Marine Protected Areas (MPAs) are marine areas of outstanding national significance, conserved by law under the jurisdiction of the Department of Wildlife Conservation, to provide protection of their valuable natural resources. MPAs fulfil a number of functions, including the conservation of biodiversity, sustainable management of natural resources for livelihoods, protection of endangered species and habitats, as well as their contribution to the tourist industry.
Four MPAs have been declared under the Fauna and Flora Protection Ordinance (FFPO) in 1993a. The district and names of these MPAs were listed.
Ramsar Sites: (A map showed locations of these sites.)In addition to these SAM sites and MPAs there are three declared Ramsar sites, i.e., wetlands of international importance, both for the conservation of migratory waterfowl and for the sustenance of local livelihoods. Coastal areas in two of these declared sites - Bundala National Park, and Maduganga estuary (a SAM site and also a proposed sanctuary) - were affected by the tsunami.
The issues:There is a risk that reconstruction activities in areas close to SAM and Ramsar sites, and MPAs may not be carried out with due environmental consideration. This could mean that these sites that provide vital livelihood and environmental functions may be affected adversely.
Improperly planned reconstruction may cause pollution, both during reconstruction and also in the long term as •a result of poor design, thus damaging SAM and Ramsar sites, and MPAs.Continuation of illegal activities such as mining for lime, sand mining in rivers (which interrupts the natural deposition •of sand to beaches) and blast fishing will have a huge negative impact on SAMs, Ramsar sites, and MPAs.
The impacts:SAM sites are noted for the economic and livelihoods value of the resources they hold, and the effective •management of natural resources in these areas are important for sustainable livelihoods and local economies. Destruction of valuable natural resources in these areas will have a severe impact on communities with high levels of dependence on these resources for their livelihoods.SAMs, Ramsar sites and MPAs can help protect low lying coastal areas from extreme weather events such •as tropical storms and tsunamis and need to be maintained for the future security of coastal communities. These sites also act as buffers, protecting coastal areas from erosion. Damage sustained to these during the reconstruction effort may increase the vulnerability of coastal populations to extreme weather events and lead to severe coastal erosion, which may adversely affect current and planned coastal developments.Marine ecosystems are three-dimensional - the water column supports different species from that of the seabed •– and many marine species rely heavily on water currents for the dispersal of larvae and seed. MPAs provide a vital function in serving as sources from which seed and larvae can disperse naturally to other marine areas. Thus, proper conservation and management of existing MPAs is critical for natural regeneration of marine ecosystems beyond the boundaries of the MPAs themselves. Many fish stocks are already seriously depleted due to over fishing. SAM sites and MPAs provide a refuge •for many species, and healthy populations within SAM sites and MPAs can spill over to non-managed areas, replenishing stocks of fish that are targeted by fishermen. SAM sites and MPAs therefore assist in maintaining
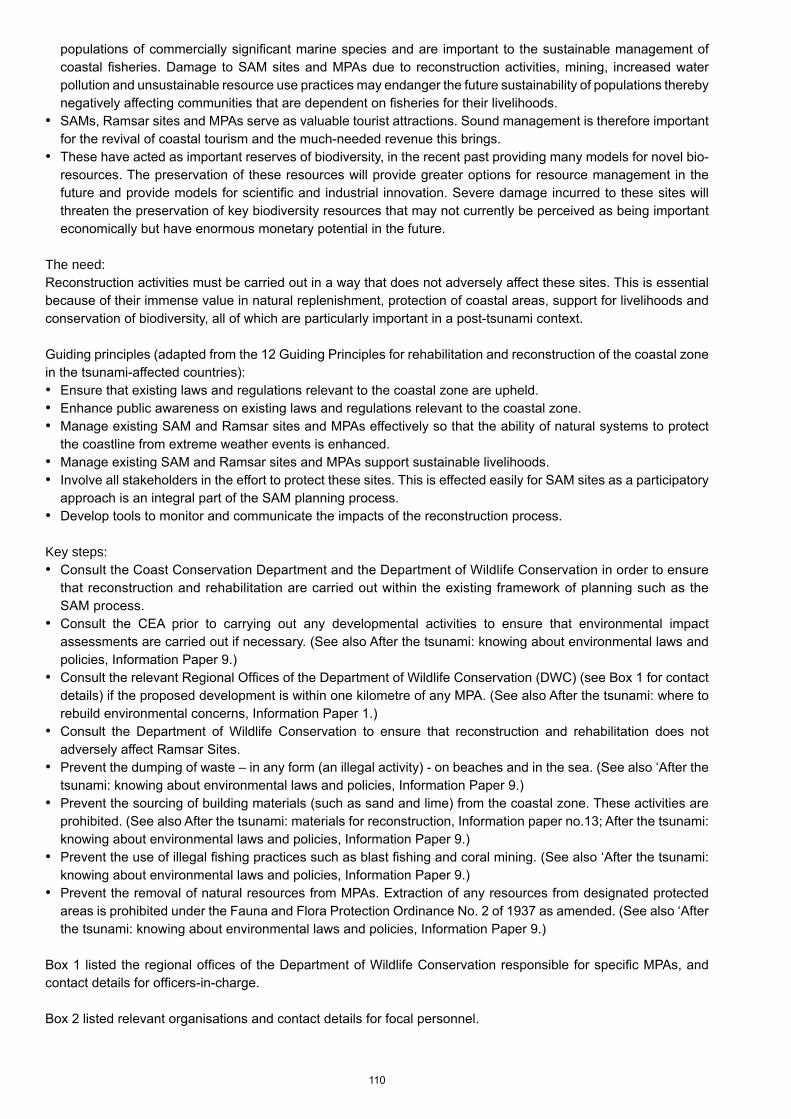
110
populations of commercially significant marine species and are important to the sustainable management of coastal fisheries. Damage to SAM sites and MPAs due to reconstruction activities, mining, increased water pollution and unsustainable resource use practices may endanger the future sustainability of populations thereby negatively affecting communities that are dependent on fisheries for their livelihoods.SAMs, Ramsar sites and MPAs serve as valuable tourist attractions. Sound management is therefore important •for the revival of coastal tourism and the much-needed revenue this brings.These have acted as important reserves of biodiversity, in the recent past providing many models for novel bio-•resources. The preservation of these resources will provide greater options for resource management in the future and provide models for scientific and industrial innovation. Severe damage incurred to these sites will threaten the preservation of key biodiversity resources that may not currently be perceived as being important economically but have enormous monetary potential in the future.
The need:Reconstruction activities must be carried out in a way that does not adversely affect these sites. This is essential because of their immense value in natural replenishment, protection of coastal areas, support for livelihoods and conservation of biodiversity, all of which are particularly important in a post-tsunami context.
Guiding principles (adapted from the 12 Guiding Principles for rehabilitation and reconstruction of the coastal zone in the tsunami-affected countries):
Ensure that existing laws and regulations relevant to the coastal zone are upheld. •Enhance public awareness on existing laws and regulations relevant to the coastal zone. •Manage existing SAM and Ramsar sites and MPAs effectively so that the ability of natural systems to protect •the coastline from extreme weather events is enhanced.Manage existing SAM and Ramsar sites and MPAs support sustainable livelihoods.•Involve all stakeholders in the effort to protect these sites. This is effected easily for SAM sites as a participatory •approach is an integral part of the SAM planning process. Develop tools to monitor and communicate the impacts of the reconstruction process.•
Key steps:Consult the Coast Conservation Department and the Department of Wildlife Conservation in order to ensure •that reconstruction and rehabilitation are carried out within the existing framework of planning such as the SAM process.Consult the CEA prior to carrying out any developmental activities to ensure that environmental impact •assessments are carried out if necessary. (See also After the tsunami: knowing about environmental laws and policies, Information Paper 9.) Consult the relevant Regional Offices of the Department of Wildlife Conservation (DWC) (see Box 1 for contact •details) if the proposed development is within one kilometre of any MPA. (See also After the tsunami: where to rebuild environmental concerns, Information Paper 1.)Consult the Department of Wildlife Conservation to ensure that reconstruction and rehabilitation does not •adversely affect Ramsar Sites. Prevent the dumping of waste – in any form (an illegal activity) - on beaches and in the sea. (See also ‘After the •tsunami: knowing about environmental laws and policies, Information Paper 9.)Prevent the sourcing of building materials (such as sand and lime) from the coastal zone. These activities are •prohibited. (See also After the tsunami: materials for reconstruction, Information paper no.13; After the tsunami: knowing about environmental laws and policies, Information Paper 9.)Prevent the use of illegal fishing practices such as blast fishing and coral mining. (See also ‘After the tsunami: •knowing about environmental laws and policies, Information Paper 9.)Prevent the removal of natural resources from MPAs. Extraction of any resources from designated protected •areas is prohibited under the Fauna and Flora Protection Ordinance No. 2 of 1937 as amended. (See also ‘After the tsunami: knowing about environmental laws and policies, Information Paper 9.)
Box 1 listed the regional offices of the Department of Wildlife Conservation responsible for specific MPAs, and contact details for officers-in-charge.
Box 2 listed relevant organisations and contact details for focal personnel.
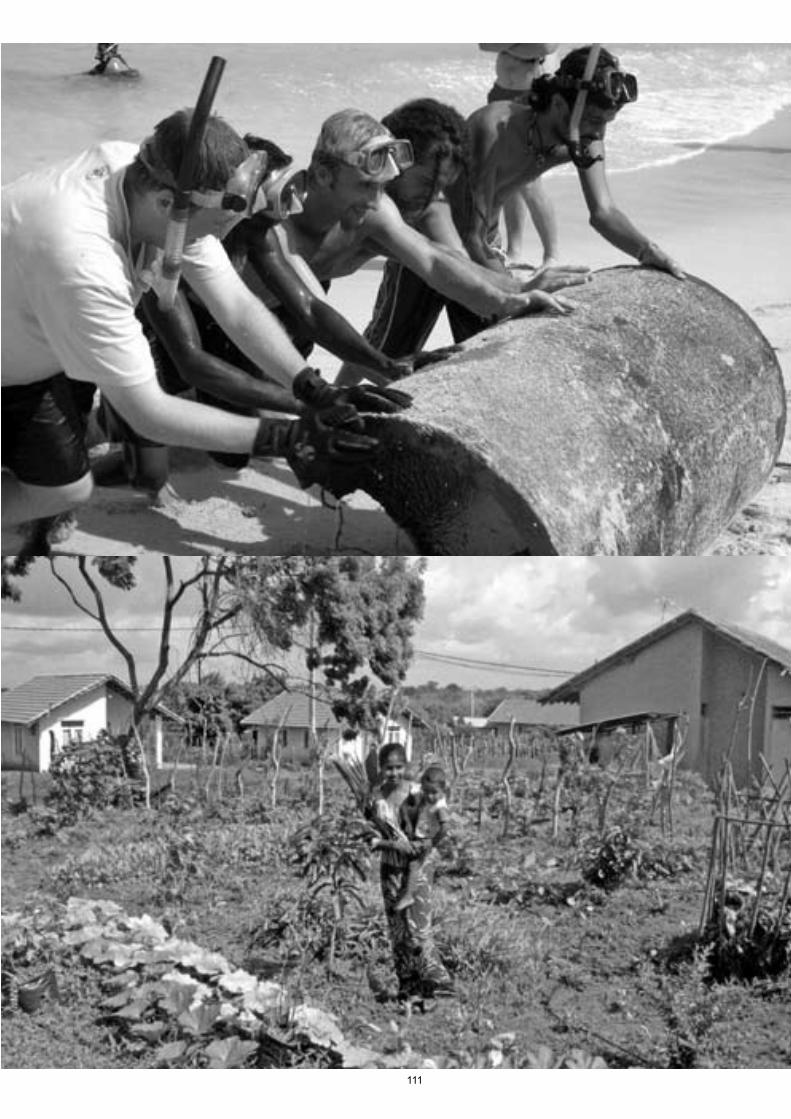
111
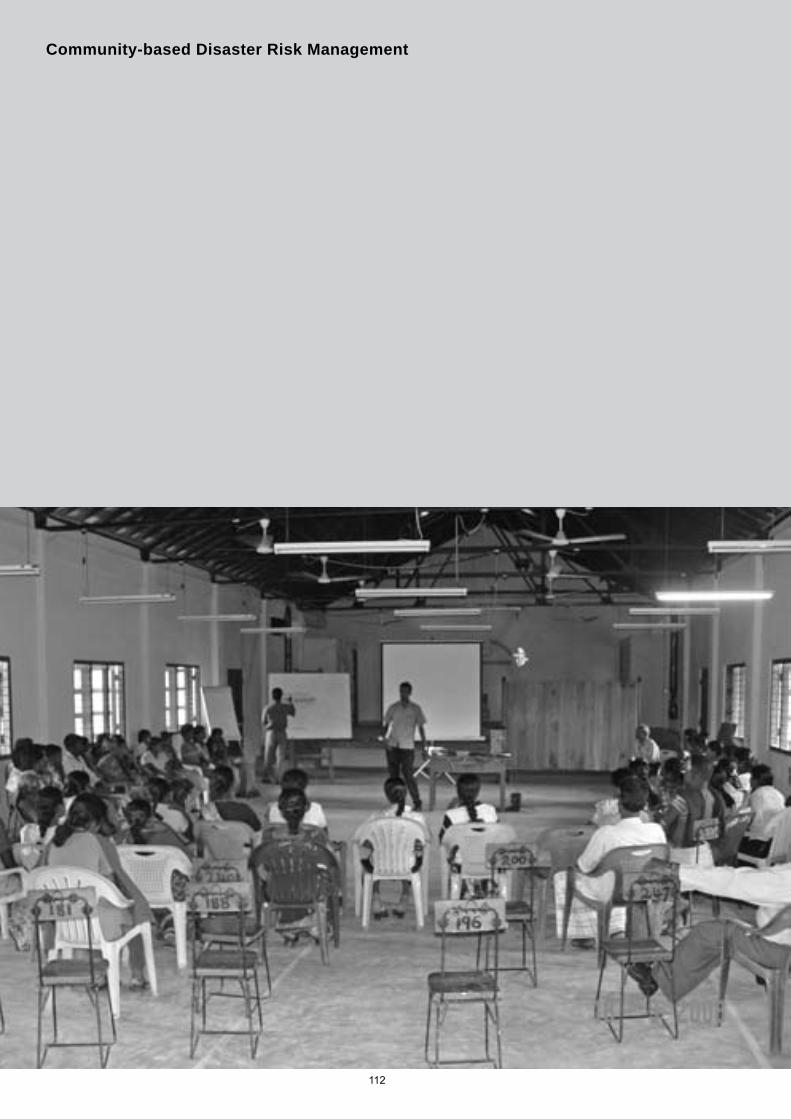
112
Community-based Disaster Risk Management
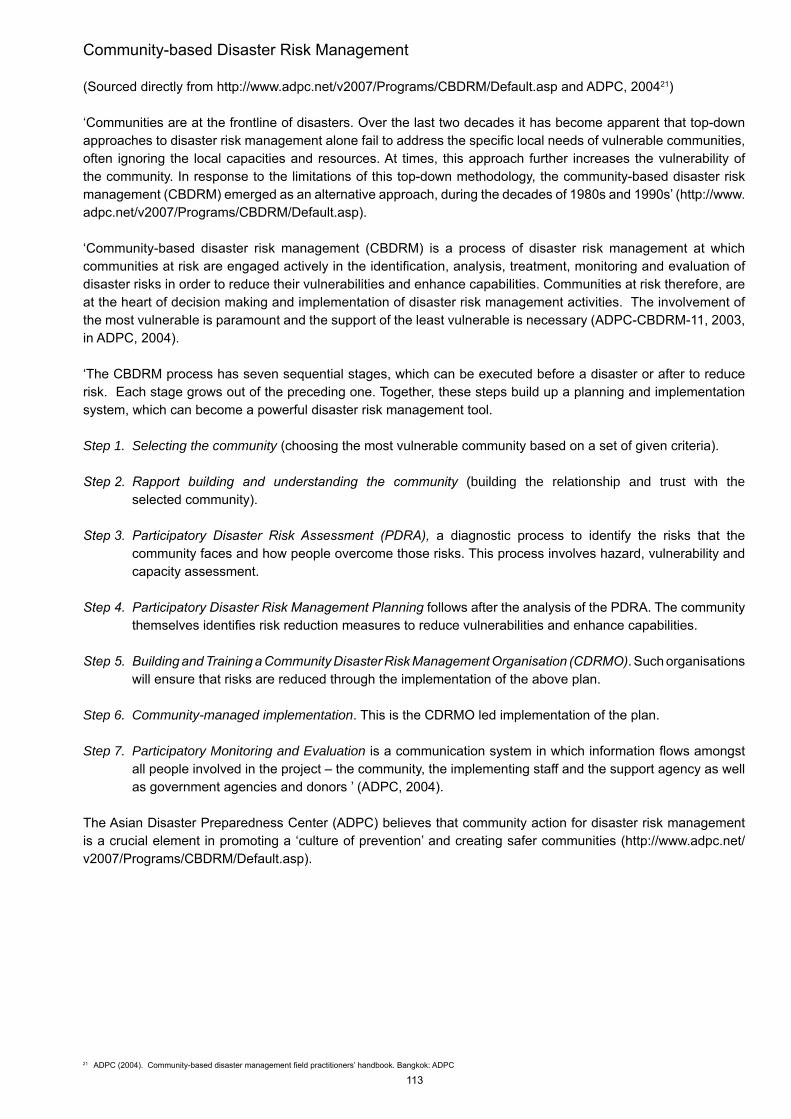
113
Community-based Disaster Risk Management
(Sourced directly from http://www.adpc.net/v2007/Programs/CBDRM/Default.asp and ADPC, 200421)
‘Communities are at the frontline of disasters. Over the last two decades it has become apparent that top-down approaches to disaster risk management alone fail to address the specific local needs of vulnerable communities, often ignoring the local capacities and resources. At times, this approach further increases the vulnerability of the community. In response to the limitations of this top-down methodology, the community-based disaster risk management (CBDRM) emerged as an alternative approach, during the decades of 1980s and 1990s’ (http://www.adpc.net/v2007/Programs/CBDRM/Default.asp).
‘Community-based disaster risk management (CBDRM) is a process of disaster risk management at which communities at risk are engaged actively in the identification, analysis, treatment, monitoring and evaluation of disaster risks in order to reduce their vulnerabilities and enhance capabilities. Communities at risk therefore, are at the heart of decision making and implementation of disaster risk management activities. The involvement of the most vulnerable is paramount and the support of the least vulnerable is necessary (ADPC-CBDRM-11, 2003, in ADPC, 2004). ‘The CBDRM process has seven sequential stages, which can be executed before a disaster or after to reduce risk. Each stage grows out of the preceding one. Together, these steps build up a planning and implementation system, which can become a powerful disaster risk management tool.
Step 1. Selecting the community (choosing the most vulnerable community based on a set of given criteria).
Step 2. Rapport building and understanding the community (building the relationship and trust with the selected community).
Step 3. Participatory Disaster Risk Assessment (PDRA), a diagnostic process to identify the risks that the community faces and how people overcome those risks. This process involves hazard, vulnerability and capacity assessment.
Step 4. Participatory Disaster Risk Management Planning follows after the analysis of the PDRA. The community themselves identifies risk reduction measures to reduce vulnerabilities and enhance capabilities.
Step 5. Building and Training a Community Disaster Risk Management Organisation (CDRMO). Such organisations will ensure that risks are reduced through the implementation of the above plan.
Step 6. Community-managed implementation. This is the CDRMO led implementation of the plan.
Step 7. Participatory Monitoring and Evaluation is a communication system in which information flows amongst all people involved in the project – the community, the implementing staff and the support agency as well as government agencies and donors ’ (ADPC, 2004).
The Asian Disaster Preparedness Center (ADPC) believes that community action for disaster risk management is a crucial element in promoting a ‘culture of prevention’ and creating safer communities (http://www.adpc.net/v2007/Programs/CBDRM/Default.asp).
21 ADPC (2004). Community-based disaster management field practitioners’ handbook. Bangkok: ADPC
114
The Cairo Principles
115
Annotated guiding principles for post-tsunami rehabilitation and reconstruction (Cairo Principles)22
Introduction:
The global problem and the need for principles:The recent tragedy of the tsunami in the Indian Ocean has generated an unprecedented amount of relief and support from the donor community and private organisations, and extraordinary generosity from neighbouring communities adjacent to those devastated. Because of the scale of the impact and the immediate humanitarian needs, actions were initially focused on emergency needs for shelter, food, and medical care. Another priority has been to begin immediately to design and build a warning system for such disasters. The biggest and most protracted challenge will be to rebuild and rehabilitate hundreds of kilometers of devastated coastline, and re-establish livelihoods for over a million displaced people.
This is a huge challenge since many of the affected shorelines are densely populated - in most cases by poor people. Before the rebuilding begins we must commit to avoid needlessly repeating the mistakes of the past – for example, forms of coastal development that pushed the poor into the most unhealthy and hazardous corners of the coast and produced patterns of construction that are inefficient, inequitable, and unsustainable.
To guide the massive coastal reconstruction effort, the United Nations Environment Programme (UNEP) Tsunami Disaster Task Force in cooperation with the UNEP Coordination Office of the Global Programme of Action for the Protection of the Marine Environment from Land-based Activities (UNEP/GPA), convened a meeting on February 17th, 2005 in Cairo to discuss coastal zone rehabilitation and management in the tsunami-affected region. Attendees from the affected nations and supporting international institutions endorsed twelve key principles (hereafter referred to as the Guiding Principles) consistent with an advance to more sustainable forms of coastal development and the United Nations Millennium Development Goals.
If adopted and applied throughout the affected region, the guiding principles will:• Allow those involved to sequence their actions following a common set of priorities;• Strengthen our collective commitment to rehabilitate and protect coastal communities and increase the efficiency
of our actions;• Provide the basis for regional workshops and discussions to pinpoint local needs and priorities;• Facilitate the exchange of experience and the rapid dissemination of emerging good practices.
The guiding principles:
Over-arching principle:1. Reduce the vulnerability of coastal communities to natural hazards by establishing a regional early warning
system; and applying construction setbacks, greenbelts and other no-build areas in each nation, founded on a science-based mapped ‘reference line.’
Using concepts of integrated coastal management, including public engagement in local decision-making, employ a rapid assessment zoning and planning process to:2. Promote early resettlement with provision for safe housing; debris clearance; potable water, sanitation and
drainage services; and access to sustainable livelihood options.3. Enhance the ability of the natural system to act as a bio-shield to protect people and their livelihoods by
conserving, managing and restoring wetlands, mangroves, spawning areas, seagrass beds and coral reefs; and by seeking alternative sustainable sources of building materials, with the aim of keeping coastal sand, coral, mangroves and rock in place.
4. Promote design that is cost-effective, appropriate and consistent with best practice and placement of infrastructure away from hazard and resource areas, favouring innovative and soft engineering solutions to coastal erosion control.
5. Respect traditional public access and uses of the shoreline, and protect religious and cultural sites.6. Adopt ecosystem based management measures; promote sustainable fisheries management in over-fished
areas, and encourage low impact aquaculture.7. Promote sustainable tourism that respects setback lines and carrying capacity, benefits local communities and
applies adequate management practices.
22 Drafted by UNEP/GPA in cooperation with Stephen Bloye Olsen, et al, University of Rhode Island, USA. The entire draft is reproduced here. http://www.cobsea.org/Cairo%20Guiding%20Principles.pdf
116
How things are done is as important, sometimes more important, than what is done. Local knowledge and insights are critically important to successful planning and decision-making, and local citizens must be engaged in the rehabilitation and reconstruction process at every stage. It is essential that the application of the construction set back line and the boundaries of bio-shields are defined in consultation with the local communities coastal reach by coastal reach. 8. Secure commitments from governments and international organisations to abide by these Principles and build
on and strengthen existing institutional arrangements where possible.9. Ensure public participation through capacity building and the effective utilisation of all means of communication
to achieve outcomes that meet the needs and realities of each situation.10. Make full use of tools such as strategic environmental assessment, spatial planning and environmental impact
assessment, to identify trade-offs and options for a sustainable future.11. Develop mechanisms and tools to monitor and periodically communicate the outcomes of the reconstruction
through indicators that reflect socio-economic change and ecosystem health.12. Widely disseminate good practices and lessons learned as they emerge.
Applying the Principles place by place:A feature critical to the successful practice of coastal management is the ability to tailor principles such as those adopted in Cairo to the unique needs and conditions present in a specific locale. For example, on low lying shores like those in Bangladesh and the Maldives, a construction setback may not be effective in reducing the vulnerability of people to rising sea level, waves and flooding. In such places, focusing on building cyclone shelters and community-based emergency plans is the best approach. However, in other situations relocating damaged roads, railroads and dwellings to higher ground is both feasible and sensible. Setbacks, greenbelts and no-build zones have been repeatedly shown to be effective in reducing hazards and enhancing environmental qualities in a wide diversity of settings within the region affected by the tsunami and elsewhere. In all cases, protecting and restoring coral reefs, dunes, estuaries and seagrass beds makes coastal systems more resilient and capable of sustaining a diversity of livelihoods and a flow of benefits to the people of the place.
It has been learned repeatedly that successful implementation of a set of principles and a plan of action rests on the active and sustained participation, support and understanding of the affected communities. Without such support, investments in planning and implementation are likely to be ignored or resisted and will not generate a sustained flow of benefits. In this booklet, we use the term ‘coastal reach by coastal reach’ and ‘reach by reach’ to describe a process of planning and decision making that addresses stretches of coastline with similar characteristics and of an appropriate size to make the engagement of local people practical and possible. A coastal reach typically extends between headlands or demarcates a length of shoreline with similar rural or urban characteristics typically extending five to 20 kilometers. For the purposes of coastal management, reaches often need to be smaller for intensely utilised coasts where a diversity of activities are competing for space. Thus, while it is the responsibility of national governments to set the policies and procedures that require setbacks, bio-shields, priorities for settlement and re-establishing livelihoods, the details of how such policies will be applied in a specific locale must make provision for local consultations and tailoring to existing conditions and needs. The precise delineation of a construction setback and identification of additional no-build areas within bio-shields requires soliciting local knowledge and responding to local needs and local conditions.
The principles adopted in Cairo and the more detailed guidance offered in this booklet are divided into two groups. Principles 1 though 7 focus on the priority technical measures. These address what must be done in order to better prepare shorefront communities for future change and to design and implement a rehabilitation and reconstruction process that, where possible, creates conditions superior to those that were present before the tsunami struck. They draw on the scientific knowledge that has evolved in recent decades as coastal processes and their interaction with human activities have been analysed. The lessons learned from the reconstruction and rehabilitation following other natural disasters form the substance of the first seven principles.
In any emergency, the order in which actions are taken is important. The delineation of construction setbacks and improving the long-term conditions of the poor are top priorities and are, therefore, addressed first in both the Cairo Principles and the guidance offered in this booklet.
Principles 8 through 12 deal with how to apply the principles. These principles draw upon the experience in dozens of nations over the past forty years in the evolution of what has come to be called ‘integrated coastal management’ (ICM). These principles address the processes of public participation, the usefulness of setting unambiguous goals at both national and local scales, the evaluation of results, and the dissemination of experience and new knowledge.
117
I. Priority technical measures:
Principle 1 (Over-arching principle):Reduce the vulnerability of coastal communities to natural hazards by establishing a regional early warning system; and applying construction setbacks, greenbelts and other no-build areas in each nation, founded on a science-based mapped ‘reference line.’
It is not possible to sustain any development in coastal areas if the huge energy and natural dynamics of coastal systems are ignored. Many of the adverse social and economic impacts of the tsunami have occurred because people have been made more vulnerable to natural hazards through poor planning and the ineffective management of coastal development. The technical difficulties and financial costs of opposing the natural dynamics of coastal systems far outweigh the long-term benefits that can be gained by working with the natural processes that create and maintain healthy ecosystems and a flow of social and economic benefits to humankind.
At a time when human populations are becoming increasingly concentrated along coastlines, sea level is rising and long established weather patterns are changing. We therefore know that hazards created by storms, the reshaping of coastlines by processes of erosion and accretion, instabilities produced by new patterns of land use as well as such relatively rare occurrences as tsunami will together make shorelines increasingly hazard-prone.
The nations of the region and several international organisations are working together to develop an effective tsunami early warning system that will reach the entire regional community, particularly the most vulnerable groups.
• What is known about past and future coastal change can be applied to define a reference line showing where the shoreline is anticipated to be, for example, by 2050. Detailed aerial photographs could be prepared reach by reach for all of the region’s shoreline, showing conditions as they were before and after the tsunami. A reference line could be drawn on such photographs showing the mean high water mark anticipated by the 2050 median projection for a sea level rise of 30cm made by the Intergovernmental Panel on Climate Change (IPCC). This reference line should be modified by other tectonic and coastal data affecting anticipated coastal change in specific areas. Where information is available, data on the anticipated effect of historical trends in erosion and accretion to 2050 and the inland extent of flooding in past storms should also be integrated into estimates of the future position of shorelines.
• A recommended construction setback line should be established by each government as a set distance and/or elevation inland of the reference line. The area seaward of the setback line should be designated as a strictly enforced ‘no-build’ zone. It is essential that such setbacks are incorporated into the existing regulatory system and are applied equitably to the wealthy and the poor.
• On low-lying shorelines with little topographical relief, practical disaster preparedness plans should be developed and tested that feature speedy evacuation of people to protected shelters.
• The width of the no-build zone determined by the setback should be greater in as-yet-undeveloped shores than in already urbanised areas.
• Designate setback lines with permanent on-site markers and enforce them uniformly as a regulatory measure. • Exceptions for building structures seaward of the setback line should be granted only where required
to support such water-dependent activities as fishing and navigation (not tourist facilities or permanent settlements). Where such exceptions are granted, structures should be temporary or built to withstand flooding by strengthened structural members and elevated first floors that permit flood waters to flow through unimpeded. Attention should be given to the impact of such structures on adjacent coastal areas, and mitigation actions taken.
• The granting of such exceptions for construction seaward of the setback line should be based on clear and uniform criteria and applied through a highly transparent process with opportunities for comment by the local community.
Principle 2:Promote early resettlement with provision for safe housing; debris clearance; potable water, sanitation and drainage services and access to sustainable livelihood options.
Putting people first in rehabilitation requires moving quickly to resettle those displaced by the tsunami in a manner that provides the poor with living conditions and services that are better than those that existed before the disaster. Those that have lost property and cannot rebuild because their properties are within the no-build zone must be compensated adequately.
118
• Where practicable, identify sites beyond the ‘no build zone’ for permanent housing for those displaced by the tsunami, and for reconstruction of essential infrastructure, such as access to roads, water supply and sanitation, waste water treatment and solid waste disposal.
• Avoid or minimise involuntary resettlement - in accordance with the Guiding Principles on Internal Displacement presented to the UN Commission on Human Rights and the General Assembly. A ‘no build zone’ applied to a settled coastline may have severe consequences for those deprived of land tenure or 120 rights of residence. Where relocation is judged to be in the best long-term interest of those affected, provide adequate compensation for land and property. Also, establish channels for grievance resolution at the appropriate levels of government.
• Adopt appropriate building codes for all structures, including seismic codes in earthquake prone areas. • Provide potable water, sewage collection and treatment, and adequate drainage systems in all new and
reconstructed communities. • Favour standardised, modular systems with interchangeable components to achieve cost savings and
reduce future maintenance costs. • Encourage the use of local labor in all phases of the reconstruction process thereby generating employment
and enhancing the marketable skills of the poor.
Principle 3:Enhance the ability of the natural system to act as a bio-shield to protect people and their livelihoods by conserving, managing and restoring wetlands, mangroves, spawning areas, seagrass beds and coral reefs; and by seeking alternatives.
Natural barriers to flooding and coastal erosion, such as coral reefs, near-shore rock outcrops, sandbars, and sand dunes should be protected from construction activity and uses that compromise their structural integrity. They reduce, absorb and redirect waves and floodwaters. Wetlands, lagoons, river estuaries, and reefs are essential to sustaining fisheries, public health and the many livelihoods that support coastal populations. They contribute to a healthy and aesthetically pleasing environment for a seaside holiday. A portion of the funds for rehabilitation should therefore be assigned to protect and restore these habitats.
Reconstruction will require thousands of cubic meters of sand for cement and for fill, and building materials of every description. Traditionally, many of these materials have been taken from the coast itself. When sand is mined from beaches, dunes and coastal rivers, mangroves are cut for timber, and wetlands filled as building sites coastal settlements become more vulnerable to hazards of every description.
• Conduct rapid assessments that involve local people in the identification of natural areas important to fisheries production, the recycling of wastes, shoreline stabilisation and scenic quality, including coastal wetlands and mangroves, seagrass beds, and coral reefs. The aerial photographs and maps used for establishing setback lines can be used in this process of identifying critical areas.
• Incorporate these natural features and habitats into a designated coastal bio-shield that maximises the protection from coastal hazards and the associated benefits provided by these natural features. Adopt measures to protect bio-shields from activities that compromise their natural qualities. Protect them from future disturbance and, where feasible, restore them.
• Where feasible, plant trees seaward of the setback line to form a greenbelt that buffers the shore from waves, floods and erosion.
• Prohibit the mining of sand, coral and stone from coastal waters within the 20m depth contour. • Regulate sand mining from rivers. • Declare wetlands and mangroves as off limits for harvest of wood. • Prohibit the filling of wetlands and estuaries.
Principle 4:Promote design that is cost-effective, appropriate and consistent with best practice and placement of infrastructure away from hazard and resource areas, and favouring innovative and soft engineering solutions to coastal erosion control.
The reconstruction is an unprecedented opportunity to relocate communities away from hazardous and unhealthy areas, rectify badly designed infrastructure and services, and reduce previous inequities in their availability and distribution.
• Place arterial roads, railroads and other transportation infrastructure well inside the setback line, and site access-ways perpendicular to the coast.
119
• Limit investments in erosion control to those situations where pre-existing infrastructure or settlements make it cost-effective, and where it is considered environmentally justifiable; favour soft solutions (placement of sand, planting vegetation) over hard solutions (breakwaters, groynes, shoreline armouring).
• Identify natural barriers to flooding and coastal erosion, specifically coral reefs, near-shore rock outcrops, sand bars, and sand dunes; protect them from construction activity and uses that compromise their structural integrity.
Principle 5: Respect traditional public access and uses of the shoreline, and protect religious and cultural sites.
• Identify with permanent on-site markers and preserve public rights of way to the shore. All coastal development initiatives should respect the customary rights of local communities to the coastline, and recognise these areas as public domain.
• Assure that landing sites for local fishers and associated facilities for cleaning catches and storing fishing gear are restored or relocated to an equivalent or better nearby location.
• Identify with permanent on-site markers and preserve religious or cultural sites valued by local residents. Coastal development should keep these special coastal features accessible and protect their visual integrity.
Principle 6:Adopt ecosystem based management measures; promote sustainable fisheries management in over-fished areas, and encourage low impact aquaculture.
The rehabilitation of hundreds of kilometers of shoreline should generate many opportunities for more diversified and more sustainable livelihoods. A primary concern must be the future prospects of communities dependent upon fishing. These same communities contain a high proportion of the region’s poorest people. A recent statement prepared by WorldFish points out that coastal fisheries in Asia were depleted severely and over-fished before the tsunami. Too many boats taking too many fish had in some areas reduced fish stocks to less than 10% of their original levels and destroyed or degraded the habitats upon which these potentially renewable resources depend. A trend toward the use of damaging gear and the use of increasingly destructive fishing methods -such as small mesh nets that take juveniles - has made the situation progressively worse. The tsunami has only added to the problem.
• While assisting fishers by replacing equipment and rebuilding boats, ensure that less destructive and more sustainable fishing practices are adopted.
• Assist fishers who do not wish to return to fishing by developing alternative livelihoods. This will contribute to reducing fishing effort and restoring natural resources.
• Promote employment-intensive fisheries operations that contribute directly to poverty alleviation and food security.
• Implement integrated coastal fisheries management (ICFM). This approach is centered on the development of management plans that incorporate social, economic and biological objectives.
• Develop investments, training and infrastructure that reduce post-harvest losses. In rebuilding destroyed infrastructure and processing facilities and creating new ones, make investments to minimise postharvest losses and add value to catches. This will also provide additional livelihoods, particularly for women, when it emphasises the use of employment-intensive, low-cost, hygienic technologies.
• Encourage investment in community-based aquaculture and other livelihoods that bring benefits to local populations and do not degrade coastal ecosystems. Rehabilitated aquaculture must adopt environmentally sound management practices that do not pollute, damage habitats or cause long-term harm, including use of feed that is taken from sustainable sources and seeds that are raised in environmentally sound hatcheries or taken from sustainable fisheries.
• Modify the placement and density of shrimp aquaculture operations to reduce environmental degradation and adverse impacts on other coastal activities. In particular, subject shrimp ponds to siting criteria that protect natural systems and coastal water quality, and limit the intensity and extent of operations in each coastal reach.
• Avoid the ‘privatisation’ of inshore waters and the consequent disruption of fishing operations and livelihoods.
120
Principle 7:Promote sustainable tourism that respects setback lines and carrying capacity, benefits local communities and applies adequate management practices.
• Identify vulnerable sectors of the population and develop strategies (for example, training, micro-enterprise development) to redirect these to such income generating activities as value-added processing, eco-tourism and cottage industries that reduce pressure on ecosystem services.
• Ensure that tourism planning is responsive to the needs of the local community and seeks to ensure community benefits. Local communities should be involved in the tourism planning process and development of associated recreational activities. This will help ensure that economic benefits are adequately distributed.
• In coastal tourism development, use appropriate siting, improved engineering designs and appropriate construction management practices that respect the dynamic nature of the coastal areas and ecosystem function. Such measures help control the negative impacts that can come with coastal tourism, including the loss of habitat and landscape, degradation of water quality, erosion of beaches and loss of beach access and income by traditional resource users. Such siting and design also helps minimises risks from storms, hurricanes, tsunamis and erosion and will reduce the need for prohibitively costly restoration and rehabilitation measures. Construction setbacks are one of the most appropriate proactive means of reducing risk of natural hazards. National and local authorities must support the industry through public sector planning, development control and provision of construction standards.
II. Process measures:
Principle 8:Secure commitments from governments and international organisations to abide by these Principles and build on and strengthen existing institutional arrangements where possible.
• Mobilise rapid or immediate endorsement of these principles and enunciate their implications for all reconstruction activities. The adoption of the principles need not add time to the reconstruction process and, if unequivocally endorsed by the highest levels, will reduce uncertainty.
• Set specific measurable goals (for example, to double the number of people with potable water over pre-tsunami levels) for the reconstruction by each participating nation and its partner organisations. This will help focus the effort and provide a basis for measuring successful implementation of the principles.
• Use the opportunities created by the intense activity brought by the reconstruction process to strengthen the relationships among these institutions and to address weaknesses in the current coastal management system. Responsibility for coastal planning and decision-making - including the necessary enforcement powers - are invariably distributed among a number of governmental agencies at the national and sub-national levels. In some nations non-governmental organisations also play major roles in coastal management.
• Embrace opportunities to strengthen each nation’s coastal management system and encourage investments in associated training and institution building.
Principle 9:Ensure public participation through capacity building and the effective utilisation of all means of communication to achieve outcomes that meet the needs and realities of each situation.
• First, consult with local people to review conditions as they existed before the tsunami to identify potentially significant habitats, rights of way to the shore and significant cultural or religious sites. The provision of detailed before and after aerial photographs and maps showing the reference line will assist in this process. It is essential that representatives of the poorer segments of the community are present and participate actively and that traditional leadership such as village leaders and religious leaders provide guidance and assist in the mediation of disputes.
• Second, envision the conditions and specific features of the coastal reach in question that would be seen as meeting local needs and local goals. This will address the specifics of marking the setback line and engaging in a rapid planning and zoning process. These discussions are likely to reveal competing views and conflicts. Therefore, it is important that decisions be guided by the precise demarcation of the setback line and that the boundaries of bio-shields be based on pre-defined and unambiguous criteria and that these be applied in a transparent manner.
• Adapt strategies for applying these principles as appropriate. It will be important to learn and adjust as the reconstruction and rehabilitation efforts unfold. Local knowledge combined with technical expertise and guided by national goals is the recipe for success.
121
Principle 10:Make full use of tools such as strategic environmental assessment, spatial planning and environmental impact assessment, to identify trade-offs and options for a sustainable future.
• Tailor coastal management principles to the unique conditions present in every coastal reach. This favors a decentralised approach and a co-management structure in which local institutions assume significant roles in planning and decision making.
• Assist the governmental and non-governmental institutions with coastal management responsibilities to refine their abilities to identify threats and their root causes, to negotiate goals and strategies with a diversity of stakeholders, to practice conflict resolution and to prioritise their actions.
• Promote the use of economic assessment tools that help set priorities for investments, define and meet financing needs and sequence investments so as to maximise inter-sectoral collaboration and the advance towards sustainable development.
• Encourage the application of the Precautionary Principle and to its use in impact assessments that should be used to evaluate proposals for major construction projects.
Principle 11:Develop mechanisms and tools to monitor and periodically communicate the outcomes of the reconstruction through indicators that reflect socio-economic change and ecosystem health.
• Set clear goals for the desired outcomes of the reconstruction and rehabilitation process reach by reach and subsequently use these as a reference point for assessing progress and the practice of adaptive management.
• Define and monitor simple, practical indicators for assessing progress towards goals and monitoring the coastal reconstruction and rehabilitation process.
• Report periodically on the results of the reconstruction processes and the lessons that emerge from the application of the principles; document failures as well as successes.
• Make it easy for the print, radio and television media to stay involved in the reporting process by establishing and updating a website and registering it with the main search engines.
Principle 12: Widely disseminate good practices and lessons learned as they emerge.
• Annually invite experts and leaders from the region and elsewhere to review progress and widely disseminate throughout the region the emerging good practices.
• Celebrate success. Create incentives to, and publicly recognise successes - particularly when they result from local initiatives and local creativity in problem solving.
Conclusion:Formulating principles to guide the rehabilitation and reconstruction is but one first step in the arduous reconstruction process. Those engaged in the process will need to work hard to create conditions that are better than those that existed before the tsunami and make coastal communities - particularly the poor - less vulnerable that they were before. There will be major pressures to simply put things back as they were before and to take advantage of the emergency to further individual interests rather than the common good. These pressures must be resisted. The implementation of these twelve Cairo Principles will help grasp the opportunities generated by such a calamity and thereby create conditions that are more sustainable and more equitable than those that were present before.
Appendix:Selected literature and references are provided below. Documents accessible through websites have been emphasised due to their easy access worldwide.
General guidance: • Additional guidance on post-tsunami reconstruction is provided in an IUCN information paper, dated
February 2005, entitled ‘Guidance for Ecosystem Rehabilitation incorporating Livelihood concerns’. It is available on the web at: http://www.iucn.org/tsunami/docs/tsunamiguidance-info.pdf#search=’ %EF%82%B7%20IUCN%20information%20paper%20%28February%202005%29%20Guidance%20for%20 Ecosystem%20Rehabilitation%20incorporating%20Livelihood%20concerns.’ and :http://www.iucn.org/tsunami/docs/tsunami- guidance-info.pdf
• Asian Wetland Symposium of February 9th 2005 on tsunami and coastal wetlands had recommendations for action: http://www.wetlands.org/news&/docs/AWS_Tsunami.pdf
122
Reducing vulnerability: • UNESCO has produced a document entitled ‘A proposal for building capacity to generate coastal
bathymetry: a critical element in protecting lives, livelihoods and sustainable development in areas prone to ocean-based extreme events.’ The IOC/UNESCO website is at: http://ioc.unesco.org/iocweb/index.php
• Information on the Indian Ocean Tsunami Warning System is gathered at: http://ioc.unesco.org/indotsunami
Debris clearance: • Guidelines on debris disposal are available at several sites including http://www.un.org/esa/sustdev/
documents/agenda21/english/agenda21chapter21.htm
Promoting access to sustainable livelihoods: • The International Tropical Timbers Organization’s 1996 paper by C. Field, entitled ‘Restoration of mangrove
ecosystems’ contains ideas about reforestation to assist sustainable livelihoods. • The UN department of economic and social affairs has publications relating to sustainable development at:
http://www.un.org/esa/sustdev/mgroups/success/SARD-6.htm
Conserving, managing and restoring natural systems: • Links to useful literature on the restoration of near-shore marine ecosystems are provided by http://
restoration.nos.noaa.gov/htmls/resources/habitat_pubs.html • The Florida seagrass restoration project has information that could be adapted to other areas: http://www.
fws.gov/CEP/FLGulf.fs.rev.pdf#search=’sea%20grass%20restoration’ • The site http://w1.mangrove.org:880/video/rem.html has links to methodology on mangrove restoration.
Methodology on mangrove restoration is described in an article at: http://www.tautai.com/Pubs/Mangrove%20Restoration%20Ambio.pdf#search=’mangrove%20restoration’
• Links to other information on mangroves can also be obtained at: http://www.ncl.ac.uk/tcmweb/tcm/ mglinks.htm
• Dr. Jurgen Primavera and Dr. Anitra Thorhaug have published several peer-reviewed journal articles on restoration of mangroves and seagrasses, respectively
• The National Oceanic and Atmospheric Administration (NOAA) has two websites with useful links to information on coral reefs, their restoration and remediation:
http://www.coris.noaa.gov/library/other_sites.html and http://www.nodc.noaa.gov/col/projects/coral/corallinks/Coral_linkmain.html • The Intergovernmental Oceanic Commission/United National Educational, Scientific and Cultural
Organization (IOC/UNESCO) has also advised about coral reef restoration and remediation at: http://ioc.unesco.org/coralbleaching/gef.htm
Sources of building materials: • Some ideas on the sourcing of certified timber and other raw materials and strategies on the sound use of
wood are presented by the World Wildlife Fund (WWF) at: http://www.unece.org/trade/timber/docs/sem-1/papers/r36Rainey.pdf#search=’sourcing%20of%20certified%20timber’
Soft engineering solutions: • An electronic bibliography on the use of constructed wetlands to improve water is available at http://www.
nal.usda.gov/wqic/Bibliographies/eb9701.html • General links to information on constructed wetlands (including for wastewater treatment) are at http://
www.epa.gov/owow/wetlands/watersheds/cwetlands.html
Setting up protected areas: • Lessons learned from setting up marine protected area designations in the United States that may be adapted
and applied to other nations are provided at http://mpa.gov/information_tools/lessons_learned_ table.html
Sustainable fisheries and low-impact aquaculture: • WorldFish center has produced a briefing paper entitled ‘Building a better future for coastal communities affected
by the tsunamis.’ This contains key recommendations from the project on ‘Sustainable management of coastal fish stocks in Asia’ documented in Silvestre et al., 2003; In Silvestre et al., (eds): Assessment, management and future directions for coastal fisheries in Asian countries. South and Southeast Asian Coastal Fisheries: Their status and directions for improved management. WorldFish Center Conference Proceedings 67, 1120 pp. This publication is available at: http://www.worldfishcenter. org/trawl/publications/publications.asp
123
• Guidance on the restoration of small scale fisheries is available at: http://www.idrc.ca/es/ev-28137-201-1-DO_TOPIC.html
• Codes of conduct for sustainable aquaculture are discussed in the following FAO document: http://www.fao.org/documents/show_cdr.asp?url_file=/DOCREP/003/AB412E/ab412e34.htm
• The marine finfish aquaculture network refers to cooperation in sustainable finfish aquaculture: http://www.enaca.org/modules/news/index.php?storytopic=10&storynum=10
• Information on fisheries assessments may be downloaded at: http://earthwatch.unep.net/oceans/oceanfisheries.php and http://www.nefsc.noaa.gov/nefsc/publications/tm/tm184/
Land management/infrastructure issues: • Ideas that could be adapted to the current situation can be found within the 2003 ‘Final report on the water
quality coalition for reef protection project’ by the Rainforest Alliance/National Fish and Wildlife Foundation: http://www.eco-index.org/search/pdfs/707report_1.pdf
Tools for rapid social and environmental assessment: • The World Bank’s community-driven development is described at: http://lnweb18.worldbank.org/ESSD/
sdvext.nsf/09ByDocName/CommunityDrivenDevelopment • Tools and methods of social assessment are evaluated at: http://www.worldbank.org/socialanalysis
sourcebook/socialassess5.htm • More information on using social assessment and rapid participatory rural appraisal may be found at:
http://www.fao.org/docrep/W5830E/w5830e08.htm and http://www.unu.edu/unupress/food2/UIN08E/uin08e0u.htm
• OECS 2003. Technical Manual for Post-Disaster Rapid Environmental Assessment. Volume 1 and 2. • Organization of Eastern Caribbean Countries, Environment and Sustainable Development Unit. http://
www.oecs.org/esdu/ • UN-ECLAC 2003. Handbook for estimating the socio-economic and environmental effects of disasters. United
Nations Economic Commission for Latin America and the Caribbean. http://www.proventionconsortium.org/toolkit.htm
• Wetlands International 2005. Assessment of field protocol for rapid wetland and coastal assessment – a guide for staff: http://www.wetlands.org/Tsunami/Tsunamidata.htm
Methods for broader environmental impact assessments: • Biswas AK and SBC Agarwal (eds.). 1992. Environmental impact assessment for developing countries.
Oxford; Butterworth Heinman. • Lohani BN. 1997. Environmental impact assessment for developing countries in Asia. Asian development
bank. Manila. • Barrow CJ. 2000. Social impact assessment: An introduction. London: Arnold. • International association for impact analysis provides information at: http://www.iaia.org/Non_Members/
Pubs_Ref_Material/pubs_ref_material_index.htm • DigitalGlobe, a commercial satellite operation has made a donation for post-tsunami reconstruction.
Imagery donated and downloadable free of charge at www.landcover.org may aid environmental impact assessments.
Ensuring public participation: • Guidance on ensuring stakeholder participation, especially the participation of women, is given in the
document ‘Biodiversity in development’: http://www.wcmc.org.uk/biodev/index2.html • Additional guidance on stakeholder participation is presented in ‘Diversity makes the difference.’ http://
www.generoyambiente.org/ES/publicaciones_uicn/biodiversity/modulebiodiversity.htm • FAO has a website dealing with the issue of gender equity in public participation: http://www.fao.org/
worldfoodsummit/english/fsheets/women.pdf
Strengthen institutional arrangements: • UNEP’s ‘10 keys for local and national action on municipal wastewater’ discusses the interactions of the
different players in a locality – ranging from the communities themselves to NGOs, local governments and the tourist industry, for example. Ideas in this list could be adapted to fit the current context. http://www.gdrc.org/uem/water/10-keys.html
• More ideas that could be adapted to coastal areas are presented by the Bonn Keys at: http://www.gdrc.org/uem/water/bonn-keys.html
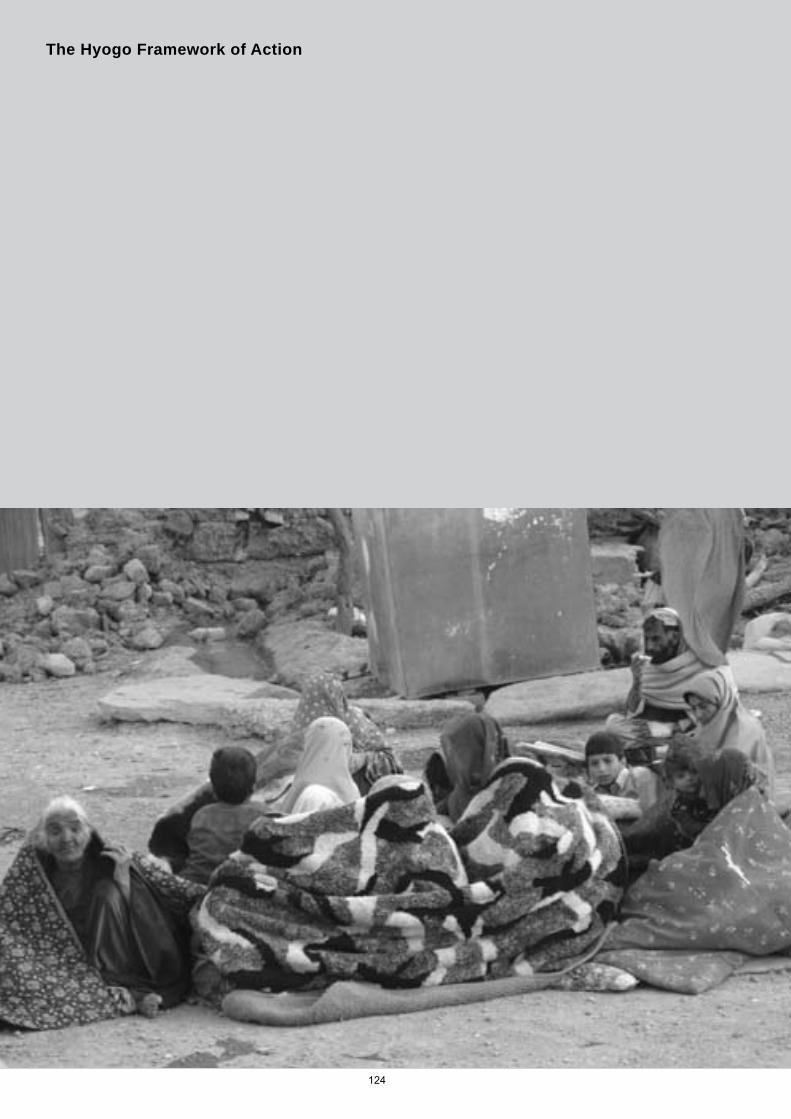
124
The Hyogo Framework of Action
125
The Hyogo Framework of Action
(Extracted directly from www.unisdr.org/hfa)
The Hyogo Framework for Action (HFA) is the key instrument for implementing disaster risk reduction, adopted by the Member States of the United Nations. Its over-arching goal is to build resilience of nations and communities to disasters, by achieving substantive reduction of disaster losses by 2015 - in lives, and in the social, economic, and environmental assets of communities and countries. The HFA offers five areas of priorities for action, guiding principles and practical means for achieving disaster resilience for vulnerable communities in the context of sustainable development. Since the adoption of the HFA, many global, regional, national and local efforts have addressed disaster risk reduction more systematically, much however, remains to be done. The United Nations General Assembly has called for the implementation of HFA, reconfirmed the multi-stakeholder ISDR System and the Global Platform for Disaster Risk Reduction to support and promote it. The General Assembly has encouraged member states to establish multi-sectoral national platforms to coordinate disaster risk reduction in countries. Many regional bodies have formulated strategies at regional scale for disaster risk reduction in line with the HFA, in the Andean region, Central America, the Caribbean, Asia, Pacific, Africa and Europe. More than 100 governments have designated official focal points for the follow-up and the implementation of the HFA (March 2007). Some have taken actions to mobilise political commitment and establish centres to promote regional cooperation in disaster risk reduction.
Priorities for action:
Principle1: Make disaster risk reduction a priority:Ensure that disaster risk reduction is a national and a local priority with a strong institutional basis for implementation.
Strong national and local commitment is required to save lives and livelihoods threatened by natural hazards. Natural hazards must be taken into account in public and private sector decision-making in the same way that environmental and social impact assessments are currently required. Countries must therefore develop or modify policies, laws, and organizational arrangements, as well as plans, programmes, and projects, to integrate disaster risk reduction. They must also allocate sufficient resources to support and maintain them. This includes:
• Creating effective, multi-sector national platforms to provide policy guidance and to coordinate activities; • Integrating disaster risk reduction into development policies and planning, such as Poverty Reduction
Strategies; and • Ensuring community participation, so that local needs are met.
Principle 2: Know the risks and take action: Identify, assess, and monitor disaster risks - and enhance early warning.
To reduce their vulnerability to natural hazards, countries and communities must know the risks that they face, and take actions based on that knowledge. Understanding risk requires investment in scientific, technical, and institutional capabilities to observe, record, research, analyse, forecast, model and map natural hazards. Tools need to be developed and disseminated: statistical information about disaster events, risk maps, disaster vulnerability and risk indicators are essential.
Most importantly, countries need to use this knowledge to develop effective early warning systems, appropriately adapted to the unique circumstances of the people at risk. Early warning is widely accepted as a crucial component of disaster risk reduction. When effective early warning systems provide information about a hazard to a vulnerable population, and plans are in place to take action, thousands of lives can be saved.
Principle 3: Build Understanding and Awareness:Use knowledge, innovation, and education to build a culture of safety and resilience at all levels.Disasters can be reduced substantially if people are well informed about measures they can take to reduce vulnerability - and if they are motivated to act. Key activities to increase awareness of disaster prevention include:
• Providing relevant information on disaster risks and means of protection, especially for citizens in high- risk areas;
126
• Strengthening networks and promoting dialogue and cooperation among disaster experts, technical and scientific specialists, planners and other stakeholders;
• Including disaster risk reduction subject matter in formal, non-formal, and informal education and training activities;
• Developing or strengthening community- based disaster risk management programmes; and • Working with the media in disaster risk reduction awareness activities.
Strategic Goals: • The integration of disaster risk reduction into sustainable development policies and planning; • Development and strengthening of institutions, mechanisms and capacities to build resilience
to hazards; • The systematic incorporation of risk reduction approaches into the implementation of emergency
preparedness, response and recovery programmes.
Principle 4: Reduce risk: Reduce the underlying risk factors. Vulnerability to natural hazards is increased in many ways, for example: • Locating communities in hazard-prone areas, such as flood plains; • Destroying forests and wetlands, thereby harming the capacity of the environment to withstand hazards; • Building public facilities and housing unable to withstand the impacts of hazards; Not having social and
financial safety mechanisms in place.
Countries can build resilience to disasters by investing in simple, well-known measures to reduce risk and vulnerability. Disasters can be reduced by applying relevant building standards to protect critical infrastructure, such as schools, hospitals and homes. Vulnerable buildings can be retrofitted to a higher degree of safety. Protecting precious ecosystems, such as coral reefs and mangrove forests, allow them to act as natural storm barriers. Effective insurance and micro-finance initiatives can help to transfer risks and provide additional resources.
Principle 5: Be prepared and ready to act: Strengthen disaster preparedness for effective response at all levels.
Being prepared, including conducting risk assessments, before investing in development at all levels of society will enable people to become more resilient to natural hazards. Preparedness involves many types of activities, including:
• The development and regular testing of contingency plans; • The establishment of emergency funds to support preparedness, response and recovery activities; • The development of coordinated regional approaches for effective disaster response; • Continuous dialogue between response agencies, planners and policy-makers, and development
organisations.
Regular disaster preparedness exercises, including evacuation drills, also are key to ensuring rapid and effective disaster response.
Effective preparedness plans and organisation also help to cope with the many small and medium-sized disasters that repeatedly occur in so many communities. Natural hazards cannot be prevented, but it is possible to reduce their impacts by reducing the vulnerability of people and their livelihoods.
Who is responsible for implementing disaster risk reduction and the Hyogo Framework?
Collaboration and cooperation are crucial to disaster risk reduction: states, regional organisations and institutions, and international organisations all have a role to play. Civil society, including volunteers and community-based organisations, the scientific community, the media, and the private sector, are all vital stakeholders. Following is an indication of the variety and diversity of actors and their core responsibilities.
States are responsible for: • Developing national coordination mechanisms; • Conducting baseline assessments on the status of disaster risk reduction;
127
• Publishing and updating summaries of national programmes; • Reviewing national progress towards achieving the objectives and priorities of the Hyogo Framework; • Working to implement relevant international legal instruments; and • Integrating disaster risk reduction with climate change strategies. Regional organisations are responsible for: • Promoting regional programmes for disaster risk reduction; • Undertaking and publishing regional and sub-regional baseline assessments; • Coordinating reviews on progress toward implementing the Hyogo Framework in the region; • Establishing regional collaborative centres; and • Supporting the development of regional early warning mechanisms. International organisations are responsible for: • Encouraging the integration of disaster risk reduction into humanitarian and sustainable development
programmes and frameworks; • Strengthening the capacity of the United Nations system to assist disaster-prone developing countries with
disaster risk reduction initiatives; • Supporting data collection and forecasting, information exchange, and early warning systems; • Supporting States’ own efforts with coordinated international assistance; and • Strengthening disaster management training and capacity building. The International Strategy for Disaster Reduction (ISDR) system is responsible for: • Developing a matrix of roles and initiatives related to the Hyogo Framework; • Facilitating the coordination of actions at the international and regional levels; • Developing indicators of progress to assist States in tracking their progress towards implementation of the
Hyogo Framework; • Supporting national platforms and coordination mechanisms; • Stimulating the exchange of best practices and lessons learned; and • Preparing reviews on progress toward achieving the Hyogo Framework objectives. The International Strategy for Disaster Reduction The International Strategy for Disaster Reduction was adopted as a follow-up of the International Decade on Natural Disaster Reduction (IDNDR) 1990-1999 by the Member States of the United Nations in 2000. This strategy aims to achieve substantive reduction of disaster losses and build resilient communities and nations, as an essential condition for sustainable development. The ISDR System comprises numerous organisations - both states and civil society worldwide working together to reduce disaster losses. All countries are encouraged to establish National Platforms for Disaster Risk Reduction or other coordination mechanisms. At regional level, information sharing and coordination among existing bodies are promoted by the UN/ISDR secretariat and partners as Regional Platforms for Disaster Risk Reduction. The international elements of the ISDR System are the Global Platform for Disaster Risk Reaction and the UN/ISDR secretariat. The Global Platform for Disaster Risk Reduction is the main global forum for governments, United Nations agencies, international financial institutions, regional bodies, civil society, the private sector, the scientific, and academic communities. It is responsible for raising awareness and reiterates commitments, for sharing experience on implementation among stakeholders and governments, addressing gaps, and for providing strategic guidance and coherence for implementing the Hyogo Framework. Thematic clusters, groups and platforms work on specific topics of the disaster risk reduction agenda, such as: climate change adaptation, education, urban risk, early warning, recovery and capacity development. The Global Platform will appoint a committee to advise on programmatic priorities and direction to the Global Platform. The UN/ISDR secretariat, accountable to the UN USG, serves as a broker, catalyst, and focal point for disaster risk reduction within the United Nations and among the members of the ISDR System. It advocates for commitment to disaster risk reduction and the implementation of the Hyogo Framework, and reports on progress. The full text of the Hyogo Framework for Action can be downloaded at http://www.unisdr.org/eng/hfa/hfa.htm.
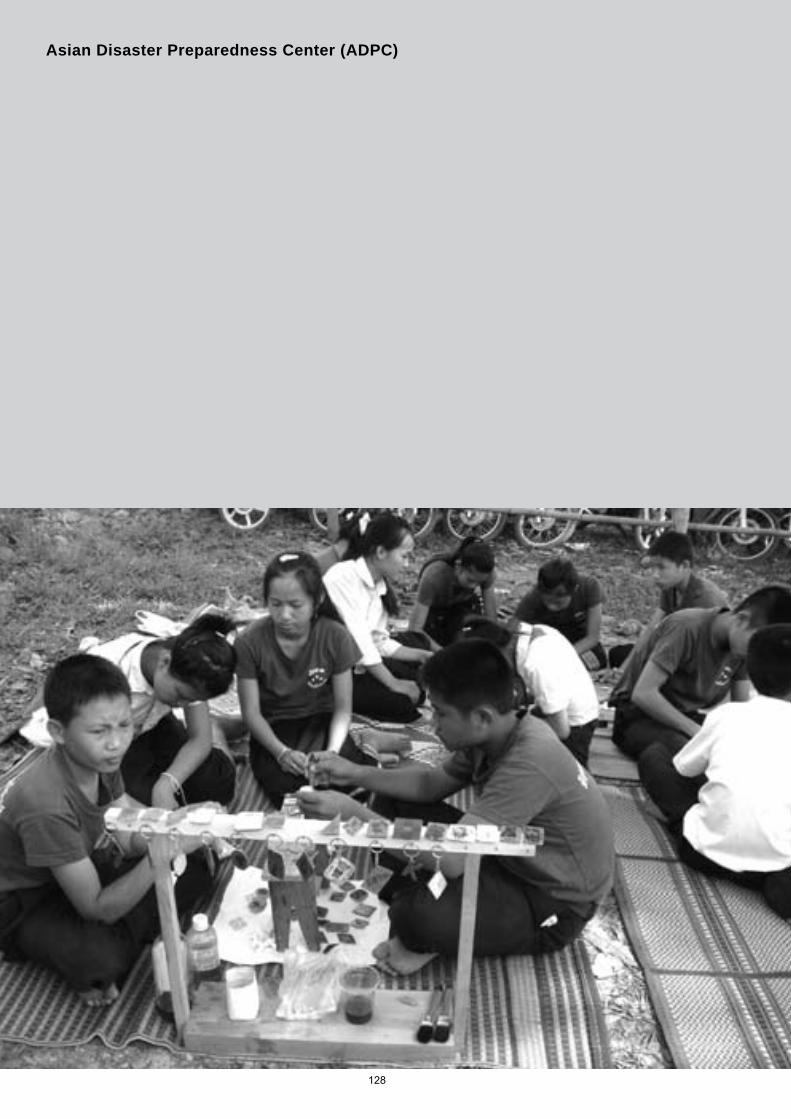
128
Asian Disaster Preparedness Center (ADPC)
129
Asian Disaster Preparedness Center (ADPC)
(Extracted directly from its website http://www.adpc.net/v2007/.)
The Asian Disaster Preparedness Center (ADPC) is a non-profit organization supporting the advancement of safer communities and sustainable development, through implementing programmes and projects that reduce the impact of disasters upon countries and communities in Asia and the Pacific, by: • developing and enhancing sustainable institutional disaster risk management capacities, frameworks and
mechanisms, and supporting the development and implementation of government policies; • facilitating the dissemination and exchange of disaster risk management expertise, experience and
information; and • raising awareness and enhancing disaster risk management knowledge and skills.
At the recommendation of UN Disaster Relief Organisation (UNDRO) - now known as UN Office for the Coordination of Humanitarian Affairs (UN-OCHA) - ADPC was established in 1986 as an outreach activity of the Asian Institute of Technology in Bangkok , Thailand , with the aim of strengthening the national disaster risk management systems in the region. In 1999, ADPC became an independent entity.
ADPC’s Vision: Safer communities and sustainable development through disaster risk reduction
ADPC’s mission: ADPC’s mission is to reduce the impact of disasters on communities and countries in Asia and the Pacific by: • raising awareness and enhancing knowledge; • developing and strengthening sustainable institutional mechanisms; • facilitating exchange of information, experience and expertise; and • developing and demonstrating innovative disaster reduction practices.
ADPC’s goals are to: • mainstream disaster reduction in development; • build and strengthen capacity; • facilitate partnerships and exchange of experiences; • be recognised as a proactive and responsive regional resource; and • achieve quality service through a team approach.
Future priorities: For future activities, ADPC has identified a number of disaster risk management priorities that the countries in the Asia region must address in their attainment of sustainable development. These include: • mainstreaming of disaster risk management into national development policies and processes (for example,
planning, staffing, budgeting, etc.); • assisting provincial and district governments in developing disaster risk management plans and supporting
national governments in developing their national disaster risk management information systems; • encouraging appropriate legislation and policies for enforcing the incorporation of disaster risk management
into development strategies and programs; • developing financing mechanisms to support the financial sustainability of disaster risk management
outcomes and activities; • reducing vulnerabilities of urban population in Asia projected to increase from 30% to 45% of the population
by 2015, increasingly putting urban centers at risk; • developing and supporting implementation of regional programs on disaster risk management, specifically,
ASEAN and SAARC; • encouraging and developing increased community participation in mine risk education activities and
providing greater support to victims assistance; and • converting vulnerable communities into a resource for undertaking disaster management intervention.
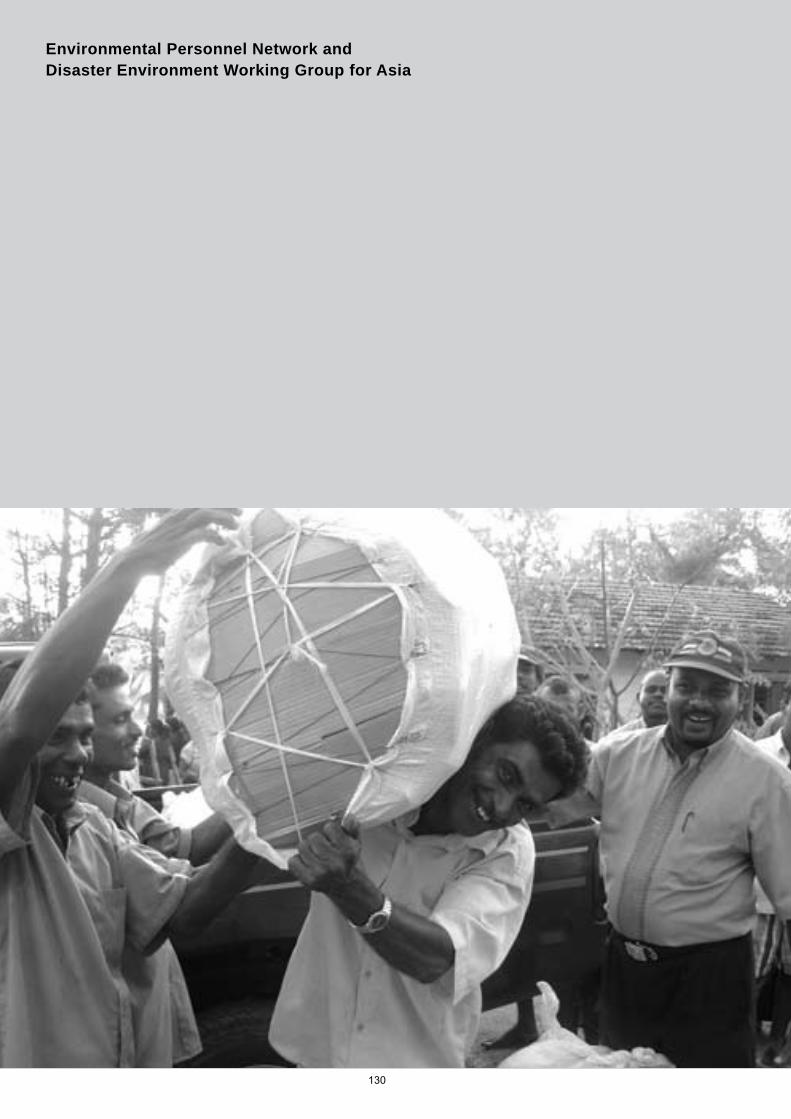
130
Environmental Personnel Network and Disaster Environment Working Group for Asia
131
Emergency Personnel Network
The Emergency Personnel Network (EPN) is a network of humanitarian organisers – professionals and operational managers who meet once a year to discuss best practices, benchmark standards, hear case studies, review new methodologies, examine problems, present solutions and plan for the future (http://www.epn.peopleinaid.org/aboutnetwork.aspx).
Through an online facility, EPN members can share ideas and experience, seek assistance and share information to improve the performance of their organisations.
About 180 organisations, including American, Australian and British Red Cross, Oxfam, CARE, UN Habitat, UNHCR are part of this network.
More information about EPN can be obtained at http://www.epn.peopleinaid.org/aboutnetwork.aspx.
Disaster Environment Working Group for Asia
The Disaster Environment Working Group for Asia (DEWGA) was established in 2007. It acts as a small, semi-formal, open-ended, regional, action-oriented, cross-sectoral partnership to explore avenues through which the partners can work with each other to minimise long term environmental impacts and degradation, as a key disaster risk reduction measure.
DEWGA aims to create a multi-disciplinary community of practitioners in the Asia Pacific region that is concerned with closing the gap among sectors with a view to increasing effectiveness of risk reduction – presuming that environmental sustainability is a key success factor – whether specific interventions on the ground or long-term strategies. It is envisaged that this will be achieved through the following objectives. i) Serve as a collective body to advocate and promote linkages between disaster risk reduction and
environmental management. ii) Create a space in which the partners can identify and undertake bilateral or joint programmes of work. iii) Exchange information on new and upcoming initiatives (for example, events, programmes, research and
publications) that provide structured opportunities to strengthen these linkages. iv) Actively promote integration of disaster risk reduction and environmental sustainability into respective
work programmes.
DEWGA collaborates with the United National International Strategy for Disaster Reduction (UN-ISDR) and the United Nations Environment Programme (UNEP) and has six founding members: the Asian Disaster Preparedness Centre (ADPC), CARE, the International Environment and Disaster Management, Graduate School of Global Environmental Studies, Kyoto University (IEDM/KU), IUCN – the World Conservation Union, the Stockholm Environment Institute (SEI) and WWF.
Information about DEWGA can be obtained from http://www.sei.se/programmes/risk-livelihoods-a-vulnerability/projects/1472-m-disaster-environment-working-group-for-asia-dewga.html
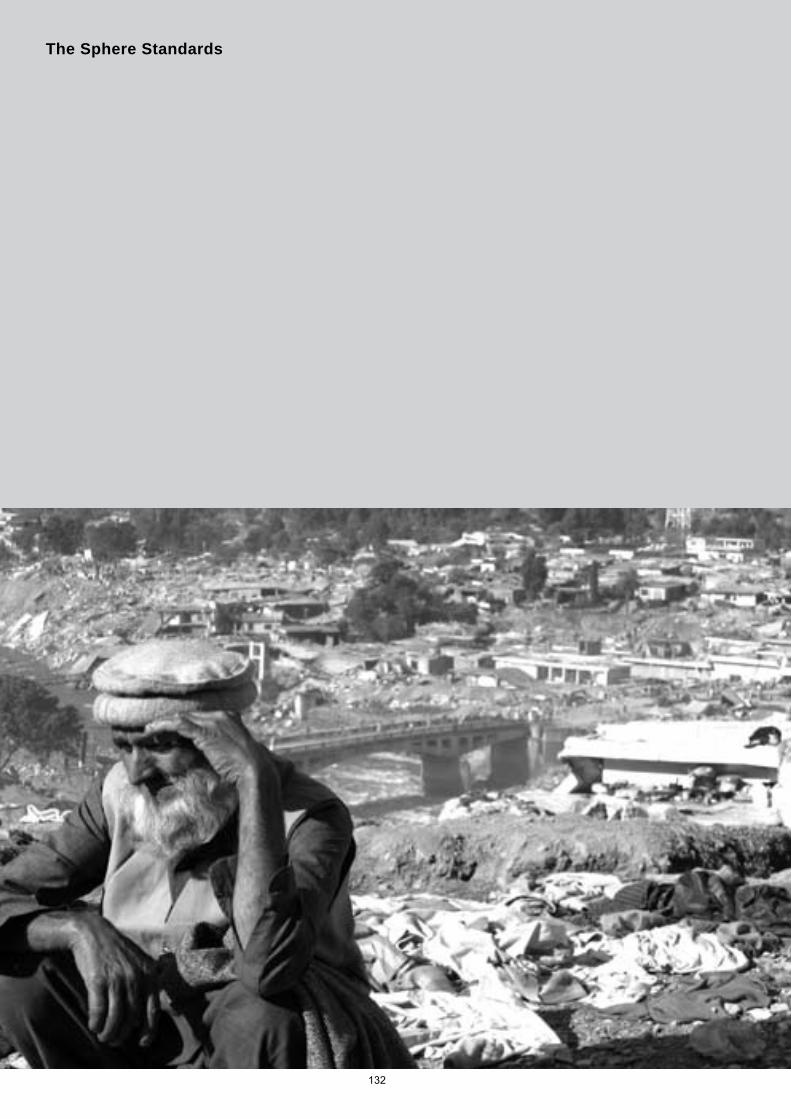
132
The Sphere Standards
133
The Sphere Standards: Humanitarian Charter and Minimum Standards in Disaster Response.
(Quoted directly from (http://www.sphereproject.org/content/view/229/232)
Drawing on international humanitarian law, the Sphere Project is a set of minimum standards, indicators and guidance notes for disaster response, based on a humanitarian charter.
Sphere is based on two core beliefs: 1. That all possible steps should be taken to alleviate human suffering arising out of calamity and conflict, and 2. That those affected by disaster have a right to life with dignity and therefore a right to assistance.
‘More than 700 people from 228 relief organisations in 60 countries considered ideas on good practice over three years. The results were published in a handbook in January 2000.
The Sphere handbook contains a humanitarian charter and minimum standards, accompanied by key indicators for five sectors of disaster response: • Water supply and sanitation, • Nutrition, • Food aid, • Shelter and site management, and • Health services.
The charter recognises the basic right to assistance of people affected by disasters, enshrined in international law. It highlights the legal responsibility of states to guarantee these rights. The standards are formulated as principles or objectives.The key indicators are quantified indices to measure fulfilment of the standards’ (http://www.pubmedcentral.nih.gov/articlerender.fcgi?artid=1121289).
The aim of Sphere:
The aim of Sphere is to improve the quality of assistance to people affected by disaster and improve the accountability of states and humanitarian agencies to their constituents, donors and the affected populations.
Guiding values and principles for the Sphere Project:
The Sphere Project is based on: • International humanitarian, human rights, and refugee law, • The code of conduct: principles of conduct for the International Red Cross and Red Crescent Movement and
NGOs in disaster response programmes.
Strategic objectives of Sphere:
1. To improve the commitment to and effective use of Sphere by all actors involved in humanitarian action. 2. To strengthen the diversity and regional balance of organisations in the governance and implementation
of Sphere. 3. To develop and nurture a cadre of people who are able to use Sphere effectively. 4. To coordinate and interact with other humanitarian initiatives, and work together when that complements
Sphere’s aim. 5. To understand and increase the impact of Sphere.
More information on the Sphere standards can be obtained from http://www.sphereproject.org/.
134
The UNHCR Handbook for Emergencies
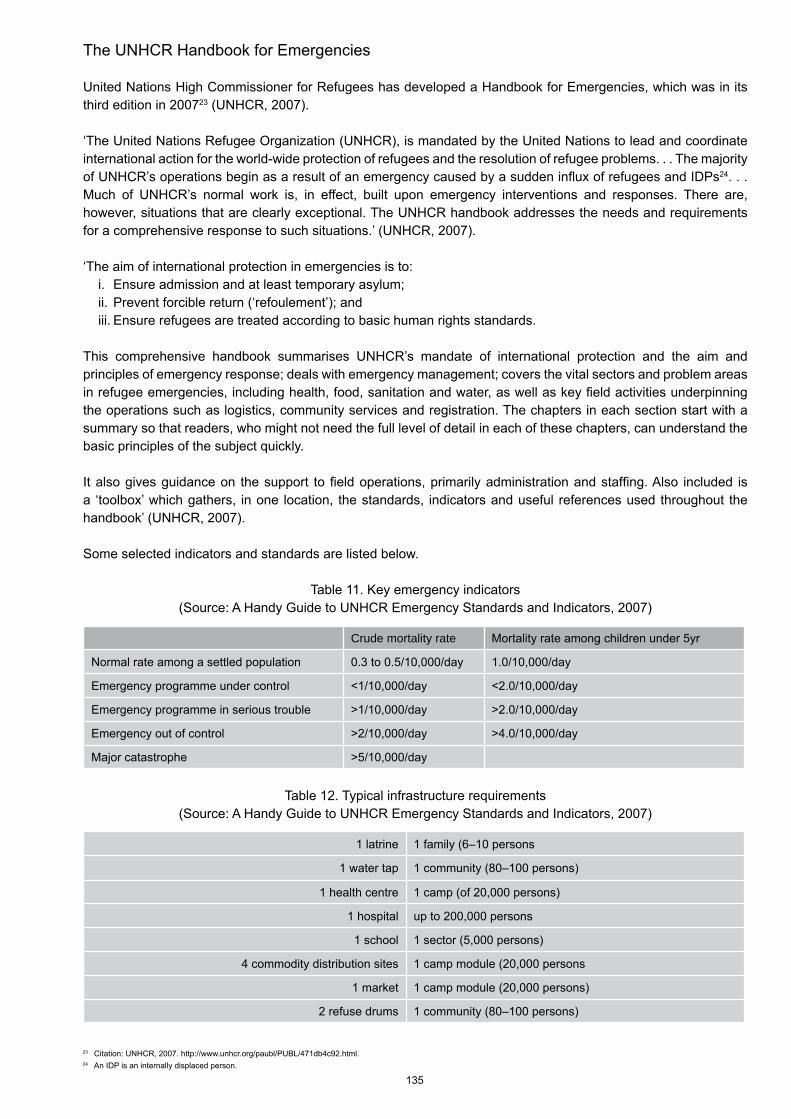
135
The UNHCR Handbook for Emergencies
United Nations High Commissioner for Refugees has developed a Handbook for Emergencies, which was in its third edition in 200723 (UNHCR, 2007).
‘The United Nations Refugee Organization (UNHCR), is mandated by the United Nations to lead and coordinate international action for the world-wide protection of refugees and the resolution of refugee problems. . . The majority of UNHCR’s operations begin as a result of an emergency caused by a sudden influx of refugees and IDPs24. . . Much of UNHCR’s normal work is, in effect, built upon emergency interventions and responses. There are, however, situations that are clearly exceptional. The UNHCR handbook addresses the needs and requirements for a comprehensive response to such situations.’ (UNHCR, 2007).
‘The aim of international protection in emergencies is to: i. Ensure admission and at least temporary asylum; ii. Prevent forcible return (‘refoulement’); and iii. Ensure refugees are treated according to basic human rights standards.
This comprehensive handbook summarises UNHCR’s mandate of international protection and the aim and principles of emergency response; deals with emergency management; covers the vital sectors and problem areas in refugee emergencies, including health, food, sanitation and water, as well as key field activities underpinning the operations such as logistics, community services and registration. The chapters in each section start with a summary so that readers, who might not need the full level of detail in each of these chapters, can understand the basic principles of the subject quickly.
It also gives guidance on the support to field operations, primarily administration and staffing. Also included is a ‘toolbox’ which gathers, in one location, the standards, indicators and useful references used throughout the handbook’ (UNHCR, 2007).
Some selected indicators and standards are listed below.
Table 11. Key emergency indicators (Source: A Handy Guide to UNHCR Emergency Standards and Indicators, 2007)
Crude mortality rate Mortality rate among children under 5yr
Normal rate among a settled population 0.3 to 0.5/10,000/day 1.0/10,000/day
Emergency programme under control <1/10,000/day <2.0/10,000/day
Emergency programme in serious trouble >1/10,000/day >2.0/10,000/day
Emergency out of control >2/10,000/day >4.0/10,000/day
Major catastrophe >5/10,000/day
Table 12. Typical infrastructure requirements(Source: A Handy Guide to UNHCR Emergency Standards and Indicators, 2007)
1 latrine 1 family (6–10 persons
1 water tap 1 community (80–100 persons)
1 health centre 1 camp (of 20,000 persons)
1 hospital up to 200,000 persons
1 school 1 sector (5,000 persons)
4 commodity distribution sites 1 camp module (20,000 persons
1 market 1 camp module (20,000 persons)
2 refuse drums 1 community (80–100 persons)
23 Citation: UNHCR, 2007. http://www.unhcr.org/paubl/PUBL/471db4c92.html.24 An IDP is an internally displaced person.
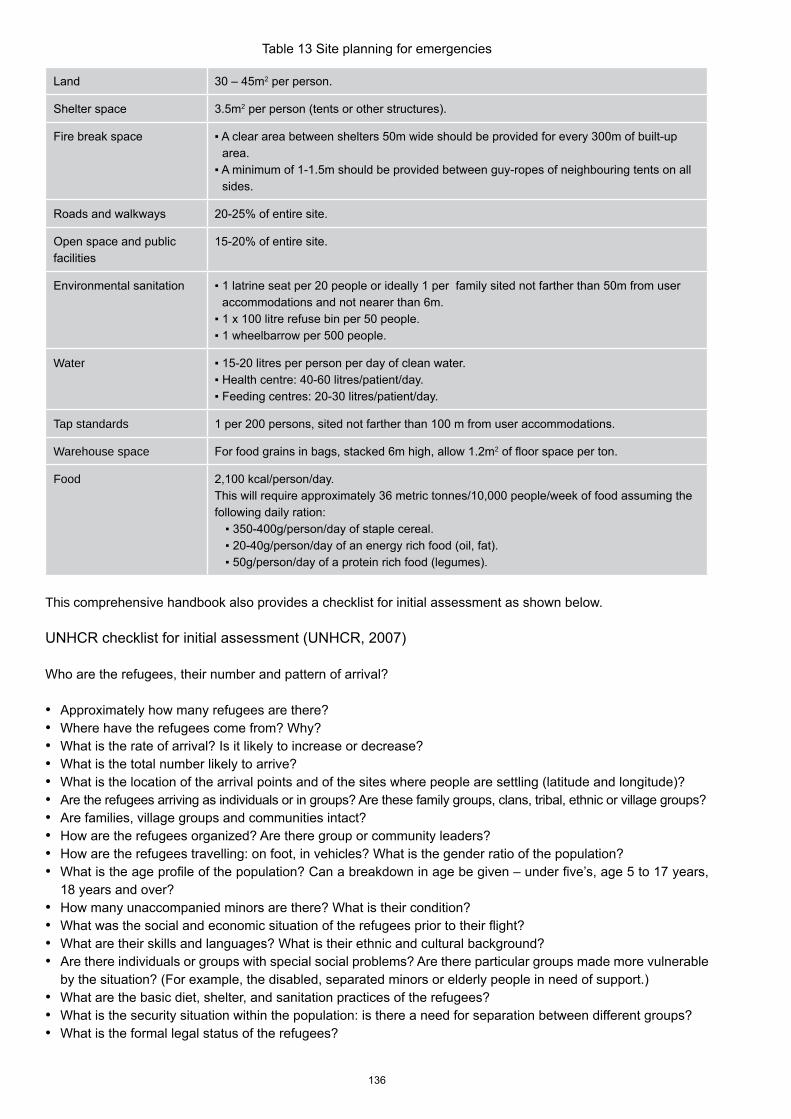
136
Table 13 Site planning for emergencies
Land 30 – 45m2 per person.
Shelter space 3.5m2 per person (tents or other structures).
Fire break space ▪ A clear area between shelters 50m wide should be provided for every 300m of built-up area.
▪ A minimum of 1-1.5m should be provided between guy-ropes of neighbouring tents on all sides.
Roads and walkways 20-25% of entire site.
Open space and public facilities
15-20% of entire site.
Environmental sanitation ▪ 1 latrine seat per 20 people or ideally 1 per family sited not farther than 50m from user accommodations and not nearer than 6m.
▪ 1 x 100 litre refuse bin per 50 people.▪ 1 wheelbarrow per 500 people.
Water ▪ 15-20 litres per person per day of clean water.▪ Health centre: 40-60 litres/patient/day.▪ Feeding centres: 20-30 litres/patient/day.
Tap standards 1 per 200 persons, sited not farther than 100 m from user accommodations.
Warehouse space For food grains in bags, stacked 6m high, allow 1.2m2 of floor space per ton.
Food 2,100 kcal/person/day.This will require approximately 36 metric tonnes/10,000 people/week of food assuming the following daily ration:
▪ 350-400g/person/day of staple cereal.▪ 20-40g/person/day of an energy rich food (oil, fat).▪ 50g/person/day of a protein rich food (legumes).
This comprehensive handbook also provides a checklist for initial assessment as shown below.
UNHCR checklist for initial assessment (UNHCR, 2007)
Who are the refugees, their number and pattern of arrival?
Approximately how many refugees are there?•Where have the refugees come from? Why?•What is the rate of arrival? Is it likely to increase or decrease?•What is the total number likely to arrive?•What is the location of the arrival points and of the sites where people are settling (latitude and longitude)?•Are the refugees arriving as individuals or in groups? Are these family groups, clans, tribal, ethnic or village groups?•Are families, village groups and communities intact?•How are the refugees organized? Are there group or community leaders?•How are the refugees travelling: on foot, in vehicles? What is the gender ratio of the population? •What is the age profile of the population? Can a breakdown in age be given – under five’s, age 5 to 17 years, •18 years and over?How many unaccompanied minors are there? What is their condition? •What was the social and economic situation of the refugees prior to their flight?•What are their skills and languages? What is their ethnic and cultural background?•Are there individuals or groups with special social problems? Are there particular groups made more vulnerable •by the situation? (For example, the disabled, separated minors or elderly people in need of support.)What are the basic diet, shelter, and sanitation practices of the refugees? •What is the security situation within the population: is there a need for separation between different groups?•What is the formal legal status of the refugees?•
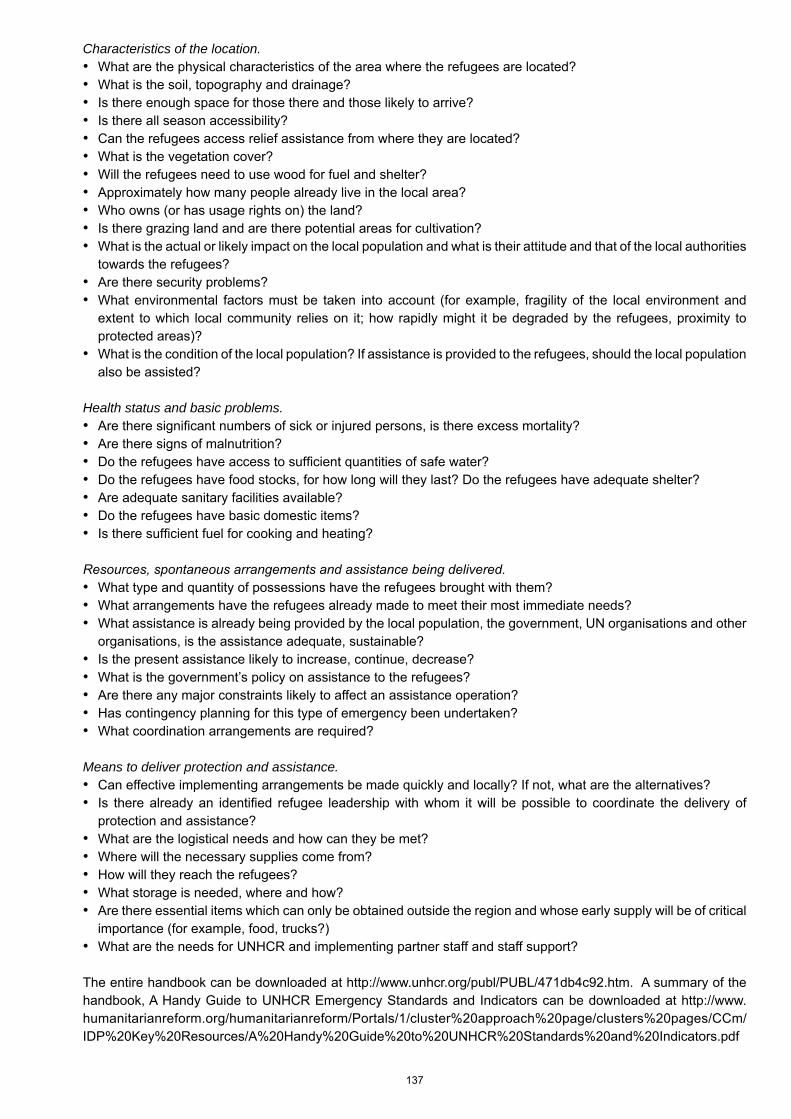
137
Characteristics of the location.What are the physical characteristics of the area where the refugees are located?•What is the soil, topography and drainage?•Is there enough space for those there and those likely to arrive?•Is there all season accessibility?•Can the refugees access relief assistance from where they are located?•What is the vegetation cover?•Will the refugees need to use wood for fuel and shelter?•Approximately how many people already live in the local area?•Who owns (or has usage rights on) the land?•Is there grazing land and are there potential areas for cultivation?•What is the actual or likely impact on the local population and what is their attitude and that of the local authorities •towards the refugees?Are there security problems? •What environmental factors must be taken into account (for example, fragility of the local environment and •extent to which local community relies on it; how rapidly might it be degraded by the refugees, proximity to protected areas)? What is the condition of the local population? If assistance is provided to the refugees, should the local population •also be assisted?
Health status and basic problems.Are there significant numbers of sick or injured persons, is there excess mortality?•Are there signs of malnutrition? •Do the refugees have access to sufficient quantities of safe water?•Do the refugees have food stocks, for how long will they last? Do the refugees have adequate shelter?•Are adequate sanitary facilities available? •Do the refugees have basic domestic items?•Is there sufficient fuel for cooking and heating?•
Resources, spontaneous arrangements and assistance being delivered.What type and quantity of possessions have the refugees brought with them?•What arrangements have the refugees already made to meet their most immediate needs?•What assistance is already being provided by the local population, the government, UN organisations and other •organisations, is the assistance adequate, sustainable?Is the present assistance likely to increase, continue, decrease? •What is the government’s policy on assistance to the refugees? •Are there any major constraints likely to affect an assistance operation?•Has contingency planning for this type of emergency been undertaken?•What coordination arrangements are required?•
Means to deliver protection and assistance.Can effective implementing arrangements be made quickly and locally? If not, what are the alternatives?•Is there already an identified refugee leadership with whom it will be possible to coordinate the delivery of •protection and assistance?What are the logistical needs and how can they be met?•Where will the necessary supplies come from?•How will they reach the refugees?•What storage is needed, where and how?•Are there essential items which can only be obtained outside the region and whose early supply will be of critical •importance (for example, food, trucks?)What are the needs for UNHCR and implementing partner staff and staff support?•
The entire handbook can be downloaded at http://www.unhcr.org/publ/PUBL/471db4c92.htm. A summary of the handbook, A Handy Guide to UNHCR Emergency Standards and Indicators can be downloaded at http://www.humanitarianreform.org/humanitarianreform/Portals/1/cluster%20approach%20page/clusters%20pages/CCm/IDP%20Key%20Resources/A%20Handy%20Guide%20to%20UNHCR%20Standards%20and%20Indicators.pdf
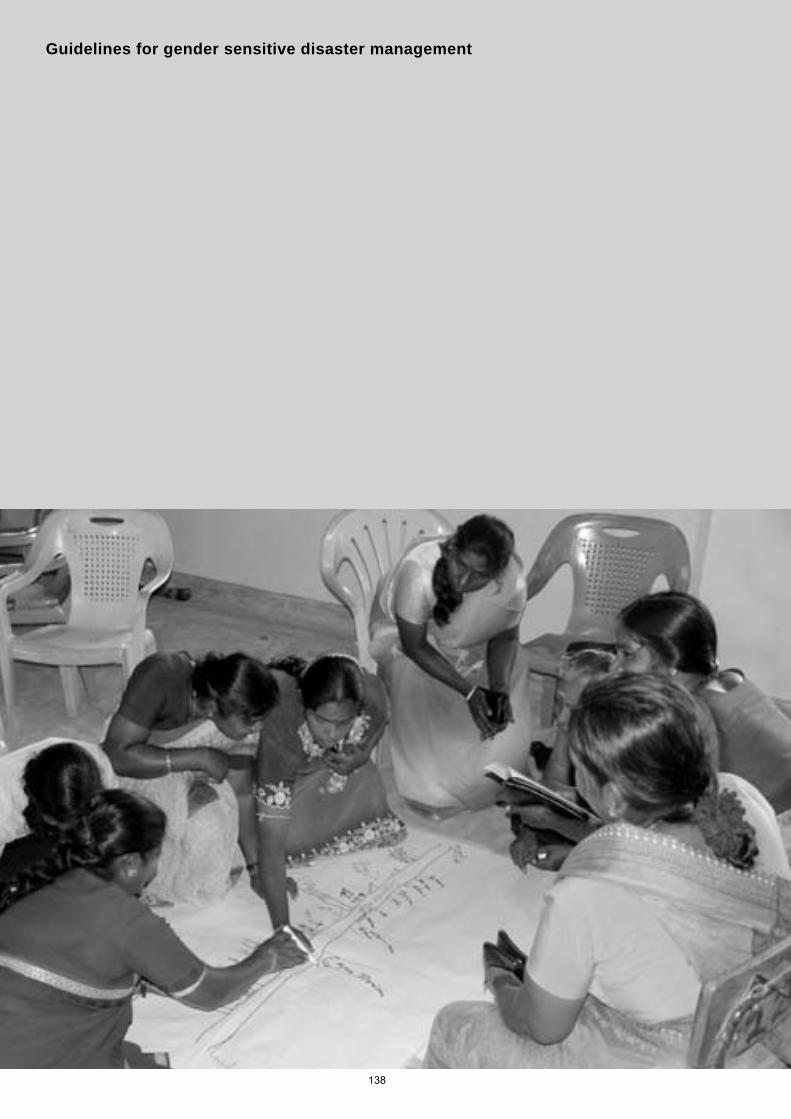
138
Guidelines for gender sensitive disaster management
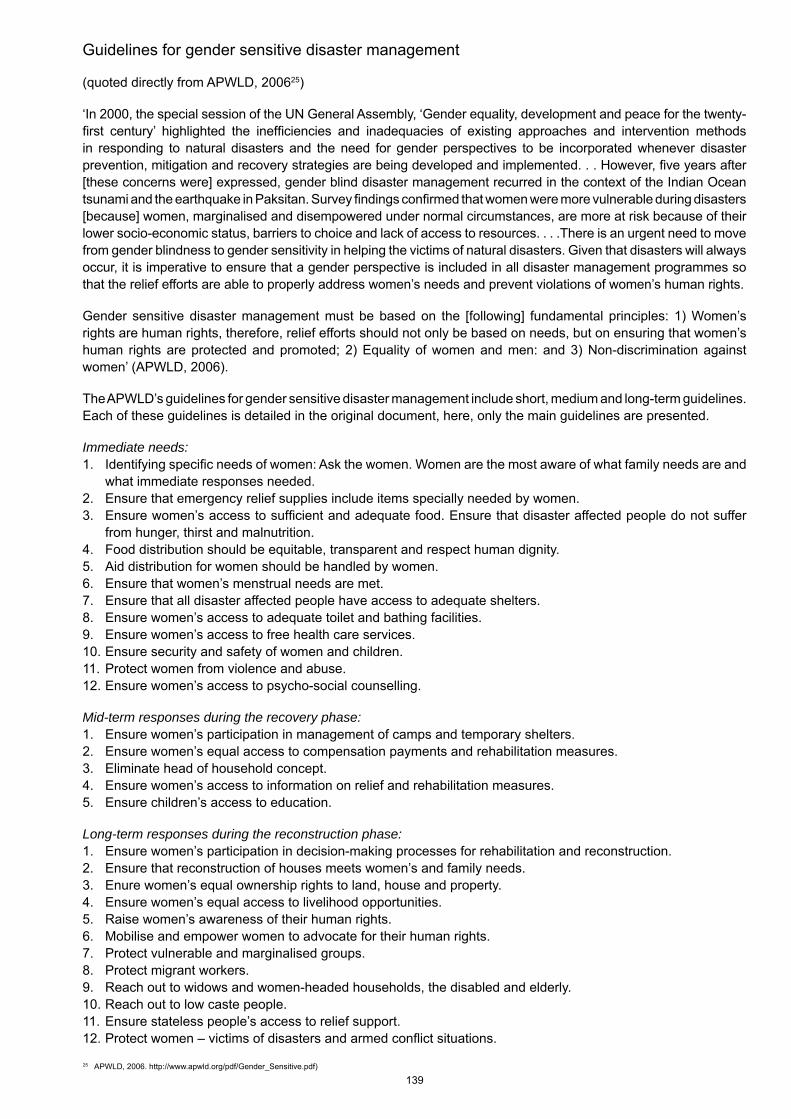
139
Guidelines for gender sensitive disaster management
(quoted directly from APWLD, 200625)
‘In 2000, the special session of the UN General Assembly, ‘Gender equality, development and peace for the twenty-first century’ highlighted the inefficiencies and inadequacies of existing approaches and intervention methods in responding to natural disasters and the need for gender perspectives to be incorporated whenever disaster prevention, mitigation and recovery strategies are being developed and implemented. . . However, five years after [these concerns were] expressed, gender blind disaster management recurred in the context of the Indian Ocean tsunami and the earthquake in Paksitan. Survey findings confirmed that women were more vulnerable during disasters [because] women, marginalised and disempowered under normal circumstances, are more at risk because of their lower socio-economic status, barriers to choice and lack of access to resources. . . .There is an urgent need to move from gender blindness to gender sensitivity in helping the victims of natural disasters. Given that disasters will always occur, it is imperative to ensure that a gender perspective is included in all disaster management programmes so that the relief efforts are able to properly address women’s needs and prevent violations of women’s human rights.
Gender sensitive disaster management must be based on the [following] fundamental principles: 1) Women’s rights are human rights, therefore, relief efforts should not only be based on needs, but on ensuring that women’s human rights are protected and promoted; 2) Equality of women and men: and 3) Non-discrimination against women’ (APWLD, 2006).
The APWLD’s guidelines for gender sensitive disaster management include short, medium and long-term guidelines. Each of these guidelines is detailed in the original document, here, only the main guidelines are presented.
Immediate needs:1. Identifying specific needs of women: Ask the women. Women are the most aware of what family needs are and
what immediate responses needed.2. Ensure that emergency relief supplies include items specially needed by women. 3. Ensure women’s access to sufficient and adequate food. Ensure that disaster affected people do not suffer
from hunger, thirst and malnutrition.4. Food distribution should be equitable, transparent and respect human dignity.5. Aid distribution for women should be handled by women.6. Ensure that women’s menstrual needs are met.7. Ensure that all disaster affected people have access to adequate shelters.8. Ensure women’s access to adequate toilet and bathing facilities.9. Ensure women’s access to free health care services.10. Ensure security and safety of women and children.11. Protect women from violence and abuse.12. Ensure women’s access to psycho-social counselling.
Mid-term responses during the recovery phase: 1. Ensure women’s participation in management of camps and temporary shelters.2. Ensure women’s equal access to compensation payments and rehabilitation measures.3. Eliminate head of household concept.4. Ensure women’s access to information on relief and rehabilitation measures.5. Ensure children’s access to education.
Long-term responses during the reconstruction phase:1. Ensure women’s participation in decision-making processes for rehabilitation and reconstruction.2. Ensure that reconstruction of houses meets women’s and family needs.3. Enure women’s equal ownership rights to land, house and property.4. Ensure women’s equal access to livelihood opportunities.5. Raise women’s awareness of their human rights.6. Mobilise and empower women to advocate for their human rights.7. Protect vulnerable and marginalised groups.8. Protect migrant workers.9. Reach out to widows and women-headed households, the disabled and elderly.10. Reach out to low caste people.11. Ensure stateless people’s access to relief support.12. Protect women – victims of disasters and armed conflict situations.
25 APWLD, 2006. http://www.apwld.org/pdf/Gender_Sensitive.pdf)
140
Photocredits
Page number
Caption Credit
Frontpiece Dried mud flat, north west coast, Sri Lanka. © Thushara Ranasinghe
iv Mangroves, south western Sri Lanka © Sriyanie Miththapala
vi Particpants of a training workshop in the field. © Hanying Li
vii Particpants of a training workshop analysing data. © Sriyanie Miththapala
1 Tsunami damage, Thailand. © IUCN Thailand
2 Mangrove habitat, Simeulue, Indonesia. © Ben Brown
3 Taking digital pictures of fauna for later identification. © Sriyanie Miththapala
6 Pugmark of a Rusty-spotted cat, north central Sri Lanka. © Sriyanie Miththapala
14 CARE staff analysing data, southern Sri Lanka. © Sanjeewa Lelwala
17 Boats in Nha Trang Bay, Vietnam. © Nha Trang Bay MPA Authority
18 Blue tiger, Sri Lanka. © Gehan de Silva Wijeyeratne
27 Papaya tree crown, north central Sri Lanka. © Nadeera Weerasinghe
28 Garbage dump, Colombo, Sri Lanka. © Ranjit Galappatti
34 Lone fisherman, south western Sri Lanka. © Sriyanie Miththapala
54 Traditional fishing, Tonle Sap, Cambodia. © Sun Visal
76 Fisherfolk mending nets, north west Sri Lanka . © Niroshan Mirando
78 Tsunami damage, eastern Sri Lanka © IUCN, Sri Lanka
81 Left: Prickly Pear; Right: Mesquite © Naalin Perera/IUCN
98 Replanting mangrove in southern Sri Lanka. © Vimukthi Weeratunge
111 Top: Beach Clean up after the tsunami, Sri Lanka, Bottom: Home garden, southern Sri Lanka
Top: © Jerker Tamelander/IUCN, Bottom: © Vimukthi Weeratunge
112 CBDRM workshop, northern Sri Lanka. © CARE Sri Lanka
114 Tsunami damage, southern Sri Lanka. © Asanka Abaykoon/IUCN
124 Persons affected by the 2005 earthquake, Pakistan © Zabardast Khan Bangash
128 Child and youth development centre at Xienghone province, Laos PDR.
© Save the Children Australia: under the programme of Youth at Risks and Women's Livelihood Creation.
130 Relief items being delivered after the tsunami by IUCN © Asanka Abaykoon/IUCN
132 Earthquake damage, Pakistan © Karl Schuler/IUCN
134 Tsunami damage, southern Sri Lanka © Asanka Abaykoon/IUCN
138 Women at a CBDRM workshop, northern Sri Lanka © CARE Sri Lanka
141 Top: Beach seine, south west Sri Lanka. Bottom: Fisherfolk, Tonle Sap, Cambodia
Top: © Sriyanie Miththapala Bottom: © Sun Visal

141

142


Ecosystems and Livelihoods Group Asia
IUCN 4/1 Adams Avenue
Colombo 4 Sri Lanka
Phone: + 94 11 2559634 Fax: +94 11- 2559637
E-mail: [email protected]://www.iucn.org/about/work/initiatives/about_
work_global_ini_mangr/oapn/index.cfm
© 2008 IUCN, International Union for Conservation of Nature and Natural Resources
Opinions expressed in this paper do not necessarily reflect the official views of IUCN or its members.
The IUCN Asia region covers 23 countries, stretching from Pakistan in the West to Japan in the East, Indonesia in the South to Mongolia in the North. IUCN maintains offices in Bangladesh, Cambodia, China, Lao PDR, Nepal, Pakistan, Sri Lanka, Thailand and Viet Nam. The Asia Regional Office is in Bangkok, Thailand.
IUCN’s seven regional thematic programmes, known collectively as the Ecosystems and Livelihoods Group (ELG), are based in two clusters: one in Colombo, Sri Lanka (environmental economics, marine and coastal, species conservation), and one in Bangkok, Thailand (environmental law, forests, protected areas, wetlands and water resources).