integrating well log interpretations for lithofacies ... · dictors), for instance well log...
TRANSCRIPT

ORIGINAL PAPER - PRODUCTION GEOLOGY
Integrating well log interpretations for lithofacies classificationand permeability modeling through advanced machine learningalgorithms
Watheq J. Al-Mudhafar1,2
Received: 20 December 2016 / Accepted: 24 May 2017 / Published online: 13 June 2017
� The Author(s) 2017. This article is an open access publication
Abstract In this paper, an integrated procedure was
adopted to obtain accurate lithofacies classification to be
incorporated with well log interpretations for a precise core
permeability modeling. Probabilistic neural networks
(PNNs) were employed to model lithofacies sequences as a
function of well logging data in order to predict discrete
lithofacies distribution at missing intervals. Then, the
generalized boosted regression model (GBM) was used as
to build a nonlinear relationship between core permeabil-
ity, well logging data, and lithofacies. The well log inter-
pretations that were considered for lithofacies classification
and permeability modeling are neutron porosity, shale
volume, and water saturation as a function of depth;
however, the measured discrete lithofacies types are sand,
shaly sand, and shale. Accurate lithofacies classification
was achieved by the PNN as the total percent correct of the
predicted discrete lithofacies was 95.81%. In GBM results,
root-mean-square prediction error and adjusted R-square
have incredible positive values, as there was an excellent
matching between the measured and predicted core per-
meability. Additionally, the GBM model led to overcome
the multicollinearity that was available between one pair of
the predictors. The efficiency of boosted regression was
demonstrated by the prediction matching of core perme-
ability in comparison with the conventional multiple linear
regression (MLR). GBM led to much more accurate per-
meability prediction than the MLR.
Keywords Lithofacies classification � Permeability
modeling � Probabilistic neural networks � Boostedregression � Well log interpretations
Introduction
Integration of rock facies classification into the formation
permeability modeling, especially given the core mea-
surement and well log interpretations, is a crucial step to
reduce the uncertainty in reservoir characterization (Xu
et al. 2012). Rock facies classification leads to improve the
relationship between permeability and porosity and then
results in efficiently estimating the petrophysical properties
in noncored intervals (Lee and Datta-Gupta 1999). The
discrete facies sequence is produced either from core
measurements (lithofacies) or clustered from the well
logging data (electrofacies) (Al-Mudhafar and Bondarenko
2015; Lee and Datta-Gupta 1999; Nashawi and Malallah
2009; Tang et al. 2004). The classification procedure starts
with modeling the discrete facies distribution as a function
of well logging data for limited intervals. Based on that
modeling, the facies distribution is then predicted for the
entire depth intervals for the well and other wells that have
no facies measurements.
Many algorithms have been adopted for lithofa-
cies/electrofacies classification, such as linear discriminant
analysis (Al-Mudhafar 2014, 2015a, b; Lee and Datta-
Gupta 1999; Rafik and Kamel 2016), multinomial logistic
regression (Al-Mudhafar 2014; Tang et al. 2004), neural
networks (Avseth and Mukerji 2002; Tang 2008; Wong
et al. 1995), kernel support vector machine (Al-Mudhafar
2015a, b, 2017a, b), and principal component analysis
(Adoghe et al. 2011). All these algorithms predict the
discrete and continuous probability distributions of facies.
& Watheq J. Al-Mudhafar
1 Louisiana State University, Patrick F. Taylor Hall,
Baton Rouge, LA 70803, USA
2 Basra Oil Company, Basra, Iraq
123
J Petrol Explor Prod Technol (2017) 7:1023–1033
DOI 10.1007/s13202-017-0360-0

In permeability modeling and prediction, there are many
various algorithms that have been adopted to predict the
permeability given core measurements and/or well logging
records in addition to rock facies. These algorithms include
multiple linear regression (Dahraj and Bhutto 2014;
Mohaghegh et al. 1997; Xue et al. 1997), generalized
additive modeling (Al-Mudhafar and Mohamed 2015; Al-
Mudhafar and Bondarenko 2015; Lee et al. 2002; Rafik
and Kamel 2016), multivariate adaptive regression splines
(Al-Mudhafar and Al-Khazraji 2016; Xie 2008), neural
networks (Lee and Datta-Gupta 1999; Lee et al. 2002;
Mohaghegh et al. 1997), fuzzy logic (Nashawi and
Malallah 2009), and support vector regression (Al-Anazi
and Gates 2011).
In this paper, the probabilistic neural networks (PNNs)
and generalized boosted regression model (GBM) were
employed for lithofacies classification and core perme-
ability estimation, respectively.
Research methodology
Linking between different reservoir parameters of distinct
measurement scales is a complex procedure because the
geological systems always have nonlinear behavior.
Therefore, it is essential to consider nonlinear algorithms to
model the response parameters, such as permeability or
rock facies, as a function of independent variables (pre-
dictors), for instance well log interpretations. Since the
predictors come from different sources with various scales
of few inches, as in core measurements, and few feet, as in
well logging data, it is important to look for the most
efficient approach to model these different data sources. In
this paper, we introduce an efficient workflow to integrate
the probabilistic neural networks (PNNs), as a nonlinear
facies classification algorithm, into the generalized boosted
regression model (GBM), as nonlinear modeling algorithm,
for core permeability modeling and prediction. To best of
author’s knowledge, the GBM algorithm has never been
adopted before, at least in the literature of the petrophysical
property modeling, to model the core permeability as a
function of well logging and facies data.
PNN is an implementation of a statistical algorithm
called Kernel discriminant analysis in which the operations
are organized into a multi-layered feedforward network
with four layers: input, pattern, summation, and output
layers. GBM is a recent data mining technique that has
shown considerable success in predictive accuracy as it
maintains a monotonic relationship between the response
and each predictor. In particular, PNN was employed to
model lithofacies sequences in order to predict discrete
lithofacies distribution for the entire reservoir thickness,
including the missing intervals. After that, the predicted
discrete facies distribution was included as a predictor in
the multivariate permeability modeling through the GBM
approach. The GBM was employed to build a nonlinear
relationship between core permeability and well logging
data conditioning to the lithofacies. More specifically, it
was essential to model the permeability as a function of
well logging data given each rock facies to estimate the
core permeability in noncored intervals and other wells
with preserving the reservoir heterogeneity. The well log
interpretations of neutron porosity, shale volume, and
water saturation along with the core measurements of
permeability and lithofacies, were obtained for a well in the
upper sandstone reservoir/Zubair formation in South
Rumaila oil field, located in southern Iraq. The principle
permeability model is illustrated in the following equation:
y ¼ f ðxiÞ þ �i ð1Þ
where xi refers to the independent variables (predictors), y
is the expected core permeability, and �i is the residual.
To show the efficiency of the GBM algorithm, its per-
formance was compared to the conventional multiple linear
regression (MLR). The root-mean-square prediction error
(RMSE) and adjusted R-square were considered as statis-
tical validation tools to compare between MLR and GBM
results. More specifically, the RMSE and R2adj were con-
sidered to quantify the mismatch between the observed and
predicted core permeability calculated by GBM and MLR.
RMSE measures the expected squared difference between
the observed and predicted core permeability, and R2adj is
the adjusted R2 that explains the variance obtained by the
permeability model adjusted for the number of predictors
that improve the model:
RMSE ¼
ffiffiffiffiffiffiffiffiffiffiffiffiffiffiffiffiffiffiffiffiffiffiffiffiffiffiffiffiffiffiffiffiffiffiffiffiffiffiffiffiffiffi
1
n
X
n
j¼1
ðf̂ jðxiÞ � fjðxiÞÞ2v
u
u
t ð2Þ
R2adj ¼ 1� ð1� R2Þðn� 1Þ
n� k � 1ð3Þ
where R2 refers to the coefficient of determination in
simple linear regression, or the coefficient of multiple
determination in multiple linear regression, n is the number
of measurements and k is the number of independent
variables (predictors).
All the multivariate statistics analyses of lithofacies
classification and permeability modeling with results
visualizations were implemented through R, the most
powerful open-source statistical computing language.
Probabilistic neural network
Specht (1990) has firstly introduced the probabilistic neural
network (PNN) as an efficient nonlinear classification
1024 J Petrol Explor Prod Technol (2017) 7:1023–1033
123
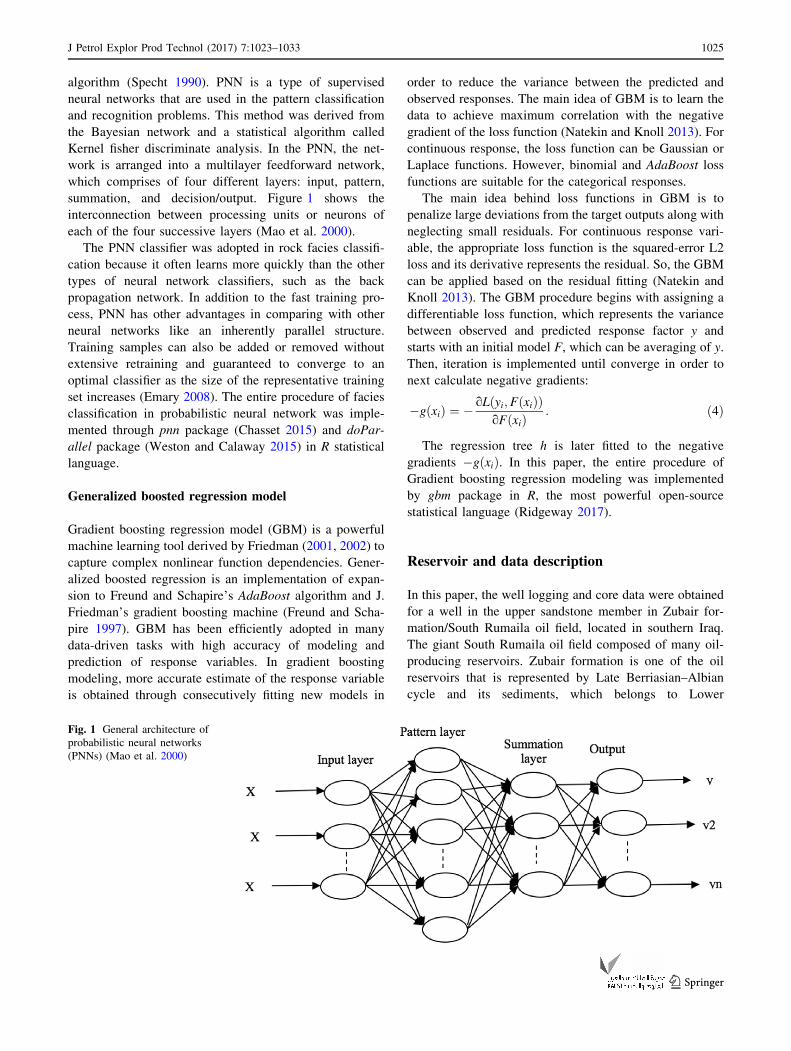
algorithm (Specht 1990). PNN is a type of supervised
neural networks that are used in the pattern classification
and recognition problems. This method was derived from
the Bayesian network and a statistical algorithm called
Kernel fisher discriminate analysis. In the PNN, the net-
work is arranged into a multilayer feedforward network,
which comprises of four different layers: input, pattern,
summation, and decision/output. Figure 1 shows the
interconnection between processing units or neurons of
each of the four successive layers (Mao et al. 2000).
The PNN classifier was adopted in rock facies classifi-
cation because it often learns more quickly than the other
types of neural network classifiers, such as the back
propagation network. In addition to the fast training pro-
cess, PNN has other advantages in comparing with other
neural networks like an inherently parallel structure.
Training samples can also be added or removed without
extensive retraining and guaranteed to converge to an
optimal classifier as the size of the representative training
set increases (Emary 2008). The entire procedure of facies
classification in probabilistic neural network was imple-
mented through pnn package (Chasset 2015) and doPar-
allel package (Weston and Calaway 2015) in R statistical
language.
Generalized boosted regression model
Gradient boosting regression model (GBM) is a powerful
machine learning tool derived by Friedman (2001, 2002) to
capture complex nonlinear function dependencies. Gener-
alized boosted regression is an implementation of expan-
sion to Freund and Schapire’s AdaBoost algorithm and J.
Friedman’s gradient boosting machine (Freund and Scha-
pire 1997). GBM has been efficiently adopted in many
data-driven tasks with high accuracy of modeling and
prediction of response variables. In gradient boosting
modeling, more accurate estimate of the response variable
is obtained through consecutively fitting new models in
order to reduce the variance between the predicted and
observed responses. The main idea of GBM is to learn the
data to achieve maximum correlation with the negative
gradient of the loss function (Natekin and Knoll 2013). For
continuous response, the loss function can be Gaussian or
Laplace functions. However, binomial and AdaBoost loss
functions are suitable for the categorical responses.
The main idea behind loss functions in GBM is to
penalize large deviations from the target outputs along with
neglecting small residuals. For continuous response vari-
able, the appropriate loss function is the squared-error L2
loss and its derivative represents the residual. So, the GBM
can be applied based on the residual fitting (Natekin and
Knoll 2013). The GBM procedure begins with assigning a
differentiable loss function, which represents the variance
between observed and predicted response factor y and
starts with an initial model F, which can be averaging of y.
Then, iteration is implemented until converge in order to
next calculate negative gradients:
�gðxiÞ ¼ � oLðyi;FðxiÞÞoFðxiÞ
: ð4Þ
The regression tree h is later fitted to the negative
gradients �gðxiÞ. In this paper, the entire procedure of
Gradient boosting regression modeling was implemented
by gbm package in R, the most powerful open-source
statistical language (Ridgeway 2017).
Reservoir and data description
In this paper, the well logging and core data were obtained
for a well in the upper sandstone member in Zubair for-
mation/South Rumaila oil field, located in southern Iraq.
The giant South Rumaila oil field composed of many oil-
producing reservoirs. Zubair formation is one of the oil
reservoirs that is represented by Late Berriasian–Albian
cycle and its sediments, which belongs to Lower
Fig. 1 General architecture of
probabilistic neural networks
(PNNs) (Mao et al. 2000)
J Petrol Explor Prod Technol (2017) 7:1023–1033 1025
123
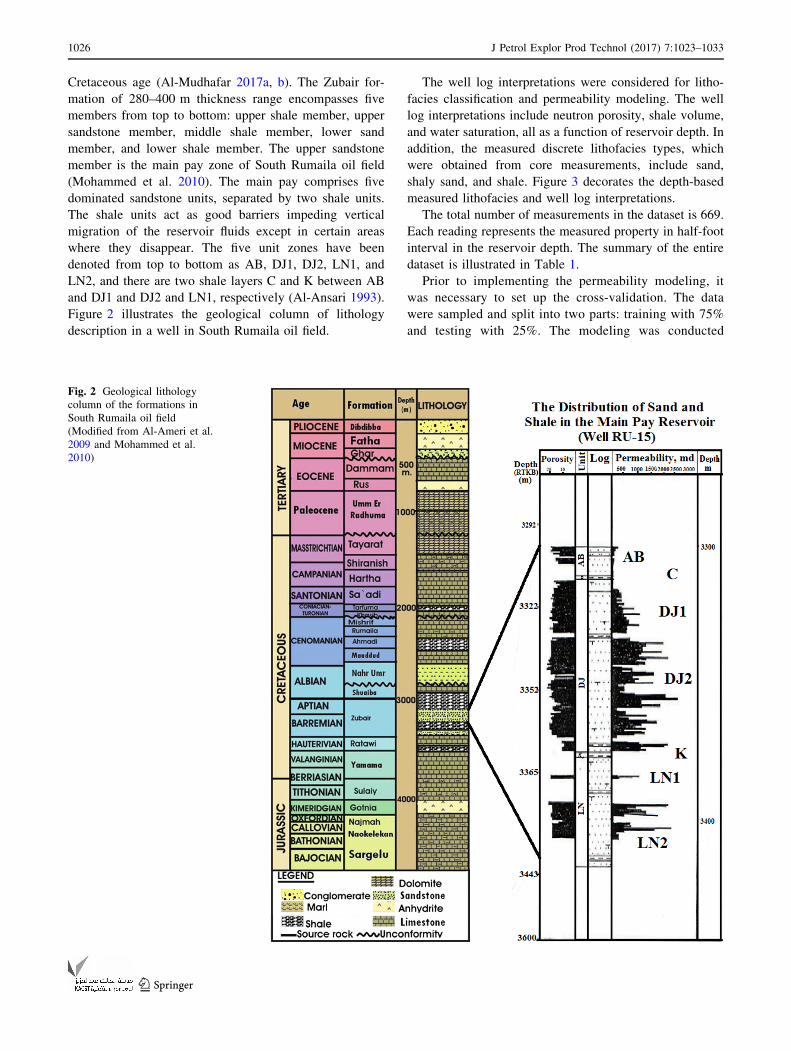
Cretaceous age (Al-Mudhafar 2017a, b). The Zubair for-
mation of 280–400 m thickness range encompasses five
members from top to bottom: upper shale member, upper
sandstone member, middle shale member, lower sand
member, and lower shale member. The upper sandstone
member is the main pay zone of South Rumaila oil field
(Mohammed et al. 2010). The main pay comprises five
dominated sandstone units, separated by two shale units.
The shale units act as good barriers impeding vertical
migration of the reservoir fluids except in certain areas
where they disappear. The five unit zones have been
denoted from top to bottom as AB, DJ1, DJ2, LN1, and
LN2, and there are two shale layers C and K between AB
and DJ1 and DJ2 and LN1, respectively (Al-Ansari 1993).
Figure 2 illustrates the geological column of lithology
description in a well in South Rumaila oil field.
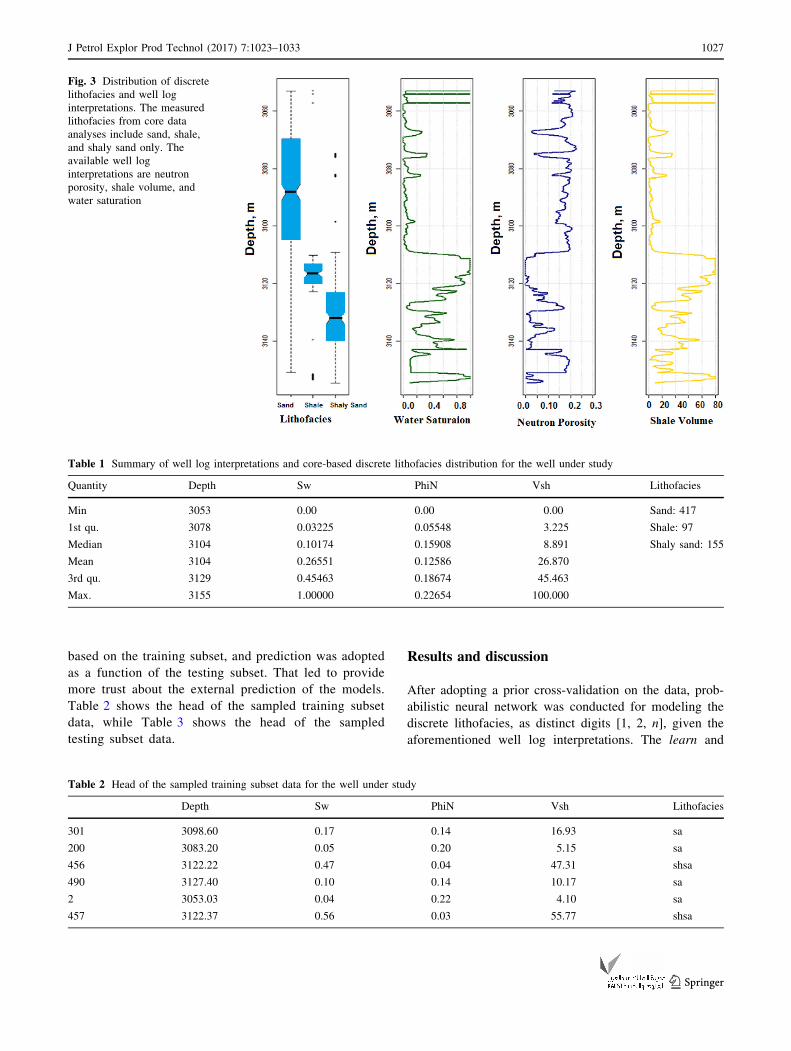
The well log interpretations were considered for litho-
facies classification and permeability modeling. The well
log interpretations include neutron porosity, shale volume,
and water saturation, all as a function of reservoir depth. In
addition, the measured discrete lithofacies types, which
were obtained from core measurements, include sand,
shaly sand, and shale. Figure 3 decorates the depth-based
measured lithofacies and well log interpretations.
The total number of measurements in the dataset is 669.
Each reading represents the measured property in half-foot
interval in the reservoir depth. The summary of the entire
dataset is illustrated in Table 1.
Prior to implementing the permeability modeling, it
was necessary to set up the cross-validation. The data
were sampled and split into two parts: training with 75%
and testing with 25%. The modeling was conducted
Fig. 2 Geological lithology
column of the formations in
South Rumaila oil field
(Modified from Al-Ameri et al.
2009 and Mohammed et al.
2010)
1026 J Petrol Explor Prod Technol (2017) 7:1023–1033
123
based on the training subset, and prediction was adopted
as a function of the testing subset. That led to provide
more trust about the external prediction of the models.
Table 2 shows the head of the sampled training subset
data, while Table 3 shows the head of the sampled
testing subset data.
Results and discussion
After adopting a prior cross-validation on the data, prob-
abilistic neural network was conducted for modeling the
discrete lithofacies, as distinct digits [1, 2, n], given the
aforementioned well log interpretations. The learn and
Fig. 3 Distribution of discrete
lithofacies and well log
interpretations. The measured
lithofacies from core data
analyses include sand, shale,
and shaly sand only. The
available well log
interpretations are neutron
porosity, shale volume, and
water saturation
Table 1 Summary of well log interpretations and core-based discrete lithofacies distribution for the well under study
Quantity Depth Sw PhiN Vsh Lithofacies
Min 3053 0.00 0.00 0.00 Sand: 417
1st qu. 3078 0.03225 0.05548 3.225 Shale: 97
Median 3104 0.10174 0.15908 8.891 Shaly sand: 155
Mean 3104 0.26551 0.12586 26.870
3rd qu. 3129 0.45463 0.18674 45.463
Max. 3155 1.00000 0.22654 100.000
Table 2 Head of the sampled training subset data for the well under study
Depth Sw PhiN Vsh Lithofacies
301 3098.60 0.17 0.14 16.93 sa
200 3083.20 0.05 0.20 5.15 sa
456 3122.22 0.47 0.04 47.31 shsa
490 3127.40 0.10 0.14 10.17 sa
2 3053.03 0.04 0.22 4.10 sa
457 3122.37 0.56 0.03 55.77 shsa
J Petrol Explor Prod Technol (2017) 7:1023–1033 1027
123

smooth functions in pnn R package produce the observed
and guessed discrete lithofacies distribution. The total
correct percent (classification success rate) of the classified
lithofacies was automatically calculated after computing
the count of success and fail points. The resulted success
rate in this study was 95.81%, and this rate is accurate
enough for the PNN algorithm to be considered for further
facies prediction. The comparison between the observed
and predicted lithofacies is shown in Fig. 4.
In core permeability modeling, the predicted discrete
lithofacies distribution of sand, shaly sand, and shale was
included into the generalized boosted regression model
(GBM) as a fifth predictor in addition to well depth, neu-
tron porosity, shale volume, and water saturation. The gbm
function, in the gbm R package, requires defining gaussian
distribution for permeability as a loss function. It also
requires determining the number of iterations and the k-
fold for the built-in cross-validation. To ensure more
accurate modeling, the number of maximum iterations was
set to 50,000 with twofold for the cross-validation; while
the optimal number of iterations is automatically specified
by gbm.perf function. Through gbm function implementa-
tion, the relative influence is calculated to show the most
influential predictors on the response (core permeability).
The lithofacies distribution has the most effect on the
core permeability modeling because of the distinct per-
meability distribution given each facies of sand, shaly sand,
and shale. The water saturation and depth are more
Table 3 Head of the sampled testing subset data for the well under study
Depth Sw PhiN Vsh Lithofacies
316 3100.88 0.04 0.21 4.22 sa
411 3115.36 1.00 0.00 100.00 sh
146 3074.97 0.35 0.04 35.46 shsa
592 3142.95 0.95 0.00 63.43 sh
182 3080.46 0.07 0.20 6.98 sa
616 3146.60 0.11 0.20 10.15 sa
Fig. 4 Box-plots of the
observed and predicted discrete
lithofacies by the PNN
algorithm
1028 J Petrol Explor Prod Technol (2017) 7:1023–1033
123
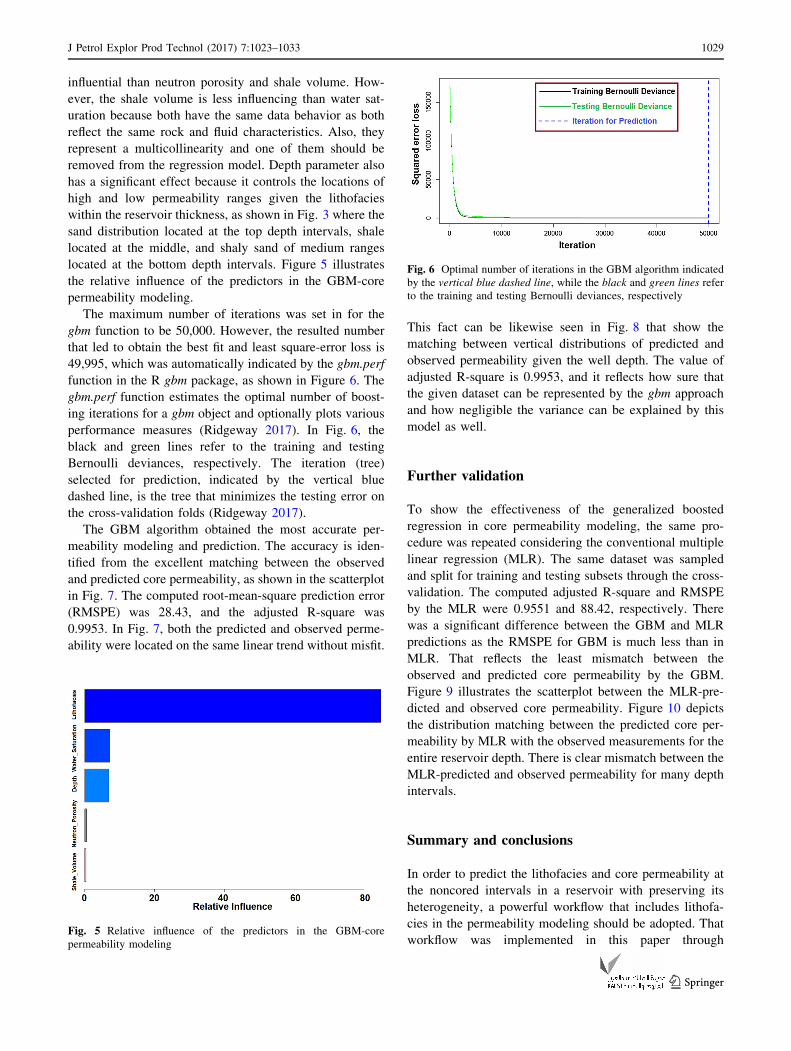
influential than neutron porosity and shale volume. How-
ever, the shale volume is less influencing than water sat-
uration because both have the same data behavior as both
reflect the same rock and fluid characteristics. Also, they
represent a multicollinearity and one of them should be
removed from the regression model. Depth parameter also
has a significant effect because it controls the locations of
high and low permeability ranges given the lithofacies
within the reservoir thickness, as shown in Fig. 3 where the
sand distribution located at the top depth intervals, shale
located at the middle, and shaly sand of medium ranges
located at the bottom depth intervals. Figure 5 illustrates
the relative influence of the predictors in the GBM-core
permeability modeling.
The maximum number of iterations was set in for the
gbm function to be 50,000. However, the resulted number
that led to obtain the best fit and least square-error loss is
49,995, which was automatically indicated by the gbm.perf
function in the R gbm package, as shown in Figure 6. The
gbm.perf function estimates the optimal number of boost-
ing iterations for a gbm object and optionally plots various
performance measures (Ridgeway 2017). In Fig. 6, the
black and green lines refer to the training and testing
Bernoulli deviances, respectively. The iteration (tree)
selected for prediction, indicated by the vertical blue
dashed line, is the tree that minimizes the testing error on
the cross-validation folds (Ridgeway 2017).
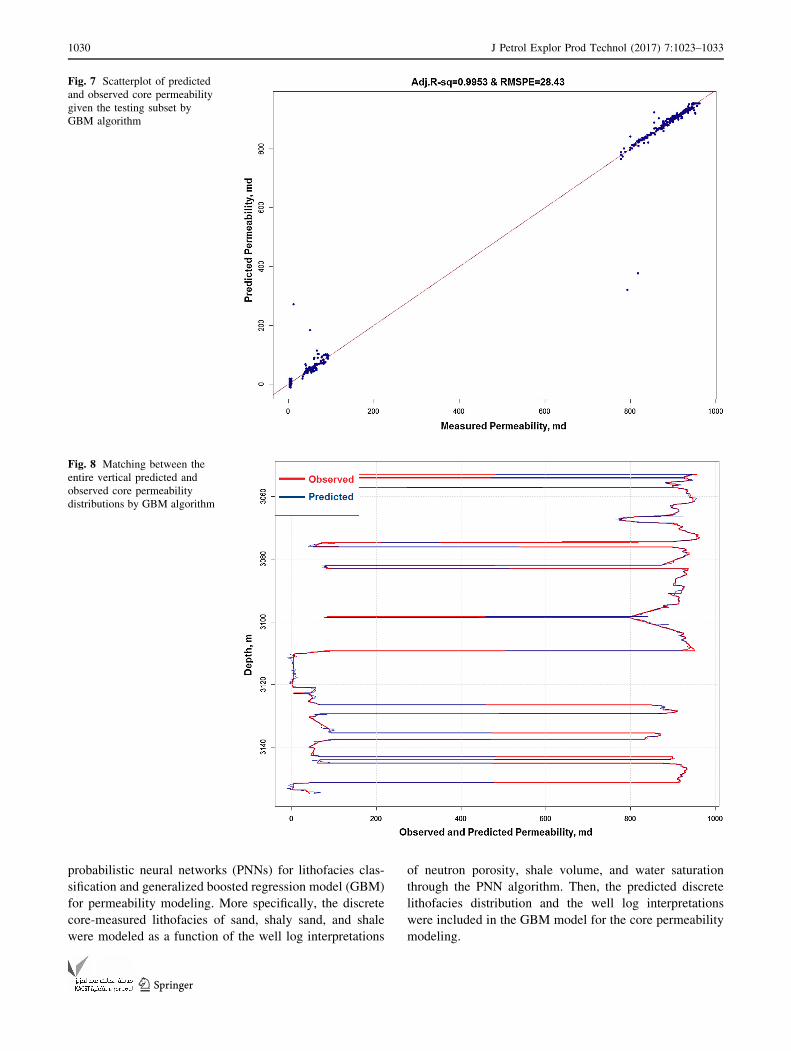
The GBM algorithm obtained the most accurate per-
meability modeling and prediction. The accuracy is iden-
tified from the excellent matching between the observed
and predicted core permeability, as shown in the scatterplot
in Fig. 7. The computed root-mean-square prediction error
(RMSPE) was 28.43, and the adjusted R-square was
0.9953. In Fig. 7, both the predicted and observed perme-
ability were located on the same linear trend without misfit.
This fact can be likewise seen in Fig. 8 that show the
matching between vertical distributions of predicted and
observed permeability given the well depth. The value of
adjusted R-square is 0.9953, and it reflects how sure that
the given dataset can be represented by the gbm approach
and how negligible the variance can be explained by this
model as well.
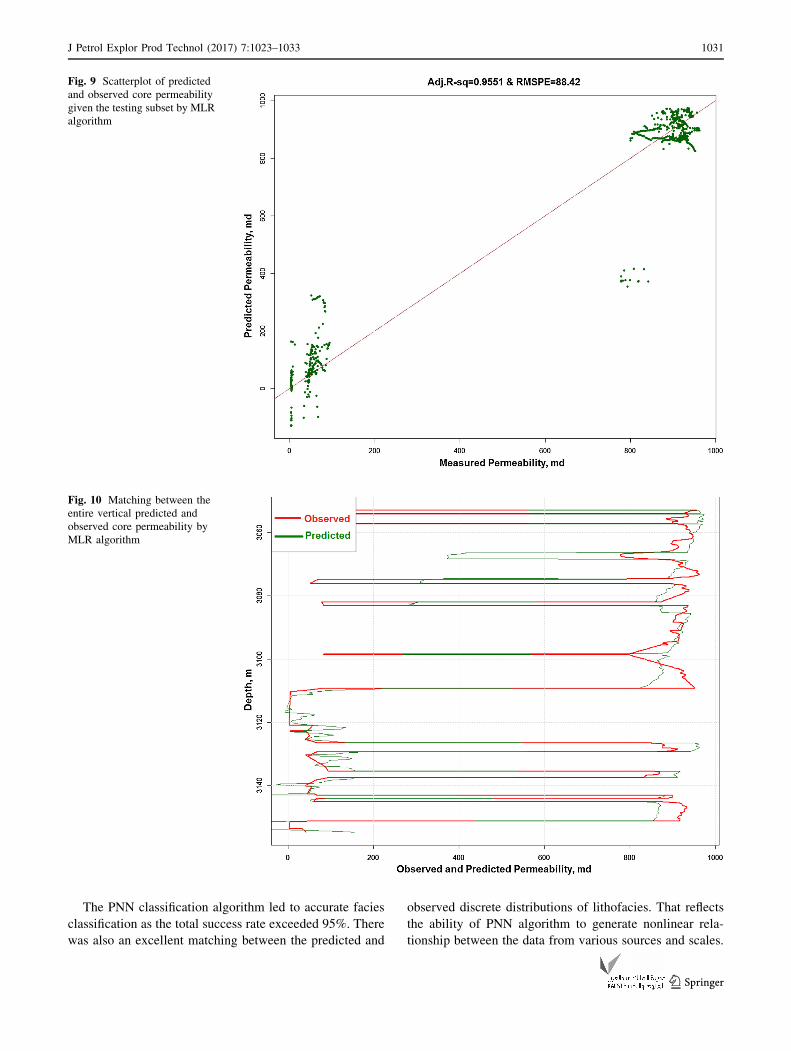
Further validation
To show the effectiveness of the generalized boosted
regression in core permeability modeling, the same pro-
cedure was repeated considering the conventional multiple
linear regression (MLR). The same dataset was sampled
and split for training and testing subsets through the cross-
validation. The computed adjusted R-square and RMSPE
by the MLR were 0.9551 and 88.42, respectively. There
was a significant difference between the GBM and MLR
predictions as the RMSPE for GBM is much less than in
MLR. That reflects the least mismatch between the
observed and predicted core permeability by the GBM.
Figure 9 illustrates the scatterplot between the MLR-pre-
dicted and observed core permeability. Figure 10 depicts
the distribution matching between the predicted core per-
meability by MLR with the observed measurements for the
entire reservoir depth. There is clear mismatch between the
MLR-predicted and observed permeability for many depth
intervals.
Summary and conclusions
In order to predict the lithofacies and core permeability at
the noncored intervals in a reservoir with preserving its
heterogeneity, a powerful workflow that includes lithofa-
cies in the permeability modeling should be adopted. That
workflow was implemented in this paper throughFig. 5 Relative influence of the predictors in the GBM-core
permeability modeling
Fig. 6 Optimal number of iterations in the GBM algorithm indicated
by the vertical blue dashed line, while the black and green lines refer
to the training and testing Bernoulli deviances, respectively
J Petrol Explor Prod Technol (2017) 7:1023–1033 1029
123
probabilistic neural networks (PNNs) for lithofacies clas-
sification and generalized boosted regression model (GBM)
for permeability modeling. More specifically, the discrete
core-measured lithofacies of sand, shaly sand, and shale
were modeled as a function of the well log interpretations
of neutron porosity, shale volume, and water saturation
through the PNN algorithm. Then, the predicted discrete
lithofacies distribution and the well log interpretations
were included in the GBM model for the core permeability
modeling.
Fig. 7 Scatterplot of predicted
and observed core permeability
given the testing subset by
GBM algorithm
Fig. 8 Matching between the
entire vertical predicted and
observed core permeability
distributions by GBM algorithm
1030 J Petrol Explor Prod Technol (2017) 7:1023–1033
123
The PNN classification algorithm led to accurate facies
classification as the total success rate exceeded 95%. There
was also an excellent matching between the predicted and
observed discrete distributions of lithofacies. That reflects
the ability of PNN algorithm to generate nonlinear rela-
tionship between the data from various sources and scales.
Fig. 9 Scatterplot of predicted
and observed core permeability
given the testing subset by MLR
algorithm
Fig. 10 Matching between the
entire vertical predicted and
observed core permeability by
MLR algorithm
J Petrol Explor Prod Technol (2017) 7:1023–1033 1031
123

The GBM algorithm created a nonlinear relationship,
which is necessary for nonlinear geological systems,
between the core permeability given the predictors of well
log interpretations and lithofacies. The nonlinearity mod-
eling resulted in the excellent matching between the
observed and predicted core permeability for all depth
intervals of the reservoir with a very small prediction error.
Additionally, the efficiency of GBM results was validated
by repeating the procedure of permeability modeling
through the conventional multiple linear regression (MLR).
The matching between the GBM-based predicted and
observed permeability was much more accurate than the
MLR as the root-mean-square prediction error was less and
adjusted R-square was higher in GBM than in MLR.
To validate the results of the variously presented algo-
rithms, the cross-validation was conducted prior to the
permeability modeling by sampling and splitting the data
into training and testing subsets. The modeling was adop-
ted in the training subset, and prediction was then con-
ducted given the testing part to make an external prediction
from the same dataset and reduce the prediction
uncertainty.
Finally, a precise prediction of rock facies leads to
improve the well logging–permeability relationships and
then obtain adequate permeability modeling with preserv-
ing reservoir heterogeneity. Additionally, integrating facies
characterization into the permeability modeling results in
accurately identifying the vertical and spatial facies as well
as boosting the petrophysical property distribution for
improved overall reservoir characterization.
Acknowledgements The author would like to present his thanks and
appreciation to the Institute of International Education for granting
him the Fulbright Science and Technology International Award that
has funded the PhD Research at Louisiana State University.
Open Access This article is distributed under the terms of the
Creative Commons Attribution 4.0 International License (http://
creativecommons.org/licenses/by/4.0/), which permits unrestricted
use, distribution, and reproduction in any medium, provided you give
appropriate credit to the original author(s) and the source, provide a
link to the Creative Commons license, and indicate if changes were
made.
References
Adoghe LI, Aniekwe OS, Nwosu C (2011) Improving electrofacies
modeling using multivariate analysis techniques: a deepwater
turbidite case study. In: Nigeria annual international conference
and exhibition (30 July–3 August), Abuja, Nigeria. doi:10.2118/
150776-MS
Al-Ameri TK, Al-Khafaji AJ, Zumberge J (2009) Petroleum system
analysis of the Mishrif reservoir in the Ratawi, Zubair, North and
South Rumaila oil fields, Southern Iraq. GeoArabia 4(4):91–103
Al-Ansari R (1993) The petroleum geology of the Upper sandstone
member of the Zubair formation in the Rumaila South Oilfield.
Ministry of Oil, Department of Reservoirs and Fields Develop-
ment-Section of Production Studies.
Al-Anazi AF, Gates ID (2011) Support-vector regression for perme-
ability prediction in a heterogeneous reservoir: a comparative
study. SPE Reserv Eval Eng 13(03):485–495. doi:10.2118/
126339-PA
Al-Mudhafar WJM (2014) Integrating Markov chains for Bayesian
estimation of vertical facies sequences through linear discrim-
inant analysis. In: European association of geoscientists and
engineers. doi:10.3997/2214-4609.20141336
Al-Mudhafar WJ (2015a) Integrating component analysis and clas-
sification techniques for comparative prediction of continuous
and discrete lithofacies distributions. In: Offshore technology
conference, Houston, Texas. doi:10.4043/25806-MS
Al-Mudhafar WJ (2015b) Multinomial logistic regression for
bayesian estimation of vertical facies modeling in heterogeneous
sandstone reservoirs. In: Offshore technology conference Asia,
Kuala Lumpur, Malaysia. doi:10.4043/24732-MS
Al-Mudhafar WJ (2017a) Integrating kernel support vector machines
for efficient rock facies classification in the main pay of Zubair
formation in South Rumaila oil field, Iraq. Model Earth Syst
Environ 3:12. doi:10.1007/s40808-017-0277-0
Al-Mudhafar WJ (2017b) Geostatistical lithofacies modeling of the
upper sandstone member/Zubair formation in South Rumaila oil
field, Iraq. Arab JGeosci 10:153. doi:10.1007/s12517-017-2951-y
Al-Mudhafar W, Bondarenko MA (2015) Integrating K-means
clustering analysis and generalized additive model for efficient
reservoir characterization. In: 77th EAGE conference and
exhibition incorporating SPE EUROPIC, Madrid, Spain.
doi:10.3997/2214-4609.201413024
Al-Mudhafar WJ, Mohamed L (2015) Incorporating lithofacies
classification and well logs into statistical learning algorithms
for comparative multisource permeability modeling. In: SPE
North Africa technical conference and exhibition, Cairo, Egypt.
doi:10.2118/175776-MS
Al-Mudhafar WJ, Al-Khazraji AK (2016) Non-parametric adaptive
regression spines for multisource permeability modeling in
sandstone formation. In: Offshore technology conference Asia
Kuala Lumpur, Malaysia. doi:10.4043/26431-MS
Avseth P, Mukerji T (2002) Seismic lithofacies classification from
well logs using statistical rock physics. Petrophysics
43(02):70–81. doi:10.2118/170748-MS
Chasset (2015) Pierre-Olivier probabilistic neural-network. https://
cran.r-project.org/web/packages/pnn/pnn.pdf
Dahraj NUH, Bhutto AA (2014) Linear mathematical model devel-
oped using statistical methods to predict permeability from
porosity. In: PAPG/SPE Pakistan section annual technical
conference (24–27 November), Islamabad, Pakistan. doi:10.
2118/174716-MS
El Emary IMM, Srinivasan R (2008) On the application of various
probabilistic neural networks in solving different pattern classi-
fication problems. World Appl Sci J 4(6):772–780
Freund Y, Schapire RE (1997) A decision-theoretic generalization of
online learning and an application to boosting. J Comput Syst Sci
55(1):119–139
Friedman JH (2001) Greedy function approximation: a gradient
boosting machine. Ann Stat 29(5):1189–1232
Friedman JH (2002) Stochastic gradient boosting. Comput Stat Data
Anal 38(4):367–378
Lee SH, Datta-Gupta A (1999) Electrofacies characterization and
permeability predictions in carbonate reservoirs: role of multi-
variate analysis and nonparametric regression. In: SPE annual
1032 J Petrol Explor Prod Technol (2017) 7:1023–1033
123

technical conference and exhibition (3–6 October), Houston,
Texas. doi:10.2118/56658-MS
Lee SH, Kharghoria A, Datta-Gupta A (2002) Electrofacies charac-
terization and permeability predictions in complex reservoirs.
SPE Reserv Eval Eng 5(03):237–248. doi:10.2118/78662-PA
Mao KZ, Tan KC, Ser W (2000) Probabilistic neural-network
structure determination for pattern classification. IEEE Trans
Neural Netw 11:10091016
Mohaghegh S, Balan B, Ameri S (1997) Permeability determination
from well log data. SPE Form Eval 12(03):170–174. doi:10.
2118/30978-PA
Mohammed WJ, Al Jawad MS, Al-Shamaa DA (2010) Reservoir flow
simulation study for a sector in main pay-south rumaila oil field.
In: SPE Oil and Gas India Conference and Exhibition, Society of
Petroleum Engineers, Mumbai
Nashawi IS, Malallah A (2009) Improved electrofacies characteriza-
tion and permeability predictions in sandstone reservoirs using a
data mining and expert system approach. Petrophysics
5(03):250–268
Natekin A, Knoll A (2013) Gradient boosting machines, a tutorial.
Front Neurorobot 7:1–21
Rafik B, Kamel B (2016) Prediction of permeability and porosity
from well log data using the nonparametric regression with
multivariate analysis and neural network, Hassi RMel Field,
Algeria, Egypt. J. Petrol. doi:10.1016/j.ejpe.2016.10.013
Ridgeway G (2017) Generalized boosted regression models. https://
cran.r-project.org/web/packages/gbm/gbm.pdf
Specht DF (1990) Probabilistic neural networks. Neural Netw
3(1):109118
Tang H (2008) Improved carbonate reservoir facies classification
using artificial neural network method. In: Canadian interna-
tional petroleum conference (17–19 June), Calgary, Alberta,
Canada. doi:10.2118/2008-122
Tang H, White C, Zeng X, Gani M, Bhattacharya J (2004)
Comparison of multivariate statistical algorithms for wireline
log facies classification. AAPG Ann Meet Abstr 88:13
Weston S, Calaway R (2015) Getting Started with doParallel and
foreach. https://cran.r-project.org/web/packages/doParallel/vig
nettes/gettingstartedParallel.pdf
Wong PM, Jian FX, Taggart IJ (1995) A critical comparison of neural
networks and discriminant analysis in lithofacies, porosity and
permeability predictions. J Pet Geol 18:191–206. doi:10.1111/j.
1747-5457.1995.tb00897.x
Xie J (2008) Improved permeability prediction using multivariate
analysis methods. M.Sc. thesis. Texas A&M University. http://
oaktrust.library.tamu.edu/bitstream/handle/1969.1/ETD-TAMU-
3223/XIE-THESIS.pdf?sequence=1&isAllowed=y
Xu C, Heidari Z, Torres-Verdin C (2012) Rock classification in
carbonate reservoirs based on static and dynamic petrophysical
properties estimated from conventional well logs. In: SPE annual
technical conference and exhibition (8–10 October), San Anto-
nio, Texas, USA. doi:10.2118/159991-MS
Xue G, Datta-Gupta A, Valko P, Blasingame T (1997) Optimal
transformations for multiple regression: application to perme-
ability estimation from well logs. SPE Form Eval 12(02):85–94.
doi:10.2118/35412-PA
J Petrol Explor Prod Technol (2017) 7:1023–1033 1033
123