integration of structural health and condition monitoring...
TRANSCRIPT

K. Smarsly, D. Hartmann & K. H. Law
Integration of structural health and condition monitoring into the life-cycle management of
wind turbines
Kay Smarsly*, Dietrich Hartmann**, Kincho H. Law* * Department of Civil and Environmental Engineering, Stanford University,
Stanford, CA 94305, USA ** Department of Civil and Environmental Engineering, Ruhr University Bochum,
44801 Bochum, Germany
Abstract. Cost-efficient operation and maintenance of wind turbines is among the major concerns for manufacturers, owners, and operators. Integrating structural health monitoring (SHM) into life-cycle management strategies can facilitate a cost-efficient and reliable operation of wind turbines. Furthermore, a precise scheduling of maintenance and repair work at minimum associated life-cycle costs is enabled. Using continuously updated monitoring data allows capturing the actual wind turbine condition and reducing uncertainty in resistance parameters and load effects acting on the structure. This paper presents a master plan for a life-cycle management (LCM) framework supporting online monitoring, reliability assessment as well as optimum maintenance and inspection planning of wind turbines. Installed on a 500 kW wind turbine in Germany, the LCM framework is exemplarily deployed for integrated life-cycle management using continuously updated structural, environmental, and operational wind turbine data. To validate the LCM framework and to demonstrate its practicability, a case study is presented investigating the operational efficiency of the monitored wind turbine over a two-year period.
Introduction
In 2011, the global “clean” energy investments have reached a new record of US$ 260 billion, as the Global Wind Energy Council (GWEC) reveals in its latest “Global Wind Report” [1]. Also the wind energy sector, having a turnover of US$ 65 billion in 2011, has broken a new record: The worldwide wind energy capacity, according to the World Wind Energy Association (WWEA), has reached 237 GW, out of which 40 GW – more than ever before – were installed in 2011. The WWEA predicts a global capacity of 500 GW by 2015, and more than 1,000 GW by 2020 [2]. Currently, 96 countries are using wind energy for electricity generation, 50 countries having installed new wind turbines in 2011. In Europe, Germany continues to be the biggest wind energy market; fostered by the coming “energy turnaround” and the nuclear exit by 2022, Germany reaches a total of 29 GW installed wind energy capacity.
To ensure a cost-efficient operation and a high availability of wind energy systems such as wind turbines and wind farms, it is essential to continuously monitor and assess their structural performance and operational efficiency. In particular, the inherent uncertainties in load and resistance parameters impose the need for continuously updated measurement data recorded from the wind turbine. Therefore, integrated life-cycle

K. Smarsly, D. Hartmann & K. H. Law
management (LCM) strategies, coupled with structural health monitoring (SHM) that provides actual measurement data from the wind turbine, are important to enable optimal operation and maintenance of wind turbines and, eventually, to operate wind turbines beyond their original design lives.
It has been demonstrated in related engineering disciplines, such as life-cycle management of bridges or naval ship structures [3-6], that SHM can be an “enabling technology that will lead to the next significant evolution of the ... management of civil infrastructure” [7]. In the wind energy sector, coupling life-cycle management and structural health monitoring, referred to as “monitoring-based LCM”, would provide a reliable instrument to identify load effects on wind turbines, to ensure structural integrity, and to increase operational efficiency and overall power output of wind farms. Currently, instead of incorporating continuously updated monitoring data, general assumptions and periodic inspections – which are time-consuming, costly and do not allow accessing all critical points – serve as a common practice for the life-cycle management of wind turbines [8-10]. Although integrated management approaches considering the electrical and mechanical components of wind turbines already exist [11], their coupling with structural wind turbine data within robust information management frameworks has received little attention.
This paper discusses an integrated approach towards monitoring-based life-cycle management of wind turbines. A decentralized LCM framework is presented, which integrates monitoring data to facilitate optimal maintenance and operation decisions, and to improve structural reliability at minimum associated life-cycle costs. Integrated into the LCM framework, a SHM system provides continuously updated structural and environmental data. In addition, operational data such as power output and revolutions, taken from the wind turbine machine control system, is integrated into the LCM framework. The framework, at the same time serving as an online information platform, automatically processes the heterogeneous data sets and provides the processed data, transmitted via secure connections through the Internet, to human users. This paper first describes the SHM system and then presents the other modules of the integrated LCM framework, focusing on the “management module” in more detail. Thereupon, the functionality and the practicability of the LCM framework are demonstrated, exemplarily analyzing the long-term operational efficiency of a wind turbine continuously monitored since more than two years.
Wind Turbine SHM System
The structural health monitoring system is prototypically installed on a 500 kW wind turbine in Germany (Figure 1). With a rigid hub and a hub height of 65 m, the wind turbine has an upwind rotor of 40.3 m diameter that is equipped with three synchronized blade pitch control systems. The SHM system comprises of a network of sensors, data acquisition units, and an on-site server installed in the maintenance room of the wind turbine; the sensors (accelerometers, displacement transducers, and temperature sensors) are placed at different levels inside and outside the steel tower and on the foundation of the wind turbine. In addition, two anemometers are deployed; one is installed on top of the nacelle, the other is mounted on a telescopic mast adjacent to the wind turbine for recording wind speed, wind direction, and air temperature (Figure 2). Operational data, such as revolutions and power production of the wind turbine, is recorded in the wind turbine machine control system. The data acquisition units, connected to the on-site server, are also installed in the maintenance room of the wind turbine to collect and process the structural and environmental data.

K. Smarsly, D. Hartmann & K. H. Law
All recorded data sets, being sampled and digitized, are continuously forwarded from the data acquisition units to the on-site server for temporary storage and periodic local backups (referred to as “primary monitoring data”). Using a permanently installed DSL connection, the on-site server transfers the primary monitoring data to a central server installed at the Institute for Computational Engineering (ICE) at Ruhr University Bochum, which is part of the LCM framework. The data transmission is automatically executed by a “Cron” job scheduler, a time-based Unix utility running on the on-site server that ensures the periodic execution of tasks according to specified time intervals. When transferring the collected primary monitoring data from the on-site server to the central server, metadata is added to provide definitions of installed sensors, IDs of data acquisition units, output specification details, date and time formats, etc. (termed here as “secondary monitoring data”). The data sets, after being synchronized, aggregated and converted, are persistently stored in a central monitoring database, which is also located at the ICE in Bochum. During the automated conversion process, “tertiary monitoring data”, summarizing the basic statistics of the data sets such as quartiles, medians and means, is computed at different time intervals Δt, and stored in the monitoring database at ICE. Once being stored in the database, the monitoring data is available for the LCM analyses and remotely accessible by authorized human users and software programs for further data processing.
Figure 1. Monitored wind turbine.
Figure 2. Anemometer adjacent to the wind turbine.
Integrated LCM Framework for Wind Turbines
Presently, the integrated LCM framework is primarily designed to remotely assess structural and operational conditions of wind turbines and to support decisions on optimum maintenance, repair work, and inspection planning. The prototype implementation of the LCM framework integrates a set of interconnected modules that are installed at spatially distributed locations. In addition to the SHM system, the following modules are integrated into the framework:
i. a monitoring database for persistent storage of the data sets recorded by the SHM system,
ii. a central server for automated data synchronization, data aggregation, and conversion of the primary monitoring data into secondary and tertiary monitoring data,
iii. RAID-based storage systems for data backups in multiple physical drives,

K. Smarsly, D. Hartmann & K. H. Law
iv. Internet-enabled user interfaces providing online access to authorized users and to software programs,
v. a multiagent-based self-diagnostic system for self-detecting system malfunctions and sensor breakdowns ensuring a reliable operation of the LCM framework,
vi. a model updating framework providing numerical wind turbine models, which are continuously updated by means of system identification based on the monitoring data obtained by the SHM system,
vii. a management module supporting wind turbine life-cycle management through remote analyses of the monitoring data.
To illustrate the practical application of the LCM framework, the following
subsections will focus on module (vii) of the framework, i.e. on the management module. Further details on modules (i) - (vi) can be found in [12-17].
Management Module
The management module provides a variety of specifically designed analysis methods for monitoring-based life-cycle management of wind turbines. Installed on a computer at the Engineering Informatics Group (EIG) at Stanford University, USA, the management module supports the wind turbine life-cycle management through remote analyses of monitoring data, for examples
• to calculate tip speed ratios of wind turbines, • to construct wind turbine power curves, • to compute power coefficients, or • to analyze wind speed distributions.
In addition, the management module allows studying correlations in the monitoring
data and detecting significant changes in the operational and structural behavior of wind turbines. For that purpose, a variety of statistical methods has been implemented, such as regression analysis techniques, analysis of variance (ANOVA), and analysis of covariance (ANCOVA). Furthermore, statistical hypothesis testing for decision making is supported by the management module.
The software architecture of the management module, written in Java, combines several software design patterns and architectures commonly adopted in software engineering – primarily the “three-tier model” and the “adapter pattern” [18] (Figure 3). The three-tier model, being both a software architecture and a software design pattern, ensures a concise separation of the user interface (“presentation”), the functional process logic (“controller”), and the monitoring data (“data access”). The architecture allows any of the three tiers to be upgraded, changed, or replaced independently from each other, and improves scalability, integrity and performance of the management module. The first tier, the presentation, provides access to the management module; the data access tier is designed to remotely access the monitoring database of the LCM framework; the third tier, the controller, contains the analysis methods to be used for life-cycle management of wind turbines. As can be seen from Figure 3, both wind turbine-specific methods and general statistical methods are modularly integrated into the management module in terms of adapters. As illustrated in the abbreviated UML class diagram in Figure 3, examples include fast Fourier transforms (FFT), calculations of tip speed ratios (TSR) and power coefficients (PC) as well as the above mentioned statistical methods.

K. Smarsly, D. Hartmann & K. H. Law
Figure 3. Architecture of the management module.
Operational Efficiency of the Wind Turbine
To illustrate the practical application of the LCM framework, the long-term operational efficiency of the monitored wind turbine is exemplarily analyzed with the management module. For the illustrative example, life-cycle analyses are conducted using monitoring data recorded in the second quarters for the years 2010, 2011, and 2012. The monitoring data used, reflecting the operational efficiency of the wind turbine, is analyzed with respect to significant changes in the three separate periods. In addition, data provided by the manufacturer is considered, serving as the basis for reducing the variability in the monitoring data in further quantitative analyses.
Initially, the monitoring data of interest is transferred from the monitoring database to the management module through a remote database connection, whereas the data provided by the manufacturer is persistently stored in the management module. Specifically, 30-minute wind speed averages as well as 30-minute power output averages, representing tertiary monitoring data, are employed for the analyses. Figure 4 shows the wind speed time histories and the power output time histories measured in the periods of interest. The actual power curves constructed from these data sets are plotted in Figure 5. For visual comparisons, the power curve calculated from the manufacturer’s data, i.e. the theoretical power curve, is also shown in Figure 5. It should be noted that the monitoring data used in the following sample calculations is provided by the automated SHM system, rather than by extensive instrumentations solely deployed for power performance tests, which would comply with IEC 61400-12-1 [19]; the wind speed data, for example, is recorded by the anemometer on top of the nacelle.
Figure 4. Wind speed and power output
in 2010, 2011, and 2012. Figure 5. Actual power curves constructed from the
monitoring data.
K. Smarsly, D. Hartmann & K. H. Law
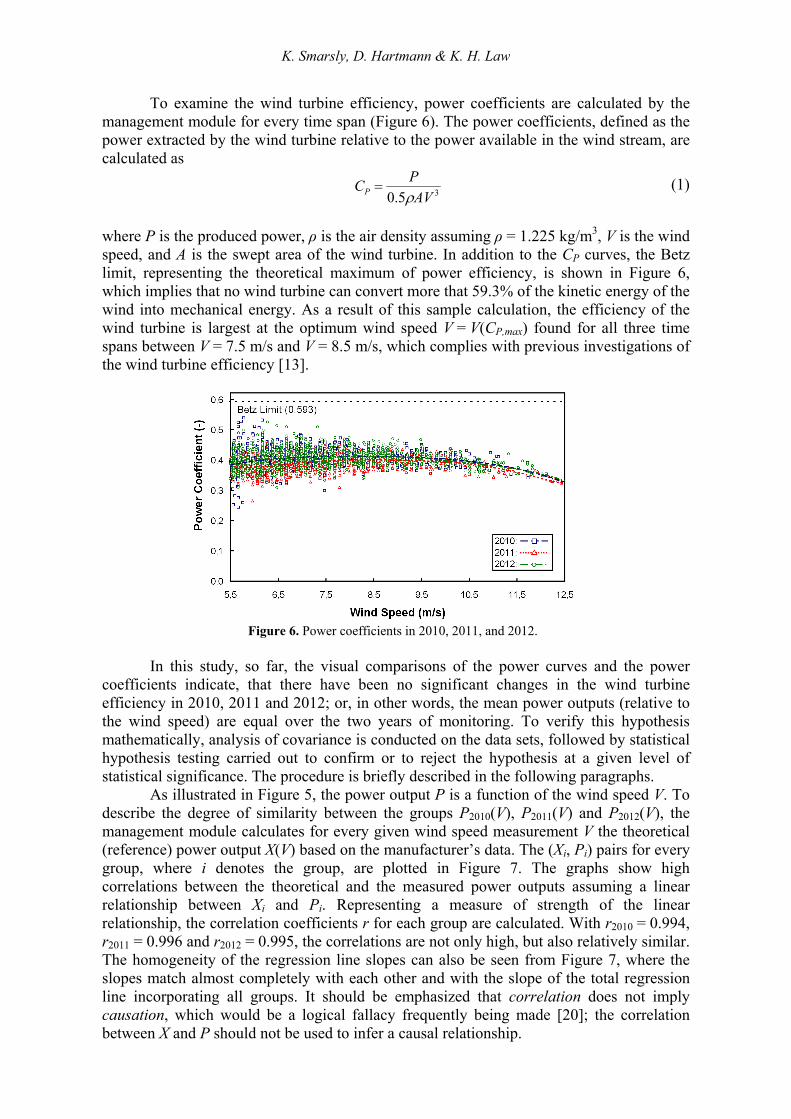
To examine the wind turbine efficiency, power coefficients are calculated by the management module for every time span (Figure 6). The power coefficients, defined as the power extracted by the wind turbine relative to the power available in the wind stream, are calculated as
35.0 AVPCP ρ
= (1)
where P is the produced power, ρ is the air density assuming ρ = 1.225 kg/m3, V is the wind speed, and A is the swept area of the wind turbine. In addition to the CP curves, the Betz limit, representing the theoretical maximum of power efficiency, is shown in Figure 6, which implies that no wind turbine can convert more that 59.3% of the kinetic energy of the wind into mechanical energy. As a result of this sample calculation, the efficiency of the wind turbine is largest at the optimum wind speed V = V(CP,max) found for all three time spans between V = 7.5 m/s and V = 8.5 m/s, which complies with previous investigations of the wind turbine efficiency [13].
Figure 6. Power coefficients in 2010, 2011, and 2012.
In this study, so far, the visual comparisons of the power curves and the power
coefficients indicate, that there have been no significant changes in the wind turbine efficiency in 2010, 2011 and 2012; or, in other words, the mean power outputs (relative to the wind speed) are equal over the two years of monitoring. To verify this hypothesis mathematically, analysis of covariance is conducted on the data sets, followed by statistical hypothesis testing carried out to confirm or to reject the hypothesis at a given level of statistical significance. The procedure is briefly described in the following paragraphs.
As illustrated in Figure 5, the power output P is a function of the wind speed V. To describe the degree of similarity between the groups P2010(V), P2011(V) and P2012(V), the management module calculates for every given wind speed measurement V the theoretical (reference) power output X(V) based on the manufacturer’s data. The (Xi, Pi) pairs for every group, where i denotes the group, are plotted in Figure 7. The graphs show high correlations between the theoretical and the measured power outputs assuming a linear relationship between Xi and Pi. Representing a measure of strength of the linear relationship, the correlation coefficients r for each group are calculated. With r2010 = 0.994, r2011 = 0.996 and r2012 = 0.995, the correlations are not only high, but also relatively similar. The homogeneity of the regression line slopes can also be seen from Figure 7, where the slopes match almost completely with each other and with the slope of the total regression line incorporating all groups. It should be emphasized that correlation does not imply causation, which would be a logical fallacy frequently being made [20]; the correlation between X and P should not be used to infer a causal relationship.

K. Smarsly, D. Hartmann & K. H. Law
Figure 7. Correlation between measured and calculated power output.
Since a direct comparison of the mean power outputs iP of the regarded groups
would be biased because of the corresponding iX being different, the management module adjusts each mean power output to a common X value: To remove the effects of X, which can be interpreted as the covariate, a computational efficient ANCOVA procedure is applied, in which the sums of squared deviates for Xi and Pi are first computed, followed by the calculation of the covariances of Xi and Pi for every group and for the total of all groups. Thereupon, all relevant parameters, such as the sums of squared deviates and the sought-after group means, are adjusted. The results are summarized in Table 1. Finally, the (adjusted) F-value is calculated and an F-test for the null hypothesis is performed. As a result, the null hypothesis that all mean power outputs are equal is rejected. With the result being significant at the 1% significance level, it can be concluded that there is evidence that the considered power outputs in 2010, 2011 and 2012 differ. However, there is no trend in the mean power outputs that would indicate a decrease of the wind turbine efficiency over the two-year period; by contrast, the mean power output, according to Table 1, is in the second quarters of 2011 and 2012 about 2% higher than in the second quarter of 2010.
Table 1. Analysis results (summary) 2010 2011 2012 Mean power output 101.1 kW 111.6 kW 121.3 kW Adjusted mean power output 113.1 kW 115.4 kW 115.4 kW
Conclusions
In this paper, an approach has been presented for integrating the data obtained from structural health monitoring into a life-cycle management framework for wind turbines. An integrated LCM framework has been introduced for use in online monitoring, reliability assessment as well as optimum maintenance and inspection planning of wind turbines. A robust and modular structural health monitoring system, prototypically installed on a 500 kW wind turbine in Germany, however transferable to similar problem definitions, has been presented. The SHM system has been integrated into the LCM framework enabling continuous collection and updating of structural, environmental, and operational data. The functionality and the practicability of the LCM framework have been demonstrated through analyses of the long-term operational efficiency of the wind turbine over a two-year period. The results of the analyses have brought valuable insights into the life-cycle performance and the actual operational efficiency of the monitored wind turbine: In this specific monitoring period, so far, the findings have corroborated that there is no decrease of the operational efficiency and that the monitored wind turbine, in this respect, is in an excellent condition.

K. Smarsly, D. Hartmann & K. H. Law
Acknowledgments
The authors gratefully acknowledge the financial support of the German Research Foundation (DFG) through the grants SM 281/1-1 and HA 1463/20-1. This research was also partially funded by the U.S. National Science Foundation (NSF) under grant CMMI-0824977. Any opinions, findings, conclusions, or recommendations are those of the authors and do not necessarily reflect the views of the German Research Foundation and the U.S. National Science Foundation.
References
[1] “Global Wind Report – Annual market update 2011”, 2012. Report. Brussels, Belgium: Global Wind Energy Council (GWEC).
[2] “2011 Report”, 2012. Report. Bonn: Germany: The World Wind Energy Association (WWEA). [3] Budelmann, H. and Hariri, K., 2006. A structural monitoring system for RC/PC structures. In: Cho, H.-N., et.
al. (eds.). Life-Cycle Cost and Perf. of Civil Infrastr. Systems. London, UK: Taylor & Francis Group. [4] Bergmeister, K., Fingerloos, F. and Wörner, J.-D. (eds.), 2009. Beton-Kalender 2009. Konstruktiver Hochbau.
Aktuelle Massivbaunormen. Berlin, Germany: Ernst & Sohn. [5] Okasha, N. M. and Frangopol, D. M., 2010. Integration of structural health monitoring in a system
performance based life-cycle bridge management framework. Structure and Infrastructure Engineering 2010, pp.1-18, (iFirst).
[6] Frangopol, D. M., Bocchini, P., Decò, A., Kim, S., Kwon, K., Okasha, N. M. and Saydam, D., 2011. Integrated life-cycle framework for maintenance, monitoring, and reliability of naval ship structures. In: Proc. of the Fleet Maintenance & Modernization Symp. (FMMS) 2011. San Diego, CA, USA, August 30, 2011.
[7] Frangopol, D. M. and Messervey, T. B., 2009. Life-cycle cost and performance prediction: Role of structural health monitoring. In: Ang, A. H.-S. and Chen, S.-S. (eds.). Frontier Technologies for Infrastructures Engineering: Structures and Infrastructures Book Series, Vol. 4. Boca Raton, FL, USA: CRC Press.
[8] LaPuma, P. T. and Liberman, E. J., 2006. A Life Cycle Assessment and Economic Analysis of Wind Turbines Using Monte Carlo Simul. In: Proc. of the Int. Life Cycle Assessment & Management 2006. Washington, DC, USA, October 4, 2006.
[9] Besnard, F. and Bertling, L., 2010. An Approach for Condition-Based Maintenance Optimization Applied to Wind Turbine Blades. IEEE Transactions on Sustainable Energy, 1(2), pp.77-83.
[10] D’Souza, N., Gbegbaje-Das, E. and Shonfield, P., 2011. Life Cycle Assessment of Electricity Production from a V112 Turbine Wind Plant. Final Report. Copenhagen, Denmark: PE North West Europe ApS.
[11] Tian, Z. and Jin, T., 2011. Maintenance of wind turbine systems under continuous monitoring. In: Proc. of the Annual Reliability and Maintainability Symposium. Lake Buena Vista, FL, USA, January 24, 2011.
[12] Smarsly, K., Law, K. H. and Hartmann, D., 2012. A Multiagent-Based Collaborative Framework for a Self-Managing Structural Health Monitoring System. Journal of Computing in Civil Engineering, 26(1), pp. 76-89.
[13] Smarsly, K., Law, K. H. and Hartmann, D., 2012. Towards Life-Cycle Management of Wind Turbines based on Structural Health Monitoring. In: Proc. of the First International Conference on Performance-Based Life-Cycle Structural Engineering. Hong Kong, China, December 5, 2012.
[14] Smarsly, K., Hartmann, D. and Law, K. H., 2012. Structural Health Monitoring of Wind Turbines Observed by Autonomous Software Components. In: Proc. of the 14th ICCCBE. Moscow, Russia, June 27, 2012.
[15] Smarsly, K., Law, K. H. and Hartmann, D., 2011. Implementation of a multiagent-based paradigm for decentralized real-time structural health monitoring. In: Proc. of the 2011 ASCE Structures Congress. Las Vegas, NV, USA, April 14, 2011.
[16] Smarsly, K., Law, K. H. and Hartmann, D., 2011. Implementing a Multiagent-Based Self-Managing Structural Health Monitoring System on a Wind Turbine. In: Proc. of the 2011 NSF Engineering Research and Innovation Conference. Atlanta, GA, USA, January 4, 2011.
[17] Hartmann, D., Smarsly, K. and Law, K. H., 2011. Coupling Sensor-Based Structural Health Monitoring with Finite Element Model Updating for Probabilistic Lifetime Estimation of Wind Energy Converter Structures. In: Proc. of the 8th IWSHM 2011. Stanford, CA, USA, September 9, 2011.
[18] Gamma, E, Helm, R., Johnson, R. and Vlissides, J. (1995). Design Patterns: Elements of Reusable Object-Oriented Software. Boston, MA, USA: Addison-Wesley.
[19] “IEC 61400-12-1 ed1.0, Wind turbines – Part 12-1: Power performance measurements of electricity producing wind turbines”, 2005. International Standard. Geneva, Switzerland: International Electrical Commission (IEC).
[20] Aldrich, J., 1995. Correlations Genuine and Spurious in Pearson and Yule. Statist. Science, 10(4), pp.364-376.