intelligent investing, weekly digest · 2 | p a g e how impulse waves progress to exemplify how we...
TRANSCRIPT

1 | P a g e
Executive Summary
In this update we will use standard Fib-extension examples to exemplify why the market could already be in minor
4 and not minute iii. We are now split 50/50 between each count as the possible minute iv retraced a bit too far to
our taste, but hasn’t caused any overlaps so it is still valid.
Regardless, the market is now in a c-wave down from its recent SPX2274 high and ideally we would like to see it
target SPX2227 for a full 5-waves down and to complete the c=a1.618x a relationship. But, that is not necessary as
its final 5th of a 5th wave may have failed on Friday and the c=1.382x a extension was reached. Here we count wave-
a from SPX2278 to SPX2248, and wave b to SPX2274.
In the case of a minor 4 low, we should see minor 5 target SPX2355-2370. In the case of a minute iv low we should
see minute v target SPX2302-2326.
There’s a 2nd alternate options; in which minor 1 topped at SPX2278 and minor 2 is now underway, but we find it
less fitting with the typical and standard wave-extensions the market hits for 1st waves.
Market breadth is now close to “buyable bottom” levels, and its setup is similar to the minor 4 low during major 1
in early April 2016. Our long term charts remain 100% bullish continuing to confirm our long term bullish view of the
market.
How to trade this?
A drop below Friday’s SPX2233 low targets SPX2227-2224. From there we expect the market to move higher for
either minor 5 or minute v to the aforementioned respective targets. A move above SPX2242 is the first sign the low
is in. A move above SPX2247-2253 will confirm.
To differentiate between minute v and minor 5; price needs to move above SPX2326. But, to get to SPX2326 we will
first need to see a move above SPX2302. Thus, taking (partial) profits at that level, or moving stops higher would be
prudent for traders. Long term investors should remain long the market.

2 | P a g e
How impulse waves progress
To exemplify how we determine wave targets and the two main wave counts we carry -minute iii, iv vs minor 3, 4-
please see the standard wave extensions for impulse waves in Figure 1 below. As you see, the difference between
the two standard Fib-extensions lies in wave 1 (0.382 x i vs 0.618x i), wave 3 (1.00x i vs 1.236 x i), wave 4 (0.618x i vs
0.764x i), wave iii (1.382x i vs 1.618x i), wave iv (0.764x i vs 1.000x i) and wave v (1.764x i vs 2.000x i). Note the word
standard, as for example third waves can extend well beyond 1.618x i. But, we can only start with standard as we
can’t foresee the future. Point in case; these two examples show the typical 1.382-1.618x extension targets for a 3rd
wave we so often refer to.
Figure 1. Standard Fib-extensions and retraces for impulse waves; note differences between 1, 2, 3, 4, iii, iv, v
Table 1. Ideal wave tracker table for intermediate waves. Note intermediate i high changed to SPX2187.66
If we add out ideal wave tracker table, re-assess the intermediate i high from SPX2193.81 to SPX2187.66 as detailed
micro-wave analyses suggests the move to SPX2193.81 counts better as 3-waves up, we then see that so far the
S&P500 hit the 1.00x extension to the T, and then retraced back to the 0.764x extension. This suggests the
SPX2277.53 high may have been minor 3 and not minute iii. It also suggest minor 4 is still underway and should
ideally target SPX2204.91, but again that’s based on text-book wave patterns and is absolutely not necessary
(SPX2220 will do to; see next page). We already had this count, but wanted to show in detail why we can count it as
such. This count is shown in Figure 2 on the next page. We are split 50/50 between this count and the minute iii, iv
count we’ve carried to date.
A B

3 | P a g e
Figure 2 shows what we described on the previous page; with the red Fib extensions being the intermediate-wave
extensions. As you can see the (red) 100% and 76.4% extensions were hit to the T, but the 38.2% extension for minor
1 was not. Since 4th waves retrace between 23.6-38.2% of the prior 3rd wave the target zone is however SPX2219-
2240, thus price may still drop lower.
Micro counting the recent move down, see insert, we could be in a 4th wave up within wave 5 down of wave-c down,
and thus one last wave down to SPX2227-2224 (orange 176.4-200.0% extensions) may be on tap before the market
heads to new all-time highs. But, we could already have had –another- failed 5th wave down into the close on Friday
(blue arrow).
The move to new highs will in this case be minor 5 targeting ideally the (red) intermediate iii 138.2% extension at
SPX2355 as per Figure1A. Please note the yellow (major) 123.6% extension at SPX2370. According to Figure 1B, this
major-wave extensions fits well with intermediate wave iii of major 3, as major 3 will then go to SPX2495 after
intermediate iv drops to SPX2280ish (resistance becomes support). But let’s first see if we are in minor 4 indeed.
Figure 2. SPX hourly chart; making the case for minor 3, 4.
Minor 4; all important potential wave 4 targets shown between SPX2240-2205
4 | P a g e
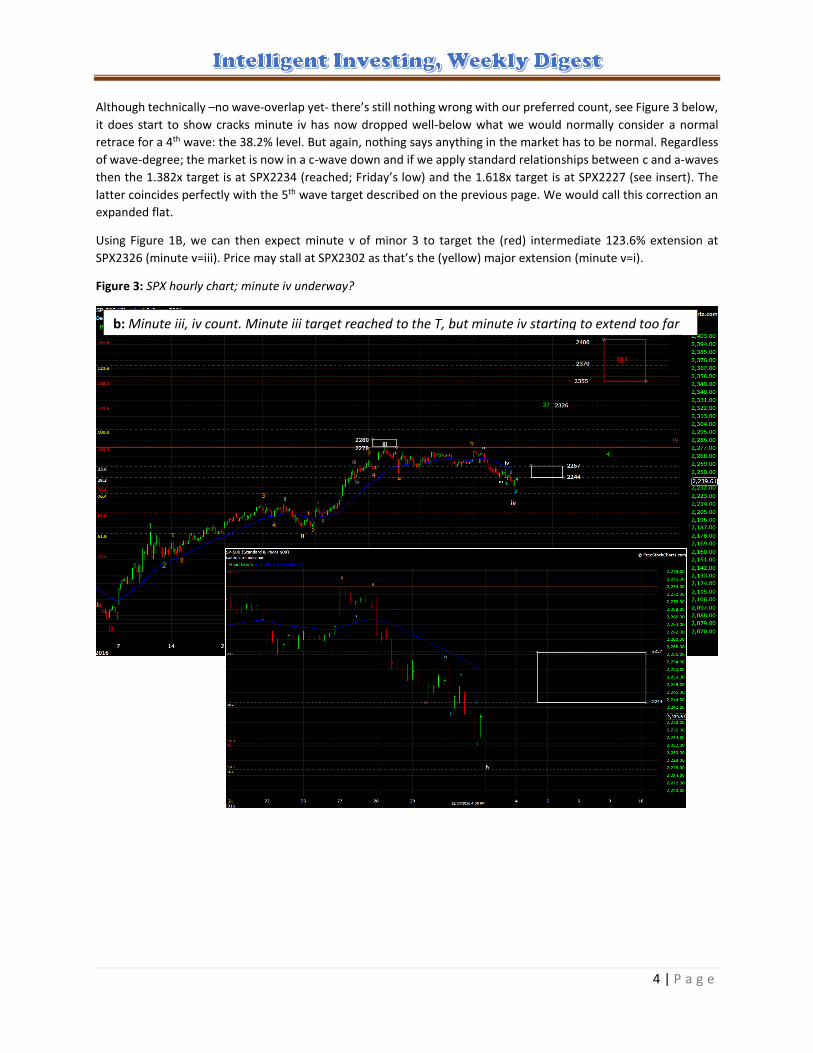
Although technically –no wave-overlap yet- there’s still nothing wrong with our preferred count, see Figure 3 below,
it does start to show cracks minute iv has now dropped well-below what we would normally consider a normal
retrace for a 4th wave: the 38.2% level. But again, nothing says anything in the market has to be normal. Regardless
of wave-degree; the market is now in a c-wave down and if we apply standard relationships between c and a-waves
then the 1.382x target is at SPX2234 (reached; Friday’s low) and the 1.618x target is at SPX2227 (see insert). The
latter coincides perfectly with the 5th wave target described on the previous page. We would call this correction an
expanded flat.
Using Figure 1B, we can then expect minute v of minor 3 to target the (red) intermediate 123.6% extension at
SPX2326 (minute v=iii). Price may stall at SPX2302 as that’s the (yellow) major extension (minute v=i).
Figure 3: SPX hourly chart; minute iv underway?
b: Minute iii, iv count. Minute iii target reached to the T, but minute iv starting to extend too far

5 | P a g e
There’s a 2nd alternate count possible and that’s only minor 1 of intermediate iii topped at SPX2278, and minor 2 is
now underway. At this stage we find it less likely given how well price has been adhering to the Fib-extensions
outlined in Figure 1. First waves rarely -if ever- hit the 100% extension of the prior 1st wave. E.g. intermediate i
(SXP2187.66) of major 3 came very close the the 0.618x extension of major 1 at SPX2183.54, which is in line with
Figure 1.
Regardless, we wanted to show the possibility as the market is all and only about possibilities and also show the
hourly RSI5 and MACD, which are now positively diverging like they did at the intermediate ii low at SPX2083 (see
green lines), and equally oversold.
Figure 4: SPX hourly chart; 2nd alternate count minor 2 underway. Positive divergence building.
6 | P a g e
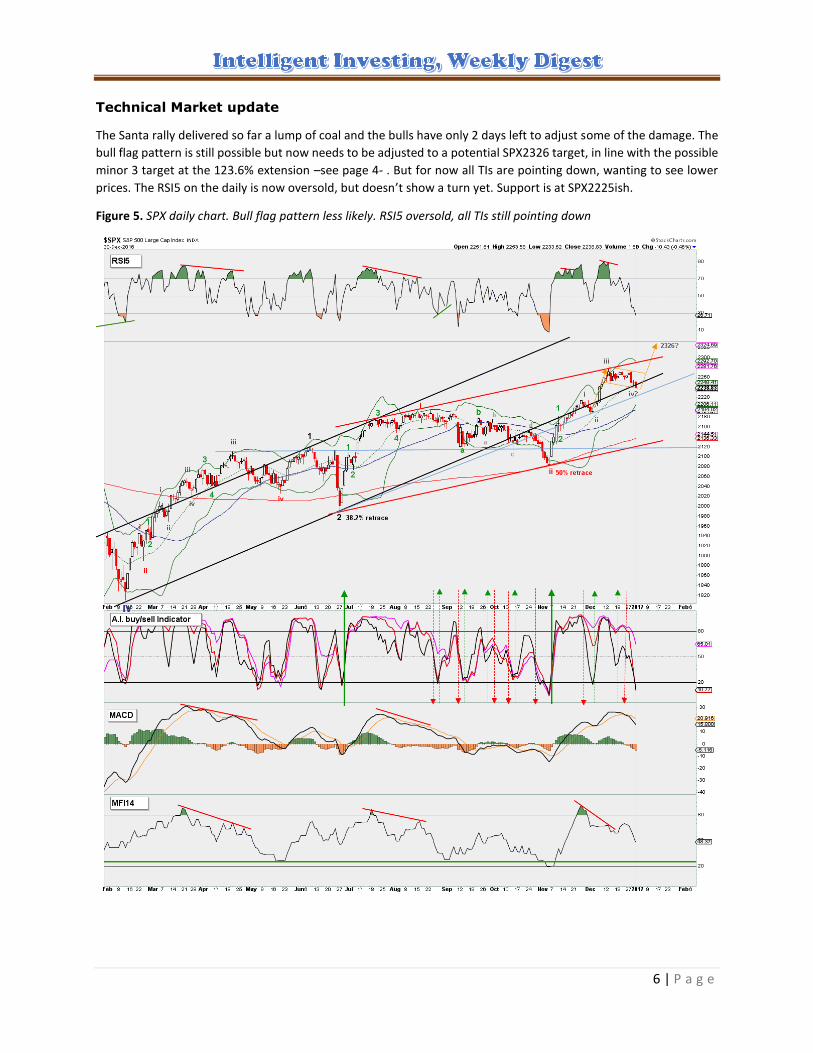
Technical Market update
The Santa rally delivered so far a lump of coal and the bulls have only 2 days left to adjust some of the damage. The
bull flag pattern is still possible but now needs to be adjusted to a potential SPX2326 target, in line with the possible
minor 3 target at the 123.6% extension –see page 4- . But for now all TIs are pointing down, wanting to see lower
prices. The RSI5 on the daily is now oversold, but doesn’t show a turn yet. Support is at SPX2225ish.
Figure 5. SPX daily chart. Bull flag pattern less likely. RSI5 oversold, all TIs still pointing down

7 | P a g e
Our next Fib-turn date is on January 20th, which is in line with the next Bradley Turn Date (BTD) on January 18, as
our December 29/30 turn date fits with the December 28 BTD. Note how price on Friday found support at the
upper long term orange trend line; breakout retest!? If this trend line doesn’t hold, the next support is ay
SPX2220ish (2nd upper blue line)
Figure 6. SPX daily time-Fib chart. December 30th turn date and support hit.

8 | P a g e
Market breadth
The McClellan Oscillator for S&P500 (SPX-MO) dropped hard this week and is almost at our “buyable zone”. It closed
outside its lower Bollinger band. Thus both ingredients are in place for a decent bottom. But like in April last year,
we may see some more whipsawing before we get the launch higher. The SPXSI (summation index of the SPXMO)
gave a sell signal on Friday. Looking back, we also saw a similar sell signal set up in April of last year; when the market
was in minor 4 of intermediate iii (blue circles). This fits our minor 3-4 thesis from page 2 and 3.
Figure 7. SPX-MO close to buyable bottom levels. SPX-SI now in sell. Similar to early-April 2016 (minor 4) low.

9 | P a g e
Miscellaneous
At this point, just use these charts as an FYI to be aware of the larger underlying trends: our long-term Simple Moving
Averages only chart (LT-SMA, for trend followers and investing) continues to be 100% bullish: the long term trend
remains up. This chart remains in line with our overall view of the market and where it will head over the next several
months. Despite the down week, our short term chart (ST-SMA, for traders to swing traders) remains mainly bullish
too, but decreased from 99% to 85% bullish.
Figure 8. LT-SMA chart 100% bullish ST-SMA chart 85% Bullish.
Below is how a 100% bullish chart look likes, everything points up. Price > fastest SMAs > slowest SMAs.
The “Ebola scare” correction
in 2014 didn’t even register
on the LT chart!

10 | P a g e
The CPCE (put/call ratio) – our contrarian indicator at extreme levels- is now as high as it was last week; suggesting
again a bottom may soon be in place; in line with our preferred view and count of the market. In addition, the VIX
is now as high as it was in early December; stalled at its 50d and 200d SMA as it did back then; closed right at its
upper Bollinger Band; and leaving a long upper wig on its daily candle. We would love to see both spike higher for
one more day to signal the low is in, but it is not required.
Figure 9. CPCE (put/call ratio) increasing rapidly. VIX as high as during the early December correction.

11 | P a g e
All Bradley Turn Dates for 2017
January 18 (50/100 Long Terms Power)
January 30 (55/100 Middle Terms Power)
March 20 (100/100 Long Terms Power)
April 3 (31/100 Declinations Power)
April 17 (19/100 Bradley Siderograph Power)
April 19 (59/100 Middle Terms Power)
April 29 (19/100 Bradley Siderograph Power
May 5 (30/100 Declinations Power)
June 9 (61/100 Long Terms Power)
June 21 (100/100 Bradley Siderograph Power)
June 30 (100/100 Declinations Power)
July 4 (100/100 Middle Terms Power)
August 19 (17/100 Bradley Siderograph Power)
September 5 (17/100 Declinations Power)
September 7 (29/100 Bradley Siderograph Power)
October 7 (48/100 Middle Terms Power)
December 3 (23/100 Bradley Siderograph Power)
December 6 (100/100 Long Terms Power)
ALOHA
Soul, Ph.D.
©2017, Intelligent Investing. This copyrighted weekly periodical is published on non-stock market trading weekend
days by Intelligent Investing, and is intended solely for use by designated recipients. No reproduction, retransmission,
or other use of the information or images is authorized. Legitimate news media may quote representative passages,
in context and with full attribution, for the purpose of reporting on our opinions.
Analysis is derived from data believed to be accurate, but such accuracy or completeness cannot be guaranteed. It
should not be assumed that such analysis, past or future, will be profitable or will equal past performance or
guarantee future performance or trends. All trading and investment decisions are the sole responsibility of the reader.
Inclusion of information about managed accounts program positions and other information is not intended as any
type of recommendation, nor solicitation.
For more information, contact intelligent investing at [email protected]. We reserve the right to refuse
service to anyone for any reason.