intelligent monitoring systems and advanced well … library/events/2017/carbon-storage... ·...
TRANSCRIPT

Intelligent Monitoring Systems and Advanced Well Integrity
and MitigationProject Number DE-FE-00026517
Barry FreifeldLawrence Berkeley National Lab
U.S. Department of EnergyNational Energy Technology Laboratory
Mastering the Subsurface Through Technology Innovation, Partnerships and Collaboration:Carbon Storage and Oil and Natural Gas Technologies Review Meeting
August 1-3, 2017

Collaborators• Scott McDonald (Project PI), Steve Ryan, Archer Daniels
Midland Company• Shan Dou, Michael Commer, Jonathan Ajo-Franklin,
Michelle Robertson and Todd Wood, Lawrence Berkeley National Laboratory
• Joern Kaven, United States Geological Survey• Nick Malkewicz, Schlumberger• Sallie Greenberg, Illinois State Geological Survey• Joe Greer, Silixa LLC• David Larrick, Richland Community College
2

3
Presentation Outline• Project Overview
– Technical Status– Accomplishment to Date– Lessons Learned– Synergy Opportunities
• Project Summary– Key Finding– Next Steps

Technical Status
4
Seismic surveys are considered the backbone technique for CO2 storage monitoring programs.Stringing thousands of cables and running thumper trucks every few years can test the limits of good neighbors. Costs are high.Permanent reservoir monitoring offers a way to obtain higher quality information with minimal intrusion into surrounding lands –• DAS provides high spatial and temporal resolution. • Installation can be in horizontal directionally drilled boreholes
beneath bodies of water, existing infrastructure.• Excitation of DAS cables can be achieved through permanent
fixed rotary sources for continuous monitoring.
DAS Seismic
New vs. Conventional Technology

Distributed Acoustic Sensing (DAS)Example from PTRC Aquistore
DAS Baseline 3D-VSP
5
Flow units
Seals
Storage
Casing DeploymentOf Fiber Optic Lines
DAS VSP is becoming accepted technology.

6 © Copyright Silixa Ltd 2016
• Standard optical fibre acts as the
sensor array
– Typical sampling at 10kHz on
10,000m fibre
– Standard gauge length of 10m
– Spatial sampling of 25cm
– DAS measures change in average
elongation per 10m gauge length
per 0.1ms acoustic time sample,
sampled every 0.25 m in distance
Distributed Acoustic Sensing
z, t Parker et al., Distributed Acoustic Sensing – a
new tool for seismic applications, first break (32), February 2014

Surface Orbital Vibrator – VFD Controlled AC Induction Motor
Max Frequency 80 Hz, Force (@80Hz) 10 T-fPhase stability is not maintained. Operate 2.5 hr/d
Force is adjustable
F=mω2r
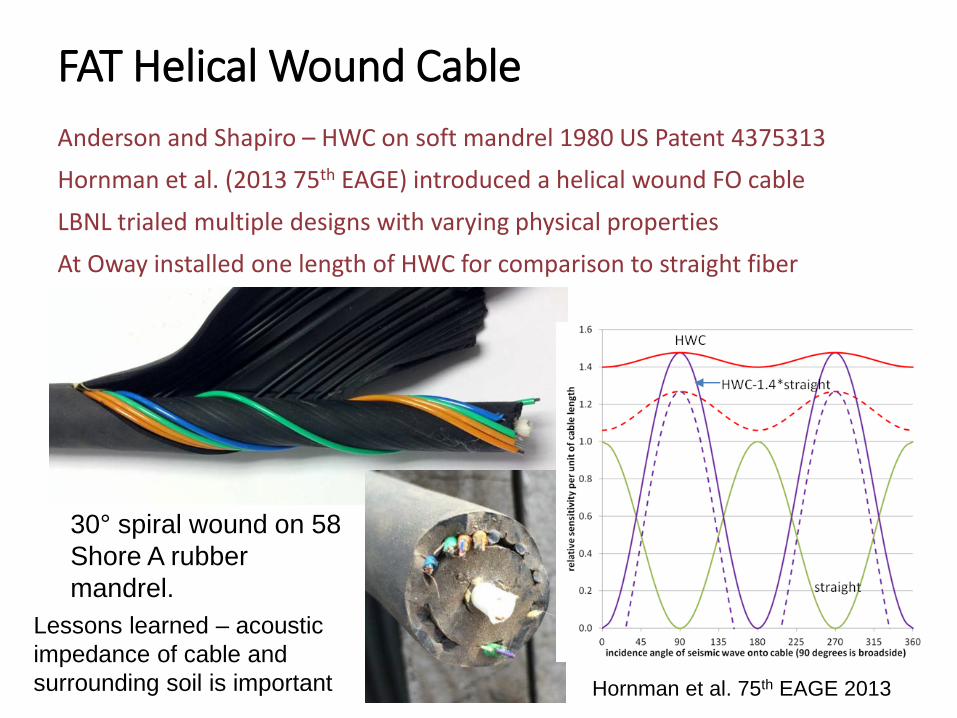
FAT Helical Wound CableAnderson and Shapiro – HWC on soft mandrel 1980 US Patent 4375313 Hornman et al. (2013 75th EAGE) introduced a helical wound FO cable
LBNL trialed multiple designs with varying physical propertiesAt Oway installed one length of HWC for comparison to straight fiber
30° spiral wound on 58 Shore A rubber mandrel.
Lessons learned – acoustic impedance of cable and surrounding soil is important Hornman et al. 75th EAGE 2013

Shale Oil Pilot Monitoring (AMSO)26,000 lb Vibe 70% force
SOV – 2 Single sweep
CO2CRC Otway Project Geophone Data
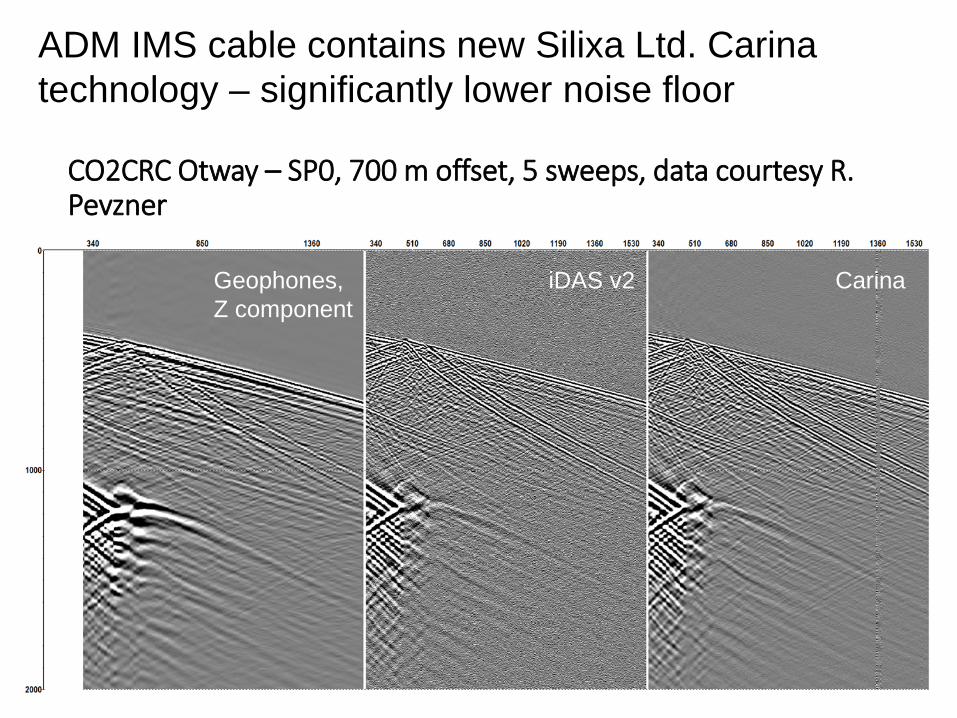
ADM IMS cable contains new Silixa Ltd. Carina technology – significantly lower noise floor
CO2CRC Otway – SP0, 700 m offset, 5 sweeps, data courtesy R. Pevzner
Geophones, Z component
iDAS v2 Carina

Fiber Optic Cable Bored at approximately 20 feet.
Rotary Source
ROTARY SEISMIC SOURCE GENERATOR (NOTE 1)
INJECTION AND MONITORING WELLS (EXISTING)
DAS FIBER OPTIC LINE (BORED TO 20 FT)
NOTE 1: DISTANCES ARE MEASURED FROM CCS#2
VW#22,600 ft.
CCS#2GM#2
SS#34,250 ft.
SS#22,150 ft.
SS#1350 ft.
SS#42,705 ft.
SS#55,475 ft.
Plume Overlay
IMS Fiber Optic and CASSM Layout
11

Accomplishments to Date
• TASK 2.0 IMS Design– Design and specification DAS cable, rotary sources CASSM,
instrumentation, data acquisition and associated subsystems– Development of an IMS architecture and the demonstration
of its operation using synthetic data feeds– Function testing of microseismic monitoring system and real-
time event detection system– Detail real-time DAS cross-correlation and stacking
algorithm and provide analysis of synthetic data evaluation with different levels of synthetic noise
– Final design review, constructability, and HAZOP meeting

Subtask 2.3 Software Design and Development
Workflow of pre-stack cross-equalization based on experience at Otway and SERDP infrastructure project.
Use of Wiener filter to minimize the influences of precipitation on the SOV generated DAS data.
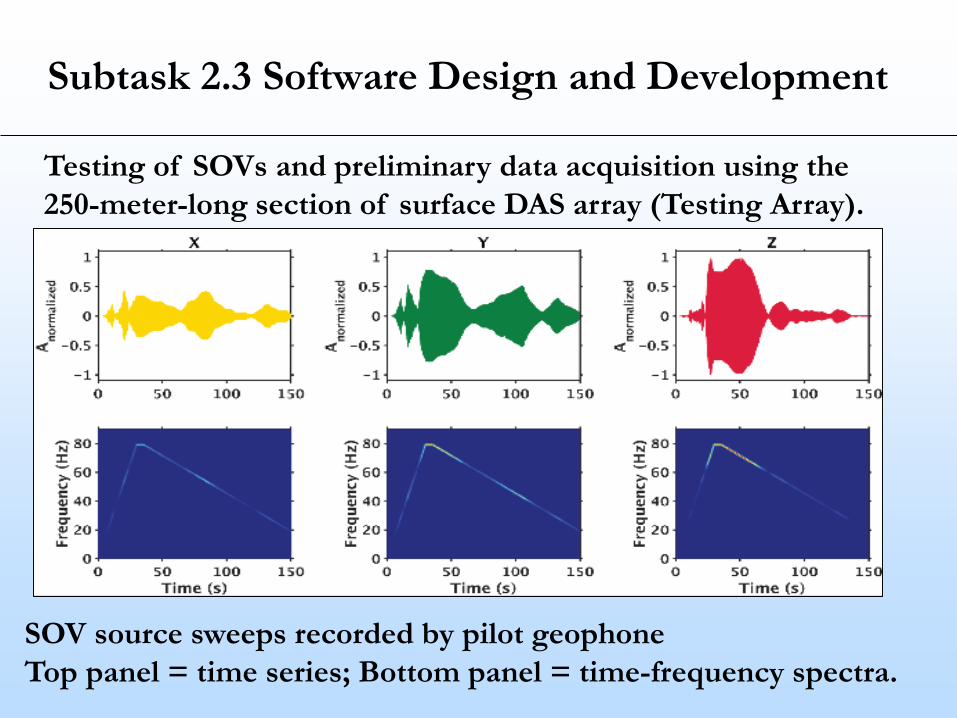
Testing of SOVs and preliminary data acquisition using the 250-meter-long section of surface DAS array (Testing Array).
SOV source sweeps recorded by pilot geophone Top panel = time series; Bottom panel = time-frequency spectra.
Subtask 2.3 Software Design and Development

Hydrological-seismic modeling framework
Close-link software merge of both simulation modules allows for full exploitation of efficient parallel computing in both simulators
Subtask 2.3 Software Design and Development

Common shot gather acquired on the Test DAS array.
Common shot gather acquired on the test DAS array. (a) Raw shot gather without fk dip filtering. (b) Data after fkdip filtering. (c) VP profile extracted from sonic well log of CCS2. Dash lines in (b) denote travel time predictions of key reflectors. Dash lines in (c) denote the depths of the key reflectors. Tertiary, secondary, and primary = tertiary, secondary, and primary seals; pre Mt. Simon = bottom of the Mt. Simon reservoir.
Subtask 2.3 Software Design and Development

SOV4 sweep recorded by the northeast DAS surface array.
Subtask 2.3 Software Design and Development
SOV sweep recorded by the permanent N/E DAS surface array.
SOV5 sweep recorded by the northeast DAS surface array.

Subtask 2.4 Design Passive Microseismic Monitoring systemData filter improvements for the deep borehole seismic network array increase the detection of microseismic events by removing frequencies of repetitive noise.
Spectra for filtered data Spectra for raw data
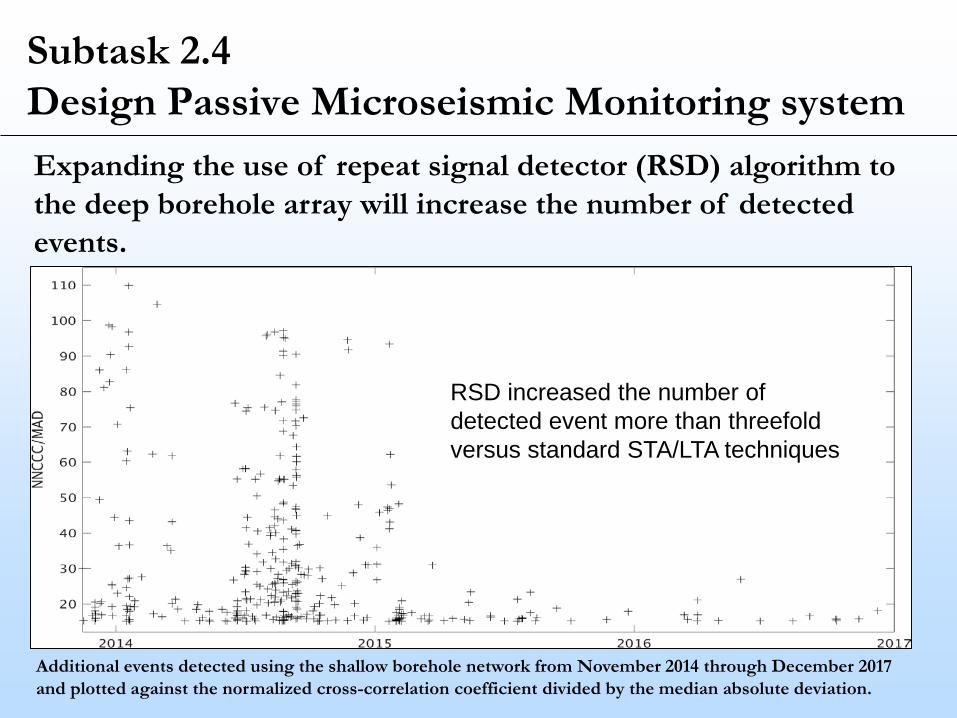
Subtask 2.4 Design Passive Microseismic Monitoring systemExpanding the use of repeat signal detector (RSD) algorithm to the deep borehole array will increase the number of detected events.
Additional events detected using the shallow borehole network from November 2014 through December 2017 and plotted against the normalized cross-correlation coefficient divided by the median absolute deviation.
RSD increased the number of detected event more than threefold versus standard STA/LTA techniques

Accomplishments to Date
• TASK 3.0 IMS Installation– Develop final construction plan for IMS equipment– Installation of data acquisition and processing
equipment– Installation of DAS surface cable and rotary sources
CASSM– Installation of instrumentation, electrical, and
communications subsystems– Installation of control, monitoring, and data acquisition
software

Subtask 3.2 Installation of IMS data acquisition and processing equipment
iDAS Units
IMS Server
SOV#2 & 3Ethernet Switch
iDAS Unit #1
iDAS Unit #2
Setup of the IMS Server & iDAS units in the CCS#2 building and SOV#2 & 3’s Ethernet switch inside the VW#2 building.
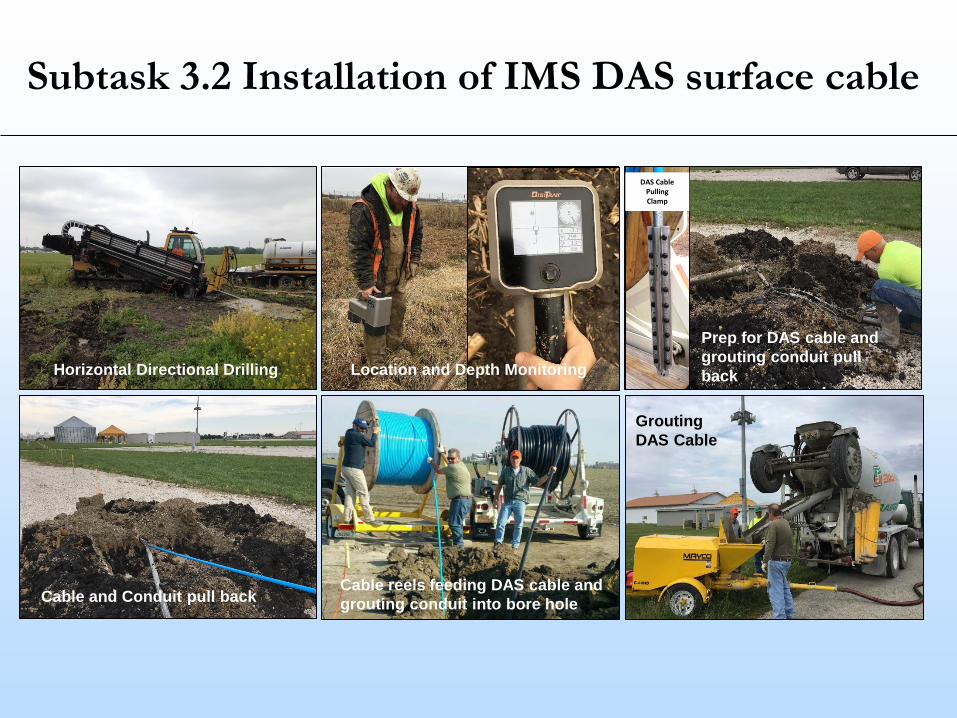
Subtask 3.2 Installation of IMS DAS surface cable
DAS Cable Pulling Clamp
Horizontal Directional Drilling Location and Depth Monitoring
Prep for DAS cable and grouting conduit pull back
Cable and Conduit pull back
Grouting DAS Cable
Cable reels feeding DAS cable and grouting conduit into bore hole

Subtask 3.2 Installation of rotary sources CASSM
Setup of the IMS Server & iDAS units in the CCS#2 building and SOV#2 & 3’s Ethernet switch inside the VW#2 building.
Foundation excavation Structural SOV Anchor Assembly
Drilling boreholes for the SOV Geophones Final installation showing SOV, SOV
Control and DAS cable Splice Panels
SOV Installation

Subtask 3.2 DAS Cable Fusion Splicing & Acquisition of Geospatial Coordinates
Over 60 fusion splices required for installation of DAS array and networking of SOV panels.Over 700 GPS coordinates with DAS cable depth used to develop of the geospatial model.
CCS#2 Splice PanelSOV#2 Splice Panel

Accomplishments to Date
• TASK 4.0 IMS Commissioning and Operation– Commissioning of IMS equipment and related controls– System commissioning began July 1, 2017 and will continue
through Q4 FY 2017.

Lessons Learned– Data Transfer and Network Latency
• The project faces challenges in transferring terabyte data sets from the ADM network to the LBNL server at speeds that allow the interactive analysis needed to troubleshoot and optimize the system.
• The project team has developed a plan to take the IMS Server off the ADM network and use a separate ISP connection to transfer data to the LBNL server.
– HDD installation and grouting requires coordination with the drilling contractor. Most contractors were unfamiliar with our requirements and procedures needed to be developed. DAS cable is sufficiently different from installation utility conduit installation that best practices need to be developed for DAS.
26

Synergy Opportunities
27
– Initial trialing of DAS helical wound cables supported by Otway Project
– Further testing of novel Constellation optical fiber
– Development of surface cable DAS data processing flows and HDD. Linkages to the CO2CRC Otway Project Stage 3, CMC CaMI, and PTRC Aquistore

Project Summary
– Key Findings.• We are making steady progress on the installation and operation of
the DAS-SOV network. Our experience and lessons learned are invaluable for developing future HDD DAS projects
– Next Steps• Operation of IMS equipment and related controls• Optimization of system with respect to data quality and processing
speed• Comparison of real time IMS data with state of the art detailed
models• DAS data feed integration into the passive seismic monitoring
system and system optimization
28

Appendix
29
30
Benefit to the Program
• Carbon Storage Program Goal Support:• Goal (1) Develop and validate technologies to ensure 99
percent storage permanence by reducing leakage risk through early detection mitigation.
• Goal (2) Develop technologies to improve reservoir storage efficiency while ensuring containment effectiveness by advancing monitoring systems to control and optimize CO2 injection operations.
• Goal (4) Contributing to the Best Practice Manuals for monitoring, verification, and accounting (MVA) with regard to IMS.

31
Benefit to the Program
• Reduce overall storage cost.• Increase monitoring sensitivity. • Increase monitoring reliability by using an
integrated system. • Optimize operation and maintenance activities.• Reduce project risk during and after the injection
of CO2.
32
Project Overview Goals and Objectives
• Develop an integrated IMS architecture that utilizes a permanent seismic monitoring network, combines the real-time geophysical and process data with reservoir flow and geomechanical models.
• Create a comprehensive monitoring, visualization, and control system that delivers critical information for process surveillance and optimization specific to the geologic storage site.
• Use real-time model calibration to provide reservoir condition forecasts allowing site optimization.

33
Project Overview Specific Project Objectives
1. Design an IMS using a real-time multi-technology architecture that fully integrates and enhances the site’s existing monitoring infrastructure that includes multi-level 3D seismic arrays, distributed acoustic sensing (DAS), multi-level pressure/temperature sensors, distributed temperature sensing (DTS), borehole seismometers, and surface seismic stations
2. Augment the sites monitoring capabilities by installing several rotary seismic sources and integrating a network of surface DAS with the existing seismic system to create a continuous active source seismic monitoring (CASSM) array covering over two square kilometers and extending to a depth of 6,300 feet.
3. Develop terabyte level data processing solutions for real time monitoring of reservoir conditions and time lapse imaging of the CO2 plume.

34
Project Overview Specific Project Objectives
4. Commission and operate the monitoring system in an industrial setting under actual conditions.
5. Validate and document the economic and environmental benefits of the monitoring system.
6. Update the monitoring verification and accounting best practices guide to include IMS and CASSM monitoring systems.
7. Incorporate DAS channels in routine location of microseismicity using the combination of borehole and surface seismic stations.
8. Develop near real-time data processing techniques to overcome passive seismic monitoring limitations of low signal-to-noise ratio on DAS array.
35
IMS Organization Chart• ADM has overall project responsibility and is accountable for:
– Task 1 Project management and planning – Task 3 IMS Installation – Task 4 IMS Commissioning and Operation
• LBNL’s team will be accountable for: – Task 2 IMS Design– Subtask 3.3 IMS DAS Surface Cable and Rotary Sources CASSM– Subtask 3.4 IMS Control, Monitoring, and Data Acquisition Software– Subtask 4.2 Function test of IMS DAS Surface Cable and Rotary Sources
CASSM – Subtask 4.5 Validate IMS real-time reduced order models
• USGS’s team will be accountable for: – Subtask 2.4 Design of Passive Microseismic Monitoring System – Subtask 4.6 Operation Passive Microseismic Monitoring System

36
IMS Organization Chart• Silixa’s team will be accountable for:
– Subtask 2.1 IMS Data Acquisition and Processing Equipment, – Subtask 3.2 IMS Data Acquisition and Processing Equipment, – Subtask 4.1 IMS Instrumentation, Controls, and Data Network,
• RCC’s team will be accountable for: – Subtask 1.4 Project Outreach and Education.
• ISGS's team will participate in: – Subtask 1.4 Project Outreach and Education, – Subtask 2.4 Design of Passive Microseismicity Monitoring System – Subtask 4.6 Operating Passive Microseismicity Monitoring
System
• SLB’s team will participate in: – Subtask 2.1 Data Acquisition and Processing Equipment– Subtask 4.5 Validate IMS real-time reduced order models
37
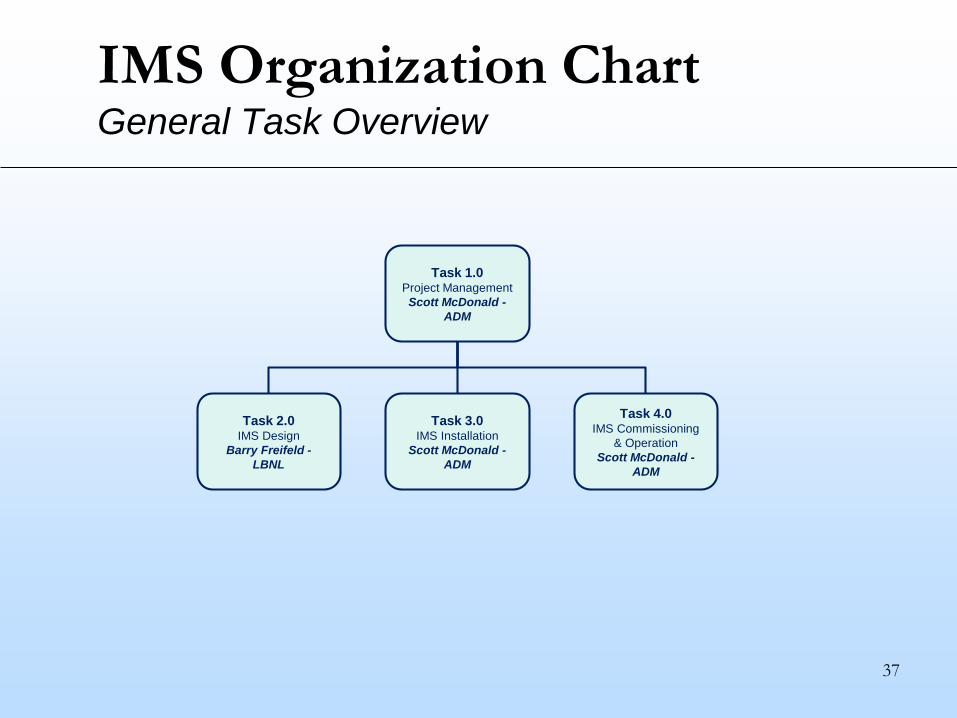
IMS Organization ChartGeneral Task Overview
Task 1.0Project ManagementScott McDonald -
ADM
Task 2.0IMS Design
Barry Freifeld -LBNL
Task 3.0IMS Installation
Scott McDonald -ADM
Task 4.0IMS Commissioning
& OperationScott McDonald -
ADM

38
IMS Organization ChartTask 1.0 - Project Management
Task 1.0Project Management
Scott McDonald - ADM
Subtask 1.1Project Management
PlanScott McDonald - ADM
Subtask 1.2Reporting
Salil Arora - ADM
Subtask 1.3Project Management
Scott McDonald- ADM
Subtask 1.4Outreach & EducationDavid Larrick- RCC

39
Task 2.0IMS Design
Barry Freifeld - LBNL
Subtask 2.1Data Acquisition and
Processing EquipmentBarry Freifeld - LBNL
Subtask 2.2DAS Surface Cable and Rotary Sources CASSMBarry Freifeld - LBNL
Subtask 2.3Software Design &
DevelopmentMichael Commer -
LBNL
Subtask 2.4Passive Microseismicity
Monitoring SystemOle Kaven - USGS
Task 2.5Final Design Review
Scott McDonald - ADM
Subtask 2.6Equipment
ProcurementSteve Ryan - ADM
Subtask 2.7Construction &
Environmental PermitsScott McDonald- ADM
LBNL – Scope & Equip SpecificationsSLB - Subsurface Equipment IntegrationSLXA – DAS EquipADM – Networking Architecture & Equipment Integration
LBNL - CASSM & DAS SpecificationSLXA - DAS IntegrationADM - Equip layout & infrastructure design
LBNL – Software DevelopmentSLXA - DAS IntegrationADM - User Interface & SCADA Integration
USGS – Software Development & Data ProcessingSLXA - DAS Integration
LBNL – Final ReviewerSLB – Final ReviewerSLXA – Final ReviewerUSGS– Final ReviewerADM– Final Reviewer
IMS Organization ChartTask 2.0 - IMS Design

Task 3.0IMS Installation
Scott McDonald - ADM
Subtask 3.1Construction Plan for
EquipmentSteve Ryan - ADM
Subtask 3.2Data Acquisition and
Processing EquipmentChris Matlock – ADM
Subtask 3.3DAS Surface Cable and Rotary Sources CASSMScott McDonald - ADMBarry Freifeld – LBNL
Subtask 3.4Control, Monitoring, and
Data Acquisition Software
Barry Freifeld – LBNL
IMS Organization ChartTask 3.0 - IMS Installation

Task 4.0IMS Operation
Scott McDonald - ADM
Subtask 4.1Instrumentation,
Controls, and Data Network
Chris Matlock - ADM
Subtask 4.2DAS Surface Cable and Rotary Sources CASSMBarry Freifeld - LBNL
Subtask 4.3Utility Systems
Steve Ryan – ADM
Subtask 4.4Operate IMS System
Scott McDonald - ADM
Subtask 4.5Validate IMS real-time reduced order modelsBarry Freifeld – LBNL
Subtask 4.6Passive Microseismicity
MonitoringOle Kaven – USGS
IMS Organization ChartTask 4.0 - IMS Operation

42
IMS Gantt Chart
On schedule to meet project milestones

Bibliography
43
• No publications yet. AGU abstract submitted for Fall 2017 Conference.