intelligent well technology- dealing with gas coning problems in
TRANSCRIPT
International Journal of Applied Science and Technology Vol. 4, No. 5; October 2014
121
Intelligent well Technology- Dealing with Gas Coning Problems in Production wells
Kwame Sarkodie
S.A. Afari
W.N. Aggrey
Petroleum Engineering Programme
Department of Chemical Engineering
College of Engineering
Kwame Nkrumah University of Science and Technology
Kumasi, Ghana
Abstract
This project made use of a reservoir simulator to model an Intelligent Well (IW)) to deal with gas coning problem
by placing Inflow Control Valves (ICV) at some particular segments based on gas-oil ratio of the segments in the
well to monitor and control fluid flow. The application of two (2) optimized reactive control strategy (RCS) in
dealing with the gas coning problem was studied. It was found out that IWT can deal with gas coning problems
by delaying gas encroachment, improved oil production efficiency and thus providing better returns on investment
in most reservoir conditions. The effect of IWT on a tight reservoir case for horizontal well type proved
insignificant in terms of productivity and profitability and as such application of IWT could be ignored but in the
case of multilateral well with longer well length, the effect is felt.
Keywords: intelligent well technology (IWT), Gas conning, reactive control strategy (RCS), Conventional well
(CW)
1.0. Introduction
Oil is usually the expected product after millions of dollars and endless man-hours are spent on developing a
reservoir. However, engineers are faced with the problem of dealing with other fluids that make their way to the
well with the oil to be produced at the surface.
The encroachment of gas from the gas cap coupled with the production of oil, water and gas is one of the major
problems encountered in reservoir engineering. The upward movement of water and/or the down movement of
gas into the perforation zone of a producing well are normally referred to as coning. [Ahmed Tarek, 1941]. This is
as a result of pressure reduction around the perforation zone and uneven perforations and the existence of a strong
gas cap or water aquifer.
To totally avoid coning, the critical flow rate of the reservoir must not be exceeded. This rate happens to be too
small and totally uneconomical to produce a reservoir at such a low rate. This makes coning inevitable in the
production life of a reservoir and hence, the best way to deal with coning problems is for reservoir engineers to try
their utmost best to delay the worrying phenomenon. Some of the proven ways of controlling the coning
phenomenon are by; decreasing the well production rate, preferential usage of horizontal wells to vertical wells to
produce the formation, recompleting the well at a different elevation to increase the distance between the gas-oil
or water-oil contact and the perforated interval, selectively partially penetrating the well at the bottom of the pay
zone and close to the center of the pay zone in the case of simultaneous water or gas coning and ultimately, the
application of intelligent well technology of which this research paper will through more light on.
Intelligent wells, sometimes referred to as ‘smart wells’ are basically wells which is fitted with special completion
equipment such as downhole sensors and instrumentations that measure and monitor well conditions and reservoir
parameters such as flow rate, fluid composition, bottomhole temperature and pressure. Intelligent wells also have
downhole control valves to regulate, seal portions of the wellbore and optimize the movement of hydrocarbons
into the well to enhance oil recovery. [Heriot Watt University, Production Technology, 2005].

© Center for Promoting Ideas, USA www.ijastnet.com
122
1.1. Objectives
The main goal was to implement an intelligent well system in a gas cap reservoir and choose an appropriate
control strategy to control the gas coning problems and also maximize oil production. With this main goal in
mind, other objectives were considered which fell in line with the main goal.
One of the objectives was to employ an open-close ICV in the configuration of the IWT to deal with the gas
coning problems. This limited the choice of ICV to be used which form an integral part of the IWT. The open-
close ICV allows for a firm control on the happening in the well and hence allow for a better control of the gas
coning problem
Formulating a proper reactive control strategy to deal with the gas coning problem was the second objective.
Reactive control strategy was chosen ahead of proactive method because of the various uncertainties surrounding
the production of oil. To properly control the coning problem, the right algorithm must be discovered to have
maximum effect in controlling the problem.
The robustness of our reservoir under varying reservoir conditions was determined as the third objective. This was
to determine how the formulated RCS would perform under uncertainties.
Finally, the profitability of IWT as compared to CW was determined by the use of Net Present Value calculations.
2.0. Reservoir Modelling
The tool of choice for the reservoir simulation was a black oil simulator. We simulated the performance of a
three-phase (water, oil, gas) reservoir. Our model used, was a simple conceptual block with one producer. There
are 30 cells in the x direction, 30 cells in the y direction and 10 cells in the z direction. The model therefore, has a
total of 9000 cells. The reservoir has a net thickness of 175ft. The top of the reservoir is at 6000ft with the gas oil
contact and the oil water contact at 6017.5ft and 6175ft respectively. The datum depth is 6017.5ft and is at a
pressure of 4500psia. The reservoir is an almost homogenous system with 30% porosity and permeability in the x,
y and z-directions as 100md, 100md and 10md respectively. The reservoir employs a combination drive system
with gas cap drive the most dominant. Depletion drive and edge water drive are the other drive mechanisms
present.
Fig 1: Reservoir Model
Two (2) different downhole completion configurations were considered and studied in this research. These consist
of a convention completion with an uncontrolled base case and an intelligent completion.
Also, two (2) different well trajectories were considered. These included; horizontal well configuration which had
a total length of 2250ft, divided into sixteen (16) segments and a multilateral well trajectory with a total length of
4350ft and thirty (30) segments to establish maximum contact with the reservoir. The horizontal well was made to
flow a liquid flow rate limit of 3000STB/D with the multilateral well flowing at 6000STB/D.

International Journal of Applied Science and Technology Vol. 4, No. 5; October 2014
123
2.1. Reactive Control Strategies
The conventional well was made smart by dividing the completion intervals into segments and installing binary
(open/close) ICVs at selected segments to control both gas and water. Two (2) reactive control strategies were
employed to help achieve smartness of our wells.
The first reactive control strategy (RCS) which we called ‘Algorithm 1’, was designed in such a way that, after
every timestep of forty five (45) days, the ICV having a SGOR above a fixed figure (selected based on the well
configuration) is shut off. This also applies to the SWCT for zones of excessive water production. This Algorithm
is further explained in figure 4. This algorithm was achieved by the ACTIONS keyword in the SCHEDULE
section of the data file.
Fig 4: Schematic of Reactive Control Strategy (Algorithm 1)
The second RCS had ICVs placed at both water and gas segments as in the Algorithm 1. This strategy was
achieved by shutting off all ICVs with the highest SGOR and SWCT for both the gas and water segments
respectively after every timestep of forty five days. Modeling this was achieved by the use of ACTIONX keyword
in the SCHEDULE section of eclipse data file. This RCS was called ALGORITHM 2. This Algorithm is further
explained in figure 5.
© Center for Promoting Ideas, USA www.ijastnet.com
124
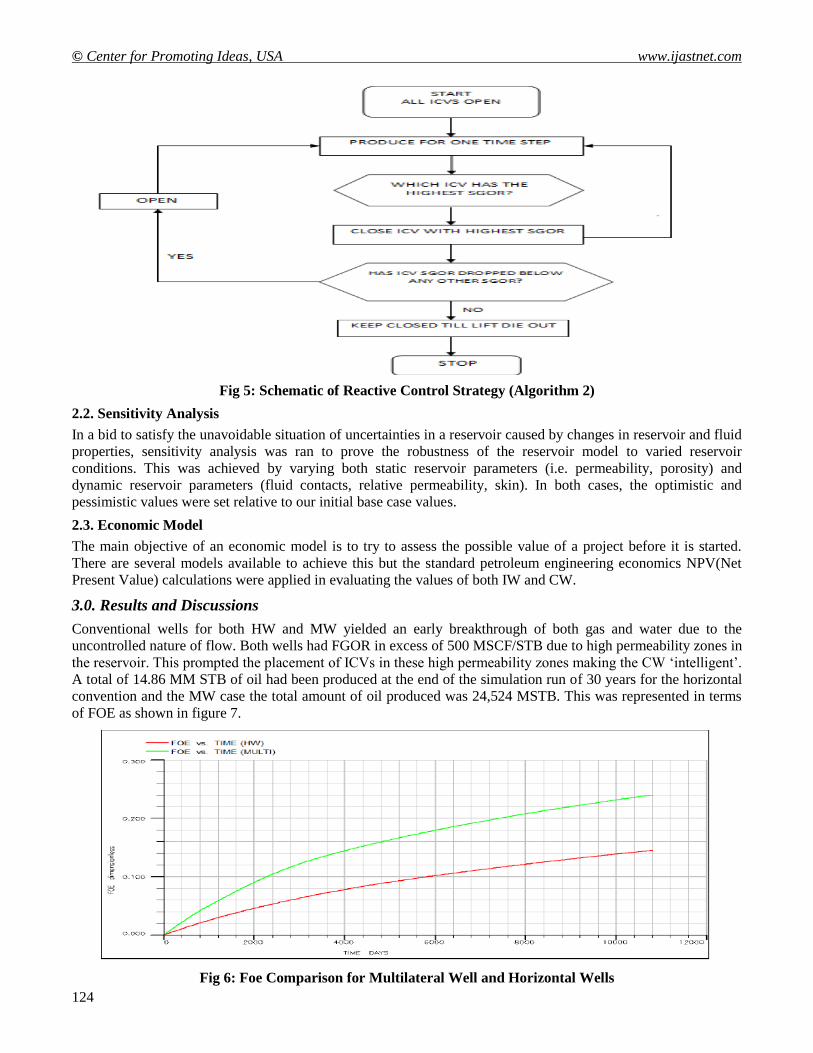
Fig 5: Schematic of Reactive Control Strategy (Algorithm 2)
2.2. Sensitivity Analysis
In a bid to satisfy the unavoidable situation of uncertainties in a reservoir caused by changes in reservoir and fluid
properties, sensitivity analysis was ran to prove the robustness of the reservoir model to varied reservoir
conditions. This was achieved by varying both static reservoir parameters (i.e. permeability, porosity) and
dynamic reservoir parameters (fluid contacts, relative permeability, skin). In both cases, the optimistic and
pessimistic values were set relative to our initial base case values.
2.3. Economic Model
The main objective of an economic model is to try to assess the possible value of a project before it is started.
There are several models available to achieve this but the standard petroleum engineering economics NPV(Net
Present Value) calculations were applied in evaluating the values of both IW and CW.
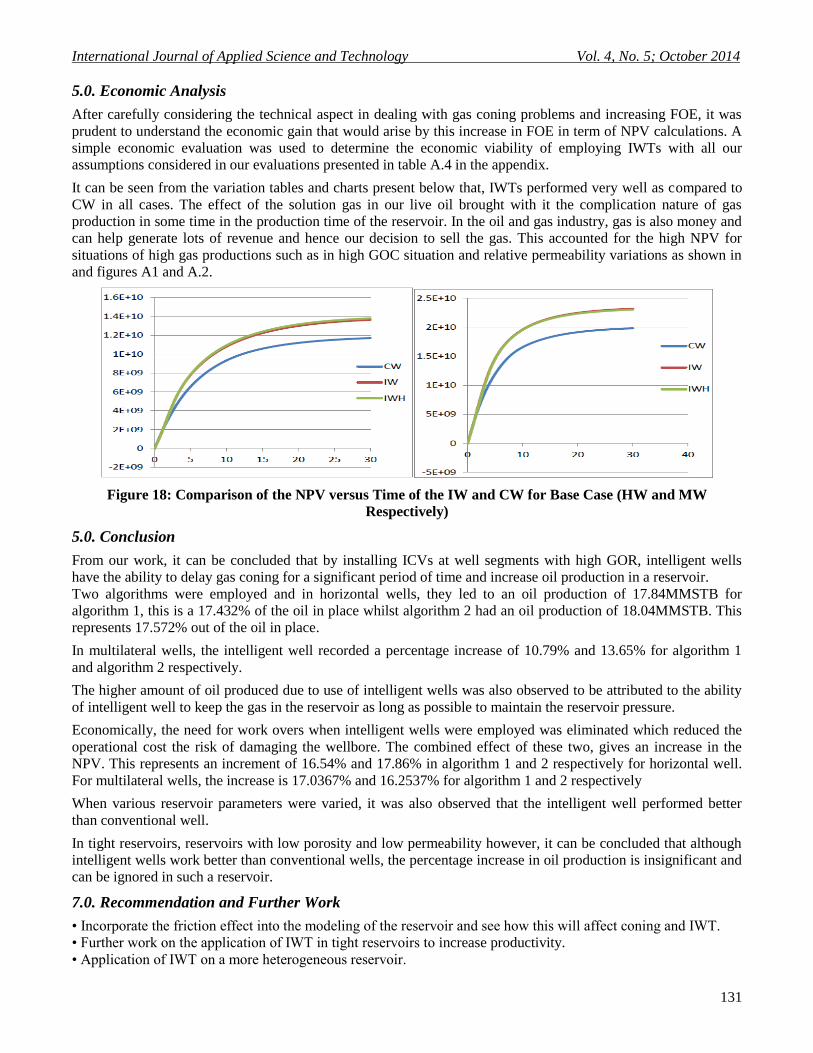
3.0. Results and Discussions
Conventional wells for both HW and MW yielded an early breakthrough of both gas and water due to the
uncontrolled nature of flow. Both wells had FGOR in excess of 500 MSCF/STB due to high permeability zones in
the reservoir. This prompted the placement of ICVs in these high permeability zones making the CW ‘intelligent’.
A total of 14.86 MM STB of oil had been produced at the end of the simulation run of 30 years for the horizontal
convention and the MW case the total amount of oil produced was 24,524 MSTB. This was represented in terms
of FOE as shown in figure 7.
Fig 6: Foe Comparison for Multilateral Well and Horizontal Wells

International Journal of Applied Science and Technology Vol. 4, No. 5; October 2014
125
The occurrence of gas coning is very evident in bore case when comparing the FGPTs. In this case, we compare a
situation with no gas cap as compared to a situation with a gas cap. It can be seen that the excess gas production
contributed immensely to the gas coning problem since this particular gas is needed in the reservoir to serve as a
drive mechanism and enhance FOE.
The main aim of the IWT will be to keep this gas in the reservoir as long as possible by dropping the bottom hole
pressure and equalizing this pressure as much as possible. This will cause a reduction in the FGOR and hence
increase the FOE and the WPI of the IW over the CW for both horizontal and multilateral well cases.
FIG 7: FGPT for Gas Cap and No Gas Cap Situation Indication Gas Coning
After incorporating ICVs into the well configuration at particular segments, i.e. 6, 7 & 14 for HW and 7 & 8 for
P1 and 14 & 15 for MW, it was realized that the IW recorded a decrease in the average FGOR from 604.6
MSCF/STB to 592.3MSCF/STB and 591.1 MSCF/STB for algorithm I and 2 respectively in the horizontal well
case. This meant that, for every barrel of oil produced, the quantity of gas contained in the oil has been reduced
and this is attributed to the reduction in gas production from the gas cap. This was as a result of the action of
open-close ICV installed in the well completion which had a total control on the pressure distribution in the well.
Fig 8: Drop in FGOR Leading to Significant Increase in FOE
4.0. Parameter Variations
In order to ascertain that IWs can deal with gas coning problems, varied reservoir conditions must be analysis.
Pessimistic and optimistic variations, representing worst and best situations respectively, were done for each
reservoir parameter. Sensitivity analysis was performed for both horizontal and multilateral well configurations.
(Table A.2 and A.3)

© Center for Promoting Ideas, USA www.ijastnet.com
126
4.1. Static Parameters
There is a relationship between flow rate and permeability by Darcy’s equation as shown below
Increasing the permeability will result in an increase in the flow rate which will in turn increase the Field Oil
Efficiency (FOE) for both optimistic and pessimistic case in both well trajectories and can be seen in figure 9.
In tight reservoirs i.e. low permeability reservoirs, as shown in the graph below, the effect of intelligent wells is
insignificant and can therefore be ignored but in high permeability reservoirs, the effect of intelligent well is
remarkable. The intelligent well presents a higher productivity than the conventional well. The evidence of
9.937% and 11.36% change in FOE in the table below proves that intelligent well is recommendable in optimistic
cases than in pessimistic cases of 1.716% and 4.34%.
Fig 9: Foes for Optimistic and Pessimistic Conditions Respectively-Horizontal Well (Iw & Cw)
To justify the results above, as can be seen in equation 4.1, an increase in permeability and enough pressure
drawdown will cause an increase in production rate and hence increase FOE. Therefore, optimistic case which had
an increase in permeability showed a better FOE in all cases as compared to the pessimistic case.
In the situation of the multilateral well, IWT performed better in both pessimistic and optimistic cases due to
proper control strategy implemented in controlling and delaying gas coning problems. It was observed that, even
though the CW for the optimistic case performed better than the pessimistic due to the variation in permeability
and in relation to equation 4.1, the IW showed otherwise. This was attributed to a higher pressure drawdown
created in the pessimistic case to cater for the fall in permeability and even cause a higher production rate and
hence higher FOE. This showed the effectiveness the RCS put in place.
4.2. Dynamic Parameters
4.2.1. Relative Permeability
We employ two graphs; figure A & B, to show how relative permeability is being varied with saturation.
Fig 10a: Relative Permeability Curve for Base Case Fig 10b: Relative Permeability Curve fnor Worse Case
Mobility ratios were calculated for the base case scenario and worst case scenario. The base scenario gave a
mobility ratio of 28.4 and the worst case gave a mobility ratio of 113.617, indicating that oil had a good mobility
for our base case scenario and low mobility for the worst case scenario. The performance of the well in terms of
FOE for both CW and IW by varying relative permeability is shown below in figures 11.

International Journal of Applied Science and Technology Vol. 4, No. 5; October 2014
127
Fig 11: Foe for HW after Relative Permeability Variation-Worst Case (CW & IW)
Fig 4.12: FGPT vs. Time for HW after Relative Permeability Variations. (CW)
Relating the results from figure 12 to table 1, it is observed that even in the worst case scenario where more gas is
produced in the CW and hence causing a reduction in the FOE, the ICV’s employed ensured that the gas stayed in
the reservoir and becomes a driving force causing more oil to be produced. This caused the IW to perform better
for the worst case as compared to the best case. (Figure 11 and Table 1) Conventional wells on the other hand
have no ICV’s to contain the gas. Gas is therefore, produced due to its high mobility causing a lower FOE results.
FOE graph for base case relative permeability variation can be seen in figure 11.
Table 1: FOEs for HW after Relative Permeability Variations (CW & IW)

© Center for Promoting Ideas, USA www.ijastnet.com
128
From th above analysis, it was seen that the open-close strategy of the ICVs together with the RCS implemented,
gas coning was greatly control and FOE was greatly improved which makes the application of IWT in very high
gas mobilty zone more feasible.
The effect of implementing IWT in a multilateral well was nothing different as compared to the horizontal well
trajectory and results are shown below.
4.2.2. Skin
The presence of formation damage was examined by relating it to pressure drawdown and hence to productivity
index (PI) as by the following equations.
This shows that skin generates an addition pressure drawdown which is affect productivity of the wells as shown
in the equation below. Low PI is undesirably since it causes a reduction in FOE.
Fig 13: WBHP and WPI vs. TIME Respectively
The presence of skin comes with an additional undesired pressure drop in the bottomhole which results in a larger
drawdown but this drawdown restricts flow. The well will thus, flow at a lower rate due to the restrictions caused
by the presence of skin and cause a reduction in well productivity index and hence the FOE of the well. This
phenomenon was exhibited by the variation of skin in the reservoir. It was observed that, even in the presence of
skin, IWT did its work in controlling the occurrence of gas coning by creating a much desired pressure which
increases the flowrate and hence causes an increase in the WPI and FOPT as can be figures 13 and 14.

International Journal of Applied Science and Technology Vol. 4, No. 5; October 2014
129
4.2.3. Gas-Oil Contact (GOC)
The major source of gas coning is the gas cap, which is varied by varying the GOC. In our quest to analyze the
effect of our gas cap on our FOE, two other contact depths were examined. (i.e. at 6000ft and 6035ft).
Fig 15: FGPT for different Gas-Oil Contact Depths
From the graph above, it can be seen that increasing the GOC caused an increased in the FGPT and vice versa.
(Table 2). This is because apart from the solution gas, the gas cap is a major source of gas production and hence
increasing the size of the gas cap will increase amount of production and cause an early gas breakthrough.

© Center for Promoting Ideas, USA www.ijastnet.com
130
Table 2: FGPT for Different Gas-Oil Contact Depths
Fig 16: FGPT for Different Gas-Oil Contact Depths-Horizontal Well
With the GOC closer (GOC at 6035) to the well completion layer (layer 4), for both multilateral and horizontal
well, gas breakthrough became inevitable and occurred earlier than GOC further away (GOC at 6000) for the
conventional case. Even though the IW’s RCS did its job in controlling the gas coning, gas breakthrough occurred
earlier with GOC closer to the completion layer which reduces the oil production rate hence a lower FOE as
shown in figure 17.
Fig 17: FOE for Gas-Oil Contact Depth at 6000ft and 6035ft Respectively-Multilateral Well (CW & IW)
International Journal of Applied Science and Technology Vol. 4, No. 5; October 2014
131
5.0. Economic Analysis
After carefully considering the technical aspect in dealing with gas coning problems and increasing FOE, it was
prudent to understand the economic gain that would arise by this increase in FOE in term of NPV calculations. A
simple economic evaluation was used to determine the economic viability of employing IWTs with all our
assumptions considered in our evaluations presented in table A.4 in the appendix.
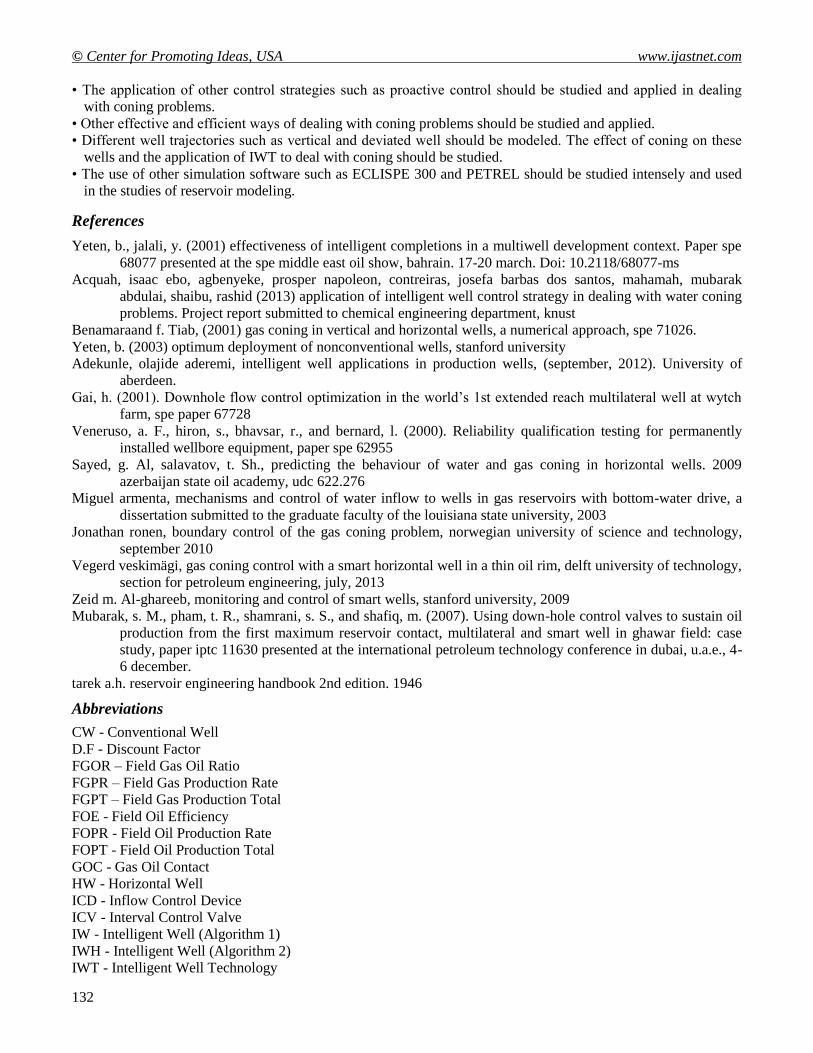
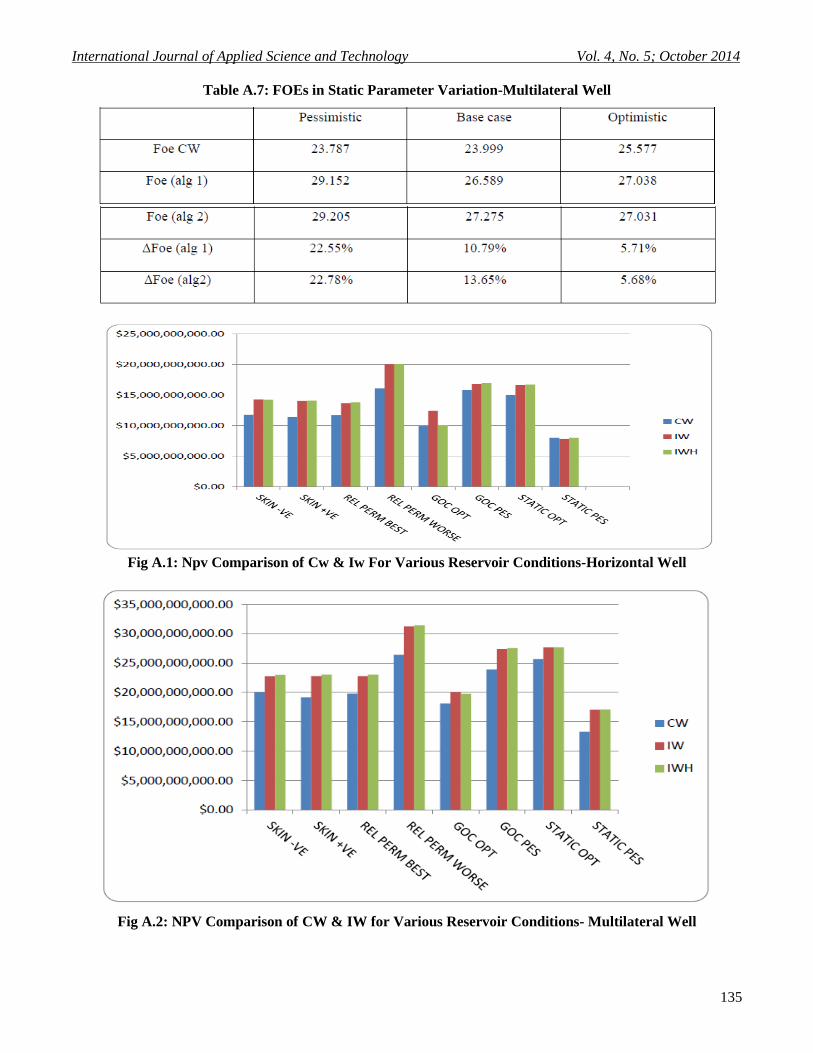
It can be seen from the variation tables and charts present below that, IWTs performed very well as compared to
CW in all cases. The effect of the solution gas in our live oil brought with it the complication nature of gas
production in some time in the production time of the reservoir. In the oil and gas industry, gas is also money and
can help generate lots of revenue and hence our decision to sell the gas. This accounted for the high NPV for
situations of high gas productions such as in high GOC situation and relative permeability variations as shown in
and figures A1 and A.2.
Figure 18: Comparison of the NPV versus Time of the IW and CW for Base Case (HW and MW
Respectively)
5.0. Conclusion
From our work, it can be concluded that by installing ICVs at well segments with high GOR, intelligent wells
have the ability to delay gas coning for a significant period of time and increase oil production in a reservoir.
Two algorithms were employed and in horizontal wells, they led to an oil production of 17.84MMSTB for
algorithm 1, this is a 17.432% of the oil in place whilst algorithm 2 had an oil production of 18.04MMSTB. This
represents 17.572% out of the oil in place.
In multilateral wells, the intelligent well recorded a percentage increase of 10.79% and 13.65% for algorithm 1
and algorithm 2 respectively.
The higher amount of oil produced due to use of intelligent wells was also observed to be attributed to the ability
of intelligent well to keep the gas in the reservoir as long as possible to maintain the reservoir pressure.
Economically, the need for work overs when intelligent wells were employed was eliminated which reduced the
operational cost the risk of damaging the wellbore. The combined effect of these two, gives an increase in the
NPV. This represents an increment of 16.54% and 17.86% in algorithm 1 and 2 respectively for horizontal well.
For multilateral wells, the increase is 17.0367% and 16.2537% for algorithm 1 and 2 respectively
When various reservoir parameters were varied, it was also observed that the intelligent well performed better
than conventional well.
In tight reservoirs, reservoirs with low porosity and low permeability however, it can be concluded that although
intelligent wells work better than conventional wells, the percentage increase in oil production is insignificant and
can be ignored in such a reservoir.
7.0. Recommendation and Further Work
• Incorporate the friction effect into the modeling of the reservoir and see how this will affect coning and IWT.
• Further work on the application of IWT in tight reservoirs to increase productivity.
• Application of IWT on a more heterogeneous reservoir.
© Center for Promoting Ideas, USA www.ijastnet.com
132
• The application of other control strategies such as proactive control should be studied and applied in dealing
with coning problems.
• Other effective and efficient ways of dealing with coning problems should be studied and applied.
• Different well trajectories such as vertical and deviated well should be modeled. The effect of coning on these
wells and the application of IWT to deal with coning should be studied.
• The use of other simulation software such as ECLISPE 300 and PETREL should be studied intensely and used
in the studies of reservoir modeling.
References
Yeten, b., jalali, y. (2001) effectiveness of intelligent completions in a multiwell development context. Paper spe
68077 presented at the spe middle east oil show, bahrain. 17-20 march. Doi: 10.2118/68077-ms
Acquah, isaac ebo, agbenyeke, prosper napoleon, contreiras, josefa barbas dos santos, mahamah, mubarak
abdulai, shaibu, rashid (2013) application of intelligent well control strategy in dealing with water coning
problems. Project report submitted to chemical engineering department, knust
Benamaraand f. Tiab, (2001) gas coning in vertical and horizontal wells, a numerical approach, spe 71026.
Yeten, b. (2003) optimum deployment of nonconventional wells, stanford university
Adekunle, olajide aderemi, intelligent well applications in production wells, (september, 2012). University of
aberdeen.
Gai, h. (2001). Downhole flow control optimization in the world’s 1st extended reach multilateral well at wytch
farm, spe paper 67728
Veneruso, a. F., hiron, s., bhavsar, r., and bernard, l. (2000). Reliability qualification testing for permanently
installed wellbore equipment, paper spe 62955
Sayed, g. Al, salavatov, t. Sh., predicting the behaviour of water and gas coning in horizontal wells. 2009
azerbaijan state oil academy, udc 622.276
Miguel armenta, mechanisms and control of water inflow to wells in gas reservoirs with bottom-water drive, a
dissertation submitted to the graduate faculty of the louisiana state university, 2003
Jonathan ronen, boundary control of the gas coning problem, norwegian university of science and technology,
september 2010
Vegerd veskimägi, gas coning control with a smart horizontal well in a thin oil rim, delft university of technology,
section for petroleum engineering, july, 2013
Zeid m. Al-ghareeb, monitoring and control of smart wells, stanford university, 2009
Mubarak, s. M., pham, t. R., shamrani, s. S., and shafiq, m. (2007). Using down-hole control valves to sustain oil
production from the first maximum reservoir contact, multilateral and smart well in ghawar field: case
study, paper iptc 11630 presented at the international petroleum technology conference in dubai, u.a.e., 4-
6 december.
tarek a.h. reservoir engineering handbook 2nd edition. 1946
Abbreviations
CW - Conventional Well
D.F - Discount Factor
FGOR – Field Gas Oil Ratio
FGPR – Field Gas Production Rate
FGPT – Field Gas Production Total
FOE - Field Oil Efficiency
FOPR - Field Oil Production Rate
FOPT - Field Oil Production Total
GOC - Gas Oil Contact
HW - Horizontal Well
ICD - Inflow Control Device
ICV - Interval Control Valve
IW - Intelligent Well (Algorithm 1)
IWH - Intelligent Well (Algorithm 2)
IWT - Intelligent Well Technology

International Journal of Applied Science and Technology Vol. 4, No. 5; October 2014
133
LRAT - Liquid Rate
MW – Multilateral Well
NCF - Net Cash Flow
NPV - Net Present Value
RCS – Reactive Control Strategy
SCF – Standard Cubic Feet
SGOR – Segment Gas Oil Ratio
SPR – Segment Pressure
STB - Stock Tank Barrel
SWCT - Segment Water Cut
WBHP- Well BottomHole Pressure
WPI – Well Productivity Index
Appendix
Appendix A1-Reservoir Model Description
Table A.1: Reservoir Model Description
Table A.2: Static Reservoir Parameters

© Center for Promoting Ideas, USA www.ijastnet.com
134
Table A.3: Dynamic Reservoir Parameters
Table A.4: Parameters for NPV Computation
Table A.5: FOE for horizontal well
Table A.6: Foes in Multilateral Conventional Well Case
International Journal of Applied Science and Technology Vol. 4, No. 5; October 2014
135
Table A.7: FOEs in Static Parameter Variation-Multilateral Well
Fig A.1: Npv Comparison of Cw & Iw For Various Reservoir Conditions-Horizontal Well
Fig A.2: NPV Comparison of CW & IW for Various Reservoir Conditions- Multilateral Well