interactive visualization of three-dimensional mantle
TRANSCRIPT

Dave Yuen, Megan Damon, E.O.D. Sevre, James B. S. G. GreenskyMinnesota Supercomputing InstituteUniversity of Minnesota, Minneapolis, Minnesota
Mike Knox and David Henry PorterLaboratory of Computational Science and EngineeringUniversity of Minnesota, Minneapolis, Minnesota
M. Charley KameyamaEarth Simulator Center, JAMSTEC, Yokohama, Japan
Walter CzechComputer Science Institute, Krakow, Poland.
Ubiquitous Interactive Visualization of 3-D Mantel Convection Via Web Application Using Java and Ajax
Framework

Outline
1. Introduction: raison d’être, onslaught of petascale computing, the “data tsunami”
2. LCSE visualization system3. 3-D numerical model ACuTEMan, by Charley
Kameyama4. Demands of interactive visualization5. Examples6. Emerging paradigm in numerical modeling
and visualization

Petascale Computing

Large 3-D Data SetsCan 3-D time dependent data sets be visualized on the fly?Seismology advancements: 2000x2000x2000 points from 500x500x1000 points!Wave patterns must be extracted from seismic calculations.This is more manageable using curvelets(De Hoop) for decomposition.

Challenges of Large Data Sets
Can we do this interactively and collaboratively?

Why Visualization?Numerical simulations and field experiments produce extremely large datasetsPetascale computing: in 2002 it was a dream, but by 2012 it is a reality, like Global WarmingThe size of these datasets are increasing exponentially fast, with resolutionNumerical output (e.g. tables) does not lend itself to easy comprehensionWe need new dynamical display of fields for unraveling new physics

Post-Processing Visualization
Start with raw data files from HPC system Results are analyzed to determine the best visualization techniquesHuman spends a lot of time learning and using software packagesThere is a need to automate these steps for a much faster turn around
LCSE Visualization System
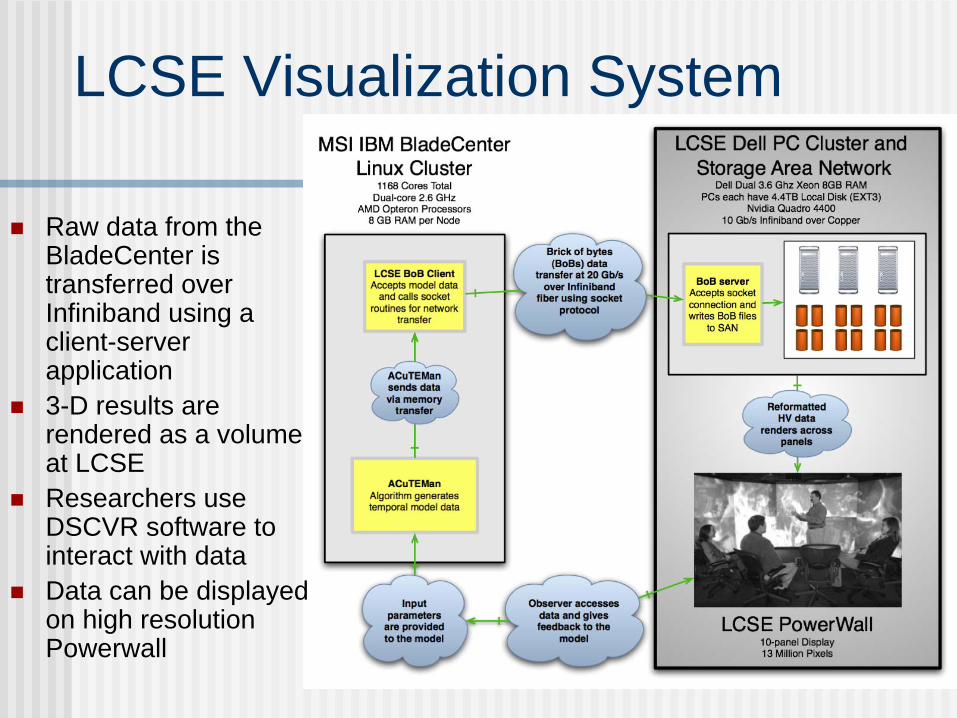
Raw data from the BladeCenter is transferred over Infiniband using a client-server application 3-D results are rendered as a volume at LCSEResearchers use DSCVR software to interact with dataData can be displayed on high resolution Powerwall

Closer look at LCSE system

Software
This is a schematic diagram showing the hierarchy of our visualization rendering web service under an Ajax interface using Java. We stress here the simplicity of the implementation, as compared to the use of VPN protocol shown in the figure on the right.

Detailed diagram showing the message passing and receiving scheme used in interactive visualization with javascript.

Client – Server message passing

Mantle convection data being interactively visualized on hand-held devices. The OQO on
the left runs Windows XP while the Nokia on the right is running a version of Linux.
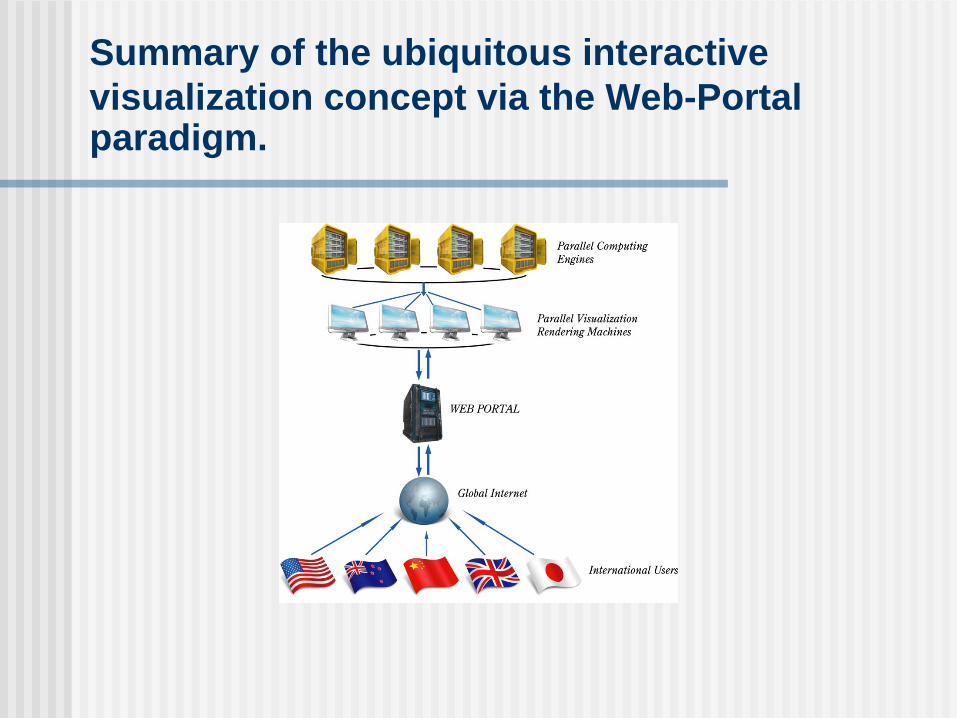
Summary of the ubiquitous interactive visualization concept via the Web-Portal paradigm.
ACuTEManWritten by Charley Kameyama, who is moving to Ehime University in September 2007Parallel, multigrid cartesian, finite volume code, written for vector parallel computing using MPI-2Benchmarked at 3.4 Teraflops a Supercomputing 2005 in PittsburghGeneralized to Yin-Yang grid for 3-D spherical geometry and recently executed on the Earth Simulator. Variable viscosity contrast up to ten thousand across adjacent grid points*Kameyama, Kageyama, Sato, J. Computational Physics, 2005 Kameyama, J. Earth
Simulator, 2006.

Multigrid Method

Demands of Petascale Computing5 hours on 3-D grid with 2000x2000x2000 grid points5 grid fields x 4 bytes storage every 5 minutes (or thousand time steps) on a linear scale with 5,000 cores2000x2000x2000x5x4x60 = 9.6 TB40 runs -> 384 TB of raw data - AND we are only storing every 1,000 time steps (stingy)!Solutions:
Stream raw output data to visualization system in real time to generate movies - data compressionInteractive visualization with real-time simulation -avoid saving most of the data

Need for Software & Hardware Solutions1. Collaborative mode of visualization
whereby we can communicate readily upon viewing a common image
2. Storage capabilities at a central site on demand
3. Web-portal services for controlling our desires

Results - Real-time Interactive Visualization with LCSE DSCVR
128x128x128 grid points rendering in real time across 128 PUs

Results - Real-time Interactive Visualization with LCSE Powerwall
128x128x128 grid points rendered in real time across 128 PUsDisplayed on 13 megapixel Powerwall
Rayleigh number = 106
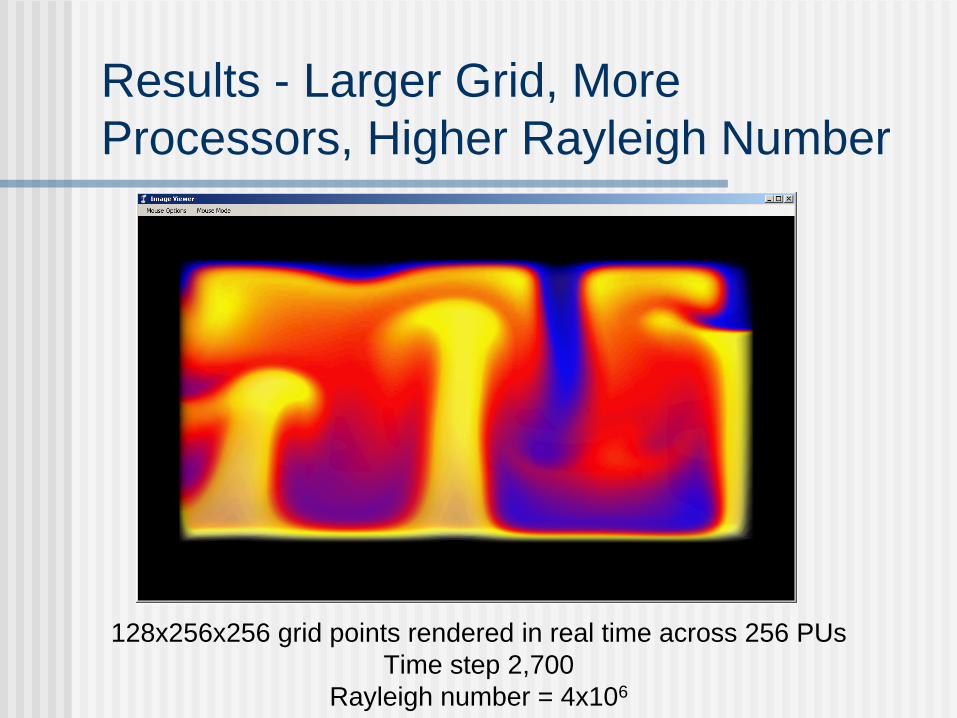
Results - Larger Grid, More Processors, Higher Rayleigh Number
128x256x256 grid points rendered in real time across 256 PUsTime step 2,700
Rayleigh number = 4x10⁶
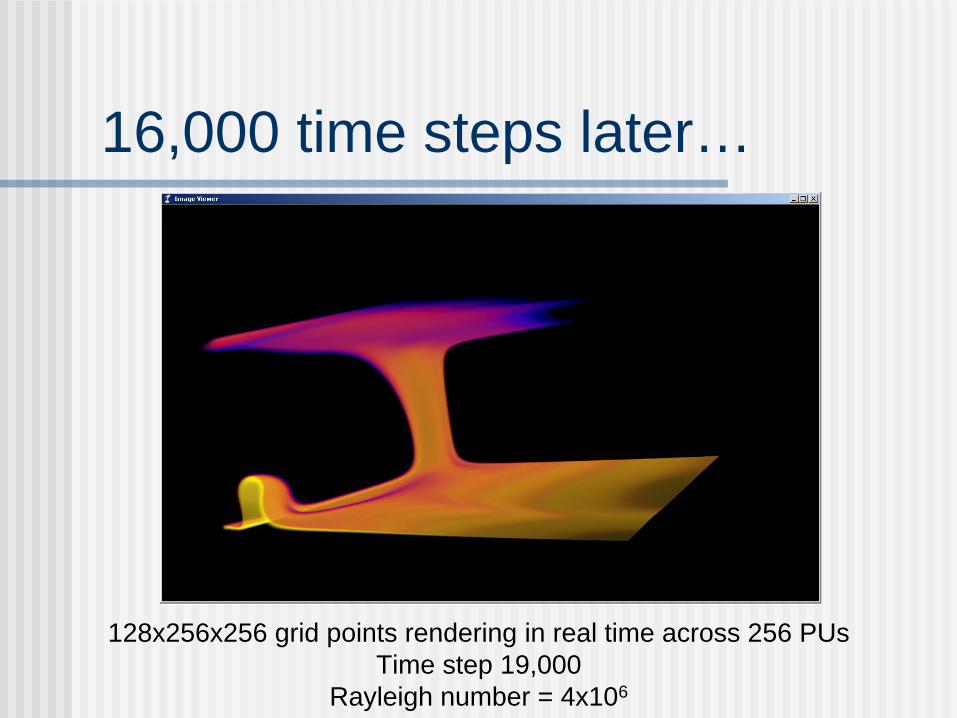
16,000 time steps later…
128x256x256 grid points rendering in real time across 256 PUsTime step 19,000
Rayleigh number = 4x10⁶

Results - Performance gains
Total compute time reduced on average by 30 %Local disk space on Supercomputer also reduced

Interactive ComputingLimited time duration, perhaps 1 or 2 hoursBalance between grid resolution and number of processorsFew frames to one frame per secondRuns can be monitored from remote locations

Runs can be monitored from home or hotel room
using a web portal
Interactive Visualization with Nokia N800
Small-display systemAnti-glare screenCurrently investigating N800 as a stand-alone visualization system for Geophysical applicationsPervasive visualization -visualize anywhere, anytime on mobile devices

New Paradigm in Numerical Modeling
Disks are a well-known bottlenecks that slow researchWe need real-time computing combined with interactive visualization for fast feedback and resultsWe can leverage high speed networks instead of disks to reduce storage requirementsWeb services for remote collaborationsStreamlined visualization techniquesThis will drastically reduce storage requirements and save compute timeWe can run a model to analyze results instead of pulling results from an archiveShort interactive periods


Summary1. The imminent arrival (2011) of petascale computing
makes it imperative that we develop some strategy for visualizing the flood of time-dependent 3-D data and simulations.
2. Interactive visualization of 3-D convection is feasible now with the deployment of hundreds of processors together with a fast network, multi-Terabyte storage at each visualization node. Large-display devices (CAVE, PowerWall) and web-portal services will allow for collaborative research.
3. This mode of operation (via a client-server application) will eventually be used by many parties around the world. A new paradigm in large-scale numerical modeling is now at hand.