intercultural communication barriers between … declaration with the signature below i, jin zheng,...
TRANSCRIPT

INTERCULTURAL COMMUNICATION BARRIERS
BETWEEN ZULU AND CHINESE STUDENTS
AT SELECTED HIGHER EDUCATION INSTITUTIONS IN DURBAN.
This work is submitted in partial fulfillment of the requirements for the
Master of Technology Degree: Public Relations Management
in the Department of Marketing, Retail and Public Relations
Faculty of Management Sciences
Durban University of Technology
JIN ZHENG
Bachelor of Technology Degree: Public Relations Management
June 2009
------------------------------------------------- ----------------------------
SUPERVISOR: DR R. RAMPERSAD (DPhil) DATE
------------------------------------------------- ----------------------------
CO - SUPERVISOR: PROF P. SINGH (Phd) DATE

ii
DECLARATION
With the signature below I, Jin Zheng, hereby declare that the work that I
present in this dissertation is based on my own research, and that I have not
submitted this dissertation to any other institution of higher education to obtain
an academic qualification.
1 June 2009
J. Zheng Date

iii
DEDICATION
This study is dedicated to all the people who have supported and encouraged
me to complete this Masters, in particular:
My parents,
who have given me the strength and determination to reach this milestone.

iv
ACKNOWLEDGEMENTS
I acknowledge the help and assistance given by the following people and
institutions, without which this study would not have been possible:
My supervisors, Dr Renitha Rampersad and Prof Prenitha Singh for their
guidance and encouragement.
Prof Tony Reddy, Dr Shalini Singh, Dr. R. B. Mason and Deepak Singh,
who so eagerly shared their knowledge with me.
Prof A. Jordaan, Nicky Muller, Avasha Lutchman, Sheena Perumal, for
their assistance throughout this study.
Special thanks to my boyfriend, Wei Zhang, for his invaluable help with this
study.
Department of Postgraduate Development and Support of Durban
University of Technology, for financial assistance.

v
ABSTRACT
This study presents the research of an investigation into the intercultural
communication barriers between Zulu and Chinese students at selected
Higher Education Institutions in Durban. To achieve this aim, two sets of
questionnaires were administered separately to Zulu and Chinese students at
two HEIs in Durban and an observation report was compiled.
This study reviewed theories and literature relevant to defining and
understanding the barriers to intercultural communication. The insights gained
from this literature review were used to interpret the results which were
obtained through a quantitative and qualitative research methodology.
The findings revealed that intercultural communication barriers do exist
between Zulu and Chinese students. Findings also found that language
problems amongst Zulu and Chinese students are viewed as common barriers,
especially where the communicators speak different languages. Comments
from respondents revealed that a communicators‟ accent, different grammar
structure and the words they use are confusing during their intercultural
communication experience. Cultural differences and language problems were
found to be the main intercultural communication barriers. In addition, the
problems of nonverbal communication, racism, ethnocentrism, cultural
stereotyping were also viewed as obstacles of the intercultural communication
process.

vi
TABLE OF CONTENTS
DECLARATION ii
DEDICATION iii
ACKNOWLEDGMENTS iv
ABSTRACT v
LIST OF FIGURES xii
LIST OF TABLES xiii
CHAPTER ONE – INTRODUCTION 1
1.1 RATIONALE 1
1.2 PROBLEM DESCRIPTION 3
1.3 THE GOAL AND OBJECTIVES OF THIS STUDY 4
1.4 LIMITATIONS 5
1.5 THEORETICAL ARGUMENT 5
1.6 METHODOLOGY 7
1.7 OVERVIEW OF THE STUDY 8
1.8 CONCLUSION 8
CHAPTER TWO – LITERATURE REVIEW 9
2.1 INTRODUCTION 9
2.2 CULTURE 9
2.2.1 Culture and Perception 11
2.2.2 Beliefs 12
2.2.3 Values 12
2.2.4 Norms 12
2.2.5 Culture is Dynamic and Heterogeneous 13

vii
2.2.6 Cultural Barriers 14
2.3 CULTURAL BACKGROUND OF CHINESE AND ZULU 17
2.3.1 Chinese Culture 17
2.3.1.1 Humility 18
2.3.1.2 Elders 18
2.3.1.3 Touching 19
2.3.1.4 Handshaking 19
2.3.1.5 Gift Giving 19
2.3.1.6 Family Visiting 19
2.3.2 Zulu Culture 20
2.3.2.1 Zulu Traditions 20
2.3.2.2 Etiquette 21
2.3.2.3 Traditional Clothes 21
2.4 LANGUAGE AND INTERCULTURAL COMMUNICATION 21
2.4.1 Language Varieties 22
2.4.2 Language-Based Barriers to Communication 24
2.4.2.1 Meanings Can Be Misunderstood 24
2.4.2.2 Language Can Cause Polarization 25
2.5 RELATIONSHIP BETWEEN NONVERBAL BEHAVIOUR AND CULTURE 25
2.5.1 Types of Nonverbal Behaviour 26
2.5.2 Characteristics of Nonverbal Behaviour 27
2.5.3 Roles of Nonverbal Communication 28
2.5.4 Types of Nonverbal Communication 30
2.5.4.1 Space 30
2.5.4.2 Touch 30
2.5.4.3 Body Movements 31
2.6 COMMUNICATION 32 2.6.1 Understanding of Communication 32
2.6.2 From The Transaction Communication Model to Intercultural communication 33

viii
2.6.3 Components of Communication 35
2.6.3.1 Source 35
2.6.3.2 Encoding 35
2.6.3.3 Message 36
2.6.3.4 Channel 36
2.6.3.5 Noise 36
2.6.3.6 Decoding 37
2.6.3.7 The Receiver‟s Response 37
2.6.3.8 Feedback 38
2.6.3.9 Context 38
2.7 CONCLUSION 39 CHAPTER THREE – RESEARCH METHODOLOGY 40
3.1 INTRODUCTION 40
3.2 RESEARCH DESIGN 40
3.3 RESEARCH APPROACH AND STRATEGY 41
3.4 DATA SOURCES 41
3.5 DATA COLLECTION APPROACHES 42
3.5.1 Qualitative and Quantitative Methods 42
3.5.2 Collecting Primary Data through Observation 42
3.5.2.1 Observation Design and Content 43
3.5.3 Collecting Primary Data through Surveys: Questionnaires 45
3.5.3.1 Questionnaire Design 45
3.5.3.2 Individual Questions 46
3.5.3.3 The Layout of the Questionnaire 48
3.5.3.4 Pilot Study 48
3.6 SAMPLING APPROACHES IN EMPIRICAL RESEARCH 48
3.6.1 Defining the Target population 49
3.6.2 Choosing the Sampling Frame 49
3.6.3 Selecting the Sampling Method 50

ix
3.6.4 Sample Size 50
3.7 DATA ANALYSIS AND INTERPRETATION OF RESULTS 51
3.7.1 Analysing Quantitative Data 51
3.7.2 Analysing Qualitative Data 51
3.7.3 Analysis Software – SPSS Version 16 52
3.7.4 Data Preparation and Capturing 52
3.7.5 Tabulation and Basic Analysis 53
3.7.5.1 Descriptive Statistics 53
3.7.5.2 Correlation 54
3.7.5.3 Analysis of Variance (ANOVA) 55
3.7.5.4 Crosstabs 55
3.7.5.5 Chi-Square Test 55
3.7.6 Reliability and Validity 55
3.7.6.1 Reliability 56
3.7.6.2 Validity 56
3.8 ETHICS 56
3.9 CONCLUSION 57
CHAPTER FOUR – ANALYSES OF RESULTS 58
4.1 INTRODUCTION 58
4.2 THEME ONE – COMMUNICATION 58
4.2.1 Analyzed Question Six: Communication Frequency 58
4.2.2 Analyzed Question Seven: Communication Ability 60
4.2.3 Analyzed Question Seventeen: Communication Experiences 61
4.2.3.1 Statement One 62
4.2.3.2 Statement Two 63
4.2.3.3 Statement Three 64
4.2.3.4 Statement Four 65
4.2.3.5 Statement Five 66
4.2.3.6 Statement Six 67
4.2.3.7 Statement Seven 68

x
4.2.3.8 Statement Eight 68
4.2.4 Discussion: Theme One - Communication 69
4.3 THEME TWO – LANGUAGE PROBLEMS 70
4.3.1 Analyzed Question Eight: Language Problems 70
4.3.2 Analyzed Question Sixteen: Specified Language Problems 73
4.4 THEME THREE – CULTURE DIFFERENCES 79
4.5 THEME FOUR – CULTURAL BARRIERS 82
4.5.1 Analyzed Question Ten: Racism 82
4.5.2 Analyzed Question Eleven: Lack of Trust 83
4.5.3 Analyzed Question Thirteen: Ethnocentrism 85
4.5.4 Analyzed Question Fourteen: Cultural Stereotyping 86
4.6 THEME FIVE – NONVERBAL COMMUNICATION 87
4.7 THEME SIX – COMMON INTERESTS 88
4.7.1 Analyzed Question Fifteen (a): Sharing Interesting Topics 88
4.7.2 Analyzed Question Fifteen (b): Interests Sharing 89
4.8 SUMMARY OF OBSERVATION REPORT 91
4.9 CONCLUSION 94
CHAPTER FIVE – CONCLUSIONS AND RECOMMENDATIONS 95
5.1 INTRODUCTION 95
5.2 SUMMARY OF THE STUDY 95
5.3 ACHIEVEMENT OF THE OBJECTIVES 96
5.3.1 First Object 96
5.3.2 Second Objective 97
5.3.3 Third Objective 99
5.4 RECOMMENDATION 100
5.5 DIRECTIONS FOR FURTHER STUDY 100

xi
LIST OF REFERENCES 102
APPENDIX A: Questionnaire: Zulu Students 110
APPENDIX B: Questionnaire: Chinese Students 118

xii
LIST OF FIGURES
Figure 1.1: Transactional Communication Model 6
Figure 2.1: The Cultural Iceberg: The Visible and Hidden Layers of Culture 10
Figure 2.2: A Transactional Model of Communication 33
Figure 4.1: Frequency of Communication (Zulu Respondents) 58
Figure 4.2: Frequency of Communication (Chinese Respondents) 59
Figure 4.3: Communication Ability (Zulu Respondents) 60
Figure 4.4: Communication Ability (Chinese Respondents) 60
Figure 4.5: Responses to Statement One 62
Figure 4.6: Responses to Statement Two 63
Figure 4.7: Responses to Statement Three 64
Figure 4.8: Responses to Statement Four 65
Figure 4.9: Responses to Statement Five 66
Figure 4.10: Responses to Statement Six 67
Figure 4.11: Responses to Statement Seven 68
Figure 4.12: Responses to Statement Eight 68

xiii
LIST OF TABLES
Table 4.1: Central Tendency Statistics on Question Seven 61
Table 4.2: Language Problems 70
Table 4.3: Analysis of Variance: Language Problems and Communication Frequency 71
Table 4.4: Cross Tabulation of Language Problems and Communication Frequency 71
Table 4.5: Analysis of Variance: Language Problems and Communication Ability 72
Table 4.6: Cross Tabulation of Language Problems and Communication Ability Level 72
Table 4.7: Specify Language Problems (Zulu Respondents) 73
Table 4.8: Specify Language Problems (Chinese Respondents) 73
Table 4.9: Correlation of Specific Language Problems in Question Sixteen (Zulu Questionnaire) 74
Table 4.10: Correlation of Specific Language Problems in Question Sixteen (Chinese Questionnaire) 75
Table 4.11: Chi-Square Results: Language Problems and Communication Ability (Zulu Respondents) 76
Table 4.12: Chi-Square Results: Language Problems and Educational Level (Zulu Respondents) 76
Table 4.13: Chi-Square Results: Language Problems and Communication Frequency (Zulu Respondents) 76
Table 4.14: Chi-Square Results: Language Problems and Home Language (Zulu Respondents) 77
Table 4.15: Chi-Square Results: Language Problems and Home Language (Chinese Respondents) 78
Table 4.16: Chi-Square Results: Language Problems and Communication Ability (Chinese Respondents) 78
Table 4.17: Cultural Differences 79
Table 4.18: Analysis of Variance: Cultural Differences and Communicators‟ Age 80
Table 4.19: Cross Tabulation of Cultural Differences and Communicators‟ Age 80
Table 4.20: Analysis of Variance: Cultural Differences and Communication Frequency 81
Table 4.21: Cross Tabulation of Cultural Differences and Communication Frequency 82
Table 4.22: Racism 82

xiv
Table 4.23: Lack of Trust 83
Table 4.24: Analysis of Variance: Lack of Trust and Communication Frequency 84
Table 4.25: Cross Tabulation: Lack of Trust and Communication Frequency 85
Table 4.26: Ethnocentrism 85
Table 4.27: Cultural Stereotyping 86
Table 4.28: Nonverbal Communication 87
Table 4.29: Sharing Interesting Topics 88
Table 4.30: Analysis of Variance: Sharing Interesting Topics and communication Frequency 88
Table 4.31: Cross Tabulation: Sharing Interesting Topics and Communication Frequency 89
Table 4.32: Interests Sharing 89
Table 4.33: Analysis of Variance: Interests Sharing and Communication Frequency 90
Table 4.34: Cross tabulation: Interests Sharing and Communication Frequency 90
Table 4.35: Correlation: Sharing Interesting Topics and Interests Sharing (Zulu Respondents) 91
Table 4.36: Correlation: Sharing Interesting Topics and Interests Sharing (Chinese Respondents) 91
Table 4.37: Observation Report 92

1
CHAPTER ONE – INTRODUCTION
1.1 RATIONALE
According to research by the British Council (Study South Africa, 2007),
student drive-factors of a choice of a study destination abroad include
geographic region, historical connections between countries, language, the
perceived quality of a country‟s education and its accessibility, affordability and
the „employability‟ of qualifications obtained. Interestingly, growing numbers of
students are opting to study in developing countries (Study South Africa,
2007).
Study South Africa (2007) found that South Africa as a popular international
student destination uses English as the primary language of instruction,
charges lower fees than developed nations, has a lower cost of living and has
a large higher education sector that is accessible and offers internationally
recognised qualifications. The benefits of having foreign students study in
destination countries like South Africa are considerable. The fees and living
costs paid by foreign students are a form of foreign investment and those who
are charged fees higher than local students help to fund higher education
(Study South Africa, 2007).
Statistics from the Ministry of Education show that in 2006 more than 130 000
Chinese went abroad for further study (Gao, 2007). He added that a survey
conducted by The China Youth Daily revealed that more than 80% of
Chinese university students wanted to study abroad and 66% responded that
they believed that an overseas education background would be beneficial to
their future career development. He further stated that Chinese students felt
that with their overseas university diplomas they were more competitive than
graduates from the local universities. China is a great “student-abroad” export
country and has considerable potential to influence the development of the
education industry than any other country (Gao, 2007).

2
The number of Chinese students studying abroad is increasing rapidly every
year. China has a huge number of students studying abroad and has a great
potential to influence the development of the education industry in South
Africa. The Chinese embassy in South Africa (2006) indicated that 19 Chinese
students were registered in South Africa in 1999, however by September 2006
more than 3 300 Chinese students had come to study at South African tertiary
institutions. Therefore, if South Africa‟s HEIs can seize this opportunity to
publicise themselves as a good study destination, more Chinese students will
be attracted. South Africa can benefit from the financial investments that
Chinese students make, and from the international relations and links forged
during their studies. The internationalisation of education is viewed as a
valuable means of advancing communication and respect among people of
different cultures, of developing scholarship, and of strengthening South
Africa‟s global position (Study South Africa, 2007). There are also benefits to
home countries like China when Chinese students return as well qualified
citizens with knowledge of and links to other countries (Study South Africa,
2007).
As there is a growing number of Chinese international students in South Africa,
communication problems between them and local students are on the
increase. According to Avruch and Black (1993) as people from different
cultural groups take on the exciting challenge of working together, cultural
values sometimes conflict. Higher Education Institutions (HEIs) in Durban are
made up of diverse groups of students who bring their own unique languages
and cultures with them. Burger (2007: 13) shows that the majority of the people
in KwaZulu-Natal speak isiZulu. In comparison to other languages in the
province, statistics show that isiZulu is the first language of 80.9% of the
population, followed by English (13.6%) and Afrikaans (1.5%).
The problem is that little research has been done which provides a thorough
cultural background of Chinese and Zulu students. In addition, limited research
has been done on investigating the barriers of effective intercultural
communication between Chinese and Zulu students in multicultural learning
environments in South Africa.

3
As a Chinese international student studying at the Durban University of
Technology, the researcher interacts with many different cultural groups at the
institution. According to a pilot study conducted by the researcher in 2007 at
HEIs in Durban, it was found that there are certain barriers to intercultural
communication that prevent Chinese and Zulu students from communicating
effectively when they involve themselves in complex intercultural
environments. The pilot study which was conducted as exploratory research
with 10 Chinese students and 10 Zulu students at HEIs in Durban showed that
most of the respondents experienced several problems when they
communicated with their peers and educators. The results showed that 100%
of the Chinese participants said they had experienced intercultural
communication problems with Zulu students. 60% of Zulu participants said that
they had experienced intercultural communication problems with Chinese
students. The pilot study also found that cultural differences led to
miscommunication between Zulu and Chinese students.
1.2 PROBLEM DESCRIPTION
According to Fielding (1993: 445) intercultural communication is a special type
of communication in which people from different cultures communicate with
each other. Rampersad (2007) states that as learners enter into intercultural
dialogue or collaboration they are often faced with cultural differences. Bruhns
et al. (cited in Njobe, 2007: 1) also found that numerous studies on language
abilities of second language learners‟ indicate that learners have difficulties
learning in a second language. Rampersad (2007) further indicates that
learners are either unhappy or reluctant to work or associate with people of
other cultures or are shy or intolerant to engage in discussions. The problem in
terms of understanding each other is also of great concern.
Sigband and Bell (1990: 76) claim the way to achieve better communication is
through knowledge, appreciation, and understanding of cultural differences
rather than through acceptance or integration. To address the barriers of
intercultural communication between Chinese and Zulu students, the
education system needs to encourage learners to become interculturally

4
competent. Lustig and Koester (1993: 73) articulate that there are three
components of intercultural competence, including the interpersonal and
situational contexts within which the communication occurs, the degree of
appropriateness and effectiveness of the interaction and the importance of
knowledge, motivations, and actions. Furthermore, for learners to become
interculturally competent, it is essential that all participants in the education
system – school administrators, teachers, and staff, become aware of their
own cultural background and how their own beliefs and values influence their
interactions with learners of other cultural backgrounds (Lustig and Koester,
2006). This study proposes to investigate the intercultural communication
barriers between Chinese and Zulu students at selected HEIs in Durban.
1.3 THE GOAL AND OBJECTIVES OF THIS STUDY
This study is about the unique relationship between communication and
culture within a multicultural setting. The objective of this study is to identify
intercultural communication barriers that exist between Zulu and Chinese
students at university level and to identify strategies to overcome these
barriers.
In order to meet the above objectives, this study will address the following:
1.3.1 To determine whether intercultural communication problems do exist
between Zulu and Chinese students at HEIs in Durban.
1.3.2 To identify the intercultural communication problems experienced
between Zulu and Chinese students at HEIs in Durban.
1.3.3 To examine the reasons why cultural divides exist between Chinese
and Zulu students at HEIs in Durban
1.3.4 To suggest strategies to enhance communication between Chinese and
Zulu students at HEIs in Durban based on the findings from this
research.

5
1.4 LIMITATIONS
The following factors afford potential limitations to this research:
- The research is based in one geographical area (KwaZulu-Natal).
Therefore the data generated is not totally representative of all other areas
in South Africa.
- As a result of time constraints and because of limited funding, the number
of the respondents may affect the result of this study.
1.5 THEORETICAL ARGUMENT
Communication is defined by Pearson, Nelson, Titsworth and Harter (2006: 9)
as the process of using messages to generate meaning. Communication is
considered a process because it is an activity, an exchange, or a set of
behaviours (Pearson et al., 2006: 9). Steinberg (2002: 21) shows that one of
the ways in which scholars have sought to understand the nature of
communication is by means of models which describe and explain the
communication process. The theoretical approach to this study will employ the
Transactional Communication Model (Figure 1.1) adapted from Verderber
1990. The Transactional Model uses all the elements of Lasswell‟s Model of
Communication, and Shannon and Weaver‟s Model, and builds on them to
show that communication does not only involve the transmission of messages
from one person to another, and that it is not simply an interaction between two
people. The communication process becomes a transaction during which the
meaning of a message is negotiated (Steinberg, 2002: 33). At the same time,
the Transactional Model suggests that the communicator and recipient take
turns to express and interpret messages (Steinberg, 2002: 33).
The Transactional Model depicts the simultaneous involvement of the
participants in the negotiation of meaning (Steinberg, 2006: 18). It also depicts
communication as a dynamic process in which the participants are actively
engaged in encoding, transmitting, receiving and decoding messages

6
(Steinberg, 2007: 57). It highlights the differences between communicator and
recipient which makes negotiation of meaning necessary.
Figure 1.1: Transactional Communication Model
(Source: Verderber, 1990)
Figure 1.1 represents the communicator and the recipient. In the centre of
each circle is the message: the thought, idea or feeling that is communicated
using verbal and nonverbal signs. Surrounding the message is in the
participant‟s values, culture, background, knowledge and attitudes. Linde
(1997) considers that the factors that can contribute to the incorrect
interpretation of the message are differences in language and culture between
the transmitter and the receiver. He explains further that a blocking of
communication may be due to "noise". The "noise" that is referred to should be
understood as obstacles hampering and interfering with the communication
process and the intended meaning of the message. A blocking may also be
due to covert messages which involve implicit messages that are hidden in the
communication (Linde, 1997).
Verderber‟s Transactional Communication Model for Development will provide
a basis for the investigation into intercultural communication barriers between
Noise Noise
Background, Culture Culture, Background
Experience, Value Sending Channel Value, Experience
Occupation Encoding Decoding Occupation
Attitudes Decoding Encoding Attitudes
Feelings Feedback Channel Feelings
Knowledge, Sex Sex, Knowledge
COMMUNICATOR CONTEXT RECIPIENT
Message Message

7
Zulu and Chinese students. This model will be used to analyze the
communicator, recipients and the message. The model will further investigate
the interaction between the participants in this study.
1.6 METHODOLOGY
This study was conducted within a qualitative and a quantitative paradigm to
investigate the intercultural communication barriers between Zulu and Chinese
students at selected HEIs in Durban. The aim of this study was to identify the
possible sources of misunderstanding that exist amongst students in order to
enhance communication between Chinese and Zulu learners at Higher
Education Institutions.
A pilot study was conducted in 2007 to find out whether there are intercultural
communication problems between Chinese and Zulu students. In the pilot
study, 10 Chinese and 10 Zulu students who have direct communication
opportunities with each other were investigated.
The main method of the research procedure in this study is a structured
questionnaire (see Appendix A and Appendix B) which was designed to obtain
primary data from students through the survey method. The questionnaire
included open-ended and closed-ended questions which were informed by the
objectives of this study. The non-participant observation method was also used.
The researcher observed Chinese and Zulu students to find the differences
between their daily behaviours, customs in order to investigate the intercultural
communication barriers between these two groups.
Statistics: Headcount by race at UKZN 2007 and Statistics: Headcount by race
at DUT 2007 showed that there are 46 Chinese students at the Durban
University of Technology (DUT) and 64 Chinese students at the University of
KwaZulu-Natal (UKZN). The sample in this study therefore focused on a total
of 90 Chinese students and 90 Zulu students who had direct communication
opportunities with each other, therefore a total of 180 students at selected HEIs
in Durban were considered for this study.

8
The data obtained from the questionnaire survey was analyzed through the
SPSS statistical programme.
1.7 OVERVIEW OF THE STUDY
Chapter Two: Literature Review
Chapter two presents a literature review that provides an overview of the
historical background of Chinese and Zulu cultures. It also explores the history
of the intercultural communication field and presents various approaches to
this area of study.
Chapter Three: Research Methodology
Chapter three discusses the research framework employed in this study. The
research design and statistical methods utilized in this study are discussed in
detail.
Chapter Four: Analysis of Results
Chapter four presents an analysis of the results. This chapter discusses
appropriate statistical testing that was used in this study.
Chapter Five: Conclusions and Recommendations
Chapter five discusses the conclusions and recommendations on both the
literature and empirical findings.
1.8 CONCLUSION
This chapter has contained the research objectives of the study. Chapter two
highlights literature review of culture, language, nonverbal communication and
the Transactional Communication Model, which will be introduced to provide a
basis for the investigation into intercultural communication barriers between
Zulu and Chinese students.

9
CHAPTER TWO – LITERATURE REVIEW
2.1 INTRODUCTION
Intercultural communication studies in South Africa have been rapidly gaining
popularity since 1994 (Dlomo, 2003: 1). Scholars like K. Chick (1985), E. de
Kadt (1992), W. L. Kruger (1990) and L. Parry (1993, 2000) have investigated
a number of intercultural scenarios involving blacks and whites of different
social and economic positions (Dlomo, 2003: 1). Although a large proportion of
the research conducted on intercultural communication done by South African
scholars involves blacks and whites or Indians and Africans, there seems to be
a knowledge gap in terms of communication problems between Zulu and
Chinese students.
The objective of this study is to identify the intercultural communication barriers
between Chinese and Zulu students and to identify strategies to overcome
these barriers. Chapter two will serve to provide a theoretical framework of the
study.
In this chapter, culture will be defined and described, followed by a discussion
on language diversity and nonverbal patterns and knowledge. The
Transactional Communication Model will be introduced to provide a basis for
the investigation into intercultural communication barriers between Zulu and
Chinese students. This model will be used to analyze the communicator,
recipients and the message. The model will further investigate the interaction
between the participants in this study.
2.2 CULTURE
Martin and Nakayama (2001: 23) point out that culture is often considered the
core concept in intercultural communication. In the pilot study, the results also
found that the cultural differences led to the miscommunication. Samovar,
Porter and McDaniel (2007: 35) believe the source of how a culture views the
world can be found in its deep structure. It is this deep structure that unifies a

10
culture, makes each culture unique, and explains the how and why behind a
culture‟s collective action. Ting-Toomey (cited in Sutter, 2004: 2) explains
culture as an iceberg (Figure 2.1). Traditions, beliefs and values form the
deeper layers of the iceberg which are hidden from the reader. To attain a
deeper understanding of culture, it is important to understand the underlying
set of beliefs and values that form peoples‟ behaviour and thinking.
Figure 2.1: The Cultural Iceberg: The Visible and Hidden Layers of Culture
(Source: Ting-Toomey, 1999)
Culture can be defined as a learned set of shared perceptions about beliefs,
values, and norms, which affect the behaviours of a relatively large group of
people that are also dynamic and heterogeneous (Lustig and Koester,
1993: 41).
2.2.1 Culture and Perception
According to Martin and Nakayama (2001: 24) people share perceptions or
ways of looking at the world. Thus, all of our prior learning, that is, the

11
information people have already stored in their brains, affects how they
interpret new information. Some of this learning and perception is related to the
values of the cultural groups they belong to.
Fielding (1993: 19) points out that the need for shared experiences and
meanings for successful communication are particularly important in
intercultural communication because the idea of a culture implies a group of
people. These cultural patterns of perceptions are developed through
interactions with different groups. Perceptions are similar to those of other
individuals who belong to the same cultural groups (Martin and Nakayama,
2001: 24). A culture can form only if those symbolic ideas are shared with a
relatively large group of people (Lustig and Koester, 1993: 42).
Observation from the pilot study showed that Chinese students think it is
uncomfortable to accept an impassioned hug from Zulu students when they
meet. Gradually, some Chinese students recognised that Zulu students just
have a stronger sense of affective passion than Chinese students. Chinese
students therefore realized that these differences exist between themselves
and other cultures.
Perception is the means by which we make sense of our physical and social
world (Samovar, Porter and Stefani, 1998: 56). As Gamble and Gamble
(1996: 77) state, perception is the process of selecting, organising, and
interpreting sensory data in a way that enables us to make sense of our world.
Because our information about and knowledge of our external physical and
social world are mediated by perceptual processes, perception is primary in
the study of intercultural communication (Samovar et al., 1998: 56). The
shared symbol systems that form the basis of culture are ideas about beliefs,
values, and norms.
2.2.2 Beliefs
Lustig and Koester (1993: 43) define beliefs as the basic understanding of a
group of people about what the world is like or what is true or false. Beliefs

12
affect our conscious and unconscious minds, as well as the manner in which
we communicate (Samovar et al., 1998: 59). Belief systems are important to
students of intercultural communication because they are learned and hence
subject to cultural interpretation and cultural diversity (Samovar et al.,
1998: 58). In other words, as Chinese and Zulu students grow up in different
cultures, their culture contributes to each person‟s unique configuration of
ideas and expectations within the larger cultural matrix (Lustig and Koester,
1993: 105). Beliefs are therefore the first cultural influence which may lead to
misunderstanding in intercultural communication.
2.2.3 Values
Values may another barrier in intercultural communication. Samovar et al.
(1998: 60) state that one of the most important functions of belief systems is
that they are the basis of our values. Although each of us has a unique set of
individual values, there are also values that tend to permeate a culture, and
these are called cultural values (Samovar et al., 1998: 60).
Values have to do with what is judged to be good or bad, or right or wrong, or
what it regards as important in a culture (Martin and Nakayama, 2001: 24). Our
values get translated into action (Samovar et al., 1998: 60). Values are often
offered as the explanation for the way in which people communicate (Lustig
and Koester, 1993: 107). An understanding of cultural values helps us
appreciate the behaviour of other people (Samovar et al., 1998: 60).
2.2.4 Norms
Norms refer to rules for appropriate behaviour which provide expectations that
people have of one another and of themselves (Lustig and Koester, 1993: 43).
Norms are the surface characteristics that emerge from a culture‟s beliefs and
values. Because norms are evident through behaviours, they can be readily
observed (Hall, 1977).

13
Norms exist for a wide variety of behaviours and include typical social routines
(Lustig and Koester, 1993: 109). For example, the greeting behaviours of
people within a culture are governed by norms. Social routines exist to guide
people‟s interactions at public functions and they indicate how to engage in
conversation, what to talk about and how to disengage from the conversation.
All these actions are based on norms for expected communication behaviours
(Lustig and Koester, 1993: 109). Due to their different cultural backgrounds,
Chinese and Zulu students have their own rules to judge behaviours and social
routines. Different norms may cause disagreements especially in an
intercultural environment.
2.2.5 Culture is Dynamic and Heterogeneous
According to Martin and Nakayama (2001: 26) another crucial feature of
culture is that it is dynamic, or changing, and can often be a source of conflict
among different groups. It is important to recognize that cultural patterns are
not rigid and homogeneous but they are dynamic and heterogeneous.
Martin and Nakayama (2001: 27) believe that people from a particular culture
are not identical, and any culture has many intercultural struggles. For
instance, when reference is made to South African culture or Chinese culture,
the diversity that resides within that culture is ignored. The “South African”
culture may refer to Zulu people, or to Afrikaans people, who speak isZulu or
Afrikaans, or to the Xhosa, who speak isXhosa. The label “South African” thus
obscures incredible diversity. Similarly, “Chinese culture” could refer to the
mainland Chinese, or to the Taiwanese of China, or to the Chinese from Hong
Kong.
As intercultural communicators, Zulu and Chinese students deal with the
difficulties of establishing fruitful dialogue in the university environment and
communicating effectively with others who do not necessarily share the same
cultural background. Cultural differences concern not only ethnicity, but also
other group cultures that relate to gender, age or generation and social status
(Scollon and Scollon, 2001: xii).

14
2.2.6 Cultural Barriers
Cultural differences cause cultural barriers. Sometimes the message is not
given explicitly. Albert (1996: 343) believes that miscommunication occurs
when the communication process does not go according to expectations.
When these expectations are not confirmed by the speaker‟s behaviour, the
listener is likely to develop a negative attitude about the speaker and this could
lead to stereotypes and prejudice.
The major cultural barriers to effective intercultural communication are as
follows:
Racism
Prejudice has been employed by cultures to oppress entire groups of
people and to make it virtually impossible for their members to have access
to political, economic and social power. In this form, prejudice is best
considered as racism (Lustig and Koester, 1993: 282).
Taylor and Katz (1988: 7) recognised that racism can occur at three
distinct levels: individual, institutional, and cultural.
At the individual level, racism is conceptually very similar to prejudice.
Individual racism involves beliefs, attitudes, and behaviours of a given
person toward people of a different racial group (Taylor and Katz, 1988: 7).
At the institutional level, racism is the exclusion of people of colour from
equal participation in the society‟s institutions (Blauner, 1972: 185).
Institutional racism is built into such social structures as the government,
schools, and industry practices. It leads to certain patterns of behaviours
and responses to specific racial or cultural groups that allow those groups
to be systematically exploited and oppressed (Lustig and Koester,
1993: 284).
At the cultural level, racism denies the existence of the culture of a

15
particular group (Jones, 1988: 118). Taylor and Katz (1988: 7) add that
cultural racism also involves the rejection by one group of the beliefs and
values of another, such as the negative evaluations by whites of black
cultural values.
Lack of Trust
According to Samovar et al. (2007: 316) the single most important trait
associated with people of character is their trustworthiness. Characteristics
often associated with the trustworthy person are integrity, honour, altruism,
sincerity, and goodwill. It is evident that trust between communicators is
very important. The general lack of trust that exists between two complete
strangers leads to an uncomfortable situation marred by doubt and
suspicion.
Ethnocentrism
Ethnocentrism is the tendency to believe that one's own race or ethnic
group is the most important and that some or all aspects of its culture are
superior to those of other groups (The Free Encyclopaedia, 2009). Lustig
and Koester (1993: 277) think all cultures have a strong ethnocentric
tendency, that is, the tendency to use the categories of one‟s own culture to
evaluate the actions of others. Ethnocentrism can occur along all of the
dimensions of cultural patterns. Because cultures teach people what the
world is really like and what is good, people consequently believe that the
values of their culture are natural and correct. Thus, people from other
cultures, who do things differently, are wrong. Ethnocentrism then becomes
an obstacle to intercultural competence.
Cultural Stereotyping and Prejudices
A stereotype is a type of logical oversimplification in which all the members
of a class or set are considered to be definable by an easily distinguishable
set of characteristics (The Free Encyclopaedia, 2009). They classify every

16
member of a culture or ethic group in the same way. They do not allow for
individual differences within the culture that they are stereotyping (Fielding,
1993: 444).
Stereotypes are therefore a form of generalization about a group of people.
When people stereotype, they take a category of people and make
assertions about the characteristics of all people who belong to that
category. The consequence of stereotyping is that the vast degree of
differences that exist among the members of any one group may be
overlooked and therefore not taken into account in the interpretation of
messages (Lustig and Koester, 1993: 278).
According to Dlomo (2003: 43) there are two main reasons for the
occurrence of stereotypes and prejudice in intercultural miscommunication.
One is that people expect the same behaviour in the target culture that they
find in their own culture. The second reason is that people often don‟t
realize that the same behaviour can be interpreted differently in two
cultures (Albert, 1996: 343).
Ethnocentrism, stereotyping and prejudice are so familiar and comfortable that
overcoming them requires a commitment both to learn about other cultures
and to understand one‟s own. Lustig and Koester (1993: 286) state that a
willingness to explore various cultural experiences without prejudgment is
necessary. Although no one can completely overcome the obstacles to
intercultural competence that naturally exist, the requisite knowledge,
motivation and skill can certainly help to minimize the negative effects of
ethnocentrism, stereotyping, prejudice and other barriers.
2.3 CULTURAL BACKGROUND OF CHINESE AND ZULU STUDENTS
History is very important in understanding intercultural relations and
intercultural communication (Martin and Nakayama, 2001: 234). According to
Neuliep (2006: 23) because the members of a particular culture share similar
values, beliefs, and behaviours, they are identifiable as a distinct group. He

17
adds that in addition to their shared values, beliefs and behaviours, the
members of a particular culture share a common history. Any culture‟s past
inextricably binds it to the present and guides its future. At the core of any
culture are traditions that are passed on to future generations (Neuliep,
2006: 23).
The history of intercultural communication is important in understanding the
character of a culture. Samovar et al. (1998: 111) state that our interest in the
study of history is predicated on two assumptions. First, historical events
explain the character of a culture. Second, what a culture seeks to remember
and pass on to the next generation tells us about the character of that culture.
Samovar et al. (2007: 70) further explain the deep structure of a culture, which
include such elements as family, history (country), and religion (worldview), are
important because they carry a culture‟s most important beliefs. Their
messages endure, are deeply felt, and help supply much of a culture‟s identify.
Therefore in the following paragraphs, the Chinese and Zulu history will be
introduced to show the character of culture.
2.3.1 Chinese Culture
According to Mente (2000) China is home to one of the world's oldest and most
complex civilizations covering a history of over 5000 years. The nation covers
a large geographical region with customs and traditions varying greatly
between towns, cities and provinces. Chinese culture is a broad term used to
describe the cultural foundation, even among Chinese-speaking regions
outside of mainland China.
Many ethnic groups have existed in China. In terms of numbers, however, the
dominant ethnic group is the Han Chinese. Throughout history, many groups
have been assimilated into neighbouring ethnicities while others have
disappeared without a trace. At the same time, many within the Han identity
have maintained distinct linguistic and regional cultural traditions.
According to Etiquette in China (2009), China has often been referred to as the

18
Nation of Etiquette. According to many westerners, however, Chinese people
often act in what appears to be a discourteous manner. The reason for this
anomaly lies in the different cultural and historical views of social decorum. In
order to avoid mistakes and embarrassment during communication, a better
understanding of Chinese etiquette is essential (Etiquette in China, 2009).
2.3.1.1 Humility
Most social values are derived from Confucianism and Taoism combined with
conservatism (Baidu, 2007). Behaviours associated with humility are very
important in China (The free encyclopedia, 2009). For example, etiquette might
demand that a great cook must serve a variety of foods when hosting friend,
but the host should not boast about his skill in cooking or he might be viewed
as being arrogant. Also people don‟t like the display of wealth. In the west one
may readily accept a compliment from other people, but it is common practice
for the Chinese to reject a compliment to show their humility. Humility is a
traditional virtue of the Chinese (The free encyclopedia, 2009).
2.3.1.2 Elders
According to The free encyclopedia (2009), special respect is paid to older
people in many circumstances in China. This can include standing when older
people enter a room, always greeting older people first before greeting others
present.Touching the head, shoulders or back of an older person can be
considered disrespectful even if the intent is to comfort or indicate affection.
Older people are rarely referred to by first names; they are addressed as Mr or
Mrs. Sometimes terms such as „uncle‟ or „auntie‟ are appropriate for older
non-relatives (The free encyclopedia, 2009).
2.3.1.3 Touching
The Chinese don't like physical contact, especially when doing business. Be
sure not to slap, pat or put an arm around someone‟s shoulders if you are just
a friend.

19
2.3.1.4 Handshaking
Handshaking is considered to be a formal greeting in China. It is used to show
respect, but only if the person is someone important, like a government official
or a businessman. Otherwise a smile or a friendly nod is sufficient (Etiquette in
China, 2009).
2.3.1.5 Gift Giving
According to Etiquette in China (2009) 'courtesy demands reciprocity', goes an
old Chinese saying, and the advice is an indispensable part of social
interactions. It is important to both private and business relationships. When
meeting a Chinese person for the first time, the best choice for the initial
meeting is a gift that expresses some unique aspect of your country. The gift
packaging should be red or any other festive colour. White or black packaging
is ominous and should be avoided. It is not proper, and is even considered to
be unfortunate, to give a clock or anything to do with the number four as a gift
because four sounds like “death” in Chinese. Do not brag about the gift in front
of the recipient. A person should use both hands when presenting it. Generally,
the recipient may graciously refuse the present when first offered. In this case,
one should correctly assess the situation and present it once again. If the
recipient did not open the gift, it does not mean that he or she is not interested
in it, as it is polite to open the gift after the guest has left (Etiquette in China,
2009).
2.3.1.6 Family Visiting
In China, a gift is also necessary when visiting a member of the family, but it is
not as complex as the above situation. Usually, flowers, common fruits and
food are given as gifts (Etiquette in China, 2009).
20
2.3.2 Zulu Culture
According to Sosibo and Harvey (2000), the Zulu people have a distinct culture
that distinguishes them from other ethnic groups. They hold yearly ceremonies
to revive their culture and tradition. These ceremonies include, among others,
Heritage Day, which is held to celebrate the life of Shaka Zulu, the most
powerful king and creator of the Zulu nation (Sosibo and Harvey, 2000). What
also distinguishes the Zulu people from other cultures, is the traditional foods,
brewing of beer, ancestral worship, places of burial, the dress code for men,
women and children, the importance of a man's cattle, the system of
compensating a father for the loss of his daughter in marriage, courtship,
witchcraft and their superstitions (Far & Wild Safaris, 2003).
2.3.2.1 Zulu Traditions
According to Zulu Traditions & Culture (2007), Zulu woman always pass an
artefact to another using her right hand only. The palm of the left hand will be
under the right forearm. This custom is significant and serves to assure you
that there are no hidden weapons and you have nothing to fear from her (Zulu
Traditions & Culture, 2007).
A popular souvenir for visitors is Zulu beadwork. One of the most fascinating
manifestations of this traditional craft is its unique language (Zulu Cultural Tour,
2009). Every colour has a different meaning and a Zulu woman can weave a
message of love, grief, jealousy, poverty or uncertainty into her patterned
creation. Young Zulu girls in particular, use the vocabulary of the beads to
send sweet (or bitter) thoughts to their loved ones (Zulu Cultural Tour, 2009).
The military influence of the Shaka regime is reflected in demonstrations of
stick fighting with which male teenagers and men settle their personal
differences in a public duel (Zulu Traditions & Culture, 2007). A spiritual healer
plays a respected and meaningful role in the life of a Zulu community by using
roots, herbs, bark, snake skins and dried animal parts to reveal the past,
predict the future and cure ailments (Zulu Traditions & Culture, 2007).

21
2.3.2.2 Etiquette
- Greeting: Sawubona (Hello), response: Yebo, Sawubona, is the greeting in
Zulu culture (Zulu Culture, 2008).
- Eye contact: Excessive eye contact is considered to be provocative and is
avoided, particularly between women and men (Zulu Etiquette, 2006).
- Handshake: A handshake takes the following form: firstly the conventional
shake, then clasping thumbs around thumbs and finally another conventional
handshake (Zulu Culture, 2008).
- Walking: Wives walk behind their husbands who, should they encounter
another man, pass him on the left enabling both to see the other's weapons
(Zulu Culture, 2008).
- Seating: Men always sit on the right of the hut with those of highest standing
at the rear. One is always expected to sit on a hide or shield (Zulu Culture,
2008).
- Eating: Eating is hygienic, each member using his own plate and utensils.
Hands are washed before eating and mouths are washed after eating.
The men are served first according to their standing, then the women, then the
children, boys before girls (Zulu Culture, 2008).
2.3.2.3 Traditional Clothes
According to Sosibo and Harvey (2000), a Zulu woman‟s traditional clothes
include beadwork. Men‟s traditional clothing consists mainly of cowhide that is
used to cover the bottom front and back. Traditionally, women and men walk
barefoot when they wear these clothes (Sosibo and Harvey, 2000).

22
2.4 LANGUAGE AND INTERCULTURAL COMMUNICATION
Culture shapes the way people express themselves, verbally or nonverbally
(Dlomo, 2003: 15). Neuliep (2006: 15) also indicates that the verbal and
nonverbal symbols we use to communicate with our friends and families are
strongly influenced by our culture. Perhaps the most obvious verbal
communication difference between two cultures is language. Language to a
large extent determines thought patterns. There seems to be no question that
languages are as much culturally based as they are innate and that language
is a part of the culture. It expresses cultural values but also to some extent
determines culture (Kaschula and Anthonissen, 1995: 26).
According to Pearson et al. (2006: 45) language is a collection of symbols,
letters or words with arbitrary meanings which are governed by rules and are
used to communicate.
Samovar and Porter (1982: 17) state that language gives people a means of
interacting with other members of their culture and a means of thinking. They
add that cultural diversity in language behaviour is perhaps one of the most
difficult and persistent problems encountered in intercultural communication
(Samovar et al., 1998: 121). The following paragraphs examine the link
between language and culture and investigate the language-based barriers to
communication.
2.4.1 Language Varieties
Kaschula and Anthonissen (1995) found that in all communities, language
varies. Language varieties include different: accents, linguistic styles,
pronunciations, register, lexicon and even different grammatical rules which
may contrast with each other for social reasons (Holmes cited in Dlomo,
2003: 21). That is perhaps the reason why Chinese students at selected HEIs
in Durban have trouble with English because they first learnt the British version
and then came to the South Africa where they encountered a different form of
English. The multiple meanings of words and the use of slang that may or may

23
not sound like dictionary words are confusing. Add to that mixture a different
culture and a different set of language rules as well as numerous new
experiences, and it‟s easy to see why non native speakers experience
problems with their language use.
According to Dlomo (2003: 20) language varieties can cause communication
problems when people who use these varieties have to interact. These
problems can be further complicated by the fact that these varieties are linked
to culture. Language influences thought and thought influences language, and
each is influenced by culture. One may find that people from different cultures
may speak the language on different levels of fluency. These varieties also
influence the one‟s perception of the messages one receives from others.
Dlomo (2003: 19) believes that English varieties that are used by different
groups are influenced by their mother tongue and their culture. Kaschula and
Anthonissen (cited in Dlomo, 2003: 17) believe that one‟s mother tongue
provides one with a series of categories which form a framework for one‟s
perception of things.
Each person speaks somewhat differently from all others. All of these
differences relate to their different language styles and different behaviours
which are related to their different cultural backgrounds, beliefs and other
factors. Seiler and Beall (2008: 100) mention that communicators should also
be aware that there are cultures that have greater or lesser expectations for an
individual‟s involvement in communication events. Students in China for
example, are expected to listen to their professors and not ask questions
during class unless the professor gives them permission to become involved.
The Chinese culture seems to prefer low involvement on the part of the
students. In South Africa, students are expected to have high involvement in
the learning process and are encouraged to ask questions and participate.
It is acknowledged that the English language is used as a medium of
instruction throughout South Africa (Njobe, 2007: 2). Chinese students speak
English as a foreign language at HEIs in South Africa and the majority of the

24
Zulu students speak English as a second, third language or foreign language.
According to Kaschula and Anthonissen (cited in Dlomo, 2003: 6) speakers
from different cultures have varying degrees of linguistic and communicative
competence in English. These levels of communicative and linguistic
competence have a major impact on the fluency of the speakers in the spoken
language.
Due to the lack of a natural learning environment, Chinese students have more
difficulties in learning English, especially in terms of pronunciation and oral
skills. Speaking has long been recognised as the most difficult skill for Chinese
students of English to acquire or master (Wang, 1999). Chinese students have
an accent when they speak English. This confuses Zulu students. Zulu
students also have accents and they have certain sounds which are not
available in English, for example clicks like „c‟, „q‟, „gq‟ and „xh‟ (Dlomo,
2003: 7). This creates a problem for Chinese student as they cannot
pronounce Zulu students‟ names fluently. It is considered rude behaviour by
Zulu students if one does not call them by their names. Because so many
variations in terms of accents, dialects, and regional peculiarities exist in the
English language, messages are often misunderstood even when both parties
speak the same language. Unfamiliar accents may also present barriers to
effective communication.
2.4.2 Language-Based Barriers to Communication
Communication is a symbolic interaction rich in subtlety. It will never be strictly
concrete or objective and thus always carries the potential for
misunderstanding (Seiler and Beall, 2008: 92). Some of the most common
language-based barriers to effective communication are:
2.4.2.1 Meanings Can Be Misunderstood
What is meant by a speaker and what is heard and understood by the listener
often differ. Such misunderstanding between a sender and a receiver is called
bypassing. Bypassing usually results from the false belief that each word has

25
only one meaning and that words have meaning in themselves (Seiler and
Beall, 2008: 92-93).
According to Seiler and Beall (2008: 93) the interpretation of words becomes
even more complex when people from different cultures exchange everyday
communication. The problem is magnified when someone uses common
phrases that are unfamiliar to non native speakers of English. For instance,
sometimes Zulu students would say “see you later” instead of “goodbye”. But
Chinese students will misunderstand they will really meet a little bit later. In this
case, bypassing occurs because of cultural differences between the two
speakers.
2.4.2.2 Language Can Cause Polarization
Accoring to Seiler and Beall (2008: 96) polarization is the tendency to view
things in terms of extremes – rich or poor, beautiful or ugly, good or bad – even
though most things exist somewhere in between. They explain polarization can
be destructive, escalating conflict to the point where two parties simply cannot
communicate. This escalation is referred to as the pendulum effect. They
further explain that when two individuals disagree in their perceptions of reality,
their pendulums begin to move in opposite directions. The distance the
pendulum swings represents their differences in opinion or conviction. As the
conversation intensifies, each remark provokes a stronger reaction from the
party to whom it is directed until both parties are driven to positions at opposite
extremes (Seiler and Beall, 2008: 96).
2.5 RELATIONSHIP BETWEEN NONVERBAL BEHAVIOUR AND
CULTURE
According to Seiler and Beall (2008: 114) nonverbal communication is related
to culture. Neuliep (2006: 15) refers to culture as having a dramatic effect on
nonverbal communication. Nonverbal symbols, gestures, and perceptions of
personal space and time vary significantly from culture to culture.
Communication is the dynamic process of encoding and decoding verbal and

26
nonverbal messages within a defined cultural, physiological, socio-relational
and perceptual environment. Although many of our messages are sent
intentionally, many others, perhaps our nonverbal messages can
unintentionally influence others (Neuliep, 2006: 15).
Neuliep (2006: 23) adds that nonverbal communication includes the use of
body language, gestures, facial expressions, voice, smell, personal and
geographical space, time and artifacts.
Body language has different meanings in different cultures. The way people
interpret body language depends on the situation at hand, the culture, the
relationship they have with the person as well as the gender of the other. For
instance, the way people make eye contact can communicate different and
important messages across cultures. In the Zulu culture, excessive eye contact
is considered to be provocative and is avoided, particularly between women
and men. However in Chinese culture eye contact shows that people are
listening seriously. Nonverbal expressions are culture specific and these
differences may therefore create barriers in the communication process.
2.5.1 Types of Nonverbal Behaviour
Dlomo (2003: 45) explains three ways in which nonverbal behaviour differs
from culture to culture. These differences are as follows:
Firstly, cultures differ in the specific repertoire of behaviours that are enacted
(Lustig and Koester, 1993: 187). Movements, body positions, postures, vocal
intonations, gestures, dress codes, spatial movements, dances and other
ritualized actions are specific to a particular culture (Dlomo, 2003: 45).
Secondly, all cultures have display rules that govern when and under what
circumstances various nonverbal expressions are required or prohibited
(Dlomo, 2003: 46). Display rules indicate such things as how far apart people
should stand while talking, whom to touch and where. These rules also
indicate the speed and timing of movements and gestures, when to look

27
directly at others in a conversation and when to look away, whether loud
talking and expansive gestures or quietness and controlled movements should
be used, when to smile and when to frown, and the overall pacing of
communication (Lustig and Koester, 1993: 188).
Thirdly, cultures vary in the interpretation of meanings that are attributed to
particular nonverbal behaviours (Lustig and Koester, 1993: 188). Lustig and
Koester (1993: 188) identify three possible interpretations that can be ascribed
to a given instance of nonverbal behaviour. They state that nonverbal
behaviour can either be random, idiosyncratic, or shared. An interpretation that
the behaviour is random means that it has no particular meaning to anyone,
like the ordinary blinking of the eyes, which everyone does because of the
inherent physiological nature of human beings. An idiosyncratic interpretation
suggests that the behaviours are unique to special individuals or relationships,
and they therefore have particular meaning only to these specific people. The
third interpretation, which is more relevant to intercultural communication, is
that the behaviours have shared meaning and significance, like when a group
of people jointly attribute the same meaning to a particular nonverbal act
(Lustig and Koester, 1993: 188).
2.5.2 Characteristics of Nonverbal Behaviour
According to Dlomo (2003) there are three important characteristics of
nonverbal behaviour. The first is that it is multi-channelled. This means that it
uses a number of mediums to send a message to the receiver, e.g. body
movements, facial expressions, touch, paralinguistic features, space and
territory, time, etc. Messages can be sent using either one of these channels or
a combination of different body movements (Samovar et al., 1998: 153). For
instance, a person may wave a hand to someone and smile at the same time
within one message context. When the person interprets this message s/he
will focus on the totality of the message and the context in which it is used
(Dlomo, 2003: 41).
According to Dlomo (2003: 42) the second characteristic of nonverbal cues is

28
that they are sometimes ambiguous. There can be two or more interpretations
and meanings offered for one nonverbal cue, depending on the context of the
communication, the cultures of the participants and their affective mode.
Singelis (cited in Dlomo, 2003: 42) confirms this view by saying that the
meaning of nonverbal behaviour is, most of the time, determined by the
receiver, who seldom confirms it with the sender. In other words, the meaning
depends on the interpretation that the receiver wants to attach to the nonverbal
cues displayed by the communicator. For instance, one rarely asks the
speaker to repeat the gaze or the eye-movement the speaker has just
displayed in order to confirm one‟s interpretation, but with verbal behaviour it is
acceptable to ask the speaker to repeat the statement s/he has just uttered so
that one can clearly understand what has been said.
The third characteristic that is stated by Singelis (cited in Dlomo, 2003: 42)
relates to the unintentional and spontaneous nature of nonverbal behaviour.
People use nonverbal behaviour to make unconscious decisions about the
nature of the relationship that exists between two or more people who are
involved in communication. The onlookers can interpret the gestures and body
language used by participants as indicating the type of relationship that they
have with each other. Generally, people interpret physical closeness to mean
an intimate or friendly relationship, the opposite is true where there is physical
distance between them. But this situation can have other interpretations in
different cultures. Occasionally, people may behave in ways which give a
different message to others about their emotional and mental state from what
was intended. A situation like this will lead to misinterpretation of the sender‟s
intentions, thus causing miscommunication (Dlomo, 2003: 43).
2.5.3 Roles of Nonverbal Communication
Mitchell (2005: 181) identifies six major communication roles in nonverbal
communication that are closely related to verbal communication. The six roles
are repetition, contradiction, substitution, accentuation, complement, and
regulation (Mitchell, 2005: 161).

29
The first role of nonverbal communication is repetition. Nonverbal
communication often reinforces what is also being conveyed in the verbal code
(Mitchell, 2005: 161). By repeating the verbal message nonverbally, there is a
better chance that the message will be clear to the audience (Mitchell,
2005: 161). But most repeated messages are sent without much thought. They
are simply a natural part of people‟s communicative behaviour (Seiler and
Beall, 2008: 117).
Contradiction is the second role of nonverbal communication. Although
nonverbal messages often repeat and thus support our verbal messages, they
may also contradict them. When people purposely mislead others by using
nonverbal cues to create false impressions or to convey incorrect information,
it is referred to as contradiction (Seiler and Beall, 2008: 117).
The third role played by nonverbal communication is substitution. Using
nonverbal messages in place of verbal messages is known as substituting
(Seiler and Beall, 2008: 117). It is common when speaking is impossible,
undesirable, or inappropriate. These nonverbal ways of expression do not
require any verbal communication to get their meaning across and in that
sense can be viewed as substituting for a verbal message (Mitchell,
2005: 161).
Accentuation is another role of nonverbal communication. Sometimes
nonverbal cues do much more than just repeat a verbal message. They
emphasize it and bring increased meaning to what has been said.
Nonverbal cues can be used to complete, describe or accent verbal cues. This
use is called complementing (Seiler and Beall, 2008: 116). The complementary
nonverbal cues are used to accent verbal behaviour by emphasizing or
punctuating the spoken words. This complementary redundancy helps people
to communicate effectively.
The last role of nonverbal communication is regulation. Nonverbal
communication is also used for controlling the flow of communication, a

30
behaviour known as regulating (Seiler and Beall, 2008: 117). According to
Seiler and Beall (2008: 117) senders might not even realize that they are
sending regulating cues but receivers are usually aware of such signals. In this
way, nonverbal communication shapes and changes the flow of a
conversation.
2.5.4 Types of Nonverbal Communication
According to Seiler and Beall (2008: 119) because nonverbal communication
is diverse, complex, common, and informative, people need to be sensitive to
its many manifestations. In this study, some of the more significant forms of
nonverbal communication such as proxemics (space), haptics (touch), kinesics
(body movements including gestures, facial expressions, and eye behaviour)
will be examined.
2.5.4.1 Space
According to Bi (1999: 128) there are four main distances in American social
and business relations: intimate, personal, social and public. Intimate distance
is for people whose relation and activities are private and close, for example,
distance between a husband and wife. The range of intimate distance is about
45 centimeters. Personal distance is about 45 - 80 centimeters and used
among common friends, acquaintances and relatives. Social distance maybe
anywhere from about 1.30 meters to 3 meters, for people who work together,
who do business together, or those in conversation at social gatherings who
tend to keep a distance farther than any of the above (Bi, 1999: 128). Culture
creates a wealth of differences in the way individuals use distance for
communication. The important thing is to recognize that not all cultures view
distance in the same way.
2.5.4.2 Touch
According to Seiler and Beall (2008: 126) touching is referred to as either

31
tactile communication or haptics. Haptics is one of the most basic forms of
communication.
Some researchers have set up categories to describe these variations in
touch. The categories are functional-professional, social-polite, friendship-
warmth, love-intimacy, and sexual arousal (Seiler and Beall, 2008: 126).
The meaning of a particular touch depends on the type of touch, the situation
in which the touch occurs, who is doing the touching, and the cultural
background of those involved. Some cultures are more prone to touching
behaviour than others. For example, in Zulu culture, many women hug and
kiss, it also occurs frequently between husband and wife and other members
of the family. In China, though, this action is seldom seen as they just shake
hands. The matter of physical contact between members of the same sex is
also a delicate issue in China.
2.5.4.3 Body Movements
People use body movements like gestures, facial expressions, and eye
behaviour to create an infinite number of nonverbal messages.
- Eye Behaviour
Eye behaviour is a subcategory of facial expressions that includes any
movement or behaviour of the eyes and is also referred to as oculesics, which
is the study of the eye movement or eye behaviour (Seiler and Beall,
2008: 119). The primary function of establishing relationships may be made
through eye contact.
- Facial Expressions
Facial expressions include configurations of the face that can reflect, augment,
contradict, or appear unrelated to a speaker‟s spoken message (Seiler and
Beall, 2008: 119).

32
Facial expressions are windows to our emotions. They provide clues about
people‟s emotional states which at times can be very complex and difficult to
interpret accurately (Seiler and Beall, 2008: 120).
- Gestures
Gestures can be particularly troublesome, as a slight difference in making the
gesture itself can mean something quite different from that intended. A wrong
interpretation of a gesture can arouse quite unexpected reactions. For
example, Zulu students have varied and their own style of handshaking when
they meet, but Chinese students do not know this and are not good at these
handshake greetings.
2.6 COMMUNICATION 2.6.1 Understanding of Communication
According to Lustig and Koester (1993: 25) to understand intercultural
communication events, one must study the more general process involved in
all human communication transactions. In this section, the transactional model
will be used to describe and examine the process of communication in order to
achieve and understand the nature of communication. This model will also be
used to analyze the communicator, recipients and the message. The model
will further investigate the interaction between the participants in this study to
provide a basis for investigating the intercultural communication barriers
between Zulu and Chinese students at selected HEIs in Durban.
Pearson et al. (2006: 9) defined communication as the process of using
messages to generate meaning. Communication is considered a process
because it is an activity, an exchange, or a set of behaviours.

33
2.6.2 From The Transactional Communication Model to Intercultural
Communication Intercultural communication is a symbolic, interpretive, transactional,
contextual process in which people from different cultures create shared
meanings (Lustig and Koester, 1993: 51). According to Samovar et al.
(1998: 25), the study of intercultural communication is both the study of culture
and communication. The relationship between communication and culture is
also explored by Potlane (1991: 18) who says communication is a process
through which a group‟s culture is transmitted from one generation to the next
or from one group to another (Dlomo, 2003: 15). Culture shapes
communication and communication is culture bound (Neuliep, 2006: 15).
In chapter one, Verderber‟s Transactional Communication Model was
discussed briefly. To suggest that communication is transactional implies that
all participants in the communication process work together to create and
sustain the meanings that develop. A transactional view holds that
communicators are simultaneously sending and receiving messages at every
instant that they are involved in conversations (Lustig and Koester, 1993: 25).
According to Lustig and Koester (1993: 25) the transactional view of
ccommunication emphasizes the construction or shared creation of messages
and meanings. The transactional view recognizes that the goal of
communication is not merely to influence and persuade others but also to
improve one‟s knowledge, to seek understanding, to develop agreements, and
to negotiate shared meanings.
The transactional view also recognizes that multiple messages are
simultaneously being interpreted by participants at the same time. These
messages include not only the meaning of the words that are said but also the
meaning conveyed by the tone of voice, the types of gestures, the frequency of
body movements, the motion of the eyes, the distances between people, the
formality of the language, the seating arrangements, the clothing worn, the
length of pauses, the words unsaid, and much more. Thus, in the transactional

34
view it is impossible to describe one person as exclusively the sender and the
other as exclusively the receiver.
Figure 2.2: A Transactional Model of Communication
(Source: Verderber, 1990)
This model can be applied into a conversational situation between Zulu and
Chinese students. Both of them assume the role of sender and receiver since
both are encoder and decoder of messages. As they send messages back and
forth they are constantly changing roles. As they continue the transactions,
they arrive at an understanding. However, the sender and receiver do not
share all their experiences and meanings (Fielding, 1993: 18) because of the
factors surrounding the message such as background, culture, value.
Therefore communication is a dynamic process, as the variables in the
process are interrelated and influence each other (Berlo cited in Jandt,
2004: 30).
The following section introduces ten components of communication as they
relate to this study.
Noise Noise
Background, Culture Culture, Background
Experience, Value Sending Channel Value, Experience
Occupation Encoding Decoding Occupation
Attitudes Decoding Encoding Attitudes
Feelings Feedback Channel Feelings
Knowledge, Sex Sex, Knowledge
COMMUNICATOR CONTEXT RECIPIENT
Message Message

35
2.6.3 Components of Communication
According to Jandt (2004: 30), there are ten components of communication:
source, encoding, message, channel, noise, receiver, decoding, receiver
response, feedback and context.
2.6.3.1 Source
When people want to communicate, there must be an idea he or she desires to
communicate, that is the “source” (Jandt, 2004: 30). This “source” is the
purpose of the communication. According to Steinberg (2007: 19) it is
generally agreed that we communicate with some purpose, that is, to satisfy a
personal or social need. For example, Chinese students need to communicate
in order to make friends with Zulu students. The “source” also can be the
physical and psychological needs. We communicate with others because we
have basic physiological needs to fulfil in order to survive (food, water, air and
shelter) (Steinberg, 2007: 19). He adds that to develop and maintain
relationships with others is another prime purpose for communication
(Steinberg, 2007: 19).
People also need to communicate when they want to obtain and share
information with others, for example, when Chinese and Zulu students want to
talk about an interesting topic, they need to communicate; or when they want
to make a decision together with others, for example Chinese and Zulu
students need to discuss something during team work, or when they want to
persuade others to think the way they think.
2.6.3.2 Encoding
Humans are not able to share thoughts directly. Their communication is in the
form of a symbol representing the idea they desire to communicate. Encoding
is the process of putting an idea into a symbol (Jandt, 2004: 30). As Steinberg
(2007: 30) explains, people always formulate their thoughts in “concepts”, i.e. a
word to which all scientists in a field of study assign the same meaning so that

36
they can understand each other. People should encode their mental image or
concept before they communicate. A simply example is when Chinese
students want to talk with Zulu students, they cannot just speak Chinese, they
must encode their language into a common language, i.e. English, and then
share the idea with the Zulu students.
2.6.3.3 Message
The term message identifies the encoded thought. Encoding is the process,
the verb and the message is the resulting object (Jandt, 2004: 30). The
message can be oral or written or nonverbal such as a smile or a nod.
2.6.3.4 Channel
The term channel is used technically to refer to the means by which the verbal
or nonverbal encoded message is transmitted (Jandt, 2004: 30). Sometimes
there are barriers in terms of the channel. As Steinberg (2007: 41) says,
people who speak the same language understand one another because they
usually ascribe similar meanings to word, but in this study, communicators who
speak different mother tongues use the medium of English to communicate, so
barriers exist. Although nonverbal signs have socially shared meanings, such
meanings are not always universal (Steinberg, 2007: 41).
2.6.3.5 Noise
Noise refers to anything that distorts the message.
Jandt (2004: 31) indicates that noise can be in many forms: external noise can
be the sights, sounds, and other stimuli that draw your attention away from the
message; internal noise refers to your thoughts and feelings that can interfere
with the message; “semantic noise” refers to how alternative meanings of the
sources message symbols can be distracting.
Figure 2.2 (on page 34) shows “internal noise” and “semantic noise” for
example people‟s background, communicator‟s culture, home language,
37
experience, value, attitudes, feelings and knowledge, even gender can affect
message construction.
The receiver and the sender in this study can be Chinese students or Zulu
students, the people who attend to the message. The sender comes from a
specific cultural background. This background means that the sender has a
specific language and view of the world, giving him or her certain experiences
and ideas of how to do things. The receiver might not have the same culture or
language background. Communication between the two may therefore be
difficult unless each is sensitive to the other‟s needs. For example one may
have a strong need for recognition, whereas another may have a need to get
the work done as quickly as possible. Their goals would therefore differ and
communication might be difficult.
All the above are examples of “noise” during intercultural communication.
2.6.3.6 Decoding
Decoding is the opposite process of encoding and just as much an active
process. The receiver is actively involved in the communication process by
assigning meaning to the symbols received (Jandt, 2004: 32), but
communicators can decode in different ways. As Seiler and Beall (2008: 88)
explain words mean different things to different people, based on each
person‟s experiences and the direct relationship of those experiences to
particular words.
2.6.3.7 The Receiver’s Response
The receiver‟s response refers to anything the receiver does after having
attended to and decoded the message. That response can range from doing
nothing to taking some action or actions that may or may not be the action
desired by the source (Jandt, 2004: 32). For example, the Zulu receivers‟
response to a compliment may be pleasure and to say “thank you”, but some
Chinese receivers would refuse this compliment. Therefore, if a Zulu

38
communicator gives a Chinese person a compliment, the response of the
Chinese person may not be the action desired by the Zulu person.
2.6.3.8 Feedback
According to Jandt (2004: 33) feedback refers to that portion of the receivers
response to which the source has knowledge and to which the source attends
and assigns meaning. Feedback makes communication a two-way or
interactive process (Jandt, 2004: 33). In face-to-face communication, feedback
will be direct. Both sender and receiver will be giving constant feedback to
each other as they exchange messages. If the sender is delivering a speech,
s/he needs to be sensitive to the audience‟s reactions and questions as these
are ways of receiving feedback. A good communicator should always be
sensitive to feedback, and should constantly adjust her or his message as a
result of the feedback (Fielding, 2006: 23).
It is important for communicators to arrange for and receive feedback.
According to Fielding (2006: 24) senders and receivers should always arrange
for feedback and be prepared to receive feedback, even if it is negative.
Feedback tells the sender how the receiver has interpreted the message.
2.6.3.9 Context
Context can be defined as the environment in which the communication takes
place and which helps define the communication (Jandt, 2004: 33).
The component of context helps to recognize the extent to which the source
and receiver have similar meanings for the communicated symbols and similar
understandings of the culture in which the communication takes place which
are critical for the success of communication (Jandt, 2004: 33).

39
2.7 CONCLUSION
This chapter introduced Zulu and Chinese cultures. It was evident that cultural
differences exist between these two cultures. Differences among cultures
produce motivations that inhibit people as they communicate interculturally
(Lustig and Koester, 1993: 96). Therefore, cultural differences created
intercultural communication barriers.
Language, culture, and thought are bound together. Effective communicators
are aware of how to interact with people from other cultures. Competent
communicators avoid unfamiliar words, seek to be sensitive toward another‟s
culture and command of the language and exercise patience in an effort to
create and share understanding. The words and manner of speaking people
choose to use can make their ideas clearer and more meaningful
People communicate with each other not only through verbal communication
but also through nonverbal communication, moreover, the latter plays an
essential role. Verbal and nonverbal communication individually may help one
to understand the source of certain intercultural difficulties, but in the long run
intercultural communication may be better understood if people consider both
forms of communication and their relationship with each other.
In most cases, miscommunication is a result of nonverbal behaviour and may
be attributed to cultural rather than individual differences because culture plays
a major role in the display of nonverbal behaviour.
Chapter three will present an outline of the research design and the
methodology of this study. The data collection instruments to be used will be
described. The sample, design and sampling method techniques employed
during the study will also be addressed.

40
CHAPTER THREE – RESEARCH METHODOLOGY
3.1 INTRODUCTION
This chapter outlines the methodology that was used in this study. This chapter
commences with a review of the research methodology. It discusses how the
research was designed, provides insight into the sampling method, the
questionnaire and other techniques used. The ethical issues were also
considered.
3.2 RESEARCH DESIGN
Research is an organized, systematic, data-based, critical, objective, scientific
inquiry or investigation into a specific problem, undertaken with the purpose of
finding answers or solutions to it (Sekaran, 2006: 5). According to Welman and
Kruger (1999: 46), a research design is the plan according to which we obtain
research participants (subjects) and collect information from them. It includes
the aims of the research, the final selection of the appropriate methodology,
the data collection techniques to be used, the chosen methods of data analysis
and interpretation and how all this fits in with the literature (White, 2000: 25).
According to White (2000: 25) two important concepts that must be built into
the design are validity and reliability. Validity is concerned with the idea that
the research design fully addresses the research questions and objectives one
is trying to answer and achieve. Reliability is about consistency and research
and whether another researcher could use the design and obtain similar
findings (White, 2000: 25).
In this study, internal validity was checked against the related literature review
to measure the accuracy of the measurement instrument which had been
chosen. A representative sample of the population was chosen to ensure
external validity (Abbu, 2006: 63). Attempts were made to select as large a
sample as possible. To ensure reliability within this process, attempts were

41
made to prepare a well designed questionnaire and the observation was
carefully planned. Validity was checked by pre-testing. A pilot study was
conducted to test the questionnaire among ten Chinese students and ten Zulu
students at DUT and UKZN and the results were analysed by a statistician.
3.3 RESEARCH APPROACH AND STRATEGY
The objective of this study is to identify intercultural communication barriers
that exist between Zulu and Chinese students at university level and to identify
strategies to overcome these barriers.
According to Saunders, Lewis and Thornhill (2003: 92) the survey strategy is
usually associated with the deductive approach. They allow the collection of a
large amount for data from a sizeable population in a highly economical way.
Often obtained by using a questionnaire, these data are standardised, allowing
easy comparison. In addition the survey strategy is perceived as authoritative
by people in general. This is because it is easily understood. They add that
using a survey strategy should provide more control over the research process
(Saunders et al., 2003: 85). However, it is not the only data collection method
that belongs to the survey strategy. Structured observation, the type most
frequently associated with organization and methods of research can also be
used.
3.4 DATA SOURCES
According to Sekaran (2006: 219) data can be obtained from primary or
secondary sources. Primary data refers to information obtained firsthand by
the researcher on the variables of interest for the specific purpose of the study.
Secondary data refers to information gathered from sources already existing.
Examples of secondary sources include internet sites and web pages; studies
and reports of institutions and departments such as universities, language
departments and other research institutes, chambers of commerce and foreign
missions such as embassies and consulates; textbooks and other published
material directly or indirectly related to the problem area; academic as well as

42
organizational journals and newsletters relevant to the problem area; census
reports on demographics from university faculty; and, theses and reports
written by other students in the university and in other institutions.
Secondary data alone cannot help to answer the research questions. In this
study, primary data were collected from observations and a survey relevant to
this particular study and its research problem.
3.5 DATA COLLECTION APPROACHES
Collecting data is frequently regarded as one of the core activities in the
research process (Blaikie, 2000: 30). Primary data collection in this study
helped the researcher identify whether there are problems between Chinese
and Zulu students when they communicate with each other and to find out
what these problems are. It also helped the researcher to find the differences
between Chinese and Zulu students‟ daily behaviours, customs.
3.5.1 Qualitative and Quantitative Methods
This study used both qualitative and quantitative methods. Qualitative
research is a descriptive, non-numerical way to collect and interpret
information (White, 2000: 28), the kind of data required to answer the proposed
questions in this study. Qualitative research carried out for this study include of
observations and questionnaires which will be discussed in more detail in the
next section.
In the quantitative method, results are given numerical values and the
researcher used a mathematical and statistical treatment to help evaluate the
results (White, 2003: 24). The survey approach, using questionnaires were
conducted in this study where responses were given numerical values.
3.5.2 Collecting Primary Data through Observation
Observation as a data collection tool entails listening and watching other
people‟s behaviour in a way that allows some type of learning and analytical

43
interpretation (Ghauri and Gronhaug, 2002: 90).
In non-participant observations, the observer or researcher observes a natural
setting but is not part of the situation her/himself (Ghauri and Gronhaug,
2002: 91). In this study, the non-participant observation method was used. The
researcher observes Chinese and Zulu students to find the differences
between their daily behaviours, customs.
3.5.2.1 Observation Design and Content
According to Sekaran (2006: 252) observation means that the observer has a
predetermined set of categories or activities or phenomena planned to be
studied. According to Saunders et al. (2003: 221) if your research question(s)
and objectives are concerned with what people do, an obvious way in which to
discover this is to watch them do it. This is essentially what observation
involves: the systematic observation, recording, description, analysis and
interpretation of people‟s behaviour (Saunders et al., 2003). In this study, the
non-participant observation method was used. Formats for recording the
observations can be specially designed and tailored to suit the goal of the
research.
In this study some situations such as daily behaviours, customs, and
characteristics of verbal and nonverbal communication patterns of Chinese
and Zulu students were observed.

44
Observation focused on the following areas:
Types Focus on Group
Zulu
Respondents
Chinese
Respondents
Daily
be
ha
vio
urs
Greeting behaviour
Compliment and response behaviour
Custo
ms
Accepting goods
Sitting
Manners
Cha
racte
ristic o
f ve
rba
l
co
mm
un
ication
Pronunciation
Tone
Language
Phrasing of sentences
Content of dialogue
Ch
ara
cte
ristics
of
no
nve
rba
l
co
mm
un
ication
Eye contact
Gestures
Facial expressions

45
Observations were recorded in worksheets and then systematically analyzed
with minimal personal inferences made by the investigator. Categories were
then developed for further analysis as described in the later discussions.
3.5.3 Collecting Primary Data through Surveys: Questionnaires
Questionnaires generate data in a very systematic and ordered fashion. The
responses to the questions were quantified, categorized and subjected to
statistical analysis (White, 2000: 50). The questionnaire was informed by the
objectives of this study and the pilot study conducted.
Naoum (2001: 44) articulates that surveys are used to gather data from a
relatively large number of respondents within a limited time frame. It is thus
concerned with a generalized result when data is abstracted from a particular
sample or population. Questionnaires are used to collect quantitative data from
larger number of individuals in a relatively quick and convenient manner
(Joseph, Hair, Babin, Money and Samouel, 2003: 130).
Data was collected through the use of questionnaires administrated to
respondents. This study used open-ended and closed questions to obtain
primary data from Zulu and Chinese students through the survey method.
Questionnaires were used to identify whether there are problems and what the
problems are between Chinese and Zulu students when they communicate
with each other.
3.5.3.1 Questionnaire Design
According to Sekaran (2006: 237) sound questionnaire design principles
should focus on three areas. The first relates to the wording of the questions.
The second refers to the planning of issues of how the variables will be
categorized, scaled, and coded after receipt of the responses. The third
pertains to the general appearance of the questionnaire. All three are
important issues in questionnaire design because they can minimize bias in
research. Sekaran (2006: 244) sums up that certain principles of wording need

46
to be followed when designing a questionnaire.
Two sets of questionnaires were completed separately by Zulu and Chinese
respondents. These questionnaires were delivered by hand to each
respondent and collected later by fieldworkers.
In broad terms, two forms of questions were used in the questionnaires. The
two types are known as closed and open questions. Open questions allow
respondents to give answers in their own way (Dillman, 2000; Fink, 1995).
Closed questions provide a number of alternative answers from which the
respondent is instructed to choose (deVaus, 2002; Dillman, 2000).
Both questionnaires had a total of seventeen questions each. The preliminary
questionnaire structure followed a three-part sequence in this study. The initial
questions referred to classification questions that helped the researcher gather
information about the background such as age, educational level and race
group of respondents in order to understand the results better. These were
followed by open-ended questions, usually the first couple of questions are
designed to establish rapport with the respondent by gaining their attention
and stimulating their interest in the topic (Joseph et al., 2003: 195). This series
of questions typically asks about such things as attitudes, beliefs, opinions,
behaviours. These questions usually are grouped into sections by topic,
because respondents then find it easier to respond, and it helps maintain
interest and avoid confusion. The final section therefore had questions directed
specifically at the topics addressed by the research objectives.
3.5.3.2 Individual Questions
Closed Questions
Three types of closed questions were used in this study, namely: list, category,
and scale or rating.
- List: where the respondent was offered a list of items, any of which could be

47
chosen by respondents. This was included in question 16, which listed five
language problems. Otherwise, a catch-all category of “other” was added
which intended to complete the list of answers.
- Category: where only one response could be selected from a given set of
categories, such as question six.
- Scale or rating: in which a rating device was used to record responses.
Question seventeen was designed to collect opinion data. In this rating
question, an even number of points, that is, four was used to get the
respondent to express their feelings toward an implicitly positive statement.
In questions six and seven the respondents‟ attitudes were captured on a
7-point numeric rating scale. In such questions it was important that the
numbers reflected the feelings of the respondents.
Open Question
Open-ended questions were included to test the opinions of the participators.
The researcher used different types of questions, i.e., multiple-choice
questions, dichotomous and open-ended questions.
Questions 8-15 were open questions. These questions progressed from
dichotomous questions, Likert Scale ratings and open-ended questions to
determine whether intercultural communication problems do exist between
Zulu and Chinese students, to identify the intercultural communication
problems experienced and to examine the reasons why cultural divides exist.
According to (Cohen, Manion and Morrison, 2007: 322-333) the dichotomous
“yes” and “no” questions provided structured responses and enabled the
analysis of the nominal data gathered. Open-ended questions were utilized to
allow the respondent to answer freely without being limited to a specific
category. The questions were presented differently but designed to enable the
test for relationships and significance through the application of different tests.

48
3.5.3.3 The Layout of the Questionnaire
The layout of questionnaires should be designed to make reading questions
and filling in responses easy (Saunders et al., 2003: 302). This study included
a five page questionnaire which kept both the visual appearance of the
questions in order to obtain valid responses and the wording of each question
simple. The covering letter was the first part of the questionnaire which
explained the purpose of the survey.
In the questionnaire, the researcher explained clearly and concisely at the start
of questionnaire what the research is about, why it is useful, and why the
recipient‟s response is important. This was followed by a promise of
confidentiality and a statement of how, the results will be used.
3.5.3.4 Pilot Study
According to Hussey and Hussey (2000: 87), pre-testing the questionnaire is
used in order to ensure that respondents interpret the questions correctly and
to enable the collection of the required information. The questionnaire was
submitted to the supervisors to check whether the questions would provide
information that would answer the research questions. The wording of the
questions was checked to determine if there were leading questions and to
detect if there was order bias in the sequence of the questions. For the final
stage in the questionnaire construction, the questionnaire was tested amongst
Chinese and Zulu students.
The questionnaire was tested amongst ten Chinese students and ten Zulu
students at two HEIs in Durban. Feedback from this pilot test indicated that
some of the students did not really understand or they were confused by some
of the questions - these questions were reconstructed after the pilot test.

49
3.6 SAMPLING APPROACHES IN EMPIRICAL RESEARCH
Sekaran (2006: 264) defines sampling as the process of selecting the right
individuals, objects or events for this study.
3.6.1 Defining the Target Population
A population refers to the entire group of people, events or topics of interest
that the researcher wishes to investigate (Sekaran, 2006: 265). The population
of interest is called the target population (Abbu, 2006: 64).
The target population in this research were male or female Chinese and Zulu
students at selected HEIs within the Durban area who have direct
communication opportunities with each other. The sampling frame focused on
the students whose departments included both Chinese and Zulu students, or
who were involved in a social setting or social group such as sports clubs,
education clubs, etc.
3.6.2 Choosing the Sampling Frame
The sampling frame provides a working definition of the target population
(Joseph et al., 2003: 211). The sampling frame focused on those students
whose departments included both Chinese and Zulu students or who were
involved in social settings or social groups such as sports clubs, education
clubs etc. Therefore, all of them had many opportunities to meet Zulu and
Chinese students accordingly giving them more opportunity to have direct
communication with each other.
The sample was drawn from the Marketing, Human Resources Management,
Tourism Management and the Mechanical Engineering Departments at the
Durban University of Technology; and students from Management and
Engineering Departments at the University of KwaZulu–Natal. Participants
were chosen from these departments because it was assumed that interaction
between Zulu students and Chinese students took place more in those

50
departments than in the other academic sectors.
3.6.3 Selecting the Sampling Method
According to Joseph et al. (2003: 211) selection of the sampling method
depends on a number of related theoretical and practical issues. This study
used non-probability sampling which is typically used in the exploratory phase
of a study. The objective in such situations is to collect data quickly and
inexpensively. Also, non-probability designs are widely used in selecting
individuals from focus groups and pre-tests of survey questionnaires
(Joseph et al., 2003: 208).
Judgmental sampling was used in this study which enabled the use of
judgment to select cases that best enabled the researcher to meet the
objectives (Neuman, 2000). This form of sampling is often used when working
with small samples such as this study. Because of the particularity of the
sample in this study, i.e. Chinese and Zulu students who have direct
communication opportunity with each other, judgment sampling was
considered the most appropriate sampling. Judgmental sampling was used as
the places which are believed to be representative of the target population had
to be chosen subjectively (Crask, 2000: 177).
The second method was snowball sampling. This sampling method requires
the researcher to follow a chain of personal contacts when choosing a sample;
a process that is used when it is very difficult to find appropriate research
subjects, as new respondents are located via the previous respondents (Page
and Meyer, 2000: 44). In this study the researcher made contact with one or
two cases, i.e. any Chinese and/or Zulu student in the population. These cases
were asked to identify further cases.
3.6.4 Sample Size
A sample is a subset of the population. It comprises some members selected
from the population (Yao, 2007: 58).

51
According to Sekaran (2003: 295) sample sizes larger than 20 and less than
500 are appropriate for most research. The sampling size was administrated
for a non-probability judgment sample of 90 Zulu students and 90 Chinese
students who have direct communication opportunities with each other, 180
students at selected HEIs in Durban in total were considered in this research.
The sample in this study was drawn from the following departments at the
Durban University of Technology: Marketing, Human Resources Management,
Tourism Management and Engineering. The sample from the University of
KwaZulu-Natal was drawn from the Management and Engineering
departments at the Howard College and Westville campuses. Participants
were chosen from these departments because it was assumed that interaction
between Zulu students and Chinese students took place more often in these
departments as there are a sizeable number of Chinese students within these
departments.
3.7 DATA ANALYSIS AND INTERPRETATION OF RESULTS
3.7.1 Analysing Quantitative Data
Quantitative data refers to all numerical data or data that could usefully be
quantified to answer the research question and can be a product of all
research strategies (Saunders et al., 2003: 327). To be useful these data need
to be analysed and interpreted. Quantitative analysis techniques assist this
process. These range from creating simple tables or diagrams that show the
frequency of occurrence through establishing statistical relationships between
variables to complex statistical modeling (Saunders et al., 2003).
3.7.2 Analysing Qualitative Data
The researcher carried out in-depth observations to further understand the
intercultural communication barriers between Chinese and Zulu participants.
During the observations, these two groups were expected to reflect on their
different daily behaviours, different customs, and different features toward their
verbal and nonverbal modes of communication. Field notes were taken during

52
the interviews. They contained the descriptive data and the researcher‟s
comments on the data. All observations was recorded and transcribed into
detailed notes.
3.7.3 Analysis Software – SPSS Version 16
A computerized statistical analysis of the data was necessary to describe and
interpret the data that was obtained from the questionnaires. The statistical
software package which is the latest version of the programme Statistical
Package for the Social Sciences (SPSS V16) was used in this study. SPSS
V16 offered extensive data-handling capabilities and numerous statistical
analysis routines by analyzing the data statistics and dealing with the
interaction among variables in the natural data.
The data was analyzed in order to identify the barriers of intercultural
communication between Zulu and Chinese students at selected HEIs in
Durban.
3.7.4 Data Preparation and Capturing
The questionnaire produced a mass of raw data that would be meaningless
unless it could be processed and meaning extracted from it. All the
questionnaires were edited, missing data was dealt with, coded, transformed
and entered (Joseph et al., 2003: 227). Data preparation according to Nel,
Radel and Laubser (1990) includes two operations: editing and coding. Editing
is the process of ascertaining whether questionnaires are filled out properly
and completely. This involves checking for interviewer and respondent errors.
Coding refers to the process of grouping and assigning numeric codes
identifying various respondents with a particular question (McDaniel and Gates,
2002).
The coded data in the spreadsheet were entered into the SPSS version 16.0
statistics package where a variety of statistical analyses were conducted on
the captured data in order to provide interpretable answers to the objectives

53
set out. The purpose of the statistical analysis was to show that certain factors
have a significant influence on intercultural communication barriers between
Zulu and Chinese students at selected HEIs in Durban. The results were
displayed by means of pie charts and bar charts to make the frequencies
easier to read.
3.7.5 Tabulation and Basic Analysis
Tabulation was done through the utilization of the SPSS programme and
enabled the accurate coding, analysis and interpretation of the results.
The statistical analysis of the data was done through descriptive and inferential
statistics. Descriptive statistics are used to describe and characterize the
sample being examined. In contrast, inferential statistics enable the researcher
to draw conclusions about a population from a sample (Arsham, 1994). In this
study, the applicable descriptive and inferential analyses techniques were
applied.
3.7.5.1 Descriptive Statistics
Descriptive statistics involve transformation of raw data into a form that would
provide information to describe a set of factors in a situation. This is done
through ordering and manipulation of the raw data collected. Descriptive
statistics are provided by frequencies, measures of central tendency and
dispersion (Sekaran, 2006: 395).
According to Sekaran (2000: 396) frequencies refer to the number of times
various sub-categories of a certain phenomenon occur, from which the
percentage and cumulative of their occurrence can easily be calculated. This
information can be presented in the form of a histogram or a bar chart
(Sekaran, 2006: 396). Question seven used frequencies to clearly show the
number of each option chosen by respondents with regards to communicators‟
communication ability. From the histogram it is easy to compare which option
was chosen by most of the respondents. This method also applied to question
54
seventeen, which showed the differences between Zulu and Chinese students‟
perception with regards to each statement relating to cultural differences.
The percentage is the proportion of respondents who answer a question a
certain way, multiplied by 100 (Aaker, Kumar and Day, 2001). Percentages
serve two purposes in data presentation. They simplify data by reducing all
numbers to a range from 0 to 100. Secondly, they translate the data into
standard form, with a base for relative comparisons (McDaniel and Gates,
2002: 292). Percentages were used to present the data in most of the
questions to show figures or differences between the Zulu and Chinese
communicators‟ answers.
According to Sekaran (2006: 396) measures of central tendencies and
dispersions describe a series of observations in a data set parsimoniously, and
in a meaningful way, which would enable individuals to get an idea of, or a feel
for the basic characteristics of the data. Question 7 used this method to find
the characteristics of the data regarding levels of respondents‟ communication
ability.
There are three measures of central tendencies: mean, median and mode.
These are explained by (Sekaran, 2000: 117) as follows:
- Mean: The mean is the average value of the variable, computed across all
cases.
- Median: The median refers to the score which has one half of the scores on
either side of it when the scores have been arranged in ascending and
descending order.
- Mode: The mode can be described by the most frequently occurring
phenomenon.
3.7.5.2 Correlation
Dillon, Madden and Firtle (1994) observed that the method or procedure used
to measure the degree of association between two variables depends on the

55
measurement scale to which the variables refer. In this study, inter-correlations
were done for each of the variables in question sixteen which made up the
team cohesiveness scores in contrast to team effectiveness. It showed how
each statement regarding language problems correlated with and influenced
each other. Inter-correlations also applied to question 15a and question 15b to
test the relationship between “interests sharing” and “sharing interesting
topics”.
3.7.5.3 Analysis of Variance (ANOVA)
The statistical technique used when testing two or more means is called the
analysis of variance (ANOVA) (Aaker et al., 2001). ANOVA is a statistical
procedure that assesses the likelihood that the means of groups are equal to a
common population mean by comparing an estimate of the population
variance determined between groups with an estimate of the same population
variance determined within groups (McDaniel and Gates, 2002: 315). In this
study, ANOVA was used to determine whether intercultural problems were
influenced by the demographic variables (gender, age, home language, race
and education). Where it was found that a demographic variable did influence
intercultural communication, crosstabs were also done.
3.7.5.4 Crosstabs
Levesque (2007) explained “crosstabs” as a procedure which forms two-way
and multiway tables and provides a variety of tests and measures of
association. In this study, crosstabs were used to find out how intercultural
problems were influenced by demographic factors.
3.7.5.5 Chi-Square Test
Chi-square distribution is the most commonly used method of comparing
proportions to establish whether relationships are dependent or independent of
each other (McDaniel and Gates, 2002: 516). In this study, Chi-square test
was applied to question sixteen to identify the influencing factors of each

56
specific language problem.
3.7.6 Reliability and Validity
Consistency is associated with the term reliability while accuracy is associated
with the term validity (Joseph et al., 2003: 169). It is therefore apparent that if
any interpretations of the findings are to be made, the credibility of the study
must be established through the determination of its reliability and validity
(Sardha, 2000: 41).
3.7.6.1 Reliability
According to Joseph et al. (2003: 169) reliability is concerned with the
consistency of the research findings. In this study reliability was determined
using Cronbach‟s Co-Efficient Alpha. According to Sekaran (2006: 307),
Cronbach‟s Co-Efficient Alpha is a reliability co-efficient that indicates how
each of the items in a set are positively correlated to one another. Cronbach‟s
Alpha is computed in terms of the average intercorrelations among the items
measuring the concept. The closer Cronbach‟s Alpha is to 1, the higher the
internal consistency reliability.
3.7.6.2 Validity
In this study, factor analysis was used to determine the validity of the
questionnaires. According to Yao (2007: 73) factor analysis is a general
description for several specific computational techniques. Sekaran (2000: 214)
adds that the results of the factor analysis will confirm whether or not theorised
dimensions emerge.
3.8 ETHICS
The Free Encyclopaedia (2009) explains “research ethics” as the application
of fundamental ethical principles to a variety of topics involving scientific
research. These include the design and implementation of research involving
human experimentation, animal experimentation, various aspects of academic

57
scandal including scientific misconduct (such as fraud, fabrication of data and
plagiarism), whistleblowing, regulation of research, etc.
Ethics are important in the choice of topic, the samples selected, the
interventions designed and the data collection procedures. After data are
collected, ethics are of great importance in the analysis and reporting of data.
The goal of ethics in this research was to ensure that no one was harmed or
suffered adverse consequences from the research activities.
3.9 CONCLUSION
This chapter described the methodology and highlighted the various
techniques that were employed to conduct this study.
The reliability and validity of the questionnaires and analyses of the data are
crucial for the acceptance of the results and the credibility of the study. This
chapter has also shown that the methodology was designed to maximize
reliability and validity, the findings of the study can thus be accepted with a
reasonable degree of confidence.
Chapter four is dedicated to the presentation of the findings, data analysis and
discussion of the empirical research results.

58
CHAPTER FOUR – ANALYSES OF RESULTS
4.1 INTRODUCTION
This chapter discusses the findings of this study. The questionnaires
completed by the Zulu and the Chinese students were analysed using the
Statistical Package for the Social Sciences (SPSS) Version 16.0. Analyses of
the results are presented in themes in this chapter as follows: theme one
examines the communication ability of the respondents, theme two examines
language problems, theme three focuses on cultural differences, theme four
examines the barriers to intercultural communication (racism, trust,
ethnocentrism and stereotyping), theme five investigates nonverbal behaviour,
and theme six examines the common interests amongst the respondents.
4.2 THEME ONE – COMMUNICATION
In this theme, a combination of questions six, seven and seventeen are
analyzed.
4.2.1 Analysis of Question Six: Communication Frequency
(see Appendix A, Question Six and Appendix B, Question Six)
Figure 4.1: Frequency of Communication (Zulu Respondents)
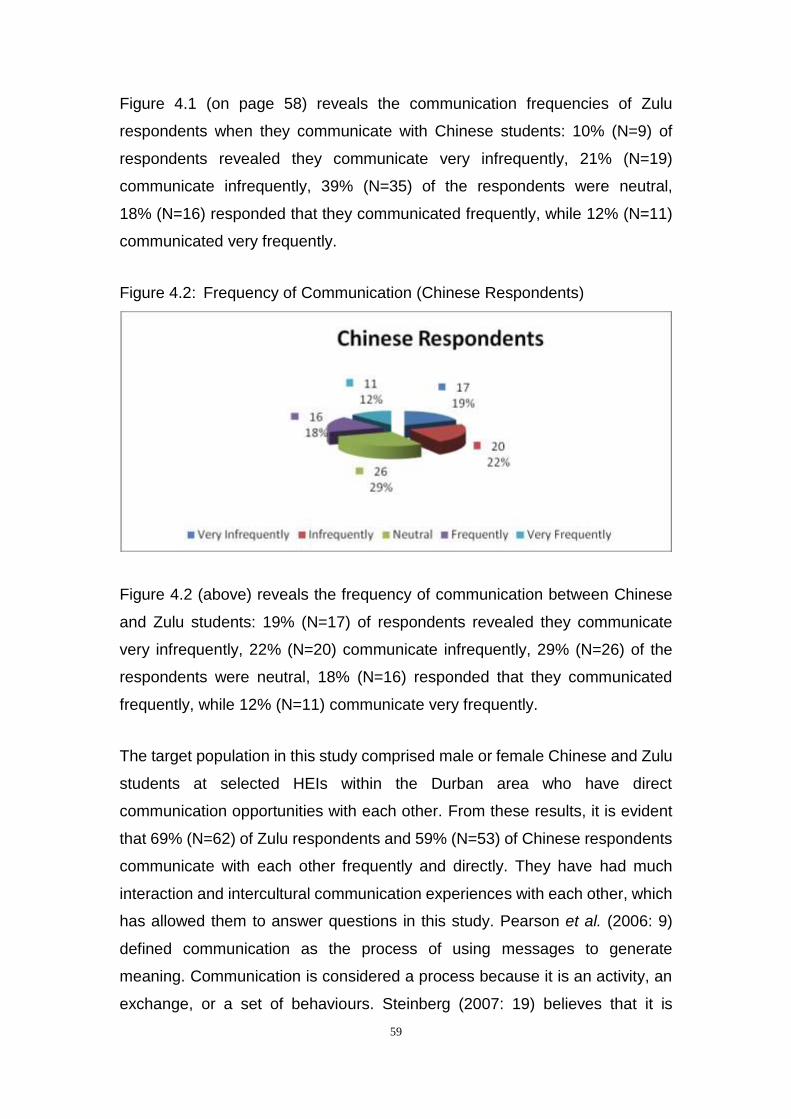
59
Figure 4.1 (on page 58) reveals the communication frequencies of Zulu
respondents when they communicate with Chinese students: 10% (N=9) of
respondents revealed they communicate very infrequently, 21% (N=19)
communicate infrequently, 39% (N=35) of the respondents were neutral,
18% (N=16) responded that they communicated frequently, while 12% (N=11)
communicated very frequently.
Figure 4.2: Frequency of Communication (Chinese Respondents)
Figure 4.2 (above) reveals the frequency of communication between Chinese
and Zulu students: 19% (N=17) of respondents revealed they communicate
very infrequently, 22% (N=20) communicate infrequently, 29% (N=26) of the
respondents were neutral, 18% (N=16) responded that they communicated
frequently, while 12% (N=11) communicate very frequently.
The target population in this study comprised male or female Chinese and Zulu
students at selected HEIs within the Durban area who have direct
communication opportunities with each other. From these results, it is evident
that 69% (N=62) of Zulu respondents and 59% (N=53) of Chinese respondents
communicate with each other frequently and directly. They have had much
interaction and intercultural communication experiences with each other, which
has allowed them to answer questions in this study. Pearson et al. (2006: 9)
defined communication as the process of using messages to generate
meaning. Communication is considered a process because it is an activity, an
exchange, or a set of behaviours. Steinberg (2007: 19) believes that it is

60
generally agreed that we communicate with some purpose which is to satisfy a
personal or social need. Hence, from the results obtained it is evident that
communication between Chinese and Zulu students is necessary to fulfill a
need.
4.2.2 Analysis of Question Seven: Communication Ability
(see Appendix A, Question Seven and Appendix B, Question Seven)
Figure 4.3: Communication Ability (Zulu Respondents)
In question seven, Zulu and Chinese respondents were asked whether they
were able to communicate easily with each other. Figure 4.3 (above) reveals
that 2% (N=2) of Zulu respondents revealed they communicate very easily,
10% (N=9) revealed that they communicate easily, 19% (N=17) were neutral,
48% (N=43) responded that they communicated with difficultly, and 21%
(N=19) communicated with much difficulty.
Figure 4.4: Communication Ability (Chinese Respondents)

61
Figure 4.4 (on page 60) reveals that 7.8% (N=7) of respondents indicated they
communicate very easily, 7% (N=6) found it easy, 14% (N=13) of the
respondents were neutral, 42% (N=38) responded that they communicated
with difficulty, and 29% (N=26) communicated with much difficultly.
The results from Figure 4.3 (on page 60) and Figure 4.4 (on page 60) indicated
that a total of 69% of Zulu and 71% of Chinese respondents believe that it is
difficult to communicate with each other.
Table 4.1: Central Tendency Statistics on Question Seven
Statistics
Question Seven: Communication Ability
N Valid Missing
90 0
Zulu Respondents Mean 3.7556
Chinese Respondents Mean 3.7778
Table 4.1 (above) reveals the central tendency statistics results for question
seven (see Appendix A, Question Seven) from the Zulu respondents. A mean
value of 3.7556 reveals that the Zulu respondents articulate an average
perception of Neutral to Difficulty. A mean value of 3.7778 reveals that the
Chinese respondents had also articulated an average perception of Neutral to
Difficulty. These results are in accordance with Rampersad (2007), who found
that learners are either unhappy or reluctant to work or associate with people
of other cultures or are shy or intolerant to engage in discussions.
4.2.3 Analyses of Question Seventeen: Communication Experiences
(see Appendix A, Question Seventeen and Appendix B, Question
Seventeen)
Question seventeen consists of responses to eight different areas from both
the Zulu and the Chinese respondents:

62
4.2.3.1 Statement One: It is important to send nonverbal signals which are not
confusing when communicating
Figure 4.5: Responses to Statement One
Question seventeen: Statement one Results
08
58
24
2
29
54
5
0
10
20
30
40
50
60
70
Strongly Disagree Disagree Agree Strongly Agree
Zulu Respondents Chinese Respondents
Figure 4.5 (above) reveals perceptions of the Zulu and the Chinese
respondents toward the statement “it is important to send nonverbal signals
which are not confusing when communicating”.
Figure 4.5 (above) indicates that 64.4% (N=58) of the Zulu respondents and
60% (N=54) of the Chinese respondents agreed with this statement. However,
only 8.9% (N=8) of the Zulu respondents and 32.2% (N=29) of the Chinese
students disagreed with this statement, while 5.6% (N=5) of the Chinese
respondents and 26.7% (N=24) of the Zulu respondents strongly agreed.
Respondents believed that nonverbal communication can help to complete
verbal communication. Respondents who disagreed with this statement
commented that nonverbal signals confuse communication as nonverbal
behaviour differs from culture to culture.

63
4.2.3.2 Statement Two: A person who is silent means that s/he does not
understand the message
Figure 4.6: Responses to Statement Two
Question seventeen: Statement two Results
0
18
51
21
10
49
24
7
0
10
20
30
40
50
60
Strongly Disagree Disagree Agree Strongly Agree
Zulu Respondents Chinese Respondents
Figure 4.6 (above) reveals the perceptions of the Zulu and the Chinese
respondents toward the statement “a person who is silent means that s/he
does not understand the message”. More than half (56.7%, N=51) of the Zulu
students agreed or strongly agreed with this statement. However more than
half (54.4%, N=49) of the Chinese students disagreed or strongly disagreed
with this statement.
The Zulu respondents commented that in Zulu culture, the receiver should
regularly respond with words like “yes”, “is it?”, “how?” etc. to show
understanding, interest in the topic and respect to the sender.
The Chinese respondents commented that listening quietly during a
conversation is considered courteous in Chinese culture. People can nod
slightly to express their agreement or they can use some other facial
expression to show their reaction.

64
4.2.3.3 Statement Three: It is important to maintain eye contact with a person
in order to see whether s/he is honest or not
Figure 4.7: Responses to Statement Three
Question seventeen: Statement three Results
14
63
942
10
53
25
0
20
40
60
80
Strongly Disagree Disagree Agree Strongly Agree
Zulu Respondents Chinese Respondents
Figure 4.7 (above) reveals the perceptions of the Zulu and the Chinese
respondents towards the statement “it is important to maintain eye contact with
a person in order to see whether s/he is honest or not”. 70.0% (N=63) of the
Zulu respondents disagreed and 15.6% (N=14) strongly disagreed with this
statement. However, 58.9% (N=53) of the Chinese respondents agreed with
and 27.8% (N=25) strongly agreed with this statement.
Zulu respondents commented that they avoid unnecessary eye contact since it
is considered misbehaviour or being defiant. Chinese respondents commented
that they do not always express themselves through words, they sometimes
just observe other people‟s facial expressions and moods and that they use
eye contact to judge a person.

65
4.2.3.4 Statement Four: Interrupting a person during a conversation is rude
and impolite
Figure 4.8: Responses to Statement Four
Question seventeen: Statement four Results
0
23
58
90
8
54
28
0
20
40
60
80
Strongly Disagree Disagree Agree Strongly Agree
Zulu Respondents Chinese Respondents
Figure 4.8 (above) reveals perceptions of the Zulu and Chinese respondents to
the statement “interrupting a person during a conversation is rude and
impolite”. 64.4% (N=58) of the Zulu respondents and 60% (N=54) of the
Chinese students agreed with this statement; 10% (N=9) of the Zulu
respondents and 31.1% (N=28) of the Chinese respondents strongly agreed
with this statement. 25.6% (N=23) of the Zulu respondents and 8.9% (N=8) of
the Chinese respondents disagreed with this statement.
Zulu respondents commented that in their culture, participation during
another‟s conversation shows their interest in the topic. They thought that
everyone has the same opportunities to show their point of view to others. On
the contrary, Chinese respondents commented that interrupters are not
welcome in their culture. People can give their own opinion after others have
finished their conversation. A too strong opposition to the communicator may
also be viewed as disrespect.

66
4.2.3.5 Statement Five: A person who speaks with a loud tone of voice is either
upset or angry
Figure 4.9: Responses to Statement Five
Question seventeen: Statement five Results
8
57
20
53
26
54
7
0
10
20
30
40
50
60
Strongly Disagree Disagree Agree Strongly Agree
Zulu Respondents Chinese Respondents
Figure 4.9 (above) reveals perceptions of the Zulu and the Chinese
respondents to the statement “a person who speaks with a loud tone of voice is
either upset or angry”. 63.3% (N=57) of the Zulu respondents and 28.9%
(N=26) of the Chinese respondents disagreed with this statement. 22.2%
(N=20) of the Zulu and 60.0% (N=54) of the Chinese students agreed with this
statement.
Chinese respondents commented that they try to have peaceful relationships
with others. They do not like to argue even when they have a different opinion
from their friends. They are also too shy to say “no” or to refuse their friends.
They talk to people with a smile, listen carefully and respond as politely as they
can. If someone speaks to a Chinese person in a loud tone of voice, the
Chinese will think that this person does not like them or that they are upset or
angry with them. Chinese people do not talk to people loudly especially with
their friends, elders and other important people since they do not want to
destroy their friendly relationship with them.
The Zulu respondents commented that in their culture people are welcome to
have different opinions and they like to exchange ideas with each other. They
can also rebut other people especially their friends if they say something wrong.
They speak loudly to discuss, argue or criticize. Therefore, speaking loudly is
considered as normal in the Zulu culture.

67
4.2.3.6 Statement Six: Receiving a gift with both hands is a sign of
appreciation
Figure 4.10: Responses to Statement Six
Question seventeen: Statement six Results
0 2
63
25
4
41 42
3
0
10
20
30
40
50
60
70
Strongly Disagree Disagree Agree Strongly Agree
Zulu Respondents Chinese Respondents
Figure 4.10 (above) reveals perceptions of the Zulu and Chinese respondents
to the statement “receiving a gift with both hands is a sign of appreciation”.
70.0% (N=63) of the Zulu respondents and 46.7% (N=42) of the Chinese
respondents agreed with this statement; 27.8% (N=25) of the Zulu
respondents and 3.3% (N=3) of the Chinese respondents strongly agreed with
this statement. However, 2.2% (N=2) of the Zulu respondents and 45.6%
(N=41) of the Chinese respondents disagreed with this statement, and 4.4%
(N=4) of Chinese respondents strongly disagreed with this statement.
Chinese respondents commented that people can receive gifts either with one
hand or both hands in their culture. There is no criterion for how to receive a
gift, but on formal occasions Chinese people prefer to receive gifts or
certificates with both hands to show respect.
Zulu respondents commented that in their culture, people receive gifts with
both hands to show appreciation. They follow the tradition of putting the left
hand on the right wrist and using the right hand to accept goods. Therefore,
they think that people who accept gifts with one hand are rude and
disrespectful.
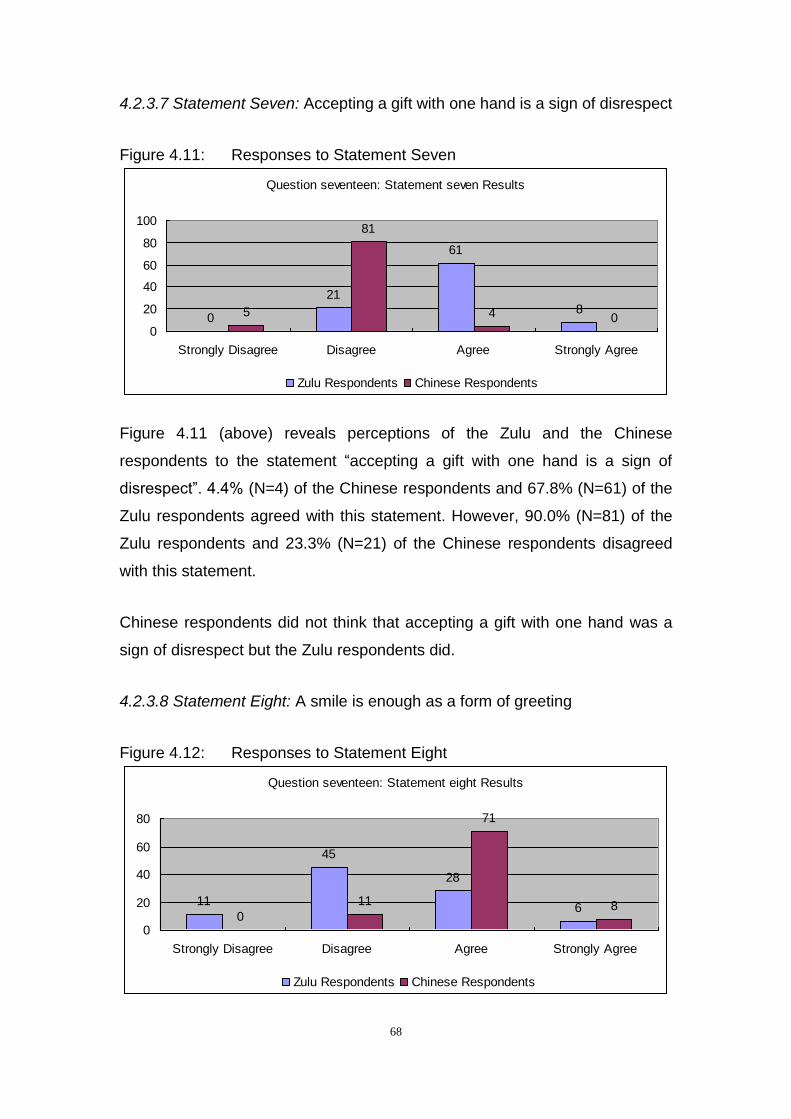
68
4.2.3.7 Statement Seven: Accepting a gift with one hand is a sign of disrespect
Figure 4.11: Responses to Statement Seven
Question seventeen: Statement seven Results
0
21
61
85
81
4 00
20
40
60
80
100
Strongly Disagree Disagree Agree Strongly Agree
Zulu Respondents Chinese Respondents
Figure 4.11 (above) reveals perceptions of the Zulu and the Chinese
respondents to the statement “accepting a gift with one hand is a sign of
disrespect”. 4.4% (N=4) of the Chinese respondents and 67.8% (N=61) of the
Zulu respondents agreed with this statement. However, 90.0% (N=81) of the
Zulu respondents and 23.3% (N=21) of the Chinese respondents disagreed
with this statement.
Chinese respondents did not think that accepting a gift with one hand was a
sign of disrespect but the Zulu respondents did.
4.2.3.8 Statement Eight: A smile is enough as a form of greeting
Figure 4.12: Responses to Statement Eight
Question seventeen: Statement eight Results
11
45
28
60
11
71
8
0
20
40
60
80
Strongly Disagree Disagree Agree Strongly Agree
Zulu Respondents Chinese Respondents

69
Figure 4.12 (on page 68) reveals perceptions of the Zulu and the Chinese
respondents to the statement “a smile is enough as a form of greeting”.
12.2% (N=11) of Zulu students strongly disagreed with and 50.0% (N=45)
disagreed with this statement. 31.1% (N=28) agreed with and 6.7% (N=6)
strongly agreed with this statement. However no Chinese students strongly
disagreed with this statement. 12.2% (N=11) of them disagreed with, 78.9%
(N=71) agreed with and 8.9% (N=8) strongly agreed with this statement.
The Chinese respondents commented that the most familiar greeting
behaviour they use is a smile. They also use a smile to show their good mood,
appreciation, understanding and more. Therefore, the smile for a greeting is
sufficient.
The Zulu respondents commented that they are a passionate group of people.
They show their hospitality friendship, and feelings of missing each other etc.
with an amiable hug, a handshake or excited facial expressions when they
meet. Zulu respondents did not think that a smile is enough to express all their
feelings. If people just give each other a smile, it may be because they do not
know each other well enough.
4.2.4 Discussion: Theme One - Communication
This section analyzed eight specific communication experiences of the Zulu
and the Chinese respondents. The findings revealed that the Zulu and the
Chinese respondents had completely different attitudes toward to these
statements. Findings from respondents‟ comments indicated that their
perceptions to the communication experiences were influenced by their
cultural values, beliefs and norms which are rooted in their own cultures.
According to Martin and Nakayama (2001: 24) people share perceptions or
ways of looking at the world. Thus, all of their prior learning, that is, the
information people have already stored in their brains, affects how they
interpret new information. Some of this learning and perception is related to the
values of the cultural groups they belong to.

70
In this study it is evident that although many intercultural communication
problems occur on the interpersonal level, most of the serious confrontations
and misunderstandings can be traced to cultural differences that go to the
basic core of what it means to be a member of a specific culture
(Samovar et al., 2007: 36).
4.3 THEME TWO – LANGUAGE PROBLEMS
In this theme, a combination of questions eight and sixteen are analyzed.
4.3.1 Analyzed Question Eight: Language Problems
(see Appendix A, Question Eight and Appendix B, Question Eight)
Table 4.2: Language Problems
Zulu respondents Chinese respondents
YES NO YES NO
Language problem 74.4% (N=67)
25.6% (N=23)
72.2% (N=65)
27.8% (N=25)
Table 4.2 (above) clearly indicates that a large percentage of the Zulu (74.4%,
N=67) and the Chinese respondents (72.2%, N=65) found that language is a
problem when they communicate with each other.
Both the Zulu and the Chinese respondents indicated that the communicators‟
accent was one of the barriers. Communicators may have their own sentence
structure, special understanding of words which cannot be followed by others,
unique pronunciation or they may be short of word to express themselves as
they are not familiar with English which may be their second language.
Findings indicated that communicators who speak English as their home
language have less intercultural communication barriers in terms of language
problems than those who speak isiZulu or Chinese as their home language.
This finding strongly supports the research findings of Bruhns et al. (cited in
Njobe, 2007: 1) which indicated that numerous studies on language abilities of
second language learners‟ indicate that learners have difficulties learning in a
second language.

71
Analysis of variance from SPSS 16 indicated that respondents‟ communication
frequency can influence language problems as reflected in Table 4.3 (below)
there was a statistically significant difference of p (0.000) < 0.05 for the Zulu
respondents and p (0.043) < 0.05 for the Chinese respondents. Therefore, the
significant difference between language problems and communication
frequency, it is accepted that both the Zulu and the Chinese respondents who
communication more frequently have less intercultural communication barriers
in terms of language problems as reflected in Table 4.4 (below).
Table 4.3: Analysis of Variance: Language Problems and Communication Frequency
Question 8: Language Problem Sum of Squares
df Mean Square
F Sig.
Zulu Respondents
Between Groups Within Groups Total
4.975 12.147 17.122
4 85 89
1.244 .143
8.703 .000
Chinese Respondents
Between Group Within Groups Total
1.957 16.098 18.056
4 85 89
.489
.189 2.584 .043
Table 4.4: Cross Tabulation of Language Problems and Communication Frequency
Communication Frequency
Language Problem Total
Yes No
Zulu Respondents Very Infrequently 9(100%) 9
Infrequently 17(89.5%) 2(10.5%) 19
Neutral 29(82.9%) 6(17.1%) 35
Frequently 10(62.5%) 6(37.5%) 16
Very Frequently 2(18.2%) 9(81.8%) 11
Total 67 23 90
Chinese Respondents
Very Infrequently 9(52.90%) 8(47.1%) 17
Infrequently 18(90%) 2(10%) 20
Neutral 16(61.5%) 10(38.5%) 26
Frequently 12(75%) 4(25%) 16
Very Frequently 10(90.9%) 1(9.1%) 11
Total 65 25 90
Table 4.5 (on page 72) reflects that there was a statistically significant
difference between different levels of communication competence and
language problems since p (0.000) < 0.05 for the Zulu respondents and p
(0.003) < 0.05 for the Chinese respondents. Therefore, because of the

72
significant difference between language problems and communication ability, it
is accepted that respondents with better communication ability experience less
intercultural communication barriers as reflected in Table 4.6 (below).
Table 4.5: Analysis of Variance: Language Problems and Communication Ability
Question 8: Language Problem Sum of Squares
df Mean Square
F Sig.
Zulu Respondents
Between Groups Within Groups Total
5.043 12.079 17.122
4 85 89
1.261 .142
8.872 .000
Chinese Respondents
Between Group Within Groups Total
3.078 14.978 18.056
4 85 89
.769
.176 4.366 .003
Table 4.6: Cross Tabulation of Language Problems and Communication Ability Level
Communication Ability Level
Language Problem Total
Yes No
Zulu Respondents
Very Easily 1(50%) 1(50%) 2
Easily 1(11.1%) 8(88.9%) 9
Neutral 11(64.7%) 6(35.3%) 17
Difficulty 36(83.7%) 7(16.3%) 43
Very Difficulty 18(94.7%) 1(5.3%) 19
Total 67 23 90
Chinese Respondents
Very Easily 1(14.3%) 6(85.7%) 7
Easily 5(83.3%) 1(16.7%) 6
Neutral 11(84.6%) 2(15.4%) 13
Difficulty 26(68.4%) 12(31.6%) 38
Very Difficulty 22(84.6%) 4(15.4%) 26
Total 65 25 90
Findings from question eight indicated that language is one of the intercultural
communication barriers experienced by students because of language
varieties, especially for those communicators for whom English is not their
home language.

73
4.3.2 Analysis of Question Sixteen: Specified Language Problems
This section analyses question sixteen of the Zulu and the Chinese
questionnaire that listed five specified language problems which respondents
may encounter.
Table 4.7: Specified Language Problems (Zulu Respondents)
Zulu respondents
YES NO
I cannot understand them. 62.2% (N=56) 37.8% (N=34)
They do not clearly understand me. 76.7% (N=69) 23.3% (N=21)
I do not have enough words to express myself. 52.2% (N=47) 47.8% (N=43)
I have to repeat myself several times. 82.2% (N=74) 17.8% (N=16)
I do not communicate with them because I am afraid I do not know enough about them. 15.6% (N=14) 84.4% (N=76)
Table 4.7 (above) indicates that 62.2% (N=56) of the Zulu respondents cannot
understand the Chinese communicators. 76.7% (N=69) of them think that the
Chinese communicators cannot clearly understand them, 52.2% (N=47) do not
have enough words to express themselves and 82.2% (N=74) of them
indicated that most of the time they have to repeat themselves several times.
Table 4.8: Specified Language Problems (Chinese Respondents)
Chinese respondents
YES NO
I cannot understand them. 70.0% (N=63) 30.0% (N=27)
They do not clearly understand me. 72.2% (N=65) 27.8% (N=25)
I do not have enough words to express myself. 74.4% (N=67) 25.6% (N=23)
I have to repeat myself several times. 74.4% (N=67) 25.6% (N=23)
I do not communicate with them because I am afraid I do not know enough about them. 41.4% (N=37) 58.9% (N=53)
Table 4.8 (above) indicates that 70.0% (N=63) of the Chinese respondents
cannot understand the Zulu communicators. 72.2% (N=65) of them think that
the Zulu communicators cannot clearly understand them, 74.4% (N=67) do not
have enough words to express themselves, 74.4% (N=67) of them indicated
that most of the time they have to repeat themselves several times and 41.4%
(N=37) of the Chinese respondents indicated that they do not communicate

74
with the Zulu communicators because they are afraid they do not know enough
about them.
Findings indicated the specified language problems in question sixteen had
correlation. Table 4.9 (below) analyzed the correlation of each specified
language problem from the Zulu respondents‟ questionnaire. It revealed that
the four specific language problems: “I cannot understand them”, “they do not
clearly understand me”, “I do not have enough words to express myself” and “I
have to repeat myself several times” have a statistically significant correlation
with each other since p is less than 0.01.
Table 4.9: Correlation of Specified Language Problems in Question Sixteen (Zulu Questionnaire)
I cannot understand them
They do not clearly understand me
I do not have enough words to express myself
I have to repeat myself several times
I do not communicate with them because I am afraid I do not know enough about them
I cannot understand them
1.000 . 90
.383** .000 90
.769** .000 90
.357** .001 90
.145 .174 90
Pearson Correlation Sig. (2-tailed) N
They do not clearly understand me
.383** .000 90
1.000 . 90
.366** .000 90
.843** .000 90
.092 .389 90
Pearson Correlation Sig. (2-tailed) N
I do not have enough words to express myself
.769** .000 90
.366** .000 90
1.000 90
.370** .000 90
.042 .692 90
Pearson Correlation Sig. (2-tailed) N
I have to repeat myself several times
.357** .001 90
.843** .000 90
.370** .000 90
1.000 . 90
.039 .714 90
Pearson Correlation Sig. (2-tailed) N
I do not communicate with them because I am afraid I do not know enough about them
.145 .174 90
.092 .389 90
.042 .692 90
.039 .714 90
1.000 . 90
Pearson Correlation Sig. (2-tailed) N
** Correlation is significant at the 0.001 level (2-tailed)

75
Table 4.10 (below) analyzed the correlation of each specified language
problem from the Chinese respondents‟ questionnaire. The findings revealed
that five specific language problems: “I cannot understand them”, “they do not
clearly understand me”, “I do not have enough words to express myself”, “I
have to repeat myself several times” and “I do not communicate with them
because I am afraid I do not know enough about them” have a statistically
significant correlation with each other since the value of p is less than 0.01.
Table 4.10: Correlation of Specified Language Problems in Question Sixteen
(Chinese Questionnaire)
I cannot understand them
They do not clearly understand me
I do not have enough words to express myself
I have to repeat myself several times
I do not communicate with them because I am afraid I do not know enough about them
I cannot understand them 1.000 . 90
.298** .004 90
.450** .000 90
.450** .000 90
.399** .000 90
Pearson Correlation Sig. (2-tailed) N
They do not clearly understand me
.298** .004 90
1.000 . 90
.603** .000 90
.490** .000 90
.417** .000 90
Pearson Correlation Sig. (2-tailed) N
I do not have enough words to express myself
.450** .000 90
.603** .000 90
1.000 90
.708** .000 90
.386** .000 90
Pearson Correlation Sig. (2-tailed) N
I have to repeat myself several times
.450** .000 90
.490** .000 90
.708** .000 90
1.000 . 90
.438** .000 90
Pearson Correlation Sig. (2-tailed) N
I do not communicate with them because I am afraid I do not know enough about them
.399** .000
90
.417** .000
90
.386** .000
90
.438 .000
90
1.000 . 90
Pearson Correlation Sig. (2-tailed) N
** Correlation is significant at the 0.001 level (2-tailed)
Findings from Table 4.9 (on page 74) and Table 4.10 (above) indicate that all
of the language problems specified in question sixteen are correlated which
means that they influence each other. These language problems therefore add
to the barriers of intercultural communication between the Zulu and the
Chinese communicators.

76
Table 4.11 – Table 4.14 (below) use Chi-square (χ) tests to identify whether
the influencing factors (Zulu respondents‟ gender, age, home language,
educational level, communication ability and communication frequency) has
statistically significant relationships with each specified language problem
statement from the Zulu students.
Table 4.11: Chi-Square Results: Language Problems and Communication Ability (Zulu respondents)
Variables Sig. (2-sided)
16.1 I cannot clearly understand them 0.007
16.2 They do not clearly understand me 0.004
16.3 I do not have enough words to express myself 0.000
16.4 I have to repeat myself several times 0.008
16.5 I do not communicate with them because I am afraid I do not know enough about them
0.284
Table 4.12: Chi-Square Results: Language Problems and Educational Level (Zulu respondents)
Variables Sig. (2-sided)
16.1 I cannot clearly understand them 0.003
16.2 They do not clearly understand me 0.078
16.3 I do not have enough words to express myself 0.000
16.4 I have to repeat myself several times 0.043
16.5 I do not communicate with them because I am afraid I do not know enough about them
0.550
Table 4.13: Chi-Square Results: Language Problems and Communication Frequency (Zulu respondents)
Variables Sig. (2-sided)
16.1 I cannot clearly understand them 0.009
16.2 They do not clearly understand me 0.018
16.3 I do not have enough words to express myself 0.000
16.4 I have to repeat myself several times 0.055
16.5 I do not communicate with them because I am afraid I do not know enough about them
0.396

77
Table 4.14: Chi-Square Results: Language Problems and Home Language (Zulu respondents)
Variables Sig. (2-sided)
16.1 I cannot clearly understand them 0.009
16.2 They do not clearly understand me 0.016
16.3 I do not have enough words to express myself 0.009
16.4 I have to repeat myself several times 0.027
16.5 I do not communicate with them because I am afraid I do not know enough about them
0.175
- The statement: “I cannot clearly understand them” has statistically
significant relationships with the factors: respondents‟ communication
ability, educational level, communication frequency and home language
since the values of p are below 0.05.
- The statement: “they do not clearly understand me” has statistically
significant relationships with the factors: respondents‟ communication
ability, educational level and home language since the values of p are
below 0.05.
- The statement: “I do not have enough words to express myself” has
statistically significant relationships with the factors: respondents‟
communication ability, educational level, communication frequency and
home language since the values of p are below 0.05.
- The statement: “I have to repeat myself several times” has statistically
significant relationships with the factors: respondents‟ communication
ability, communication frequency and home language since the values of p
are below 0.05.
- The statement: “I do not communicate with them because I am afraid I do
not know enough about them” has no statistically significant relationships
with any factors since the p values are above 0.05.

78
Table 4.15 (below) and Table 4.16 (below) reveal the Chi-square (χ) test
results from the Chinese students‟ responses to determine whether their
gender, age, home language, educational level, communication ability and
communication frequency has statistically significant relationships with each
specified language problem statement.
Table 4.15: Chi-Square Results: Language Problems and Home Language (Chinese Respondents)
Variables Sig. (2-sided)
16.1 I cannot clearly understand them 0.011
16.2 They do not clearly understand me 0.000
16.3 I do not have enough words to express myself 0.000
16.4 I have to repeat myself several times 0.001
16.5 I do not communicate with them because I am afraid I do not know enough about them
0.071
Table 4.16: Chi-Square Results: Language Problems and Communication Ability (Chinese Respondents)
Variables Sig. (2-sided)
16.1 I cannot clearly understand them 0.019
16.2 They do not clearly understand me 0.001
16.3 I do not have enough words to express myself 0.000
16.4 I have to repeat myself several times 0.001
16.5 I do not communicate with them because I am afraid I do not know enough about them
0.182
- The statements: “I cannot clearly understand them”, “they do not clearly
understand me”, “I do not have enough words to express myself” and “I
have to repeat myself several times” have statistically significant
relationships with the factors: respondents’ home language and
communication ability since the p values are below 0.05.
- The statement: “I do not communicate with them because I am afraid I do
not know enough about them” has no statistically significant relationships
with any factors since the p values are above 0.05.
Findings from question sixteen indicates that the communicators‟ personal
factors affect language problems and that communicators who do not speak

79
English as a first language, do not have the requisite communicational ability to
express themselves properly.
According to Samovar et al. (1998: 144) language problems become
intercultural communication barriers since the meanings people have for words
are determined by the culture in which they have been raised; word usage and
meanings are learned, and all cultures and co-cultures have special
experiences that frame usage and meaning; people learn and use language as
they do because of their cultural background.
Taking the above into account, it is necessary to find out how cultural
differences affect intercultural communication.
4.4 THEME THREE – CULTURAL DIFFERENCES
In this theme, question nine (see Appendix A, Question Nine and Appendix B,
Question Nine) is analyzed.
Table 4.17: Cultural Differences
Zulu respondents Chinese respondents
YES NO YES NO
Culture differences 65.6% (N=59)
34.4% (N=31)
61.1% (N=55) 38.9% (N=35)
Table 4.17 (above) reveals that 65.6% (N=59) of the Zulu respondents and
61.1% (N=55) of the Chinese respondents indicated that cultural differences
create problems when they communicate with each other.
Cultural differences cause problems as Chinese and Zulu students do not
share a common cultural background. Lustig and Koester (1993: 96) agree
that the differences among cultures produce motivations that inhibit people as
they communicate interculturally. It was therefore evident that intercultural
problems do exist between the Zulu and the Chinese communicators.

80
To corroborate the above finding, Analysis of Variance Test was conducted to
determine whether communicators‟ age and communication frequency had
statistically significant relationships with the cultural differences variable.
The tests examined by SPSS V16 - Analysis of variance indicated that
communicators‟ age and communication frequency have statistically
significant different affect cultural differences since:
Table 4.18 (below) revealed that there is a statistically significant difference
between the variables: communicators‟ age and cultural differences since:
p (0.033) < 0.05 (Zulu respondents) and p (0.002) < 0.05 (Chinese
respondents).
Table 4.18: Analysis of Variance: Cultural Differences and Communicators‟ Age
Question 9: Cultural Differences Sum of Squares
df Mean Square
F Sig.
Zulu Respondents
Between Groups Within Groups Total
1.956 18.366 20.322
3 86 89
.652
.214 3.054 .033
Chinese Respondents
Between Group Within Groups Total
3.333 18.056 21.389
3 86 89
1.111 .210
5.292 .002
Table 4.19 (below) indicates that both Zulu and Chinese respondents who are
younger experienced fewer cultural problems than the older respondents.
Table 4.19: Cross Tabulation: Cultural Differences and Communicators‟ Age
Communicators‟ Age Cultural Differences Total Yes No
Zulu Respondents 18 – 21 Years 19(48.7%) 20(51.3%) 39
22 – 25 Years 28(77.8%) 8(22.2%) 36
26 – 30 Years 8(80%) 2(20%) 10
Above 30 Years 4(80%) 1(20%) 5
Total 59 31 90
Chinese Respondents 18 – 21 Years 5(29.4%) 12(70.6%) 17
22 – 25 Years 30(60%) 20(40%) 50
26 – 30 Years 16(84.2%) 3(16.8%) 19
Above 30 Years 4(100%) 4
Total 55 35 90

81
This finding can be attributed to the claim that cultures exist in the minds of
people, and are shaped since they were young. As they grow up, culture
becomes rooted deeper and deeper. This deep structure that unifies a culture,
makes each culture unique, and explains the how and why behind a culture‟s
collective action (Samovar et al., 2007: 35). This study found that younger
people like to experience new cultures.
Table 4.20 (below) reveals that there is a statistically significant difference
between the variables: communication frequency and cultural differences
since p (0.029) < 0.05 for the Chinese respondents. There was no statistically
significant difference for the Zulu respondents.
Table 4.20: Analysis of Variance: Cultural Differences and Communication Frequency
Question 9: Cultural Differences Sum of Squares
df Mean Square
F Sig.
Zulu Respondents
Between Groups Within Groups Total
.302 20.020 20.322
4 85 89
7.545E-02 .236
.320 .864
Chinese Respondents
Between Group Within Groups Total
2.522 18.867 21.389
4 85 89
.630
.222 2.84
0 .029
Findings revealed that the significant difference between the variables: cultural
differences and communication frequency can be attributed to the fact that
Chinese respondents with more communication frequency have less
intercultural communication problems as reflected in Table 4.21 (on page 82).

82
Table 4.21: Cross Tabulation: Cultural Differences and Communication Frequency (Chinese Respondents)
Communication Frequency
Cultural Differences Total Yes No
Chinese Respondents
Very Infrequently 11(64.7%) 6(35.3%) 17
Infrequently 15(75%) 5(25%) 20
Neutral 19(73.1%) 7(26.9%) 26
Frequently 7(43.8%) 9(56.2%) 16
Very Frequently 3(27.3%) 8(72.7%) 11
Total 55 35 90
All cultures tend to train their members to use the categories of their own
cultural experiences when they judge the experiences of people from other
cultures (Lustig and Koester, 1993: 92). That is why cultural differences create
intercultural communication barriers. If people have more opportunities to
communicate with other cultures, they will be able to learn more about the
other cultures, thereby reducing misunderstanding between them. As stated
earlier (see 4.3.1, on page 70), both the Zulu and the Chinese respondents
with more communication frequency experienced less intercultural
communication barriers when communicating with each other.
Cultural differences also cause other barriers, for example, racism problem,
lack of trust, ethnocentrism and cultural stereotyping which are discussed in
the next section.
4.5 THEME FOUR – CULTURAL BARRIERS
In this theme, a combination of questions ten, eleven, thirteen and fourteen are
analyzed.
4.5.1 Analysis of Question Ten: Racism
(see Appendix A, Question Ten and Appendix B, Question Ten)
Table 4.22: Racism
Zulu respondents Chinese respondents
YES NO YES NO
Racism as a problem
12.2% (N=11) 87.8% (N=79) 54.4% (N=49) 45.6% (N=41)

83
In Table 4.22 (on page 82), more than half of the Chinese respondents (54.4%,
N=49) indicated that racism is a problem but only a few of the Zulu
respondents (12.2%, N=11) thought so.
It was evident that racism was a problem for the Chinese students. Taylor and
Katz (1988: 7) recognised that racism can occur at three distinct levels:
individual, institutional, and cultural. According to respondents‟ comments, it
was found that Chinese students are a small community in the selected
university environment. They came from another country and another culture
to a totally unfamiliar country which made them sensitive and aware of
differences. On the questionnaires many Chinese students had also
mentioned that the employment laws in South Africa are unfair. All of the
above added to the Chinese respondents‟ negative perceptions and were
translated into problems of racism. According to Lustig and Koester (1993: 282)
prejudice has been employed by cultures to oppress entire groups of people
and to make it virtually impossible for their members to have access to
political, economic, and social power. In this form, prejudice is considered as
racism as Chinese students are not allowed access to the same privileges as
South African students.
4.5.2 Analysis of Question Eleven: Lack of Trust
(see Appendix A, Question Eleven and Appendix B, Question Eleven)
Table 4.23: Lack of Trust
Zulu respondents Chinese respondents
YES NO YES NO
Lack of trust 27.8% (N=25) 72.2% (N=65) 57.8% (N=52) 42.2% (N=38)
As Table 4.23 (above) reveals, 27.8% (N=25) of the Zulu respondents and
57.8% (N=52) of the Chinese respondents indicated that there was a lack of
trust between them. 72.2% (N=65) of the Zulu respondents and 42.2% (N=38)
of the Chinese respondents did not think so.
Findings revealed that the Chinese respondents experienced the “lack of trust
problem” more than the Zulu respondents. Chinese respondents‟ comments
indicated that South Africa‟s high crime rate was the primary reason why they

84
had lost their trust in “most of the black people” which also included their lack
of trust in Zulu people. On the other hand, the Zulu students commented that
Chinese people do not keep their promises. This is an example of
misunderstanding because of cultural differences. In Chinese culture, people
do not like to refuse other people especially when they are face-to-face. They
would comply with the other‟s request first, thereafter, they would send a
massage or telephone to say they cannot make it – this causes the Zulu
students to lose trust in the Chinese students.
Table 4.24 (below) revealed that there is a statistically significant difference
between communication frequency and “lack of trust” in the case of the Zulu
respondents as p (0.000) < 0.05 and in the case of the Chinese respondents
where p (0.016) < 0.05. it is also evident from Table 4.25 (on page 85) that
both the Zulu and the Chinese respondents with more communication
frequency have less intercultural communication problems in terms of “lack of
trust” when communicating with each other.
Table 4.24: Analysis of Variance: Lack of Trust and Communication Frequency
Question 11: Lack of Trust Sum of Squares
df Mean Square
F Sig.
Zulu Respondents
Between Groups Within Groups
Total
4.607 13.488 18.056
4 85 89
1.152 .158
7.280 .000
Chinese Respondents
Between Group Within Groups
Total
2.900 19.056 21.956
4 85 89
.725
.224 3.233 .016

85
Table 4.25: Cross Tabulation: Lack of Trust and Communication Frequency
Communication Frequency
Lack of trust Total Yes No
Zulu Respondents Very Infrequently 6(66.7%) 3(33.3%) 9
Infrequently 11(57.9%) 8(42.1%) 19
Neutral 3(8.8%) 32(91.2%) 35
Frequently 3(18.8%) 13(81.2%) 16
Very Frequently 2(18.2%) 9(81.8%) 11
Total 25 65 90
Chinese Respondents Very Infrequently 13(76.5%) 4(23.5%) 17
Infrequently 11(55%) 9(45%) 20
Neutral 19(73.1%) 7(26.9%) 26
Frequently 6(37.5%) 10(62.5%) 16
Very Frequently 3(27.3%) 8(72.7%) 11
Total 52 38 90
The findings above suggest that in order to avoid intercultural communication
barriers caused by lack of trust, communicators should increase
communication frequency which in turn will increase understanding between
them and make them familiar with other‟s culture. In this way, they may be able
to overcome obstacles to intercultural communication. Sigband and Bell
(1990: 76) agree that the way to achieve better communication is through
knowledge, appreciation, and understanding of cultural differences rather than
through acceptance or integration.
4.5.3 Analysis Question Thirteen: Ethnocentrism
(see Appendix A, Question Thirteen and Appendix B, Question Thirteen)
Table 4.26: Ethnocentrism
Zulu respondents Chinese respondents
YES NO YES NO
Ethnocentrism as a problem
23.3% (N=21) 76.7% (N=69) 26.7% (N=24) 73.3% (N=66)
23.3% (N=21) of the Zulu respondents and 26.7% (N=24) of the Chinese
respondents in Table 26 (above) indicated that ethnocentrism is a problem
when they communicate with each other; 76.7% (N=69) of the Zulu
respondents and 73.3% (N=66) of the Chinese respondents did not think so.

86
According to Lustig and Koester (1993: 277) all cultures have a strong
ethnocentric tendency, that is, the tendency to use the categories of one‟s own
culture to evaluate the actions of others. However, it is evident from Table 4.26
(on page 85) that ethnocentrism does not have too much of an influence on the
communication between the Zulu and the Chinese students.
4.5.4 Analysis Question Fourteen: Cultural Stereotyping
(see Appendix A, Question Fourteen and Appendix B, Question
Fourteen)
Table 4.27: Cultural Stereotyping
Zulu respondents Chinese respondents
YES NO YES NO
Cultural stereotyping
56.7% (N=51) 43.3% (N=39) 47.8% (N=43) 52.2% (N=47)
Table 4.27 (above) reveals that 56.7% (N=51) of the Zulu respondents and
47.8% (N=43) of the Chinese respondents indicated that cultural stereotyping
is a problem when they communicate with each other. 43.3% (N=39) of the
Zulu respondents and 52.2% (N=47) of the Chinese respondents did not think
so.
Samovar et al. (1998: 246) explain that people learn stereotypes from their
parents, relatives, and friends. Stereotypes develop through limited personal
contact. Dlomo (2003: 43) added that there are two main reasons for the
occurrence of stereotypes and prejudice in intercultural miscommunication.
One is that people expect the same behaviour in the target culture that they
find in their own culture. The second reason is that people often don‟t realize
that the same behaviour can be interpreted differently in two cultures (Albert,
1996: 343).
Lustig and Koester (1993: 286) suggest that there must be a willingness to
explore various cultural experiences without prejudgment and that there must
be a commitment both to learn about other cultures and to understand one‟s
own. Although no one can completely overcome all the obstacles to
intercultural competence that naturally exist, the requisite knowledge,

87
motivation, and skill can certainly help to minimize the negative effects of
ethnocentrism, stereotyping, prejudice and other barriers.
4.6 THEME FIVE – NONVERBAL COMMUNICATION
In this theme, question twelve (see Appendix A, Question Twelve and
Appendix B, Question Twelve) is analyzed.
Table 4.28: Nonverbal Communication
Zulu respondents Chinese respondents
YES NO YES NO
Nonverbal communication
41.1% (N=37) 58.9% (N=53) 50.0% (N=45) 50.0% (N=45)
In Table 4.28 (above), 41.1% (N=37) of the Zulu respondents and 50.0%
(N=45) of the Chinese respondents indicated that nonverbal communication is
a problem when they communicate with each other. 58.9% (N=53) of the Zulu
respondents and 50.0% (N=45) of the Chinese respondents did not think so.
Mitchell (2005: 181) explained that nonverbal communication plays six major
communicative roles, i.e. repetition, contradiction, substitution, accentuation,
complement and regulation that are closely related to verbal communication.
Therefore, nonverbal communication helps communicators to complete their
conversion. However, Chinese respondents commented that the Zulu students
use their own gestures to greet each other and they therefore feel that they
cannot join the Zulu students‟ group. Chinese students also encounter
nonverbal communication problems in their daily lives, for example, when they
call for a taxi, they are required to use different gestures to indicate different
destinations, but Chinese students are not familiar with these gestures and
therefore experience difficulties with transport. The Zulu respondents
commented that nonverbal communication also brings them difficulty
sometimes, like for example when they engage in conversation with Chinese
students. The Chinese students like to keep eye contact to show their respect
and to indicate that they are paying attention but Zulu people avoid direct eye
contact since that is considered rude and defiant behaviour in their culture. It is
evident that nonverbal expressions vary from culture to culture and it is

88
precisely those variations that make misinterpretation of nonverbal
communication a barrier. Therefore, nonverbal communication can create
confusion when people from different cultures communicate with each other.
4.7 THEME SIX – COMMON INTERESTS
In this theme, question fifteen (see Appendix A, Question Fifteen and
Appendix B, Question Fifteen) is analyzed.
4.7.1 Analysis of Question Fifteen (a): Sharing Interesting Topics
Table 4.29: Sharing Interesting Topics
Zulu respondents Chinese respondents
YES NO YES NO
sharing interesting topics
54.4% (N=49) 45.6% (N=41) 61.1% (N=55) 38.9% (N=35)
Table 4.29 (above) reveals that 54.4% (N=49) of Zulu respondents and 61.1%
(N=55) of Chinese respondents indicated that they share common interests in
terms of topics of discussion with each other. 45.6% (N=41) of the Zulu
respondents and 38.9% (N=35) of the Chinese respondents did not share
common interests topics.
Table 4.30 (below) reveals that there is a statistically significant difference
between “communication frequency” and “sharing interesting topics” as
p (0.000) < 0.05 for the Zulu respondents and p (0.047) < 0.05 for the Chinese
respondents.
Table 4.30: Analysis of Variance: “Sharing Interesting Topics” and Communication Frequency
Question 15a: Sharing Interesting Topics
Sum of Squares
df Mean Square
F Sig.
Zulu Respondents
Between Groups Within Groups
Total
9.549 12.773 22.322
4 85 89
2.387 .150
15.887 .000
Chinese Respondents
Between Group Within Groups
Total
2.264 19.125 21.389
4 85 89
.566
.225 2.515 .047
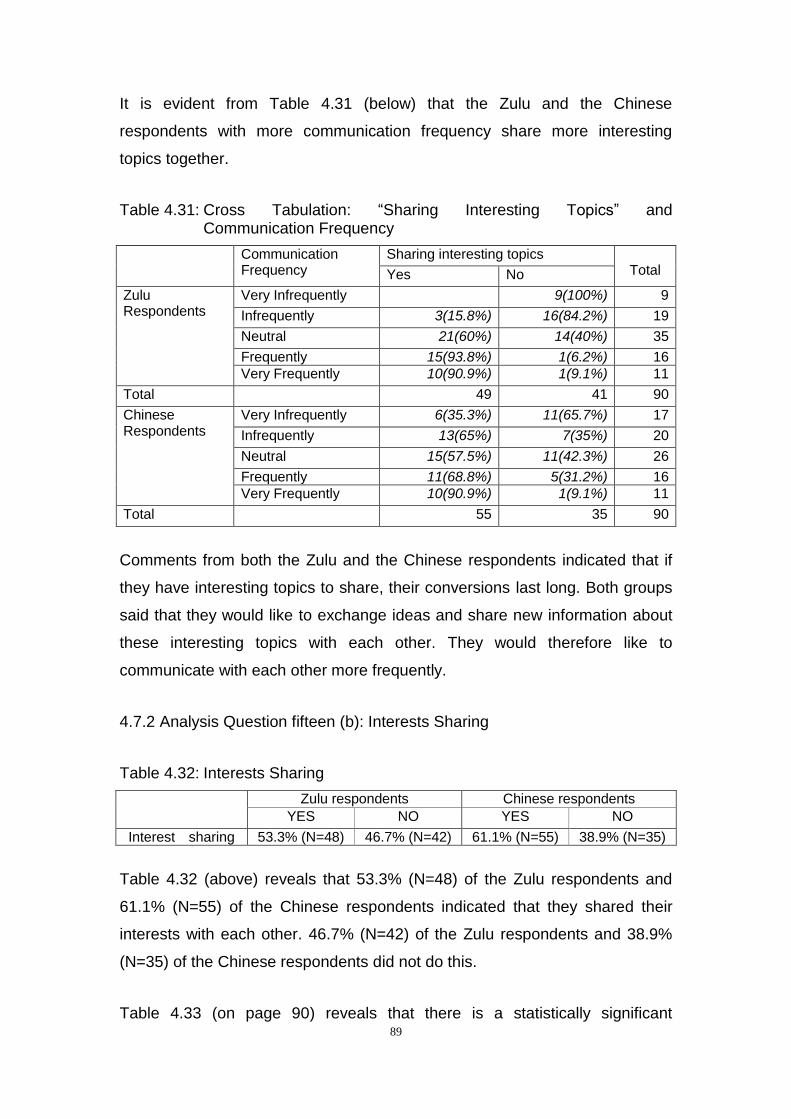
89
It is evident from Table 4.31 (below) that the Zulu and the Chinese
respondents with more communication frequency share more interesting
topics together.
Table 4.31: Cross Tabulation: “Sharing Interesting Topics” and
Communication Frequency
Communication Frequency
Sharing interesting topics Total Yes No
Zulu Respondents
Very Infrequently 9(100%) 9
Infrequently 3(15.8%) 16(84.2%) 19
Neutral 21(60%) 14(40%) 35
Frequently 15(93.8%) 1(6.2%) 16
Very Frequently 10(90.9%) 1(9.1%) 11
Total 49 41 90
Chinese Respondents
Very Infrequently 6(35.3%) 11(65.7%) 17
Infrequently 13(65%) 7(35%) 20
Neutral 15(57.5%) 11(42.3%) 26
Frequently 11(68.8%) 5(31.2%) 16
Very Frequently 10(90.9%) 1(9.1%) 11
Total 55 35 90
Comments from both the Zulu and the Chinese respondents indicated that if
they have interesting topics to share, their conversions last long. Both groups
said that they would like to exchange ideas and share new information about
these interesting topics with each other. They would therefore like to
communicate with each other more frequently.
4.7.2 Analysis Question fifteen (b): Interests Sharing
Table 4.32: Interests Sharing
Zulu respondents Chinese respondents
YES NO YES NO
Interest sharing 53.3% (N=48) 46.7% (N=42) 61.1% (N=55) 38.9% (N=35)
Table 4.32 (above) reveals that 53.3% (N=48) of the Zulu respondents and
61.1% (N=55) of the Chinese respondents indicated that they shared their
interests with each other. 46.7% (N=42) of the Zulu respondents and 38.9%
(N=35) of the Chinese respondents did not do this.
Table 4.33 (on page 90) reveals that there is a statistically significant

90
difference between “communication frequency” and “interests sharing” as
p (0.000) < 0.05 for the Zulu respondents and p (0.047) < 0.05 for the Chinese
respondents.
Table 4.33: Analysis of Variance: “Interests Sharing” and Communication Frequency
Question 15b: Interests Sharing Sum of Squares
df Mean Square
F Sig.
Zulu Respondents
Between Groups Within Groups
Total
10.364 12.036 22.400
4 85 89
2.591 .142
18.298 .000
Chinese Respondents
Between Group Within Groups
Total
2.264 19.125 21.389
4 85 89
.566
.225 2.515 .047
Table 4.34 (below) also reveals that Zulu and Chinese respondents with more
communication frequency get more of an opportunity to share their interests
with each other.
Table 4.34: Cross Tabulation: Interests Sharing and Communication Frequency
Communication Frequency
Interests sharing Total Yes No
Zulu Respondents
Very Infrequently 9(100%) 9
Infrequently 2(10.5%) 17(89.5%) 19
Neutral 21(60%) 14(40%) 35
Frequently 15(93.8%) 1(6.2%) 16
Very Frequently 10(90.9%) 1(9.1%) 11
Total 48 42 90
Chinese Respondents
Very Infrequently 6(35.3%) 11(65.7%) 17
Infrequently 13(65%) 7(35%) 20
Neutral 15(57.7%) 11(42.3%) 26
Frequently 11(68.8%) 5(31.2%) 16
Very Frequently 10(90.9%) 1(9.1%) 11
Total 55 35 90
Tables 4.35 and 4.36 (on page 91) indicate that “sharing interesting topic” and
“interests sharing” have a statistically significant correlation with each other
since these variables have a p value of 0.000, which is below 0.05. This means
that communicators who share interesting topics should have the same
interests and vice versa, in other words if people have common interests they
are easily able to share interesting topics. Respondents‟ comments indicated

91
that playing soccer and basketball are common interests for males but not
badminton or tennis. Female respondents share most of each other‟s interests
which include fashion, shopping, entertainment news, movie, soapies, etc.
Table 4.35: Correlation: Sharing Interesting Topics and Interests Sharing (Zulu Respondents)
Sharing interesting topics
Interests sharing
Sharing interesting topics
Pearson Correlation Sig. (2-tailed)
N
1.000 .
90
.978** .000
90
Interests sharing
Pearson Correlation Sig. (2-tailed)
N
.978** .000
90
1.000 .
90
** Correlation is significant at the 0.001 level (2-tailed).
Table 4.36: Correlation: Sharing Interesting Topics and Interests Sharing (Chinese Respondents)
Sharing interesting topics
Interests sharing
Sharing interesting topics Pearson Correlation Sig. (2-tailed)
N
1.000 .
90
1.000** .000
90
Interests sharing
Pearson Correlation Sig. (2-tailed)
N
1.000** .000
90
1.000 .
90
** Correlation is significant at the 0.001 level (2-tailed).
It is clear from the above discussion that “interests sharing” and “sharing
interesting topics” occur when communicators‟ communicate with each other
frequently. Respondents also remarked that when they share interesting topics
with people from another culture, they feel closer to each other, and that this
also enables them to learn more about each others‟ cultures. This also reveals
that common interests are incentives to have intercultural conversations.
4.8 SUMMARY OF OBSERVATION REPORT
Table 4.37 (on pages 92-93) is a report on the observations of Zulu and
Chinese students‟ daily communication with each other. It includes
communicators‟ behaviours, customs, and characteristics of their verbal and
nonverbal communication.

92
Table 4.37: Observation Report
Types Focus on Name of group members
Zulu Respondents Chinese Respondents
Daily
be
ha
vio
urs
Greeting behaviour Zulu students like to hug each other or have a special handshake when they meet.
When Chinese students meet each other, most of them smile or nod and say “Hi” or “Hello”.
Compliment and
response behaviour
Zulu students like to receive compliments. Chinese students usually refuse compliments and respond with humility.
Cu
sto
ms
Accepting goods They put their left hand on the right wrist and use the right hand to accept goods.
They use one hand to accept goods, but on formal occasions, people prefer to receive gifts or certificates with both hands to show respect.
Sitting They usually find a seat and sit down when they come into a room without waiting for permission or consent.
They won‟t sit down until they are given permission or consent to do so.
Manners To old people: they do not pay special attention to old people because helping an old man may sometimes be viewed negatively, like you think them too old to do anything for themselves. The old people are usually not happy to accept other people‟s help, because they think they can do things for themselves.
To old people: They help their elders and the elders are happy to accept.
They are able to wait patiently in queues. They are not used to standing in queues.

93
C
ha
racte
ristic o
f ve
rba
l com
mu
nic
atio
n
Pronunciation They have a distinct accent when they speak English. These pronunciations can be understood by Indians, Whites and other students.
They have a distinct accent when they speak English. Their pronunciations are not understood easily not only by Zulu students but also by other cultures in South Africa. They cannot pronounce a word clearly if it is too long.
Tone They have certain sounds which are not available in English, for example clicks like „c‟, „q‟, „gq‟ and „xh‟”
Their words sometimes have a Chinese “sound” even when they speak English.
Language They speak Zulu as a first language, but if they are speaking with students from other languages backgrounds they usually speak English.
They speak Chinese most of the time. Even when there are English speaking students present, Chinese students still prefer to communicate in Chinese.
Phrasing (syntax) They use simple, easy words and sentences. They are used to Chinese syntax to construct sentences.
Content of dialogue
When they meet, they normally talk about the weather, what they did or are going to do and other interesting topics. They avoid personal questions.
When they meet they normally ask each other where they are going and what they are going to do. They talk about their life and they exchange school news, job information or entertainment news.
Ch
ara
cte
ristics o
f n
on
ve
rbal
co
mm
unic
ation
Eye contact They avoid too much eye contact during a conversation. They maintain eye contact to show their interest and understanding in a conversation.
Gestures They have special gestures, for example, greeting gestures and gestures to take a taxi.
They do not use too many gestures.
Facial expressions They like to express their emotion via facial expressions.
When they talk, they do not have too many facial expressions.

94
As Lustig and Koester (1993: 262) explained competent interpersonal
relationships among people from different cultures do not happen just by
accident. They occur as a result of the knowledge and perceptions that people
have about one another, their motivations to engage in meaningful interaction,
and their ability to act in ways that are regarded as appropriate and effective. The
report (Table 4.37, on pages 92-93) reveals that the Zulu and the Chinese
students have totally different behaviours, customs, and verbal and nonverbal
communication characteristics. When they communicate with each other, some
or all of these factors may become obstacles in the communication process. The
findings suggest that it is necessary to learn about peoples‟ cultures, to share
your culture with those people in order to overcome the inevitable differences
which may occur in intercultural relationships. Lustig and Koester (1993: 272)
add that learning to use culturally sensitive ways to handle the differences and
disagreements that may arise are additional ways to improve intercultural
relations.
4.9 CONCLUSION
Chapter Four analysed the quantitative and qualitative data gathered in this
study.
It presented the findings of the questionnaires from the Zulu and the Chinese
respondents to investigate the intercultural communication barriers between
them. It analyzed the findings under six research themes: communication ability,
language problems, cultural differences, barriers to intercultural communication
(racism, trust, ethnocentrism and stereotyping), nonverbal behaviour and
common interests amongst the respondents.
Chapter five discusses the conclusions of this study and makes
recommendations for further research.

95
CHAPTER FIVE – CONCLUSIONS AND RECOMMENDATIONS
5.1 INTRODUCTION
Chapter four analyzes and interprets the data from the questionnaires by using
descriptive and inferential statistics.
In this final chapter, discussion of the theoretical and practical implications
regarding intercultural communication barriers between Zulu and Chinese
students based on the results obtained in this study are presented. Finally,
recommendations are made for further study.
5.2 SUMMARY OF THE STUDY
Chapter two reviewed theories and literature relevant to defining and
understanding the barriers of intercultural communication. The Transactional
Communication Model was introduced to provide a basis for the investigation into
intercultural communication barriers between Zulu and Chinese students. In
intercultural communication, misunderstandings often occur because of the way
people interpret verbal and nonverbal behaviours. This is caused by the display
rules of cultures and how each culture attaches different meanings concerning
the appropriateness and effectiveness of particular interaction sequences. It is
therefore important for one to understand the display rules before one exhibits
certain verbal and nonverbal behaviours in order to avoid misunderstanding.
Cultural differences also cause other problems of racism, lack of trust,
ethnocentrism, cultural stereotyping and prejudices. Although no one can
completely overcome all the possible obstacles to intercultural competence, the
requisite knowledge, motivation, and skill can certainly help to minimize the
negative effects of ethnocentrism, stereotyping, prejudice and other barriers.
Chapter three described the methodology in this study. The various techniques
that were employed in this study were highlighted. The research design was
discussed and provided insight into the sampling method, i.e. the questionnaire
and observation report. This chapter has also revealed that the methodology was

96
designed to maximize reliability and validity which is crucial for the analysis of the
results and the credibility of this study.
Chapter four categorised six themes to present the findings of the questions that
were posed to the Zulu and the Chinese students to elicit their opinions about
their intercultural interaction in the communication process. Theme one
examined the communication ability of the respondents, theme two examined
language problems, theme three focused on cultural differences, theme four
examined the barriers to intercultural communication (racism, trust,
ethnocentrism and stereotyping), and theme five investigated nonverbal
behaviour. Theme six examined the common interests amongst respondents.
The findings revealed that intercultural communication barriers do exist between
Zulu and Chinese students. Cultural differences and language problems were
found to be the main intercultural communication barriers. In addition, the
problems of nonverbal communication, racism, ethnocentrism, cultural
stereotyping were also viewed as obstacles of the intercultural communication
process.
5.3 ACHIEVEMENT OF THE OBJECTIVES
The aim of this study was to investigate the intercultural communication barriers
between Zulu and Chinese students at selected HEIs in Durban.
5.3.1 First Objective
The first objective was to determine whether intercultural communication
problems do exist between Zulu and Chinese students.
The literature provided an understanding of intercultural communication and its
barriers. It was found that verbal and nonverbal cultural differences can affect
communicators‟ encoding and decoding messages which can lead to
misunderstanding. Culture shares interpretations about beliefs, values and
norms and these can be observed in people‟s behaviours. Culture provides

97
guidelines about how people should behave and indicates what to expect in
interactions with others. Therefore, when one interacts with someone from
another culture, one may find that an appropriate interpretation and reaction in
one‟s own culture may be viewed as inappropriate in the other culture.
Language and nonverbal communication are influenced by culture, especially in
this study where the communicators spoke different languages. Their tone,
accent, verbal code system, conversational style, body language, facial
experiences and other verbal and nonverbal communication behaviours differed
from each other.
Evidence from this study suggests that the objectives have been achieved, as
intercultural communication barriers do exist between Zulu and Chinese
students.
5.3.2 Second Objective
The second objective was to identify the intercultural communication problems
experienced between Zulu and Chinese students.
The findings revealed that culture and language problems are the main barriers.
Racism, cultural stereotyping, nonverbal communication and lack of trust were
other obstacles in intercultural communication between the Zulu and the Chinese
students. The particular characteristics of respondents, such as their age,
educational level and home language influenced intercultural communication.
Other factors included respondents‟ communication ability and communication
frequency.
The Transactional Model of Communication was utilized in this study to relate the
process of communication. The model displayed the components of
communication, viz. source, encoding, message, channel, noise, decoding,
feedback, and context which are relative to this study. The conclusions on the
application of this model revealed that all ten components were effectively
utilized during the communication process between the Zulu and the Chinese

98
students.
Chapter four analyzed and reported on the Zulu and the Chinese respondents‟
intercultural communication experiences. Findings revealed that language
problems amongst Zulu and Chinese students are viewed as common barriers.
Comments from respondents revealed that a communicators‟ accent, different
grammar structure and the words they use are confusing during their intercultural
communication experiences. This is supported by Seiler and Beall (2008: 85)
who believe that the ability to use sounds and grammar correctly is crucial to
competent communication. Successful communication with someone from
another culture involves understanding a common language (Chaney and Martin,
2004: 85).
An observation report also revealed further intercultural communication problems.
Different customs, nonverbal communication problems and different daily
communication behaviours were noted. It is evident that language provides the
conceptual categories that influence how its speakers‟ perceptions are encoded
and stored. Language holds us together as groups, differentiates us into groups,
and also controls the way we shape concepts, how we think, how we perceive,
and how we judge others (Jandt, 2004: 49). Findings revealed that the Zulu
students would like to use nonverbal communication to complete their
conversations, however the observation report indicates that Chinese students
are not good at using nonverbal communication especially unfamiliar gestures as
it confuses the communication process.
Findings from the analyses in chapter four revealed that if people communicate
regularly, there will be less intercultural barriers. This finding may suggest that
students should be encouraged to participate regularly in intercultural
communication to improve intercultural competence. These findings are in line
with Lustig and Koester (1993: 317) who believe that the ability to manage
interactions with others, skills in enacting appropriate task and relational role
behaviours, the capacity to tolerate uncertainty without anxiety, and a non
evaluation posture toward the beliefs and actions of others must be in order to
set up an acculturation environment.

99
5.3.3 Third Objective
The third objective was to examine the reasons why cultural divides exist
between Chinese and Zulu students. To achieve this objective, in chapter four,
question seventeen analyzed Zulu and Chinese students‟ responses using eight
specific statements. Results revealed answers to each statement were totally
different. The reason is that people are influenced by their culture from an early
age and this affects the way they interpret information regarding intercultural
experiences. Cultures differ not only in their beliefs and values but also in terms
of their norms. Beliefs affect people‟s conscious and unconscious minds, as well
as the manner in which they communicate. Therefore beliefs are the first cultural
influence which may lead to misunderstanding in intercultural communication.
Each person has a unique set of individual values which tend to permeate a
culture. People use their own value to judge other people which make it a
complex situation. Different norms may cause disagreements especially in an
intercultural environment since people have different cultural backgrounds and
they have their own rules to judge behaviours and social routines. Therefore,
people from other cultures may organize their ideas, put their customs first and
structure their conversations in a manner that differs from another culture.
Findings revealed that cultural differences may also led to racism, lack of trust,
ethnocentrism and stereotyping. Racism involves beliefs, attitudes, and
behaviours of a given person toward people of a different racial group. It also
excludes people from participating with other race groups and denies the
interaction of cultural participation with other groups. Lack of trust led to
uncomfortable situations marred by doubt and suspicion. Ethnocentrism makes
people believe that the values of their culture are natural and correct and that
people from other cultures, who do things differently, are wrong. Cultural
stereotyping classifies every member of a culture in the same way. Therefore,
stereotypes are a form of generalization about groups of people and makes
assertions about the characteristics of all people who belong to that group.

100
5.4 RECOMMENDATIONS
Based on the context of this study the following recommendations can be made:
Communicators from different cultures should ideally study the language
of another culture. Simple terms like greetings would be useful to avoid
unnecessary barriers and would assist in building relationships.
This study emphasized how cultural differences give rise to intercultural
communication barriers. Therefore, it is important that communicators
acquire knowledge about other cultures. Communicators can study
about a different culture from books, movies, or by making regular
contact with another culture.
Cultural studies should be included in relevant syllabi at universities.
Communicators should be advised to explore various cultural
experiences without prejudgment. The ability to adapt to changes in
terms of different beliefs, values, norms as well as verbal and nonverbal
codes and to behave appropriately and effectively with different cultures
is advised.
5.5 DIRECTIONS FOR FURTHER STUDY
Several aspects emerged during the course of this study, but were not discussed
in detail as they were beyond the scope of this study but are certainly important
for further study.
Further research could explore the following:
A study on Zulu and Chinese cultures in terms of specific approaches
including cultural differences, which works as a determining factor to
influence intercultural communication should be analysed.

101
A study to investigate intercultural communication barriers in a
multicultural learning environment.
This study focused on respondents in a university environment.
Research into intercultural communication in the corporate sector should
also be explored.
This study was limited to universities in KwaZulu-Natal further study
could gather information on a wider scale and involve more universities
in South Africa.
Cultural issues are resilient to contemporary life in South Africa and across the
globe. Intercultural communication is a necessity to understand how people
communicate, using verbal varieties and nonverbal codes which allows them to
work together to build relationships. In this complex academic world, the mixing
of different cultures and languages are necessary for effective communication
and to ensure that harmonious team work takes place.

102
LIST OF REFERENCES
Aaker, D. A., Kumar, V. and Day, G. S. 2001. Marketing Research. 7th ed. New
York: John Wiley and Sons.
Albert, D. R. 1996. A framework and model for understanding Latin American
and Latino/ Hispanic cultural patterns in Landis, D and Bhagat, R. S. (eds).
Handbook of intercultural training (2nd edition). U.S.A: Sage Publications.
Abbu, A. R. 2006. Consumer attitudes towards curbside recycling of waste within
the eThekwini municipality area. Unpublished Masters Dissertation. Durban
University of Technology, South Africa.
An activist’s guide to research and advocacy: Core manual – research and
analysis skills strengthening programme. 2003. Unpublished manual.
Durban: University of Natal, Centre for Civil Society.
Arsham, H. 1994. Topics in statistical data analysis: Revealing facts from data.
9th ed. [Online] Available:
http://www.mirrorservice.org/sites/home.ubalt.edu/ntsbarsh/Business-stat
[Accessed: 2 April 2008].
Avruch and Black. 1993. Cross-cultural communication issues facing
international managers. [Online] Available:
http://www.ubiconnect.com/files/Communications article.pdf [Accessed: 17
June 2007].
Baidu, 2007. Please introduce Chinese Culture to a foreigner. [Online] Available:
http://zhidao.baidu.com/question/36035437.html [Accessed: 18 May 2009].
Bi, J. W. 1999. Intercultural Nonverbal Communication. Beijing: English Teaching
Publication.
Blaikie, N. 2000. Designing Social Research. New York: Blackwell Publishers

103
Ltd.
Blauner, R. 1972. Racial Oppression in America. New York: Harper and Row.
Borden, G.A. 1991. Cultural Orientation: An Approach to Understanding
Intercultural Communication. Upper Saddle River, NJ: Prentice Hall.
Burger, B. (ed.) 2007. South Africa Yearbook 2006/07. Cape Town: GCIS.
Chaney, L. and Martin, J. S. 2004. Intercultural Business Communication. 3rd ed.
Upper Saddle River, NJ: Prentice Hall.
Chick, J. K. 1985. The interactional accomplishment of discrimination in South
Africa. Language in society, 14(3): 299-326.
Chinese Embassy in South Africa. 2006. [Online] Available:
www.chinese-embassy.org.za [Accessed: 15 June 2007].
Cohen, L. Manion, L. and Morrison K. R. B. 2007. Research Methods in
Education. 6th ed. London: Routledge
Crask, F. 2000. A Sampler on Sampling. New York: John Wiley.
De Kadt, E. 1992. Politeness phenomena in South African Black English. In
Sociolinguistics for Applied linguistics by I.A. Stevenson and Papo, F. M.
Pretoria. Department of Linguistics: UNISA.
De Vaus, D. A. 2002. Surveys in Social Research. 5th ed. London: Routledge.
Dillman, D. A. 2000. Mail and Internet Surveys: The Tailored Design Method. 2nd
ed. New York: Wiley.
Dillon, W. R., Madden, T. J. and Firtle, N. 1994. Marketing Research in A
Marketing Environment. 3rd ed. Boston: Irwin.
Dlomo, T. 2003. An investigation into cultural barriers in intercultural communication

104
between Blacks and Indians at the Durban Institute of Technology. Unpublished
Masters Dissertation, Department of Sociolinguistics, University of South Africa.
Elion, B. and Strieman, M. 2001. Clued up on Culture: A Practical Guide for
South Africa. Camps Bay: One life Media cc.
Etiquette in China. 2009. [Online] Available: http://www.warriortours.com/
essential/getting_acquainted/etiquette.htm [Accessed: 18 August 2009]
Far & Wild Safaris. 2003. The Battlefields of KwaZulu Natal. [Online] Available:
http://www.africasafari.co.za/battlefields.htm [Accessed: 1 May 2008]
Fielding, M. 1993. Effective Communication in Organizations: Preparing
Messages that Communicate. Cape Town: Juta and Co. Ltd.
Fielding, M. 2006. Effective Communication in Organisations. 3rd ed. RSA: Juta.
Fink, A. 1995. How to Ask Survey Questions. Thousand Oaks, CA: Sage.
Gamble, T. K. and Gamble, M. 1996. Communication Works. 5th ed. New York:
McGraw-Hill.
Gao, Y. (ed). 2007. Survey: More than 80% Chinese University Students Want to
Study Abroad. [Online] Available:
http://news.xinhuanet.com/english/2007-12/07/content_7216547.htm
[Accessed: 28 January 2008].
Ghauri, P. and Gronhaug, K. 2002. Research Methods in Business Studies: A
Practical Guide. 2nd ed. England: Pearson Education Limited.
Hall, E. T., 1977. Beyond Culture. New York: Garden City.
Hussey, J. and Hussey, R. 2000. Business Research: A Practical Guide for
Undergraduate and Postgraduate Students. Bristol: Macmillan Press.

105
Jandt, F. E. 2004. An Introduction to Intercultural Communication: Identities in A
Global Community. 4th ed. USA: Sage Publications. Inc.
Jones, J. M. 1988. Racism in Black and White: A bicultural model of reaction and
evolution. In Katz, P. A. and Taylor, D. A. (eds). Eliminating Racism: Profiles
in Controversy. pp. 137-157. New York: Plenum Press.
Joseph, F., Hair, J. R., Babin, B., Money, A. H. and Samouel, P. 2003. Essentials
of Business Research Methods. USA: John Wiley and Sons, Inc.
Kaschula, R. H. and Anthonissen, C. 1995. Communicating Across Cultures in
South Africa: Toward a Critical Language Awareness. Johannesburg: Hodder
and Stoughton.
Kruger, W. L. 1990. Intercultural Communication in the Eastern Cape: Similarity
Versus Variety. Communicare, vol. 9: pp. 219-228.
Levesque, R. 2007. SPSS Programming and Data Management: A Guide for
SPSS and SAS Users. 4th ed. Chicago: SPSS Inc.
Linde, V. Intercultural communication within multicultural schools: educational
management insights. [Online] Available: http://findarticles.com/p/articles/mi_
qa3673/is199701/ain8752094 [Accessed: 28 January 2008].
Lustig, M. W. and Koester, J. 1993. Intercultural Competence: Interpersonal
Communication Across Cultures. New York: HarperCollins College
Publishers.
Lustig, M.W. and Koester, J. 2006. Intercultural Competence: Interpersonal
Communication Across Cultures. Boston: Pearson Education.
Martin, J. N. and Nakayama, T. K. 2001. Experiencing Intercultural
Communication: An Introduction. California: Mayfield Publishing Company.
Mente, B. D. 2000. The Chinese Have a Word for it: The Complete Guide to

106
Chinese Thought and Culture. New York: McGraw-Hill Contemporary.
McDaniel, T. and Gates, F. 2002. Principles and Quantitative Methods. Boston:
PWS Publishers.
Mitchell, A. (ed.) 2005. Among Cultures: The Challenge of Communication. 2nd
ed. USA: Thomson Wadsworth.
Naoum, S. 2001. Dissertation Research and Writing for Construction Students.
Los Angeles: Reed Educational and Professional Publishing Ltd.
Nel, P. A., Radel, F. E. and Laubser, M. 1990. Researching the South African
Market. Prertoria: UNISA.
Neuliep, J. W. 2006. Intercultural Communication: A Contextual Approach. 3rd
ed. USA: Sage Publications. Inc.
Neuman, W. L. 2000. Social Research Methods. 2nd ed. London: Allyn and
Bacon.
Njobe, M.P. 2007. Understanding the influence of a second language on the
academic performance of learners in Information Technology: A case study
of IsiZulu speaking English second language learners in KwaZulu-Natal.
Unpublished Masters Dissertation. Department of Information Technology,
Durban University of Technology, South Africa.
Page, C. and Meyer, D. 2000. Applied Research Design for Business and
Management. Australia: McGraw-Hill.
Parry, L. L. 1993. Cultural barriers to intercultural/ interracial communication
among Black and White South African women. Communicare 12(2): 5-2.
Parry, L. L. 2000. South African women: an intercultural perspective.
Communication 26(2): 65-72.
Pearson, J., Nelson, P., Titsworth, S. and Harter, L. 2006. Human

107
Communication. 2nd ed. New York: McGraw-Hill.
Potlane, J. 1991. Demystifying intercultural interaction in the South Black
Context. Paper delivered at a Seminar on the Incorporation of uBuntu into a
uniquely South African Approach to Management, Midrand, 30 October.
Rampersad, R. 2007. Toward communication challenges in an age of diversity:
Critiquing cross-cultural communication challenges in a multicultural learning
environment. Paper delivered at the International Association for Intercultural
Communication Studies (IAICS), July. Harbin, China.
Samovar, L. A, and Porter, R. E. 1982. Intercultural Communication: A Reader.
6th ed. Belmont, CA: Wadsworth.
Samovar, L. A., Porter, R. E. and Stefani, L. A. 1998. Communication Between
Cultures. Belmont, CA: Wadsworth Publishing Company.
Samovar, L. A., Porter, R. E. and McDaniel, E. R. 2007. 6th ed. Communication
Between Cultures. Belmont, CA: Wadsworth/ Thomson Learning.
Sardha, S. 2000. A pilot study into how well business in the central business
district of Durban is equipped to handle the consumer movement in the new
millennium. Unpublished Bachelors Dissertation. Durban University of
Technology, South Africa.
Saunders, M., Lewis, P. and Thornhill, A. 2003. Research Methods for Business
Students. 3rd ed. England: Pearson Education Limited.
Scollon, R. and Scollon, S. W. 2001. Intercultural Communication: A Discourse
Approach. 2nd ed. Oxford, UK: Blackwell.
Seiler, W. J. and Beall, M. L. 2008. Communication: Making Connections. 7th ed.
Boston: Pearson Education, Inc.
Sekaran, U. 2003. Applied Cusiness Research: Qualitative and Quantitative

108
Methods. Milton: John Wiley.
Sekaran, U. 2006. Research Methods for business: A Skill-Building Approach. 4th
ed. New York: John Wiley & Sons, Inc.
Sekaran, M. 2000. Marketing Research and Analysis. Englewood Cliffs: Prentice
Hall International, Inc.
Sigband, N.B. and Bell, A.H. 1990. Communication for Managers. Cincinnati,
Ohio: South-Western Publishing.
Sosibo, L. and Harvey, J. 2000. IsiZulu. [Online] Available:
http://www.humnet.ucla.edu/aflang/zulu/home.html [Accessed: 1 May 2007].
Statistics: headcount by race at DUT 2007. Faculty Information acquired from the
Department of Management Information Systems at the Durban University of
Technology.
Statistics: headcount by race at UKZN 2007. Faculty Information acquired from
the Department of Management Information Systems at the University of
KwaZulu-Natal
Steinberg, S. 2002. Communication Study: An Introduction. Cape Town: Juta
and Co. Ltd.
Steinberg, S. 2006. Introduction to communication. Course book 1: The basics.
Cape Town: Juta and Co. Ltd.
Steinberg, S. 2007. An Introduction to Communication Studies. Cape Town: Juta
and Company Limited
Study South Africa. 2007. International Education Association of South Africa.
[Online] Available: http://www.studysa.co.za/contentpage.aspx?pageid=4152
[Accessed: 21 February 2008].
Sutter, E. 2004. Cross-cultural consumer behaviour – A comparison between

109
Germany and the U.S. Scholarly paper (Advanced Seminar) at the Institution
of Hochschule Fuer Wirtschaft und Umwelt Nuertingen. Nuertingen Germany
[Online] Available: http://www.grin.com/en/ preview/35648.html [Accessed:
22 March 2008].
Taylor, D. A. and Katz, A. 1988. Eliminating Racism: Profiles in Controversy.
New York: Plenum Press.
Ting-Toomey, S. 1999. Communicating Across Cultures. New York: The Guilford
Press.
The Free Encyclopaedia. 2009. Research ethics. [Online] Available:
http://en.wikipedia.org/wiki/Research_ethics [Accessed: 25 May 2009].
The Free Encyclopaedia. 2009. Ethnocentrism. [Online] Available:
http://en.wikipedia.org/wiki/Ethnocentrism [Accessed: 25 May 2009].
The Free Encyclopaedia. 2009. Stereotype. [Online] Available:
http://en.wikipedia.org/wiki/Stereotype [Accessed: 25 May 2009].
The Free Encyclopedia. 2009. Etiquette in Asia. [Online] Available:
http://en.wikipedia.org/wiki/Etiquette_in_Asia#Humility [Accessed: 25 May
2009].
Verderber, R. F. 1990. Communicate. Belmont, CA: Wadsworth Publishing
Company.
Wang, C. 1999. Teaching English pronunciation to Taiwanese children. Paper
presented at The International Conference on ESL/EFL Literacies in the
Asia-Pacific Region, December. Tunhai University, Taichung.
Welman, J.C. and Kruger S.J. 1999. Research Methodology for theBusiness and
Administrative Sciences. Cape Town: International Thomson Publishing.
White, B. 2000. Dissertation Skills for Business and Management Students. New

110
York: Martins the Printers Ltd.
White, B. 2003. Dissertation Skills for Business and Management Students. 2nd
ed. London: Continuum.
Yao, J. 2007. To evaluate the level of customer service offered to clients of Pick
’n Pay stores in the greater Durban area. Unpublished Masters Dissertation.
Durban University of Technology, South Africa.
Zulu Cultural Tour. 2009. [Online] Available:
http://www.zulani.co.za/St%20Lucia%20Attractions/Zulu%20Cultural%20Tou
r/ [Accessed: 10 May 2008].
Zulu Culture. 2008. Zulu Family Structure. [Online] Available:
http://www.zulu-culture.co.za/zulu_family.php [Accessed: 10 May 2008].
Zulu Etiquette. 2006. [Online] Available:
http://www.warthog.co.za/dedt/tourism/culture/family/etiquette.htm
[Accessed: 10 May 2008].
Zulu Traditions & Culture. 2007. [Online] Available:
http://www.drakensberg-tourism.com/zulu-culture-traditions.html [Accessed:
10 May 2008].

111
Appendix A
Questionnaire: Zulu Students

112
Dear Students
I am studying towards an M-Tech degree in Public Relations Management at the
Durban University of Technology. I am conducting a study on intercultural
communication barriers between Zulu and Chinese students at selected Higher
Education Institutions in Durban. This questionnaire is part of an M-Tech
dissertation.
Kindly assist me by completing the attached questionnaire. The information you
provide will be kept strictly confidential and only aggregate figures will be
reported.
Please return the complete questionnaire to Jin Zheng at the address below.
Thank you for your time and effort.
Yours Sincerely,
Jin Zheng
263 Fenniscowles Road, Umbilo, Durban 4001, SA.
Cell: 072 2356 597
3 March 2008

113
Questionnaire for Zulu Students
Section A: Personal Data
1. Please indicate your gender. (Please tick one)
Male
Female
2. Please indicate your age. (Please tick one)
18-21 Years
22-25 Years
26-30 Years
Above 30 Years
3. Please tick your home language:
English
IsiZulu
Other
4. Please indicate your highest educational level. (Please tick one)
Matric
Diploma/Degree
Masters
Doctorate
Other (Please specify)………………….
5. Please indicate the name of your university and the department you are
registered with.
_____________________________________________________________

114
6. How many times a week do you communicate with Chinese students?
Please tick where applicable.
Infrequently Frequently
Section B
7. Are you able to communicate easily with Chinese students?
Yes No
8. Do you think language is a problem when you communicate with
Chinese students?
Yes
No
If yes, please explain what problems you have experienced.
9. Do you think cultural differences are a problem when you communicate
with Chinese students?
Yes
No
If yes, please explain what problems you have experienced.
1 2 3 4 5 6 7
1 2 3 4 5 6 7

115
10. Is racism a problem when you communicate with Chinese students?
Yes
No
If yes, please explain what problems you have experienced.
11. Is there a lack of trust between yourself and the Chinese students?
Yes
No
If yes, please explain what problems you have experienced.
12. Do you experience problems with nonverbal communication, i.e.
gestures, eye contact, facial expressions with Chinese students?
Yes
No
If yes, please state what problems you have experienced with nonverbal
communication.

116
13. Does ethnocentrism (a person’s belief that their culture is superior to
others) affect communication with Chinese students?
Yes
No
If yes, please explain your answer.
14. Does cultural stereotyping (generalization about people from a specific
culture) affect your communication with Chinese students?
Yes
No
If yes, please explain your answer.
15 (a). Do you share common interests in terms of topics of discussion
with Chinese students?
Yes
No
If yes, please explain your answer.

117
15 (b). Do you think that Chinese students share your interests in terms of
sport and leisure?
Yes
No
If yes, please explain your answer.
16. Specify any language problems you encounter when you communicate with Chinese students who do not speak your language. Please tick the relevant box/es.
I cannot clearly understand them
They do not clearly understand me
I do not have enough words to express myself
I have to repeat myself several times
I do not communicate with them because I am afraid I do not know enough about them
Other (specify)

118
17. Consider the following statements when you communicate with Chinese students. Please tick the relevant box/es.
Strongly disagree
Disagree Agree Strongly agree
It is important to send nonverbal signals which are not confusing when communicating
A person who is silent means that s/he does not understand the message
It is important to maintain eye contact with a person in order to see whether s/he is honest or not
Interrupting a person during a conversation is rude and impolite
A person who speaks with a loud tone of voice is either upset or angry
Receiving a gift with both hands is a sign of appreciation
Accepting a gift with one hand is a sign of disrespect
A smile is enough as a form of greeting
* Please note that all information provided above will remain anonymous *
Thank you for your time!

119
Appendix B Questionnaire: Chinese Students

120
Dear Students
I am studying towards an M-Tech degree in Public Relations Management at the
Durban University of Technology. I am conducting a study on intercultural
communication barriers between Zulu and Chinese students at selected Higher
Education Institutions in Durban. This questionnaire is part of an M-Tech
dissertation.
Kindly assist me by completing the attached questionnaire. The information you
provide will be kept strictly confidential and only aggregate figures will be
reported.
Please return the complete questionnaire to Jin Zheng at the address below.
Thank you for your time and effort.
Yours Sincerely,
Jin Zheng
263 Fenniscowles Road, Umbilo, Durban 4001, SA.
Cell: 072 2356 597
3 March 2008

121
Questionnaire for Chinese Students
Section A: Personal Data
1. Please indicate your gender. (Please tick one)
Male
Female
2. Please indicate your age. (Please tick one)
18-21 Years
22-25 Years
26-30 Years
Above 30 Years
3. Please tick your home language:
English
Chinese
Other
4. Please indicate your highest educational level. (Please tick one)
Matric
Diploma/Degree
Masters
Doctorate
Other (Please specify)………………….
5. Please indicate the name of your university and the department you are
registered with.
_____________________________________________________________

122
6. How many times a week do you communicate with Zulu students?
Please tick where applicable.
Infrequently Frequently
Section B
7. Are you able to communicate easily with Zulu students?
Yes No
8. Do you think language is a problem when you communicate with Zulu
students?
Yes
No
If yes, please explain what problems you have experienced.
9. Do you think cultural differences are a problem when you communicate
with Zulu students?
Yes
No
If yes, please explain what problems you have experienced.
1 2 3 4 5 6 7
1 2 3 4 5 6 7

123
10. Is racism a problem when you communicate with Zulu students?
Yes
No
If yes, please explain what problems you have experienced.
11. Is there a lack of trust between yourself and the Zulu students?
Yes
No
If yes, please explain what problems you have experienced.
12. Do you experience problems with nonverbal communication, i.e.
gestures, eye contact, facial expressions with Zulu students?
Yes
No
If yes, please state what problems you have experienced with nonverbal
communication.

124
13. Does ethnocentrism (a person’s belief that their culture is superior to
others) affect communication with Zulu students?
Yes
No
If yes, please explain your answer.
14. Does cultural stereotyping (generalization about people from a specific
culture) affect your communication with Zulu students?
Yes
No
If yes, please explain your answer.
15 (a). Do you share common interests in terms of topics of discussion
with Zulu students?
Yes
No
If yes, please explain what those topics are.

125
15 (b). Do you think that Zulu students share your interests in terms of
sport and leisure?
Yes
No
If yes, please explain your answer.
16. Specify language problems you encounter when you communicate with Zulu students who do not speak your language. Please tick the relevant box/es.
I cannot clearly understand them
They do not clearly understand me
I do not have enough words to express myself
I have to repeat myself several times
I do not communicate with them because I am afraid I do not know enough about them
Other (specify)

126
17. Consider the following statements when you communicate with Zulu students. Please tick the relevant box/es.
Strongly disagree
Disagree Agree Strongly agree
It is important to send nonverbal signals which are not confusing when communicating
A person who is silent means that s/he does not understand the message
It is important to maintain eye contact with a person in order to see whether s/he is honest or not
Interrupting a person during a conversation is rude and impolite
A person who speaks with a loud tone of voice is either upset or angry
Receiving a gift with both hands is a sign of appreciation
Accepting a gift with one hand is a sign of disrespect
A smile is enough as a form of greeting
* Please note that all information provided above will remain anonymous *
Thank you for your time!