interim report iii/2017 - e.on · interim report january ... digital products and services like...
TRANSCRIPT
Interim Report January – September III/2017

Glossary of Selected Financial Terms
Adjusted EBIT Earnings before interest and taxes. It is our most important earnings figure for purposes of internal
management control and as an indicator of our businesses’ long-term earnings power. The EBIT used by E.ON is
derived from income/loss from continuing operations before interest income and income taxes and is adjusted to
exclude certain items, mainly non-operating income and expenses.
Adjusted EBITDA Earnings before interest, taxes, depreciation, and amortization. The EBITDA used by E.ON is
derived from income/loss from continuing operations before interest income, income taxes, depreciation, and
amortization and is adjusted to exclude certain items, mainly non-operating income and expenses.
Adjusted net income An earnings figure after interest income, income taxes, and non-controlling interests that
has been adjusted to exclude non-operating items. Along with effects from the marking to market of derivatives,
the adjustments include book gains and book losses on disposals, restructuring expenses, and other material
non-operating income and expenses (after taxes and non-controlling interests), and interest expense/income not
affecting net income, which consists of the interest expense/income resulting from non-operating effects.
Economic net debt A key figure that supplements net financial position with pension obligations and asset-retirement
obligations. In the case of material provisions affected by negative real interest rates, we use the actual amount of
the obligation instead of the balance-sheet figure to calculate our economic net debt.
Investments Cash-effective investments as shown in the Consolidated Statements of Cash Flows.
E.ON Group Financial Highlights1
Nine months
€ in millions 2017 2016 +/- %
Sales 27,937 28,198 -1
Adjusted EBITDA2 3,540 3,640 -3
Adjusted EBIT2 2,117 2,311 -8
Net income/Net loss 3,903 -9,299 –
Net income/Net loss attributable to shareholders of E.ON SE 3,706 -3,948 –
Adjusted net income2 965 641 +51
Investments 2,222 1,981 +12
Cash provided by operating activities of continuing operations -3,309 3,041 –
Cash provided by operating activities of continuing operations before interest and taxes -3,091 3,827 –
Economic net debt (September 30 and December 31) 19,699 26,320 -25
Employees (September 30 and December 31) 42,525 43,138 -1
Earnings per share3, 4 (€) 1.75 -2.02 –
Adjusted net income per share3, 4 (€) 0.46 0.33 +39
Shares outstanding (in millions, September 30 and December 31) 2,167 1,952 +11
1Adjusted for discontinued operations.2Adjusted for non-operating effects (see Glossary).3Based on shares outstanding (weighted average).4Attributable to shareholders of E.ON SE.

4 CEO Letter5 E.ON Stock8 Interim Group Management Report8 Corporate Profile
8 Business Report
8 Industry Environment
9 Earnings Situation
12 Financial Situation
14 Asset Situation
15 Employees
16 Forecast Report
17 Risk and Chances Report
18 Business Segments
25 Review Report28 Condensed Consolidated Interim Financial Statements28 E.ON SE and Subsidiaries Consolidated Statements of Income
29 E.ON SE and Subsidiaries Consolidated Statements of Recognized Income and Expenses
30 E.ON SE and Subsidiaries Consolidated Balance Sheets
31 E.ON SE and Subsidiaries Consolidated Statements of Cash Flows
32 Statement of Changes in Equity
34 Notes to the Condensed Consolidated Interim Financial Statements
47 Financial Calendar
Contents

4CEO Letter
Dear Shareholders,
At the nine-month mark, your E.ON is right on track. Sales of €27.9 billion were nearly at the prior-year figure. As anticipated,
adjusted EBIT declined by around 8 percent to €2.1 billion. Adjusted net income rose by 51 percent to €965 million. As announced, our
performance in the second and third quarters made up a big part of our slow start earlier in the year. Earnings at our core business
(Energy Networks, Customer Solutions, and Renewables) were higher in the third quarter as well, rising by 6 percent. This puts us
on course for our forecast for full-year 2017, which we today reaffirm: we expect to post adjusted EBIT of €2.8 to €3.1 billion and
adjusted net income of €1.2 to €1.45 billion.
We owe the solid performance of our operating business above all to our employees’ hard work on behalf of our customers. Focus
Money, a weekly business magazine, named us Germany’s best value-for-money supplier for the third year in a row. Although
competition is keen, we’re responding proactively with new digital products and services like E.ON Solar Cloud as well as a revitalized
brand image. Our business serving industrial customers is also successful. Its latest project is to install solar panels on the sizeable
roofs of up to thirty Metro hypermarkets in Germany, which will enable Metro to reduce its carbon emissions by up to 12,000 metric
tons per year. Our innovations enable our customers to produce energy efficiently while helping to protect the earth’s climate. Here’s
another example of how we’re helping customers protect the climate: our networked and digital solutions will enable the first com-
munity in Sweden to be entirely energy-autonomous using locally produced energy.
E.ON’s balance sheet is stronger. We systematically reduced our economic net debt—much faster than planned—to €19.7 billion, down
by just over a quarter from roughly €26.3 billion at year-end 2016. We’re on course to achieve our debt-reduction target. Our solid
earnings and the capital increase we conducted in March raised our equity to €6.2 billion. As of the end of the third quarter we can state
that in early July we of course met, on time, our payment obligation to Germany’s public fund for financing nuclear-waste disposal.
This removes any future risks for us in this area.
At our annual results press conference in March we told you that we would increase the dividend payout as soon as our balance
sheet and cash flow allow us to. Consequently, we increased the payout ratio from between 50 and 60 percent to a minimum of
65 percent starting with the 2018 financial year. We’re also well on our way toward having the flexibility for growth investments.
The Management Board is currently designing a strategy for E.ON’s future growth. By early 2018, we’ll put together a detailed set
of recommendations for where and how your E.ON can grow in the years ahead and present it to you at our annual results press
conference for the 2017 financial year.
Our customers’ opportunities in the green, distributed, and digital energy world are also our shareholders’ opportunities for sustainable
value growth. We aim to seize these opportunities for our customers and for you, our shareholders. We’re achieving this better and
better every day. Your E.ON is gathering more speed.
Best wishes,
Dr. Johannes Teyssen
5Interim Report III/2017E.ON Stock
150
140
130
120
110
100
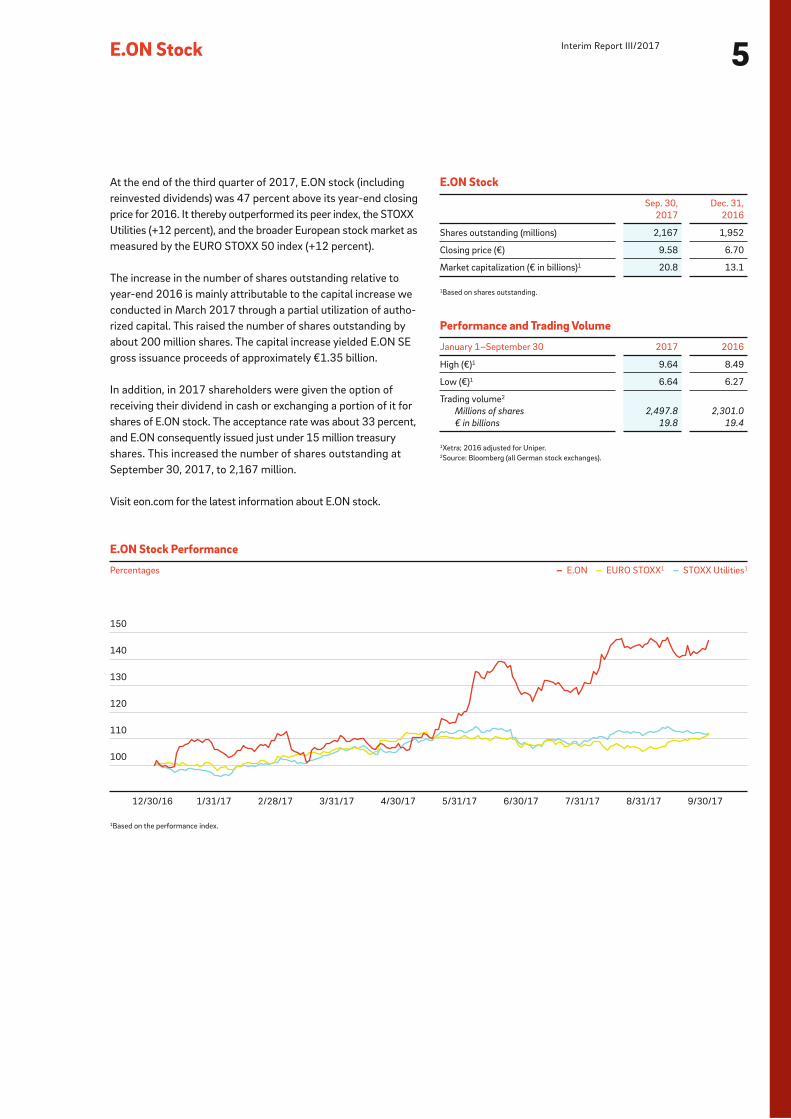
E.ON Stock Performance
Percentages – E.ON – EURO STOXX1 – STOXX Utilities1
1Based on the performance index.
12/30/16 1/31/17 2/28/17 3/31/17 4/30/17 5/31/17 6/30/17 7/31/17 8/31/17 9/30/17
At the end of the third quarter of 2017, E.ON stock (including
reinvested dividends) was 47 percent above its year-end closing
price for 2016. It thereby outperformed its peer index, the STOXX
Utilities (+12 percent), and the broader European stock market as
measured by the EURO STOXX 50 index (+12 percent).
The increase in the number of shares outstanding relative to
year-end 2016 is mainly attributable to the capital increase we
conducted in March 2017 through a partial utilization of autho-
rized capital. This raised the number of shares outstanding by
about 200 million shares. The capital increase yielded E.ON SE
gross issuance proceeds of approximately €1.35 billion.
In addition, in 2017 shareholders were given the option of
receiving their dividend in cash or exchanging a portion of it for
shares of E.ON stock. The acceptance rate was about 33 percent,
and E.ON consequently issued just under 15 million treasury
shares. This increased the number of shares outstanding at
September 30, 2017, to 2,167 million.
Visit eon.com for the latest information about E.ON stock.
E.ON Stock
Sep. 30,
2017
Dec. 31,
2016
Shares outstanding (millions) 2,167 1,952
Closing price (€) 9.58 6.70
Market capitalization (€ in billions)1 20.8 13.1
1Based on shares outstanding.
Performance and Trading Volume
January 1–September 30 2017 2016
High (€)1 9.64 8.49
Low (€)1 6.64 6.27
Trading volume2
Millions of shares 2,497.8 2,301.0
€ in billions 19.8 19.4
1Xetra; 2016 adjusted for Uniper.2Source: Bloomberg (all German stock exchanges).

Interim Group Management Report
January – September 2017
• Forecast for 2017 adjusted EBIT and adjusted net income affirmed
• Adjusted EBIT down year on year; third-quarter adjusted EBIT
above year-earlier quarter
• Adjusted net income considerably above prior-year figure
• Economic net debt reduced further, balance sheet strengthened
• €10.3 billion payment into Germany’s public fund for financing
nuclear-waste disposal relieves E.ON of liability
• Agreement concluded with Fortum on right to sell Uniper stake

8Interim Group Management Report
energy efficiency and autonomy and provide other benefits. Our
activities are tailored to the individual needs of customers across
all segments: residential, small and medium-sized enterprises,
large commercial and industrial, and public entities. E.ON’s main
presence in this business is in Germany, the United Kingdom,
Sweden, Italy, the Czech Republic, Hungary, and Romania. E.ON
Connecting Energies, which provides customers with turn-key
distributed-energy solutions, is also part of this segment.
RenewablesThis segment consists of Onshore Wind/Solar and Offshore
Wind/Other. We plan, build, operate, and manage renewable
generation assets. We market their output in several ways: in
conjunction with renewable incentive programs, under long-
term electricity supply agreements with key customers, and
directly to the wholesale market.
Non-Core Business This segment consists of our non-strategic activities. This applies
to the operation of our nuclear power stations in Germany
(which is managed by our PreussenElektra unit).
Business Report
Industry Environment Energy Policy and Regulatory Environment On June 30, 2017, the German Bundestag passed the Grid Fee
Modernization Act which lays the legal foundation for trans-
mission grid fees to be standardized nationwide and for changes
to be made in the compensation for avoided grid fees pursuant
to Section 18 of the Electricity Grid Charges Ordinance. The act,
which will be implemented gradually, will yield considerable
savings for our distribution grid customers through 2023.
The German Federal Constitutional Court ruled that the nuclear-
fuel tax was invalid. This entitled E.ON to a tax refund of approxi-
mately €2,850 million. The refund and other claims were paid
in the current year. The refund is recorded as other operating
income and as cash provided by operating activities of continuing
operations. Note 3 to the Condensed Consolidated Interim
Financial Statements contains more information.
Corporate Profile
Business Model
E.ON is an investor-owned energy company. Led by Group
Management in Essen, our operations are segmented into three
operating units: Energy Networks, Customer Solutions, and
Renewables. Our non-strategic operations are reported under
Non-Core Business.
Group ManagementThe main task of Group Management is to lead the E.ON Group.
This involves charting E.ON’s strategic course and managing
and funding its existing business portfolio. Group Management’s
tasks include optimizing E.ON’s overall business across countries
and markets from a financial, strategic, and risk perspective and
conducting stakeholder management.
In view of our new strategy and the Annual Shareholders Meet-
ing’s vote to spin off Uniper, we applied IFRS 5 and reported
Uniper activities as a discontinued operation in 2016. After the
Control Termination Agreement took effect, Uniper was decon-
solidated effective December 31, 2016, and was recorded in our
Consolidated Financial Statements as an associated company
in accordance with our stake and accounted for using the equity
method. Uniper’s earnings were reported under non-operating
earnings. In September 2017 E.ON and Finnish energy company
Fortum concluded an agreement under which E.ON has the right
to sell its 46.65-percent stake in Uniper in early 2018 in the
context of a takeover offer (see the commentary in Note 5 to the
Consolidated Interim Financial Statements). Effective the end of
September 2017, we classify our Uniper stake as an asset held
for sale.
Energy NetworksThis segment consists of our power and gas distribution networks
and related activities. It is subdivided into three regional markets:
Germany, Sweden, and East-Central Europe/Turkey (which con-
sists of the Czech Republic, Hungary, Romania, Slovakia, and
Turkey). This segment’s main tasks include operating its power
and gas networks safely and reliably, carrying out any necessary
maintenance and repairs, and expanding its networks, which
frequently involves adding customer connections.
Customer SolutionsThis segment serves as the platform for working with our cus-
tomers to actively shape Europe’s energy transition. This includes
supplying customers in Europe (excluding Turkey) with power, gas,
and heat as well as with products and services that enhance their
9Interim Report III/2017
Earnings Situation
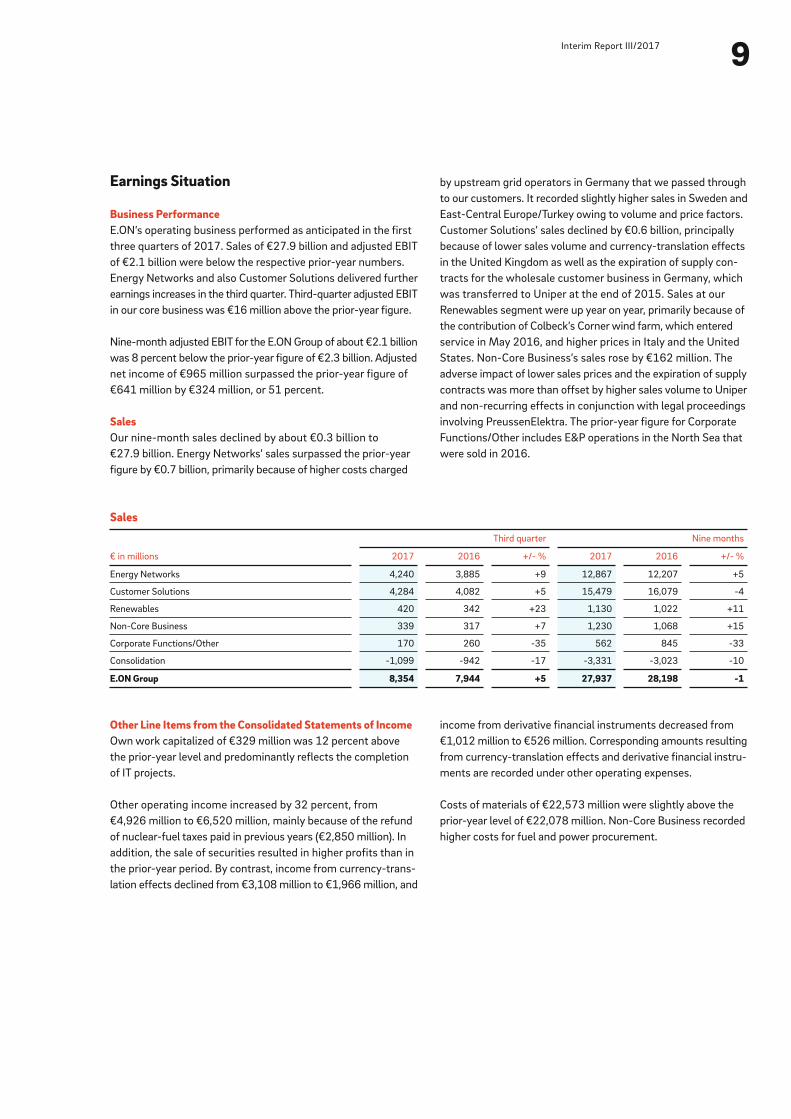
Business PerformanceE.ON’s operating business performed as anticipated in the first
three quarters of 2017. Sales of €27.9 billion and adjusted EBIT
of €2.1 billion were below the respective prior-year numbers.
Energy Networks and also Customer Solutions delivered further
earnings increases in the third quarter. Third-quarter adjusted EBIT
in our core business was €16 million above the prior-year figure.
Nine-month adjusted EBIT for the E.ON Group of about €2.1 billion
was 8 percent below the prior-year figure of €2.3 billion. Adjusted
net income of €965 million surpassed the prior-year figure of
€641 million by €324 million, or 51 percent.
SalesOur nine-month sales declined by about €0.3 billion to
€27.9 billion. Energy Networks’ sales surpassed the prior-year
figure by €0.7 billion, primarily because of higher costs charged
by upstream grid operators in Germany that we passed through
to our customers. It recorded slightly higher sales in Sweden and
East-Central Europe/Turkey owing to volume and price factors.
Customer Solutions’ sales declined by €0.6 billion, principally
because of lower sales volume and currency-translation effects
in the United Kingdom as well as the expiration of supply con-
tracts for the wholesale customer business in Germany, which
was transferred to Uniper at the end of 2015. Sales at our
Renewables segment were up year on year, primarily because of
the contribution of Colbeck’s Corner wind farm, which entered
service in May 2016, and higher prices in Italy and the United
States. Non-Core Business’s sales rose by €162 million. The
adverse impact of lower sales prices and the expiration of supply
contracts was more than offset by higher sales volume to Uniper
and non-recurring effects in conjunction with legal proceedings
involving PreussenElektra. The prior-year figure for Corporate
Functions/Other includes E&P operations in the North Sea that
were sold in 2016.
Sales
€ in millions
Third quarter Nine months
2017 2016 +/- % 2017 2016 +/- %
Energy Networks 4,240 3,885 +9 12,867 12,207 +5
Customer Solutions 4,284 4,082 +5 15,479 16,079 -4
Renewables 420 342 +23 1,130 1,022 +11
Non-Core Business 339 317 +7 1,230 1,068 +15
Corporate Functions/Other 170 260 -35 562 845 -33
Consolidation -1,099 -942 -17 -3,331 -3,023 -10
E.ON Group 8,354 7,944 +5 27,937 28,198 -1
Other Line Items from the Consolidated Statements of IncomeOwn work capitalized of €329 million was 12 percent above
the prior-year level and predominantly reflects the completion
of IT projects.
Other operating income increased by 32 percent, from
€4,926 million to €6,520 million, mainly because of the refund
of nuclear-fuel taxes paid in previous years (€2,850 million). In
addition, the sale of securities resulted in higher profits than in
the prior-year period. By contrast, income from currency-trans-
lation effects declined from €3,108 million to €1,966 million, and
income from derivative financial instruments decreased from
€1,012 million to €526 million. Corresponding amounts resulting
from currency-translation effects and derivative financial instru-
ments are recorded under other operating expenses.
Costs of materials of €22,573 million were slightly above the
prior-year level of €22,078 million. Non-Core Business recorded
higher costs for fuel and power procurement.
10Interim Group Management Report
of this stake will not be recalculated in the fourth quarter. Nine-
month income was partially offset by lower earnings at Energy
Networks’ East-Central Europe/Turkey unit.
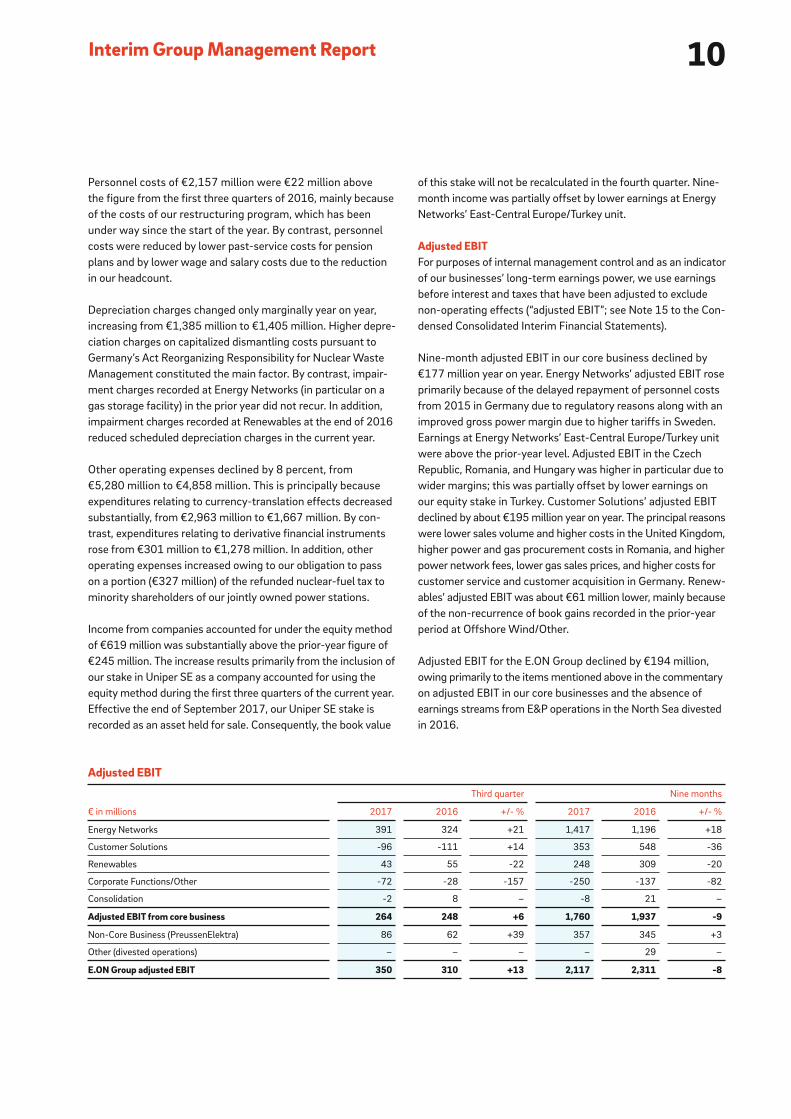
Adjusted EBITFor purposes of internal management control and as an indicator
of our businesses’ long-term earnings power, we use earnings
before interest and taxes that have been adjusted to exclude
non-operating effects (“adjusted EBIT”; see Note 15 to the Con-
densed Consolidated Interim Financial Statements).
Nine-month adjusted EBIT in our core business declined by
€177 million year on year. Energy Networks’ adjusted EBIT rose
primarily because of the delayed repayment of personnel costs
from 2015 in Germany due to regulatory reasons along with an
improved gross power margin due to higher tariffs in Sweden.
Earnings at Energy Networks’ East-Central Europe/Turkey unit
were above the prior-year level. Adjusted EBIT in the Czech
Republic, Romania, and Hungary was higher in particular due to
wider margins; this was partially offset by lower earnings on
our equity stake in Turkey. Customer Solutions’ adjusted EBIT
declined by about €195 million year on year. The principal reasons
were lower sales volume and higher costs in the United Kingdom,
higher power and gas procurement costs in Romania, and higher
power network fees, lower gas sales prices, and higher costs for
customer service and customer acquisition in Germany. Renew-
ables’ adjusted EBIT was about €61 million lower, mainly because
of the non-recurrence of book gains recorded in the prior-year
period at Offshore Wind/Other.
Adjusted EBIT for the E.ON Group declined by €194 million,
owing primarily to the items mentioned above in the commentary
on adjusted EBIT in our core businesses and the absence of
earnings streams from E&P operations in the North Sea divested
in 2016.
Personnel costs of €2,157 million were €22 million above
the figure from the first three quarters of 2016, mainly because
of the costs of our restructuring program, which has been
under way since the start of the year. By contrast, personnel
costs were reduced by lower past-service costs for pension
plans and by lower wage and salary costs due to the reduction
in our headcount.
Depreciation charges changed only marginally year on year,
increasing from €1,385 million to €1,405 million. Higher depre-
ciation charges on capitalized dismantling costs pursuant to
Germany’s Act Reorganizing Responsibility for Nuclear Waste
Management constituted the main factor. By contrast, impair-
ment charges recorded at Energy Networks (in particular on a
gas storage facility) in the prior year did not recur. In addition,
impairment charges recorded at Renewables at the end of 2016
reduced scheduled depreciation charges in the current year.
Other operating expenses declined by 8 percent, from
€5,280 million to €4,858 million. This is principally because
expenditures relating to currency-translation effects decreased
substantially, from €2,963 million to €1,667 million. By con-
trast, expenditures relating to derivative financial instruments
rose from €301 million to €1,278 million. In addition, other
operating expenses increased owing to our obligation to pass
on a portion (€327 million) of the refunded nuclear-fuel tax to
minority shareholders of our jointly owned power stations.
Income from companies accounted for under the equity method
of €619 million was substantially above the prior-year figure of
€245 million. The increase results primarily from the inclusion of
our stake in Uniper SE as a company accounted for using the
equity method during the first three quarters of the current year.
Effective the end of September 2017, our Uniper SE stake is
recorded as an asset held for sale. Consequently, the book value
Adjusted EBIT
€ in millions
Third quarter Nine months
2017 2016 +/- % 2017 2016 +/- %
Energy Networks 391 324 +21 1,417 1,196 +18
Customer Solutions -96 -111 +14 353 548 -36
Renewables 43 55 -22 248 309 -20
Corporate Functions/Other -72 -28 -157 -250 -137 -82
Consolidation -2 8 – -8 21 –
Adjusted EBIT from core business 264 248 +6 1,760 1,937 -9
Non-Core Business (PreussenElektra) 86 62 +39 357 345 +3
Other (divested operations) – – – – 29 –
E.ON Group adjusted EBIT 350 310 +13 2,117 2,311 -8
11Interim Report III/2017
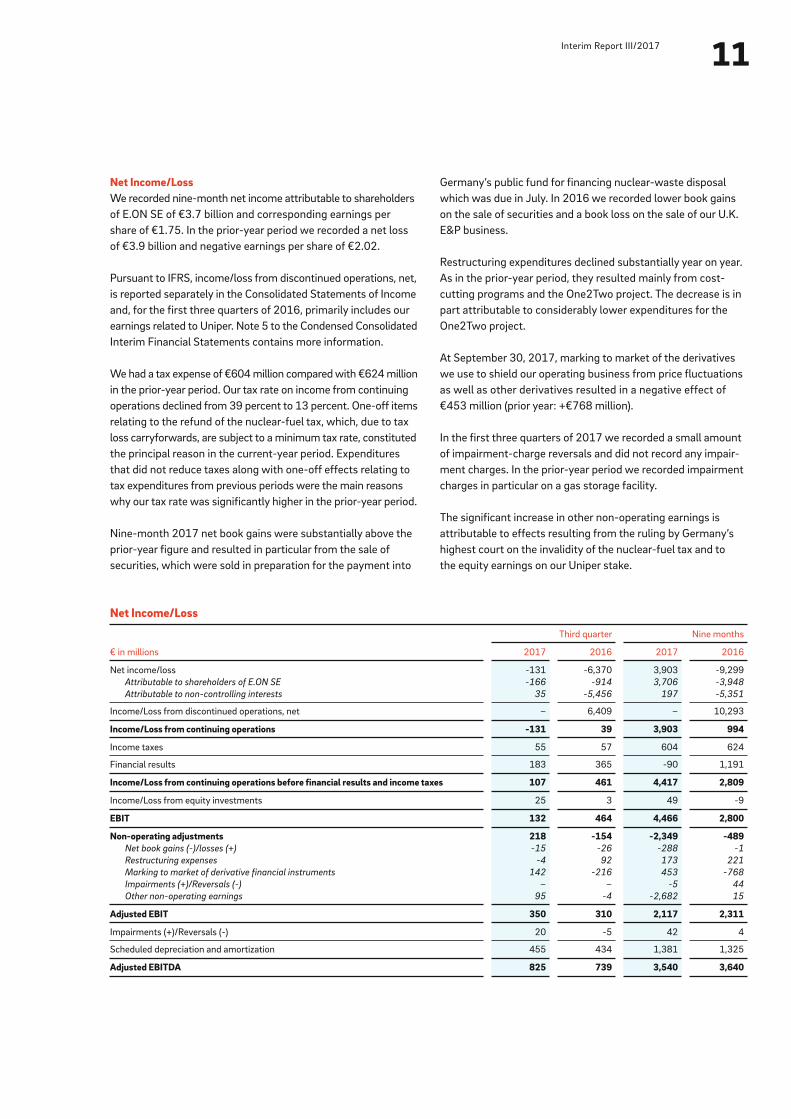
Net Income/LossWe recorded nine-month net income attributable to shareholders
of E.ON SE of €3.7 billion and corresponding earnings per
share of €1.75. In the prior-year period we recorded a net loss
of €3.9 billion and negative earnings per share of €2.02.
Pursuant to IFRS, income/loss from discontinued operations, net,
is reported separately in the Consolidated Statements of Income
and, for the first three quarters of 2016, primarily includes our
earnings related to Uniper. Note 5 to the Condensed Consolidated
Interim Financial Statements contains more information.
We had a tax expense of €604 million compared with €624 million
in the prior-year period. Our tax rate on income from continuing
operations declined from 39 percent to 13 percent. One-off items
relating to the refund of the nuclear-fuel tax, which, due to tax
loss carryforwards, are subject to a minimum tax rate, constituted
the principal reason in the current-year period. Expenditures
that did not reduce taxes along with one-off effects relating to
tax expenditures from previous periods were the main reasons
why our tax rate was significantly higher in the prior-year period.
Nine-month 2017 net book gains were substantially above the
prior- year figure and resulted in particular from the sale of
securities, which were sold in preparation for the payment into
Germany’s public fund for financing nuclear-waste disposal
which was due in July. In 2016 we recorded lower book gains
on the sale of securities and a book loss on the sale of our U.K.
E&P business.
Restructuring expenditures declined substantially year on year.
As in the prior-year period, they resulted mainly from cost-
cutting programs and the One2Two project. The decrease is in
part attributable to considerably lower expenditures for the
One2Two project.
At September 30, 2017, marking to market of the derivatives
we use to shield our operating business from price fluctuations
as well as other derivatives resulted in a negative effect of
€453 million (prior year: +€768 million).
In the first three quarters of 2017 we recorded a small amount
of impairment-charge reversals and did not record any impair-
ment charges. In the prior-year period we recorded impairment
charges in particular on a gas storage facility.
The significant increase in other non-operating earnings is
attributable to effects resulting from the ruling by Germany’s
highest court on the invalidity of the nuclear-fuel tax and to
the equity earnings on our Uniper stake.
Net Income/Loss
€ in millions
Third quarter Nine months
2017 2016 2017 2016
Net income/loss -131 -6,370 3,903 -9,299
Attributable to shareholders of E.ON SE -166 -914 3,706 -3,948
Attributable to non-controlling interests 35 -5,456 197 -5,351
Income/Loss from discontinued operations, net – 6,409 – 10,293
Income/Loss from continuing operations -131 39 3,903 994
Income taxes 55 57 604 624
Financial results 183 365 -90 1,191
Income/Loss from continuing operations before financial results and income taxes 107 461 4,417 2,809
Income/Loss from equity investments 25 3 49 -9
EBIT 132 464 4,466 2,800
Non-operating adjustments 218 -154 -2,349 -489Net book gains (-)/losses (+) -15 -26 -288 -1
Restructuring expenses -4 92 173 221
Marking to market of derivative financial instruments 142 -216 453 -768
Impairments (+)/Reversals (-) – – -5 44
Other non-operating earnings 95 -4 -2,682 15
Adjusted EBIT 350 310 2,117 2,311
Impairments (+)/Reversals (-) 20 -5 42 4
Scheduled depreciation and amortization 455 434 1,381 1,325
Adjusted EBITDA 825 739 3,540 3,640

12Interim Group Management Report
income resulting from non-operating effects. Adjusted net
income also does not include income/loss from discontinued
operations.
The E.ON Management Board uses this figure in conjunction
with its consistent dividend policy. Starting with the 2018
financial year, the goal will be to pay out to E.ON shareholders
a minimum of 65 percent of adjusted net income as dividends.
E.ON will therefore aim for a payout ratio that is on par with its
relevant peer companies. E.ON still plans to propose a dividend
of €0.30 per share for the 2017 financial year.
Adjusted Net IncomeLike EBIT, net income also consists of non-operating effects,
such as the marking to market of derivatives. Adjusted net
income is an earnings figure after interest income, income
taxes, and non-controlling interests that has been adjusted to
exclude non-operating effects. In addition to the marking to
market of derivatives, the adjustments include book gains and
book losses on disposals, restructuring expenses, other
material non-operating income and expenses (after taxes and
non-controlling interests), and interest expense/income not
affecting net income, which consists of the interest expense/
Adjusted Net Income
€ in millions
Third quarter Nine months
2017 2016 2017 2016
Income/Loss from continuing operations before financial results and income taxes 107 461 4,417 2,809
Income/Loss from equity investments 25 3 49 -9
EBIT 132 464 4,466 2,800
Non-operating adjustments 218 -154 -2,349 -489
Adjusted EBIT 350 310 2,117 2,311
Net interest income/loss -208 -368 41 -1,182
Non-operating interest expense (+)/income (-) 16 60 -616 64
Operating earnings before taxes 158 2 1,542 1,193
Taxes on operating earnings -39 69 -386 -387
Operating earnings attributable to non-controlling interests -35 -34 -191 -165
Adjusted net income 84 37 965 641
Financial Situation
E.ON presents its financial condition using, among other financial
measures, economic net debt and operating cash flow.
Financial PositionCompared with the figure recorded at December 31, 2016
(€26.3 billion), our economic net debt declined by €6.6 billion
to €19.7 billion.
The change in our net financial position predominantly reflects
the capital increase we conducted in March 2017 and our oper-
ating cash flow. The latter includes positive effects from the
refund of the nuclear-fuel tax and from our normal operating
business as well as negative effects from the payment into
Germany’s public fund for financing nuclear-waste disposal. How-
ever, because we removed from our balance sheets provisions
for nuclear-waste management in the same amount, the payment
into the fund had no effect on our economic net debt.
The change in our gross financial debt relative to year-end
2016 reflects the issuance of €2 billion in bonds in May 2017
to fund the payment into Germany’s public fund for financing
nuclear-waste disposal, which was made in July. We issued three
euro-denominated bonds with maturities in 2021, 2024, and
2029. The principal countervailing factors were the on-schedule
repayment of a €900 million euro-denominated bond and posi-
tive currency-translation effects.

13Interim Report III/2017
The creditworthiness of E.ON has been assessed by Standard &
Poor’s (“S&P”) and Moody’s with long-term ratings of BBB and
Baa2, respectively. In March 2017 both S&P and Moody’s
downgraded E.ON’s rating from BBB+ and Baa1 with a negative
outlook, respectively. The outlook of both ratings is now stable.
The new ratings reflect both agencies’ anticipation that in the near
to medium term E.ON will be able to maintain a leverage ratio
as required for these ratings. E.ON’s short-term ratings have been
unchanged with A-2 (S&P) and P-2 (Moody’s).
InvestmentsNine-month investments in our core business and the E.ON
Group’s total investments were above the prior-year level. We
invested €2.1 billion in property, plant, and equipment and
intangible assets (prior year: €1.9 billion). Share investments
totaled €101 million versus €90 million in the prior-year period.
Economic Net Debt
€ in millions
Sep. 30,
2017
Dec. 31,
2016
Liquid funds 5,450 8,573
Non-current securities 3,801 4,327
Financial liabilities -14,304 -14,227
FX hedging adjustment 158 390
Net financial position -4,895 -937
Provisions for pensions -3,586 -4,009
Asset-retirement obligations1 -11,218 -21,374
Economic net debt -19,699 -26,320
1This figure is not the same as the asset-retirement obligations shown in our Consolidated
Balance Sheet (€12,249 million at September 30, 2017; €22,515 million at December 31,
2016). This is because we calculate our economic net debt in part based on the actual
amount of our obligations.
Investments
January 1–September 30
€ in millions 2017 2016 +/- %
Energy Networks 864 866 –
Customer Solutions 350 392 -11
Renewables 961 637 +51
Corporate Functions/Other 42 70 -40
Consolidation -5 -4 -25
Investments in core business 2,212 1,961 +13
Non-Core Business
(PreussenElektra) 10 12 -17
Other (divested operations) – 8 –
E.ON Group investments 2,222 1,981 +12
Energy Networks’ nine-month investments were at the prior- year
level. Investments of €228 million to upgrade and maintain net-
works in Sweden were €48 million above the prior-year figure.
Investments at East-Central Europe/Turkey were €71 million
higher due principally to the reassignment of investment projects
(such as grid maintenance, repair, and connections) in the Czech
Republic from Customer Solutions to Energy Networks. By con-
trast, Energy Networks’ investments in Germany of €396 million
were lower than in the prior-year period.
Customer Solutions invested €42 million less than in the prior-
year period, chiefly because of the already-mentioned reassign-
ment of investment projects in the Czech Republic from this
segment to Energy Networks. In addition, investments at E.ON
Connecting Energies and in the United Kingdom and Germany
were lower. In Sweden, by contrast, we invested more in the
maintenance, upgrade, and expansion of existing assets and in
the heat distribution network.
Investments at Renewables were €324 million higher. Onshore
Wind/Solar’s investments increased by €236 million, primarily
because of expenditures for two large new-build projects
(Radford’s Run and Bruenning’s Breeze), which will enter service
this year. Offshore Wind/Other’s investments increased by a
total of €88 million owing to expenditures for the Rampion new-
build project and to expenditures in line with our stake in the
Arkona project.
Investments at Non-Core Business (nuclear energy operations
in Germany) were €2 million below the prior-year level.
14Interim Group Management Report
Asset Situation
Our total assets and liabilities of €58.3 billion were about
€5.4 billion, or 8 percent, below the figure from year-end 2016.
Non-current assets of €42.5 billion were €3.8 billion lower
relative to year-end 2016. The principal factors were the reclassi-
fication of the book value of our Uniper SE stake as an asset held
for sale and the sale of non-current securities.
Current assets decreased by 9 percent, from €17.4 billion to
€15.8 billion. A roughly €3.1 billion decline in liquid funds and a
€2 billion decline in operating receivables and other operating
assets were largely offset by the reclassification of the book
value of our Uniper SE stake as an asset held for sale. The decline
in liquid funds was chiefly attributable to the payment of
€10.3 billion into Germany’s public fund for financing nuclear-
waste disposal. To finance this payment, E.ON SE had conducted
a roughly €1.35 billion capital increase in the fist quarter of this
year. Furthermore, liquid funds were increased by the €2 billion
bond issuance in the second quarter and the refund of nuclear-
fuel taxes paid in previous years plus interest.
Our equity ratio (including non-controlling interests) at Sep-
tember 30, 2017, was 11 percent, which is about 9 percentage
points higher than at year-end 2016. This change reflects the
already-mentioned capital increase, the reduction in total assets
and liabilities, as well as our positive net income in the first three
quarters of the current year. In particular, the refund of nuclear-
fuel taxes paid in previous years had a positive impact on net
income. Equity attributable to shareholders of E.ON SE was
about €3.6 billion at September 30, 2017. Equity attributable
to non-controlling interests was roughly €2.5 billion.
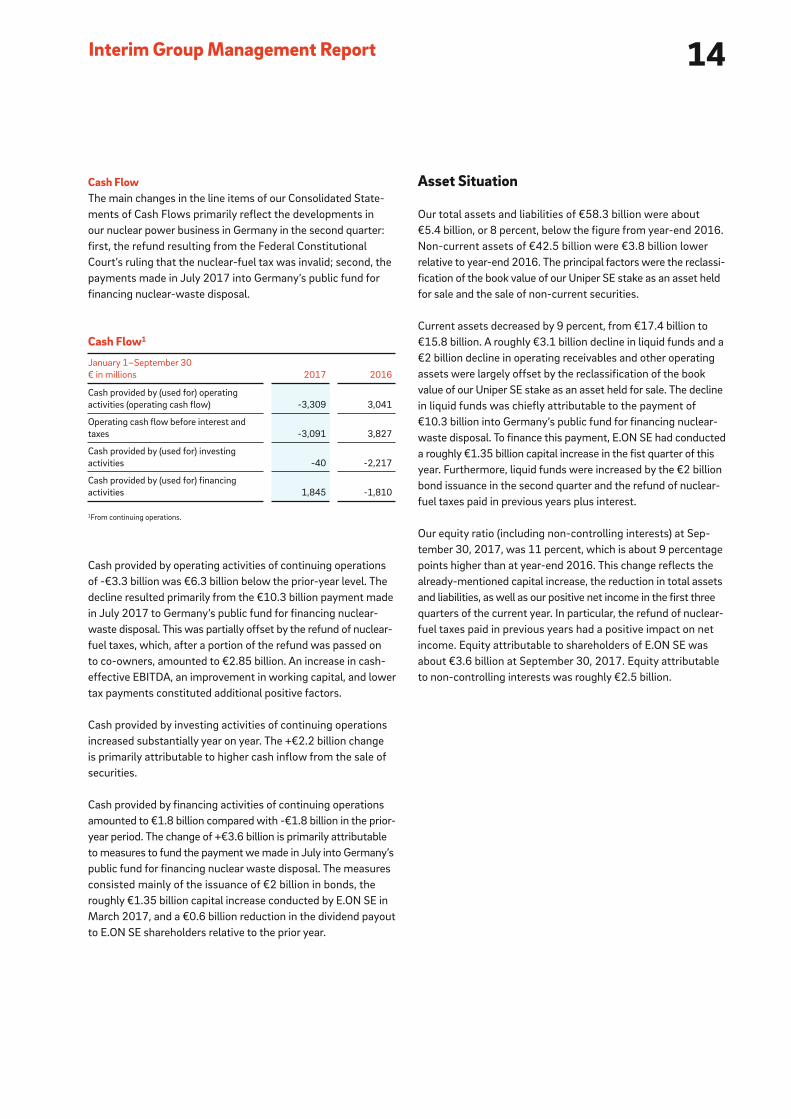
Cash FlowThe main changes in the line items of our Consolidated State-
ments of Cash Flows primarily reflect the developments in
our nuclear power business in Germany in the second quarter:
first, the refund resulting from the Federal Constitutional
Court’s ruling that the nuclear-fuel tax was invalid; second, the
payments made in July 2017 into Germany’s public fund for
financing nuclear-waste disposal.
Cash provided by operating activities of continuing operations
of -€3.3 billion was €6.3 billion below the prior-year level. The
decline resulted primarily from the €10.3 billion payment made
in July 2017 to Germany’s public fund for financing nuclear-
waste disposal. This was partially offset by the refund of nuclear-
fuel taxes, which, after a portion of the refund was passed on
to co-owners, amounted to €2.85 billion. An increase in cash-
effective EBITDA, an improvement in working capital, and lower
tax payments constituted additional positive factors.
Cash provided by investing activities of continuing operations
increased substantially year on year. The +€2.2 billion change
is primarily attributable to higher cash inflow from the sale of
securities.
Cash provided by financing activities of continuing operations
amounted to €1.8 billion compared with -€1.8 billion in the prior-
year period. The change of +€3.6 billion is primarily attributable
to measures to fund the payment we made in July into Germany’s
public fund for financing nuclear waste disposal. The measures
consisted mainly of the issuance of €2 billion in bonds, the
roughly €1.35 billion capital increase conducted by E.ON SE in
March 2017, and a €0.6 billion reduction in the dividend payout
to E.ON SE shareholders relative to the prior year.
Cash Flow1
January 1–September 30
€ in millions 2017 2016
Cash provided by (used for) operating
activities (operating cash flow) -3,309 3,041
Operating cash flow before interest and
taxes -3,091 3,827
Cash provided by (used for) investing
activities -40 -2,217
Cash provided by (used for) financing
activities 1,845 -1,810
1From continuing operations.
15Interim Report III/2017
Non-current liabilities decreased by €2.2 billion, or 5 percent,
owing to a reduction in liabilities relating to derivative financial
instruments, lower pension obligations, and a decline in nuclear-
asset-retirement obligations.
In line with Germany’s Act Reorganizing Responsibility for
Nuclear Waste Management, existing nuclear-asset-retirement
obligations at year-end were met through payment, resulting in
a substantial reduction—€8.1 billion—in current liabilities relative
to year-end 2016.
Consolidated Assets, Liabilities, and Equity
€ in millions
Sep. 30,
2017 %
Dec. 31,
2016 %
Non-current assets 42,505 73 46,296 73
Current assets 15,793 27 17,403 27
Total assets 58,298 100 63,699 100
Equity 6,164 11 1,287 2
Non-current liabilities 37,128 63 39,287 62
Current liabilities 15,006 26 23,125 36
Total equity and liabilities 58,298 100 63,699 100
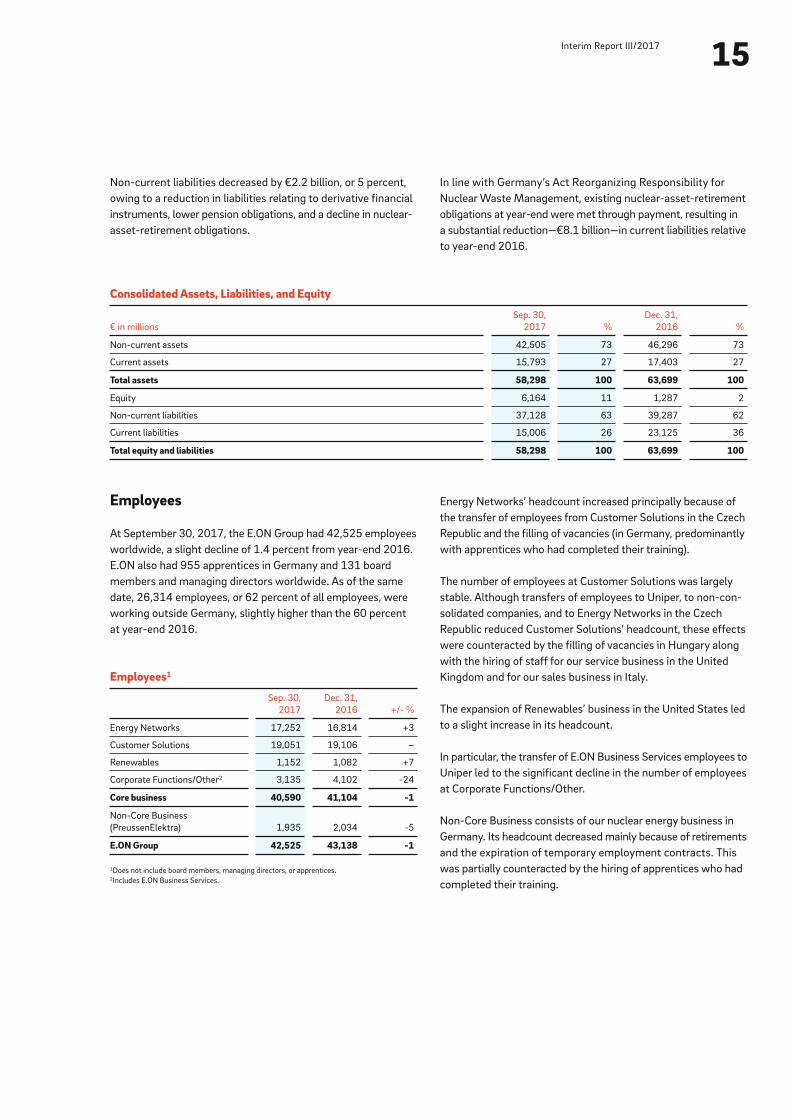
Employees
At September 30, 2017, the E.ON Group had 42,525 employees
worldwide, a slight decline of 1.4 percent from year-end 2016.
E.ON also had 955 apprentices in Germany and 131 board
members and managing directors worldwide. As of the same
date, 26,314 employees, or 62 percent of all employees, were
working outside Germany, slightly higher than the 60 percent
at year-end 2016.
Employees1
Sep. 30,
2017
Dec. 31,
2016 +/- %
Energy Networks 17,252 16,814 +3
Customer Solutions 19,051 19,106 –
Renewables 1,152 1,082 +7
Corporate Functions/Other2 3,135 4,102 -24
Core business 40,590 41,104 -1
Non-Core Business
(PreussenElektra) 1,935 2,034 -5
E.ON Group 42,525 43,138 -1
1Does not include board members, managing directors, or apprentices.2Includes E.ON Business Services.
Energy Networks’ headcount increased principally because of
the transfer of employees from Customer Solutions in the Czech
Republic and the filling of vacancies (in Germany, predominantly
with apprentices who had completed their training).
The number of employees at Customer Solutions was largely
stable. Although transfers of employees to Uniper, to non-con-
solidated companies, and to Energy Networks in the Czech
Republic reduced Customer Solutions’ headcount, these effects
were counteracted by the filling of vacancies in Hungary along
with the hiring of staff for our service business in the United
Kingdom and for our sales business in Italy.
The expansion of Renewables’ business in the United States led
to a slight increase in its headcount.
In particular, the transfer of E.ON Business Services employees to
Uniper led to the significant decline in the number of employees
at Corporate Functions/Other.
Non-Core Business consists of our nuclear energy business in
Germany. Its headcount decreased mainly because of retirements
and the expiration of temporary employment contracts. This
was partially counteracted by the hiring of apprentices who had
completed their training.

16Interim Group Management Report
Forecast Report
Business Environment
Macroeconomic Situation The OECD forecasts a gradual acceleration of global economic
growth in 2017 and 2018. It expects the global economy to
grow by 3.5 percent in 2017 and by 3.7 percent in 2018. The
corresponding figures for the United States are 2.1 percent and
2.4 percent, while comparatively weaker growth (2.1 percent
and 1.9 percent) is forecast for the euro zone. The OECD sees
substantial political uncertainty and financial risks. It believes that
fiscal initiatives and structural reforms should result in stronger
growth. In Germany, the Bundestag election on September 24,
2017, led to coalition negotiations whose outcome is open.
Anticipated Earnings Situation
Forecast Earnings Performance Our forecast for full-year 2017 earnings continues to be sig-
nificantly influenced by the difficult business environment.
Examples include a weaker British pound and policymaking risks
in the United Kingdom. In addition, the current low-interest-
rate environment and increasingly fierce competition in our core
markets are putting downward pressure on achievable returns.
For our 2017 earnings forecast, we adjusted our internal financial
key figures with respect to the treatment of nuclear-asset-retire-
ment obligations. Effects resulting from the valuation of certain
provisions at the balance-sheet date are now reported under
non-operating earnings. This change, which improves the
depiction of E.ON’s underlying earnings strength, took effect
on January 1, 2017. In view of the fundamental change in
our business and its structure in 2016, it did not make sense
to adjust the prior-year figures.
We continue to expect the E.ON Group’s 2017 adjusted EBIT
to be between €2.8 and €3.1 billion and its 2017 adjusted net
income to be between €1.2 and €1.45 billion.
Our forecast by segment:
We expect Energy Networks’ 2017 adjusted EBIT to be signifi-
cantly above the prior-year figure. The principal positive factors
in Germany are special regulatory effects such as the delayed
repayment of higher provisions for pensions from 2015 which
were included in allowed network revenues along with non-
recurring items stemming from the conversion to Germany’s
amended Incentive Regulation Ordinance. Germany’s Grid Fee
Modernization Act took effect on July 22, 2017; however, it will
not impact grid fees until 2018. The fees will be passed through
by E.ON grid operators and will not affect earnings. Unlike orig-
inally assumed, there will therefore not be a one-off earnings
increase in 2017 or the repayment of this increase in years 2019
to 2021. Elsewhere, improved power tariffs in Sweden and
the Czech Republic will increase earnings. In Hungary we will
benefit from the new regulation period in 2017.
17Interim Report III/2017
We anticipate that Customer Solutions’ adjusted EBIT will be
significantly below the prior-year figure. Earnings in Germany will
be lower due primarily to the absence of positive one-off items
recorded in the prior year, lower gas sales prices, and higher costs
for customer retention and acquisition. The intervention of the
Competition and Markets Authority and rising costs for customer
acquisition as part of our new marketing strategy will have a
significant negative impact on earnings in the United Kingdom.
Earnings will be lower in Romania primarily because of nar-
rower margins in response to keener competition in the wake of
market liberalization.
We expect Renewables’ adjusted EBIT to be at the prior-year level.
Major new-build projects (such as Radford’s Run, Bruenning’s
Breeze, Arkona, and Rampion wind farms) will not enter service
and contribute to earnings until the end of 2017 or in subsequent
years.
We now anticipate that adjusted EBIT at Corporate Functions/
Other will be above the prior-year level. The prior year was
adversely affected by one-off items.
At Non-Core Business we now expect PreussenElektra’s adjusted
EBIT to be significantly below the prior-year level, chiefly because
of an extended overhaul at Brokdorf nuclear power station.
Risk and Chances Report
The Combined Group Management Report contained in our
2016 Annual Report describes in detail our risk management
systems and the measures we take to limit risks.
Risiks and Chances
In the normal course of business, we are subject to a number
of risks that are inseparably linked to the operation of our busi-
nesses. The resulting risks and chances are described in detail
in the 2016 Combined Group Management Report. These risks
remained essentially unchanged at the end of the first three
quarters of 2017.
Management’s Assessment of the Risk Situation
At the end of the first three quarters of 2017 the risk situation
of the E.ON Group’s core operating business had not changed
significantly compared with year-end 2016. However, a number
of uncertainties no longer exist: those regarding Germany’s
nuclear-fuel tax and nuclear moratorium (which were eliminated
by court rulings), those regarding the funding and the transfer
of the payment into Germany’s public fund for financing nuclear-
waste disposal, and those regarding Germany’s Grid Fee Modern-
ization Act. From today’s perspective, we do not perceive any
risks that could threaten the existence of E.ON SE, the E.ON Group,
or individual segments.

18Interim Group Management Report
Business Segments
Energy Networks
Below we report on a number of important non-financial key
figures for this segment, such as power and gas passthrough.
Power and Gas Passthrough Nine-month power passthrough was at the prior-year level. Gas
passthrough rose by 3 percent.
Power and gas passthrough in Germany of 49.6 billion kWh
and 75.5 billion kWh, respectively, were at the prior-year level.
Power passthrough in Sweden was at the prior-year level,
whereas gas passthrough declined owing to the closure of a
power station in Malmö.
Power passthrough at East-Central Europe/Turkey was 0.9 bil-
lion kWh above the prior-year level due principally to positive
economic development in the Czech Republic and comparatively
lower temperatures in all countries. Weather factors were
responsible for the 3.2 billion kWh increase in gas passthrough.
Energy Passthrough
Billion kWh
Germany Sweden
East-Central Europe/
Turkey Total
2017 2016 2017 2016 2017 2016 2017 2016
Third quarter
Power 17.2 17.7 8.0 8.0 8.6 8.4 33.8 34.1
Line loss, station use, etc. 0.6 0.5 0.2 0.2 0.6 0.5 1.4 1.2
Gas 16.1 15.8 1.0 1.0 4.3 4.1 21.4 20.9
Nine months
Power 49.6 50.0 27.3 27.5 27.0 26.1 103.9 103.6
Line loss, station use, etc. 1.9 1.8 0.8 0.7 2.0 2.0 4.7 4.5
Gas 75.5 75.0 3.1 3.9 29.9 26.7 108.5 105.6
19Interim Report III/2017
Energy Networks
€ in millions
Germany Sweden
East-Central Europe/
Turkey Total
2017 2016 2017 2016 2017 2016 2017 2016
Third quarter
Sales 3,589 3,286 268 227 383 372 4,240 3,885
Adjusted EBITDA 321 291 147 132 159 142 627 565
Adjusted EBIT 182 146 106 91 103 87 391 324
Nine months
Sales 10,797 10,288 831 736 1,239 1,183 12,867 12,207
Adjusted EBITDA 1,217 1,084 467 411 451 428 2,135 1,923
Adjusted EBIT 788 638 345 288 284 270 1,417 1,196
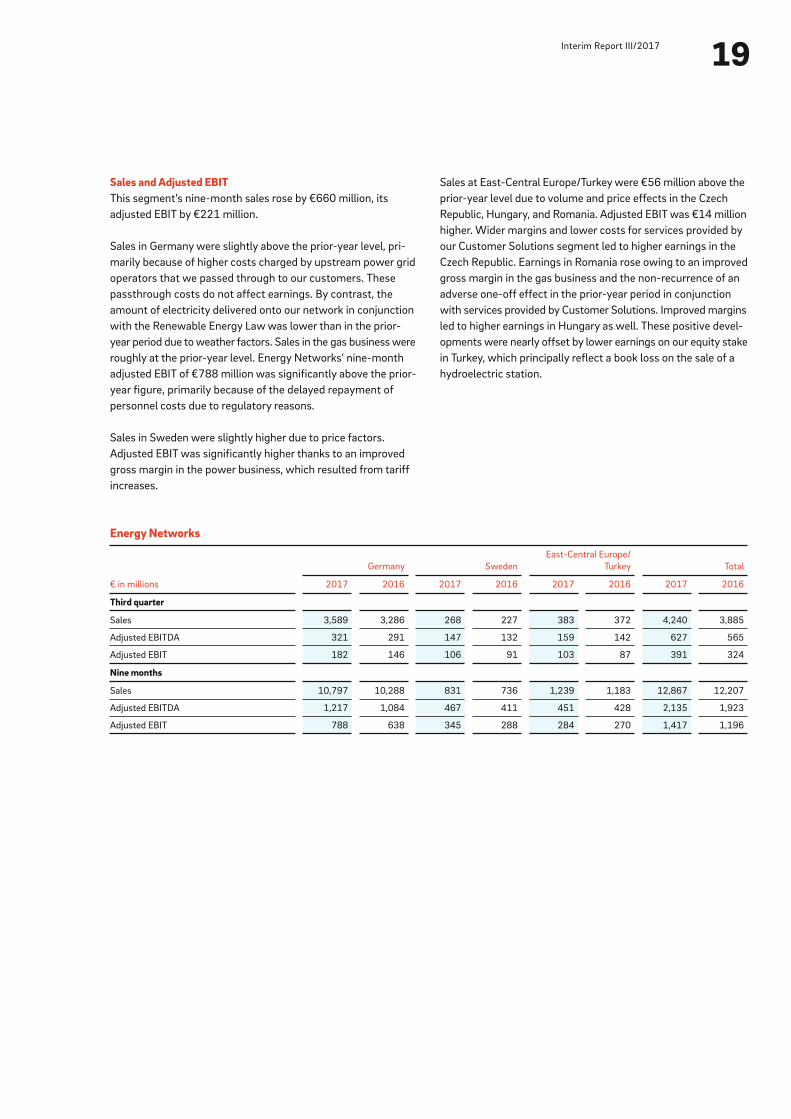
Sales and Adjusted EBITThis segment’s nine-month sales rose by €660 million, its
adjusted EBIT by €221 million.
Sales in Germany were slightly above the prior-year level, pri-
marily because of higher costs charged by upstream power grid
operators that we passed through to our customers. These
passthrough costs do not affect earnings. By contrast, the
amount of electricity delivered onto our network in conjunction
with the Renewable Energy Law was lower than in the prior-
year period due to weather factors. Sales in the gas business were
roughly at the prior-year level. Energy Networks’ nine-month
adjusted EBIT of €788 million was significantly above the prior-
year figure, primarily because of the delayed repayment of
personnel costs due to regulatory reasons.
Sales in Sweden were slightly higher due to price factors.
Adjusted EBIT was significantly higher thanks to an improved
gross margin in the power business, which resulted from tariff
increases.
Sales at East-Central Europe/Turkey were €56 million above the
prior-year level due to volume and price effects in the Czech
Republic, Hungary, and Romania. Adjusted EBIT was €14 million
higher. Wider margins and lower costs for services provided by
our Customer Solutions segment led to higher earnings in the
Czech Republic. Earnings in Romania rose owing to an improved
gross margin in the gas business and the non-recurrence of an
adverse one-off effect in the prior-year period in conjunction
with services provided by Customer Solutions. Improved margins
led to higher earnings in Hungary as well. These positive devel-
opments were nearly offset by lower earnings on our equity stake
in Turkey, which principally reflect a book loss on the sale of a
hydroelectric station.
20
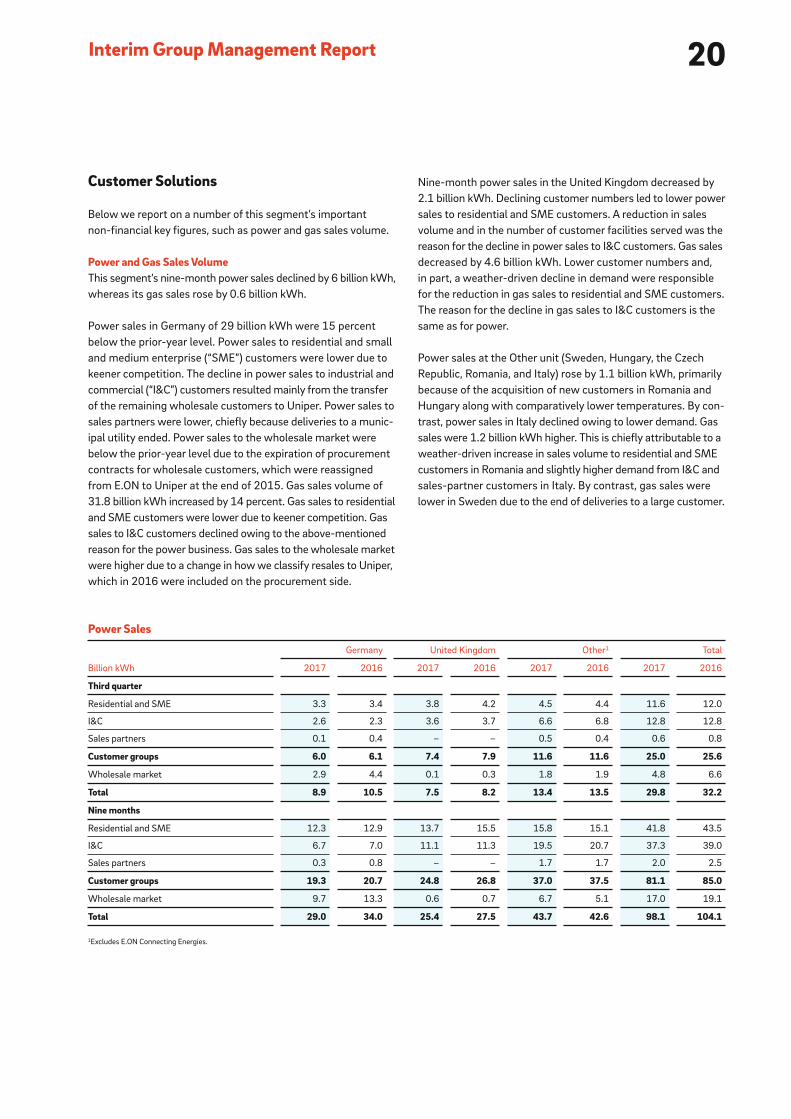
Power Sales
Billion kWh
Germany United Kingdom Other1 Total
2017 2016 2017 2016 2017 2016 2017 2016
Third quarter
Residential and SME 3.3 3.4 3.8 4.2 4.5 4.4 11.6 12.0
I&C 2.6 2.3 3.6 3.7 6.6 6.8 12.8 12.8
Sales partners 0.1 0.4 – – 0.5 0.4 0.6 0.8
Customer groups 6.0 6.1 7.4 7.9 11.6 11.6 25.0 25.6
Wholesale market 2.9 4.4 0.1 0.3 1.8 1.9 4.8 6.6
Total 8.9 10.5 7.5 8.2 13.4 13.5 29.8 32.2
Nine months
Residential and SME 12.3 12.9 13.7 15.5 15.8 15.1 41.8 43.5
I&C 6.7 7.0 11.1 11.3 19.5 20.7 37.3 39.0
Sales partners 0.3 0.8 – – 1.7 1.7 2.0 2.5
Customer groups 19.3 20.7 24.8 26.8 37.0 37.5 81.1 85.0
Wholesale market 9.7 13.3 0.6 0.7 6.7 5.1 17.0 19.1
Total 29.0 34.0 25.4 27.5 43.7 42.6 98.1 104.1
1Excludes E.ON Connecting Energies.
Interim Group Management Report
Nine-month power sales in the United Kingdom decreased by
2.1 billion kWh. Declining customer numbers led to lower power
sales to residential and SME customers. A reduction in sales
volume and in the number of customer facilities served was the
reason for the decline in power sales to I&C customers. Gas sales
decreased by 4.6 billion kWh. Lower customer numbers and,
in part, a weather-driven decline in demand were responsible
for the reduction in gas sales to residential and SME customers.
The reason for the decline in gas sales to I&C customers is the
same as for power.
Power sales at the Other unit (Sweden, Hungary, the Czech
Republic, Romania, and Italy) rose by 1.1 billion kWh, primarily
because of the acquisition of new customers in Romania and
Hungary along with comparatively lower temperatures. By con-
trast, power sales in Italy declined owing to lower demand. Gas
sales were 1.2 billion kWh higher. This is chiefly attributable to a
weather-driven increase in sales volume to residential and SME
customers in Romania and slightly higher demand from I&C and
sales-partner customers in Italy. By contrast, gas sales were
lower in Sweden due to the end of deliveries to a large customer.
Customer Solutions
Below we report on a number of this segment’s important
non-financial key figures, such as power and gas sales volume.
Power and Gas Sales VolumeThis segment’s nine-month power sales declined by 6 billion kWh,
whereas its gas sales rose by 0.6 billion kWh.
Power sales in Germany of 29 billion kWh were 15 percent
below the prior-year level. Power sales to residential and small
and medium enterprise (“SME”) customers were lower due to
keener competition. The decline in power sales to industrial and
commercial (“I&C”) customers resulted mainly from the transfer
of the remaining wholesale customers to Uniper. Power sales to
sales partners were lower, chiefly because deliveries to a munic-
ipal utility ended. Power sales to the wholesale market were
below the prior-year level due to the expiration of procurement
contracts for wholesale customers, which were reassigned
from E.ON to Uniper at the end of 2015. Gas sales volume of
31.8 billion kWh increased by 14 percent. Gas sales to residential
and SME customers were lower due to keener competition. Gas
sales to I&C customers declined owing to the above-mentioned
reason for the power business. Gas sales to the wholesale market
were higher due to a change in how we classify resales to Uniper,
which in 2016 were included on the procurement side.
21Interim Report III/2017
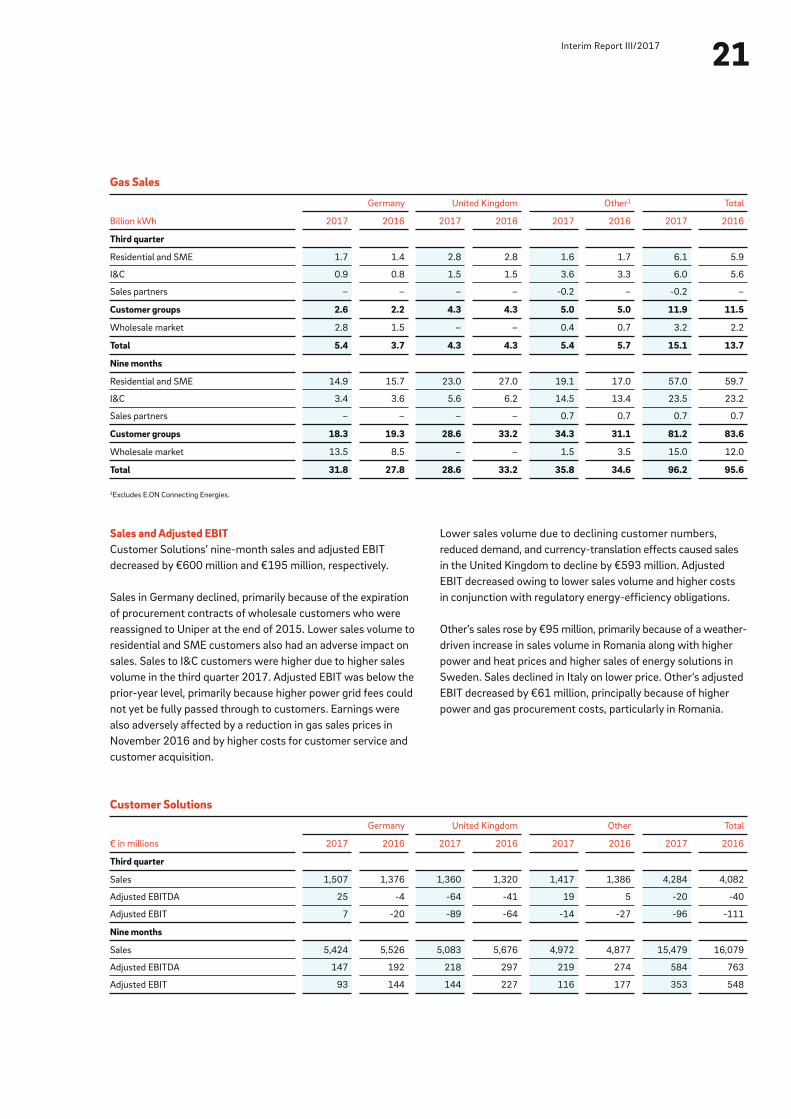
Gas Sales
Billion kWh
Germany United Kingdom Other1 Total
2017 2016 2017 2016 2017 2016 2017 2016
Third quarter
Residential and SME 1.7 1.4 2.8 2.8 1.6 1.7 6.1 5.9
I&C 0.9 0.8 1.5 1.5 3.6 3.3 6.0 5.6
Sales partners – – – – -0.2 – -0.2 –
Customer groups 2.6 2.2 4.3 4.3 5.0 5.0 11.9 11.5
Wholesale market 2.8 1.5 – – 0.4 0.7 3.2 2.2
Total 5.4 3.7 4.3 4.3 5.4 5.7 15.1 13.7
Nine months
Residential and SME 14.9 15.7 23.0 27.0 19.1 17.0 57.0 59.7
I&C 3.4 3.6 5.6 6.2 14.5 13.4 23.5 23.2
Sales partners – – – – 0.7 0.7 0.7 0.7
Customer groups 18.3 19.3 28.6 33.2 34.3 31.1 81.2 83.6
Wholesale market 13.5 8.5 – – 1.5 3.5 15.0 12.0
Total 31.8 27.8 28.6 33.2 35.8 34.6 96.2 95.6
1Excludes E.ON Connecting Energies.
Sales and Adjusted EBITCustomer Solutions’ nine-month sales and adjusted EBIT
decreased by €600 million and €195 million, respectively.
Sales in Germany declined, primarily because of the expiration
of procurement contracts of wholesale customers who were
reassigned to Uniper at the end of 2015. Lower sales volume to
residential and SME customers also had an adverse impact on
sales. Sales to I&C customers were higher due to higher sales
volume in the third quarter 2017. Adjusted EBIT was below the
prior-year level, primarily because higher power grid fees could
not yet be fully passed through to customers. Earnings were
also adversely affected by a reduction in gas sales prices in
November 2016 and by higher costs for customer service and
customer acquisition.
Lower sales volume due to declining customer numbers,
reduced demand, and currency-translation effects caused sales
in the United Kingdom to decline by €593 million. Adjusted
EBIT decreased owing to lower sales volume and higher costs
in conjunction with regulatory energy-efficiency obligations.
Other’s sales rose by €95 million, primarily because of a weather-
driven increase in sales volume in Romania along with higher
power and heat prices and higher sales of energy solutions in
Sweden. Sales declined in Italy on lower price. Other’s adjusted
EBIT decreased by €61 million, principally because of higher
power and gas procurement costs, particularly in Romania.
Customer Solutions
€ in millions
Germany United Kingdom Other Total
2017 2016 2017 2016 2017 2016 2017 2016
Third quarter
Sales 1,507 1,376 1,360 1,320 1,417 1,386 4,284 4,082
Adjusted EBITDA 25 -4 -64 -41 19 5 -20 -40
Adjusted EBIT 7 -20 -89 -64 -14 -27 -96 -111
Nine months
Sales 5,424 5,526 5,083 5,676 4,972 4,877 15,479 16,079
Adjusted EBITDA 147 192 218 297 219 274 584 763
Adjusted EBIT 93 144 144 227 116 177 353 548

22Interim Group Management Report
United States was the principal factor. Output in Europe was
higher due to favorable wind conditions, particularly in Poland,
Germany, and Sweden. This unit’s third-quarter owned generation
in the United States declined owing to poor wind conditions.
Offshore Wind/Other’s owned generation decreased slightly
compared with the prior year. Lower output in the United Kingdom
was partially offset by higher output in Sweden and Denmark
resulting from favorable wind conditions.
Renewables
Below we report on a number of important non-financial key
figures for this segment, such as power generation and power
sales volume.
Power GenerationThis segment’s nine-month owned generation rose by
0.3 billion kWh.
Onshore Wind/Solar’s owned generation was 0.4 billion kWh
higher. The commissioning of Colbeck’s Corner wind farm in the
Power Generation
Billion kWh
Onshore Wind/Solar Offshore Wind/Other Total
2017 2016 2017 2016 2017 2016
Third quarter
Owned generation 1.4 1.7 0.7 0.7 2.1 2.4
Purchases 0.3 0.3 0.2 0.1 0.5 0.4
Jointly owned power plants – – 0.2 0.1 0.2 0.1
Third parties 0.3 0.3 – – 0.3 0.3
Power sales 1.7 2.0 0.9 0.8 2.6 2.8
Nine months
Owned generation 6.3 5.9 2.4 2.5 8.7 8.4
Purchases 1.0 1.0 0.6 0.5 1.6 1.5
Jointly owned power plants – – 0.6 0.5 0.6 0.5
Third parties 1.0 1.0 – – 1.0 1.0
Power sales 7.3 6.9 3.0 3.0 10.3 9.9
23Interim Report III/2017
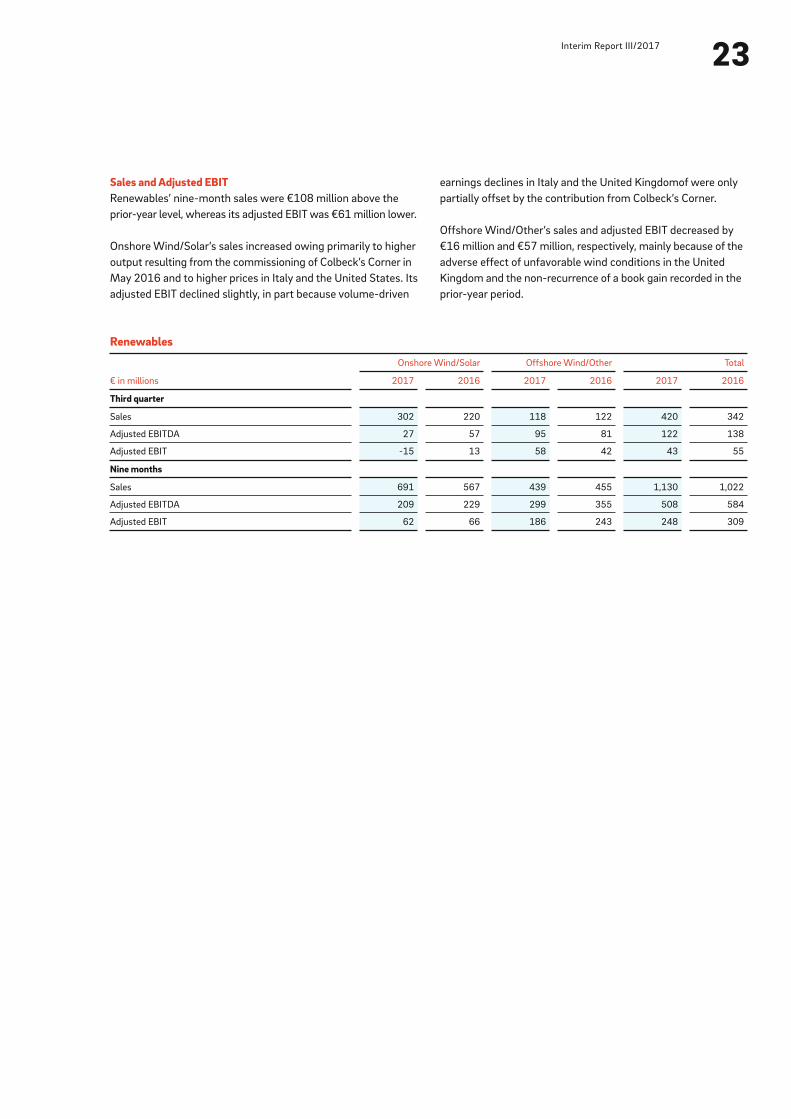
earnings declines in Italy and the United Kingdomof were only
partially offset by the contribution from Colbeck’s Corner.
Offshore Wind/Other’s sales and adjusted EBIT decreased by
€16 million and €57 million, respectively, mainly because of the
adverse effect of unfavorable wind conditions in the United
Kingdom and the non-recurrence of a book gain recorded in the
prior-year period.
Sales and Adjusted EBITRenewables’ nine-month sales were €108 million above the
prior-year level, whereas its adjusted EBIT was €61 million lower.
Onshore Wind/Solar’s sales increased owing primarily to higher
output resulting from the commissioning of Colbeck’s Corner in
May 2016 and to higher prices in Italy and the United States. Its
adjusted EBIT declined slightly, in part because volume-driven
Renewables
€ in millions
Onshore Wind/Solar Offshore Wind/Other Total
2017 2016 2017 2016 2017 2016
Third quarter
Sales 302 220 118 122 420 342
Adjusted EBITDA 27 57 95 81 122 138
Adjusted EBIT -15 13 58 42 43 55
Nine months
Sales 691 567 439 455 1,130 1,022
Adjusted EBITDA 209 229 299 355 508 584
Adjusted EBIT 62 66 186 243 248 309

24Interim Group Management Report
Non-Core Business
Below we report on a number of important non-financial key
figures for this segment, such as power generation and power
procurement.
PreussenElektra’s Power Generation This segment’s power procured (owned generation and purchases)
of 27.4 billion kWh was at the prior-year level. The reduction
in owned generation is principally attributable to the unplanned
extension of the overhaul at Brokdorf nuclear power station due
to a thicker oxide layer on some fuel elements. The increase in
power procured reflects the purchase of power to meet delivery
obligations; 1.1 billion kWh of power was purchased for this
reason in the third quarter.
Power Generation
Billion kWh
PreussenElektra
2017 2016
Third quarter
Owned generation 7.3 7.6
Purchases 2.2 0.8
Jointly owned power plants 0.4 0.4
Third parties 1.8 0.4
Total 9.5 8.4
Station use, line loss, etc. – –
Power sales 9.5 8.4
Nine months
Owned generation 18.9 23.1
Purchases 8.5 3.6
Jointly owned power plants 1.0 1.0
Third parties 7.5 2.6
Total 27.4 26.7
Station use, line loss, etc. -0.1 -0.2
Power sales 27.3 26.5
PreussenElektra’s Sales and Adjusted EBITThis segment’s sales were up €162 million year on year. The
adverse impact of lower sales prices and the expiration of supply
contracts was more than offset by higher sales volume to Uniper
and one-off items, in particular in conjunction with a legal pro-
ceeding. The improvement in third-quarter sales is attributable
to higher sales volume to Uniper.
Adjusted EBIT of €357 million was slightly above the prior-year
figure of €345 million. The adverse impact of the unplanned
outage at Brokdorf and higher depreciation charges was offset
by the absence of the nuclear-fuel tax (which expired at the end
of 2016) and by one-off items. The improvement in third-quarter
adjusted EBIT is primarily attributable to the expiration of the
nuclear-fuel tax at the end of 2016.
Non-Core Business
€ in millions
PreussenElektra
2017 2016
Third quarter
Sales 339 317
Adjusted EBITDA 133 83
Adjusted EBIT 86 62
Nine months
Sales 1,230 1,068
Adjusted EBITDA 497 410
Adjusted EBIT 357 345

25Interim Report III/2017Review Report
Based on our review, no matters have come to our attention that
cause us to presume that the condensed consolidated interim
financial statements have not been prepared, in all material
respects, in accordance with the IFRS applicable to interim finan-
cial reporting as adopted by the EU nor that the interim group
management report has not been prepared, in all material respects,
in accordance with the provisions of the German Securities
Trading Act applicable to interim group management reports.
Düsseldorf, November 7, 2017
PricewaterhouseCoopers GmbH
Wirtschaftsprüfungsgesellschaft
Markus Dittmann Aissata Touré
Wirtschaftsprüfer Wirtschaftsprüferin
(German Public Auditor) (German Public Auditor)
To E.ON SE, Essen
We have reviewed the condensed consolidated interim financial
statements—comprising the balance sheet, income statement,
statement of recognized income and expenses, condensed cash
flows statement, statement of changes in equity and selected
explanatory notes—and the interim group management report of
E.ON SE for the period from January 1 to September 30, 2017,
which are part of the quarterly financial report pursuant to
§ (Article) 37w WpHG (“Wertpapierhandelsgesetz”: German
Securities Trading Act). The preparation of the condensed con-
solidated interim financial statements in accordance with the
IFRS applicable to interim financial reporting as adopted by the EU
and of the interim group management report in accordance with
the provisions of the German Securities Trading Act applicable
to interim group management reports is the responsibility of the
parent Company’s Board of Managing Directors. Our responsi-
bility is to issue a review report on the condensed consolidated
interim financial statements and on the interim group manage-
ment report based on our review.
We conducted our review of the condensed consolidated interim
financial statements and the interim group management report
in accordance with German generally accepted standards for
the review of financial statements promulgated by the Institut
der Wirtschaftsprüfer (Institute of Public Auditors in Germany)
(IDW) and additionally observed the International Standard on
Review Engagements “Review of Interim Financial Information
Performed by the Independent Auditor of the Entity” (ISRE 2410).
Those standards require that we plan and perform the review so
that we can preclude through critical evaluation, with moderate
assurance, that the condensed consolidated interim financial
statements have not been prepared, in all material respects, in
accordance with the IFRS applicable to interim financial reporting
as adopted by the EU and that the interim group management
report has not been prepared, in all material respects, in accor-
dance with the provisions of the German Securities Trading Act
applicable to interim group management reports. A review is
limited primarily to inquiries of company personnel and analytical
procedures and therefore does not provide the assurance attain-
able in a financial statement audit. Since, in accordance with
our engagement, we have not performed a financial statement
audit, we cannot express an audit opinion.

Notes to the Condensed Consolidated Interim Financial Statements

Condensed Consolidated Interim Financial Statements
28Condensed Consolidated Interim Financial Statements
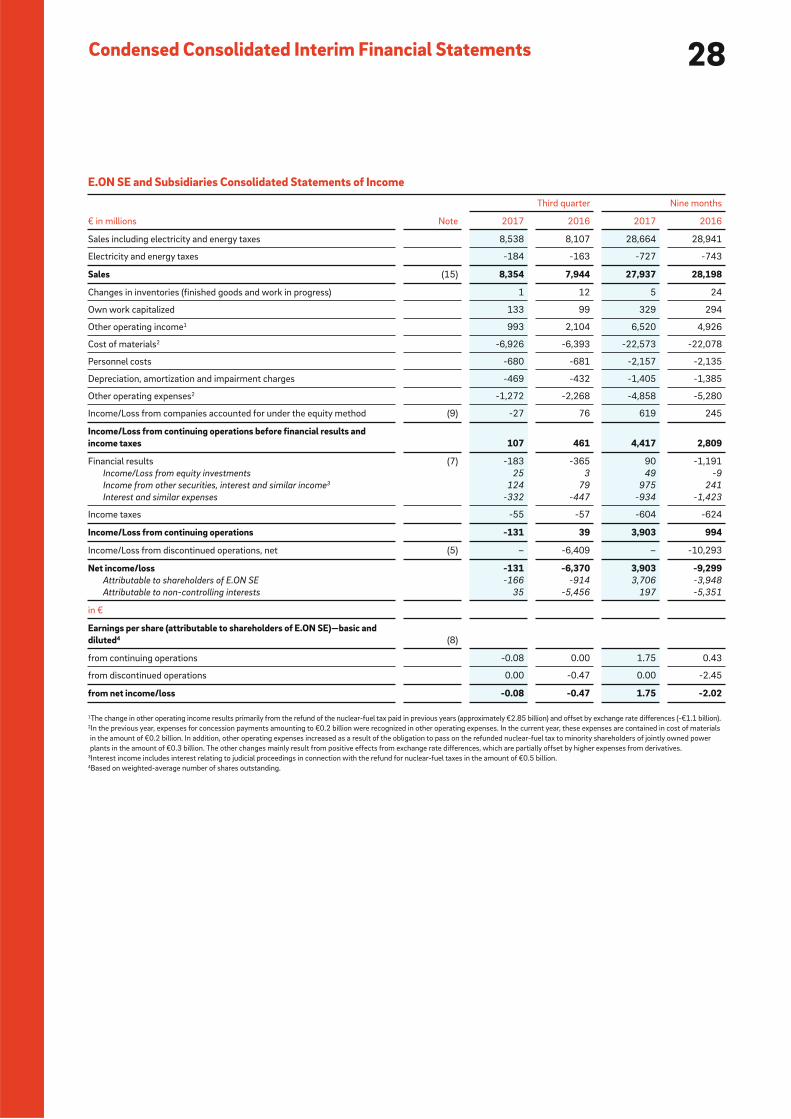
Sales including electricity and energy taxes 8,538 8,107 28,664 28,941
Electricity and energy taxes -184 -163 -727 -743
Sales (15) 8,354 7,944 27,937 28,198
Changes in inventories (finished goods and work in progress) 1 12 5 24
Own work capitalized 133 99 329 294
Other operating income 1 993 2,104 6,520 4,926
Cost of materials 2 -6,926 -6,393 -22,573 -22,078
Personnel costs -680 -681 -2,157 -2,135
Depreciation, amortization and impairment charges -469 -432 -1,405 -1,385
Other operating expenses 2 -1,272 -2,268 -4,858 -5,280
Income/Loss from companies accounted for under the equity method (9) -27 76 619 245
Income/Loss from continuing operations before financial results and income taxes 107 461 4,417 2,809
Financial results (7) -183 -365 90 -1,191
Income/Loss from equity investments 25 3 49 -9
Income from other securities, interest and similar income 3 124 79 975 241
Interest and similar expenses -332 -447 -934 -1,423
Income taxes -55 -57 -604 -624
Income/Loss from continuing operations -131 39 3,903 994
Income/Loss from discontinued operations, net (5) – -6,409 – -10,293
Net income/loss -131 -6,370 3,903 -9,299Attributable to shareholders of E.ON SE -166 -914 3,706 -3,948
Attributable to non-controlling interests 35 -5,456 197 -5,351
in €
Earnings per share (attributable to shareholders of E.ON SE)—basic and diluted 4 (8)
from continuing operations -0.08 0.00 1.75 0.43
from discontinued operations 0.00 -0.47 0.00 -2.45
from net income/loss -0.08 -0.47 1.75 -2.02
E.ON SE and Subsidiaries Consolidated Statements of Income
€ in millions Note
Third quarter Nine months
2017 2016 2017 2016
1The change in other operating income results primarily from the refund of the nuclear-fuel tax paid in previous years (approximately €2.85 billion) and offset by exchange rate differences (-€1.1 billion).2In the previous year, expenses for concession payments amounting to €0.2 billion were recognized in other operating expenses. In the current year, these expenses are contained in cost of materials
in the amount of €0.2 billion. In addition, other operating expenses increased as a result of the obligation to pass on the refunded nuclear-fuel tax to minority shareholders of jointly owned power
plants in the amount of €0.3 billion. The other changes mainly result from positive effects from exchange rate differences, which are partially offset by higher expenses from derivatives.3Interest income includes interest relating to judicial proceedings in connection with the refund for nuclear-fuel taxes in the amount of €0.5 billion.4Based on weighted-average number of shares outstanding.
29Interim Report III/2017
E.ON SE and Subsidiaries Consolidated Statements of Recognized Income and Expenses
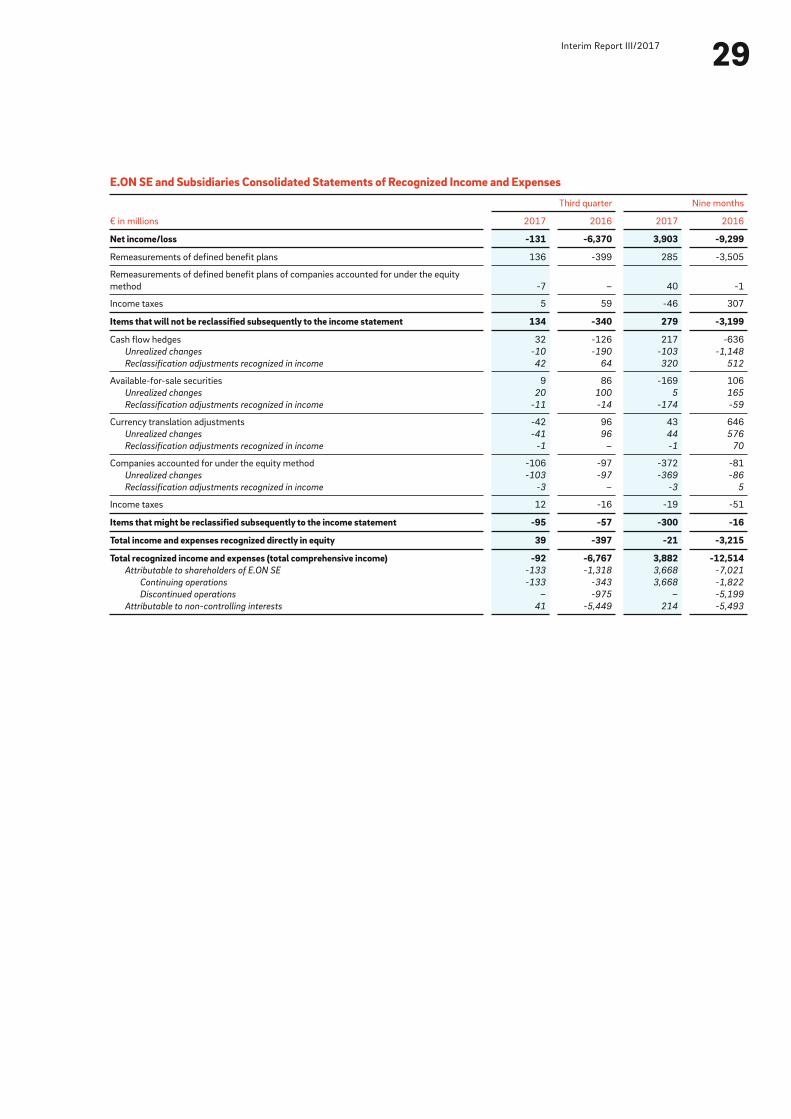
Net income/loss -131 -6,370 3,903 -9,299
Remeasurements of defined benefit plans 136 -399 285 -3,505
Remeasurements of defined benefit plans of companies accounted for under the equity
method -7 – 40 -1
Income taxes 5 59 -46 307
Items that will not be reclassified subsequently to the income statement 134 -340 279 -3,199
Cash flow hedges 32 -126 217 -636
Unrealized changes -10 -190 -103 -1,148
Reclassification adjustments recognized in income 42 64 320 512
Available-for-sale securities 9 86 -169 106
Unrealized changes 20 100 5 165
Reclassification adjustments recognized in income -11 -14 -174 -59
Currency translation adjustments -42 96 43 646
Unrealized changes -41 96 44 576
Reclassification adjustments recognized in income -1 – -1 70
Companies accounted for under the equity method -106 -97 -372 -81
Unrealized changes -103 -97 -369 -86
Reclassification adjustments recognized in income -3 – -3 5
Income taxes 12 -16 -19 -51
Items that might be reclassified subsequently to the income statement -95 -57 -300 -16
Total income and expenses recognized directly in equity 39 -397 -21 -3,215
Total recognized income and expenses (total comprehensive income) -92 -6,767 3,882 -12,514Attributable to shareholders of E.ON SE -133 -1,318 3,668 -7,021
Continuing operations -133 -343 3,668 -1,822
Discontinued operations – -975 – -5,199
Attributable to non-controlling interests 41 -5,449 214 -5,493
€ in millions
Third quarter Nine months
2017 2016 2017 2016

30Condensed Consolidated Interim Financial Statements
Equity and Liabilities
Goodwill 3,381 3,463
Intangible assets 2,457 2,329
Property, plant and equipment 25,402 25,242
Companies accounted for under the equity method (9) 3,541 6,352
Other financial assets (9) 4,594 5,148
Equity investments 793 821
Non-current securities 3,801 4,327
Financial receivables and other financial assets 491 553
Operating receivables and other operating assets 1,476 1,761
Income tax assets 7 7
Deferred tax assets 1,156 1,441
Non-current assets 42,505 46,296
Inventories 847 785
Financial receivables and other financial assets 424 463
Trade receivables and other operating assets 4,707 6,719
Income tax assets 1,167 851
Liquid funds (3) 5,450 8,573
Securities and fixed-term deposits 746 2,147
Restricted cash and cash equivalents 639 852
Cash and cash equivalents 4,065 5,574
Assets held for sale (5) 3,198 12
Current assets 15,793 17,403
Total assets 58,298 63,699
Capital stock 2,201 2,001
Additional paid-in capital 9,862 9,201
Retained earnings -4,981 -8,495
Accumulated other comprehensive income -2,341 -2,048
Treasury shares (10) -1,126 -1,714
Equity attributable to shareholders of E.ON SE 3,615 -1,055
Non-controlling interests (before reclassification) 3,099 2,896
Reclassification related to put options -550 -554
Non-controlling interests 2,549 2,342
Equity 6,164 1,287
Financial liabilities 9,871 10,435
Operating liabilities 4,757 5,247
Income taxes 1,209 1,433
Provisions for pensions and similar obligations (12) 3,586 4,009
Miscellaneous provisions 15,143 15,609
Deferred tax liabilities 2,562 2,554
Non-current liabilities 37,128 39,287
Financial liabilities 4,433 3,792
Trade payables and other operating liabilities (3) 7,677 6,888
Income taxes 641 434
Miscellaneous provisions (3) 2,047 12,008
Liabilities associated with assets held for sale (5) 208 3
Current liabilities 15,006 23,125
Total equity and liabilities 58,298 63,699
E.ON SE and Subsidiaries Consolidated Balance Sheets
€ in millions Note
Sep. 30,
2017
Dec. 31,
2016
Assets
31Interim Report III/2017
E.ON SE and Subsidiaries Consolidated Statements of Cash Flows
Nine months
€ in millions 2017 2016
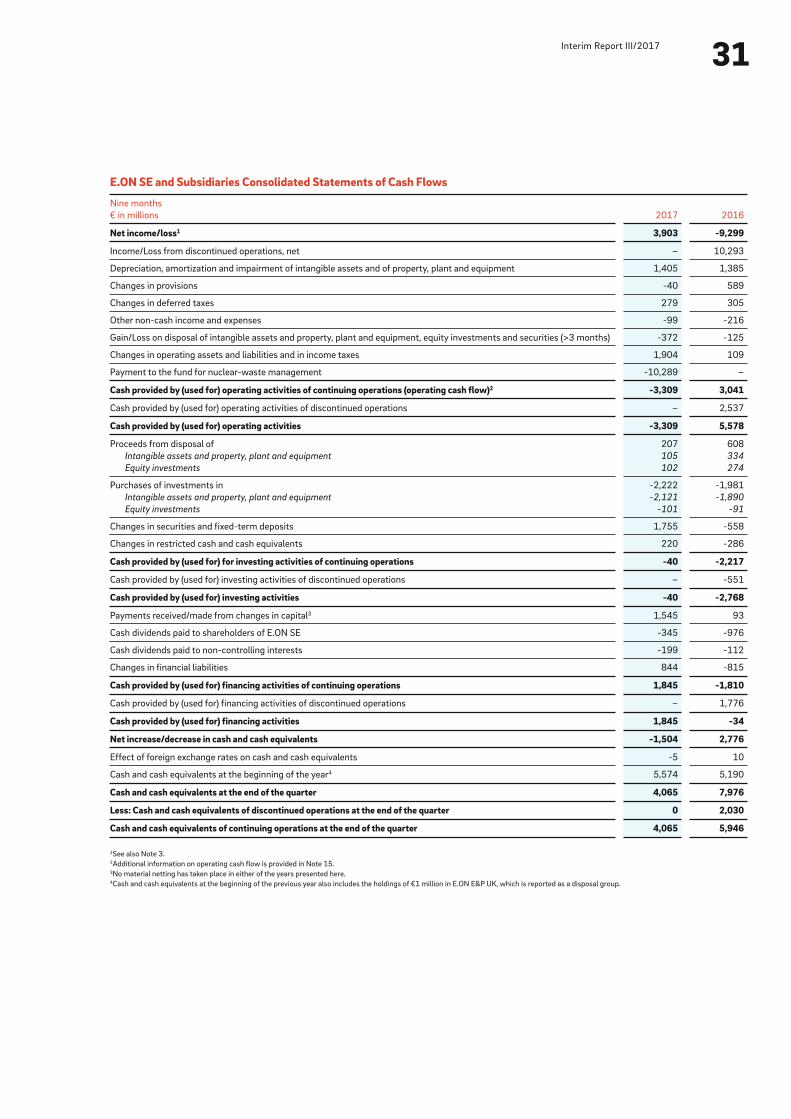
Net income/loss1 3,903 -9,299
Income/Loss from discontinued operations, net – 10,293
Depreciation, amortization and impairment of intangible assets and of property, plant and equipment 1,405 1,385
Changes in provisions -40 589
Changes in deferred taxes 279 305
Other non-cash income and expenses -99 -216
Gain/Loss on disposal of intangible assets and property, plant and equipment, equity investments and securities (>3 months) -372 -125
Changes in operating assets and liabilities and in income taxes 1,904 109
Payment to the fund for nuclear-waste management -10,289 –
Cash provided by (used for) operating activities of continuing operations (operating cash flow)2 -3,309 3,041
Cash provided by (used for) operating activities of discontinued operations – 2,537
Cash provided by (used for) operating activities -3,309 5,578
Proceeds from disposal of 207 608
Intangible assets and property, plant and equipment 105 334
Equity investments 102 274
Purchases of investments in -2,222 -1,981
Intangible assets and property, plant and equipment -2,121 -1,890
Equity investments -101 -91
Changes in securities and fixed-term deposits 1,755 -558
Changes in restricted cash and cash equivalents 220 -286
Cash provided by (used for) for investing activities of continuing operations -40 -2,217
Cash provided by (used for) investing activities of discontinued operations – -551
Cash provided by (used for) investing activities -40 -2,768
Payments received/made from changes in capital3 1,545 93
Cash dividends paid to shareholders of E.ON SE -345 -976
Cash dividends paid to non-controlling interests -199 -112
Changes in financial liabilities 844 -815
Cash provided by (used for) financing activities of continuing operations 1,845 -1,810
Cash provided by (used for) financing activities of discontinued operations – 1,776
Cash provided by (used for) financing activities 1,845 -34
Net increase/decrease in cash and cash equivalents -1,504 2,776
Effect of foreign exchange rates on cash and cash equivalents -5 10
Cash and cash equivalents at the beginning of the year4 5,574 5,190
Cash and cash equivalents at the end of the quarter 4,065 7,976
Less: Cash and cash equivalents of discontinued operations at the end of the quarter 0 2,030
Cash and cash equivalents of continuing operations at the end of the quarter 4,065 5,946
1See also Note 3.2Additional information on operating cash flow is provided in Note 15.3No material netting has taken place in either of the years presented here.4Cash and cash equivalents at the beginning of the previous year also includes the holdings of €1 million in E.ON E&P UK, which is reported as a disposal group.
32Condensed Consolidated Interim Financial Statements
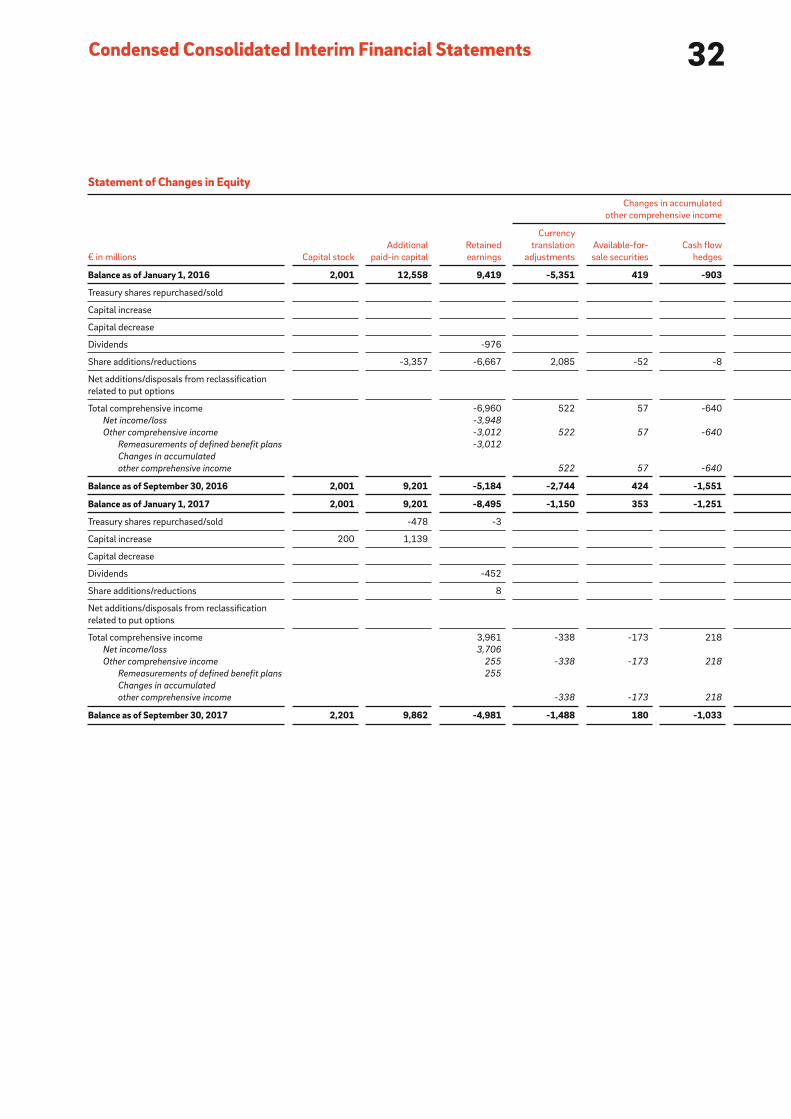
Statement of Changes in Equity
€ in millions Capital stock
Additional
paid-in capital
Retained
earnings
Changes in accumulated
other comprehensive income
Currency
translation
adjustments
Available-for-
sale securities
Cash flow
hedges
Balance as of January 1, 2016 2,001 12,558 9,419 -5,351 419 -903
Treasury shares repurchased/sold
Capital increase
Capital decrease
Dividends -976
Share additions/reductions -3,357 -6,667 2,085 -52 -8
Net additions/disposals from reclassification
related to put options
Total comprehensive income -6,960 522 57 -640
Net income/loss -3,948
Other comprehensive income -3,012 522 57 -640
Remeasurements of defined benefit plans -3,012
Changes in accumulated
other comprehensive income 522 57 -640
Balance as of September 30, 2016 2,001 9,201 -5,184 -2,744 424 -1,551
Balance as of January 1, 2017 2,001 9,201 -8,495 -1,150 353 -1,251
Treasury shares repurchased/sold -478 -3
Capital increase 200 1,139
Capital decrease
Dividends -452
Share additions/reductions 8
Net additions/disposals from reclassification
related to put options
Total comprehensive income 3,961 -338 -173 218
Net income/loss 3,706
Other comprehensive income 255 -338 -173 218
Remeasurements of defined benefit plans 255
Changes in accumulated
other comprehensive income -338 -173 218
Balance as of September 30, 2017 2,201 9,862 -4,981 -1,488 180 -1,033
33Interim Report III/2017
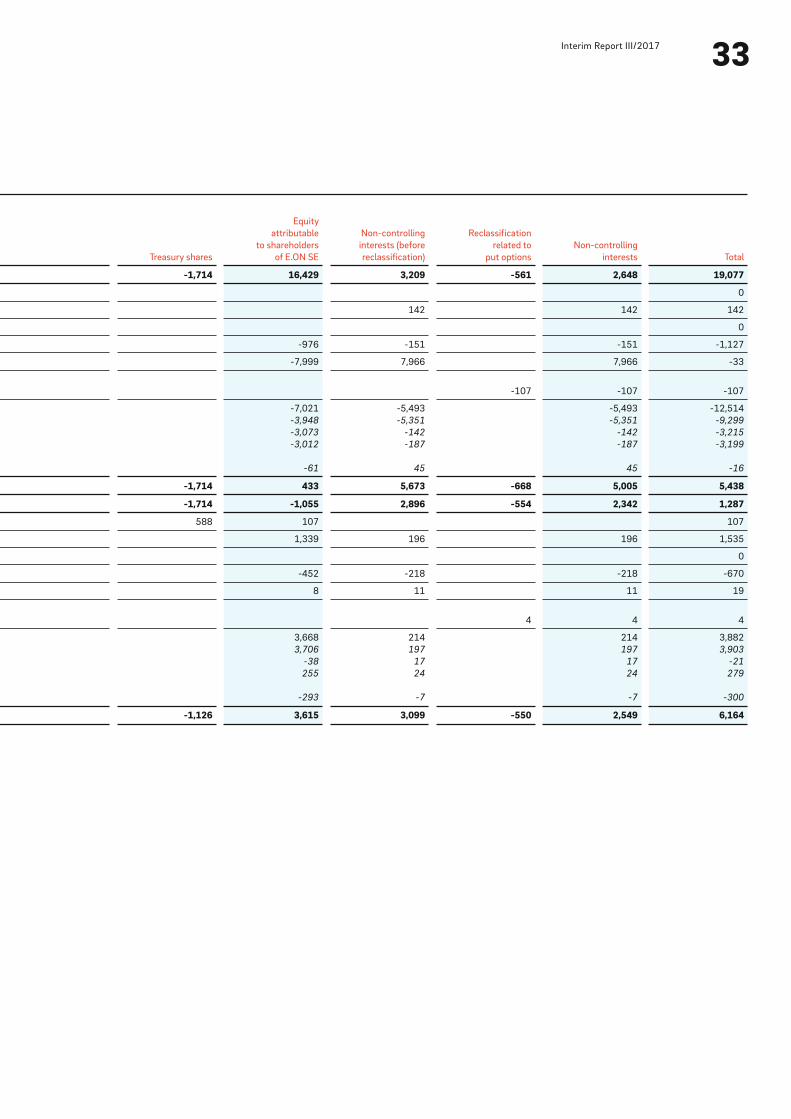
Treasury shares
Equity
attributable
to shareholders
of E.ON SE
Non-controlling
interests (before
reclassification)
Reclassification
related to
put options
Non-controlling
interests Total
-1,714 16,429 3,209 -561 2,648 19,077
0
142 142 142
0
-976 -151 -151 -1,127
-7,999 7,966 7,966 -33
-107 -107 -107
-7,021 -5,493 -5,493 -12,514
-3,948 -5,351 -5,351 -9,299
-3,073 -142 -142 -3,215
-3,012 -187 -187 -3,199
-61 45 45 -16
-1,714 433 5,673 -668 5,005 5,438
-1,714 -1,055 2,896 -554 2,342 1,287
588 107 107
1,339 196 196 1,535
0
-452 -218 -218 -670
8 11 11 19
4 4 4
3,668 214 214 3,882
3,706 197 197 3,903
-38 17 17 -21
255 24 24 279
-293 -7 -7 -300
-1,126 3,615 3,099 -550 2,549 6,164

34Notes to the Condensed Consolidated Interim Financial Statements
(1) Summary of Significant Accounting Policies
The Interim Report for the nine months ended September 30,
2017, has been prepared in accordance with those International
Financial Reporting Standards (“IFRS”) and IFRS Interpretations
Committee interpretations (“IFRS IC”) effective and adopted for
use in the European Union (“EU”).
This Interim Report was prepared using the accounting, valuation
and consolidation policies used in the Consolidated Financial
Statements for the 2016 fiscal year.
This Interim Report prepared in accordance with IAS 34 is con-
densed compared with the scope applied to the Consolidated
Financial Statements for the full year. For further information,
including information about E.ON’s risk management system,
please refer to E.ON’s Consolidated Financial Statements for
the year ended December 31, 2016, which provide the basis for
this Interim Report.
(2) Material Standards Applicable in 2018
IFRS 9, “Financial Instruments”
In July 2014, the IASB published the new standard IFRS 9,
“Financial Instruments,” which must be applied for fiscal years
beginning on or after January 1, 2018. The changes to the new
standard can be divided into three phases. E.ON expects higher
income volatility from the future amendments in phase I “Classi-
fication of Financial Instruments” since equity instruments will
in the future be classified as fair value in net income for the
period. Phase II of the project addresses impairment of financial
assets. The new impairment model, which, in contrast to the
impairment model under IAS 39, takes account not only of
losses that have already been incurred but also expected losses
(expected loss model), will make more use of forward-looking
information and take losses into account at an earlier stage.
Because of the new model, in the future E.ON expects the timing
on the impairment of financial assets to be different. E.ON
expects no material impacts from the third phase of the project
“Hedge Accounting.”
IFRS 15, “Revenue from Contracts with Customers”
In May 2014, the IASB published IFRS 15, “Revenue from Con-
tracts with Customers,” which must be applied for fiscal years
beginning on or after January 1, 2018. Initial application is
retrospective, and the E.ON Group has opted for modified retro-
spective initial application. Within the framework of the project
for the implementation of IFRS 15, the following significant
impact was identified in comparison with the previous revenue
recognition: The revision criteria for principal/agent relationships
will at times result in a change in recognition on the income
statement. This means that, in particular, revenues and cost of
materials will decrease without resulting in any earnings effects.
The cumulative effect is considered to be material.
(3) Material Transactions in the First Nine Months of 2017
Fund to Finance the Disposal of Nuclear Waste
On June 16, 2017, with the approval of the European Commission,
the Omnibus Act Reorganizing Responsibility for Nuclear Waste
Management (“Gesetz zur Neuordnung der Verantwortung in
der kerntechnischen Entsorgung”) adopted by Germany’s two
houses of parliament in December 2016, entered into force. As
part of this, supplemental regulations were published for the
specification of the payment amount as well as the procedures
for payment into the fund set up by the Federal Republic of
Germany to finance the disposal of nuclear waste.
E.ON had committed itself to payment of a basic amount
plus carryforward of €7,640 million and a risk surcharge of
€2,649 million.
On July 3, 2017, the payments for the basic amount plus carry-
forward and the risk surcharge for all nuclear power plants and
equity investments in nuclear power plants attributable to E.ON
were fully paid up. According to confirmations by the fund, E.ON
and other subsidiaries are therefore no longer liable for the
disposal tasks assumed by the Federal Republic of Germany.
The payments of €10,289 million are recognized separately in
cash flow from operations in the third quarter of 2017. Taking
into account the passing on of charges from and to co-owners,
E.ON’s payment obligation totaled €10,066 million.
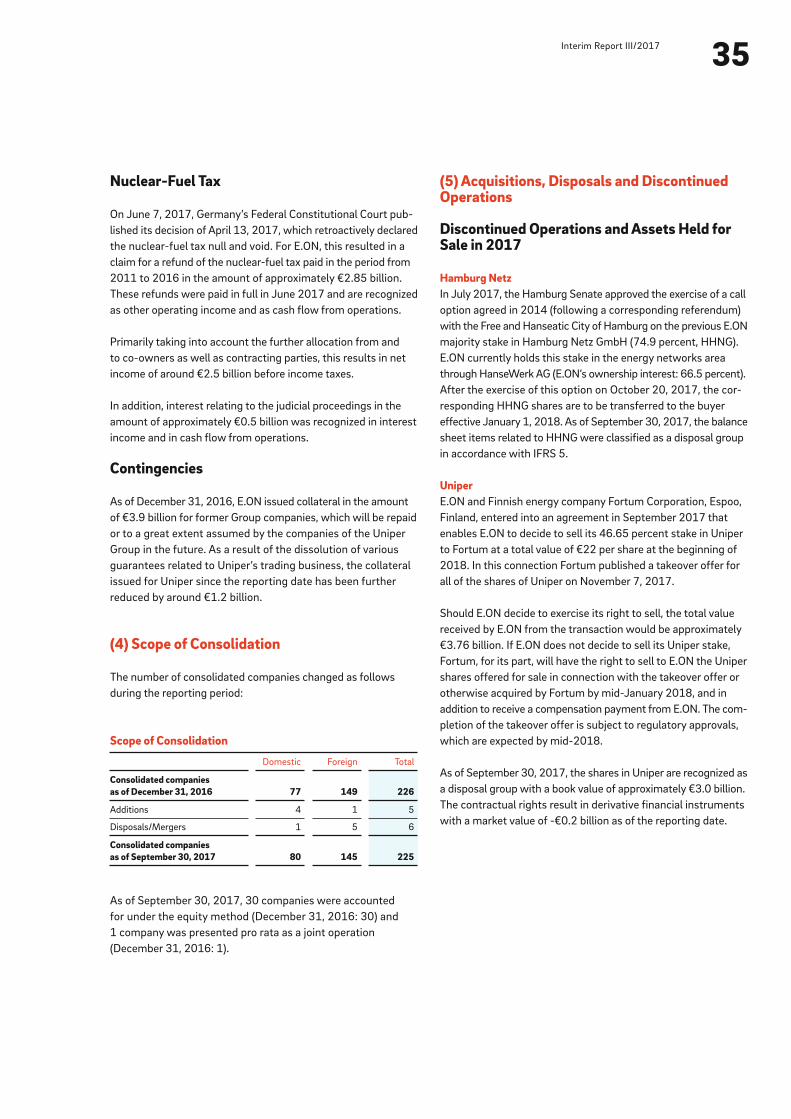
35Interim Report III/2017
(5) Acquisitions, Disposals and Discontinued Operations
Discontinued Operations and Assets Held for Sale in 2017
Hamburg NetzIn July 2017, the Hamburg Senate approved the exercise of a call
option agreed in 2014 (following a corresponding referendum)
with the Free and Hanseatic City of Hamburg on the previous E.ON
majority stake in Hamburg Netz GmbH (74.9 percent, HHNG).
E.ON currently holds this stake in the energy networks area
through HanseWerk AG (E.ON’s ownership interest: 66.5 percent).
After the exercise of this option on October 20, 2017, the cor-
responding HHNG shares are to be transferred to the buyer
effective January 1, 2018. As of September 30, 2017, the balance
sheet items related to HHNG were classified as a disposal group
in accordance with IFRS 5.
UniperE.ON and Finnish energy company Fortum Corporation, Espoo,
Finland, entered into an agreement in September 2017 that
enables E.ON to decide to sell its 46.65 percent stake in Uniper
to Fortum at a total value of €22 per share at the beginning of
2018. In this connection Fortum published a takeover offer for
all of the shares of Uniper on November 7, 2017.
Should E.ON decide to exercise its right to sell, the total value
received by E.ON from the transaction would be approximately
€3.76 billion. If E.ON does not decide to sell its Uniper stake,
Fortum, for its part, will have the right to sell to E.ON the Uniper
shares offered for sale in connection with the takeover offer or
otherwise acquired by Fortum by mid-January 2018, and in
addition to receive a compensation payment from E.ON. The com-
pletion of the takeover offer is subject to regulatory approvals,
which are expected by mid-2018.
As of September 30, 2017, the shares in Uniper are recognized as
a disposal group with a book value of approximately €3.0 billion.
The contractual rights result in derivative financial instruments
with a market value of -€0.2 billion as of the reporting date.
Nuclear-Fuel Tax
On June 7, 2017, Germany’s Federal Constitutional Court pub-
lished its decision of April 13, 2017, which retroactively declared
the nuclear-fuel tax null and void. For E.ON, this resulted in a
claim for a refund of the nuclear-fuel tax paid in the period from
2011 to 2016 in the amount of approximately €2.85 billion.
These refunds were paid in full in June 2017 and are recognized
as other operating income and as cash flow from operations.
Primarily taking into account the further allocation from and
to co-owners as well as contracting parties, this results in net
income of around €2.5 billion before income taxes.
In addition, interest relating to the judicial proceedings in the
amount of approximately €0.5 billion was recognized in interest
income and in cash flow from operations.
Contingencies
As of December 31, 2016, E.ON issued collateral in the amount
of €3.9 billion for former Group companies, which will be repaid
or to a great extent assumed by the companies of the Uniper
Group in the future. As a result of the dissolution of various
guarantees related to Uniper’s trading business, the collateral
issued for Uniper since the reporting date has been further
reduced by around €1.2 billion.
(4) Scope of Consolidation
The number of consolidated companies changed as follows
during the reporting period:
As of September 30, 2017, 30 companies were accounted
for under the equity method (December 31, 2016: 30) and
1 company was presented pro rata as a joint operation
(December 31, 2016: 1).
Scope of Consolidation
Domestic Foreign Total
Consolidated companies as of December 31, 2016 77 149 226
Additions 4 1 5
Disposals/Mergers 1 5 6
Consolidated companies as of September 30, 2017 80 145 225

36Notes to the Condensed Consolidated Interim Financial Statements
Discontinued Operations and Assets Held for Sale in 2016
UniperThe spinoff of the conventional power generation, global energy
trading, Russia and exploration and production business areas
into a separate entity now called the Uniper Group, which the
Management Board of E.ON SE had decided in December 2014,
was organizationally and legally completed in 2016.
The spinoff was legally completed with the approval of the spinoff
of 53.35 percent of the shares of Uniper by the Annual Share-
holders Meeting on June 8, 2016, and when it was entered in the
commercial register on September 9, 2016. E.ON shareholders
received one Uniper share for every ten E.ON shares. Uniper SE
shares were admitted for official trading on the regulated market
of the Frankfurt Stock Exchange on September 9, 2016. Trading
commenced on September 12, 2016.
From the time at which the Annual Shareholders Meeting granted
its consent to the spinoff and until deconsolidation on Decem-
ber 31, 2016, Uniper met the requirements for being reported
as a discontinued operation.
Pursuant to IFRS 5, the carrying amounts of all of Uniper’s
assets and liabilities were required to be measured in accordance
with applicable IFRS immediately before their reclassification.
In the course of this measurement, based on the application of
IAS 36, an impairment charge of €2.9 billion was recognized on
non-current assets in the second quarter of 2016. Furthermore,
provisions were established for anticipated losses in the amount
of €0.9 billion.
When trading of Uniper SE shares on the Frankfurt Stock
Exchange commenced in the third quarter of 2016, the fair value
of Uniper was calculated on the basis of the share price, taking
into account a market-rate premium for presentation of owner-
ship. This resulted in the recognition of an additional impairment
of €6.1 billion, including deferred taxes, in results from discon-
tinued operations.
On December 31, 2016, the fair value-again taking into account
a market-rate premium for presentation of ownership was once
again to be compared with the carrying amount of the Uniper
Group. Although the market price had risen compared to the price
on September 30, 2016, a further impairment of approximately
€0.9 billion resulted from the increase in net assets at Uniper.
As of December 31, 2016, E.ON and Uniper entered into the
agreement on the non-exercise of control that was included in
the spinoff agreement. Under this agreement, E.ON undertakes
to abstain over the long term from exercising voting rights relating
to the election of a certain number of supervisory board members
of Uniper. With the finalization of the agreement, E.ON lost
control over Uniper despite the 46.65-percent stake retained in
Uniper, which in principle would provide actual control at the
Annual Shareholders Meeting due to E.ON’s expected majority
presence there.
The remaining 46.65-percent interest in Uniper has been
reclassified as an associated company since control was lost,
and was accounted for in the consolidated financial statements
using the equity method until reclassification at the end of
September 2017.
In the first nine months of 2016, E.ON generated revenues of
€2,170 million, interest income of €184 million and interest
expenses of €10 million, as well as other income of €1,126 million
and other expenses of €7,197 million, with companies of the
Uniper Group.
The following table shows selected financial information for the
Uniper Group, which is reported as discontinued operations for
the first nine months of 2016:
The deconsolidation of Uniper as of December 31, 2016 resulted
in a loss on disposal of €3.6 billion.
The disposed asset and liability items of the Uniper Group related
to intangible assets (€1.5 billion), property, plant and equipment
(€8.5 billion), other assets (€32.1 billion), provisions (€9.2 billion)
and liabilities (€26.5 billion). Taking into account other deconsoli-
dation effects (€0.5 billion), the loss on deconsolidation essen-
tially resulted from the recognition in income of the currency
translation effects previously recognized in other comprehensive
income.
E.ON Distribuţie România S.A.E.ON entered into an agreement with Allianz Capital Partners in
December 2016 to sell a 30-percent stake in E.ON Distribuţie
România S.A. E.ON Distribuţie România S.A owns and operates
Selected Financial Information— Uniper (Summary)
Nine months
€ in millions 2016
Sales 40,330
Other income 3,332
Other expense -53,905
Income/Loss from continuing operations before income taxes -10,243
Income taxes -70
Income/Loss from discontinued operations, net -10,313
37Interim Report III/2017
a gas distribution network of over 20,000 kilometers and a power
distribution network of more than 80,000 kilometers, supplying
more than 3 million customers. After conclusion of the transaction
on December 22, 2016, E.ON retains 56.5 percent of the shares
of E.ON Distribuţie România, and another 13.5 percent of the
shares are held by the Romanian Ministry of Energy. The parties
agreed to not disclose the purchase price. Since this is a sale of
shares without loss of control, no profit or loss was realized.
E.ON in SpainIn late November 2014, E.ON entered into contracts with a con-
sortium made up of Macquarie European Infrastructure Fund 4
(MEIF4) and Wren House Infrastructure (WHI) on the sale of its
Spanish and Portuguese activities. The transaction closed on
March 25, 2015, with a minimal loss on disposal.
As part of the framework agreement and a contractual agree-
ment building on that framework concluded in October 2016,
E.ON received an additional payment of €0.2 billion. This payment
is included as a purchase price adjustment from discontinued
operations in the fourth quarter of 2016.
Exploration and Production Business in the North SeaIn November 2014, E.ON had announced the strategic review of
its exploration and production business in the North Sea. Because
of a firming commitment to divest itself of these activities, E.ON
had reported this business as a disposal group as of September
30, 2015.
E.ON signed an agreement to sell all of its shares in E.ON Explo-
ration & Production Norge AS (“E.ON E&P Norge”), Stavanger,
Norway, to DEA Deutsche Erdoel AG (“DEA”), Hamburg,
Germany, in October 2015. The transaction was closed in
December 2015.
In January 2016, E.ON signed an agreement to sell its British
E&P subsidiary E.ON E&P UK Limited, London, United Kingdom,
to Premier Oil plc, London, United Kingdom. The base sales price
as of the January 1, 2015, effective date was approximately
€0.1 billion ($0.12 billion). In addition, E.ON retains liquid funds
that existed in the company as of the effective date, and also
receives other adjustments that will result in the transaction pro-
ducing a net cash inflow of approximately €0.3 billion. As the
purchase price for the British E&P business became more certain
in the fourth quarter of 2015, a charge was recognized on its
goodwill in the amount of approximately €0.1 billion. Held as a
disposal group in the former Exploration & Production global
unit, the major asset and liability items of the British E&P busi-
ness as of March 31, 2016, were goodwill (€0.1 billion) and
other assets (€0.7 billion), as well as liabilities (€0.6 billion). The
closing of the transaction at the end of April 2016 resulted in a
loss on disposal of about €0.1 billion, which consisted mostly
of realized foreign-exchange translation differences reclassified
from other comprehensive income to the income statement.
Enovos International S.A. In December 2015, E.ON signed an agreement to sell its
10-percent shareholding in Enovos International S.A., Esch-sur-
Alzette, Luxembourg—joining with RWE AG (“RWE”), Essen,
Germany, which also sold its own stake—to a bidder consortium
led by the Grand Duchy of Luxembourg and the independent
private investment company Ardian, Paris, France. The carrying
amount of the 10-percent shareholding amounted to approxi-
mately €0.1 billion as of December 31, 2015. The transaction
closed in the first quarter of 2016. The parties agreed to not
disclose the purchase price.
AS Latvijas GāzeOn December 22, 2015, E.ON entered into an agreement to
sell 28.974 percent of the shares of its associated shareholding
AS Latvijas Gāze, Riga, Latvia, to the Luxembourg company
Marguerite Gas I S.à r.l. The carrying amount of the equity inter-
est amounted to approximately €0.1 billion as of December 31,
2015. The transaction, which closed in January 2016 at a sales
price of approximately €0.1 billion, resulted in a minimal gain
on disposal.
Grid Connection Infrastructure for the Humber Wind Farm Following the construction and entry into service of the Humber
Gateway wind farm in the U.K. North Sea, E.ON was required by
regulation to sell to an independent third party the associated
grid connection infrastructure currently held by E.ON Climate &
Renewables UK Humber Wind Ltd., Coventry, United Kingdom
(“Humber Wind”). The sale to Balfour Beatty Equitix Consortium
(BBEC) was completed in September 2016. The sales price and
carrying amount totaled approximately €0.2 billion each.
Arkona Offshore Wind Farm PartnershipE.ON has made the decision to build the Arkona offshore wind
farm project in the Baltic Sea. The Norwegian energy company
Statoil has acquired a 50-percent interest in the project and
is involved from the start. E.ON is responsible for building and
operating the wind farm. The contract on the sale of the
50-percent stake was signed in the first quarter of 2016, and
the transaction closed in April 2016. The transaction resulted
in a minimal gain on disposal
(6) Research and Development Costs
The E.ON Group’s research and development costs under IFRS
totaled €4.5 million in the first nine months of 2017 (first nine
months of 2016: €8.5 million).
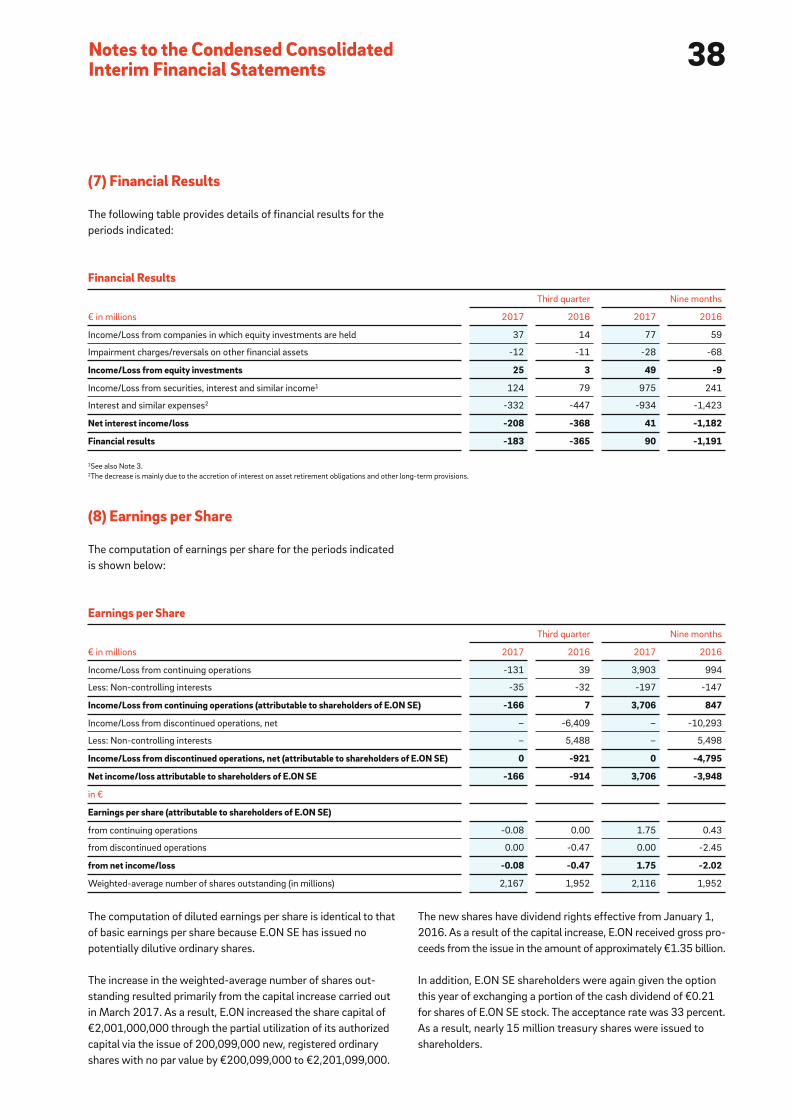
38Notes to the Condensed Consolidated Interim Financial Statements
(7) Financial Results
The following table provides details of financial results for the
periods indicated:
(8) Earnings per Share
The computation of earnings per share for the periods indicated
is shown below:
The computation of diluted earnings per share is identical to that
of basic earnings per share because E.ON SE has issued no
potentially dilutive ordinary shares.
The increase in the weighted-average number of shares out-
standing resulted primarily from the capital increase carried out
in March 2017. As a result, E.ON increased the share capital of
€2,001,000,000 through the partial utilization of its authorized
capital via the issue of 200,099,000 new, registered ordinary
shares with no par value by €200,099,000 to €2,201,099,000.
The new shares have dividend rights effective from January 1,
2016. As a result of the capital increase, E.ON received gross pro-
ceeds from the issue in the amount of approximately €1.35 billion.
In addition, E.ON SE shareholders were again given the option
this year of exchanging a portion of the cash dividend of €0.21
for shares of E.ON SE stock. The acceptance rate was 33 percent.
As a result, nearly 15 million treasury shares were issued to
shareholders.
Financial Results
€ in millions
Third quarter Nine months
2017 2016 2017 2016
Income/Loss from companies in which equity investments are held 37 14 77 59
Impairment charges/reversals on other financial assets -12 -11 -28 -68
Income/Loss from equity investments 25 3 49 -9
Income/Loss from securities, interest and similar income 1 124 79 975 241
Interest and similar expenses 2 -332 -447 -934 -1,423
Net interest income/loss -208 -368 41 -1,182
Financial results -183 -365 90 -1,191
1See also Note 3.2The decrease is mainly due to the accretion of interest on asset retirement obligations and other long-term provisions.
Earnings per Share
€ in millions
Third quarter Nine months
2017 2016 2017 2016
Income/Loss from continuing operations -131 39 3,903 994
Less: Non-controlling interests -35 -32 -197 -147
Income/Loss from continuing operations (attributable to shareholders of E.ON SE) -166 7 3,706 847
Income/Loss from discontinued operations, net – -6,409 – -10,293
Less: Non-controlling interests – 5,488 – 5,498
Income/Loss from discontinued operations, net (attributable to shareholders of E.ON SE) 0 -921 0 -4,795
Net income/loss attributable to shareholders of E.ON SE -166 -914 3,706 -3,948
in €
Earnings per share (attributable to shareholders of E.ON SE)
from continuing operations -0.08 0.00 1.75 0.43
from discontinued operations 0.00 -0.47 0.00 -2.45
from net income/loss -0.08 -0.47 1.75 -2.02
Weighted-average number of shares outstanding (in millions) 2,167 1,952 2,116 1,952
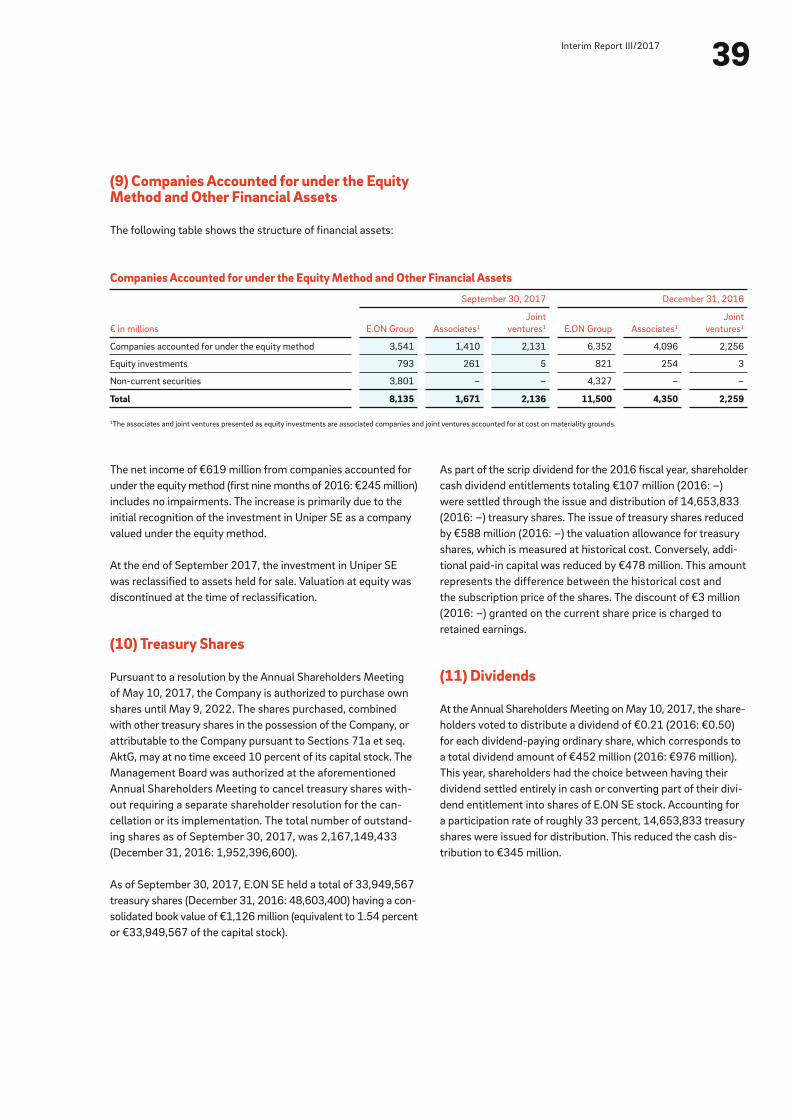
39Interim Report III/2017
The net income of €619 million from companies accounted for
under the equity method (first nine months of 2016: €245 million)
includes no impairments. The increase is primarily due to the
initial recognition of the investment in Uniper SE as a company
valued under the equity method.
At the end of September 2017, the investment in Uniper SE
was reclassified to assets held for sale. Valuation at equity was
discontinued at the time of reclassification.
(10) Treasury Shares
Pursuant to a resolution by the Annual Shareholders Meeting
of May 10, 2017, the Company is authorized to purchase own
shares until May 9, 2022. The shares purchased, combined
with other treasury shares in the possession of the Company, or
attributable to the Company pursuant to Sections 71a et seq.
AktG, may at no time exceed 10 percent of its capital stock. The
Management Board was authorized at the aforementioned
Annual Shareholders Meeting to cancel treasury shares with-
out requiring a separate shareholder resolution for the can-
cellation or its implementation. The total number of outstand-
ing shares as of September 30, 2017, was 2,167,149,433
(December 31, 2016: 1,952,396,600).
As of September 30, 2017, E.ON SE held a total of 33,949,567
treasury shares (December 31, 2016: 48,603,400) having a con-
solidated book value of €1,126 million (equivalent to 1.54 percent
or €33,949,567 of the capital stock).
(9) Companies Accounted for under the Equity Method and Other Financial Assets
The following table shows the structure of financial assets:
Companies Accounted for under the Equity Method and Other Financial Assets
€ in millions
September 30, 2017 December 31, 2016
E.ON Group Associates 1Joint
ventures 1 E.ON Group Associates 1Joint
ventures 1
Companies accounted for under the equity method 3,541 1,410 2,131 6,352 4,096 2,256
Equity investments 793 261 5 821 254 3
Non-current securities 3,801 – – 4,327 – –
Total 8,135 1,671 2,136 11,500 4,350 2,259
1The associates and joint ventures presented as equity investments are associated companies and joint ventures accounted for at cost on materiality grounds.
As part of the scrip dividend for the 2016 fiscal year, shareholder
cash dividend entitlements totaling €107 million (2016: –)
were settled through the issue and distribution of 14,653,833
(2016: –) treasury shares. The issue of treasury shares reduced
by €588 million (2016: –) the valuation allowance for treasury
shares, which is measured at historical cost. Conversely, addi-
tional paid-in capital was reduced by €478 million. This amount
represents the difference between the historical cost and
the subscription price of the shares. The discount of €3 million
(2016: –) granted on the current share price is charged to
retained earnings.
(11) Dividends
At the Annual Shareholders Meeting on May 10, 2017, the share-
holders voted to distribute a dividend of €0.21 (2016: €0.50)
for each dividend-paying ordinary share, which corresponds to
a total dividend amount of €452 million (2016: €976 million).
This year, shareholders had the choice between having their
dividend settled entirely in cash or converting part of their divi-
dend entitlement into shares of E.ON SE stock. Accounting for
a participation rate of roughly 33 percent, 14,653,833 treasury
shares were issued for distribution. This reduced the cash dis-
tribution to €345 million.
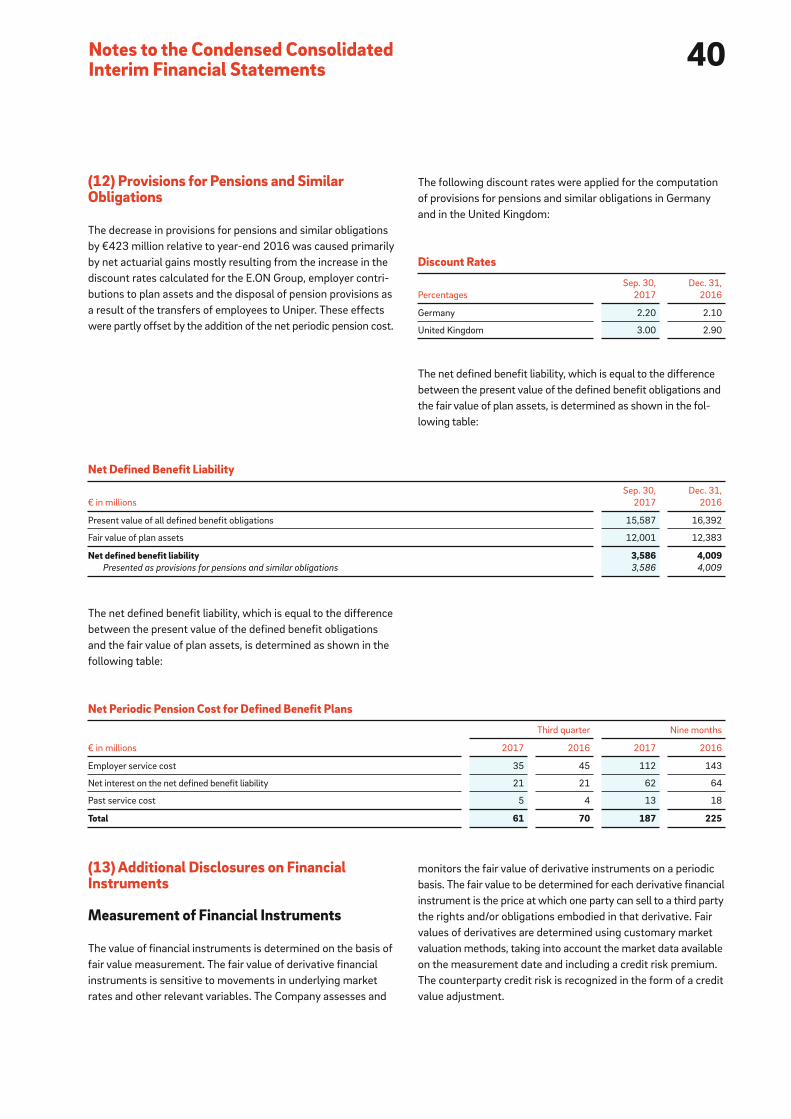
40Notes to the Condensed Consolidated Interim Financial Statements
The following discount rates were applied for the computation
of provisions for pensions and similar obligations in Germany
and in the United Kingdom:
The net defined benefit liability, which is equal to the difference
between the present value of the defined benefit obligations and
the fair value of plan assets, is determined as shown in the fol-
lowing table:
The net defined benefit liability, which is equal to the difference
between the present value of the defined benefit obligations
and the fair value of plan assets, is determined as shown in the
following table:
(13) Additional Disclosures on Financial Instruments
Measurement of Financial Instruments
The value of financial instruments is determined on the basis of
fair value measurement. The fair value of derivative financial
instruments is sensitive to movements in underlying market
rates and other relevant variables. The Company assesses and
monitors the fair value of derivative instruments on a periodic
basis. The fair value to be determined for each derivative financial
instrument is the price at which one party can sell to a third party
the rights and/or obligations embodied in that derivative. Fair
values of derivatives are determined using customary market
valuation methods, taking into account the market data available
on the measurement date and including a credit risk premium.
The counterparty credit risk is recognized in the form of a credit
value adjustment.
Net Defined Benefit Liability
€ in millions
Sep. 30,
2017
Dec. 31,
2016
Present value of all defined benefit obligations 15,587 16,392
Fair value of plan assets 12,001 12,383
Net defined benefit liability 3,586 4,009Presented as provisions for pensions and similar obligations 3,586 4,009
Net Periodic Pension Cost for Defined Benefit Plans
€ in millions
Third quarter Nine months
2017 2016 2017 2016
Employer service cost 35 45 112 143
Net interest on the net defined benefit liability 21 21 62 64
Past service cost 5 4 13 18
Total 61 70 187 225
Discount Rates
Percentages
Sep. 30,
2017
Dec. 31,
2016
Germany 2.20 2.10
United Kingdom 3.00 2.90
(12) Provisions for Pensions and Similar Obligations
The decrease in provisions for pensions and similar obligations
by €423 million relative to year-end 2016 was caused primarily
by net actuarial gains mostly resulting from the increase in the
discount rates calculated for the E.ON Group, employer contri-
butions to plan assets and the disposal of pension provisions as
a result of the transfers of employees to Uniper. These effects
were partly offset by the addition of the net periodic pension cost.

41Interim Report III/2017
information available that is based on market prices for com-
parable assets or on suitable valuation techniques. In such
cases, E.ON determines fair value using the discounted cash
flow method by discounting estimated future cash flows by
a weighted-average cost of capital. Estimated cash flows are
consistent with the internal mid-term planning data for the next
three years, followed by two additional years of cash flow pro-
jections, which are extrapolated until the end of an asset’s useful
life using a growth rate based on industry and internal projec-
tions. The discount rate reflects the specific risks inherent in the
activities.
Presentation of Financial Instruments
The following table shows the carrying amounts of the financial
assets and financial liabilities that are measured at fair value,
classified by measurement source:
Derivative financial instruments are covered by market netting
agreements. Master netting agreements based on those devel-
oped by the International Swaps and Derivatives Association
(ISDA), and supplemented by appropriate schedules, are in place
with banks. Commodity transactions are generally governed by
master agreements developed by the European Federation of
Energy Traders (EFET). The aforementioned netting agreements
are taken into account when determining the fair values of the
financial instruments. Portfolio-based credit risks are also used
in the calculations.
The fair values of individual assets are determined using published
exchange or market prices at the time of acquisition in the case
of marketable securities, fixed-term deposits and equity invest-
ments, and are adjusted to current market prices as of the
reporting dates. If exchange or market prices are unavailable for
consideration, fair values are determined using the most reliable
Carrying Amounts of Financial Instruments as of September 30, 2017
€ in millions
Carrying
amounts
within the
scope of
IFRS 7
Determined
using market
prices
(Level 1)
Derived from
active mar-
ket prices
(Level 2)
Determined
using
valuation
techniques
(Level 3)
Assets
Equity investments 793 39 210 544
Derivatives 1,728 45 1,545 138
Securities and fixed-term deposits 4,547 4,116 431 –
Liabilities
Derivatives 2,455 39 2,386 30
Carrying Amounts of Financial Instruments as of December 31, 2016
€ in millions
Carrying
amounts
within the
scope of
IFRS 7
Determined
using market
prices
(Level 1)
Derived from
active mar-
ket prices
(Level 2)
Determined
using
valuation
techniques
(Level 3)
Assets
Equity investments 821 66 206 549
Derivatives 2,518 29 2,284 205
Securities and fixed-term deposits 6,474 6,091 383 –
Liabilities
Derivatives 2,867 43 2,724 100
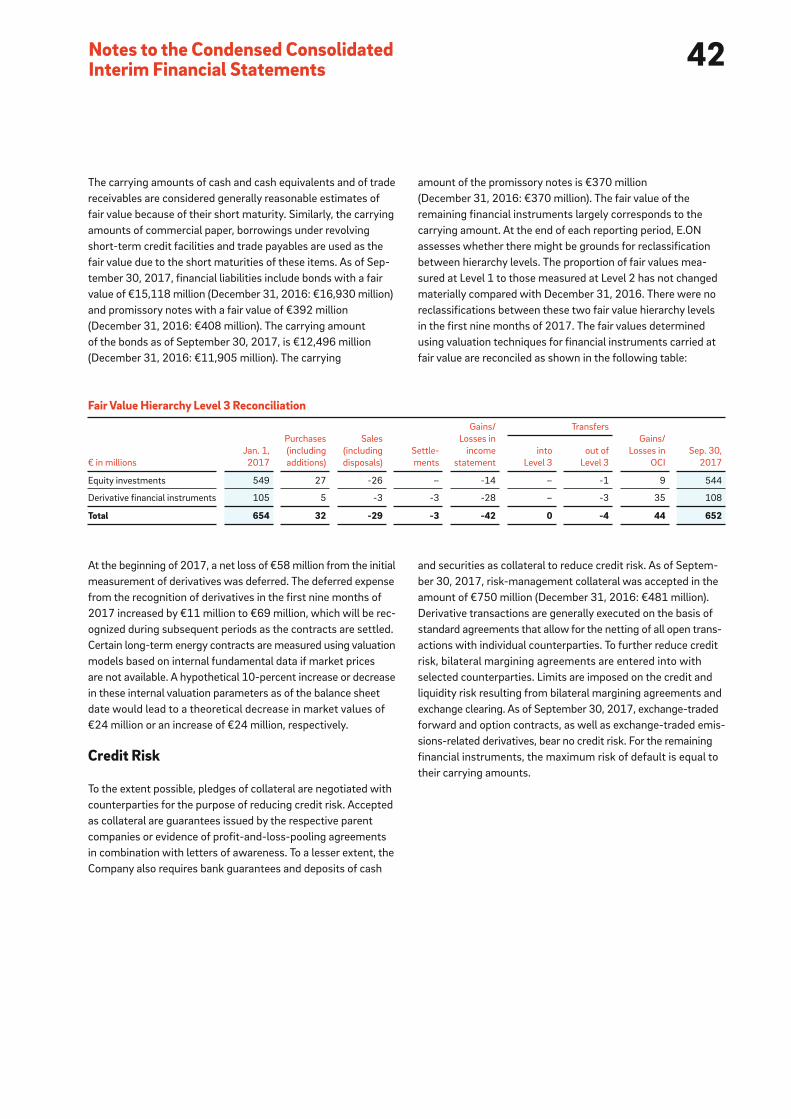
42Notes to the Condensed Consolidated Interim Financial Statements
The carrying amounts of cash and cash equivalents and of trade
receivables are considered generally reasonable estimates of
fair value because of their short maturity. Similarly, the carrying
amounts of commercial paper, borrowings under revolving
short- term credit facilities and trade payables are used as the
fair value due to the short maturities of these items. As of Sep-
tember 30, 2017, financial liabilities include bonds with a fair
value of €15,118 million (December 31, 2016: €16,930 million)
and promissory notes with a fair value of €392 million
(December 31, 2016: €408 million). The carrying amount
of the bonds as of September 30, 2017, is €12,496 million
(December 31, 2016: €11,905 million). The carrying
amount of the promissory notes is €370 million
(December 31, 2016: €370 million). The fair value of the
remaining financial instruments largely corresponds to the
carrying amount. At the end of each reporting period, E.ON
assesses whether there might be grounds for reclassification
between hierarchy levels. The proportion of fair values mea-
sured at Level 1 to those measured at Level 2 has not changed
materially compared with December 31, 2016. There were no
reclassifications between these two fair value hierarchy levels
in the first nine months of 2017. The fair values determined
using valuation techniques for financial instruments carried at
fair value are reconciled as shown in the following table:
At the beginning of 2017, a net loss of €58 million from the initial
measurement of derivatives was deferred. The deferred expense
from the recognition of derivatives in the first nine months of
2017 increased by €11 million to €69 million, which will be rec-
ognized during subsequent periods as the contracts are settled.
Certain long-term energy contracts are measured using valuation
models based on internal fundamental data if market prices
are not available. A hypothetical 10-percent increase or decrease
in these internal valuation parameters as of the balance sheet
date would lead to a theoretical decrease in market values of
€24 million or an increase of €24 million, respectively.
Credit Risk
To the extent possible, pledges of collateral are negotiated with
counterparties for the purpose of reducing credit risk. Accepted
as collateral are guarantees issued by the respective parent
companies or evidence of profit-and-loss-pooling agreements
in combination with letters of awareness. To a lesser extent, the
Company also requires bank guarantees and deposits of cash
Fair Value Hierarchy Level 3 Reconciliation
€ in millions
Jan. 1,
2017
Purchases
(including
additions)
Sales
(including
disposals)
Settle-
ments
Gains/
Losses in
income
statement
Transfers
Gains/
Losses in
OCI
Sep. 30,
2017
into
Level 3
out of
Level 3
Equity investments 549 27 -26 – -14 – -1 9 544
Derivative financial instruments 105 5 -3 -3 -28 – -3 35 108
Total 654 32 -29 -3 -42 0 -4 44 652
and securities as collateral to reduce credit risk. As of Septem-
ber 30, 2017, risk-management collateral was accepted in the
amount of €750 million (December 31, 2016: €481 million).
Derivative transactions are generally executed on the basis of
standard agreements that allow for the netting of all open trans-
actions with individual counterparties. To further reduce credit
risk, bilateral margining agreements are entered into with
selected counterparties. Limits are imposed on the credit and
liquidity risk resulting from bilateral margining agreements and
exchange clearing. As of September 30, 2017, exchange-traded
forward and option contracts, as well as exchange-traded emis-
sions-related derivatives, bear no credit risk. For the remaining
financial instruments, the maximum risk of default is equal to
their carrying amounts.
43Interim Report III/2017
(14) Related-Party Transactions
E.ON exchanges goods and services with a large number of
companies as part of its continuing operations. Related parties
include, in particular, the companies of the Uniper Group, which
were included in the consolidated financial statements using the
equity method until reclassification at the end of September 2017.
As of September 30, 2017, receivables totaling €491 million
(December 31, 2016: €1,136 million), provisions in the amount
of €77 million (December 31, 2016: €55 million) and liabilities
of €389 million (December 31, 2016: €908 million) to companies
of the Uniper Group consist primarily of electricity and gas
transactions and the measurement of commodity derivatives.
In the first nine months of 2017, income from such transac-
tions with Uniper companies amounted to €1,890 million and
expenses of €4,841 million. In the previous year, income and
expenses from relationships with the fully consolidated Uniper
companies were consolidated.
(15) Segment Reporting
In line with its business realignment, the E.ON Group, led by
its Group Management in Essen, Germany, now comprises the
seven new reporting segments described below, as well as a
segment for its Non-Core Business and Corporate Functions/
Other, all of which are reported here in accordance with IFRS 8.
The combined segments, which are not separately reportable,
in the Energy Networks East-Central Europe/Turkey unit and the
Customer Solutions Other unit are of subordinate importance
and have similar economic characteristics with respect to cus-
tomer structure, products and distribution channels. Information
regarding Uniper SE is provided in Note 5.
Energy Networks
GermanyThis segment combines the electricity and gas distribution
networks and all related activities in Germany.
SwedenThis segment comprises the electricity and gas networks
businesses in Sweden.
East-Central Europe/TurkeyThis segment combines the distribution network activities in
the Czech Republic, Hungary, Romania, Slovakia and Turkey.
Customer Solutions
GermanyThis segment consists of activities that supply our customers in
Germany with electricity, gas and heating and the distribution
of specific products and services in areas for improving energy
efficiency and energy independence.
United KingdomThe segment comprises sales activities and customer solutions
in the U.K.
OtherThis segment combines the corresponding Customer Solutions
in Sweden, Italy, the Czech Republic, Hungary and Romania, as
well as E.ON Connecting Energies.
Renewables
The Renewables segment combines the Group’s activities for
the production of wind power plants (onshore and offshore) as
well as solar farms.
Non-Core Business
Held in the Non-Core Business segment are the non-strategic
activities of the E.ON Group. This includes the operation of
the German nuclear power plants, which are managed by the
PreussenElektra operating unit.
Corporate Functions/Other
Corporate Functions/Other contains E.ON SE itself, the equity
investments held directly within E.ON SE and, for part of 2016,
some remaining contributions from the E&P activities in the
North Sea. Since December 31, 2016, the Uniper Group, which
is accounted for in the consolidated financial statements using
the equity method, is also allocated here. The earnings of Uniper
are reported under non-operating earnings.
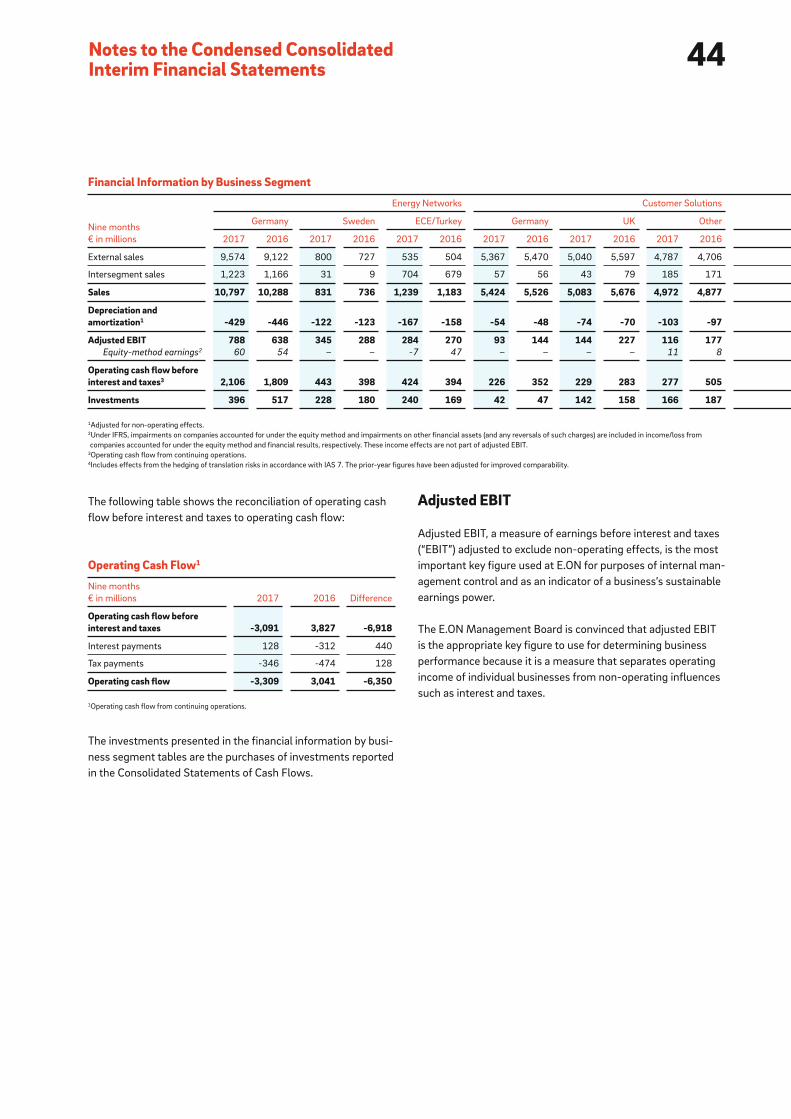
44Notes to the Condensed Consolidated Interim Financial Statements
Adjusted EBIT
Adjusted EBIT, a measure of earnings before interest and taxes
(“EBIT”) adjusted to exclude non-operating effects, is the most
important key figure used at E.ON for purposes of internal man-
agement control and as an indicator of a business’s sustainable
earnings power.
The E.ON Management Board is convinced that adjusted EBIT
is the appropriate key figure to use for determining business
performance because it is a measure that separates operating
income of individual businesses from non-operating influences
such as interest and taxes.
The following table shows the reconciliation of operating cash
flow before interest and taxes to operating cash flow:
The investments presented in the financial information by busi-
ness segment tables are the purchases of investments reported
in the Consolidated Statements of Cash Flows.
Operating Cash Flow 1
Nine months
€ in millions 2017 2016 Difference
Operating cash flow before interest and taxes -3,091 3,827 -6,918
Interest payments 128 -312 440
Tax payments -346 -474 128
Operating cash flow -3,309 3,041 -6,350
1Operating cash flow from continuing operations.
Financial Information by Business Segment
Nine months
€ in millions
Energy Networks Customer Solutions
Germany Sweden ECE/Turkey Germany UK Other
2017 2016 2017 2016 2017 2016 2017 2016 2017 2016 2017 2016
External sales 9,574 9,122 800 727 535 504 5,367 5,470 5,040 5,597 4,787 4,706
Intersegment sales 1,223 1,166 31 9 704 679 57 56 43 79 185 171
Sales 10,797 10,288 831 736 1,239 1,183 5,424 5,526 5,083 5,676 4,972 4,877
Depreciation and amortization 1 -429 -446 -122 -123 -167 -158 -54 -48 -74 -70 -103 -97
Adjusted EBIT 788 638 345 288 284 270 93 144 144 227 116 177 Equity-method earnings 2 60 54 – – -7 47 – – – – 11 8
Operating cash flow before interest and taxes 3 2,106 1,809 443 398 424 394 226 352 229 283 277 505
Investments 396 517 228 180 240 169 42 47 142 158 166 187
1Adjusted for non-operating effects.2Under IFRS, impairments on companies accounted for under the equity method and impairments on other financial assets (and any reversals of such charges) are included in income/loss from
companies accounted for under the equity method and financial results, respectively. These income effects are not part of adjusted EBIT.3Operating cash flow from continuing operations.4Includes effects from the hedging of translation risks in accordance with IAS 7. The prior-year figures have been adjusted for improved comparability.
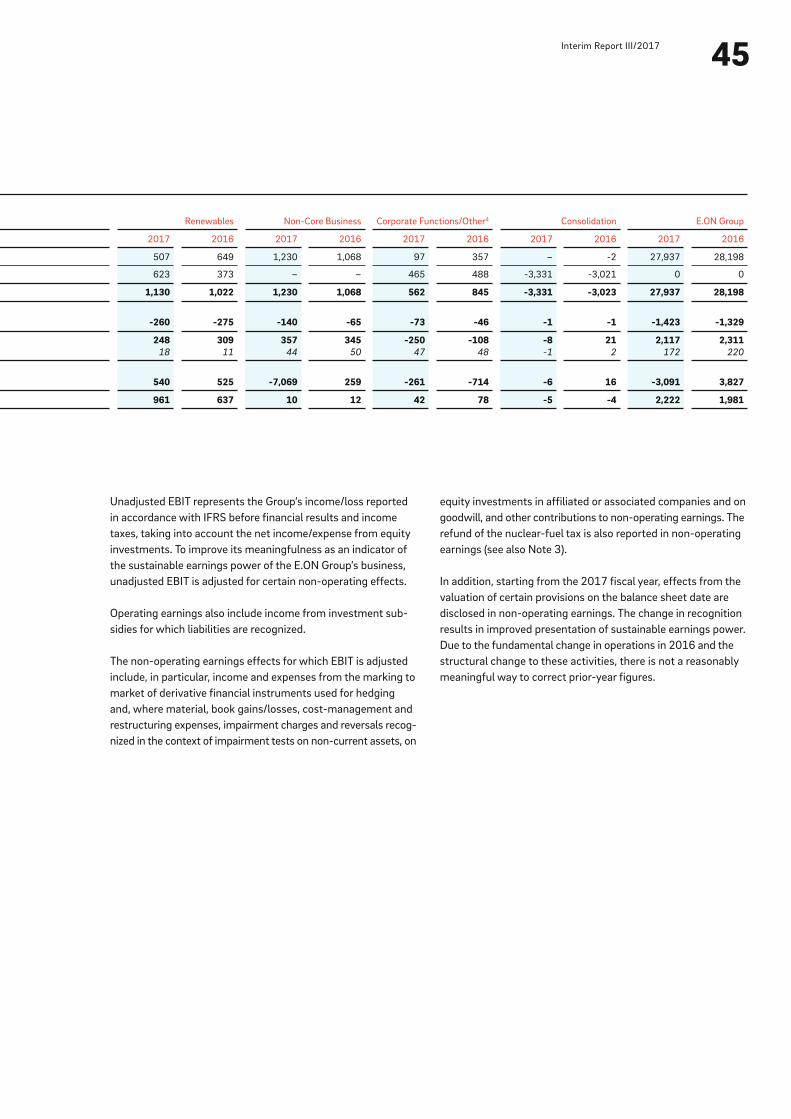
45Interim Report III/2017
Renewables Non-Core Business Corporate Functions/Other 4 Consolidation E.ON Group
2017 2016 2017 2016 2017 2016 2017 2016 2017 2016
507 649 1,230 1,068 97 357 – -2 27,937 28,198
623 373 – – 465 488 -3,331 -3,021 0 0
1,130 1,022 1,230 1,068 562 845 -3,331 -3,023 27,937 28,198
-260 -275 -140 -65 -73 -46 -1 -1 -1,423 -1,329
248 309 357 345 -250 -108 -8 21 2,117 2,311 18 11 44 50 47 48 -1 2 172 220
540 525 -7,069 259 -261 -714 -6 16 -3,091 3,827
961 637 10 12 42 78 -5 -4 2,222 1,981
Unadjusted EBIT represents the Group’s income/loss reported
in accordance with IFRS before financial results and income
taxes, taking into account the net income/expense from equity
investments. To improve its meaningfulness as an indicator of
the sustainable earnings power of the E.ON Group’s business,
unadjusted EBIT is adjusted for certain non-operating effects.
Operating earnings also include income from investment sub-
sidies for which liabilities are recognized.
The non-operating earnings effects for which EBIT is adjusted
include, in particular, income and expenses from the marking to
market of derivative financial instruments used for hedging
and, where material, book gains/losses, cost-management and
restructuring expenses, impairment charges and reversals recog-
nized in the context of impairment tests on non-current assets, on
equity investments in affiliated or associated companies and on
goodwill, and other contributions to non-operating earnings. The
refund of the nuclear-fuel tax is also reported in non-operating
earnings (see also Note 3).
In addition, starting from the 2017 fiscal year, effects from the
valuation of certain provisions on the balance sheet date are
disclosed in non-operating earnings. The change in recognition
results in improved presentation of sustainable earnings power.
Due to the fundamental change in operations in 2016 and the
structural change to these activities, there is not a reasonably
meaningful way to correct prior-year figures.
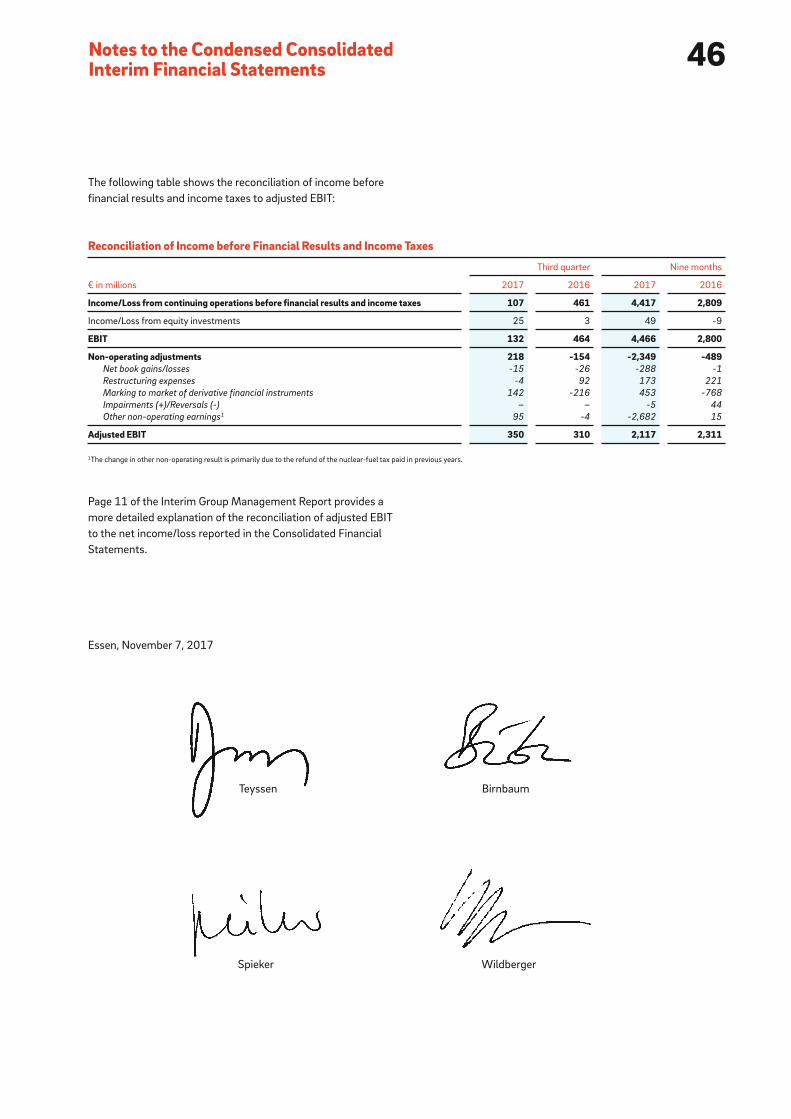
46Notes to the Condensed Consolidated Interim Financial Statements
Page 11 of the Interim Group Management Report provides a
more detailed explanation of the reconciliation of adjusted EBIT
to the net income/loss reported in the Consolidated Financial
Statements.
Essen, November 7, 2017
The following table shows the reconciliation of income before
financial results and income taxes to adjusted EBIT:
1The change in other non-operating result is primarily due to the refund of the nuclear-fuel tax paid in previous years.
Reconciliation of Income before Financial Results and Income Taxes
€ in millions
Third quarter Nine months
2017 2016 2017 2016
Income/Loss from continuing operations before financial results and income taxes 107 461 4,417 2,809
Income/Loss from equity investments 25 3 49 -9
EBIT 132 464 4,466 2,800
Non-operating adjustments 218 -154 -2,349 -489Net book gains/losses -15 -26 -288 -1
Restructuring expenses -4 92 173 221
Marking to market of derivative financial instruments 142 -216 453 -768
Impairments (+)/Reversals (-) – – -5 44
Other non-operating earnings 1 95 -4 -2,682 15
Adjusted EBIT 350 310 2,117 2,311
Teyssen
Wildberger
Birnbaum
Spieker

47Interim Report III/2017
Further information E.ON SE
Brüsseler Platz 1
45131 Essen
Germany
T +49 (0)201-184-00
eon.com
Journalists
T +49 (0)201-184-4236
Analysts and shareholders
T +49 (0)201-184-2806
Bond investors
T +49 (0)201-184-6526
Only the German version of this Interim Report is legally binding.
This Interim Report may contain forward-looking statements based on current assumptions and forecasts made by E.ON Group
Management and other information currently available to E.ON. Various known and unknown risks, uncertainties, and other factors
could lead to material differences between the actual future results, financial situation, development, or performance of the company
and the estimates given here. E.ON SE does not intend, and does not assume any liability whatsoever, to update these forward-looking
statements or to conform them to future events or developments.
March 14, 2018 Release of the 2017 Annual Report
May 8, 2018 Interim Report: January – March 2018
May 9, 2018 2018 Annual Shareholders Meeting
August 8, 2018 Interim Report: January – June 2018
November 14, 2018 Interim Report: January – September 2018
Financial Calendar
