interim report jan-sep 2016 - lifco · pdf fileassets hold for divestment 410 26 645-464- ......
TRANSCRIPT
INTERIM REPORT JAN-SEP 201625 OCTOBER 2016
1998 1999 2000 2001 2002 2003 2004 2005 2006 2007 2008 2009 2010 2011 2012 2013 2014 2015 2016
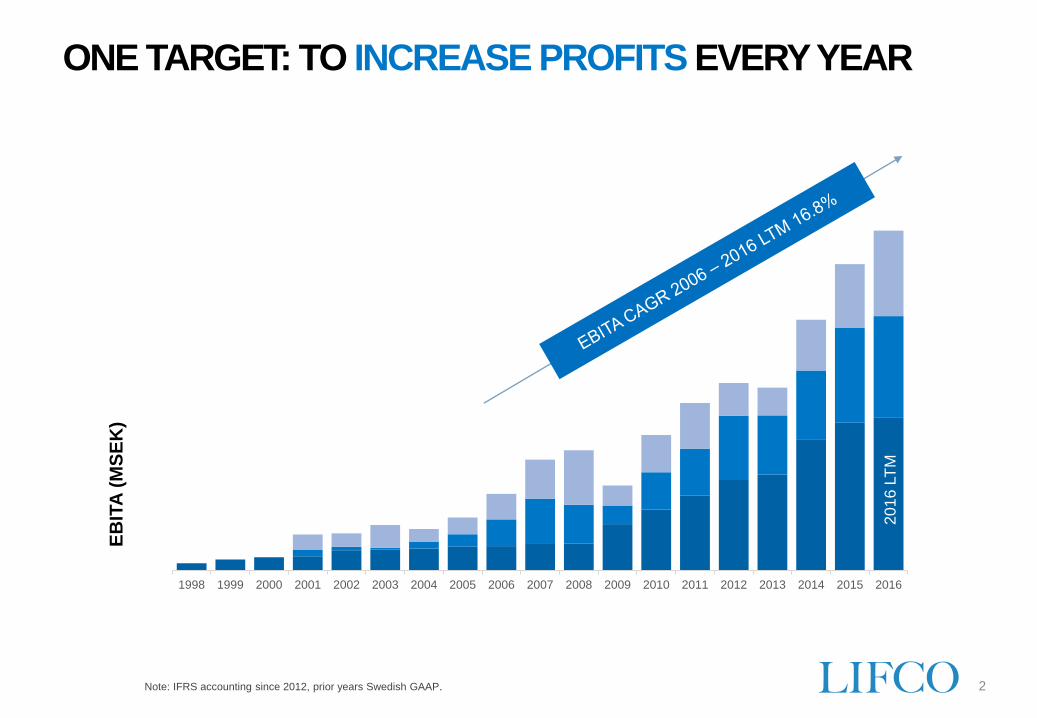
ONE TARGET: TO INCREASE PROFITS EVERY YEAR
2Note: IFRS accounting since 2012, prior years Swedish GAAP.
EB
ITA
(M
SE
K)
2016 L
TM
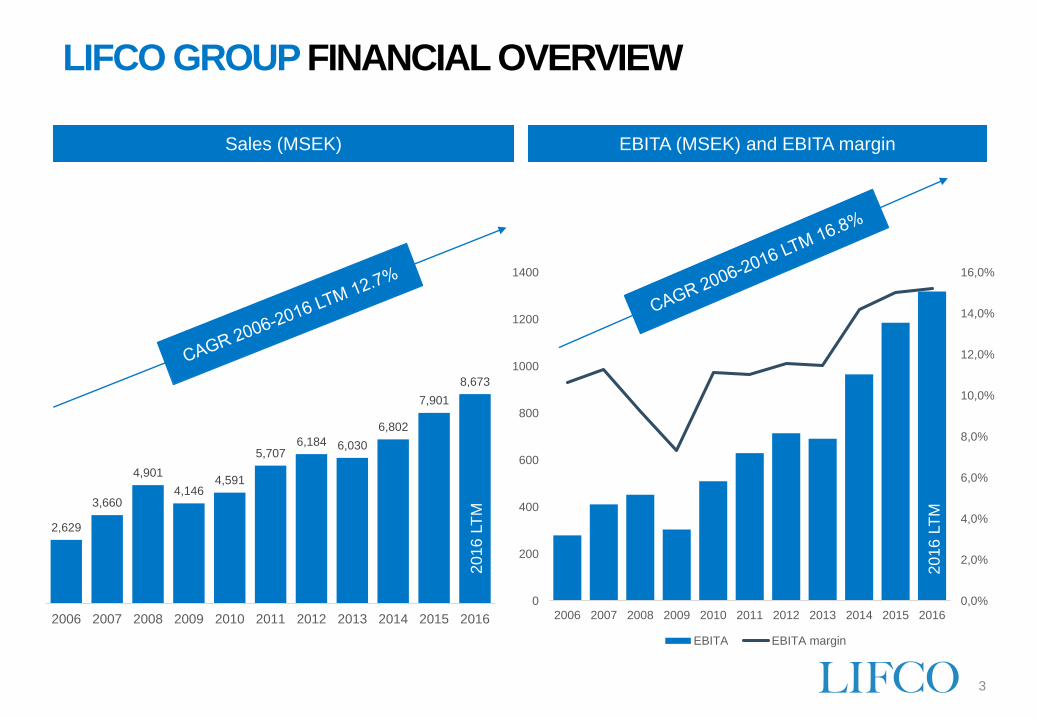
2,629
3,660
4,901
4,1464,591
5,7076,184 6,030
6,802
7,901
8,673
2006 2007 2008 2009 2010 2011 2012 2013 2014 2015 2016
LIFCO GROUP FINANCIAL OVERVIEW
3
Pro
form
a 2
014
Sales (MSEK) EBITA (MSEK) and EBITA margin
2016
LT
M
2016
LT
M
0
200
400
600
800
1000
1200
1400
2006 2007 2008 2009 2010 2011 2012 2013 2014 2015 2016
0,0%
2,0%
4,0%
6,0%
8,0%
10,0%
12,0%
14,0%
16,0%
EBITA EBITA margin
2016
LT
M
0,0%
2,0%
4,0%
6,0%
8,0%
10,0%
12,0%
14,0%
16,0%
18,0%
20,0%
0
100
200
300
400
500
600
700
2006 2007 2008 2009 2010 2011 2012 2013 2014 2015 2016
EBITA EBITA margin
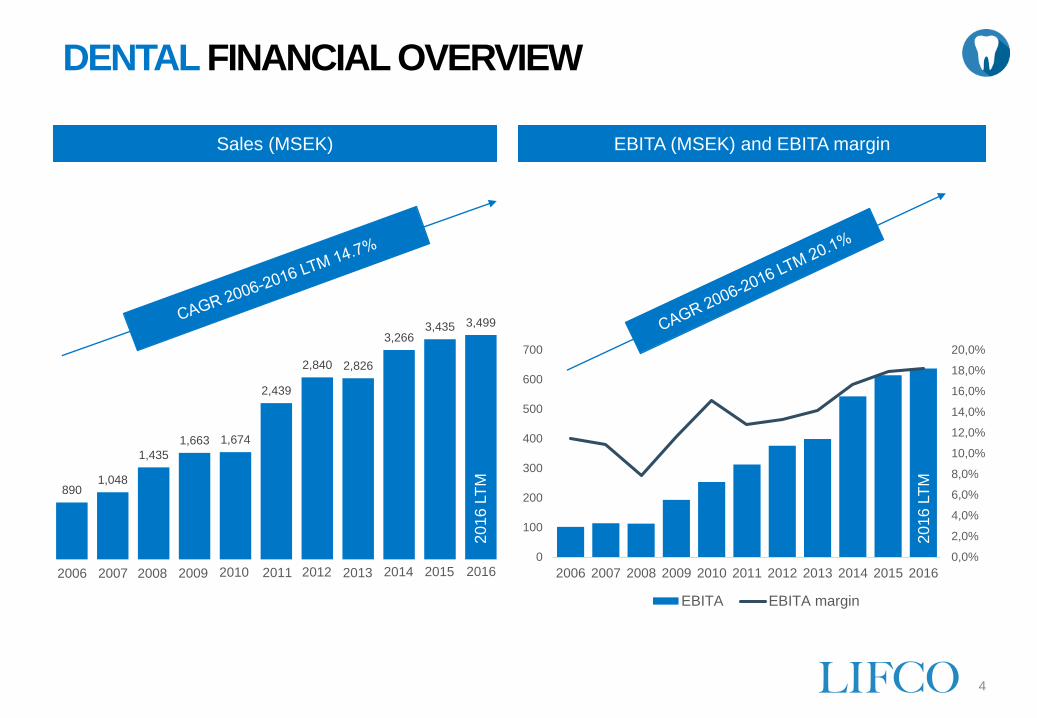
8901,048
1,435
1,663 1,674
2,439
2,840 2,826
3,2663,435 3,499
DENTAL FINANCIAL OVERVIEW
4
Sales (MSEK) EBITA (MSEK) and EBITA margin
2006 2007 2008 2009 2010 2011 2012 2013 2014 2015 2016
2016 L
TM
2016 L
TM
0,0%
5,0%
10,0%
15,0%
20,0%
25,0%
30,0%
35,0%
0
50
100
150
200
250
300
350
400
450
2006 2007 2008 2009 2010 2011 2012 2013 2014 2015 2016
EBITA EBITA margin
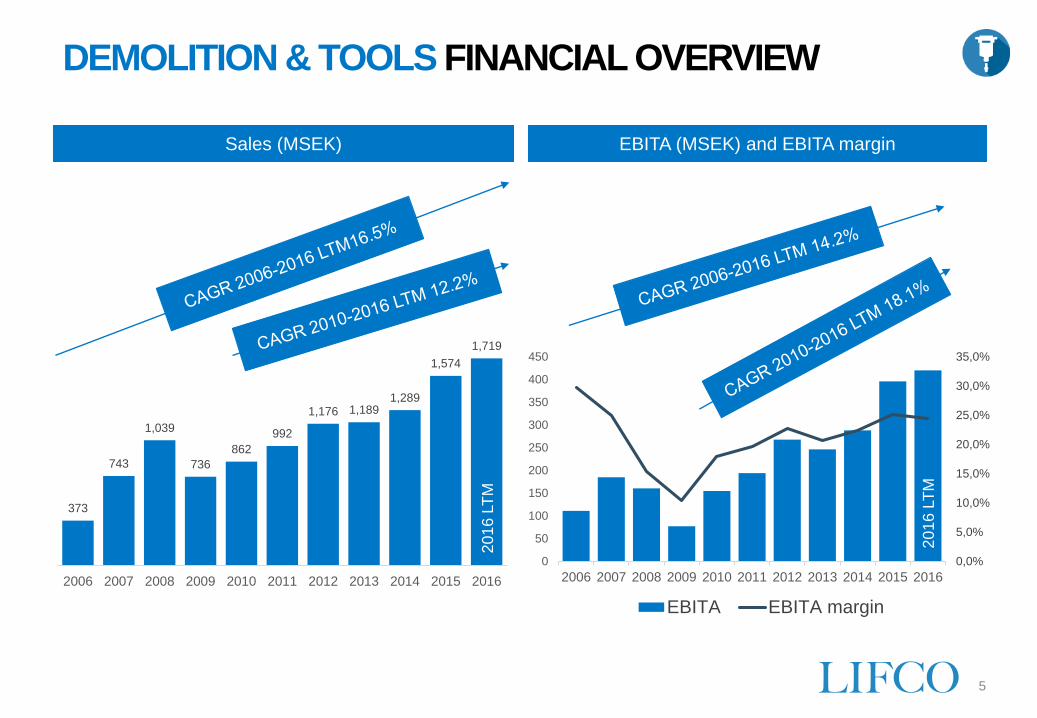
373
743
1,039
736
862
992
1,176 1,1891,289
1,574
1,719
2006 2007 2008 2009 2010 2011 2012 2013 2014 2015 2016
DEMOLITION & TOOLS FINANCIAL OVERVIEW
5
Sales (MSEK) EBITA (MSEK) and EBITA margin
2016 L
TM
2016 L
TM
0,0%
2,0%
4,0%
6,0%
8,0%
10,0%
12,0%
0
50
100
150
200
250
300
350
400
2006 2007 2008 2009 2010 2011 2012 2013 2014 2015 2016
EBITA EBITA margin
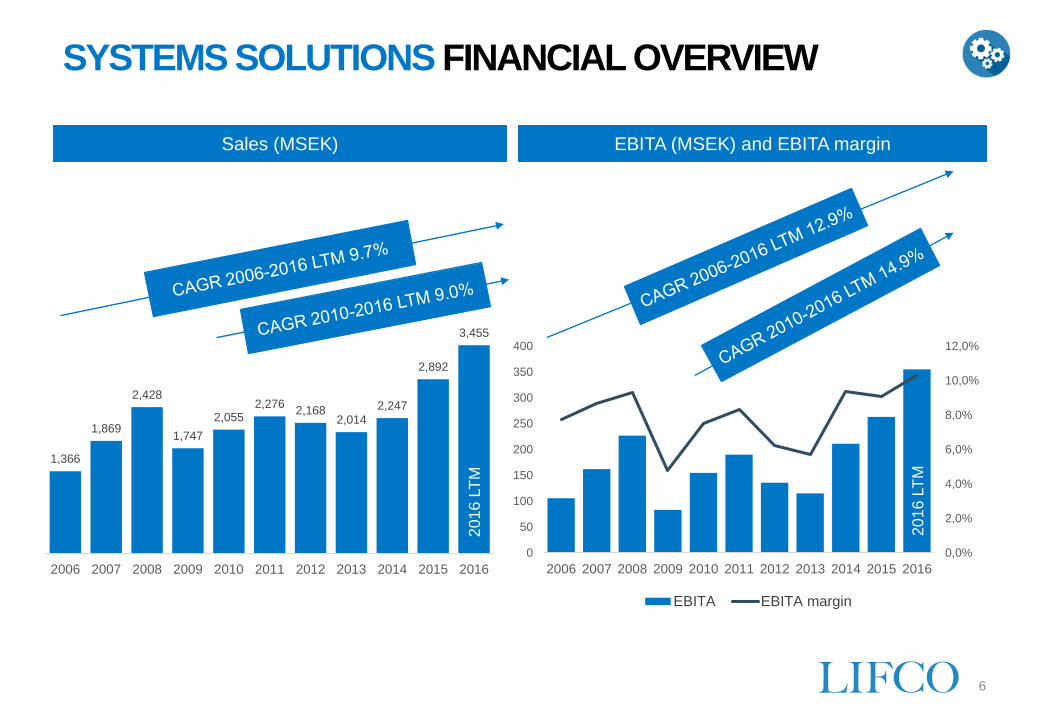
1,366
1,869
2,428
1,747
2,0552,276
2,1682,014
2,247
2,892
3,455
2006 2007 2008 2009 2010 2011 2012 2013 2014 2015 2016
SYSTEMS SOLUTIONS FINANCIAL OVERVIEW
6
Sales (MSEK) EBITA (MSEK) and EBITA margin
2016 L
TM
2016 L
TM
FINANCIALS FY, Q3 AND JAN-SEP 2016
7
GROUP FY
2014
FY
2015 Change
Q3
2016
Q3
2015 Change
Jan-Sep
2016
Jan-Sep
2015 Change
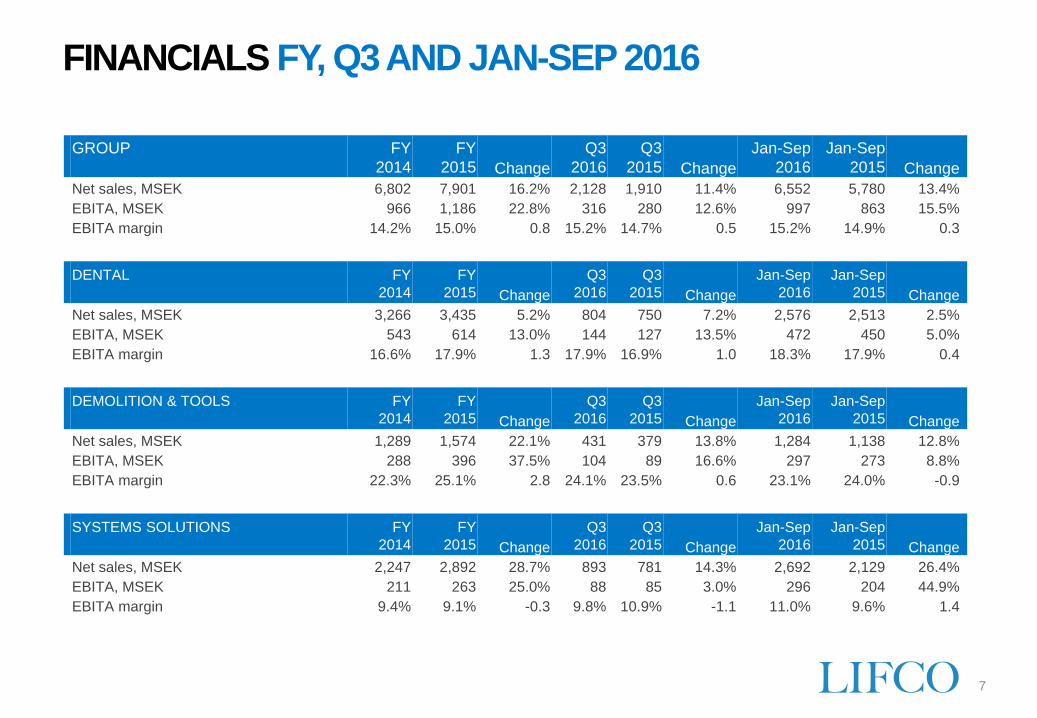
Net sales, MSEK 6,802 7,901 16.2% 2,128 1,910 11.4% 6,552 5,780 13.4%
EBITA, MSEK 966 1,186 22.8% 316 280 12.6% 997 863 15.5%
EBITA margin 14.2% 15.0% 0.8 15.2% 14.7% 0.5 15.2% 14.9% 0.3
DENTAL FY
2014
FY
2015 Change
Q3
2016
Q3
2015 Change
Jan-Sep
2016
Jan-Sep
2015 Change
Net sales, MSEK 3,266 3,435 5.2% 804 750 7.2% 2,576 2,513 2.5%
EBITA, MSEK 543 614 13.0% 144 127 13.5% 472 450 5.0%
EBITA margin 16.6% 17.9% 1.3 17.9% 16.9% 1.0 18.3% 17.9% 0.4
DEMOLITION & TOOLS FY
2014
FY
2015 Change
Q3
2016
Q3
2015 Change
Jan-Sep
2016
Jan-Sep
2015 Change
Net sales, MSEK 1,289 1,574 22.1% 431 379 13.8% 1,284 1,138 12.8%
EBITA, MSEK 288 396 37.5% 104 89 16.6% 297 273 8.8%
EBITA margin 22.3% 25.1% 2.8 24.1% 23.5% 0.6 23.1% 24.0% -0.9
SYSTEMS SOLUTIONS FY
2014
FY
2015 Change
Q3
2016
Q3
2015 Change
Jan-Sep
2016
Jan-Sep
2015 Change
Net sales, MSEK 2,247 2,892 28.7% 893 781 14.3% 2,692 2,129 26.4%
EBITA, MSEK 211 263 25.0% 88 85 3.0% 296 204 44.9%
EBITA margin 9.4% 9.1% -0.3 9.8% 10.9% -1.1 11.0% 9.6% 1.4
LIFCO GROUP BALANCE SHEET
8
Comments
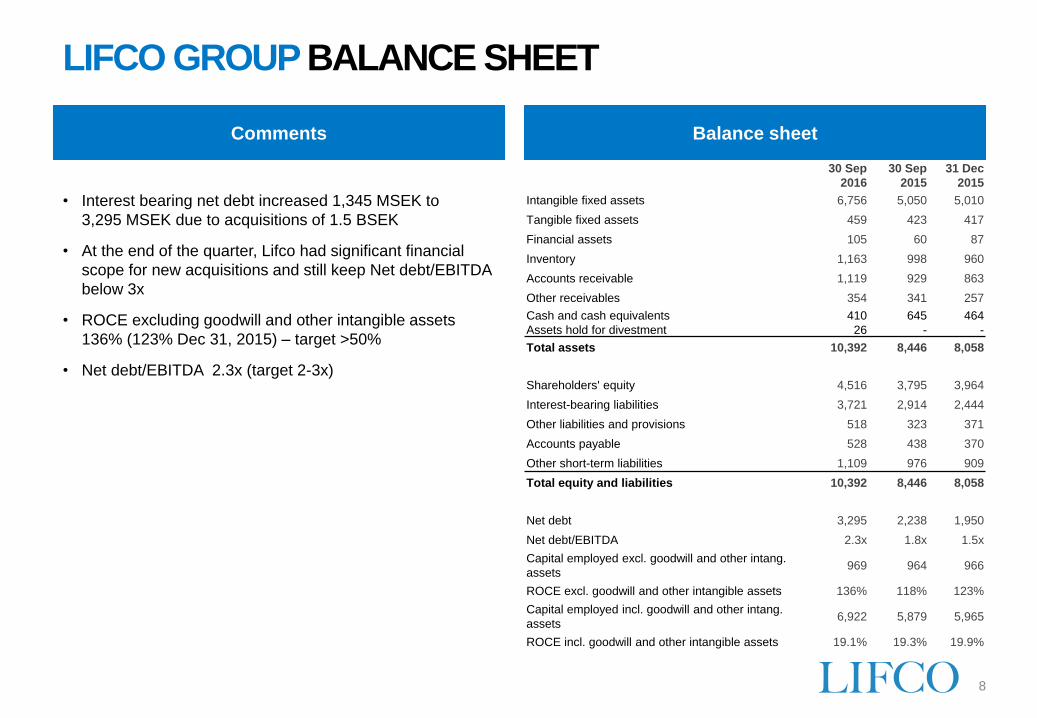
• Interest bearing net debt increased 1,345 MSEK to
3,295 MSEK due to acquisitions of 1.5 BSEK
• At the end of the quarter, Lifco had significant financial
scope for new acquisitions and still keep Net debt/EBITDA
below 3x
• ROCE excluding goodwill and other intangible assets
136% (123% Dec 31, 2015) – target >50%
• Net debt/EBITDA 2.3x (target 2-3x)
MSEK30 Sep
2016
30 Sep
2015
31 Dec
2015
Intangible fixed assets 6,756 5,050 5,010
Tangible fixed assets 459 423 417
Financial assets 105 60 87
Inventory 1,163 998 960
Accounts receivable 1,119 929 863
Other receivables 354 341 257
Cash and cash equivalents
Assets hold for divestment
410
26
645
-
464
-
Total assets 10,392 8,446 8,058
Shareholders' equity 4,516 3,795 3,964
Interest-bearing liabilities 3,721 2,914 2,444
Other liabilities and provisions 518 323 371
Accounts payable 528 438 370
Other short-term liabilities 1,109 976 909
Total equity and liabilities 10,392 8,446 8,058
Net debt 3,295 2,238 1,950
Net debt/EBITDA 2.3x 1.8x 1.5x
Capital employed excl. goodwill and other intang.
assets969 964 966
ROCE excl. goodwill and other intangible assets 136% 118% 123%
Capital employed incl. goodwill and other intang.
assets6,922 5,879 5,965
ROCE incl. goodwill and other intangible assets 19.1% 19.3% 19.9%
Balance sheet
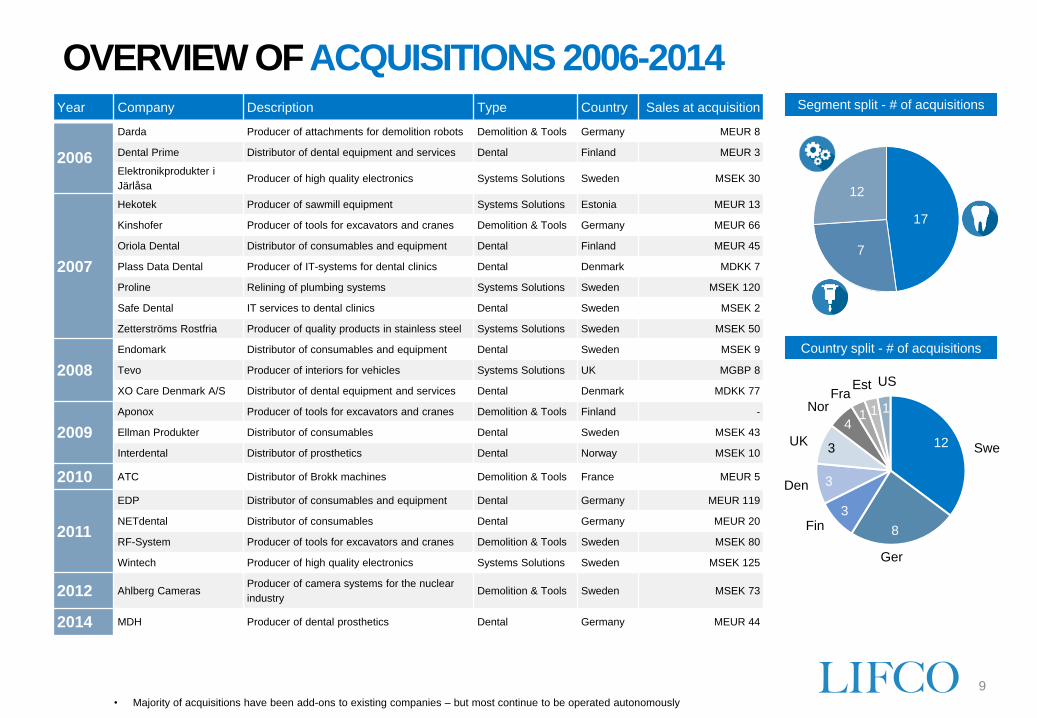
OVERVIEW OF ACQUISITIONS 2006-2014
9
Year Company Description Type Country Sales at acquisition
2006
Darda Producer of attachments for demolition robots Demolition & Tools Germany MEUR 8
Dental Prime Distributor of dental equipment and services Dental Finland MEUR 3
Elektronikprodukter i
JärlåsaProducer of high quality electronics Systems Solutions Sweden MSEK 30
2007
Hekotek Producer of sawmill equipment Systems Solutions Estonia MEUR 13
Kinshofer Producer of tools for excavators and cranes Demolition & Tools Germany MEUR 66
Oriola Dental Distributor of consumables and equipment Dental Finland MEUR 45
Plass Data Dental Producer of IT-systems for dental clinics Dental Denmark MDKK 7
Proline Relining of plumbing systems Systems Solutions Sweden MSEK 120
Safe Dental IT services to dental clinics Dental Sweden MSEK 2
Zetterströms Rostfria Producer of quality products in stainless steel Systems Solutions Sweden MSEK 50
2008
Endomark Distributor of consumables and equipment Dental Sweden MSEK 9
Tevo Producer of interiors for vehicles Systems Solutions UK MGBP 8
XO Care Denmark A/S Distributor of dental equipment and services Dental Denmark MDKK 77
2009
Aponox Producer of tools for excavators and cranes Demolition & Tools Finland -
Ellman Produkter Distributor of consumables Dental Sweden MSEK 43
Interdental Distributor of prosthetics Dental Norway MSEK 10
2010 ATC Distributor of Brokk machines Demolition & Tools France MEUR 5
2011
EDP Distributor of consumables and equipment Dental Germany MEUR 119
NETdental Distributor of consumables Dental Germany MEUR 20
RF-System Producer of tools for excavators and cranes Demolition & Tools Sweden MSEK 80
Wintech Producer of high quality electronics Systems Solutions Sweden MSEK 125
2012 Ahlberg CamerasProducer of camera systems for the nuclear
industryDemolition & Tools Sweden MSEK 73
2014 MDH Producer of dental prosthetics Dental Germany MEUR 44
• Majority of acquisitions have been add-ons to existing companies – but most continue to be operated autonomously
Segment split - # of acquisitions
17
7
12
12
8
3
3
14
3 Swe
Ger
Fin
Den
EstFra
Nor
UK
1
Country split - # of acquisitions
1
US
10
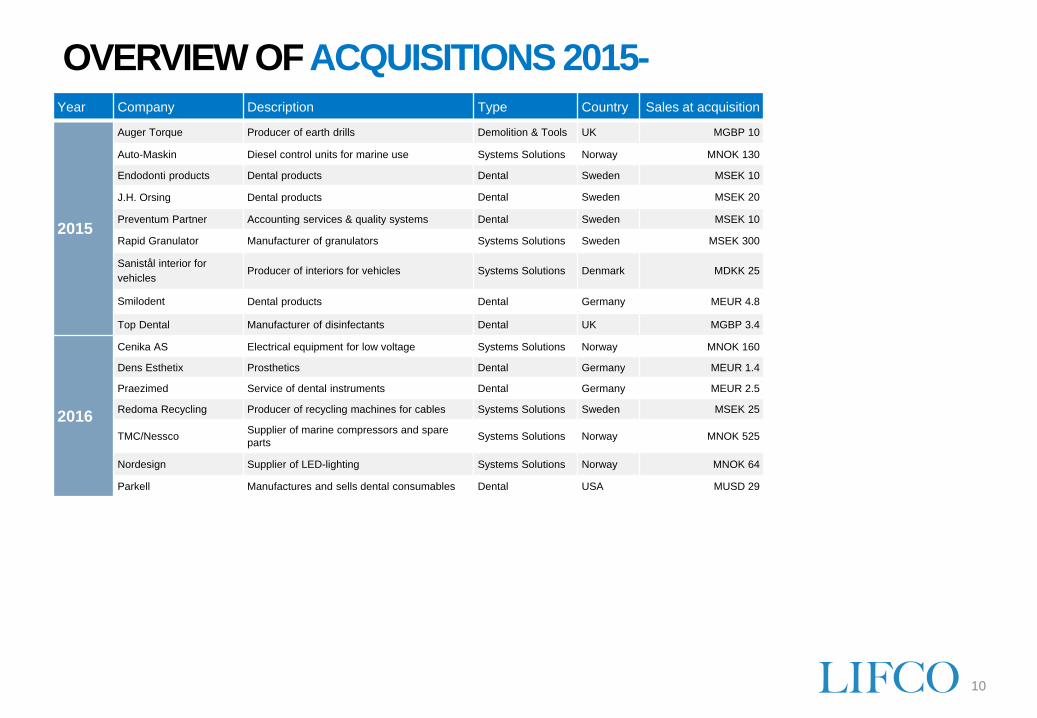
Year Company Description Type Country Sales at acquisition
2015
Auger Torque Producer of earth drills Demolition & Tools UK MGBP 10
Auto-Maskin Diesel control units for marine use Systems Solutions Norway MNOK 130
Endodonti products Dental products Dental Sweden MSEK 10
J.H. Orsing Dental products Dental Sweden MSEK 20
Preventum Partner Accounting services & quality systems Dental Sweden MSEK 10
Rapid Granulator Manufacturer of granulators Systems Solutions Sweden MSEK 300
Sanistål interior for
vehiclesProducer of interiors for vehicles Systems Solutions Denmark MDKK 25
Smilodent Dental products Dental Germany MEUR 4.8
Top Dental Manufacturer of disinfectants Dental UK MGBP 3.4
2016
Cenika AS Electrical equipment for low voltage Systems Solutions Norway MNOK 160
Dens Esthetix Prosthetics Dental Germany MEUR 1.4
Praezimed Service of dental instruments Dental Germany MEUR 2.5
Redoma Recycling Producer of recycling machines for cables Systems Solutions Sweden MSEK 25
TMC/NesscoSupplier of marine compressors and spare
partsSystems Solutions Norway MNOK 525
Nordesign Supplier of LED-lighting Systems Solutions Norway MNOK 64
Parkell Manufactures and sells dental consumables Dental USA MUSD 29
OVERVIEW OF ACQUISITIONS 2015-
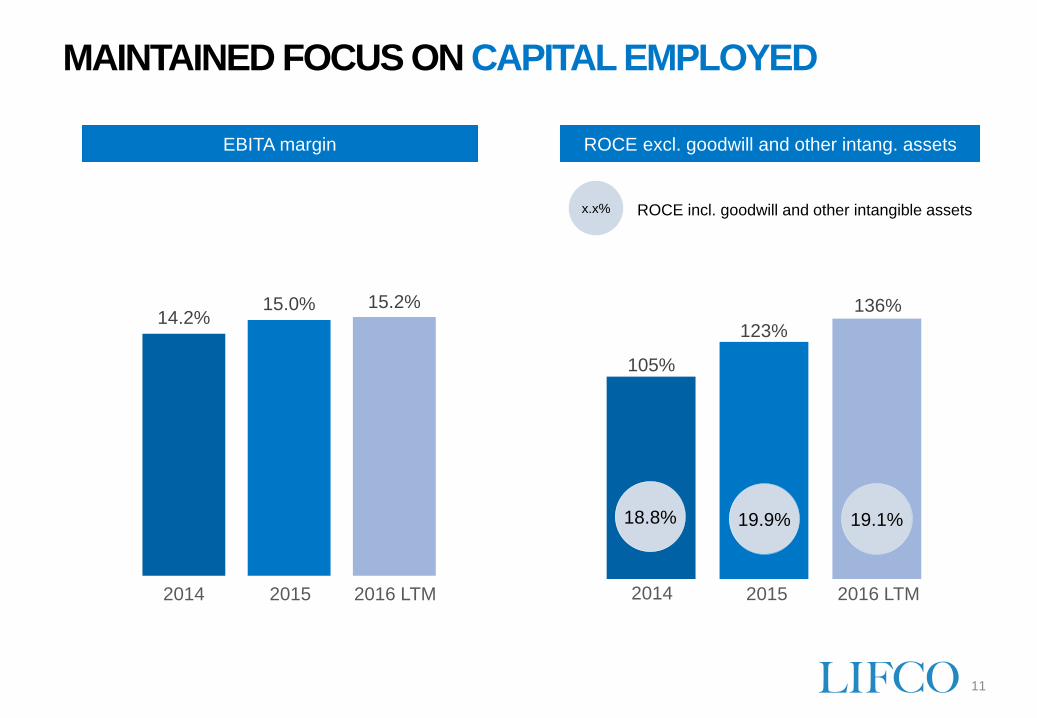
ROCE incl. goodwill and other intangible assets
MAINTAINED FOCUS ON CAPITAL EMPLOYED
11
EBITA margin
x.x%
ROCE excl. goodwill and other intang. assets
2014 2015 2016 LTM 2014 2015 2016 LTM
18.8% 19.9% 19.1%
105%
123%
136%14.2%
15.0% 15.2%

STRONG CASH FLOW GENERATION
12
Core net working capital1
1) Refers to investments in and depreciation of tangible fixed assets
2) Operating pre-tax cash flow defined as EBITDA – change in NWC (according to cash flow statement) – investments in tangible fixed assets
3) Cash flow conversion defined as operating pre-tax cash flow divided by EBITA
Capex and depreciation2 Operating pre-tax cash flow
75
95
74 65 60
50
1.2% 1.6%1.1%
1.1% 1.0%0.8%
2012 2013 LTM Sep 2014
Capex (SEKm) Depreciation (SEKm)
Capex as % of sales Depreciation as % of sales
75
95
74 65 60
50
1.2% 1.6%1.1%
1.1% 1.0%0.8%
2012 2013 LTM Sep 2014
Capex (SEKm) Depreciation (SEKm)
Capex as % of sales Depreciation as % of sales
1,101 1,116
1,212
65%62%
75%
2012 2013 LTM Sep 2014
NWC (SEKm) NWC as % of sales
710 679
907
99.3% 98.1% 100.3%
2012 2013 LTM Sep 2014
Oper. pre-tax cash flow (SEKm) Cash flow conversion (%)
710 679
907
99.3% 98.1% 100.3%
2012 2013 LTM Sep 2014
Oper. pre-tax cash flow (SEKm) Cash flow conversion (%)
• Focus on working capital through
mathematical depreciation of inventory and
receivables
• Low required maintenance capex within the
group
• Due to outsourcing of a large share of basic
manufacturing, investments in subsidiaries
with own production can be minimised
• High cash conversion as a result of focus on
asset light operations combined with tight
control of working capital
3
4
0%
20%
40%
60%
80%
100%
120%
0
200
400
600
800
1000
1200
2013 2014 20150,00%
2,00%
4,00%
6,00%
8,00%
10,00%
12,00%
14,00%
16,00%
18,00%
20,00%
0
200
400
600
800
1000
1200
1400
1600
2013 2014 2015
95
105 102
60 67
81
1.6%1.5%
1.3%
1.0% 1.0%
2013 2014 2015
1.0%
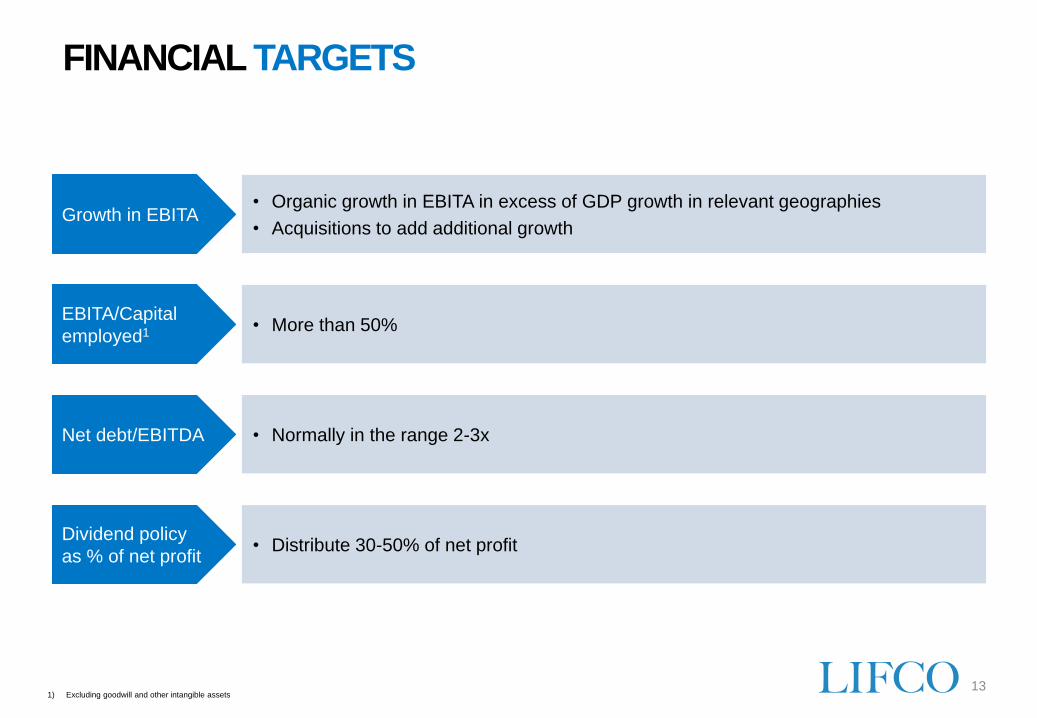
FINANCIAL TARGETS
13
• Distribute 30-50% of net profitDividend policy
as % of net profit
• More than 50%EBITA/Capital
employed1
• Organic growth in EBITA in excess of GDP growth in relevant geographies
• Acquisitions to add additional growthGrowth in EBITA
• Normally in the range 2-3xNet debt/EBITDA
1) Excluding goodwill and other intangible assets
GROWTH OR PROFIT? PROFIT GROWTH!
14
15
DISCLAIMER
Important information
This material (the “Material”) has been prepared by Lifco AB (publ) (“Lifco”) in good faith and for information purposes only. Unless otherwise stated, Lifco
is the source of all data contained in the Material. All data contained herein is provided as of the date of this Material and is subject to change without notice.
This Material does not constitute or form part of, and should not be construed as, an offer or invitation for the sale or subscription of, or a solicitation of any
offer to buy, any securities of Lifco, nor shall it or any part of it or the fact of its distribution form the basis of, or be relied on in connection with, any
investment decision relating thereto, nor does it constitute a recommendation regarding the securities of Lifco.
This Material has not been examined, approved or registered by any regulatory authority. This Material does not constitute a prospectus for purposes of the
Prospectus Directive (2003/71/EC), as amended, in whole or in part.
The transmission or distribution of this Material in certain jurisdictions may be restricted by law and persons into whose possession this Material comes
should inform themselves of and observe any such restrictions.
This Material contains certain forward-looking statements and opinions. Forward-looking statements are based on current estimates and assumptions made
according to the best of Lifco’s knowledge. Such forward-looking statements are subject to risks, uncertainties, and other factors that could cause the actual
results, including Lifco’s cash flow, financial position and earnings, to differ materially from the results, or fail to meet expectations expressly or implicitly
assumed or described in those statements or to turn out to be less favorable than the results expressly or implicitly assumed or described in those statements. In
light of the risks, uncertainties and assumptions associated with forward-looking statements, it is possible that the future events mentioned in this Material may
not occur.
This Material includes industry and market data pertaining to Lifco’s business and markets. If not otherwise stated, such information is based on Lifco’s
analysis of multiple sources. Lifco cannot give any assurances as to the accuracy of industry and market data contained in this Material that was extracted or
derived from industry publications or reports. Business and market data are inherently predictive and subject to uncertainty and not necessarily reflective of
actual market conditions.
The information in this Material has not been independently verified. No representation or warranty, express or implied, is made as to, and no reliance should
be placed on, the fairness, accuracy or completeness of the information or opinions contained herein, and no liability whatsoever is accepted as to any errors,
omissions or misstatements contained herein. None of Lifco, or any of its shareholders, or any of their respective subsidiary undertakings or affiliates or any of
such person’s directors, officers or employees, advisers or other representatives, accept any liability whatsoever (whether in negligence or otherwise) arising,
directly or indirectly, from the use of this Material or otherwise arising in connection therewith. By receiving this Material and/or attending a presentation
concerning the contents hereof you acknowledge that you will be solely responsible for your own assessment of Lifco and that you will conduct your own
analysis and be solely responsible for forming your own view of the potential future performance of Lifco.