interim report - handelsbanken.com · ne ans an d ed esu re ne 9 er iaes 7 nt e 10 osettn f fnanal...
TRANSCRIPT

Interim ReportJanuary–June
2017

Handelsbanken’s Interim ReportJANUARY – JUNE 2017
SUMMARY JANUARY – JUNE 2017, COMPARED WITH JANUARY – JUNE 2016
• Operating profit rose by 4% to SEK 10,604m (10,244)
• The period’s profit after tax for total operations decreased by 1% to SEK 8,167m (8,237)
• Earnings per share for total operations decreased to SEK 4.20 (4.31)
• Return on equity for total operations declined to 12.6% (13.7)
• Income increased by 1% to SEK 20,274m (20,165) and by 5% after adjustment for
capital gains in the period of comparison
• Net interest income rose by 6% to SEK 14,402m (13,603)
• Net fee and commission income rose by 9% to SEK 4,862m (4,450)
• The C/I ratio decreased to 45.8% (47.2)
• The loan loss ratio was unchanged at 0.04% (0.04)
• The common equity tier 1 ratio increased to 23.4% (23.0) and the total capital ratio
was 29.0% (28.9)
SUMMARY OF Q2 2017, COMPARED WITH Q1 2017
• Operating profit fell by 2% to SEK 5,257m (5,347), but increased by 3% after adjustments
for non-recurring items in the quarter of comparison
• The period’s profit after tax for total operations decreased by 1% to SEK 4,056m (4,111),
and earnings per share were SEK 2.09 (2.11)
• Return on equity for total operations rose to 12.9% (12.4)
• Income increased by 2% to SEK 10,238m (10,036)
• Net interest income increased by 3% to SEK 7,321m (7,081)
• The loan loss ratio was 0.04% (0.04)
2 Handelsbanken
INTERIM REPORT JANUARY – JUNE 2017

INTERIM REPORT JANUARY – JUNE 2017
2 Handelsbanken
Contents Page
Group – Overview 4
Group performance 5
Group – Business segments 9
Handelsbanken Sweden 10 Handelsbanken UK 12 Handelsbanken Denmark 14 Handelsbanken Finland 16 Handelsbanken Norway 18 Handelsbanken the Netherlands 20 Handelsbanken Capital Markets 22 Other units not reported in the business segments 24 Key figures 25 The Handelsbanken share 25
Condensed set of financial statements – Group 26 Income statement 26 Earnings per share 26 Statement of comprehensive income 27 Quarterly performance 28 Balance sheet 29 Statement of changes in equity 30 Cash flow statement 31
Note 1 Accounting policies 31 Note 2 Net interest income 32 Note 3 Net fee and commission income 32 Note 4 Net gains/losses on financial transactions 33 Note 5 Other expenses 33 Note 6 Loan losses and impaired loans 34 Note 7 Discontinued operations 35 Note 8 Loans and credit exposure 35 Note 9 Derivatives 37 Note 10 Offsetting of financial instruments 38 Note 11 Goodwill and other intangible assets 39 Note 12 Due to credit institutions, deposits and borrowing from the public 39 Note 13 Issued securities 39 Note 14 Pledged assets, contingent liabilities and other commitments 39 Note 15 Classification of financial assets and liabilities 40 Note 16 Fair value measurement of financial instruments 42 Note 17 Assets and liabilities by currency 44 Note 18 Own funds and capital requirements in the consolidated situation 45 Note 19 Risk and liquidity 49 Note 20 Related-party transactions 53 Note 21 Segment reporting 53 Note 22 Events after the balance sheet date 53
Condensed set of financial statements – Parent company 54
Information on phone conference, etc. 61
Auditors’ review report 62
Share price performance and other information 63
For definitions and calculation of key figures, as well as specifications of separate items and non-recurring items, please see the Fact Book which is available at handelsbanken.se/ireng.
3 Handelsbanken
INTERIM REPORT JANUARY – JUNE 2017

INTERIM REPORT JANUARY – JUNE 2017
3 Handelsbanken
Handelsbanken Group – Overview SEK m
Q22017
Q12017 Change
Q2 2016 Change
Jan-Jun2017
Jan-Jun2016 Change
Full year 2016
Summary income statementNet interest income 7,321 7,081 3% 6,808 8% 14,402 13,603 6% 27,943
Net fee and commission income 2,508 2,354 7% 2,280 10% 4,862 4,450 9% 9,156
Net gains/losses on financial transactions 317 547 -42% 523 -39% 864 1,685 -49% 3,066
Risk result - insurance 53 36 47% 35 51% 89 111 -20% 142
Other dividend income 11 2 450% 222 -95% 13 225 -94% 228
Share of profit of associates -3 -27 89% 13 -30 15 25
Other income 31 43 -28% 41 -24% 74 76 -3% 203Total income 10,238 10,036 2% 9,922 3% 20,274 20,165 1% 40,763
Staff costs -3,242 -2,918 11% -2,952 10% -6,160 -6,620 -7% -12,542
Other expenses -1,410 -1,430 -1% -1,346 5% -2,840 -2,649 7% -5,401Depreciation, amortisation and impairment of property, equipment and intangible assets -145 -150 -3% -119 22% -295 -244 21% -495Total expenses -4,797 -4,498 7% -4,417 9% -9,295 -9,513 -2% -18,438
Profit before loan losses 5,441 5,538 -2% 5,505 -1% 10,979 10,652 3% 22,325Net loan losses -186 -196 -5% -229 -19% -382 -416 -8% -1,724Gains/losses on disposal of property, equipment and intangible assets 2 5 -60% 1 100% 7 8 -13% 32
Operating profit 5,257 5,347 -2% 5,277 0% 10,604 10,244 4% 20,633Taxes -1,201 -1,236 -3% -1,091 10% -2,437 -2,020 21% -4,401Profit for the period from continuing operations 4,056 4,111 -1% 4,186 -3% 8,167 8,224 -1% 16,232Profit for the period pertaining to discontinued operations, after tax - - 8 - 13 13Profit for the period 4,056 4,111 -1% 4,194 -3% 8,167 8,237 -1% 16,245
Summary balance sheetLoans to the public 2,011,455 1,991,434 1% 1,937,155 4% 2,011,455 1,937,155 4% 1,963,622 of which mortgage loans 1,182,790 1,163,833 2% 1,117,514 6% 1,182,790 1,117,514 6% 1,150,594
Deposits and borrowing from the public 1,120,291 1,049,699 7% 1,134,500 -1% 1,120,291 1,134,500 -1% 829,336 of which households 429,725 409,694 5% 391,701 10% 429,725 391,701 10% 404,112
Total equity 134,900 131,741 2% 129,582 4% 134,900 129,582 4% 136,381Total assets 2,961,094 2,922,929 1% 3,030,645 -2% 2,961,094 3,030,645 -2% 2,627,580
Summary of key figuresReturn on equity, total operations 12.9% 12.4% 14.2% 12.6% 13.7% 13.1%
Return on equity, continuing operations 12.9% 12.4% 14.2% 12.6% 13.7% 13.1%
C/I ratio, continuing operations 46.9% 44.8% 44.5% 45.8% 47.2% 45.2%
Earnings per share, total operations, SEK 2.09 2.11 2.19 4.20 4.31 8.43 - after dilution 2.06 2.10 2.15 4.16 4.22 8.31
Common equity tier 1 ratio, CRR 23.4% 23.8% 23.0% 23.4% 23.0% 25.1%
Total capital ratio, CRR 29.0% 29.7% 28.9% 29.0% 28.9% 31.4%
4 Handelsbanken
INTERIM REPORT JANUARY – JUNE 2017

INTERIM REPORT JANUARY – JUNE 2017
3 Handelsbanken
Handelsbanken Group – Overview SEK m
Q22017
Q12017 Change
Q2 2016 Change
Jan-Jun2017
Jan-Jun2016 Change
Full year 2016
Summary income statementNet interest income 7,321 7,081 3% 6,808 8% 14,402 13,603 6% 27,943
Net fee and commission income 2,508 2,354 7% 2,280 10% 4,862 4,450 9% 9,156
Net gains/losses on financial transactions 317 547 -42% 523 -39% 864 1,685 -49% 3,066
Risk result - insurance 53 36 47% 35 51% 89 111 -20% 142
Other dividend income 11 2 450% 222 -95% 13 225 -94% 228
Share of profit of associates -3 -27 89% 13 -30 15 25
Other income 31 43 -28% 41 -24% 74 76 -3% 203Total income 10,238 10,036 2% 9,922 3% 20,274 20,165 1% 40,763
Staff costs -3,242 -2,918 11% -2,952 10% -6,160 -6,620 -7% -12,542
Other expenses -1,410 -1,430 -1% -1,346 5% -2,840 -2,649 7% -5,401Depreciation, amortisation and impairment of property, equipment and intangible assets -145 -150 -3% -119 22% -295 -244 21% -495Total expenses -4,797 -4,498 7% -4,417 9% -9,295 -9,513 -2% -18,438
Profit before loan losses 5,441 5,538 -2% 5,505 -1% 10,979 10,652 3% 22,325Net loan losses -186 -196 -5% -229 -19% -382 -416 -8% -1,724Gains/losses on disposal of property, equipment and intangible assets 2 5 -60% 1 100% 7 8 -13% 32
Operating profit 5,257 5,347 -2% 5,277 0% 10,604 10,244 4% 20,633Taxes -1,201 -1,236 -3% -1,091 10% -2,437 -2,020 21% -4,401Profit for the period from continuing operations 4,056 4,111 -1% 4,186 -3% 8,167 8,224 -1% 16,232Profit for the period pertaining to discontinued operations, after tax - - 8 - 13 13Profit for the period 4,056 4,111 -1% 4,194 -3% 8,167 8,237 -1% 16,245
Summary balance sheetLoans to the public 2,011,455 1,991,434 1% 1,937,155 4% 2,011,455 1,937,155 4% 1,963,622 of which mortgage loans 1,182,790 1,163,833 2% 1,117,514 6% 1,182,790 1,117,514 6% 1,150,594
Deposits and borrowing from the public 1,120,291 1,049,699 7% 1,134,500 -1% 1,120,291 1,134,500 -1% 829,336 of which households 429,725 409,694 5% 391,701 10% 429,725 391,701 10% 404,112
Total equity 134,900 131,741 2% 129,582 4% 134,900 129,582 4% 136,381Total assets 2,961,094 2,922,929 1% 3,030,645 -2% 2,961,094 3,030,645 -2% 2,627,580
Summary of key figuresReturn on equity, total operations 12.9% 12.4% 14.2% 12.6% 13.7% 13.1%
Return on equity, continuing operations 12.9% 12.4% 14.2% 12.6% 13.7% 13.1%
C/I ratio, continuing operations 46.9% 44.8% 44.5% 45.8% 47.2% 45.2%
Earnings per share, total operations, SEK 2.09 2.11 2.19 4.20 4.31 8.43 - after dilution 2.06 2.10 2.15 4.16 4.22 8.31
Common equity tier 1 ratio, CRR 23.4% 23.8% 23.0% 23.4% 23.0% 25.1%
Total capital ratio, CRR 29.0% 29.7% 28.9% 29.0% 28.9% 31.4%
INTERIM REPORT JANUARY – JUNE 2017
4 Handelsbanken
Group performance JANUARY – JUNE 2017 COMPARED WITH JANUARY – JUNE 2016 The Group’s operating profit grew by 4% to SEK 10,604m (10,244). The period’s profit after tax for total operations decreased by 1% to SEK 8,167m (8,237), and earnings per share were SEK 4.20 (4.31).
The common equity tier 1 ratio increased to 23.4% (23.0), and the return on equity for total operations decreased to 12.6% (13.7). The C/I ratio decreased to 45.8% (47.2).
Income
Income increased by 1% to SEK 20,274m (20,165). Adjusted for capital gains on the sale of shares in the period of comparison, the increase was 5%. The effect of exchange rate movements was marginal.
Net interest income rose by 6% to SEK 14,402m (13,603).
Starting from 2017, the Bank defines its lending and deposit margins as the customer interest rate minus the internal interest rates which are either debited or credited to branch operations. Greater lending volumes increased net interest income by SEK 573m. At the same time, lending margins in branch operations had a negative impact of SEK -53m. Net interest income from deposit operations increased by SEK 141m.
The benchmark effect in Stadshypotek decreased to SEK -39m (6), and the doubled fee to the Resolution Fund amounted to SEK -865m (-491). Including fees for various deposit guarantees, government fees increased by SEK 389m to SEK -1,043m (-654). The remainder of the improvement in net interest income was chiefly attributable to lower funding costs.
Total average volume of loans to the public grew by 5% to SEK 2,002bn (1,911). Exchange rate effects increased average volumes by SEK 9bn. Household lending increased by 7% to SEK 1,047bn (980), while corporate lending grew by 3% to SEK 955bn (932). In local currencies, lending increased in all home markets.
The average volumes of deposits and borrowing rose by 2% to SEK 1,000bn (985). The average volume of household deposits increased by 12% to SEK 410bn (366), while corporate deposits decreased by 5% to SEK 589bn (619).
Net fee and commission income rose by 9% to SEK 4,862m (4,450), primarily due to higher fund and asset management commissions. Fund management
commissions increased by 24% to SEK 1,744m (1,412), and other custody and asset management commissions grew by 13%. Brokerage income rose by 10% to SEK 507m (462), and net payment commissions decreased by 1% to SEK 908m (920). Net fee and commission income from card operations declined to SEK 572m (620).
Net gains/losses on financial transactions declined to SEK 864m (1,685), because the period of comparison included capital gains from the sale of shares totalling SEK 908m.
Other income decreased to SEK 146m (427). The decrease was primarily attributable to lower dividend income.
Expenses
Total expenses decreased by 2% to SEK -9,295m (-9,513). Exchange rate effects reduced expenses by SEK 1m.
Staff costs fell by 7% to SEK -6,160m (-6,620). In the first quarter, staff costs declined by SEK 239m as a result of the transition to a defined contribution pension plan in the Norwegian operations and the period of comparison including a provision of SEK -700m. Adjusted for these items, underlying staff costs rose by 8%, because of the resumption of provisions to the Oktogonen Foundation, which totalled SEK 486m (-). Variable remuneration, including social security costs and other payroll overheads, decreased to SEK -47m (-56).
The average number of employees fell by 139, to 11,636 (11,775). Excluding the expanding operations in the UK and the Netherlands, the average number of employees decreased by 2%, and the ongoing work to improve efficiency continues according to plan.
Other expenses rose by 7% to SEK -2,840m (-2,649), chiefly due to higher costs for IT development.
Loan losses
Loan losses decreased to SEK -382m (-416), and the loan loss ratio was 0.04% (0.04). Net impaired loans decreased by 13% to SEK 2,952m (3,383), equivalent to 0.15% (0.17) of lending.
SEK mJan-Jun
2017Jan-Jun
2016 Change
Net interest income 14,402 13,603 6%
Net fee and commission income 4,862 4,450 9%
Net gains/losses on financial trans. 864 1,685 -49%
Other income 146 427 -66%
Total income 20,274 20,165 1%
SEK mJan-Jun
2017Jan-Jun
2016 Change
Staff costs -6,160 -6,620 -7%
Other expenses -2,840 -2,649 7%
Depreciation and amortisation -295 -244 21%
Total expenses -9,295 -9,513 -2%
SEK mJan-Jun
2017Jan-Jun
2016 Change
Net loan losses -382 -416 -34
Loan loss ratio as a % of loans, acc. 0.04 0.04 0.00
Impaired loans, net 2,952 3,383 -13%
Proportion of impaired loans, % 0.15 0.17 -0.02
5 Handelsbanken
INTERIM REPORT JANUARY – JUNE 2017
INTERIM REPORT JANUARY – JUNE 2017
5 Handelsbanken
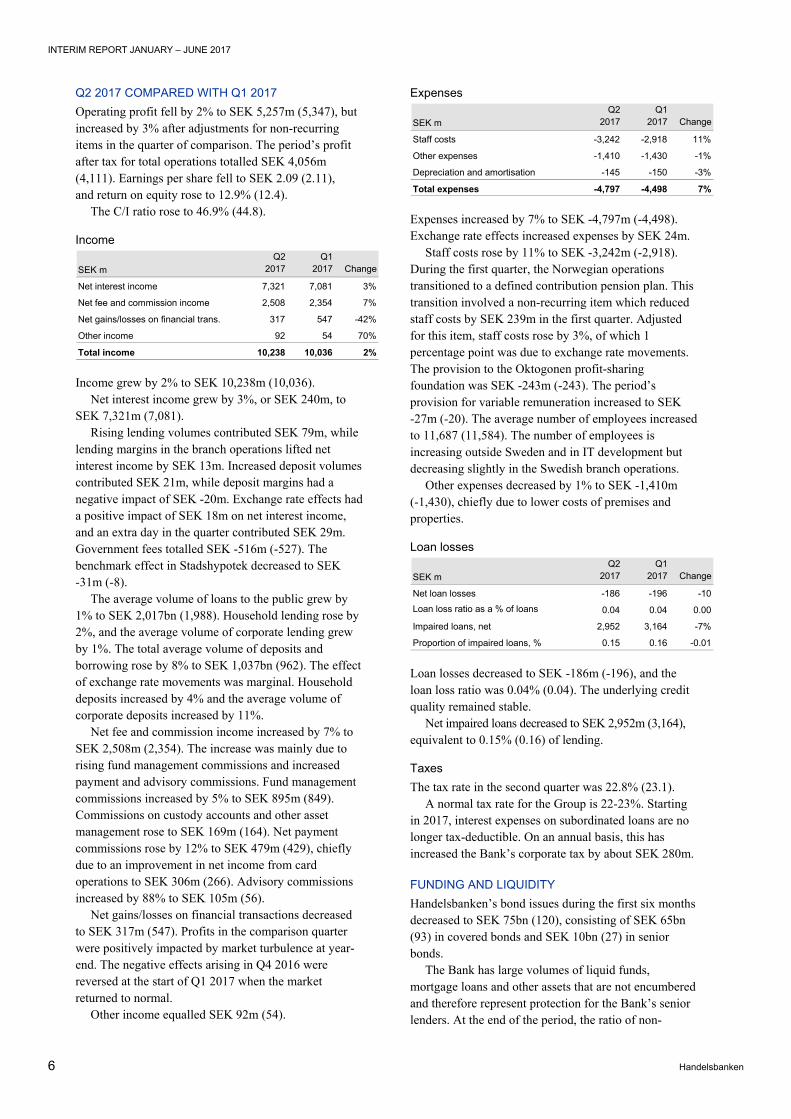
Q2 2017 COMPARED WITH Q1 2017 Operating profit fell by 2% to SEK 5,257m (5,347), but increased by 3% after adjustments for non-recurring items in the quarter of comparison. The period’s profit after tax for total operations totalled SEK 4,056m (4,111). Earnings per share fell to SEK 2.09 (2.11), and return on equity rose to 12.9% (12.4).
The C/I ratio rose to 46.9% (44.8).
Income
Income grew by 2% to SEK 10,238m (10,036). Net interest income grew by 3%, or SEK 240m, to
SEK 7,321m (7,081). Rising lending volumes contributed SEK 79m, while
lending margins in the branch operations lifted net interest income by SEK 13m. Increased deposit volumes contributed SEK 21m, while deposit margins had a negative impact of SEK -20m. Exchange rate effects had a positive impact of SEK 18m on net interest income, and an extra day in the quarter contributed SEK 29m. Government fees totalled SEK -516m (-527). The benchmark effect in Stadshypotek decreased to SEK -31m (-8).
The average volume of loans to the public grew by 1% to SEK 2,017bn (1,988). Household lending rose by 2%, and the average volume of corporate lending grew by 1%. The total average volume of deposits and borrowing rose by 8% to SEK 1,037bn (962). The effect of exchange rate movements was marginal. Household deposits increased by 4% and the average volume of corporate deposits increased by 11%.
Net fee and commission income increased by 7% to SEK 2,508m (2,354). The increase was mainly due to rising fund management commissions and increased payment and advisory commissions. Fund management commissions increased by 5% to SEK 895m (849). Commissions on custody accounts and other asset management rose to SEK 169m (164). Net payment commissions rose by 12% to SEK 479m (429), chiefly due to an improvement in net income from card operations to SEK 306m (266). Advisory commissions increased by 88% to SEK 105m (56).
Net gains/losses on financial transactions decreased to SEK 317m (547). Profits in the comparison quarter were positively impacted by market turbulence at year-end. The negative effects arising in Q4 2016 were reversed at the start of Q1 2017 when the market returned to normal.
Other income equalled SEK 92m (54).
Expenses
Expenses increased by 7% to SEK -4,797m (-4,498). Exchange rate effects increased expenses by SEK 24m.
Staff costs rose by 11% to SEK -3,242m (-2,918). During the first quarter, the Norwegian operations transitioned to a defined contribution pension plan. This transition involved a non-recurring item which reduced staff costs by SEK 239m in the first quarter. Adjusted for this item, staff costs rose by 3%, of which 1 percentage point was due to exchange rate movements. The provision to the Oktogonen profit-sharing foundation was SEK -243m (-243). The period’s provision for variable remuneration increased to SEK -27m (-20). The average number of employees increased to 11,687 (11,584). The number of employees is increasing outside Sweden and in IT development but decreasing slightly in the Swedish branch operations.
Other expenses decreased by 1% to SEK -1,410m (-1,430), chiefly due to lower costs of premises and properties.
Loan losses
Loan losses decreased to SEK -186m (-196), and the loan loss ratio was 0.04% (0.04). The underlying credit quality remained stable.
Net impaired loans decreased to SEK 2,952m (3,164), equivalent to 0.15% (0.16) of lending.
Taxes The tax rate in the second quarter was 22.8% (23.1).
A normal tax rate for the Group is 22-23%. Starting in 2017, interest expenses on subordinated loans are no longer tax-deductible. On an annual basis, this has increased the Bank’s corporate tax by about SEK 280m.
FUNDING AND LIQUIDITY Handelsbanken’s bond issues during the first six months decreased to SEK 75bn (120), consisting of SEK 65bn (93) in covered bonds and SEK 10bn (27) in senior bonds.
The Bank has large volumes of liquid funds, mortgage loans and other assets that are not encumbered and therefore represent protection for the Bank’s senior lenders. At the end of the period, the ratio of non-
SEK mQ2
2017Q1
2017 Change
Net interest income 7,321 7,081 3%
Net fee and commission income 2,508 2,354 7%
Net gains/losses on financial trans. 317 547 -42%
Other income 92 54 70%
Total income 10,238 10,036 2%
SEK mQ2
2017Q1
2017 Change
Staff costs -3,242 -2,918 11%
Other expenses -1,410 -1,430 -1%
Depreciation and amortisation -145 -150 -3%
Total expenses -4,797 -4,498 7%
SEK mQ2
2017Q1
2017 Change
Net loan losses -186 -196 -10Loan loss ratio as a % of loans 0.04 0.04 0.00
Impaired loans, net 2,952 3,164 -7%
Proportion of impaired loans, % 0.15 0.16 -0.01
6 Handelsbanken
INTERIM REPORT JANUARY – JUNE 2017

INTERIM REPORT JANUARY – JUNE 2017
5 Handelsbanken
Q2 2017 COMPARED WITH Q1 2017 Operating profit fell by 2% to SEK 5,257m (5,347), but increased by 3% after adjustments for non-recurring items in the quarter of comparison. The period’s profit after tax for total operations totalled SEK 4,056m (4,111). Earnings per share fell to SEK 2.09 (2.11), and return on equity rose to 12.9% (12.4).
The C/I ratio rose to 46.9% (44.8).
Income
Income grew by 2% to SEK 10,238m (10,036). Net interest income grew by 3%, or SEK 240m, to
SEK 7,321m (7,081). Rising lending volumes contributed SEK 79m, while
lending margins in the branch operations lifted net interest income by SEK 13m. Increased deposit volumes contributed SEK 21m, while deposit margins had a negative impact of SEK -20m. Exchange rate effects had a positive impact of SEK 18m on net interest income, and an extra day in the quarter contributed SEK 29m. Government fees totalled SEK -516m (-527). The benchmark effect in Stadshypotek decreased to SEK -31m (-8).
The average volume of loans to the public grew by 1% to SEK 2,017bn (1,988). Household lending rose by 2%, and the average volume of corporate lending grew by 1%. The total average volume of deposits and borrowing rose by 8% to SEK 1,037bn (962). The effect of exchange rate movements was marginal. Household deposits increased by 4% and the average volume of corporate deposits increased by 11%.
Net fee and commission income increased by 7% to SEK 2,508m (2,354). The increase was mainly due to rising fund management commissions and increased payment and advisory commissions. Fund management commissions increased by 5% to SEK 895m (849). Commissions on custody accounts and other asset management rose to SEK 169m (164). Net payment commissions rose by 12% to SEK 479m (429), chiefly due to an improvement in net income from card operations to SEK 306m (266). Advisory commissions increased by 88% to SEK 105m (56).
Net gains/losses on financial transactions decreased to SEK 317m (547). Profits in the comparison quarter were positively impacted by market turbulence at year-end. The negative effects arising in Q4 2016 were reversed at the start of Q1 2017 when the market returned to normal.
Other income equalled SEK 92m (54).
Expenses
Expenses increased by 7% to SEK -4,797m (-4,498). Exchange rate effects increased expenses by SEK 24m.
Staff costs rose by 11% to SEK -3,242m (-2,918). During the first quarter, the Norwegian operations transitioned to a defined contribution pension plan. This transition involved a non-recurring item which reduced staff costs by SEK 239m in the first quarter. Adjusted for this item, staff costs rose by 3%, of which 1 percentage point was due to exchange rate movements. The provision to the Oktogonen profit-sharing foundation was SEK -243m (-243). The period’s provision for variable remuneration increased to SEK -27m (-20). The average number of employees increased to 11,687 (11,584). The number of employees is increasing outside Sweden and in IT development but decreasing slightly in the Swedish branch operations.
Other expenses decreased by 1% to SEK -1,410m (-1,430), chiefly due to lower costs of premises and properties.
Loan losses
Loan losses decreased to SEK -186m (-196), and the loan loss ratio was 0.04% (0.04). The underlying credit quality remained stable.
Net impaired loans decreased to SEK 2,952m (3,164), equivalent to 0.15% (0.16) of lending.
Taxes The tax rate in the second quarter was 22.8% (23.1).
A normal tax rate for the Group is 22-23%. Starting in 2017, interest expenses on subordinated loans are no longer tax-deductible. On an annual basis, this has increased the Bank’s corporate tax by about SEK 280m.
FUNDING AND LIQUIDITY Handelsbanken’s bond issues during the first six months decreased to SEK 75bn (120), consisting of SEK 65bn (93) in covered bonds and SEK 10bn (27) in senior bonds.
The Bank has large volumes of liquid funds, mortgage loans and other assets that are not encumbered and therefore represent protection for the Bank’s senior lenders. At the end of the period, the ratio of non-
SEK mQ2
2017Q1
2017 Change
Net interest income 7,321 7,081 3%
Net fee and commission income 2,508 2,354 7%
Net gains/losses on financial trans. 317 547 -42%
Other income 92 54 70%
Total income 10,238 10,036 2%
SEK mQ2
2017Q1
2017 Change
Staff costs -3,242 -2,918 11%
Other expenses -1,410 -1,430 -1%
Depreciation and amortisation -145 -150 -3%
Total expenses -4,797 -4,498 7%
SEK mQ2
2017Q1
2017 Change
Net loan losses -186 -196 -10Loan loss ratio as a % of loans 0.04 0.04 0.00
Impaired loans, net 2,952 3,164 -7%
Proportion of impaired loans, % 0.15 0.16 -0.01
INTERIM REPORT JANUARY – JUNE 2017
6 Handelsbanken
encumbered assets to all non-encumbered market funding was 236% (210% at year-end 2016).
The Bank has a strong liquidity position. Cash funds and liquid assets invested with central banks amounted to SEK 489bn, while the volume of liquid bonds and other liquid assets totalled SEK 175bn.
According to the current Swedish definition from January 2013, the Handelsbanken Group’s liquidity coverage ratio (LCR) at the end of the second quarter was 120% (139). In USD, the LCR was 177% (121), and in EUR it was 132% (181). The Group’s LCR, calculated according to the European Commission’s delegated act, was 136% (146). At the end of the second quarter, the net stable funding ratio (NSFR) was 106% (102% at year-end).
CAPITAL The Bank’s goal is that its common equity tier 1 ratio under normal circumstances should exceed by 1-3 percentage points the common equity tier 1 capital requirement communicated to the Bank by the Swedish Financial Supervisory Authority.
At the end of March, the Swedish Financial Supervisory Authority approved the Bank’s new PD models for corporate exposures.
During the second quarter, the Authority approved the Bank’s models for capital adequacy for sovereign exposures applying the IRB Approach. Capital adequacy for these exposures was previously calculated using the standardised approach and their risk weight was zero. Introduction of the new models increases the Bank’s risk exposure by SEK 9.6bn.
The common equity tier 1 ratio at the end of the second quarter was 23.4%. At the end of the first quarter, the Swedish Financial Supervisory Authority’s common equity tier 1 capital requirement was 20.3%. Thus the Bank’s common equity tier 1 ratio slightly exceeded the upper limit of the target interval.
Capital situation 30 June 2017 compared with 30 June 2016
Own funds increased to SEK 146bn (137), putting the Bank’s total capital ratio at 29.0% (28.9).
The common equity tier 1 capital increased to SEK 118bn (109), and the common equity tier 1 ratio rose by 0.4 percentage points to 23.4% (23.0). The implementation of new models for sovereign exposures
reduced the common equity tier 1 ratio by -0.5 percentage points.
Conversions of the 2011 staff convertible bond increased the ratio by 0.1 percentage point. The period’s profit contributed 1.0 percentage point after a deduction for the dividend generated.
Implementation of new PD models reduced the common equity tier 1 ratio by -1.8 percentage points. Higher lending volumes reduced the common equity tier 1 ratio by -0.1 percentage point, and credit risk migration in the loan portfolio had an additional impact of -0.2 percentage points. At the same time, as a result of new lending volumes having lower risk than the exposures leaving the credit portfolio (known as volume migration), the common equity tier 1 ratio increased by 0.3 percentage points.
The effect of IAS 19 increased the common equity tier 1 capital ratio by 1.7 percentage points, due to both higher asset values and raised discount rates. The sale of AFS shares had a positive effect of 0.6 percentage points.
Exchange rate effects were neutral, and the net effect of other factors reduced the common equity tier 1 ratio by -0.7 percentage points.
Capital situation 30 June 2017 compared with 31 March 2017
Own funds increased to SEK 146bn (145), and the total capital ratio declined to 29.0% (29.7). The common equity tier 1 capital increased to SEK 118bn (117), and the common equity tier 1 ratio according to CRR fell by -0.4 percentage points to 23.4% (23.8). The implementation of new models for sovereign exposures reduced the common equity tier 1 ratio by -0.5 percentage points. The period’s profit contributed 0.3 percentage points after a deduction for the dividend generated.
Rising lending volumes reduced the common equity tier 1 ratio by -0.2 percentage points. Volume migration had a neutral effect, while credit risk migration had a negative impact of -0.2 percentage points.
The effect of IAS 19 increased the common equity tier 1 capital ratio by 0.2 percentage points, mainly due to higher asset values. The discount rate for Swedish pension obligations was 2.30% (2.30).
The effects of exchange rate movements were neutral.
SEK m30 Jun
201730 Jun
2016 Change
Common equity tier 1 ratio, CRR 23.4% 23.0% 0.4
Total capital ratio, CRR 29.0% 28.9% 0.1
Risk exposure amount CRR 504,199 474,500 6%
Common equity tier 1 capital 117,851 109,006 8%
Total own funds 146,164 137,057 7%
Capital requirement, Basel I floor 100,575 97,459 3%
Total own funds, Basel I floor 148,436 138,600 7%
SEK m30 Jun
201731 Mar
2017 Change
Common equity tier 1 ratio, CRR 23.4% 23.8% -0.4
Total capital ratio, CRR 29.0% 29.7% -0.7
Risk exposure amount CRR 504,199 489,456 3%
Common equity tier 1 capital 117,851 116,529 1%
Total own funds 146,164 145,291 1%
Capital requirement, Basel I floor 100,575 98,946 2%
Total own funds, Basel I floor 148,436 147,561 1%
7 Handelsbanken
INTERIM REPORT JANUARY – JUNE 2017
INTERIM REPORT JANUARY – JUNE 2017
7 Handelsbanken
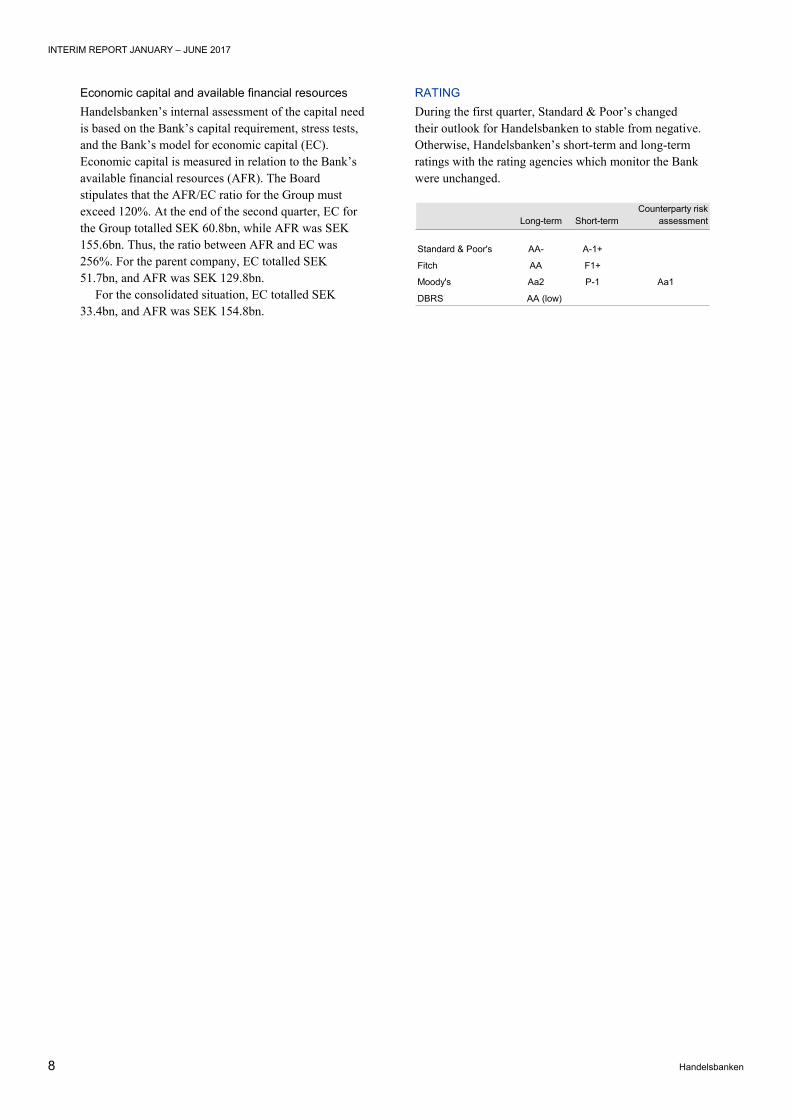
Economic capital and available financial resources Handelsbanken’s internal assessment of the capital need is based on the Bank’s capital requirement, stress tests, and the Bank’s model for economic capital (EC). Economic capital is measured in relation to the Bank’s available financial resources (AFR). The Board stipulates that the AFR/EC ratio for the Group must exceed 120%. At the end of the second quarter, EC for the Group totalled SEK 60.8bn, while AFR was SEK 155.6bn. Thus, the ratio between AFR and EC was 256%. For the parent company, EC totalled SEK 51.7bn, and AFR was SEK 129.8bn.
For the consolidated situation, EC totalled SEK 33.4bn, and AFR was SEK 154.8bn.
RATING During the first quarter, Standard & Poor’s changed their outlook for Handelsbanken to stable from negative. Otherwise, Handelsbanken’s short-term and long-term ratings with the rating agencies which monitor the Bank were unchanged.
Long-term Short-termCounterparty risk
assessment
Standard & Poor's AA- A-1+
Fitch AA F1+
Moody's Aa2 P-1 Aa1
DBRS AA (low)
8 Handelsbanken
INTERIM REPORT JANUARY – JUNE 2017

INTERIM REPORT JANUARY – JUNE 2017
7 Handelsbanken
Economic capital and available financial resources Handelsbanken’s internal assessment of the capital need is based on the Bank’s capital requirement, stress tests, and the Bank’s model for economic capital (EC). Economic capital is measured in relation to the Bank’s available financial resources (AFR). The Board stipulates that the AFR/EC ratio for the Group must exceed 120%. At the end of the second quarter, EC for the Group totalled SEK 60.8bn, while AFR was SEK 155.6bn. Thus, the ratio between AFR and EC was 256%. For the parent company, EC totalled SEK 51.7bn, and AFR was SEK 129.8bn.
For the consolidated situation, EC totalled SEK 33.4bn, and AFR was SEK 154.8bn.
RATING During the first quarter, Standard & Poor’s changed their outlook for Handelsbanken to stable from negative. Otherwise, Handelsbanken’s short-term and long-term ratings with the rating agencies which monitor the Bank were unchanged.
Long-term Short-termCounterparty risk
assessment
Standard & Poor's AA- A-1+
Fitch AA F1+
Moody's Aa2 P-1 Aa1
DBRS AA (low)
INTERIM REPORT JANUARY – JUNE 2017
8 Handelsbanken
Handelsbanken Group – Business segments
The business segments consist of Handelsbanken Sweden, Handelsbanken UK,
Handelsbanken Denmark, Handelsbanken Finland, Handelsbanken Norway,
Handelsbanken the Netherlands and Handelsbanken Capital Markets. The
income statements by segment include internal items such as internal interest,
commissions and payment for internal services, primarily according to the cost
price principle. The part of Handelsbanken Capital Markets’ operating profit that
does not involve risk-taking is allocated to branches with customer responsibility.
January - June 2017
SEK m Sweden UK Denmark Finland NorwayNether-
landsCapital
Markets OtherAdj. & elim.
GroupJan-Jun
2017
Net interest income 8,022 2,257 842 583 1,783 260 236 419 14,402
Net fee and commission income 2,175 290 229 234 205 65 1,641 23 4,862Net gains/losses on financial transactions 323 94 53 27 46 5 627 -311 864
Risk result - insurance 89 89
Share of profit of associates 2 -32 -30
Other income 27 0 8 10 10 0 10 22 87Total income 10,547 2,641 1,132 854 2,044 332 2,603 121 20,274Staff costs -1,704 -914 -329 -194 -177 -141 -1,132 -1,461 -108 -6,160
Other expenses -558 -238 -75 -86 -107 -38 -448 -1,290 -2,840
Internal purchased and sold services -1,565 -301 -163 -151 -200 -46 23 2,403Depreciation, amortisation and impairments of property, equipment and intangible assets -44 -32 -7 -9 -7 -5 -40 -125 -26 -295Total expenses -3,871 -1,485 -574 -440 -491 -230 -1,597 -473 -134 -9,295Profit before loan losses 6,676 1,156 558 414 1,553 102 1,006 -352 -134 10,979
Net loan losses -99 -35 -70 -12 -102 0 -64 -382
Gains/losses on disposal of property, equipment and intangible assets 0 -1 8 0 0 - 0 0 7
Operating profit 6,577 1,120 496 402 1,451 102 942 -352 -134 10,604
Profit allocation 624 15 48 70 44 2 -803 -
Operating profit after profit allocation 7,201 1,135 544 472 1,495 104 139 -352 -134 10,604
Internal income* 166 -584 -174 -174 -1,284 -122 -1,449 3,621
January - June 2016
SEK m Sweden UK Denmark Finland NorwayNether-
landsCapital
Markets OtherAdj. & elim.
GroupJan-Jun
2016
Net interest income 7,572 2,218 814 612 1,566 195 271 355 13,603
Net fee and commission income 2,084 251 191 195 175 11 1,513 30 4,450Net gains/losses on financial transactions 374 126 35 58 68 1 578 445 1,685
Risk result - insurance 111 111
Share of profit of associates 15 15
Other income 15 1 9 6 72 - 3 195 301
Total income 10,045 2,596 1,049 871 1,881 207 2,476 1,040 20,165
Staff costs -2,526 -935 -314 -185 -321 -89 -1,207 -928 -115 -6,620
Other expenses -590 -211 -85 -120 -98 -24 -429 -1,092 -2,649
Internal purchased and sold services -1,335 -257 -138 -118 -176 -39 -22 2,085Depreciation, amortisation and impairments of property, equipment and intangible assets -37 -24 -7 -6 1 -3 -39 -129 -244
Total expenses -4,488 -1,427 -544 -429 -594 -155 -1,697 -64 -115 -9,513
Profit before loan losses 5,557 1,169 505 442 1,287 52 779 976 -115 10,652
Net loan losses -108 -67 -44 -34 -167 1 3 -416
Gains/losses on disposal of property, equipment and intangible assets 0 2 1 0 0 - 0 5 8
Operating profit 5,449 1,104 462 408 1,120 53 782 981 -115 10,244
Profit allocation 426 15 37 62 39 2 -581
Operating profit after profit allocation 5,875 1,119 499 470 1,159 55 201 981 -115 10,244
Internal income* 10 -677 -199 -147 -1,242 -108 -1,281 3,644
Home markets
Home markets
* Internal income which is included in total income comprises income from transactions between other operating segments and Other. Since interest income and interest expense are reported net as income, this means that internal income includes the net amount of the internal funding cost between segments and Other.
9 Handelsbanken
INTERIM REPORT JANUARY – JUNE 2017

INTERIM REPORT JANUARY – JUNE 2017
9 Handelsbanken
Handelsbanken Sweden Handelsbanken Sweden comprises branch operations in five regional banks, as well as the operations of Handelsbanken Finans, Ecster and Stadshypotek in Sweden. At Handelsbanken, the branches are the base of all operations, with responsibility for all customers of the Bank. The regional banks offer a full range of banking services at 423 branches throughout Sweden. Handelsbanken Finans offers finance company services and works through the Bank’s branches.
INCOME STATEMENT
BUSINESS VOLUMES
SEK mQ2
2017Q1
2017 ChangeQ2
2016 ChangeJan-Jun
2017Jan-Jun
2016 ChangeFull year
2016
Net interest income 4,076 3,946 3% 3,813 7% 8,022 7,572 6% 15,519
Net fee and commission income 1,117 1,058 6% 1,080 3% 2,175 2,084 4% 4,233
Net gains/losses on financial transactions 176 147 20% 242 -27% 323 374 -14% 725
Other income 16 11 45% 4 300% 27 15 80% 47Total income 5,385 5,162 4% 5,139 5% 10,547 10,045 5% 20,524
Staff costs -848 -856 -1% -920 -8% -1,704 -2,526 -33% -3,671
Other expenses -279 -279 0% -310 -10% -558 -590 -5% -1,153
Internal purchased and sold services -773 -792 -2% -677 14% -1,565 -1,335 17% -2,645Depreciation, amortisation and impairments of property, equipment and intangible assets -17 -27 -37% -17 0% -44 -37 19% -67Total expenses -1,917 -1,954 -2% -1,924 0% -3,871 -4,488 -14% -7,536Profit before loan losses 3,468 3,208 8% 3,215 8% 6,676 5,557 20% 12,988
Net loan losses -39 -60 -35% -84 -54% -99 -108 -8% -416Gains/losses on disposal of property, equipment and intangible assets 0 0 0% 1 -100% 0 0 0Operating profit 3,429 3,148 9% 3,132 9% 6,577 5,449 21% 12,572
Profit allocation 330 294 12% 224 47% 624 426 46% 997Operating profit after profit allocation 3,759 3,442 9% 3,356 12% 7,201 5,875 23% 13,569
Internal income 182 -16 121 50% 166 10 116
Cost/income ratio, % 33.5 35.8 35.9 34.7 42.9 35.0
Loan loss ratio, % 0.01 0.02 0.03 0.02 0.02 0.03
Allocated capital 74,464 78,736 -5% 68,642 8% 74,464 68,642 8% 77,800
Return on allocated capital, % 15.7 13.6 15.3 14.7 12.8 14.7
Average number of employees 3,990 4,006 0% 4,300 -7% 3,998 4,356 -8% 4,293Number of branches 423 425 0% 472 -10% 423 472 -10% 435
Average volumes, SEK bnQ2
2017Q1
2017 ChangeQ2
2016 ChangeJan-Jun
2017Jan-Jun
2016 ChangeFull year
2016
Loans to the public*
Household 775 765 1% 736 5% 770 728 6% 740
of which mortgage loans 725 714 2% 681 6% 719 674 7% 687
Corporate 486 479 1% 481 1% 482 482 0% 479
of which mortgage loans 280 275 2% 272 3% 278 273 2% 271Total 1,261 1,244 1% 1,217 4% 1,252 1,210 3% 1,219
Deposits and borrowing from the public
Household 316 307 3% 291 9% 312 286 9% 295
Corporate 229 217 6% 200 15% 223 199 12% 201Total 545 524 4% 491 11% 535 485 10% 496* Excluding loans to the National Debt Office.
10 Handelsbanken
INTERIM REPORT JANUARY – JUNE 2017

INTERIM REPORT JANUARY – JUNE 2017
9 Handelsbanken
Handelsbanken Sweden Handelsbanken Sweden comprises branch operations in five regional banks, as well as the operations of Handelsbanken Finans, Ecster and Stadshypotek in Sweden. At Handelsbanken, the branches are the base of all operations, with responsibility for all customers of the Bank. The regional banks offer a full range of banking services at 423 branches throughout Sweden. Handelsbanken Finans offers finance company services and works through the Bank’s branches.
INCOME STATEMENT
BUSINESS VOLUMES
SEK mQ2
2017Q1
2017 ChangeQ2
2016 ChangeJan-Jun
2017Jan-Jun
2016 ChangeFull year
2016
Net interest income 4,076 3,946 3% 3,813 7% 8,022 7,572 6% 15,519
Net fee and commission income 1,117 1,058 6% 1,080 3% 2,175 2,084 4% 4,233
Net gains/losses on financial transactions 176 147 20% 242 -27% 323 374 -14% 725
Other income 16 11 45% 4 300% 27 15 80% 47Total income 5,385 5,162 4% 5,139 5% 10,547 10,045 5% 20,524
Staff costs -848 -856 -1% -920 -8% -1,704 -2,526 -33% -3,671
Other expenses -279 -279 0% -310 -10% -558 -590 -5% -1,153
Internal purchased and sold services -773 -792 -2% -677 14% -1,565 -1,335 17% -2,645Depreciation, amortisation and impairments of property, equipment and intangible assets -17 -27 -37% -17 0% -44 -37 19% -67Total expenses -1,917 -1,954 -2% -1,924 0% -3,871 -4,488 -14% -7,536Profit before loan losses 3,468 3,208 8% 3,215 8% 6,676 5,557 20% 12,988
Net loan losses -39 -60 -35% -84 -54% -99 -108 -8% -416Gains/losses on disposal of property, equipment and intangible assets 0 0 0% 1 -100% 0 0 0Operating profit 3,429 3,148 9% 3,132 9% 6,577 5,449 21% 12,572
Profit allocation 330 294 12% 224 47% 624 426 46% 997Operating profit after profit allocation 3,759 3,442 9% 3,356 12% 7,201 5,875 23% 13,569
Internal income 182 -16 121 50% 166 10 116
Cost/income ratio, % 33.5 35.8 35.9 34.7 42.9 35.0
Loan loss ratio, % 0.01 0.02 0.03 0.02 0.02 0.03
Allocated capital 74,464 78,736 -5% 68,642 8% 74,464 68,642 8% 77,800
Return on allocated capital, % 15.7 13.6 15.3 14.7 12.8 14.7
Average number of employees 3,990 4,006 0% 4,300 -7% 3,998 4,356 -8% 4,293Number of branches 423 425 0% 472 -10% 423 472 -10% 435
Average volumes, SEK bnQ2
2017Q1
2017 ChangeQ2
2016 ChangeJan-Jun
2017Jan-Jun
2016 ChangeFull year
2016
Loans to the public*
Household 775 765 1% 736 5% 770 728 6% 740
of which mortgage loans 725 714 2% 681 6% 719 674 7% 687
Corporate 486 479 1% 481 1% 482 482 0% 479
of which mortgage loans 280 275 2% 272 3% 278 273 2% 271Total 1,261 1,244 1% 1,217 4% 1,252 1,210 3% 1,219
Deposits and borrowing from the public
Household 316 307 3% 291 9% 312 286 9% 295
Corporate 229 217 6% 200 15% 223 199 12% 201Total 545 524 4% 491 11% 535 485 10% 496* Excluding loans to the National Debt Office.
INTERIM REPORT JANUARY – JUNE 2017
10 Handelsbanken
JANUARY – JUNE 2017 COMPARED WITH JANUARY – JUNE 2016
Financial performance Operating profit increased by 21% to SEK 6,577m (5,449). Adjusted for the staff cost provision of SEK -700m in Q1 2016, the increase was 7%.
Net interest income increased by 6% to SEK 8,022m (7,572). Greater lending volumes increased net interest income by SEK 251m and improved lending margins by an additional SEK 54m. Deposit operations contributed SEK 60m thanks to volumes and SEK 16m thanks to improved margins. Fees for the Resolution Fund and the deposit guarantee rose by SEK 214m to -544m (-330), and the benchmark effect in Stadshypotek was SEK -39m (6). The remainder of the increase in net interest income was mainly due to lower funding costs.
Net fee and commission income rose by 4% to SEK 2,175m (2,084). The increase was chiefly due to higher fund management, payment and insurance commissions.
Net gains/losses on financial transactions declined by 14% to SEK 323m (374), mainly as a result of capital gains on equities in the period of comparison.
Total expenses decreased by 14% to SEK -3,871m (-4,488), as a result of the preceding year’s staff cost provision of SEK -700m. Adjusted for the provision, staff costs decreased by 7%. The average number of employees fell by 8% to 3,998 (4,356).
Expenses for services bought and sold internally increased by 17% to SEK -1,565m, mainly due to higher IT development costs.
The C/I ratio improved to 34.7% (42.9). Loan losses declined to SEK -99m (-108), and the
loan loss ratio was unchanged at 0.02% (0.02).
Business development At the beginning of April, Kantar Sifo presented the 2017 Company Reputation Index. This shows the degree of trust and quality that the Swedish public attaches to different companies. As in previous years, Handelsbanken was the major bank in which the general public had the most confidence. Handelsbanken is the only bank among the 10 companies with the best reputation in Sweden. In addition, confidence in the Bank increased, and Handelsbanken was given an index value of 58 (54). This can be compared with the average for the other three major banks, which went down to 31 (35).
During the first six months of the year, new savings in the Bank’s mutual funds in Sweden were SEK 10.8bn (5.5), corresponding to a market share of 18.1%.
The average volume of deposits from households rose by 9% to SEK 312bn (286). The average volume of mortgage loans to private individuals increased by 7% to SEK 719bn (674), while the average volume of lending to companies was unchanged at SEK 482bn (482).
During the second quarter, the Bank continued to adapt its branch operations, partly as a result of changed customer behaviour resulting from digitalisation. Handelsbanken had 423 branches (472) in Sweden.
Q2 2017 COMPARED WITH Q1 2017 Operating profit increased by 9% to SEK 3,429m (3,148), and return on allocated capital rose to 15.7% (13.6).
Net interest income rose by 3%, or SEK 130m, to SEK 4,076m (3,946).
Increased lending volumes contributed SEK 49m, while lending margins reduced net interest income by SEK -3m. Net interest income from deposit operations increased by SEK 16m. The benchmark effect in Stadshypotek decreased to SEK -31m (-8).
The average volume of mortgage loans to private individuals grew by 2% to SEK 725bn (714). The gross margin on the mortgage portfolio – before advisory and administration expenses – was unchanged at 1.06% (1.06).
The average volume of corporate lending increased by 1% to SEK 486bn (479).
Net fee and commission income grew by 6% to SEK 1,117m (1,058), due to increased fund management and payment commissions.
Net gains/losses on financial transactions rose to SEK 176m (147), due to improved gains on bond repurchases in Stadshypotek.
Expenses decreased by 2% to SEK -1,917m (-1,954), attributable to somewhat lower staff costs and reduced costs for services bought and sold. The average number of employees decreased to 3,990 (4,006).
Loan losses fell to SEK -39m (-60), and the loan loss ratio fell to 0.01% (0.02).
11 Handelsbanken
INTERIM REPORT JANUARY – JUNE 2017

INTERIM REPORT JANUARY – JUNE 2017
11 Handelsbanken
Handelsbanken UK Handelsbanken UK comprises branch operations in five regional banks and the asset management company Heartwood. Handelsbanken Finans’s operations in the UK are also included. At Handelsbanken, the branches are the base of all operations, with responsibility for all customers of the Bank. The regional banks offer banking services at 207 branches throughout the UK.
INCOME STATEMENT
BUSINESS VOLUMES
SEK mQ2
2017Q1
2017 ChangeQ2
2016 ChangeJan-Jun
2017Jan-Jun
2016 ChangeFull year
2016
Net interest income 1,178 1,079 9% 1,102 7% 2,257 2,218 2% 4,414
Net fee and commission income 150 140 7% 132 14% 290 251 16% 519
Net gains/losses on financial transactions 48 46 4% 76 -37% 94 126 -25% 219
Other income 0 0 0% 0 0 1 -100% 3Total income 1,376 1,265 9% 1,310 5% 2,641 2,596 2% 5,155
Staff costs -461 -453 2% -462 0% -914 -935 -2% -1,849
Other expenses -126 -112 13% -105 20% -238 -211 13% -463
Internal purchased and sold services -151 -150 1% -137 10% -301 -257 17% -545Depreciation, amortisation and impairments of property, equipment and intangible assets -16 -16 0% -11 45% -32 -24 33% -46Total expenses -754 -731 3% -715 5% -1,485 -1,427 4% -2,903Profit before loan losses 622 534 16% 595 5% 1,156 1,169 -1% 2,252
Net loan losses -23 -12 92% -26 -12% -35 -67 -48% -160Gains/losses on disposal of property, equipment and intangible assets 0 -1 -1 -1 2 2Operating profit 599 521 15% 568 5% 1,120 1,104 1% 2,094
Profit allocation 7 8 -13% 7 0% 15 15 0% 35Operating profit after profit allocation 606 529 15% 575 5% 1,135 1,119 1% 2,129
Internal income -286 -298 4% -327 13% -584 -677 14% -1,195
Cost/income ratio, % 54.5 57.4 54.3 55.9 54.7 55.9
Loan loss ratio, % 0.05 0.02 0.05 0.04 0.07 0.08
Allocated capital 12,144 12,914 -6% 10,263 18% 12,144 10,263 18% 11,426
Return on allocated capital, % 15.6 12.8 17.5 14.1 16.5 15.4
Average number of employees 2,022 1,991 2% 1,957 3% 2,006 1,934 4% 1,959
Number of branches 207 207 0% 205 1% 207 205 1% 207
Average volumes, GBP mQ2
2017Q1
2017 ChangeQ2
2016 ChangeJan-Jun
2017Jan-Jun
2016 ChangeFull year
2016
Loans to the public
Household 6,073 5,916 3% 5,456 11% 5,994 5,372 12% 5,527
Corporate 12,050 11,719 3% 10,847 11% 11,885 10,706 11% 11,007Total 18,123 17,635 3% 16,303 11% 17,879 16,078 11% 16,534
Deposits and borrowing from the public
Household 3,603 3,297 9% 2,425 49% 3,450 2,242 54% 2,569
Corporate 8,490 7,840 8% 7,051 20% 8,165 6,898 18% 7,218Total 12,093 11,137 9% 9,476 28% 11,615 9,140 27% 9,787
12 Handelsbanken
INTERIM REPORT JANUARY – JUNE 2017

INTERIM REPORT JANUARY – JUNE 2017
11 Handelsbanken
Handelsbanken UK Handelsbanken UK comprises branch operations in five regional banks and the asset management company Heartwood. Handelsbanken Finans’s operations in the UK are also included. At Handelsbanken, the branches are the base of all operations, with responsibility for all customers of the Bank. The regional banks offer banking services at 207 branches throughout the UK.
INCOME STATEMENT
BUSINESS VOLUMES
SEK mQ2
2017Q1
2017 ChangeQ2
2016 ChangeJan-Jun
2017Jan-Jun
2016 ChangeFull year
2016
Net interest income 1,178 1,079 9% 1,102 7% 2,257 2,218 2% 4,414
Net fee and commission income 150 140 7% 132 14% 290 251 16% 519
Net gains/losses on financial transactions 48 46 4% 76 -37% 94 126 -25% 219
Other income 0 0 0% 0 0 1 -100% 3Total income 1,376 1,265 9% 1,310 5% 2,641 2,596 2% 5,155
Staff costs -461 -453 2% -462 0% -914 -935 -2% -1,849
Other expenses -126 -112 13% -105 20% -238 -211 13% -463
Internal purchased and sold services -151 -150 1% -137 10% -301 -257 17% -545Depreciation, amortisation and impairments of property, equipment and intangible assets -16 -16 0% -11 45% -32 -24 33% -46Total expenses -754 -731 3% -715 5% -1,485 -1,427 4% -2,903Profit before loan losses 622 534 16% 595 5% 1,156 1,169 -1% 2,252
Net loan losses -23 -12 92% -26 -12% -35 -67 -48% -160Gains/losses on disposal of property, equipment and intangible assets 0 -1 -1 -1 2 2Operating profit 599 521 15% 568 5% 1,120 1,104 1% 2,094
Profit allocation 7 8 -13% 7 0% 15 15 0% 35Operating profit after profit allocation 606 529 15% 575 5% 1,135 1,119 1% 2,129
Internal income -286 -298 4% -327 13% -584 -677 14% -1,195
Cost/income ratio, % 54.5 57.4 54.3 55.9 54.7 55.9
Loan loss ratio, % 0.05 0.02 0.05 0.04 0.07 0.08
Allocated capital 12,144 12,914 -6% 10,263 18% 12,144 10,263 18% 11,426
Return on allocated capital, % 15.6 12.8 17.5 14.1 16.5 15.4
Average number of employees 2,022 1,991 2% 1,957 3% 2,006 1,934 4% 1,959
Number of branches 207 207 0% 205 1% 207 205 1% 207
Average volumes, GBP mQ2
2017Q1
2017 ChangeQ2
2016 ChangeJan-Jun
2017Jan-Jun
2016 ChangeFull year
2016
Loans to the public
Household 6,073 5,916 3% 5,456 11% 5,994 5,372 12% 5,527
Corporate 12,050 11,719 3% 10,847 11% 11,885 10,706 11% 11,007Total 18,123 17,635 3% 16,303 11% 17,879 16,078 11% 16,534
Deposits and borrowing from the public
Household 3,603 3,297 9% 2,425 49% 3,450 2,242 54% 2,569
Corporate 8,490 7,840 8% 7,051 20% 8,165 6,898 18% 7,218Total 12,093 11,137 9% 9,476 28% 11,615 9,140 27% 9,787
INTERIM REPORT JANUARY – JUNE 2017
12 Handelsbanken
JANUARY – JUNE 2017 COMPARED WITH JANUARY – JUNE 2016
Financial performance Operating profit increased by 1% to SEK 1,120m (1,104). Exchange rate movements reduced operating profit by SEK -69m; expressed in local currency operating profit grew by 9%. The return on allocated capital decreased to 14.1% (16.5).
Income rose by 2%. In local currency, income rose by 9%.
Net interest income improved by 2% to SEK 2,257m (2,218). Exchange rate movements had a negative impact of SEK -145m on net interest income, while net interest income grew by 9% expressed in local currency. Increased lending volumes contributed SEK 175m, and deposit volumes contributed SEK 55m. Lower lending margins negatively affected net interest income by SEK -66m and deposit margins by SEK -19m. Government fees which affected net interest income rose to SEK -90m (-43).
Net fee and commission income rose by 16% to SEK 290m (251). In local currency, the increase was 24%, mainly due to higher payment and asset management commissions but also to higher deposit and lending commissions.
Net gains/losses on financial transactions decreased to SEK 94m (126), chiefly because the period of comparison included one-off income related to the sale of Visa Europe.
Expenses rose by 4% to SEK -1,485m (-1,427). In local currency, expenses were up by 11%, as a result of expanding operations as well as costs related to Brexit and preparations for the possible conversion of the UK branch into a subsidiary.
The average number of employees grew by 4% to 2,006 (1,934).
Loan losses fell to SEK -35m (-67), and the loan loss ratio fell to 0.04% (0.07).
Business development
Business volumes continued to grow. The average volume of deposits from households climbed by 54%, and lending to households grew by 12%, compared
with the first half of 2016. Overall, the average volume of lending increased by 11% to GBP 17.9bn, while total deposits grew by 27% to GBP 11.6bn. Therefore the loan-to-deposit ratio continued to decrease and was 150% at the end of Q2 2017, compared with 172% at the end of Q2 2016.
Heartwood’s assets under management totalled GBP 3.2bn, compared with GBP 2.9bn at the year-end.
The number of branches in the UK was unchanged during the first six months, at 207.
Q2 2017 COMPARED WITH Q1 2017 Operating profit rose by 15% to SEK 599m (521), chiefly due to improved net interest income. Exchange rate effects had a positive impact of SEK 12m on operating profit. The return on allocated capital increased to 15.6% (12.8).
Income grew by 9% to SEK 1,376m (1,265). Net interest income rose by 9%, or SEK 99m, to SEK 1,178m (1,079), of which SEK 20m was attributable to exchange rate effects and SEK 11m to there being fewer days in the comparison quarter. An adjustment of interest income attributable to impaired loans increased net interest income by SEK 37m. Adjusted for these items, net interest income rose by 3%. Greater business volumes had a positive impact of SEK 34m, while lower deposit margins had an impact of SEK -10m on net interest income. Lending margins improved somewhat, increasing net interest income by SEK 2m.
Net fee and commission income increased to SEK 150m (140), chiefly due to higher commissions on deposits and lending as well as on payments.
Net gains/losses on financial transactions rose to SEK 48m (46).
Expenses increased by 3% to SEK -754m (-731). Just over half the increase was attributable to exchange rate effects. The remainder of the increase was partly attributable to preparations for Brexit. The average number of employees rose to 2,022 (1,991).
Loan losses were SEK -23m (-12), and the loan loss ratio was 0.05% (0.02).
13 Handelsbanken
INTERIM REPORT JANUARY – JUNE 2017

INTERIM REPORT JANUARY – JUNE 2017
13 Handelsbanken
Handelsbanken Denmark Handelsbanken Denmark consists of the branch operations in Denmark, which are organised as a regional bank, as well as Stadshypotek’s operations in Denmark. At Handelsbanken, the branches are the base of all operations, with responsibility for all customers of the Bank. The regional bank offers a full range of banking services at 57 branches throughout Denmark.
INCOME STATEMENT
BUSINESS VOLUMES
SEK mQ2
2017Q1
2017 ChangeQ2
2016 ChangeJan-Jun
2017Jan-Jun
2016 ChangeFull year
2016
Net interest income 425 417 2% 405 5% 842 814 3% 1,686
Net fee and commission income 121 108 12% 93 30% 229 191 20% 379
Net gains/losses on financial transactions 29 24 21% 18 61% 53 35 51% 75
Other income 1 7 -86% 6 -83% 8 9 -11% 15Total income 576 556 4% 522 10% 1,132 1,049 8% 2,155
Staff costs -163 -166 -2% -155 5% -329 -314 5% -655
Other expenses -36 -39 -8% -41 -12% -75 -85 -12% -194
Internal purchased and sold services -83 -80 4% -69 20% -163 -138 18% -287Depreciation, amortisation and impairments of property, equipment and intangible assets -4 -3 33% -4 0% -7 -7 0% -14Total expenses -286 -288 -1% -269 6% -574 -544 6% -1,150Profit before loan losses 290 268 8% 253 15% 558 505 10% 1,005
Net loan losses -66 -4 -38 74% -70 -44 59% -716Gains/losses on disposal of property, equipment and intangible assets 2 6 -67% 1 100% 8 1 7Operating profit 226 270 -16% 216 5% 496 462 7% 296Profit allocation 24 24 0% 18 33% 48 37 30% 85Operating profit after profit allocation 250 294 -15% 234 7% 544 499 9% 381
Internal income -86 -88 2% -95 9% -174 -199 13% -334
Cost/income ratio, % 47.7 49.7 49.8 48.6 50.1 51.3
Loan loss ratio, % 0.27 0.02 0.18 0.14 0.10 0.85
Allocated capital 5,535 6,382 -13% 6,146 -10% 5,535 6,146 -10% 6,221
Return on allocated capital, % 14.1 14.4 11.9 14.3 12.8 4.8
Average number of employees 605 611 -1% 626 -3% 608 626 -3% 624
Number of branches 57 57 0% 57 0% 57 57 0% 57
Average volumes, DKK bnQ2
2017Q1
2017 ChangeQ2
2016 ChangeJan-Jun
2017Jan-Jun
2016 ChangeFull year
2016
Loans to the public
Household 43.8 43.4 1% 40.1 9% 43.6 39.6 10% 40.8
Corporate 28.8 29.6 -3% 28.8 0% 29.2 28.7 2% 28.8Total 72.6 73.0 -1% 68.9 5% 72.8 68.3 7% 69.6
Deposits and borrowing from the public
Household 12.9 12.2 6% 12.0 8% 12.5 11.6 8% 11.9
Corporate 18.6 18.5 1% 13.5 38% 18.6 15.3 22% 15.7Total 31.5 30.7 3% 25.5 24% 31.1 26.9 16% 27.6
14 Handelsbanken
INTERIM REPORT JANUARY – JUNE 2017
INTERIM REPORT JANUARY – JUNE 2017
13 Handelsbanken
Handelsbanken Denmark Handelsbanken Denmark consists of the branch operations in Denmark, which are organised as a regional bank, as well as Stadshypotek’s operations in Denmark. At Handelsbanken, the branches are the base of all operations, with responsibility for all customers of the Bank. The regional bank offers a full range of banking services at 57 branches throughout Denmark.
INCOME STATEMENT
BUSINESS VOLUMES
SEK mQ2
2017Q1
2017 ChangeQ2
2016 ChangeJan-Jun
2017Jan-Jun
2016 ChangeFull year
2016
Net interest income 425 417 2% 405 5% 842 814 3% 1,686
Net fee and commission income 121 108 12% 93 30% 229 191 20% 379
Net gains/losses on financial transactions 29 24 21% 18 61% 53 35 51% 75
Other income 1 7 -86% 6 -83% 8 9 -11% 15Total income 576 556 4% 522 10% 1,132 1,049 8% 2,155
Staff costs -163 -166 -2% -155 5% -329 -314 5% -655
Other expenses -36 -39 -8% -41 -12% -75 -85 -12% -194
Internal purchased and sold services -83 -80 4% -69 20% -163 -138 18% -287Depreciation, amortisation and impairments of property, equipment and intangible assets -4 -3 33% -4 0% -7 -7 0% -14Total expenses -286 -288 -1% -269 6% -574 -544 6% -1,150Profit before loan losses 290 268 8% 253 15% 558 505 10% 1,005
Net loan losses -66 -4 -38 74% -70 -44 59% -716Gains/losses on disposal of property, equipment and intangible assets 2 6 -67% 1 100% 8 1 7Operating profit 226 270 -16% 216 5% 496 462 7% 296Profit allocation 24 24 0% 18 33% 48 37 30% 85Operating profit after profit allocation 250 294 -15% 234 7% 544 499 9% 381
Internal income -86 -88 2% -95 9% -174 -199 13% -334
Cost/income ratio, % 47.7 49.7 49.8 48.6 50.1 51.3
Loan loss ratio, % 0.27 0.02 0.18 0.14 0.10 0.85
Allocated capital 5,535 6,382 -13% 6,146 -10% 5,535 6,146 -10% 6,221
Return on allocated capital, % 14.1 14.4 11.9 14.3 12.8 4.8
Average number of employees 605 611 -1% 626 -3% 608 626 -3% 624
Number of branches 57 57 0% 57 0% 57 57 0% 57
Average volumes, DKK bnQ2
2017Q1
2017 ChangeQ2
2016 ChangeJan-Jun
2017Jan-Jun
2016 ChangeFull year
2016
Loans to the public
Household 43.8 43.4 1% 40.1 9% 43.6 39.6 10% 40.8
Corporate 28.8 29.6 -3% 28.8 0% 29.2 28.7 2% 28.8Total 72.6 73.0 -1% 68.9 5% 72.8 68.3 7% 69.6
Deposits and borrowing from the public
Household 12.9 12.2 6% 12.0 8% 12.5 11.6 8% 11.9
Corporate 18.6 18.5 1% 13.5 38% 18.6 15.3 22% 15.7Total 31.5 30.7 3% 25.5 24% 31.1 26.9 16% 27.6
INTERIM REPORT JANUARY – JUNE 2017
14 Handelsbanken
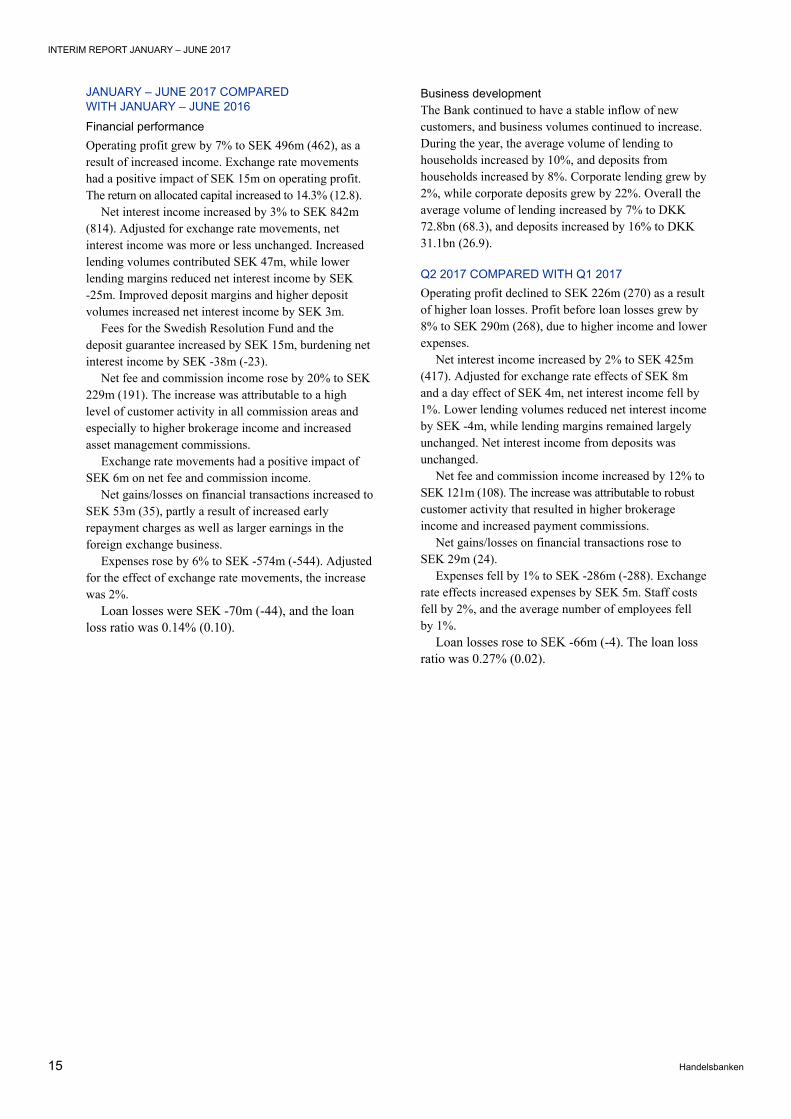
JANUARY – JUNE 2017 COMPARED WITH JANUARY – JUNE 2016
Financial performance Operating profit grew by 7% to SEK 496m (462), as a result of increased income. Exchange rate movements had a positive impact of SEK 15m on operating profit. The return on allocated capital increased to 14.3% (12.8).
Net interest income increased by 3% to SEK 842m (814). Adjusted for exchange rate movements, net interest income was more or less unchanged. Increased lending volumes contributed SEK 47m, while lower lending margins reduced net interest income by SEK -25m. Improved deposit margins and higher deposit volumes increased net interest income by SEK 3m.
Fees for the Swedish Resolution Fund and the deposit guarantee increased by SEK 15m, burdening net interest income by SEK -38m (-23).
Net fee and commission income rose by 20% to SEK 229m (191). The increase was attributable to a high level of customer activity in all commission areas and especially to higher brokerage income and increased asset management commissions.
Exchange rate movements had a positive impact of SEK 6m on net fee and commission income.
Net gains/losses on financial transactions increased to SEK 53m (35), partly a result of increased early repayment charges as well as larger earnings in the foreign exchange business.
Expenses rose by 6% to SEK -574m (-544). Adjusted for the effect of exchange rate movements, the increase was 2%.
Loan losses were SEK -70m (-44), and the loan loss ratio was 0.14% (0.10).
Business development The Bank continued to have a stable inflow of new customers, and business volumes continued to increase. During the year, the average volume of lending to households increased by 10%, and deposits from households increased by 8%. Corporate lending grew by 2%, while corporate deposits grew by 22%. Overall the average volume of lending increased by 7% to DKK 72.8bn (68.3), and deposits increased by 16% to DKK 31.1bn (26.9).
Q2 2017 COMPARED WITH Q1 2017Operating profit declined to SEK 226m (270) as a result of higher loan losses. Profit before loan losses grew by 8% to SEK 290m (268), due to higher income and lower expenses.
Net interest income increased by 2% to SEK 425m (417). Adjusted for exchange rate effects of SEK 8m and a day effect of SEK 4m, net interest income fell by 1%. Lower lending volumes reduced net interest income by SEK -4m, while lending margins remained largely unchanged. Net interest income from deposits was unchanged.
Net fee and commission income increased by 12% to SEK 121m (108). The increase was attributable to robust customer activity that resulted in higher brokerage income and increased payment commissions.
Net gains/losses on financial transactions rose to SEK 29m (24).
Expenses fell by 1% to SEK -286m (-288). Exchange rate effects increased expenses by SEK 5m. Staff costs fell by 2%, and the average number of employees fell by 1%.
Loan losses rose to SEK -66m (-4). The loan loss ratio was 0.27% (0.02).
15 Handelsbanken
INTERIM REPORT JANUARY – JUNE 2017

INTERIM REPORT JANUARY – JUNE 2017
15 Handelsbanken
Handelsbanken Finland Handelsbanken Finland consists of the branch operations in Finland, which are organised as a regional bank, as well as Handelsbanken Finans’s and Stadshypotek’s operations in Finland. At Handelsbanken, the branches are the base of all operations, with responsibility for all customers of the Bank. The regional bank offers a full range of banking services at 45 branches throughout Finland. Handelsbanken Finans offers finance company services and works through the Bank’s branches.
INCOME STATEMENT
BUSINESS VOLUMES
SEK mQ2
2017Q1
2017 ChangeQ2
2016 ChangeJan-Jun
2017Jan-Jun
2016 ChangeFull year
2016
Net interest income 291 292 0% 294 -1% 583 612 -5% 1,218
Net fee and commission income 121 113 7% 102 19% 234 195 20% 419
Net gains/losses on financial transactions 13 14 -7% 45 -71% 27 58 -53% 87
Other income 6 4 50% 3 100% 10 6 67% 10Total income 431 423 2% 444 -3% 854 871 -2% 1,734
Staff costs -100 -94 6% -95 5% -194 -185 5% -380
Other expenses -44 -42 5% -50 -12% -86 -120 -28% -210
Internal purchased and sold services -78 -73 7% -60 30% -151 -118 28% -239Depreciation, amortisation and impairments of property, equipment and intangible assets -5 -4 25% -3 67% -9 -6 50% -14Total expenses -227 -213 7% -208 9% -440 -429 3% -843Profit before loan losses 204 210 -3% 236 -14% 414 442 -6% 891
Net loan losses -15 3 -11 36% -12 -34 -65% -36Gains/losses on disposal of property, equipment and intangible assets 0 - 0 0 0 0Operating profit 189 213 -11% 225 -16% 402 408 -1% 855Profit allocation 38 32 19% 30 27% 70 62 13% 131Operating profit after profit allocation 227 245 -7% 255 -11% 472 470 0% 986
Internal income -87 -87 0% -62 -40% -174 -147 -18% -262
Cost/income ratio, % 48.4 46.8 43.9 47.6 46.0 45.2
Loan loss ratio, % 0.05 -0.01 0.04 0.02 0.06 0.03
Allocated capital 5,283 6,169 -14% 5,568 -5% 5,283 5,568 -5% 6,252
Return on allocated capital, % 13.4 12.4 14.3 12.9 12.7 13.0
Average number of employees 505 482 5% 496 2% 493 492 0% 491
Number of branches 45 45 0% 45 0% 45 45 0% 45
Average volumes, EUR mQ2
2017Q1
2017 ChangeQ2
2016 ChangeJan-Jun
2017Jan-Jun
2016 ChangeFull year
2016
Loans to the public
Household 4,053 4,024 1% 3,952 3% 4,039 3,952 2% 3,975
Corporate 9,061 8,922 2% 8,733 4% 8,992 8,738 3% 8,761Total 13,114 12,946 1% 12,685 3% 13,031 12,690 3% 12,736
Deposits and borrowing from the public
Household 1,642 1,625 1% 1,432 15% 1,633 1,406 16% 1,451
Corporate 2,556 2,771 -8% 1,766 45% 2,663 1,909 39% 1,991Total 4,198 4,396 -5% 3,198 31% 4,296 3,315 30% 3,442
16 Handelsbanken
INTERIM REPORT JANUARY – JUNE 2017

INTERIM REPORT JANUARY – JUNE 2017
15 Handelsbanken
Handelsbanken Finland Handelsbanken Finland consists of the branch operations in Finland, which are organised as a regional bank, as well as Handelsbanken Finans’s and Stadshypotek’s operations in Finland. At Handelsbanken, the branches are the base of all operations, with responsibility for all customers of the Bank. The regional bank offers a full range of banking services at 45 branches throughout Finland. Handelsbanken Finans offers finance company services and works through the Bank’s branches.
INCOME STATEMENT
BUSINESS VOLUMES
SEK mQ2
2017Q1
2017 ChangeQ2
2016 ChangeJan-Jun
2017Jan-Jun
2016 ChangeFull year
2016
Net interest income 291 292 0% 294 -1% 583 612 -5% 1,218
Net fee and commission income 121 113 7% 102 19% 234 195 20% 419
Net gains/losses on financial transactions 13 14 -7% 45 -71% 27 58 -53% 87
Other income 6 4 50% 3 100% 10 6 67% 10Total income 431 423 2% 444 -3% 854 871 -2% 1,734
Staff costs -100 -94 6% -95 5% -194 -185 5% -380
Other expenses -44 -42 5% -50 -12% -86 -120 -28% -210
Internal purchased and sold services -78 -73 7% -60 30% -151 -118 28% -239Depreciation, amortisation and impairments of property, equipment and intangible assets -5 -4 25% -3 67% -9 -6 50% -14Total expenses -227 -213 7% -208 9% -440 -429 3% -843Profit before loan losses 204 210 -3% 236 -14% 414 442 -6% 891
Net loan losses -15 3 -11 36% -12 -34 -65% -36Gains/losses on disposal of property, equipment and intangible assets 0 - 0 0 0 0Operating profit 189 213 -11% 225 -16% 402 408 -1% 855Profit allocation 38 32 19% 30 27% 70 62 13% 131Operating profit after profit allocation 227 245 -7% 255 -11% 472 470 0% 986
Internal income -87 -87 0% -62 -40% -174 -147 -18% -262
Cost/income ratio, % 48.4 46.8 43.9 47.6 46.0 45.2
Loan loss ratio, % 0.05 -0.01 0.04 0.02 0.06 0.03
Allocated capital 5,283 6,169 -14% 5,568 -5% 5,283 5,568 -5% 6,252
Return on allocated capital, % 13.4 12.4 14.3 12.9 12.7 13.0
Average number of employees 505 482 5% 496 2% 493 492 0% 491
Number of branches 45 45 0% 45 0% 45 45 0% 45
Average volumes, EUR mQ2
2017Q1
2017 ChangeQ2
2016 ChangeJan-Jun
2017Jan-Jun
2016 ChangeFull year
2016
Loans to the public
Household 4,053 4,024 1% 3,952 3% 4,039 3,952 2% 3,975
Corporate 9,061 8,922 2% 8,733 4% 8,992 8,738 3% 8,761Total 13,114 12,946 1% 12,685 3% 13,031 12,690 3% 12,736
Deposits and borrowing from the public
Household 1,642 1,625 1% 1,432 15% 1,633 1,406 16% 1,451
Corporate 2,556 2,771 -8% 1,766 45% 2,663 1,909 39% 1,991Total 4,198 4,396 -5% 3,198 31% 4,296 3,315 30% 3,442
INTERIM REPORT JANUARY – JUNE 2017
16 Handelsbanken
JANUARY – JUNE 2017 COMPARED WITH JANUARY – JUNE 2016
Financial performance Operating profit decreased by 1% to SEK 402m (408). Exchange rate effects increased profit by SEK 12m. The return on allocated capital rose slightly to 12.9% (12.7).
Income fell by 2%. Net interest income declined by 5% to SEK 583m (612). Reduced margins on lending had a negative impact of SEK -53m on net interest income. At the same time, higher lending volumes had a positive impact of SEK 8m. Government fees to the Resolution Fund and the deposit guarantee reduced net interest income by SEK -53m (-27). Exchange rate movements increased net interest income by SEK 19m.
Net fee and commission income rose by 20% to SEK 234m (195), due to higher payment commissions and rising commissions on deposits and lending. The savings business also developed favourably.
Net gains/losses on financial transactions decreased to SEK 27m (58), chiefly because the period of comparison included one-off income related to the sale of Visa Europe.
Total expenses rose by 3% to SEK -440m (-429). Adjusted for movements in exchange rates, expenses fell 1%. Staff costs increased by 5%, equivalent to an increase of almost 3% expressed in local currency. The total of other expenses and internal costs for services bought and sold were largely unchanged. The average number of employees totalled 493 (492).
Loan losses were SEK -12m (-34), and the loan loss ratio decreased to 0.02% (0.06).
Business development The average volume of deposits from households was 16% more than in the corresponding period of the preceding year, while lending to households grew by 2%.
The average volume of corporate deposits climbed by 39%, while corporate lending grew by 3% compared with the corresponding period in the preceding year.
Q2 2017 COMPARED WITH Q1 2017 Operating profit decreased by 11% to SEK 189m (213), chiefly due to higher loan losses. Expressed in local currency, profit before loan losses decreased by 4%.
Net interest income was largely unchanged at SEK 291m (292). Adjusted for exchange rate effects and fewer days in the comparison quarter, net interest income fell by -3%.
Net fee and commission income grew by 7% to SEK 121m (113), due to higher payment commissions.
Net gains/losses on financial transactions were largely unchanged at SEK 13m (14).
Expenses increased by 7% to SEK -227m (-213). Adjusted for exchange rate movements, expenses expressed in local currency increased by 4%.
Loan losses were SEK -15m, compared to net recoveries of SEK 3m in the preceding quarter. The loan loss ratio was 0.05% (-0.01).
.
17 Handelsbanken
INTERIM REPORT JANUARY – JUNE 2017

INTERIM REPORT JANUARY – JUNE 2017
17 Handelsbanken
Handelsbanken Norway Handelsbanken Norway consists of the branch operations in Norway, which are organised as a regional bank, as well as Stadshypotek’s operations in Norway. At Handelsbanken, the branches are the base of all operations, with responsibility for all customers of the Bank. The regional bank offers a full range of banking services at 49 branches throughout Norway.
INCOME STATEMENT
BUSINESS VOLUMES
SEK mQ2
2017Q1
2017 ChangeQ2
2016 ChangeJan-Jun
2017Jan-Jun
2016 ChangeFull year
2016
Net interest income 898 885 1% 797 13% 1,783 1,566 14% 3,355
Net fee and commission income 102 103 -1% 91 12% 205 175 17% 381
Net gains/losses on financial transactions 19 27 -30% 30 -37% 46 68 -32% 114
Other income 6 4 50% 68 -91% 10 72 -86% 81Total income 1,025 1,019 1% 986 4% 2,044 1,881 9% 3,931
Staff costs -192 15 -158 22% -177 -321 -45% -676
Other expenses -53 -54 -2% -50 6% -107 -98 9% -206
Internal purchased and sold services -103 -97 6% -90 14% -200 -176 14% -379Depreciation, amortisation and impairments of property, equipment and intangible assets -3 -4 -25% 4 -7 1 -8Total expenses -351 -140 151% -294 19% -491 -594 -17% -1,269Profit before loan losses 674 879 -23% 692 -3% 1,553 1,287 21% 2,662
Net loan losses -56 -46 22% -64 -13% -102 -167 -39% -347Gains/losses on disposal of property, equipment and intangible assets 0 0 0% 0 0 0 0Operating profit 618 833 -26% 628 -2% 1,451 1,120 30% 2,315Profit allocation 23 21 10% 16 44% 44 39 13% 91
Operating profit after profit allocation 641 854 -25% 644 0% 1,495 1,159 29% 2,406
Internal income -618 -666 7% -558 -11% -1,284 -1,242 -3% -2,463
Cost/income ratio, % 33.5 13.5 29.3 23.5 30.9 31.6
Loan loss ratio, % 0.09 0.08 0.12 0.08 0.16 0.17
Allocated capital 15,521 16,808 -8% 12,870 21% 15,521 12,870 21% 15,883
Return on allocated capital, % 12.9 15.9 15.6 14.4 13.8 13.3
Average number of employees 662 662 0% 658 1% 662 661 0% 668
Number of branches 49 49 0% 50 -2% 49 50 -2% 50
Average volumes, NOK bnQ2
2017Q1
2017 ChangeQ2
2016 ChangeJan-Jun
2017Jan-Jun
2016 ChangeFull year
2016
Loans to the public
Household 88.4 88.0 0% 85.3 4% 88.2 84.8 4% 85.9
Corporate 148.7 145.8 2% 142.7 4% 147.3 141.0 4% 143.1Total 237.1 233.8 1% 228.0 4% 235.5 225.8 4% 229.0
Deposits and borrowing from the public
Household 19.7 19.6 1% 19.1 3% 19.6 18.9 4% 19.3
Corporate 49.0 48.8 0% 44.2 11% 48.9 42.5 15% 46.3Total 68.7 68.4 0% 63.3 9% 68.5 61.4 12% 65.6
18 Handelsbanken
INTERIM REPORT JANUARY – JUNE 2017

INTERIM REPORT JANUARY – JUNE 2017
17 Handelsbanken
Handelsbanken Norway Handelsbanken Norway consists of the branch operations in Norway, which are organised as a regional bank, as well as Stadshypotek’s operations in Norway. At Handelsbanken, the branches are the base of all operations, with responsibility for all customers of the Bank. The regional bank offers a full range of banking services at 49 branches throughout Norway.
INCOME STATEMENT
BUSINESS VOLUMES
SEK mQ2
2017Q1
2017 ChangeQ2
2016 ChangeJan-Jun
2017Jan-Jun
2016 ChangeFull year
2016
Net interest income 898 885 1% 797 13% 1,783 1,566 14% 3,355
Net fee and commission income 102 103 -1% 91 12% 205 175 17% 381
Net gains/losses on financial transactions 19 27 -30% 30 -37% 46 68 -32% 114
Other income 6 4 50% 68 -91% 10 72 -86% 81Total income 1,025 1,019 1% 986 4% 2,044 1,881 9% 3,931
Staff costs -192 15 -158 22% -177 -321 -45% -676
Other expenses -53 -54 -2% -50 6% -107 -98 9% -206
Internal purchased and sold services -103 -97 6% -90 14% -200 -176 14% -379Depreciation, amortisation and impairments of property, equipment and intangible assets -3 -4 -25% 4 -7 1 -8Total expenses -351 -140 151% -294 19% -491 -594 -17% -1,269Profit before loan losses 674 879 -23% 692 -3% 1,553 1,287 21% 2,662
Net loan losses -56 -46 22% -64 -13% -102 -167 -39% -347Gains/losses on disposal of property, equipment and intangible assets 0 0 0% 0 0 0 0Operating profit 618 833 -26% 628 -2% 1,451 1,120 30% 2,315Profit allocation 23 21 10% 16 44% 44 39 13% 91
Operating profit after profit allocation 641 854 -25% 644 0% 1,495 1,159 29% 2,406
Internal income -618 -666 7% -558 -11% -1,284 -1,242 -3% -2,463
Cost/income ratio, % 33.5 13.5 29.3 23.5 30.9 31.6
Loan loss ratio, % 0.09 0.08 0.12 0.08 0.16 0.17
Allocated capital 15,521 16,808 -8% 12,870 21% 15,521 12,870 21% 15,883
Return on allocated capital, % 12.9 15.9 15.6 14.4 13.8 13.3
Average number of employees 662 662 0% 658 1% 662 661 0% 668
Number of branches 49 49 0% 50 -2% 49 50 -2% 50
Average volumes, NOK bnQ2
2017Q1
2017 ChangeQ2
2016 ChangeJan-Jun
2017Jan-Jun
2016 ChangeFull year
2016
Loans to the public
Household 88.4 88.0 0% 85.3 4% 88.2 84.8 4% 85.9
Corporate 148.7 145.8 2% 142.7 4% 147.3 141.0 4% 143.1Total 237.1 233.8 1% 228.0 4% 235.5 225.8 4% 229.0
Deposits and borrowing from the public
Household 19.7 19.6 1% 19.1 3% 19.6 18.9 4% 19.3
Corporate 49.0 48.8 0% 44.2 11% 48.9 42.5 15% 46.3Total 68.7 68.4 0% 63.3 9% 68.5 61.4 12% 65.6
INTERIM REPORT JANUARY – JUNE 2017
18 Handelsbanken
JANUARY – JUNE 2017 COMPARED WITH JANUARY – JUNE 2016
Financial performance Operating profit increased by 30% to SEK 1,451m (1,120). It was affected by a non-recurring item in the first quarter which reduced staff costs by SEK 206m, as a result of the transition to a defined contribution pension plan in the Norwegian operations. Lower loan losses and exchange rate movements also had a positive impact on profit. The period of comparison included non-recurring items resulting from the sale of Visa Europe. Adjusted for the aforementioned items, profit before loan losses improved by 6% expressed in local currency.
Return on allocated capital was 14.4% (13.8). Adjusted for exchange rate effects, income rose by
3%. Net interest income increased by SEK 217m, or 14%, to SEK 1,783m (1,566), of which SEK 88m was attributable to exchange rate movements. Lending margins rose by SEK 43m, while increased lending volumes had a positive effect of SEK 32m on net interest income. Improved deposit margins and higher deposits had a positive effect of SEK 25m on net interest income. The fees for the Swedish Resolution Fund and the deposit guarantee reduced net interest income by SEK -97m (-53).
Net fee and commission income increased by 17% to SEK 205m (175). Adjusted for exchange rate movements, net fee and commission income rose by 11%, chiefly due to higher fund management commissions.
Net gains/losses on financial transactions decreased by 32% to SEK 46m (68). The decrease was chiefly attributable to capital gains in the period of comparison related to the sale of Visa Europe.
Adjusted for the aforementioned transition to a defined contribution pension plan, staff costs rose by SEK 62m, or 19%, of which SEK 20m was attributable to exchange rate effects. The new financial sector tax in Norway – a 5% charge payable on wage costs – had an impact of SEK -17m on staff costs. Adjusted for these effects, staff costs increased by 8% compared to the corresponding period in the preceding year.
Loan losses fell to SEK -102m (-167), and the loan loss ratio fell to 0.08% (0.16).
Business development Business volumes continued to grow during the first six months. The average volume of deposits from households climbed by 4% compared to the corresponding period in the preceding year, while lending to households grew by 4%. The average volume of corporate lending increased by 4%, while corporate deposits grew by 15%.
In total, the average volume of lending rose by 4% to NOK 235.5bn (225.8), while total deposits rose by 12% to NOK 68.5bn (61.4).
Handelsbanken has 49 branches (50) in Norway.
Q2 2017 COMPARED WITH Q1 2017 Operating profit decreased by SEK 215m to SEK 618m (833), of which SEK 206m was attributable to the non-recurring item in the preceding quarter that resulted from the transition to a defined contribution pension plan. Exchange rate effects had a negative impact of SEK 17m on operating profit. Adjusted for both these effects, operating profit rose by just over 1%.
Net interest income rose by 1%, or SEK 13m, to SEK 898m (885). Exchange rate movements had a negative impact of SEK -19m, while fewer days in the preceding quarter had a positive impact of SEK 8m on net interest income during the second quarter. Higher lending margins contributed SEK 20m, and rising lending volumes SEK 9m. Net interest on deposits declined by SEK -9m, chiefly due to lower deposit margins.
Net fee and commission income was largely unchanged at SEK 102m (103).
Net gains/losses on financial transactions decreased to SEK 19m (27), chiefly as a result of weaker profits in the foreign exchange business.
Expenses totalled SEK -351m (-140). Adjusted for the non-recurring item that reduced staff costs for the preceding quarter by SEK 206m and for exchange rate effects of SEK 3m, expenses increased by 2%.
Loan losses increased to SEK -56m (-46), and the loan loss ratio was 0.09% (0.08).
19 Handelsbanken
INTERIM REPORT JANUARY – JUNE 2017

INTERIM REPORT JANUARY – JUNE 2017
19 Handelsbanken
Handelsbanken the Netherlands Handelsbanken the Netherlands consists of the branch operations in the Netherlands, which are organised as a regional bank, as well as asset management operations in Optimix Vermogensbeheer. The regional bank offers banking services at 27 branches throughout the Netherlands.
INCOME STATEMENT
BUSINESS VOLUMES
SEK mQ2
2017Q1
2017 ChangeQ2
2016 ChangeJan-Jun
2017Jan-Jun
2016 ChangeFull year
2016
Net interest income 135 125 8% 100 35% 260 195 33% 438
Net fee and commission income 33 32 3% 6 450% 65 11 491% 75
Net gains/losses on financial transactions 3 2 50% 0 5 1 400% 5
Share of profit of associates 1 1 0% - 2 -
Other income 0 0 0% - 0 - 1Total income 172 160 7% 106 62% 332 207 60% 521
Staff costs -74 -67 10% -45 64% -141 -89 58% -210
Other expenses -20 -18 11% -16 25% -38 -24 58% -60
Internal purchased and sold services -24 -22 9% -19 26% -46 -39 18% -77Depreciation, amortisation and impairments of property, equipment and intangible assets -3 -2 50% -2 50% -5 -3 67% -7Total expenses -121 -109 11% -82 48% -230 -155 48% -354Profit before loan losses 51 51 0% 24 113% 102 52 96% 167
Net loan losses 2 -2 1 0 1 -100% 0Gains/losses on disposal of property, equipment and intangible assets - - - - - -Operating profit 53 49 8% 25 112% 102 53 92% 167Profit allocation 2 0 2 0% 2 2 0% 3Operating profit after profit allocation 55 49 12% 27 104% 104 55 89% 170
Internal income -62 -60 -3% -56 -11% -122 -108 -13% -210
Cost/income ratio, % 69.5 68.1 75.9 68.9 74.2 67.6
Loan loss ratio, % -0.02 0.02 -0.02 0.00 -0.01 0.00
Allocated capital 1,375 1,276 8% 956 44% 1,375 956 44% 1,251
Return on allocated capital, % 12.4 12.0 8.6 12.2 9.2 12.5
Average number of employees 274 259 6% 188 46% 266 185 44% 206
Number of branches 27 26 4% 23 17% 27 23 17% 25
Average volumes, EUR mQ2
2017Q1
2017 ChangeQ2
2016 ChangeJan-Jun
2017Jan-Jun
2016 ChangeFull year
2016
Loans to the public
Household 1,891 1,780 6% 1,367 38% 1,836 1,302 41% 1,434
Corporate 1,717 1,695 1% 1,397 23% 1,706 1,335 28% 1,519Total 3,608 3,475 4% 2,764 31% 3,542 2,637 34% 2,953
Deposits and borrowing from the public
Household 84 78 8% 58 45% 81 55 47% 62
Corporate 727 768 -5% 440 65% 748 424 76% 420Total 811 846 -4% 498 63% 829 479 73% 482
20 Handelsbanken
INTERIM REPORT JANUARY – JUNE 2017

INTERIM REPORT JANUARY – JUNE 2017
19 Handelsbanken
Handelsbanken the Netherlands Handelsbanken the Netherlands consists of the branch operations in the Netherlands, which are organised as a regional bank, as well as asset management operations in Optimix Vermogensbeheer. The regional bank offers banking services at 27 branches throughout the Netherlands.
INCOME STATEMENT
BUSINESS VOLUMES
SEK mQ2
2017Q1
2017 ChangeQ2
2016 ChangeJan-Jun
2017Jan-Jun
2016 ChangeFull year
2016
Net interest income 135 125 8% 100 35% 260 195 33% 438
Net fee and commission income 33 32 3% 6 450% 65 11 491% 75
Net gains/losses on financial transactions 3 2 50% 0 5 1 400% 5
Share of profit of associates 1 1 0% - 2 -
Other income 0 0 0% - 0 - 1Total income 172 160 7% 106 62% 332 207 60% 521
Staff costs -74 -67 10% -45 64% -141 -89 58% -210
Other expenses -20 -18 11% -16 25% -38 -24 58% -60
Internal purchased and sold services -24 -22 9% -19 26% -46 -39 18% -77Depreciation, amortisation and impairments of property, equipment and intangible assets -3 -2 50% -2 50% -5 -3 67% -7Total expenses -121 -109 11% -82 48% -230 -155 48% -354Profit before loan losses 51 51 0% 24 113% 102 52 96% 167
Net loan losses 2 -2 1 0 1 -100% 0Gains/losses on disposal of property, equipment and intangible assets - - - - - -Operating profit 53 49 8% 25 112% 102 53 92% 167Profit allocation 2 0 2 0% 2 2 0% 3Operating profit after profit allocation 55 49 12% 27 104% 104 55 89% 170
Internal income -62 -60 -3% -56 -11% -122 -108 -13% -210
Cost/income ratio, % 69.5 68.1 75.9 68.9 74.2 67.6
Loan loss ratio, % -0.02 0.02 -0.02 0.00 -0.01 0.00
Allocated capital 1,375 1,276 8% 956 44% 1,375 956 44% 1,251
Return on allocated capital, % 12.4 12.0 8.6 12.2 9.2 12.5
Average number of employees 274 259 6% 188 46% 266 185 44% 206
Number of branches 27 26 4% 23 17% 27 23 17% 25
Average volumes, EUR mQ2
2017Q1
2017 ChangeQ2
2016 ChangeJan-Jun
2017Jan-Jun
2016 ChangeFull year
2016
Loans to the public
Household 1,891 1,780 6% 1,367 38% 1,836 1,302 41% 1,434
Corporate 1,717 1,695 1% 1,397 23% 1,706 1,335 28% 1,519Total 3,608 3,475 4% 2,764 31% 3,542 2,637 34% 2,953
Deposits and borrowing from the public
Household 84 78 8% 58 45% 81 55 47% 62
Corporate 727 768 -5% 440 65% 748 424 76% 420Total 811 846 -4% 498 63% 829 479 73% 482
INTERIM REPORT JANUARY – JUNE 2017
20 Handelsbanken
JANUARY – JUNE 2017 COMPARED WITH JANUARY – JUNE 2016
Financial performance Operating profit improved by 92% to SEK 102m (53), chiefly due to continuing growth in business volumes. Income rose by 60%, while expenses increased by 48%. Adjusted for exchange rate movements, operating profit improved by 83% expressed in local currency. Return on allocated capital was 12.2% (9.2).
Net interest income increased by 33% to SEK 260m (195). Increased lending volumes contributed SEK 60m, while lower lending margins reduced net interest income by SEK -7m. Higher deposit volumes and improved deposit margins increased net interest income by SEK 4m.
Net fee and commission income increased to SEK 65m (11), as a result of the acquisition of the Optimix asset management company, which has been a part of Handelsbanken the Netherlands since 1 September 2016 and contributed SEK 56m.
Expenses rose by 48% to SEK -230m (-155), as a result of the continuing expansion, including the acquisition of the Optimix asset management company. The C/I ratio improved to 68.9% (74.2), and the average number of employees increased by 44% to 266 (185).
Loan losses were SEK 0m (1), and the loan loss ratio was 0.00% (-0.01).
Business development The average volume of lending to households grew by 41% to EUR 1,836m (1,302), while deposits from households increased by 47% to EUR 81m (55). Corporate lending climbed 28% to EUR 1,706m (1,335). The average volume of corporate deposits rose by 76% to EUR 748m (424). Business volumes with small and medium-sized companies continued to grow.
In May, the Bank opened a branch in Alkmaar, bringing the total of Handelsbanken branches in the Netherlands to 27.
The Optimix asset management company was acquired on 1 September 2016. Assets under management totalled EUR 2.1bn at 30 June 2017, including the company’s own mutual funds.
Q2 2017 COMPARED WITH Q1 2017 Operating profit increased by 8% to SEK 53m (49), of which SEK 1m was due to exchange rate movements.
Income grew by 7% to SEK 172m (160). Net interest income rose by 8% to SEK 135m (125).
Net fee and commission income increased by 3% to SEK 33m (32).
Expenses rose by SEK 12m, or 11%, to SEK -121m (-109); this was attributable to a SEK 7m increase in staff costs. The average number of employees grew by 6% to 274 (259).
Loan losses consisted of net recoveries and equalled SEK 2m (-2). The loan loss ratio was -0.02% (0.02).
21 Handelsbanken
INTERIM REPORT JANUARY – JUNE 2017

INTERIM REPORT JANUARY – JUNE 2017
21 Handelsbanken
Handelsbanken Capital Markets Handelsbanken Capital Markets consists of Markets & Asset Management, Pension & Life, Handelsbanken International and Business Support. It has employees in 21 countries.
Markets & Asset Management offers a full range of products and services linked to risk management, securities, derivatives, mutual funds, research, debt capital markets and corporate finance, as well as co-ordinating the Bank’s offering in the savings area.
Pension & Life comprises the Handelsbanken Liv subsidiary and offers pension solutions and other insurance solutions for private and corporate customers.
Handelsbanken International encompasses the Bank’s branches and representative offices in 16 countries outside the Bank’s home markets, as well as the units for Financial Institutions (global banking collaborations) and Transaction Banking (cash management, trade finance and export finance).
A large part of the income from Handelsbanken Capital Markets’ products, including asset management commissions and income from currency conversions, is booked directly in branch operations at the branch with customer responsibility, and is thus not included in the income statement below.
INCOME STATEMENT
For more financial information about the different business areas within Handelsbanken Capital Markets, please see the Fact Book that is available at
handelsbanken.se/ireng.
SEK mQ2
2017Q1
2017 ChangeQ2
2016 ChangeJan-Jun
2017Jan-Jun
2016 ChangeFull year
2016
Net interest income 118 118 0% 134 -12% 236 271 -13% 557
Net fee and commission income 859 782 10% 771 11% 1,641 1,513 8% 3,081
Net gains/losses on financial transactions 228 399 -43% 338 -33% 627 578 8% 984
Risk result - insurance 53 36 47% 35 51% 89 111 -20% 142
Other income 3 7 -57% 1 200% 10 3 233% 8Total income 1,261 1,342 -6% 1,279 -1% 2,603 2,476 5% 4,772
Staff costs -588 -544 8% -597 -2% -1,132 -1,207 -6% -2,368
Other expenses -225 -223 1% -217 4% -448 -429 4% -871
Internal purchased and sold services 4 19 -79% -22 23 -22 -56Depreciation, amortisation and impairments of property, equipment and intangible assets -22 -18 22% -19 16% -40 -39 3% -76Total expenses -831 -766 8% -855 -3% -1,597 -1,697 -6% -3,371
Profit before loan losses 430 576 -25% 424 1% 1,006 779 29% 1,401
Net loan losses 11 -75 -7 -64 3 -49Gains/losses on disposal of property, equipment and intangible assets 0 - 0 0 0 0Operating profit 441 501 -12% 417 6% 942 782 20% 1,352Profit allocation -424 -379 12% -297 43% -803 -581 38% -1,342
Operating profit after profit allocation 17 122 -86% 120 -86% 139 201 -31% 10
Internal income -699 -750 7% -702 0% -1,449 -1,281 -13% -2,851
Cost/income ratio, % 99.3 79.5 87.1 88.7 89.6 98.3
Loan loss ratio, % -0.10 0.67 0.06 0.28 -0.01 0.10
Allocated capital 4,478 4,972 -10% 5,038 -11% 4,478 5,038 -11% 5,033
Return on allocated capital, % 1.1 7.7 7.5 4.6 6.3 0.2
Average number of employees 1,627 1,643 -1% 1,681 -3% 1,635 1,700 -4% 1,678
22 Handelsbanken
INTERIM REPORT JANUARY – JUNE 2017

INTERIM REPORT JANUARY – JUNE 2017
21 Handelsbanken
Handelsbanken Capital Markets Handelsbanken Capital Markets consists of Markets & Asset Management, Pension & Life, Handelsbanken International and Business Support. It has employees in 21 countries.
Markets & Asset Management offers a full range of products and services linked to risk management, securities, derivatives, mutual funds, research, debt capital markets and corporate finance, as well as co-ordinating the Bank’s offering in the savings area.
Pension & Life comprises the Handelsbanken Liv subsidiary and offers pension solutions and other insurance solutions for private and corporate customers.
Handelsbanken International encompasses the Bank’s branches and representative offices in 16 countries outside the Bank’s home markets, as well as the units for Financial Institutions (global banking collaborations) and Transaction Banking (cash management, trade finance and export finance).
A large part of the income from Handelsbanken Capital Markets’ products, including asset management commissions and income from currency conversions, is booked directly in branch operations at the branch with customer responsibility, and is thus not included in the income statement below.
INCOME STATEMENT
For more financial information about the different business areas within Handelsbanken Capital Markets, please see the Fact Book that is available at
handelsbanken.se/ireng.
SEK mQ2
2017Q1
2017 ChangeQ2
2016 ChangeJan-Jun
2017Jan-Jun
2016 ChangeFull year
2016
Net interest income 118 118 0% 134 -12% 236 271 -13% 557
Net fee and commission income 859 782 10% 771 11% 1,641 1,513 8% 3,081
Net gains/losses on financial transactions 228 399 -43% 338 -33% 627 578 8% 984
Risk result - insurance 53 36 47% 35 51% 89 111 -20% 142
Other income 3 7 -57% 1 200% 10 3 233% 8Total income 1,261 1,342 -6% 1,279 -1% 2,603 2,476 5% 4,772
Staff costs -588 -544 8% -597 -2% -1,132 -1,207 -6% -2,368
Other expenses -225 -223 1% -217 4% -448 -429 4% -871
Internal purchased and sold services 4 19 -79% -22 23 -22 -56Depreciation, amortisation and impairments of property, equipment and intangible assets -22 -18 22% -19 16% -40 -39 3% -76Total expenses -831 -766 8% -855 -3% -1,597 -1,697 -6% -3,371
Profit before loan losses 430 576 -25% 424 1% 1,006 779 29% 1,401
Net loan losses 11 -75 -7 -64 3 -49Gains/losses on disposal of property, equipment and intangible assets 0 - 0 0 0 0Operating profit 441 501 -12% 417 6% 942 782 20% 1,352Profit allocation -424 -379 12% -297 43% -803 -581 38% -1,342
Operating profit after profit allocation 17 122 -86% 120 -86% 139 201 -31% 10
Internal income -699 -750 7% -702 0% -1,449 -1,281 -13% -2,851
Cost/income ratio, % 99.3 79.5 87.1 88.7 89.6 98.3
Loan loss ratio, % -0.10 0.67 0.06 0.28 -0.01 0.10
Allocated capital 4,478 4,972 -10% 5,038 -11% 4,478 5,038 -11% 5,033
Return on allocated capital, % 1.1 7.7 7.5 4.6 6.3 0.2
Average number of employees 1,627 1,643 -1% 1,681 -3% 1,635 1,700 -4% 1,678
INTERIM REPORT JANUARY – JUNE 2017
22 Handelsbanken
JANUARY – JUNE 2017 COMPARED WITH JANUARY – JUNE 2016
Financial performance Operating profit increased by 20% to SEK 942m (782). Total income grew by 5% to SEK 2,603m (2,476). Net fee and commission income grew by 8% to SEK 1,641m (1,513), driven mainly by higher mutual fund commissions. Net gains/losses on financial transactions went up by 8% to SEK 627m (578).
Total expenses decreased by 6% to SEK -1,597m (-1,697). The decrease was mainly attributable to staff costs falling by 6% to SEK -1,132m (-1,207), partly as a result of a 4% fall in the average number of employees to 1,635 (1,700).
Loan losses amounted to SEK -64m (3), corresponding to a loan loss ratio of 0.28% (-0.01).
Business development Asset management operations continued to show a strong performance. In Sweden, net savings in Handelsbanken’s mutual funds during the first six months of 2017 amounted to SEK 10.8bn, corresponding to a market share of 18.1%. Net savings in the Bank’s mutual funds elsewhere in the Nordic region showed strong growth, increasing to SEK 4.4bn. Total net savings in the Group’s funds amounted to SEK 15bn. Xact Kapitalförvaltning remained the largest player as regards Nordic exchange-traded funds.
The total fund volume, including exchange-traded funds, increased by 10% from the beginning of the year to SEK 468bn (425). Total assets under management in the Group rose during the same period by 7% to SEK 582bn (542).
Morningstar, a mutual fund research company, ranked Handelsbanken’s mutual funds highest of the Nordic banks when it evaluated the 30 largest fund managers on the Swedish market. In addition, during the year, Lipper Fund Awards ranked four of the Bank’s funds as the best in their respective categories.
The Pension & Life business area showed positive performance, with its income increasing and expenses decreasing. The occupational pension area showed particularly strong performance, with a 30% increase in
premiums paid in. The net flow during the first six months was SEK 3.1bn. In the first half of 2017, the volume of assets under management by Handelsbanken Liv grew to SEK 133bn (122).
As of 1 July 2017, all the Bank’s global index funds track new, more sustainable indexes. This change of indexes means, among other things, that a large number of companies are excluded as investment alternatives for mutual funds.
Corporate Finance business showed a strong performance, and according to Mergermarket, the Bank was No.1 for M&A transactions involving Swedish companies.
The Bank’s business volumes in terms of capital market funding also showed strong performance. The Bank arranged a total of 69 bond issues during the quarter for a value of EUR 8.3bn.
The average volume of lending in Handelsbanken International, i.e. the operations outside the Bank’s home markets, totalled SEK 33.7bn (35.1). During the same period, deposits rose by 11% to SEK 49.0bn (44.2).
Q2 2017 COMPARED WITH Q1 2017 Operating profit fell by 12% to SEK 441m (501), due to lower income and higher expenses than in the preceding quarter. Total income fell by 6% to SEK 1,261m (1,342), as a result of higher net gains/losses on financial transactions during the quarter of comparison.
During the first quarter, net profit was positively affected by the market turbulence around the turn of the year, as the negative effects arising in Q4 2016 were reversed in early 2017 when the market returned to normal.
Total expenses rose by 8% to SEK -831m (-766), chiefly due to higher staff costs. Staff costs rose by 8%, mainly due to a non-recurring item in the preceding quarter that reduced staff costs in Norway due to the transition to a defined contribution pension plan. The average number of employees totalled 1,627 (1,643).
Loan losses consisted of net recoveries, and totalled SEK 11m (-75), corresponding to a loan loss ratio of -0.10% (0.67).
23 Handelsbanken
INTERIM REPORT JANUARY – JUNE 2017

INTERIM REPORT JANUARY – JUNE 2017
23 Handelsbanken
Other units not reported in the business segments Reported below are the income and expenses related to Treasury and the central staff functions, and also provisions to the Oktogonen profit-sharing foundation. Capital gains/losses, dividends, and other income and expenses that are not attributable to any of the segments are also reported here.
INCOME STATEMENT
JANUARY – JUNE 2017 COMPARED WITH JANUARY – JUNE 2016 Operating profit in other units not reported in the business segments amounted to SEK -352m (981). The provision for the Oktogonen profit-sharing foundation was resumed in the first quarter, and for the first six months it amounted to SEK 486m (-). Capital gains from the sale of shares totalling SEK 812m were included in the comparison period. The average number of employees rose to 1,966 (1,821), chiefly due to increased activity in IT development.
Q2 2017 COMPARED WITH Q1 2017 Operating profit declined to SEK -230m (-122), chiefly due to lower net gains/losses on financial transactions at Treasury, where the market turbulence around the turn of the year had a positive effect on the comparison period. The average number of employees totalled 2,003 (1,930).
SEK mQ2
2017Q1
2017 ChangeQ2
2016 ChangeJan-Jun
2017Jan-Jun
2016 ChangeFull year
2016
Net interest income 200 219 -9% 163 23% 419 355 18% 756
Net fee and commission income 5 18 -72% 5 0% 23 30 -23% 69
Net gains/losses on financial transactions -199 -112 -78% -226 12% -311 445 857
Share of profit of associates -4 -28 86% 13 -32 15 23
Other income 10 12 -17% 181 -94% 22 195 -89% 266Total income 12 109 -89% 136 -91% 121 1,040 -88% 1,971
Staff costs -763 -698 9% -459 66% -1,461 -928 57% -2,335
Other expenses -627 -663 -5% -557 13% -1,290 -1,092 18% -2,244
Internal purchased and sold services 1,208 1,195 1% 1,074 12% 2,403 2,085 15% 4,228Depreciation, amortisation and impairments of property, equipment and intangible assets -60 -65 -8% -67 -10% -125 -129 -3% -248Total expenses -242 -231 5% -9 -473 -64 -599
Profit before loan losses -230 -122 -89% 127 -352 976 1,372Net loan lossesGains/losses on disposal of property, equipment and intangible assets 0 0 0% 0 0 5 23Operating profit -230 -122 -89% 127 -352 981 1,395
Profit allocation - - 0 - 0 -Operating profit after profit allocation -230 -122 -89% 127 -352 981 1,395
Internal income 1,656 1,965 -16% 1,679 -1% 3,621 3,644 -1% 7,199
Average number of employees 2,003 1,930 4% 1,810 11% 1,966 1,821 8% 1,840
24 Handelsbanken
INTERIM REPORT JANUARY – JUNE 2017

INTERIM REPORT JANUARY – JUNE 2017
23 Handelsbanken
Other units not reported in the business segments Reported below are the income and expenses related to Treasury and the central staff functions, and also provisions to the Oktogonen profit-sharing foundation. Capital gains/losses, dividends, and other income and expenses that are not attributable to any of the segments are also reported here.
INCOME STATEMENT
JANUARY – JUNE 2017 COMPARED WITH JANUARY – JUNE 2016 Operating profit in other units not reported in the business segments amounted to SEK -352m (981). The provision for the Oktogonen profit-sharing foundation was resumed in the first quarter, and for the first six months it amounted to SEK 486m (-). Capital gains from the sale of shares totalling SEK 812m were included in the comparison period. The average number of employees rose to 1,966 (1,821), chiefly due to increased activity in IT development.
Q2 2017 COMPARED WITH Q1 2017 Operating profit declined to SEK -230m (-122), chiefly due to lower net gains/losses on financial transactions at Treasury, where the market turbulence around the turn of the year had a positive effect on the comparison period. The average number of employees totalled 2,003 (1,930).
SEK mQ2
2017Q1
2017 ChangeQ2
2016 ChangeJan-Jun
2017Jan-Jun
2016 ChangeFull year
2016
Net interest income 200 219 -9% 163 23% 419 355 18% 756
Net fee and commission income 5 18 -72% 5 0% 23 30 -23% 69
Net gains/losses on financial transactions -199 -112 -78% -226 12% -311 445 857
Share of profit of associates -4 -28 86% 13 -32 15 23
Other income 10 12 -17% 181 -94% 22 195 -89% 266Total income 12 109 -89% 136 -91% 121 1,040 -88% 1,971
Staff costs -763 -698 9% -459 66% -1,461 -928 57% -2,335
Other expenses -627 -663 -5% -557 13% -1,290 -1,092 18% -2,244
Internal purchased and sold services 1,208 1,195 1% 1,074 12% 2,403 2,085 15% 4,228Depreciation, amortisation and impairments of property, equipment and intangible assets -60 -65 -8% -67 -10% -125 -129 -3% -248Total expenses -242 -231 5% -9 -473 -64 -599
Profit before loan losses -230 -122 -89% 127 -352 976 1,372Net loan lossesGains/losses on disposal of property, equipment and intangible assets 0 0 0% 0 0 5 23Operating profit -230 -122 -89% 127 -352 981 1,395
Profit allocation - - 0 - 0 -Operating profit after profit allocation -230 -122 -89% 127 -352 981 1,395
Internal income 1,656 1,965 -16% 1,679 -1% 3,621 3,644 -1% 7,199
Average number of employees 2,003 1,930 4% 1,810 11% 1,966 1,821 8% 1,840
INTERIM REPORT JANUARY – JUNE 2017
24 Handelsbanken
KEY FIGURES – GROUP
THE HANDELSBANKEN SHARE
Q22017
Q12017
Q22016
Jan-Jun2017
Jan-Jun2016
Return on equity, total operations 12.9% 12.4% 14.2% 12.6% 13.7%Return on equity, continuing operations 12.9% 12.4% 14.2% 12.6% 13.7%
C/I ratio, continuing operations 46.9% 44.8% 44.5% 45.8% 47.2%C/I ratio, continuing operations, incl. loan losses 48.7% 46.8% 46.8% 47.7% 49.2%
Earnings per share, total operations, SEK 2.09 2.11 2.19 4.20 4.31 - after dilution 2.06 2.10 2.15 4.16 4.22
Ordinary dividend, SEK
Total dividend
Adjusted equity per share, SEK 68.82 66.77 62.83 68.82 62.83
Common equity tier 1 ratio, CRR 23.4% 23.8% 23.0% 23.4% 23.0%Total capital ratio, CRR 29.0% 29.7% 28.9% 29.0% 28.9%
Own funds in relation to capital requirement according to Basel I floor 148% 149% 142% 148% 142%
Average number of employees, continuing operations 11,687 11,584 11,716 11,636 11,775Number of branches, Sweden 423 425 472 423 472Number of branches outside Sweden 398 397 393 398 393
In addition to financial definitions according to IFRS, alternative performance measures are used to describe the performance of the underlying operations and to increase comparability between periods. For definitions and calculation of these performance measures, please see the Fact Book which is available at handelsbanken.se/ireng.
Q22017
Q12017
Q22016
Jan-Jun2017
Jan-Jun2016
Number of converted shares - 22,151 28,800,955 22,151 28,800,955Number of repurchased shares - - - - -
Holding of own shares in trading book, end of period - - - - -Number of outstanding shares after repurchases and deduction for trading book, end of period 1,944,173,551 1,944,173,551 1,935,847,037 1,944,173,551 1,935,847,037
Number of outstanding shares after dilution, end of period 1,975,025,212 1,975,278,248 1,975,789,501 1,975,025,212 1,975,789,501
Average number of shares converted during the period 22,151 17,718 12,852,916 19,947 6,426,458Average holdings of own shares (repurchased and holdings in trading book) - - - - -Average number of outstanding shares 1,944,173,551 1,944,169,118 1,919,898,998 1,944,171,347 1,913,472,540 - after dilution 1,975,278,248 1,974,290,244 1,976,193,169 1,974,290,244 1,972,745,117
Share price SHB class A, end of period, SEK 120.60 122.90 101.80 120.60 101.80Share price SHB class B, end of period, SEK 119.20 123.40 105.70 119.20 105.70Market capitalisation, end of period, SEK bn 234 239 197 234 197
25 Handelsbanken
INTERIM REPORT JANUARY – JUNE 2017

INTERIM REPORT JANUARY – JUNE 2017
25 Handelsbanken
Condensed set of financial statements – GroupINCOME STATEMENT – GROUP
EARNINGS PER SHARE – GROUP
SEK mQ2
2017Q1
2017 ChangeQ2
2016 ChangeJan-Jun
2017Jan-Jun
2016 ChangeFull year
2016
Interest income 10,398 10,210 2% 9,451 10% 20,608 19,787 4% 39,950
Interest expense -3,077 -3,129 -2% -2,643 16% -6,206 -6,184 0% -12,007
Net interest income Note 2 7,321 7,081 3% 6,808 8% 14,402 13,603 6% 27,943
Net fee and commission income Note 3 2,508 2,354 7% 2,280 10% 4,862 4,450 9% 9,156
Net gains/losses on financial transactions Note 4 317 547 -42% 523 -39% 864 1,685 -49% 3,066
Risk result - insurance 53 36 47% 35 51% 89 111 -20% 142
Other dividend income 11 2 450% 222 -95% 13 225 -94% 228
Share of profit of associates -3 -27 89% 13 -30 15 25
Other income 31 43 -28% 41 -24% 74 76 -3% 203
Total income 10,238 10,036 2% 9,922 3% 20,274 20,165 1% 40,763Staff costs -3,242 -2,918 11% -2,952 10% -6,160 -6,620 -7% -12,542
Other expenses Note 5 -1,410 -1,430 -1% -1,346 5% -2,840 -2,649 7% -5,401Depreciation, amortisation and impairment of property, equipment and intangible assets -145 -150 -3% -119 22% -295 -244 21% -495
Total expenses -4,797 -4,498 7% -4,417 9% -9,295 -9,513 -2% -18,438Profit before loan losses 5,441 5,538 -2% 5,505 -1% 10,979 10,652 3% 22,325Net loan losses Note 6 -186 -196 -5% -229 -19% -382 -416 -8% -1,724Gains/losses on disposal of property, equipment and intangible assets 2 5 -60% 1 100% 7 8 -13% 32
Operating profit 5,257 5,347 -2% 5,277 0% 10,604 10,244 4% 20,633Taxes -1,201 -1,236 -3% -1,091 10% -2,437 -2,020 21% -4,401Profit for the period from continuing operations 4,056 4,111 -1% 4,186 -3% 8,167 8,224 -1% 16,232Profit for the period pertaining to discontinued operations, after tax Note 7 - - 8 - 13 13
Profit for the period 4,056 4,111 -1% 4,194 -3% 8,167 8,237 -1% 16,245
Attributable to
Shareholders in Svenska Handelsbanken AB 4,056 4,111 -1% 4,194 -3% 8,167 8,236 -1% 16,244
Minority interest 0 0 0 0 1 1
Q22017
Q12017 Change
Q22016 Change
Jan-Jun2017
Jan-Jun2016 Change
Full year 2016
Profit for the year, attributable to shareholders in Svenska Handelsbanken AB 4,056 4,111 -1% 4,194 -3% 8,167 8,236 -1% 16,244- of which interest expense on convertible subordinated loan after tax -18 -31 -42% -41 -56% -49 -87 -44% -139
Average number of outstanding shares, million 1,944.2 1,944.2 1,919.9 1,944.2 1,913.5 1,927.1Average number of outstanding shares after dilution, million 1,975.3 1,974.3 1,976.2 1,974.3 1,972.7 1,972.7
Earnings per share, continuing operations, SEK 2.09 2.11 -1% 2.18 -4% 4.20 4.30 -2% 8.42 - after dilution 2.06 2.10 -2% 2.14 -4% 4.16 4.21 -1% 8.30
Earnings per share, discontinued operations, SEK - - 0.01 - 0.01 0.01 - after dilution - - 0.01 - 0.01 0.01
Earnings per share, total operations, SEK 2.09 2.11 -1% 2.19 -5% 4.20 4.31 -3% 8.43 - after dilution 2.06 2.10 -2% 2.15 -4% 4.16 4.22 -1% 8.31
Earnings per share after dilution are calculated by taking into account the effects of a conversion of outstanding convertible debt instruments. This means that the average number of shares is adjusted by potential shares and that the period’s earnings are adjusted by the period’s interest expense on the outstanding convertible debt instruments after tax.
26 Handelsbanken
INTERIM REPORT JANUARY – JUNE 2017

INTERIM REPORT JANUARY – JUNE 2017
25 Handelsbanken
Condensed set of financial statements – GroupINCOME STATEMENT – GROUP
EARNINGS PER SHARE – GROUP
SEK mQ2
2017Q1
2017 ChangeQ2
2016 ChangeJan-Jun
2017Jan-Jun
2016 ChangeFull year
2016
Interest income 10,398 10,210 2% 9,451 10% 20,608 19,787 4% 39,950
Interest expense -3,077 -3,129 -2% -2,643 16% -6,206 -6,184 0% -12,007
Net interest income Note 2 7,321 7,081 3% 6,808 8% 14,402 13,603 6% 27,943
Net fee and commission income Note 3 2,508 2,354 7% 2,280 10% 4,862 4,450 9% 9,156
Net gains/losses on financial transactions Note 4 317 547 -42% 523 -39% 864 1,685 -49% 3,066
Risk result - insurance 53 36 47% 35 51% 89 111 -20% 142
Other dividend income 11 2 450% 222 -95% 13 225 -94% 228
Share of profit of associates -3 -27 89% 13 -30 15 25
Other income 31 43 -28% 41 -24% 74 76 -3% 203
Total income 10,238 10,036 2% 9,922 3% 20,274 20,165 1% 40,763Staff costs -3,242 -2,918 11% -2,952 10% -6,160 -6,620 -7% -12,542
Other expenses Note 5 -1,410 -1,430 -1% -1,346 5% -2,840 -2,649 7% -5,401Depreciation, amortisation and impairment of property, equipment and intangible assets -145 -150 -3% -119 22% -295 -244 21% -495
Total expenses -4,797 -4,498 7% -4,417 9% -9,295 -9,513 -2% -18,438Profit before loan losses 5,441 5,538 -2% 5,505 -1% 10,979 10,652 3% 22,325Net loan losses Note 6 -186 -196 -5% -229 -19% -382 -416 -8% -1,724Gains/losses on disposal of property, equipment and intangible assets 2 5 -60% 1 100% 7 8 -13% 32
Operating profit 5,257 5,347 -2% 5,277 0% 10,604 10,244 4% 20,633Taxes -1,201 -1,236 -3% -1,091 10% -2,437 -2,020 21% -4,401Profit for the period from continuing operations 4,056 4,111 -1% 4,186 -3% 8,167 8,224 -1% 16,232Profit for the period pertaining to discontinued operations, after tax Note 7 - - 8 - 13 13
Profit for the period 4,056 4,111 -1% 4,194 -3% 8,167 8,237 -1% 16,245
Attributable to
Shareholders in Svenska Handelsbanken AB 4,056 4,111 -1% 4,194 -3% 8,167 8,236 -1% 16,244
Minority interest 0 0 0 0 1 1
Q22017
Q12017 Change
Q22016 Change
Jan-Jun2017
Jan-Jun2016 Change
Full year 2016
Profit for the year, attributable to shareholders in Svenska Handelsbanken AB 4,056 4,111 -1% 4,194 -3% 8,167 8,236 -1% 16,244- of which interest expense on convertible subordinated loan after tax -18 -31 -42% -41 -56% -49 -87 -44% -139
Average number of outstanding shares, million 1,944.2 1,944.2 1,919.9 1,944.2 1,913.5 1,927.1Average number of outstanding shares after dilution, million 1,975.3 1,974.3 1,976.2 1,974.3 1,972.7 1,972.7
Earnings per share, continuing operations, SEK 2.09 2.11 -1% 2.18 -4% 4.20 4.30 -2% 8.42 - after dilution 2.06 2.10 -2% 2.14 -4% 4.16 4.21 -1% 8.30
Earnings per share, discontinued operations, SEK - - 0.01 - 0.01 0.01 - after dilution - - 0.01 - 0.01 0.01
Earnings per share, total operations, SEK 2.09 2.11 -1% 2.19 -5% 4.20 4.31 -3% 8.43 - after dilution 2.06 2.10 -2% 2.15 -4% 4.16 4.22 -1% 8.31
Earnings per share after dilution are calculated by taking into account the effects of a conversion of outstanding convertible debt instruments. This means that the average number of shares is adjusted by potential shares and that the period’s earnings are adjusted by the period’s interest expense on the outstanding convertible debt instruments after tax.
INTERIM REPORT JANUARY – JUNE 2017
26 Handelsbanken
STATEMENT OF COMPREHENSIVE INCOME – GROUP
In the first half of 2017, other comprehensive income totalled SEK 71m (2,597) after tax. In individual periods, the results of all items within other comprehensive income may fluctuate due to changes in the discount rate, exchange rates and inflation.
At year-end, net pensions, net of pension obligations and plan assets, were a liability. At the end of the second quarter, net pensions were an asset. During the January–June period, other comprehensive income increased by SEK 2,597m (-856) after tax, related to defined benefit pension plans. The main reason for the change during the period is that the plan assets have increased in value since 31 December 2016. This has been offset to a certain extent by the pension obligations increasing as a result of a decrease in the discount rate for the Swedish pension obligations, to 2.30% from 2.40%, since 31 December 2016.
Most of the Group’s long-term funding is hedged using derivatives, where all cash flows are matched until maturity. Cash flow hedging manages the risk of variations in the cash flows related to changes in variable interest rates and currencies on lending and funding. The underlying funding and the asset which is being funded are measured at amortised cost, while the derivatives which are hedging these
items are measured at market value. The impact on profit/loss of the market valuation is reported under cash flow hedges. Over time, these values become zero at maturity for each individual hedge, but lead to volatility in other comprehensive income during their term. Changes in the value of hedge derivatives in cash flow hedges had an effect on other comprehensive income of SEK -580m (3,875) after tax. The value changes derived partly from exchange rate movements, but above all from increasing discount rates in foreign currency. During the period, SEK -4m (24) was reclassified to the income statement as a result of ineffectiveness.
Unrealised changes in the value of financial assets classified as available for sale had an effect on other comprehensive income of SEK 54m (-515) after tax during the year. The preceding year’s negative result was mainly due to gains from selling shares having been recognised in the income statement.
Unrealised exchange rate effects related to the restatement of foreign branches and subsidiaries to the Group’s presentation currency and the effect of hedging of net investments in foreign operations have affected other comprehensive income by SEK -2,000m (93) after tax during the year.
SEK mQ2
2017Q1
2017 ChangeQ2
2016 ChangeJan-Jun
2017Jan-Jun
2016 ChangeFull year
2016Profit for the period 4,056 4,111 -1% 4,194 -3% 8,167 8,237 -1% 16,245
Other comprehensive incomeItems that may not subsequently be reclassified to profit or lossDefined benefit plans 1,013 2,318 -56% -2,597 3,331 -1,096 3,993Taxes on items that cannot be reclassified into profit or loss -223 -511 56% 568 -734 240 -876Total items that may not subsequently be reclassified to profit or loss 790 1,807 -56% -2,029 2,597 -856 3,117
Items that can be reclassified into profit or lossCash flow hedges -1,070 336 1,442 -734 4,968 -3,145
Available-for-sale instruments 21 37 -43% 529 -96% 58 -572 -1,160
Translation differences for the period -869 -1,310 34% 1,063 -2,179 45 1,183
of which hedging net investment in foreign operations -24 -795 97% -10 -140% -819 -218 -276% -142
Taxes on items that can be reclassified into profit or loss 230 99 132% -316 329 -988 833
of which cash flow hedges 228 -74 -317 154 -1,093 692
of which available-for-sale instruments -2 -2 0% -1 -100% -4 57 110
of which hedging net investment in foreign operations 4 175 -98% 2 100% 179 48 273% 31
Total items that can be reclassified into profit or loss -1,688 -838 -101% 2,718 -2,526 3,453 -2,289
Total other comprehensive income for the period -898 969 689 71 2,597 -97% 828Total comprehensive income for the period 3,158 5,080 -38% 4,883 -35% 8,238 10,834 -24% 17,073
Attributable to
Shareholders in Svenska Handelsbanken AB 3,158 5,080 -38% 4,883 -35% 8,238 10,833 -24% 17,072 Minority interest 0 0 0% 0 0% 0 1 -100% 1
27 Handelsbanken
INTERIM REPORT JANUARY – JUNE 2017

INTERIM REPORT JANUARY – JUNE 2017
27 Handelsbanken
QUARTERLY PERFORMANCE – GROUP
SEK mQ2
2017Q1
2017Q4
2016Q3
2016Q2
2016
Interest income 10,398 10,210 10,220 9,943 9,451
Interest expense -3,077 -3,129 -2,921 -2,902 -2,643
Net interest income 7,321 7,081 7,299 7,041 6,808
Net fee and commission income 2,508 2,354 2,447 2,259 2,280
Net gains/losses on financial transactions 317 547 269 1,112 523
Risk result - insurance 53 36 6 25 35
Other dividend income 11 2 2 1 222
Share of profit of associates -3 -27 0 10 13
Other income 31 43 102 25 41
Total income 10,238 10,036 10,125 10,473 9,922Staff costs -3,242 -2,918 -2,981 -2,941 -2,952
Other expenses -1,410 -1,430 -1,518 -1,234 -1,346Depreciation, amortisation and impairment of property, equipment and intangible assets -145 -150 -114 -137 -119
Total expenses -4,797 -4,498 -4,613 -4,312 -4,417Profit before loan losses 5,441 5,538 5,512 6,161 5,505Net loan losses -186 -196 -832 -476 -229Gains/losses on disposal of property, equipment and intangible assets 2 5 18 6 1
Operating profit 5,257 5,347 4,698 5,691 5,277Taxes -1,201 -1,236 -1,254 -1,127 -1,091Profit for the period from continuing operations 4,056 4,111 3,444 4,564 4,186
Profit for the period pertaining to discontinued operations, after tax - - - - 8
Profit for the period 4,056 4,111 3,444 4,564 4,194
Earnings per share, continuing operations, SEK 2.09 2.11 1.77 2.36 2.18 - after dilution 2.06 2.10 1.76 2.32 2.14
Earnings per share, discontinued operations, SEK - - - - 0.01 - after dilution - - - - 0.01
Earnings per share, total operations, SEK 2.09 2.11 1.77 2.36 2.19 - after dilution 2.06 2.10 1.76 2.32 2.15
28 Handelsbanken
INTERIM REPORT JANUARY – JUNE 2017

INTERIM REPORT JANUARY – JUNE 2017
27 Handelsbanken
QUARTERLY PERFORMANCE – GROUP
SEK mQ2
2017Q1
2017Q4
2016Q3
2016Q2
2016
Interest income 10,398 10,210 10,220 9,943 9,451
Interest expense -3,077 -3,129 -2,921 -2,902 -2,643
Net interest income 7,321 7,081 7,299 7,041 6,808
Net fee and commission income 2,508 2,354 2,447 2,259 2,280
Net gains/losses on financial transactions 317 547 269 1,112 523
Risk result - insurance 53 36 6 25 35
Other dividend income 11 2 2 1 222
Share of profit of associates -3 -27 0 10 13
Other income 31 43 102 25 41
Total income 10,238 10,036 10,125 10,473 9,922Staff costs -3,242 -2,918 -2,981 -2,941 -2,952
Other expenses -1,410 -1,430 -1,518 -1,234 -1,346Depreciation, amortisation and impairment of property, equipment and intangible assets -145 -150 -114 -137 -119
Total expenses -4,797 -4,498 -4,613 -4,312 -4,417Profit before loan losses 5,441 5,538 5,512 6,161 5,505Net loan losses -186 -196 -832 -476 -229Gains/losses on disposal of property, equipment and intangible assets 2 5 18 6 1
Operating profit 5,257 5,347 4,698 5,691 5,277Taxes -1,201 -1,236 -1,254 -1,127 -1,091Profit for the period from continuing operations 4,056 4,111 3,444 4,564 4,186
Profit for the period pertaining to discontinued operations, after tax - - - - 8
Profit for the period 4,056 4,111 3,444 4,564 4,194
Earnings per share, continuing operations, SEK 2.09 2.11 1.77 2.36 2.18 - after dilution 2.06 2.10 1.76 2.32 2.14
Earnings per share, discontinued operations, SEK - - - - 0.01 - after dilution - - - - 0.01
Earnings per share, total operations, SEK 2.09 2.11 1.77 2.36 2.19 - after dilution 2.06 2.10 1.76 2.32 2.15
INTERIM REPORT JANUARY – JUNE 2017
28 Handelsbanken
BALANCE SHEET – GROUP
SEK m30 Jun
201731 Mar
201731 Dec
201630 Sep
201630 Jun
2016
Assets Cash and balances with central banks 436,848 387,092 199,362 353,680 501,744
Other loans to central banks Note 8 52,718 79,245 25,527 103,113 81,267
Interest-bearing securities eligible as collateral with central banks 119,603 97,262 97,205 119,532 117,753
Loans to other credit institutions Note 8 33,526 34,542 31,347 41,410 48,479
Loans to the public Note 8 2,011,455 1,991,434 1,963,622 1,965,649 1,937,155
Value change of interest-hedged item in portfolio hedge 33 31 35 51 45
Bonds and other interest-bearing securities 61,243 65,436 63,909 53,855 46,223
Shares 21,353 23,397 20,412 35,964 52,541
Investments in associates 212 218 255 259 257
Assets where the customer bears the value change risk 128,870 123,595 118,646 115,532 107,004
Derivative instruments Note 9,10 61,940 73,111 82,633 78,688 92,381
Reinsurance assets 9 9 9 10 10
Intangible assets Note 11 9,579 9,460 9,393 9,293 8,450
Property and equipment 2,353 2,363 2,387 2,323 2,264
Current tax assets 1,379 518 38 2,409 1,575
Deferred tax assets 436 534 962 1,978 1,979
Net pension assets 1,368 379 - - -
Assets held for sale 3 3 1 2 -
Other assets 12,302 29,034 5,615 19,496 25,810
Prepaid expenses and accrued income 5,864 5,266 6,222 5,691 5,708Total assets 2,961,094 2,922,929 2,627,580 2,908,935 3,030,645
Liabilities and equityDue to credit institutions Note 12 202,681 205,971 178,781 205,274 207,312
Deposits and borrowing from the public Note 12 1,120,291 1,049,699 829,336 1,009,427 1,134,500
Liabilities where the customer bears the value change risk 128,962 123,653 118,745 115,600 107,054
Issued securities Note 13 1,264,536 1,295,668 1,261,765 1,315,684 1,320,083
Derivative instruments Note 9,10 31,654 24,297 31,738 33,296 37,283
Short positions 7,876 11,753 1,572 11,441 8,581
Insurance liabilities 562 599 574 583 591
Current tax liabilities 1,388 809 514 1,657 1,008
Deferred tax liabilities 7,749 7,842 7,875 9,788 10,006
Provisions 426 615 731 734 773
Net pension liabilities - - 2,161 6,547 6,544
Other liabilities 13,851 21,684 9,427 16,452 18,817
Accrued expenses and deferred income 13,436 15,399 14,580 15,359 15,608
Subordinated liabilities 32,782 33,199 33,400 33,008 32,903Total liabilities 2,826,194 2,791,188 2,491,199 2,774,850 2,901,063
Minority interest 6 6 6 6 5
Share capital 3,013 3,013 3,013 3,008 3,001
Share premium 5,629 5,629 5,628 5,410 5,081
Reserves 9,339 10,237 9,268 10,639 11,037
Retained earnings 108,746 108,745 102,222 102,222 102,222Profit for the period, attributable to shareholders in Svenska Handelsbanken AB 8,167 4,111 16,244 12,800 8,236Total equity 134,900 131,741 136,381 134,085 129,582Total liabilities and equity 2,961,094 2,922,929 2,627,580 2,908,935 3,030,645
29 Handelsbanken
INTERIM REPORT JANUARY – JUNE 2017

INTERIM REPORT JANUARY – JUNE 2017
29 Handelsbanken
STATEMENT OF CHANGES IN EQUITY – GROUP
During the January–June 2017 period, convertibles for a nominal value of SEK 1m (1,951) relating to subordinated convertible bonds were converted into 22,151 class A shares (28,800,955). At the end of the period, the number of Handelsbanken shares in the trading book was 0 (0).
January - June 2017SEK m
Share capital
Share premium
Defined benefit
plansHedge
reserve
Fair value
reserveTranslation
reserveRetained earnings Minority Total
Opening equity 3,013 5,628 1,656 2,487 974 4,151 118,466 6 136,381 Profit for the period 8,167 0 8,167
Other comprehensive income 2,597 -580 54 -2,000 0 71Total comprehensive income for the period 2,597 -580 54 -2,000 8,167 0 8,238
Dividend -9,721 -9,721
Effects of convertible subordinated loans 0 1 1
Change of minority interests 1 0 1
Closing equity 3,013 5,629 4,253 1,907 1,028 2,151 116,913 6 134,900
January - December 2016SEK m
Share capital
Share premium
Defined benefit
plansHedge
reserve
Fair value
reserveTranslation
reserveRetained earnings Minority Total
Opening equity 2,956 3,204 -1,461 4,940 2,024 2,937 113,664 4 128,268 Profit for the period 16,244 1 16,245
Other comprehensive income 3,117 -2,453 -1,050 1,214 0 828Total comprehensive income for the period 3,117 -2,453 -1,050 1,214 16,244 1 17,073
Dividend -11,442 -11,442
Effects of convertible subordinated loans 57 2,424 2,481
Change of minority interests 0 1 1
Closing equity 3,013 5,628 1,656 2,487 974 4,151 118,466 6 136,381
January - June 2016SEK m
Share capital
Share premium
Defined benefit
plansHedge
reserve
Fair value
reserveTranslation
reserveRetained earnings Minority Total
Opening equity 2,956 3,204 -1,461 4,940 2,024 2,937 113,664 4 128,268 Profit for the period 8,236 1 8,237
Other comprehensive income -856 3,875 -515 93 0 2,597Total comprehensive income for the period -856 3,875 -515 93 8,236 1 10,834
Dividend -11,442 -11,442
Effects of convertible subordinated loans 45 1,877 1,922
Change of minority interests 0 0 0
Closing equity 3,001 5,081 -2,317 8,815 1,509 3,030 110,458 5 129,582
30 Handelsbanken
INTERIM REPORT JANUARY – JUNE 2017

INTERIM REPORT JANUARY – JUNE 2017
29 Handelsbanken
STATEMENT OF CHANGES IN EQUITY – GROUP
During the January–June 2017 period, convertibles for a nominal value of SEK 1m (1,951) relating to subordinated convertible bonds were converted into 22,151 class A shares (28,800,955). At the end of the period, the number of Handelsbanken shares in the trading book was 0 (0).
January - June 2017SEK m
Share capital
Share premium
Defined benefit
plansHedge
reserve
Fair value
reserveTranslation
reserveRetained earnings Minority Total
Opening equity 3,013 5,628 1,656 2,487 974 4,151 118,466 6 136,381 Profit for the period 8,167 0 8,167
Other comprehensive income 2,597 -580 54 -2,000 0 71Total comprehensive income for the period 2,597 -580 54 -2,000 8,167 0 8,238
Dividend -9,721 -9,721
Effects of convertible subordinated loans 0 1 1
Change of minority interests 1 0 1
Closing equity 3,013 5,629 4,253 1,907 1,028 2,151 116,913 6 134,900
January - December 2016SEK m
Share capital
Share premium
Defined benefit
plansHedge
reserve
Fair value
reserveTranslation
reserveRetained earnings Minority Total
Opening equity 2,956 3,204 -1,461 4,940 2,024 2,937 113,664 4 128,268 Profit for the period 16,244 1 16,245
Other comprehensive income 3,117 -2,453 -1,050 1,214 0 828Total comprehensive income for the period 3,117 -2,453 -1,050 1,214 16,244 1 17,073
Dividend -11,442 -11,442
Effects of convertible subordinated loans 57 2,424 2,481
Change of minority interests 0 1 1
Closing equity 3,013 5,628 1,656 2,487 974 4,151 118,466 6 136,381
January - June 2016SEK m
Share capital
Share premium
Defined benefit
plansHedge
reserve
Fair value
reserveTranslation
reserveRetained earnings Minority Total
Opening equity 2,956 3,204 -1,461 4,940 2,024 2,937 113,664 4 128,268 Profit for the period 8,236 1 8,237
Other comprehensive income -856 3,875 -515 93 0 2,597Total comprehensive income for the period -856 3,875 -515 93 8,236 1 10,834
Dividend -11,442 -11,442
Effects of convertible subordinated loans 45 1,877 1,922
Change of minority interests 0 0 0
Closing equity 3,001 5,081 -2,317 8,815 1,509 3,030 110,458 5 129,582
INTERIM REPORT JANUARY – JUNE 2017
30 Handelsbanken
CASH FLOW STATEMENT, CONDENSED – GROUP
NOTES
Note 1 Accounting policies
Accounting policies
This interim report has been prepared in accordance with IAS 34 Interim Financial Reporting. The consolidated accounts have been prepared in accordance with international financial reporting standards (IFRS) and interpretations of these standards as adopted by the EU. The accounting policies also follow the Swedish Annual Accounts Act for Credit Institutions and Securities Companies (1995:1559), and the regulations and general guidelines issued by the Swedish Financial Supervisory Authority, FFFS 2008:25 Annual reports in credit institutions and securities companies. RFR 1 Supplementary accounting rules for groups as well as statements from the Swedish Financial Reporting Board are also applied in the consolidated accounts.
The interim report for the parent company has been prepared in accordance with the Swedish Annual Accounts Act for Credit Institutions and Securities Companies, and the regulations and general guidelines issued by the Swedish Financial Supervisory Authority, FFFS 2008:25 Annual reports in credit institutions and securities companies. The parent company also applies RFR 2 Accounting for legal entities, as well as statements issued by the Swedish Financial Reporting Board.
The interim report of the Group and the parent company has been prepared in accordance with the same accounting policies and calculation methods that were applied in the annual report for 2016.
Future regulatory changes
IFRS 9 Financial Instruments, which is to replace IAS 39 Financial Instruments: Recognition and Measurement, has been adopted for application by the EU. The standard will be applied as of the 2018 financial year. The standard encompasses three areas: classification and measurement, impairment, and general hedge accounting. The forthcoming regulations on impairment are based on expected loan
losses, and not on incurred loan losses as in the current IAS 39 regulations. The provisions will also be based on a probability-weighted outcome, unlike the current IAS 39 where the provision is based on the most expected outcome. All in all, in the transition to IFRS 9, this may entail higher provisions for loan losses. This regulatory change may lead to an adjustment of equity. No final decision has yet been taken as to how these effects will be dealt with as regards the relationship between the expected loan loss provisions in accounting terms and the expected loan losses in capital adequacy terms. The Bank is currently analysing the financial effects of the new standard in more detail.
IFRS 15 Revenue from Contracts with Customers has also been adopted for application in the EU. The standard will be applied as of the 2018 financial year. IFRS 15 introduces a five-step model to establish how and when revenue must be recognised. However, the standard does not apply to financial instruments, insurance contracts or leases. IFRS 15 also contains increased disclosure requirements relating to revenue. The Bank’s assessment is that the new standard will not have any material impact on Handelsbanken’s financial reports, capital adequacy or large exposures.
IFRS 16 Leases has also been published by the IASB. Assuming that IFRS 16 is adopted by the EU, and the date of implementation proposed by the IASB is not changed, this standard will be applied as of the 2019 financial year. The main change due to the new standard is that all lease contracts (with the exception of short-term and minor lease contracts) must be recognised as an asset (right-of-use asset) and as a liability in the lessee’s balance sheet. The lease payment must be reported as depreciation and interest expense. There are also increased disclosure requirements. For lessors, the requirements are largely unchanged. The Bank is analysing the financial effects of the new standard.
SEK mJan-Jun
2017Jan-Jun
2016Full year
2016
Operating profit, total operations 10,604 10,286 20,674Adjustment for non-cash items in profit/loss 1,300 -1,371 89Paid income tax -2,909 -3,591 -5,544Changes in the assets and liabilities of operating activities 252,433 299,035 -11,167Cash flow from operating activities 261,428 304,359 4,052
Aquisition / disposal of subsidiaries - - -408Change in shares 7 1,026 5,462Change in interest-bearing securities - 1,000 1,003Change in property and equipment -164 563 385Change in intangible assets -355 -207 -546Cash flow from investing activities -512 2,382 5,896
Repayment of subordinated loans - 1,951 -2,512Issued subordinated loans - - -Dividend paid -9,721 -11,442 -11,442Cash flow from financing activities -9,721 -9,491 -13,954
Liquid funds at beginning of the period 199,362 202,630 202,630Cash flow for the period 251,195 297,250 -4,006Exchange rate difference on liquid funds -13,709 1,864 738Liquid funds at end of the period* 436,848 501,744 199,362
* Liquid funds are defined as Cash and balances with central banks.
31 Handelsbanken
INTERIM REPORT JANUARY – JUNE 2017

INTERIM REPORT JANUARY – JUNE 2017
31 Handelsbanken
In addition, IFRS 17 Insurance contracts has been published by the IASB. Assuming that IFRS 17 is adopted by the EU, and the date of implementation proposed by the IASB is not changed, this standard will be applied as of the 2021 financial year. IFRS 17 will mean a
change in how insurance contracts are reported and measured. The Bank is analysing the financial effects of the new standard.
None of the other changes in the accounting regulations issued for application are expected to have any material impact on Handelsbanken’s financial reports, capital adequacy, large exposures or other circumstances under the applicable operating rules.
Note 2 Net interest income
Note 3 Net fee and commission income
SEK mQ2
2017Q1
2017 ChangeQ2
2016 ChangeJan-Jun
2017Jan-Jun
2016 ChangeFull year
2016
Interest incomeLoans to credit institutions and central banks 522 347 50% 391 34% 869 872 0% 1,422
Loans to the public 9,750 9,695 1% 9,759 0% 19,445 19,571 -1% 39,333Interest-bearing securities eligible as collateral with central banks 43 57 -25% 109 -61% 100 227 -56% 229
Interest-bearing securities 164 176 -7% 232 -29% 340 425 -20% 783
Derivative instruments -380 -326 -17% -1,218 69% -706 -1,637 57% -2,629
Other interest income 359 320 12% 329 9% 679 640 6% 1,317
Total interest income 10,458 10,269 2% 9,602 9% 20,727 20,098 3% 40,455Of which interest income reported in Net gains/losses on financial transactions 60 59 2% 151 -60% 119 311 -62% 505
Interest income according to income statement 10,398 10,210 2% 9,451 10% 20,608 19,787 4% 39,950
Interest expenseDue to credit institutions and central banks -309 -299 3% -261 18% -608 -543 12% -1,086
Deposits and borrowing from the general public -398 -294 35% -382 4% -692 -786 -12% -1,423
Issued securities -4,023 -4,157 -3% -4,582 -12% -8,180 -8,974 -9% -17,740
Derivative instruments 2,454 2,432 1% 3,210 -24% 4,886 5,423 -10% 10,771
Subordinated liabilities -356 -360 -1% -384 -7% -716 -773 -7% -1,534
State fees -516 -527 -2% -318 62% -1,043 -654 59% -1,300
Other interest expense -19 -28 -32% -124 -85% -47 -195 -76% -279
Total interest expense -3,167 -3,233 -2% -2,841 11% -6,400 -6,502 -2% -12,591Of which interest expense reported in Net gains/losses on financial transactions -90 -104 -13% -198 -55% -194 -318 -39% -584
Interest expense according to income statement -3,077 -3,129 -2% -2,643 16% -6,206 -6,184 0% -12,007Net interest income 7,321 7,081 3% 6,808 8% 14,402 13,603 6% 27,943
The derivative instrument rows include net interest income related to hedged assets and liabilities. These may have both a positive and a negative impact on interest income and interest expense.
SEK mQ2
2017Q1
2017 ChangeQ2
2016 ChangeJan-Jun
2017Jan-Jun
2016 ChangeFull year
2016
Brokerage and other securities commissions 246 261 -6% 229 7% 507 462 10% 916
Mutual funds 895 849 5% 717 25% 1,744 1,412 24% 3,023
Custody and other asset management fees 169 164 3% 148 14% 333 295 13% 623
Advisory services 105 56 88% 98 7% 161 202 -20% 317
Insurance 168 160 5% 151 11% 328 309 6% 634
Payments 847 760 11% 795 7% 1,607 1,513 6% 3,185
Loans and deposits 308 301 2% 290 6% 609 570 7% 1,172
Guarantees 99 97 2% 108 -8% 196 207 -5% 422
Other 125 124 1% 127 -2% 249 246 1% 488
Total fee and commission income 2,962 2,772 7% 2,663 11% 5,734 5,216 10% 10,780Securities -70 -72 -3% -70 0% -142 -136 4% -260
Payments -368 -331 11% -293 26% -699 -593 18% -1,289
Other -16 -15 7% -20 -20% -31 -37 -16% -75
Total fee and commission expense -454 -418 9% -383 19% -872 -766 14% -1,624Net fee and commission income 2,508 2,354 7% 2,280 10% 4,862 4,450 9% 9,156
32 Handelsbanken
INTERIM REPORT JANUARY – JUNE 2017

INTERIM REPORT JANUARY – JUNE 2017
31 Handelsbanken
In addition, IFRS 17 Insurance contracts has been published by the IASB. Assuming that IFRS 17 is adopted by the EU, and the date of implementation proposed by the IASB is not changed, this standard will be applied as of the 2021 financial year. IFRS 17 will mean a
change in how insurance contracts are reported and measured. The Bank is analysing the financial effects of the new standard.
None of the other changes in the accounting regulations issued for application are expected to have any material impact on Handelsbanken’s financial reports, capital adequacy, large exposures or other circumstances under the applicable operating rules.
Note 2 Net interest income
Note 3 Net fee and commission income
SEK mQ2
2017Q1
2017 ChangeQ2
2016 ChangeJan-Jun
2017Jan-Jun
2016 ChangeFull year
2016
Interest incomeLoans to credit institutions and central banks 522 347 50% 391 34% 869 872 0% 1,422
Loans to the public 9,750 9,695 1% 9,759 0% 19,445 19,571 -1% 39,333Interest-bearing securities eligible as collateral with central banks 43 57 -25% 109 -61% 100 227 -56% 229
Interest-bearing securities 164 176 -7% 232 -29% 340 425 -20% 783
Derivative instruments -380 -326 -17% -1,218 69% -706 -1,637 57% -2,629
Other interest income 359 320 12% 329 9% 679 640 6% 1,317
Total interest income 10,458 10,269 2% 9,602 9% 20,727 20,098 3% 40,455Of which interest income reported in Net gains/losses on financial transactions 60 59 2% 151 -60% 119 311 -62% 505
Interest income according to income statement 10,398 10,210 2% 9,451 10% 20,608 19,787 4% 39,950
Interest expenseDue to credit institutions and central banks -309 -299 3% -261 18% -608 -543 12% -1,086
Deposits and borrowing from the general public -398 -294 35% -382 4% -692 -786 -12% -1,423
Issued securities -4,023 -4,157 -3% -4,582 -12% -8,180 -8,974 -9% -17,740
Derivative instruments 2,454 2,432 1% 3,210 -24% 4,886 5,423 -10% 10,771
Subordinated liabilities -356 -360 -1% -384 -7% -716 -773 -7% -1,534
State fees -516 -527 -2% -318 62% -1,043 -654 59% -1,300
Other interest expense -19 -28 -32% -124 -85% -47 -195 -76% -279
Total interest expense -3,167 -3,233 -2% -2,841 11% -6,400 -6,502 -2% -12,591Of which interest expense reported in Net gains/losses on financial transactions -90 -104 -13% -198 -55% -194 -318 -39% -584
Interest expense according to income statement -3,077 -3,129 -2% -2,643 16% -6,206 -6,184 0% -12,007Net interest income 7,321 7,081 3% 6,808 8% 14,402 13,603 6% 27,943
The derivative instrument rows include net interest income related to hedged assets and liabilities. These may have both a positive and a negative impact on interest income and interest expense.
SEK mQ2
2017Q1
2017 ChangeQ2
2016 ChangeJan-Jun
2017Jan-Jun
2016 ChangeFull year
2016
Brokerage and other securities commissions 246 261 -6% 229 7% 507 462 10% 916
Mutual funds 895 849 5% 717 25% 1,744 1,412 24% 3,023
Custody and other asset management fees 169 164 3% 148 14% 333 295 13% 623
Advisory services 105 56 88% 98 7% 161 202 -20% 317
Insurance 168 160 5% 151 11% 328 309 6% 634
Payments 847 760 11% 795 7% 1,607 1,513 6% 3,185
Loans and deposits 308 301 2% 290 6% 609 570 7% 1,172
Guarantees 99 97 2% 108 -8% 196 207 -5% 422
Other 125 124 1% 127 -2% 249 246 1% 488
Total fee and commission income 2,962 2,772 7% 2,663 11% 5,734 5,216 10% 10,780Securities -70 -72 -3% -70 0% -142 -136 4% -260
Payments -368 -331 11% -293 26% -699 -593 18% -1,289
Other -16 -15 7% -20 -20% -31 -37 -16% -75
Total fee and commission expense -454 -418 9% -383 19% -872 -766 14% -1,624Net fee and commission income 2,508 2,354 7% 2,280 10% 4,862 4,450 9% 9,156
INTERIM REPORT JANUARY – JUNE 2017
32 Handelsbanken
Note 4 Net gains/losses on financial transactions
Note 5 Other expenses
SEK mQ2
2017Q1
2017 ChangeQ2
2016 ChangeJan-Jun
2017Jan-Jun
2016 ChangeFull year
2016
Trading, derivatives, FX effect etc 439 706 -38% -90 1,145 -357 832
Other financial instruments at fair value in profit/loss -132 -139 5% 447 -271 1,030 466 of which interest-bearing securities -123 -129 5% 455 -252 1,040 502 of which loans -9 -10 10% -8 -13% -19 -10 -90% -36
Financial instruments at amortised cost 32 13 146% 56 -43% 45 92 -51% 182
of which loans 86 84 2% 127 -32% 170 213 -20% 446
of which liabilities -54 -71 24% -71 24% -125 -121 -3% -264
Financial instruments available for sale 4 2 100% 89 -96% 6 916 -99% 1,689
Hedge accounting 3 -10 36 -92% -7 36 -3
of which net gains/losses on fair value hedges 6 -6 10 -40% - 12 -8
of which cash flow hedge ineffectiveness -3 -4 25% 26 -7 24 5
Gains/losses on unbundled insurance contracts -29 -25 -16% -15 -93% -54 -32 -69% -100Total 317 547 -42% 523 -39% 864 1,685 -49% 3,066
SEK mQ2
2017Q1
2017 ChangeQ2
2016 ChangeJan-Jun
2017Jan-Jun
2016 ChangeFull year
2016
Property and premises -290 -318 -9% -303 -4% -608 -611 0% -1,234
External IT costs -489 -478 2% -420 16% -967 -828 17% -1,698
Communication -75 -84 -11% -80 -6% -159 -165 -4% -317
Travel and marketing -88 -68 29% -85 4% -156 -153 2% -306
Purchased services -317 -318 0% -298 6% -635 -562 13% -1,159
Supplies -38 -48 -21% -43 -12% -86 -88 -2% -173
Other administrative expenses -113 -116 -3% -117 -3% -229 -242 -5% -514Other expenses -1,410 -1,430 -1% -1,346 5% -2,840 -2,649 7% -5,401
33 Handelsbanken
INTERIM REPORT JANUARY – JUNE 2017

INTERIM REPORT JANUARY – JUNE 2017
33 Handelsbanken
Note 6 Loan losses and impaired loans
Loan losses
Impaired loans Impaired loans includes all loans in respect of which all contracted cash flows will probably not be fulfilled. The full amount of all loans which give rise to a specific provision is included in impaired loans, including amounts which are covered by collateral. This means that the impaired loans reserve ratio is stated without taking into account collateral received. Thus, this key figure may vary substantially between the quarters, even though the provisioning policies are unchanged.
For definitions and calculation of key figures, please see the Fact Book which is available at handelsbanken.se/ireng.
SEK mQ2
2017Q1
2017 ChangeQ2
2016 ChangeJan-Jun
2017Jan-Jun
2016 ChangeFull year
2016
Specific provision for individually assessed loans
Provision for the period -165 -301 -45% -297 -44% -466 -641 -27% -1,899
Reversal of previous provisions 64 61 5% 76 -16% 125 133 -6% 377
Total -101 -240 -58% -221 -54% -341 -508 -33% -1,522
Collective provisions
Net provision for the period for individually assessed loans -67 6 -4 -61 3 -62
Net provision for the period for homogeneous loans -3 1 0 -2 1 -10
Total -70 7 -4 -63 4 -72
Off-balance-sheet items
Losses on off-balance-sheet items 0 -1 -2 -1 -4 -75% -16
Reversal of previous losses on off-balance-sheet items 9 1 2 350% 10 2 400% 2
Change in collective provision for off-balance-sheet items -9 12 -10 -10% 3 5 -40% -26
Total 0 12 -100% -10 12 3 300% -40
Write-offs
Actual loan losses for the period -253 -410 -38% -142 78% -663 -1,357 -51% -2,183
Utilised share of previous provisions 195 396 -51% 114 71% 591 1,309 -55% 1,863
Recoveries 42 40 5% 34 24% 82 133 -38% 230
Total -16 26 6 10 85 -88% -90Value change for the period 1 -1 - - - -
Net loan losses -186 -196 -5% -229 -19% -382 -416 -8% -1,724
SEK m30 Jun
201731 Mar
201731 Dec
201630 Sep
201630 Jun
2016Impaired loans 7,303 7,594 7,746 7,710 7,427
Specific provision for individually assessed loans -3,840 -3,985 -4,188 -3,972 -3,671
Provision for collectively assessed homogeneous groups of loans with limited value -108 -105 -107 -107 -94
Collective provisions for individually assessed loans -403 -340 -348 -310 -279
Impaired loans, net 2,952 3,164 3,103 3,321 3,383Total impaired loans reserve ratio 59.6% 58.3% 59.9% 56.9% 54.4%
Proportion of impaired loans 0.15% 0.16% 0.16% 0.17% 0.17%
Impaired loans reserve ratio excl. collective provisions 54.1% 53.9% 55.4% 52.9% 50.7%
Loan loss ratio as a % of loans, acc. 0.04% 0.04% 0.09% 0.06% 0.04%
Loans past due > 60 days 4,067 3,925 4,123 4,928 4,629
Loans past due > 60 days, which are not impaired 1,116 946 1,061 1,381 1,229
34 Handelsbanken
INTERIM REPORT JANUARY – JUNE 2017

INTERIM REPORT JANUARY – JUNE 2017
33 Handelsbanken
Note 6 Loan losses and impaired loans
Loan losses
Impaired loans Impaired loans includes all loans in respect of which all contracted cash flows will probably not be fulfilled. The full amount of all loans which give rise to a specific provision is included in impaired loans, including amounts which are covered by collateral. This means that the impaired loans reserve ratio is stated without taking into account collateral received. Thus, this key figure may vary substantially between the quarters, even though the provisioning policies are unchanged.
For definitions and calculation of key figures, please see the Fact Book which is available at handelsbanken.se/ireng.
SEK mQ2
2017Q1
2017 ChangeQ2
2016 ChangeJan-Jun
2017Jan-Jun
2016 ChangeFull year
2016
Specific provision for individually assessed loans
Provision for the period -165 -301 -45% -297 -44% -466 -641 -27% -1,899
Reversal of previous provisions 64 61 5% 76 -16% 125 133 -6% 377
Total -101 -240 -58% -221 -54% -341 -508 -33% -1,522
Collective provisions
Net provision for the period for individually assessed loans -67 6 -4 -61 3 -62
Net provision for the period for homogeneous loans -3 1 0 -2 1 -10
Total -70 7 -4 -63 4 -72
Off-balance-sheet items
Losses on off-balance-sheet items 0 -1 -2 -1 -4 -75% -16
Reversal of previous losses on off-balance-sheet items 9 1 2 350% 10 2 400% 2
Change in collective provision for off-balance-sheet items -9 12 -10 -10% 3 5 -40% -26
Total 0 12 -100% -10 12 3 300% -40
Write-offs
Actual loan losses for the period -253 -410 -38% -142 78% -663 -1,357 -51% -2,183
Utilised share of previous provisions 195 396 -51% 114 71% 591 1,309 -55% 1,863
Recoveries 42 40 5% 34 24% 82 133 -38% 230
Total -16 26 6 10 85 -88% -90Value change for the period 1 -1 - - - -
Net loan losses -186 -196 -5% -229 -19% -382 -416 -8% -1,724
SEK m30 Jun
201731 Mar
201731 Dec
201630 Sep
201630 Jun
2016Impaired loans 7,303 7,594 7,746 7,710 7,427
Specific provision for individually assessed loans -3,840 -3,985 -4,188 -3,972 -3,671
Provision for collectively assessed homogeneous groups of loans with limited value -108 -105 -107 -107 -94
Collective provisions for individually assessed loans -403 -340 -348 -310 -279
Impaired loans, net 2,952 3,164 3,103 3,321 3,383Total impaired loans reserve ratio 59.6% 58.3% 59.9% 56.9% 54.4%
Proportion of impaired loans 0.15% 0.16% 0.16% 0.17% 0.17%
Impaired loans reserve ratio excl. collective provisions 54.1% 53.9% 55.4% 52.9% 50.7%
Loan loss ratio as a % of loans, acc. 0.04% 0.04% 0.09% 0.06% 0.04%
Loans past due > 60 days 4,067 3,925 4,123 4,928 4,629
Loans past due > 60 days, which are not impaired 1,116 946 1,061 1,381 1,229
INTERIM REPORT JANUARY – JUNE 2017
34 Handelsbanken
Impaired loans and loans which are past due by more than 60 days, by sector
Note 7 Discontinued operations The Bank divested its ownership of Plastal Industri AB in Q2 2016. Discontinued operations refer to the results from the Plastal Industri AB subsidiary for the time before the divestment, as well as the profits from the divestment of the company.
Note 8 Loans and credit exposure
30 June 2017
SEK m Gross Provisions Net*Of which past due >60 days
Private individuals 1,306 -708 598 411 657Housing co-operative associations 39 -19 20 4 27Property management 1,782 -611 1,171 323 278Manufacturing 640 -474 166 19 27Retail 349 -187 162 57 24Hotel and restaurant 111 -38 73 71 -Passenger and goods transport by sea 1,564 -1,020 544 0 -Other transport and communication 53 -36 17 10 2Construction 225 -150 75 40 47Electricity, gas and water 260 -104 156 56 -Agriculture, hunting and forestry 76 -41 35 7 17Other services 259 -211 48 21 28Holding, investment and insurance companies, funds etc. 572 -307 265 14 2Other corporate lending 67 -42 25 22 7Credit institutions - - - - -Total 7,303 -3,948 3,355 1,055 1,116* Book value after deduction of specific provisions.
Impaired loansLoans past due > 60 days, which are not
impaired
31 December 2016
SEK m Gross Provisions Net*Of which past due >60 days
Private individuals 1,405 -745 660 435 721Housing co-operative associations 41 -20 21 5 -Property management 1,793 -691 1,102 263 240Manufacturing 719 -522 197 26 18Retail 457 -270 187 45 0Hotel and restaurant 96 -32 64 64 6Passenger and goods transport by sea 1,849 -1,244 605 0 -Other transport and communication 52 -36 16 7 5Construction 269 -161 108 46 13Electricity, gas and water 68 -39 29 4 9Agriculture, hunting and forestry 53 -31 22 11 2Other services 214 -113 101 94 18Holding, investment and insurance companies, funds etc. 601 -316 285 30 6Other corporate lending 129 -75 54 14 23Credit institutions - - - - -Total 7,746 -4,295 3,451 1,044 1,061* Book value after deduction of specific provisions.
Impaired loansLoans past due > 60 days, which are not
impaired
SEK m30 Jun
201731 Mar
201731 Dec
201630 Sep
201630 Jun
2016
Loans to the public 2,011,455 1,991,434 1,963,622 1,965,649 1,937,155
of which reverse repos 8,322 11,182 7,493 14,041 11,360Loans to other credit institutions 33,526 34,542 31,347 41,410 48,479
of which reverse repos 11,175 10,805 4,088 16,984 19,330
Other loans to central banks 52,718 79,245 25,527 103,113 81,267 of which reverse repos - 1,003 - - -
35 Handelsbanken
INTERIM REPORT JANUARY – JUNE 2017

INTERIM REPORT JANUARY – JUNE 2017
35 Handelsbanken
Loans to the public, by sector
Specification of Loans to the public – Property management
SEK mLoansgross Provisions
Loansnet
Loansgross Provisions
Loansnet
Private individuals 1,009,125 -708 1,008,417 982,640 -745 981,895 of which mortgage loans 821,232 -37 821,195 800,092 -33 800,059 of which other loans with property mortgages 122,856 -132 122,724 120,121 -146 119,975 of which other loans to private individuals 65,037 -539 64,498 62,427 -566 61,861Housing co-operative associations 195,283 -19 195,264 187,016 -20 186,996 of which mortgage loans 163,882 -12 163,870 156,835 -12 156,823Property management 548,610 -611 547,999 540,194 -691 539,503Manufacturing 25,923 -474 25,449 27,633 -522 27,111Retail 23,775 -187 23,588 21,947 -270 21,677Hotels and restaurants 8,482 -38 8,444 8,516 -32 8,484Passenger and goods transport by sea 8,506 -1,020 7,486 9,375 -1,244 8,131Other transport and communication 15,461 -36 15,425 14,614 -36 14,578Construction 18,600 -150 18,450 18,103 -161 17,942Electricity, gas, water 24,078 -104 23,974 25,224 -39 25,185Agriculture, hunting and forestry 11,757 -41 11,716 11,727 -31 11,696Other services 18,935 -211 18,724 19,608 -113 19,495Holding, investment, insurance, funds, etc. 72,507 -307 72,200 66,730 -316 66,414Government and municipalities 13,361 - 13,361 15,891 - 15,891Other corporate lending 21,403 -42 21,361 19,047 -75 18,972Total loans to the public, before collective provisions 2,015,806 -3,948 2,011,858 1,968,265 -4,295 1,963,970Collective provisions -403 -348Total loans to the public 2,011,455 1,963,622
30 June 2017 31 December 2016
SEK mLoansgross Provisions
Loansnet
Loansgross Provisions
Loansnet
Loans in SwedenState-owned property companies 4,427 - 4,427 3,228 - 3,228Municipal-owned property companies 8,999 - 8,999 9,771 - 9,771Residential property companies 101,706 -24 101,682 99,598 -26 99,572 of which mortgage loans 88,507 - 88,507 85,134 -1 85,133Other property management 128,088 -129 127,959 127,578 -130 127,448 of which mortgage loans 55,094 -2 55,092 52,925 -2 52,923Total loans in Sweden 243,220 -153 243,067 240,175 -156 240,019Loans outside SwedenDenmark 20,269 -100 20,169 19,755 -118 19,637Finland 35,948 -4 35,944 33,891 -4 33,887Norway 101,267 -100 101,167 103,767 -108 103,659UK 116,519 -251 116,268 111,800 -289 111,511The Netherlands 24,635 - 24,635 23,194 - 23,194Other countries 6,752 -3 6,749 7,612 -16 7,596Total loans outside Sweden 305,390 -458 304,932 300,019 -535 299,484
Total loans - Property management 548,610 -611 547,999 540,194 -691 539,503
30 June 2017 31 December 2016
36 Handelsbanken
INTERIM REPORT JANUARY – JUNE 2017

INTERIM REPORT JANUARY – JUNE 2017
35 Handelsbanken
Loans to the public, by sector
Specification of Loans to the public – Property management
SEK mLoansgross Provisions
Loansnet
Loansgross Provisions
Loansnet
Private individuals 1,009,125 -708 1,008,417 982,640 -745 981,895 of which mortgage loans 821,232 -37 821,195 800,092 -33 800,059 of which other loans with property mortgages 122,856 -132 122,724 120,121 -146 119,975 of which other loans to private individuals 65,037 -539 64,498 62,427 -566 61,861Housing co-operative associations 195,283 -19 195,264 187,016 -20 186,996 of which mortgage loans 163,882 -12 163,870 156,835 -12 156,823Property management 548,610 -611 547,999 540,194 -691 539,503Manufacturing 25,923 -474 25,449 27,633 -522 27,111Retail 23,775 -187 23,588 21,947 -270 21,677Hotels and restaurants 8,482 -38 8,444 8,516 -32 8,484Passenger and goods transport by sea 8,506 -1,020 7,486 9,375 -1,244 8,131Other transport and communication 15,461 -36 15,425 14,614 -36 14,578Construction 18,600 -150 18,450 18,103 -161 17,942Electricity, gas, water 24,078 -104 23,974 25,224 -39 25,185Agriculture, hunting and forestry 11,757 -41 11,716 11,727 -31 11,696Other services 18,935 -211 18,724 19,608 -113 19,495Holding, investment, insurance, funds, etc. 72,507 -307 72,200 66,730 -316 66,414Government and municipalities 13,361 - 13,361 15,891 - 15,891Other corporate lending 21,403 -42 21,361 19,047 -75 18,972Total loans to the public, before collective provisions 2,015,806 -3,948 2,011,858 1,968,265 -4,295 1,963,970Collective provisions -403 -348Total loans to the public 2,011,455 1,963,622
30 June 2017 31 December 2016
SEK mLoansgross Provisions
Loansnet
Loansgross Provisions
Loansnet
Loans in SwedenState-owned property companies 4,427 - 4,427 3,228 - 3,228Municipal-owned property companies 8,999 - 8,999 9,771 - 9,771Residential property companies 101,706 -24 101,682 99,598 -26 99,572 of which mortgage loans 88,507 - 88,507 85,134 -1 85,133Other property management 128,088 -129 127,959 127,578 -130 127,448 of which mortgage loans 55,094 -2 55,092 52,925 -2 52,923Total loans in Sweden 243,220 -153 243,067 240,175 -156 240,019Loans outside SwedenDenmark 20,269 -100 20,169 19,755 -118 19,637Finland 35,948 -4 35,944 33,891 -4 33,887Norway 101,267 -100 101,167 103,767 -108 103,659UK 116,519 -251 116,268 111,800 -289 111,511The Netherlands 24,635 - 24,635 23,194 - 23,194Other countries 6,752 -3 6,749 7,612 -16 7,596Total loans outside Sweden 305,390 -458 304,932 300,019 -535 299,484
Total loans - Property management 548,610 -611 547,999 540,194 -691 539,503
30 June 2017 31 December 2016
INTERIM REPORT JANUARY – JUNE 2017
36 Handelsbanken
Credit risk exposure
Note 9 Derivatives
SEK m30 Jun
201731 Mar
201731 Dec
201630 Sep
201630 Jun
2016
Loans to the public 2,011,455 1,991,434 1,963,622 1,965,649 1,937,155
of which reverse repos 8,322 11,182 7,493 14,041 11,360
Loans to other credit institutions 33,526 34,542 31,347 41,410 48,479
of which reverse repos 11,175 10,805 4,088 16,984 19,330
Interest-bearing securities eligible as collateral with central banks 119,603 97,262 97,205 119,532 117,753
Bonds and other interest-bearing securities 61,243 65,436 63,909 53,855 46,223
Derivative instruments* 61,940 73,111 82,633 78,688 92,381
Contingent liabilities 75,293 80,481 78,530 82,361 78,459
of which guarantees, credits 10,088 9,839 9,643 10,110 10,440
of which guarantees, other 58,620 64,512 63,108 67,122 63,551
of which letters of credit 6,585 6,130 5,779 5,129 4,468
Other commitments 441,532 427,927 425,267 431,564 425,390
of which unutilised part of granted overdraft facilities 131,721 132,366 128,967 128,930 130,525
of which loan commitments 290,250 273,876 272,729 274,810 268,866
of which other 19,561 21,685 23,571 27,824 25,999Total 2,804,592 2,770,193 2,742,513 2,773,059 2,745,840
Cash and balances with central banks 436,848 387,092 199,362 353,680 501,744
Other loans to central banks 52,718 79,245 25,527 103,113 81,267Total 3,294,158 3,236,530 2,967,402 3,229,852 3,328,851
* Refers to the total of positive market values.
SEK m30 Jun
201731 Mar
201731 Dec
201630 Sep
201630 Jun
2016
Positive market valuesTrading 35,432 37,290 44,703 53,324 66,498
Fair value hedges 133 96 79 15 22
Cash flow hedges 48,394 60,151 64,905 60,986 62,328
Amounts set off -22,019 -24,426 -27,054 -35,637 -36,467Total 61,940 73,111 82,633 78,688 92,381
Negative market valuesTrading 37,676 40,050 47,824 58,556 63,037
Fair value hedges 78 91 82 146 129
Cash flow hedges 15,651 8,512 9,689 8,264 8,096
Amounts set off -21,751 -24,356 -25,857 -33,670 -33,979Total 31,654 24,297 31,738 33,296 37,283
Nominal valueTrading 3,610,265 3,665,721 3,167,735 3,370,296 3,390,582
Fair value hedges 59,903 53,248 42,228 26,073 24,725
Cash flow hedges 1,080,938 1,092,773 1,058,071 925,397 891,575
Amounts set off -1,621,005 -1,967,179 -1,747,179 -1,671,455 -1,575,310Total 3,130,101 2,844,563 2,520,855 2,650,311 2,731,572
Derivative contracts are presented gross in the table. Amounts set off on the balance sheet consist of the set-off market value of contracts for which the Bank has the legal right and intention to settle contractual cash flows net (including cleared contracts). These contracts are presented on a net basis on the balance sheet per counterparty and currency.
37 Handelsbanken
INTERIM REPORT JANUARY – JUNE 2017

INTERIM REPORT JANUARY – JUNE 2017
37 Handelsbanken
Note 10 Offsetting of financial instruments
The amount set off for derivative assets includes set-off cash collateral of SEK 2,438m (3,565), derived from the balance sheet item deposits and borrowing from the public. The amount set off for derivative liabilities includes set-off cash collateral of SEK 914m (2,367), derived from the balance sheet item loans to the public.
30 June 2017SEK m Derivatives Total
83,959 25,068 109,027-22,019 -4,701 -26,72061,940 20,367 82,307
-16,938 - -16,938-33,025 -20,358 -53,383-49,963 -20,358 -70,321
11,977 9 11,986
53,405 5,033 58,438-21,751 -4,701 -26,45231,654 332 31,986
-16,938 - -16,938-4,310 -332 -4,642
-21,248 -332 -21,580
10,406 0 10,406
31 December 2016SEK m Derivatives Total
109,687 13,427 123,114-27,054 -1,030 -28,08482,633 12,397 95,030
-20,643 - -20,643-42,238 -12,397 -54,635-62,881 -12,397 -75,278
19,752 - 19,752
57,595 1,032 58,627-25,857 -1,030 -26,88731,738 2 31,740
Related amounts not set off on the balance sheet-20,643 - -20,643-3,807 -2 -3,809
-24,450 -2 -24,452
7,288 - 7,288
Gross amountAmounts set off
Repurchase agreements, securities borrowing and
similar agreements
Amounts set offCarrying amount on the balance sheet
Related amounts not set off on the balance sheetFinancial instruments, netting arrangementsFinancial assets pledged as collateral
Financial instruments, netting arrangementsFinancial assets received as collateral
Net amount
Financial liabilities subject to offsetting, enforceable master netting arrangements and similar agreementsGross amount
Financial assets subject to offsetting, enforceable master netting arrangements and similar agreements
Carrying amount on the balance sheet
Related amounts not set off on the balance sheet
Carrying amount on the balance sheet
Related amounts not set off on the balance sheetFinancial instruments, netting arrangements
Repurchase agreements, securities borrowing and
similar agreementsFinancial assets subject to offsetting, enforceable master netting arrangements and similar agreementsGross amountAmounts set off
Net amount
Net amountDerivative instruments are set off on the balance sheet when the settlement of two or more derivatives reflects the Bank’s anticipated cash flows. Repurchase agreements and reverse repurchase agreements with central counterparty clearing houses are set off on the balancesheet when this reflects the Bank's anticipated cash flows in the settlement of two or more agreements. This occurs when the Bank has both a contractual right and intention to settle the agreed cash flows with a net amount. The remaining counterparty risk in derivatives is reduced through netting agreements if payments are suspended, i.e. netting positive values against negative values in all derivative transactions with the same counterparty in a bankruptcy situation. Handelsbanken’s policy is to sign netting agreements with all bank counterparties. Netting agreements are supplemented with agreements for issuing collateral for the net exposure. The collateral used is mainly cash, but government securities are also used. Collateral for repurchase agreements and borrowing and lending of securities is normally in the form of cash or other securities.
Total amounts not set off on the balance sheet
Total amounts not set off on the balance sheet
Total amounts not set off on the balance sheet
Total amounts not set off on the balance sheet
Financial assets received as collateral
Net amount
Financial liabilities subject to offsetting, enforceable master netting arrangements and similar agreements
Financial assets pledged as collateral
Gross amountAmounts set offCarrying amount on the balance sheet
Financial instruments, netting arrangements
38 Handelsbanken
INTERIM REPORT JANUARY – JUNE 2017

INTERIM REPORT JANUARY – JUNE 2017
37 Handelsbanken
Note 10 Offsetting of financial instruments
The amount set off for derivative assets includes set-off cash collateral of SEK 2,438m (3,565), derived from the balance sheet item deposits and borrowing from the public. The amount set off for derivative liabilities includes set-off cash collateral of SEK 914m (2,367), derived from the balance sheet item loans to the public.
30 June 2017SEK m Derivatives Total
83,959 25,068 109,027-22,019 -4,701 -26,72061,940 20,367 82,307
-16,938 - -16,938-33,025 -20,358 -53,383-49,963 -20,358 -70,321
11,977 9 11,986
53,405 5,033 58,438-21,751 -4,701 -26,45231,654 332 31,986
-16,938 - -16,938-4,310 -332 -4,642
-21,248 -332 -21,580
10,406 0 10,406
31 December 2016SEK m Derivatives Total
109,687 13,427 123,114-27,054 -1,030 -28,08482,633 12,397 95,030
-20,643 - -20,643-42,238 -12,397 -54,635-62,881 -12,397 -75,278
19,752 - 19,752
57,595 1,032 58,627-25,857 -1,030 -26,88731,738 2 31,740
Related amounts not set off on the balance sheet-20,643 - -20,643-3,807 -2 -3,809
-24,450 -2 -24,452
7,288 - 7,288
Gross amountAmounts set off
Repurchase agreements, securities borrowing and
similar agreements
Amounts set offCarrying amount on the balance sheet
Related amounts not set off on the balance sheetFinancial instruments, netting arrangementsFinancial assets pledged as collateral
Financial instruments, netting arrangementsFinancial assets received as collateral
Net amount
Financial liabilities subject to offsetting, enforceable master netting arrangements and similar agreementsGross amount
Financial assets subject to offsetting, enforceable master netting arrangements and similar agreements
Carrying amount on the balance sheet
Related amounts not set off on the balance sheet
Carrying amount on the balance sheet
Related amounts not set off on the balance sheetFinancial instruments, netting arrangements
Repurchase agreements, securities borrowing and
similar agreementsFinancial assets subject to offsetting, enforceable master netting arrangements and similar agreementsGross amountAmounts set off
Net amount
Net amountDerivative instruments are set off on the balance sheet when the settlement of two or more derivatives reflects the Bank’s anticipated cash flows. Repurchase agreements and reverse repurchase agreements with central counterparty clearing houses are set off on the balancesheet when this reflects the Bank's anticipated cash flows in the settlement of two or more agreements. This occurs when the Bank has both a contractual right and intention to settle the agreed cash flows with a net amount. The remaining counterparty risk in derivatives is reduced through netting agreements if payments are suspended, i.e. netting positive values against negative values in all derivative transactions with the same counterparty in a bankruptcy situation. Handelsbanken’s policy is to sign netting agreements with all bank counterparties. Netting agreements are supplemented with agreements for issuing collateral for the net exposure. The collateral used is mainly cash, but government securities are also used. Collateral for repurchase agreements and borrowing and lending of securities is normally in the form of cash or other securities.
Total amounts not set off on the balance sheet
Total amounts not set off on the balance sheet
Total amounts not set off on the balance sheet
Total amounts not set off on the balance sheet
Financial assets received as collateral
Net amount
Financial liabilities subject to offsetting, enforceable master netting arrangements and similar agreements
Financial assets pledged as collateral
Gross amountAmounts set offCarrying amount on the balance sheet
Financial instruments, netting arrangements
INTERIM REPORT JANUARY – JUNE 2017
38 Handelsbanken
Note 11 Goodwill and other intangible assets
Note 12 Due to credit institutions, deposits and borrowing from the public
Note 13 Issued securities
Note 14 Pledged assets, contingent liabilities and other commitments
Goodwill Other intangible assets Total
SEK mJan-Jun
2017Jan-Jun
2016Full year
2016Jan-Jun
2017Jan-Jun
2016Full year
2016Jan-Jun
2017Jan-Jun
2016Full year
2016
Opening residual value 6,761 6,460 6,460 2,632 1,794 1,794 9,393 8,254 8,254Additional during the period - - 147 355 219 1,070 355 219 1,217The period's amortisation - - - -130 -86 -198 -130 -86 -198The period's impairments - - - -9 -1 -1 -9 -1 -1Foreign exchange effect -24 90 154 -6 -26 -33 -30 64 121Closing residual value 6,737 6,550 6,761 2,842 1,900 2,632 9,579 8,450 9,393
SEK m30 Jun
201731 Mar
201731 Dec
201630 Sep
201630 Jun
2016
Due to credit institutions 202,681 205,971 178,781 205,274 207,312
of which repos - 1,003 - 450 912Deposits and borrowing from the public 1,120,291 1,049,699 829,336 1,009,427 1,134,500 of which repos 332 4,861 2 5,559 4,522
SEK mJan-Jun
2017Jan-Jun
2016
Issued securities at beginning of year 1,261,765 1,245,367Issued 641,229 717,771Repurchased -34,557 -21,664Matured -566,205 -625,066Foreign exchange effect etc. -37,696 3,675Issued securities at end of period 1,264,536 1,320,083
SEK m30 Jun
201731 Mar
201731 Dec
201630 Sep
201630 Jun
2016
Assets pledged for own debt 812,294 852,739 839,982 822,426 829,996
Other pledged assets 31,755 53,558 33,375 38,286 34,969
Contingent liabilities 75,293 80,481 78,530 82,361 78,459Other commitments 441,532 427,927 425,267 431,564 425,390
39 Handelsbanken
INTERIM REPORT JANUARY – JUNE 2017
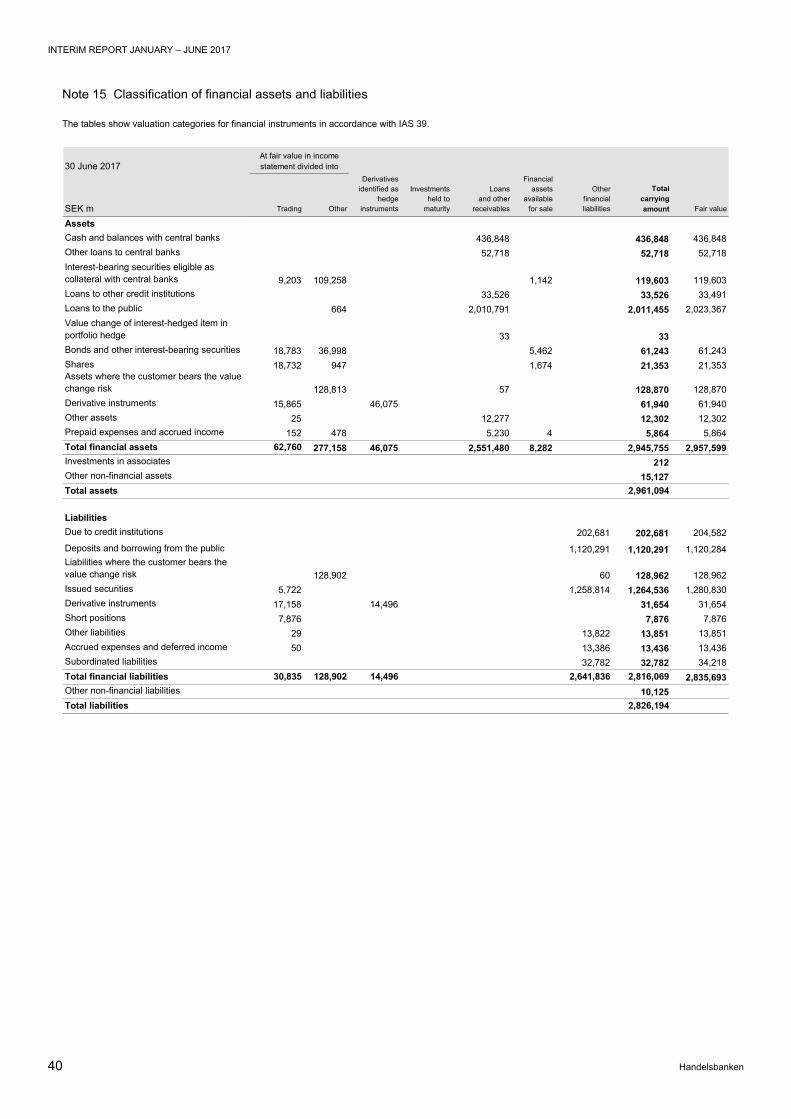
INTERIM REPORT JANUARY – JUNE 2017
39 Handelsbanken
Note 15 Classification of financial assets and liabilities
The tables show valuation categories for financial instruments in accordance with IAS 39.
30 June 2017
SEK m Trading Other
Derivatives identified as
hedgeinstruments
Investments held to
maturity
Loans and other
receivables
Financial assets
available for sale
Otherfinancial liabilities
Total carrying
amount Fair value
Assets Cash and balances with central banks 436,848 436,848 436,848Other loans to central banks 52,718 52,718 52,718Interest-bearing securities eligible as collateral with central banks 9,203 109,258 1,142 119,603 119,603Loans to other credit institutions 33,526 33,526 33,491Loans to the public 664 2,010,791 2,011,455 2,023,367Value change of interest-hedged item in portfolio hedge 33 33Bonds and other interest-bearing securities 18,783 36,998 5,462 61,243 61,243Shares 18,732 947 1,674 21,353 21,353Assets where the customer bears the valuechange risk 128,813 57 128,870 128,870Derivative instruments 15,865 46,075 61,940 61,940Other assets 25 12,277 12,302 12,302Prepaid expenses and accrued income 152 478 5,230 4 5,864 5,864Total financial assets 62,760 277,158 46,075 2,551,480 8,282 2,945,755 2,957,599Investments in associates 212Other non-financial assets 15,127Total assets 2,961,094
Liabilities Due to credit institutions 202,681 202,681 204,582Deposits and borrowing from the public 1,120,291 1,120,291 1,120,284Liabilities where the customer bears the value change risk 128,902 60 128,962 128,962Issued securities 5,722 1,258,814 1,264,536 1,280,830Derivative instruments 17,158 14,496 31,654 31,654Short positions 7,876 7,876 7,876Other liabilities 29 13,822 13,851 13,851Accrued expenses and deferred income 50 13,386 13,436 13,436Subordinated liabilities 32,782 32,782 34,218Total financial liabilities 30,835 128,902 14,496 2,641,836 2,816,069 2,835,693Other non-financial liabilities 10,125Total liabilities 2,826,194
At fair value in income statement divided into
40 Handelsbanken
INTERIM REPORT JANUARY – JUNE 2017
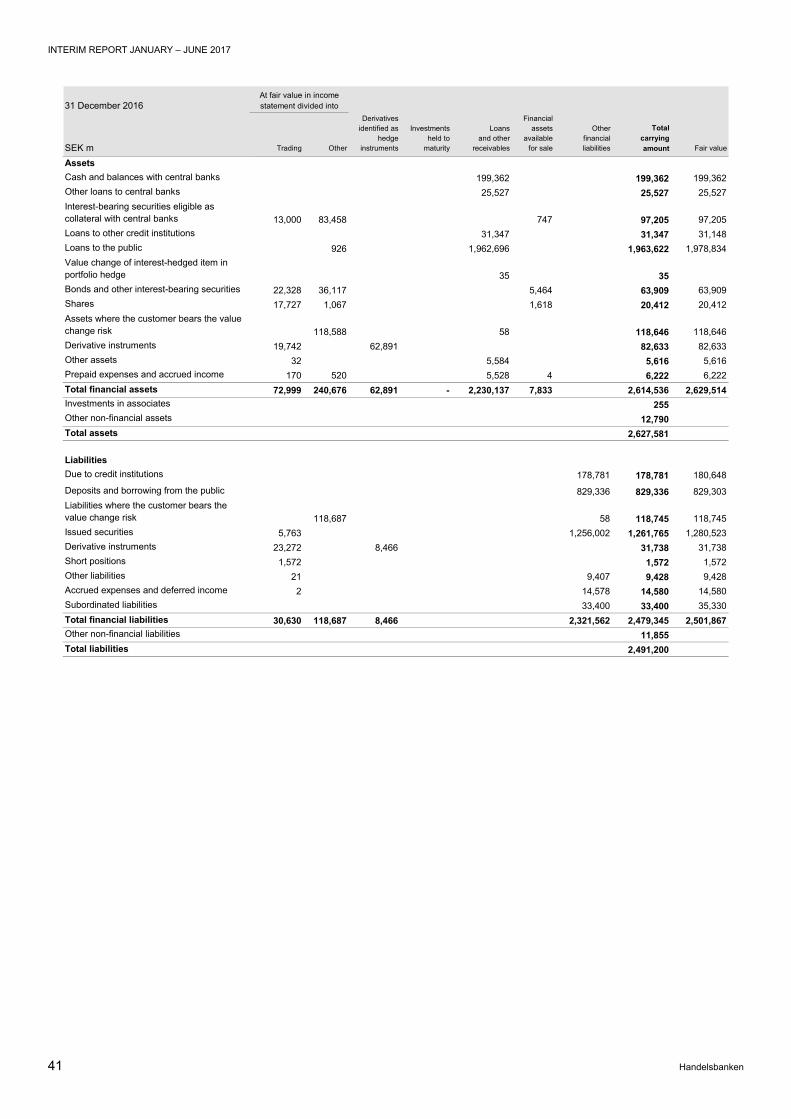
INTERIM REPORT JANUARY – JUNE 2017
40 Handelsbanken
31 December 2016
SEK m Trading Other
Derivatives identified as
hedgeinstruments
Investments held to
maturity
Loans and other
receivables
Financial assets
available for sale
Otherfinancial liabilities
Total carrying
amount Fair value
Assets Cash and balances with central banks 199,362 199,362 199,362Other loans to central banks 25,527 25,527 25,527Interest-bearing securities eligible as collateral with central banks 13,000 83,458 747 97,205 97,205Loans to other credit institutions 31,347 31,347 31,148Loans to the public 926 1,962,696 1,963,622 1,978,834Value change of interest-hedged item in portfolio hedge 35 35Bonds and other interest-bearing securities 22,328 36,117 5,464 63,909 63,909Shares 17,727 1,067 1,618 20,412 20,412Assets where the customer bears the value change risk 118,588 58 118,646 118,646Derivative instruments 19,742 62,891 82,633 82,633Other assets 32 5,584 5,616 5,616Prepaid expenses and accrued income 170 520 5,528 4 6,222 6,222Total financial assets 72,999 240,676 62,891 - 2,230,137 7,833 2,614,536 2,629,514Investments in associates 255Other non-financial assets 12,790Total assets 2,627,581
Liabilities Due to credit institutions 178,781 178,781 180,648Deposits and borrowing from the public 829,336 829,336 829,303Liabilities where the customer bears the value change risk 118,687 58 118,745 118,745Issued securities 5,763 1,256,002 1,261,765 1,280,523Derivative instruments 23,272 8,466 31,738 31,738Short positions 1,572 1,572 1,572Other liabilities 21 9,407 9,428 9,428Accrued expenses and deferred income 2 14,578 14,580 14,580Subordinated liabilities 33,400 33,400 35,330Total financial liabilities 30,630 118,687 8,466 2,321,562 2,479,345 2,501,867Other non-financial liabilities 11,855Total liabilities 2,491,200
At fair value in income statement divided into
41 Handelsbanken
INTERIM REPORT JANUARY – JUNE 2017

INTERIM REPORT JANUARY – JUNE 2017
41 Handelsbanken
Note 16 Fair value measurement of financial instruments
Valuation process
The risk control function checks that the Group’s financial instruments are correctly valued. As far as is possible, the valuations are based on externally generated data.
Financial instruments for which price information is easily available, and which are representative of real and frequently occurring transactions, are valued at their current market price. The current bid price is used for financial assets and the current ask price is used for financial liabilities. For groups of financial instruments which are managed on the basis of the Bank’s net exposure to market risk, the current market price is presumed to be the same as the price which would be received or paid if the net position were divested.
For financial instruments where there is no reliable information about market prices, fair value is established using valuation models. These models can, for example, be based on price comparisons, present value calculations or option valuation theory depending on the nature of the instrument.
Valuation hierarchy
In the tables, financial instruments at fair value have been categorised in terms of how the valuations have been carried out and the extent of market data used in the valuation. The categorisation is
shown as levels 1–3 in the tables. Financial instruments which are valued at the current market price are categorised as level 1. These financial instruments mainly comprise government instruments and other interest-bearing securities that are traded actively, listed shares and short-term positions in corresponding assets. Level 1 also includes the majority of shares in mutual funds and other assets which are related to unit-linked insurance contracts and similar agreements and the corresponding liabilities. Financial instruments which are valued using valuation models which substantially are based on market data are categorised as level 2. Level 2 mainly includes interest-bearing securities and interest- and currency-related derivatives. Financial instruments whose value to a material extent is affected by input data that cannot be verified using external market information are categorised as level 3.
The categorisation is based on the valuation method used on the balance sheet date. If the category for a specific instrument has changed since the previous balance sheet date (31 December 2016), the instrument has been moved between the levels in the table. During the January–June 2017 period, some of the volumes were moved between level 1 and level 2, as a result of a new assessment of market activity. On the assets side, equities worth SEK 68m were moved from level 2 to level 1. Derivatives with a value of SEK 5m
30 June 2017SEK m Level 1 Level 2 Level 3 Total
117,526 2,077 - 119,603
- 648 16 664
57,188 4,055 - 61,243
13,061 6,522 1,770 21,353
128,359 - 454 128,813
286 61,654 - 61,940
316,420 74,956 2,240 393,616
128,448 - 454 128,902
- 5,722 - 5,722
413 31,241 - 31,654
7,799 77 - 7,876
136,660 37,040 454 174,154
31 December 2016SEK m Level 1 Level 2 Level 3 Total
95,511 1,694 - 97,205
- 909 17 926
61,514 2,395 - 63,909
11,528 7,047 1,837 20,412
117,826 - 762 118,588
408 82,225 - 82,633
286,787 94,270 2,616 383,673
117,925 - 762 118,687
- 5,763 - 5,763
443 31,295 - 31,738
1,097 475 - 1,572
119,465 37,533 762 157,760
Derivative instruments
Total financial liabilities at fair value
LiabilitiesLiabilities where the customer bears the value change risk
Issued securities
Derivative instruments
Short positions
Derivative instruments
Loans to the public
Bonds and other interest-bearing securities
Shares
Assets where the customer bears the value change risk
Total financial assets at fair value
Assets
Liabilities
AssetsInterest-bearing securities eligible as collateral with central banks
Total financial assets at fair value
Liabilities where the customer bears the value change risk
Issued securities
Derivative instruments
Short positions
Interest-bearing securities eligible as collateral with central banks
Loans to the public
Bonds and other interest-bearing securities
Shares
Assets where the customer bears the value change risk
Total financial liabilities at fair value
42 Handelsbanken
INTERIM REPORT JANUARY – JUNE 2017

INTERIM REPORT JANUARY – JUNE 2017
41 Handelsbanken
Note 16 Fair value measurement of financial instruments
Valuation process
The risk control function checks that the Group’s financial instruments are correctly valued. As far as is possible, the valuations are based on externally generated data.
Financial instruments for which price information is easily available, and which are representative of real and frequently occurring transactions, are valued at their current market price. The current bid price is used for financial assets and the current ask price is used for financial liabilities. For groups of financial instruments which are managed on the basis of the Bank’s net exposure to market risk, the current market price is presumed to be the same as the price which would be received or paid if the net position were divested.
For financial instruments where there is no reliable information about market prices, fair value is established using valuation models. These models can, for example, be based on price comparisons, present value calculations or option valuation theory depending on the nature of the instrument.
Valuation hierarchy
In the tables, financial instruments at fair value have been categorised in terms of how the valuations have been carried out and the extent of market data used in the valuation. The categorisation is
shown as levels 1–3 in the tables. Financial instruments which are valued at the current market price are categorised as level 1. These financial instruments mainly comprise government instruments and other interest-bearing securities that are traded actively, listed shares and short-term positions in corresponding assets. Level 1 also includes the majority of shares in mutual funds and other assets which are related to unit-linked insurance contracts and similar agreements and the corresponding liabilities. Financial instruments which are valued using valuation models which substantially are based on market data are categorised as level 2. Level 2 mainly includes interest-bearing securities and interest- and currency-related derivatives. Financial instruments whose value to a material extent is affected by input data that cannot be verified using external market information are categorised as level 3.
The categorisation is based on the valuation method used on the balance sheet date. If the category for a specific instrument has changed since the previous balance sheet date (31 December 2016), the instrument has been moved between the levels in the table. During the January–June 2017 period, some of the volumes were moved between level 1 and level 2, as a result of a new assessment of market activity. On the assets side, equities worth SEK 68m were moved from level 2 to level 1. Derivatives with a value of SEK 5m
30 June 2017SEK m Level 1 Level 2 Level 3 Total
117,526 2,077 - 119,603
- 648 16 664
57,188 4,055 - 61,243
13,061 6,522 1,770 21,353
128,359 - 454 128,813
286 61,654 - 61,940
316,420 74,956 2,240 393,616
128,448 - 454 128,902
- 5,722 - 5,722
413 31,241 - 31,654
7,799 77 - 7,876
136,660 37,040 454 174,154
31 December 2016SEK m Level 1 Level 2 Level 3 Total
95,511 1,694 - 97,205
- 909 17 926
61,514 2,395 - 63,909
11,528 7,047 1,837 20,412
117,826 - 762 118,588
408 82,225 - 82,633
286,787 94,270 2,616 383,673
117,925 - 762 118,687
- 5,763 - 5,763
443 31,295 - 31,738
1,097 475 - 1,572
119,465 37,533 762 157,760
Derivative instruments
Total financial liabilities at fair value
LiabilitiesLiabilities where the customer bears the value change risk
Issued securities
Derivative instruments
Short positions
Derivative instruments
Loans to the public
Bonds and other interest-bearing securities
Shares
Assets where the customer bears the value change risk
Total financial assets at fair value
Assets
Liabilities
AssetsInterest-bearing securities eligible as collateral with central banks
Total financial assets at fair value
Liabilities where the customer bears the value change risk
Issued securities
Derivative instruments
Short positions
Interest-bearing securities eligible as collateral with central banks
Loans to the public
Bonds and other interest-bearing securities
Shares
Assets where the customer bears the value change risk
Total financial liabilities at fair value
INTERIM REPORT JANUARY – JUNE 2017
42 Handelsbanken
were moved from level 1 to level 2. On the liabilities side, derivatives with a value of SEK 30m were transferred from level 1 to level 2.
The holdings in level 3 mainly comprise unlisted shares and holdings in private equity funds. Holdings in private equity funds are valued using valuation models mainly based on a relative valuation of comparable listed companies in the same sector. The performance measurements used in the comparison are adjusted for factors which distort the comparison between the investment and the company used for comparison. Subsequently, the valuation is based on earnings multiples, e.g. P/E ratios. Most of these holdings represent investment assets in the Group’s insurance operations. Value changes on the investment assets are included in the basis for calculating the yield split in the insurance operations and are therefore not reported directly in the income statement.
The Group’s holdings of unlisted shares consist mainly of the Bank’s participating interests in various types of jointly owned operations which are related to the Bank’s business. For example, these may be participating interests in clearing organisations and infrastructure collaboration on Handelsbanken’s home markets. In general, such holdings are valued at the Bank’s share of the company’s net asset value, or alternatively at the price of the last completed transaction. In all material respects, unlisted shares are classified as available for sale. Value changes for these holdings are thus reported in other comprehensive income.
Differences between the transaction price and the value produced using a valuation model
The models use input data in the form of market prices and other variables that are deemed to affect pricing. The models and input data which form the basis of the valuations are regularly validated to ensure that they are consistent with market practice and established financial theory. In cases where there are material positive differences between the value calculated with the help of a valuation model at initial recognition and the transaction price (day 1 gain/loss), the difference is distributed over the maturity period of the financial instrument. Such differences occur when the applied valuation model does not fully capture all the components which affect the value of the instrument.
As a consequence of the application of this principle, SEK 63m (76) has been amortised in net gains/losses on financial transactions during the January–June 2017 period. At the end of the period, non-recognised day 1 gains/losses amounted to SEK 601m; at the previous year-end, the corresponding figure was SEK 585m.
The Bank regularly conducts separate valuations of the total credit risk component (own credit risk as well as counterparty risk) in outstanding model-valued derivatives. Changes in fair value due to changed credit risk are recognised in profit/loss to the extent that the overall effect exceeds non-recognised day 1 gains/losses.
January – June 2017SEK m Shares
Loans to the public
Assets where the customer bears the
value change risk
Liabilities where the customer bears the
value change risk
Carrying amount at beginning of year 1,837 17 762 -762Acquisitions/issues 11 - - -Repurchases/sales -54 - -312 312Matured during the period - -2 - -Unrealised value change in income statement -68 - 4 -4Unrealised value change in other comprehensive income 44 - - -Transfer from level 1 or 2 - 1 - -Transfer to level 1 or 2 - - - -Carrying amount at end of period 1,770 16 454 -454
January – December 2016SEK m Shares
Loans to the public
Assets where the customer bears the
value change risk
Liabilities where the customer bears the
value change risk
Carrying amount at beginning of year 1,283 10 732 -732Acquisitions/issues 14 - - -Repurchases/sales -90 - - -Matured during the period - -2 - -Unrealised value change in income statement -55 0 30 -30Unrealised value change in other comprehensive income 685 1 - -Transfer from level 1 or 2 - 8 - -Transfer to level 1 or 2 - - - -Carrying amount at end of period 1,837 17 762 -762
Reconciliation of financial instruments in level 3
43 Handelsbanken
INTERIM REPORT JANUARY – JUNE 2017

INTERIM REPORT JANUARY – JUNE 2017
43 Handelsbanken
Note 17 Assets and liabilities by currency
30 June 2017
SEK m SEK EUR NOK DKK GBP USDOther
currencies TotalAssetsCash and balances with central banks 167 113,121 4,169 1,752 95,545 220,625 1,469 436,848
Other loans to central banks 4,774 64 25,116 22,175 429 - 160 52,718
Loans to other credit institutions 1,658 7,090 750 38 938 21,160 1,892 33,526
Loans to the public 1,264,946 192,936 228,488 90,496 199,777 26,045 8,767 2,011,455
of which corporates 479,876 130,075 139,198 33,585 133,080 25,788 7,904 949,506
of which households 785,070 62,861 89,290 56,911 66,697 257 863 1,061,949Interest-bearing securities eligible as collateral with central banks 93,925 6,747 - 11 - 17,991 929 119,603
Bonds and other interest-bearing securities 44,427 2,340 1,173 - 1,668 11,635 - 61,243
Other items not broken down by currency 245,701 245,701Total assets 1,655,598 322,298 259,696 114,472 298,357 297,456 13,217 2,961,094
LiabilitiesDue to credit institutions 74,025 65,955 6,305 15,901 14,614 19,756 6,125 202,681
Deposits and borrowing from the public 554,035 103,244 72,713 40,510 145,862 198,543 5,384 1,120,291
of which corporates 223,411 85,483 51,814 23,753 104,966 196,231 4,909 690,567
of which households 330,624 17,761 20,899 16,757 40,896 2,312 475 429,724
Issued securities 436,694 254,931 24,262 442 86,677 425,266 36,264 1,264,536
Subordinated liabilities 8,308 14,432 - - - 10,042 - 32,782
Other items not broken down by currency, incl. equity 340,804 340,804Total liabilities and equity 1,413,866 438,562 103,280 56,853 247,153 653,607 47,773 2,961,094
Other assets and liabilities broken down by currency (net) 116,415 -156,285 -57,490 -51,084 356,199 34,600
Net foreign currency position 151 131 129 120 48 44 623
31 December 2016
SEK m SEK EUR NOK DKK GBP USDOther
currencies TotalAssetsCash and balances with central banks 140 99,547 6,199 102 61,774 30,463 1,137 199,362
Other loans to central banks 4,820 - 20,269 394 - 44 25,527
Loans to other credit institutions 7,630 6,983 360 5 976 14,127 1,266 31,347
Loans to the public 1,220,175 187,649 232,704 92,299 192,953 28,636 9,206 1,963,622
of which corporates 460,084 128,416 139,985 36,741 128,371 28,413 8,287 930,297
of which households 760,091 59,233 92,719 55,558 64,582 223 919 1,033,325Interest-bearing securities eligible as collateral with central banks 72,683 6,431 - 11 - 17,344 736 97,205
Bonds and other interest-bearing securities 43,464 2,181 1,329 - 1,701 15,234 - 63,909
Other items not broken down by currency 246,608 246,608Total assets 1,595,520 302,791 240,592 112,686 257,798 105,804 12,389 2,627,580
LiabilitiesDue to credit institutions 36,630 73,200 4,454 17,700 4,775 27,768 14,254 178,781
Deposits and borrowing from the public 503,890 78,736 59,761 34,733 122,374 23,181 6,661 829,336
of which corporates 192,720 61,542 38,662 19,051 86,076 21,003 6,170 425,224
of which households 311,170 17,194 21,099 15,682 36,298 2,178 491 404,112
Issued securities 463,704 240,231 30,826 324 84,338 405,286 37,056 1,261,765
Subordinated liabilities 8,230 14,355 - - - 10,815 - 33,400
Other items not broken down by currency, incl. equity 324,298 324,298Total liabilities and equity 1,336,752 406,522 95,041 52,757 211,487 467,050 57,971 2,627,580
Other assets and liabilities broken down by currency (net) 103,917 -145,364 -59,815 -46,342 361,349 45,650
Net foreign currency position 186 187 114 -31 103 68 627
44 Handelsbanken
INTERIM REPORT JANUARY – JUNE 2017

INTERIM REPORT JANUARY – JUNE 2017
43 Handelsbanken
Note 17 Assets and liabilities by currency
30 June 2017
SEK m SEK EUR NOK DKK GBP USDOther
currencies TotalAssetsCash and balances with central banks 167 113,121 4,169 1,752 95,545 220,625 1,469 436,848
Other loans to central banks 4,774 64 25,116 22,175 429 - 160 52,718
Loans to other credit institutions 1,658 7,090 750 38 938 21,160 1,892 33,526
Loans to the public 1,264,946 192,936 228,488 90,496 199,777 26,045 8,767 2,011,455
of which corporates 479,876 130,075 139,198 33,585 133,080 25,788 7,904 949,506
of which households 785,070 62,861 89,290 56,911 66,697 257 863 1,061,949Interest-bearing securities eligible as collateral with central banks 93,925 6,747 - 11 - 17,991 929 119,603
Bonds and other interest-bearing securities 44,427 2,340 1,173 - 1,668 11,635 - 61,243
Other items not broken down by currency 245,701 245,701Total assets 1,655,598 322,298 259,696 114,472 298,357 297,456 13,217 2,961,094
LiabilitiesDue to credit institutions 74,025 65,955 6,305 15,901 14,614 19,756 6,125 202,681
Deposits and borrowing from the public 554,035 103,244 72,713 40,510 145,862 198,543 5,384 1,120,291
of which corporates 223,411 85,483 51,814 23,753 104,966 196,231 4,909 690,567
of which households 330,624 17,761 20,899 16,757 40,896 2,312 475 429,724
Issued securities 436,694 254,931 24,262 442 86,677 425,266 36,264 1,264,536
Subordinated liabilities 8,308 14,432 - - - 10,042 - 32,782
Other items not broken down by currency, incl. equity 340,804 340,804Total liabilities and equity 1,413,866 438,562 103,280 56,853 247,153 653,607 47,773 2,961,094
Other assets and liabilities broken down by currency (net) 116,415 -156,285 -57,490 -51,084 356,199 34,600
Net foreign currency position 151 131 129 120 48 44 623
31 December 2016
SEK m SEK EUR NOK DKK GBP USDOther
currencies TotalAssetsCash and balances with central banks 140 99,547 6,199 102 61,774 30,463 1,137 199,362
Other loans to central banks 4,820 - 20,269 394 - 44 25,527
Loans to other credit institutions 7,630 6,983 360 5 976 14,127 1,266 31,347
Loans to the public 1,220,175 187,649 232,704 92,299 192,953 28,636 9,206 1,963,622
of which corporates 460,084 128,416 139,985 36,741 128,371 28,413 8,287 930,297
of which households 760,091 59,233 92,719 55,558 64,582 223 919 1,033,325Interest-bearing securities eligible as collateral with central banks 72,683 6,431 - 11 - 17,344 736 97,205
Bonds and other interest-bearing securities 43,464 2,181 1,329 - 1,701 15,234 - 63,909
Other items not broken down by currency 246,608 246,608Total assets 1,595,520 302,791 240,592 112,686 257,798 105,804 12,389 2,627,580
LiabilitiesDue to credit institutions 36,630 73,200 4,454 17,700 4,775 27,768 14,254 178,781
Deposits and borrowing from the public 503,890 78,736 59,761 34,733 122,374 23,181 6,661 829,336
of which corporates 192,720 61,542 38,662 19,051 86,076 21,003 6,170 425,224
of which households 311,170 17,194 21,099 15,682 36,298 2,178 491 404,112
Issued securities 463,704 240,231 30,826 324 84,338 405,286 37,056 1,261,765
Subordinated liabilities 8,230 14,355 - - - 10,815 - 33,400
Other items not broken down by currency, incl. equity 324,298 324,298Total liabilities and equity 1,336,752 406,522 95,041 52,757 211,487 467,050 57,971 2,627,580
Other assets and liabilities broken down by currency (net) 103,917 -145,364 -59,815 -46,342 361,349 45,650
Net foreign currency position 186 187 114 -31 103 68 627
INTERIM REPORT JANUARY – JUNE 2017
44 Handelsbanken
Note 18 Own funds and capital requirements in the consolidated situation
The requirements for the calculation of own funds and capital requirements are regulated in Regulation (EU) No 575/2013 (CRR) and Directive 2013/36/EU, which comprise the EU’s implementation of the international Basel III regulations. All references to CRR in this interim report refer to these regulations in their entirety, regardless of legislative form (regulation, directive, executive decree or national implementation). Figures reported in this section refer to the minimum capital requirements under Pillar 1 and meet the requirements for publication of information relating to capital adequacy in CRR Part Eight, as well as in the Swedish Financial Supervisory Authority’s regulation FFFS 2014:12.
Own funds
SEK m30 Jun
201731 Mar
201731 Dec
201630 Sep
201630 Jun
2016
TIER 1 CAPITAL Equity, Group 134,900 131,741 136,381 134,085 129,582
Accrued unpaid dividend last year - - - - -
Accrued dividend current year -5,127 -2,595 -9,721 -6,400 -4,118
Adjustment of Group result -429 -195 3,829 -162 34
Adjustment of Group equity 3,289 3,267 -593 3,532 3,518
Minority interests -6 -6 -6 -6 -5
Equity (consolidated entities) 132,627 132,212 129,890 131,049 129,011Deducted items
Goodwill and other intangible assets -9,513 -9,409 -9,355 -9,268 -8,433
Value adjustments (fair value) -477 -633 -645 -637 -685
Special deduction for IRB institutions -2,272 -2,270 -1,527 -1,567 -1,543
Positions in securitisation - - - - -
Net pension assets - - - - -
Own shares -607 -622 -636 -593 -529
Adjustments in accordance with stability filter
Cash flow hedges -1,907 -2,749 -2,487 -7,850 -8,815
Unrealised accumulated gains, shares - - - - -
Common equity tier 1 capital, gross 117,851 116,529 115,240 111,134 109,006Threshold deductions Capital contributions to unconsolidated financial entities >10% CET1 - - - - -
Deferred tax assets >10% CET1 - - - - - Amount of capital contributions and deferred tax assets >15% - - - - -
Common equity tier 1 capital 117,851 116,529 115,240 111,134 109,006Additional tier 1 instruments 12,011 12,598 12,768 12,156 12,045
Total tier 1 capital 129,862 129,127 128,008 123,290 121,051
TIER 2 CAPITALSubordinated loans 17,431 17,293 17,354 17,392 17,135
Deducted items
Tier 2 contribution in unconsolidated financial entities -1,129 -1,129 -1,129 -1,129 -1,129
Total tier 2 capital 16,302 16,164 16,225 16,263 16,006
Total own funds 146,164 145,291 144,233 139,553 137,057
45 Handelsbanken
INTERIM REPORT JANUARY – JUNE 2017

INTERIM REPORT JANUARY – JUNE 2017
45 Handelsbanken
Capital ratios and buffers
* Information is only provided regarding the buffer requirements which have come into force.
Capital requirement
Risk exposure amount
Capital requirement credit risks, standardised approach**
** Information about capital requirements for the exposure classes where there are exposures.
30 Jun 2017
31 Mar 2017
31 Dec 2016
30 Sep 2016
30 Jun 2016
Common equity tier 1 ratio, CRR 23.4% 23.8% 25.1% 24.0% 23.0%
Tier 1 ratio, CRR 25.8% 26.4% 27.9% 26.6% 25.5%
Total capital ratio, CRR 29.0% 29.7% 31.4% 30.1% 28.9%
Risk exposure amount CRR 504,199 489,456 458,787 463,675 474,500
Own funds in relation to capital requirement according to Basel I floor 148% 149% 148% 144% 142%
Institution-specific buffer requirements* 6.6% 6.6% 6.4% 6.4% 6.4%
of which capital conservation buffer requirement 2.5% 2.5% 2.5% 2.5% 2.5%
of which countercyclical capital buffer requirement 1.1% 1.1% 0.9% 0.9% 0.9%
of which systemic risk buffer requirement 3.0% 3.0% 3.0% 3.0% 3.0%Common equity tier 1 capital available for use as a buffer 18.9% 19.3% 20.6% 19.5% 18.5%
SEK m30 Jun
201731 Mar
201731 Dec
201630 Sep
201630 Jun
2016
Credit risk according to standardised approach 6,609 6,330 6,472 6,336 6,186
Credit risk according to IRB Approach 27,560 26,334 23,950 24,476 25,603
Market risks 800 936 873 817 711
Credit valuation adjustment risk (CVA) 438 627 594 650 645
Operational risk 4,929 4,929 4,815 4,815 4,815Total capital requirement 40,336 39,156 36,704 37,094 37,960
Adjustment according to Basel I floor 60,239 59,790 61,531 61,134 59,499Capital requirement, Basel I floor 100,575 98,946 98,235 98,228 97,459
Total own funds, Basel I floor 148,436 147,561 145,760 141,120 138,600
SEK m30 Jun
201731 Mar
201731 Dec
201630 Sep
201630 Jun
2016
Credit risk according to standardised approach 82,608 79,126 80,896 79,204 77,323
Credit risk according to IRB Approach 344,497 329,180 299,370 305,951 320,041
Market risk 10,004 11,705 10,910 10,216 8,890
Credit valuation adjustment risk (CVA) 5,477 7,832 7,429 8,122 8,064
Operational risk 61,613 61,613 60,182 60,182 60,182Total risk exposure amount 504,199 489,456 458,787 463,675 474,500
SEK m30 Jun
201731 Dec
201630 Jun
201731 Dec
201630 Jun
201731 Dec
201630 Jun
201731 Dec
2016
Sovereign and central banks 98 255,748 0 77 0 6 0.0 0.0Municipalities 1 54,908 0 22 0 2 0.0 0.0Multilateral development banks 592 636 0 0 0 0 0.0 0.0International organisations 0 49 0 0 0 0 0.0 0.0Institutions 6,257 4,215 373 343 30 27 6.0 8.1Corporates 11,458 10,640 11,348 10,017 908 801 99.0 94.1Households 16,990 17,042 12,703 12,737 1,016 1,019 74.8 74.7Collateral in real estate 97,700 92,087 35,095 33,316 2,808 2,665 35.9 36.2Past due items 255 199 333 258 27 21 130.6 129.6Collective investment undertakings 88 0 88 0 7 0 100.0 0.0Equities 6,784 6,796 16,114 16,126 1,289 1,290 237.5 237.3Other items 7,148 8,571 6,554 8,000 524 641 91.7 93.4Total 147,371 450,891 82,608 80,896 6,609 6,472 56.1 17.9
Exposure amount Capital requirement Average risk weight, %Risk-weighted
exposure amount
46 Handelsbanken
INTERIM REPORT JANUARY – JUNE 2017

INTERIM REPORT JANUARY – JUNE 2017
46 Handelsbanken
Credit risks IRB
* The foundation approach means the IRB Approach without own estimates of LGD and CCF. The advanced approach means the IRB Approach with own estimates of LGD and CCF.
The capital requirement for credit risk is calculated according to the standardised approach and the IRB Approach in accordance with CRR. There are two different IRB Approaches: the IRB Approach without own estimates of LGD and CCF, and the IRB Approach with own estimates of LGD and CCF.
In the IRB Approach without own estimates of LGD and CCF, the Bank uses its own method to determine the probability of the customer defaulting within one year (PD), while the other parameters are set out in CRR rules. In the IRB Approach with own estimates of LGD and CCF, the Bank uses its own methods to calculate the loss given default (LGD) and the exposure amount.
Handelsbanken uses the IRB Approach without own estimates of LGD and CCF for exposures to institutions and for certain product and collateral types for corporate exposures and, starting from Q2 2017, for sovereign exposures in the whole of the regional banking operations and in the following subsidiaries: Stadshypotek AB, Handelsbanken Finans AB, Ecster AB, Handelsbanken Finans (Shanghai) Financial Leasing Co. Ltd and Rahoitus Oy.
The IRB Approach with own estimates of LGD and CCF is applied to the majority of exposures to large corporates, medium-sized companies, property companies and housing co-operative associations in regional bank operations (excluding the Netherlands), Handelsbanken Capital Markets, Stadshypotek AB and
Handelsbanken Finans AB, Ecster AB, and retail exposures in Sweden, Norway, Finland and Denmark, as well as in the subsidiaries Stadshypotek AB, Handelsbanken Finans AB, Ecster AB, and Rahoitus Oy.
At the end of the quarter, the IRB Approach was applied to 81% of the total risk-weighted exposure amount for credit risk. For the remaining credit risk exposures, the capital requirement is calculated using the standardised approach.
Repos and securities loans for institutions are reported separately in the Credit risk exposures approved for the IRB Approach table, since they give rise to very low capital requirements, while the volumes vary considerably over time. The low capital requirement is due to the exposure being reported gross and being secured.
The total average risk weight for exposures approved for the IRB Approach decreased during the quarter, amounting to 12.8% (15.6). The reason why the average risk weight has decreased is that sovereign exposures began to be reported in accordance with the IRB Approach during the quarter, and these have an average risk weight of 1.7%.
Credit quality is good. Of Handelsbanken’s corporate exposures, 97% were customers with a repayment capacity assessed as normal or better than normal, i.e. with a rating grade between 1 and 5 on the
SEK m30 Jun
201731 Dec
201630 Jun
201731 Dec
201630 Jun
201731 Dec
201630 Jun
201731 Dec
2016
Sovereign and central banks 581,859 9,659 772 1.7Corporate 840,765 821,000 230,800 194,650 18,464 15,572 27.5 23.7Corporate lending 818,366 798,330 226,639 190,709 18,131 15,257 27.7 23.9 of which other loans foundation approach * 109,110 116,048 30,858 35,946 2,469 2,876 28.3 31.0 of which other loans advanced approach * 709,256 682,282 195,781 154,763 15,662 12,381 27.6 22.7 of which large companies 149,881 126,774 55,131 57,176 4,411 4,574 36.8 45.1 of which medium-sized companies 78,803 81,640 37,042 32,486 2,963 2,599 47.0 39.8 of which property companies 480,572 473,868 103,608 65,101 8,288 5,208 21.6 13.7Counterparty risk 22,399 22,670 4,161 3,941 333 315 18.6 17.4Housing co-operative associations 186,293 187,897 8,871 7,555 710 604 4.8 4.0Retail 1,000,376 982,270 71,523 72,398 5,722 5,792 7.1 7.4Private individuals 974,568 955,346 64,412 65,258 5,153 5,221 6.6 6.8
of which property loans 897,973 874,253 50,295 48,178 4,024 3,854 5.6 5.5
of which other loans 76,595 81,093 14,117 17,080 1,129 1,367 18.4 21.1
Small companies 25,808 26,924 7,111 7,140 569 571 27.6 26.5
of which property loans 7,317 7,650 1,846 1,706 148 137 25.2 22.3
of which other loans 18,491 19,274 5,265 5,434 421 434 28.5 28.2
Institutions 86,065 105,185 14,007 17,397 1,121 1,392 16.3 16.5Lending to institutions 15,523 20,066 5,128 6,175 410 494 33.0 30.8
Counterparty risk 70,542 85,119 8,879 11,222 710 898 12.6 13.2
of which repos and securities loans 18,069 14,070 312 631 25 50 1.7 4.5
of which derivatives 52,473 71,049 8,567 10,591 685 848 16.3 14.9
Equity exposures 2,128 1,340 7,262 4,959 581 397 341.2 370.0 of which listed shares 766 - 2,220 - 178 - 290.0 -
of which other shares 1,362 1,340 5,042 4,959 403 397 370.0 370.0
Non credit-obligation assets 2,353 2,387 2,353 2,387 188 191 100.0 100.0Securitisation positions 21 22 22 24 2 2 106.0 105.9 of which Traditional securitisation 21 22 22 24 2 2 106.0 105.9
of which Synthetic securitisation - - - - - - - -
Total IRB Approach 2,699,860 2,100,101 344,497 299,370 27,560 23,950 12.8 14.3
Exposure amount Capital requirement Average risk weight, %Risk-weighted
exposure amount
47 Handelsbanken
INTERIM REPORT JANUARY – JUNE 2017

INTERIM REPORT JANUARY – JUNE 2017
47 Handelsbanken
Bank’s ten-point risk rating scale. The IRB Approach is based on historical losses from both the financial crisis of recent years and the Swedish banking crisis in the early 1990s. These risk weights reflect the fact that Handelsbanken has reported low loan losses over a long period. The risk measurements applied contain margins of conservatism to ensure that the risk is not underestimated.
The level of the risk weight in the corporate exposures reflects the portfolio composition and how various loans are classified into different exposure classes.
The capital requirement for equity exposures in the IRB Approach is calculated according to a simplified risk weight method.
Capital requirement market risks
The capital requirement for market risks is calculated for the Bank’s consolidated situation. The capital requirement for interest rate risks and equity price risks is, however, only calculated for positions in the trading book. When calculating the capital requirement for market risks, the standardised approach is applied.
Capital requirement operational risk Handelsbanken uses the standardised approach, to calculate the capital requirement for operational risk. According to the standardised approach, the capital requirement is calculated by multiplying a factor specified in the regulations by the average operating income during the last three years of operation. Different factors are applied in different business segments.
Leverage ratio The provisions of CRR include a reporting requirement regarding a non-risk-based leverage ratio. The measurement is to undergo evaluation and no
decision to make it mandatory has yet been taken.
SEK m30 Jun
201731 Mar
201731 Dec
201630 Sep
201630 Jun
2016
Position risk in the trading book 793 928 864 810 703
Interest rate risk 784 917 855 801 694
of which general risk 497 616 598 651 534
of which specific risk 287 300 256 149 158
of which positions in securitisation instruments - - - - -
of which non-delta risk 0 1 1 1 2
Equity price risk 9 11 9 9 9
of which general risk 1 2 1 1 1
of which specific risk 4 4 3 4 3
of which mutual funds 1 0 0 0 1
of which non-delta risk 3 5 5 4 4
Exchange rate risk - - - - -
of which non-delta risk - - - - -
Commodities risk 7 8 9 7 8
of which non-delta risk 0 0 0 0 0
Settlement risk 0 - 0 0 0Total capital requirement for market risks 800 936 873 817 711
SEK m30 Jun
201731 Mar
201731 Dec
201630 Sep
201630 Jun
2016Balance sheet according to accounting regulations 2,961,094 2,922,929 2,627,580 2,908,935 3,030,645
Deduction for assets not included in the banking group -123,620 -120,443 -114,858 -112,161 -103,215Adjustment for differences between carrying amount and leverage ratio exposure – derivatives -21,485 -26,092 -20,341 -27,185 -24,710
Adjustment for differences between carrying amount and leverage ratio exposure – repos and securities loans 3,342 3,860 4,436 5,295 6,252
Assets reported off the balance sheet, gross (before adjustment for conversion factor) 500,667 485,559 492,788 494,872 486,570
Deduction from assets off the balance sheet after application of conversion factor -321,387 -312,461 -314,413 -313,706 -309,195
Assets reported off the balance sheet, net 179,280 173,098 178,375 181,166 177,375Additional adjustment -14,775 -15,683 -14,650 -19,915 -21,106Assets on which the leverage ratio is calculated 2,983,836 2,937,669 2,660,542 2,936,135 3,065,241
Capital on which the leverage ratio can be calculatedTier 1 capital 129,862 129,127 128,008 123,290 121,051
Leverage ratioLeverage ratio calculated on tier 1 capital 4.4% 4.4% 4.8% 4.2% 3.9%
48 Handelsbanken
INTERIM REPORT JANUARY – JUNE 2017

INTERIM REPORT JANUARY – JUNE 2017
48 Handelsbanken
Information in this section relates to Handelsbanken’s material risks and capital requirements at the time that this interim report is published. A full description of the Bank’s risk and capital management can be found in Handelsbanken’s Annual Report and in Handelsbanken’s Risk and Capital Management – Information according to Pillar 3.
Note 19 Risk and liquidity
Figures reported in this section meet the requirements for publication of information relating to risk and capital management in CRR Part Eight.
Risk and uncertainty factors Handelsbanken provides credit through its branch operations, exercising a low risk tolerance. The credit process is based on the conviction that a decentralised organisation with local presence ensures high quality in credit decisions. Handelsbanken’s exposure to market risks is also low. Essentially, market risks in the banking operations are only taken as part of meeting customers’ investment and risk management needs. During the past few years, the Bank has worked actively to reduce the market risks on its balance sheet. One result of this is that a much smaller part of the Bank’s earnings comes from net gains/losses on financial transactions.
The situation with regard to regulatory developments continues to evolve rapidly. The UK’s decision to leave the EU means there is uncertainty regarding the regulations that will apply to the Bank’s British operations. The Bank is preparing for the implementation of Brexit in close consultation with public authorities in both Sweden and the UK. The Bank’s low tolerance of risk, sound capitalisation and strong liquidity situation mean that Handelsbanken is also well-equipped to operate under substantially more difficult market conditions than those experienced during the last few years. The Bank’s liquidity position is described in more detail below under the heading Liquidity and funding.
Liquidity and funding Handelsbanken has a strong liquidity position. For many years, the Bank has actively worked with liquidity measures and has adopted a conservative approach. Part of this work has involved centralising liquidity management with the purpose of strengthening control of the liquidity risks and of guaranteeing and optimising the Bank’s funding in all scenarios.
For many years, the Bank has worked on extending the maturities of its funding by increasing bond issues and ensuring that liquidity risks are included in internal pricing. Handelsbanken’s funding programme covers the maturities in all currencies that the Bank needs to fund its lending and enables the Bank to issue in all currencies of relevance to the Bank.
Funding programmes/limits as at 30 June 2017 – Group
Programme (in millions) Currency Programme size Utilised amountCountervalue
SEK m
ECP* EUR 15,000 5,981 57,602
ECP (Stadshypotek)* EUR 4,000 - -
French Commercial Paper EUR 7,500 1,839 17,706
Swedish Commercial Paper SEK 25,000 - -
Swedish Commercial Paper (Stadshypotek) SEK 90,000 - -
USCP USD 15,000 5,462 46,063
AMTN AUD 5,000 1,275 8,266
AMTCN (Stadshypotek) AUD 5,000 750 4,863
EMTN* USD 50,000 20,983 176,964
EMTCN (Stadshypotek)* EUR 20,000 10,002 96,327
US 144A/3(a)(2) USD 20,000 10,650 89,819
Stadshypotek US 144A USD 15,000 5,000 42,169
Samurai JPY 400,000 160,700 12,084
MTN* SEK 100,000 10,979 10,979
General funding >1 Y* USD 15,000 3,447 29,071
Extendible Notes USD 15,000 - -
Total 591,913Total programme (or limited) amounts, SEK m 1,854,124
Unutilised amount, SEK m 1,262,211
Available amount 68%
* Under these programmes it is possible to issue in other currencies than the original programme currency. Currency conversion takes place at the time of issue.
49 Handelsbanken
INTERIM REPORT JANUARY – JUNE 2017

INTERIM REPORT JANUARY – JUNE 2017
49 Handelsbanken
Balances with central banks and banks, as well as securities that are eligible as collateral with central banks, totalled SEK 664bn as at 30 June 2017 (see table below). In addition, there was an unutilised
issue amount for covered bonds and other liquidity-creating measures.
Balances with central banks and banks, and securities holdings in the liquidity reserve
Market value
SEK m30 Jun
201731 Mar
201731 Dec
201630 Sep
201630 Jun
2016
Cash and balances with and other lending to central banks 489,210 465,038 224,533 456,491 582,590 Balances with banks and the National Debt Office, overnight 1,555 2,301 7,712 803 1,807
Securities issued by governments and public entities 123,699 99,652 96,217 106,938 104,133
Covered bonds 48,011 53,093 53,647 53,458 50,101
Securities issued by non-financial companies 934 287 27 797 614
Securities issued by financial companies 106 301 124 242 142Total 663,515 620,672 382,260 618,729 739,387 of which in SEK 135,228 151,277 126,241 192,224 160,997 of which in EUR 122,095 123,353 108,380 135,707 83,698 of which in USD 246,228 195,289 47,449 179,920 366,669 of which in other currencies 159,964 150,753 100,190 110,878 128,023
30 June 2017
Market value, SEK m SEK EUR USD Other TotalCash and balances with and other lending to central banks 4,773 113,069 220,621 150,747 489,210
Balances with other banks and the National Debt Office, overnight 1,380 26 22 127 1,555
Securities issued by governments 88,338 6,829 19,565 - 114,732
Securities issued by municipalities and other public entities 2,927 - 6,020 20 8,967
Covered bonds, external issuers 33,710 2,092 - 9,070 44,872
Own covered bonds 3,139 - - - 3,139
Securities issued by non-financial companies 899 35 - - 934
Securities issued by financial companies 62 44 - - 106Total 135,228 122,095 246,228 159,964 663,515
50 Handelsbanken
INTERIM REPORT JANUARY – JUNE 2017

INTERIM REPORT JANUARY – JUNE 2017
50 Handelsbanken
Maturities for financial assets and liabilities
For maturity tables in SEK, EUR and USD, please see the Fact Book which is available at handelsbanken.se/ireng.
30 June 2017SEK m Up to 1 mth 1 - 6 mths 6 - 12 mths 1 - 2 yrs 2 - 5 yrs 5 yrs -
Unspec. maturity Total
Assets Cash and balances with central banks 489,566 - - - - - - 489,566Interest-bearing securities eligible as collateral with central banks 119,603 - - - - - - 119,603
Bonds and other interest-bearing securities 61,243 - - - - - - 61,243
Loans to credit institutions 26,897 1,282 1,256 129 1,627 2,335 - 33,526
-of which reverse repos 11,175 - - - - - - 11,175
Loans to the public 45,187 239,645 179,395 176,293 373,101 997,834 - 2,011,455
-of which reverse repos 8,322 - - - - - - 8,322
Other 29,361 - - - - - 216,340 245,701
-of which shares and participating interests 21,353 - - - - - - 21,353
-of which claims on investment banking settlements 8,008 - - - - - - 8,008
Total 771,857 240,927 180,651 176,422 374,728 1,000,169 216,340 2,961,094
Liabilities Due to credit institutions 119,339 53,237 1,774 4,612 281 4,864 18,574 202,681 -of which repos - - - - - - - 0 -of which deposits from central banks 34,140 28,576 518 - - - 1,722 64,956
Deposits and borrowing from the public 192,488 44,486 4,863 754 2,346 5,806 869,548 1,120,291
-of which repos 332 - - - - - - 332
Issued securities 98,518 307,128 178,904 183,164 417,331 79,491 - 1,264,536
-of which covered bonds - 11,464 108,556 114,238 287,725 48,220 - 570,203 -of which certificates and other securities with original maturity of less than one year 81,484 271,853 37,952 - - - - 391,289 -of which senior bonds and other securities with original maturity of more than one year 17,034 23,811 32,396 68,926 129,606 31,271 - 303,044
Subordinated liabilities - 2,971 - 19,787 10,024 - - 32,782
Other 12,518 - - - - - 328,286 340,804
-of which short positions 7,876 - - - - - - 7,876
-of which investment banking settlement debts 4,642 - - - - - - 4,642Total 422,863 407,822 185,541 208,317 429,982 90,161 1,216,408 2,961,094
The table shows holdings of bonds and other interest-bearing securities in the time intervals in which they can be converted to liquidity if they are pledged as collateral or sold. This means that the table does not reflect the actual maturities for the securities included.
In “Other”, assets and liabilities are reported as maturing in the time intervals that correspond to the contractual maturity dates, taking into account contractual amortisation plans.
Sight deposits are reported under “Unspecified maturity”. “Other” includes market values in derivative transactions.
51 Handelsbanken
INTERIM REPORT JANUARY – JUNE 2017

INTERIM REPORT JANUARY – JUNE 2017
51 Handelsbanken
Liquidity coverage ratio (LCR)
As of 1 October 2015, due to the European Commission’s delegated act, there is a European minimum requirement for banks’ liquidity in the form of a short-term liquidity buffer: liquidity coverage ratio (LCR). The minimum requirement in 2017 is 80%, and this will be raised to 100% by 2018, when the delegated act will be fully implemented. However, according to the delegated act, the LCR is based on the less stringent LCR proposed by the Basel Committee in 2013 and certain EU-specific changes, for example, that the liquidity reserve may include a higher proportion of covered bonds.
By making requirements for a short-term liquidity buffer in FFFS 2012:6 as early as 2013, Sweden has moved more quickly than required by the EU. The requirement amounts to 100%, but the definition of what comprises a short-term liquidity buffer differs from what applies at EU level. The LCR which the Swedish Financial Supervisory Authority has implemented is a stricter LCR measurement, mainly in terms of deposit outflow assumptions and the composition of the liquidity portfolio. The minimum requirement for the net stable funding ratio is expected to be introduced in the EU in 2018 at the earliest.
At the end of the second quarter, Handelsbanken’s LCR according to the Swedish Financial Supervisory Authority’s regulation FFFS 2012:6 was 120%, which shows that the Bank has high resistance to short-term disruptions in the funding market. This also applies in USD and EUR. The LCR, as an average of daily observations according to
the same regulation, was 132% during the first six months. The Bank’s LCR, calculated according to the European Commission’s delegated act, was 136%.
Stress test with liquidity-creating measures The Bank’s liquidity position is regularly subjected to stress tests. In these tests, the Bank’s cash flows are stressed, based on certain defined assumptions. For example, in the stress test aimed at demonstrating resistance to more long-term market disruptions, it is assumed that the Bank is unable to obtain funding in the financial markets at the same time as it experiences a gradual disappearance of 10% of deposits from households and companies over the first month. It is further assumed that the Bank continues to conduct its core activities, i.e. loans to households and companies, and that committed loan offers and other credit facilities are partly utilised by customers. Account is also taken of the fact that holdings with central banks are utilised and that the Group Treasury liquidity portfolio can provide immediate additional liquidity. In addition, liquidity-creating measures – for example, unutilised facilities to issue covered bonds – are used in order to gradually provide liquidity to the Bank. The result of the stress test shows that the liquidity reserves, even in a stressed scenario, cover the Bank’s liquidity requirement for over three years, even if access to new funding in the markets were to disappear.
Liquidity coverage ratio (LCR), %30 Jun
201731 Mar
201731 Dec
201630 Sep
201630 Jun
2016
EUR 132 178 136 178 181
USD 177 236 322 164 121Total* 120 148 126 162 139
* In accordance with the Swedish Financial Supervisory Authority's directive FFFS 2012:6.
Liquidity coverage ratio (LCR) - decomposition, SEK m30 Jun
201731 Mar
201731 Dec
201630 Sep
201630 Jun
2016
Liquid assets 650,117 606,507 290,058 416,189 433,824Liquid assets level 1 613,808 565,626 251,189 375,318 394,887
Liquid assets level 2 36,309 40,881 38,869 40,871 38,937
Cash outflows 593,185 489,050 359,659 514,967 697,349Deposits from customers 242,608 220,330 173,496 191,610 169,582
Market funding 308,352 228,791 151,735 284,083 486,320
Other cash flows 42,225 39,929 34,428 39,274 41,447
Cash inflows 50,132 79,554 129,176 258,526 384,619Inflows from maturing lending to non-financial customers 14,486 22,186 21,146 18,618 26,985
Other cash inflows 35,646 57,368 108,030 239,908 357,634The components are defined in accordance with the Swedish Financial Supervisory Authority's regulations and requirements for the liquidity coverage ratio and reporting of liquid assets and cash flows (FFFS 2012:6). Liquid assets level 1 corresponds to Chapter 3, Section 6. Liquid assets level 2 corresponds to Chapter 3, Section 7. Deposits from customers corresponds to Chapter 4, Sections 4-9. Market funding corresponds to Chapter 4, Sections 10-13. Other cash flows corresponds to Chapter 4, Sections 14-25. Loans to non-financial customers corresponds to Chapter 5, Section 4. Other cash inflows corresponds to Chapter 5, Sections 6-12.
52 Handelsbanken
INTERIM REPORT JANUARY – JUNE 2017

INTERIM REPORT JANUARY – JUNE 2017
52 Handelsbanken
Non-encumbered assets, NEA
Information in this section relates to Handelsbanken’s material risks and risk management at the time that this interim report is published. A full description of the Bank’s risk and capital management can be found in Handelsbanken’s Annual Report and in Handelsbanken’s Risk and Capital Management – Information according to Pillar 3.
Note 20 Related-party transactions There have been no business transactions of material importance with related parties during the period.
Note 21 Segment reporting Information about the Bank’s segment reporting is provided on pages 9-23.
Note 22 Events after the balance sheet date No significant events occurred after the balance sheet date.
30 June 2017
SEK bn NEA
%47466oiloftrop ytidiuqil eht ni seitiruces dna sknab lartnec htiw sgnidloH
Mortgage loans %631355
Other household lending %651581
%681562)3-1( ssalc ksir tsewol gnidnel ynapmoc ytreporP
%302051)3-1( ssalc ksir tsewol gnidnel etaroproc rehtO
%60282)3-1( ssalc ksir tsewol snoitutitsni tiderc ot snaoL
Other corporate lending %432942
Other assets %63232
%632711,2)AEN( stessa derebmucne-non latoT
75**seitilibail gniylrednu tuohtiw stessa derebmucnE787seitilibail gniylrednu htiw stessa derebmucnE
Total assets, Group 2,961
31 December 2016
SEK bn NEA
%64283oiloftrop ytidiuqil eht ni seitiruces dna sknab lartnec htiw sgnidloH
Mortgage loans %201074
Other household lending %421281
%551062)3-1( ssalc ksir tsewol gnidnel ynapmoc ytreporP
%271441)3-1( ssalc ksir tsewol gnidnel etaroproc rehtO
%67123)3-1( ssalc ksir tsewol snoitutitsni tiderc ot snaoL
Other corporate lending %502142
Other assets %01244
%012557,1)AEN( stessa derebmucne-non latoT
16**seitilibail gniylrednu tuohtiw stessa derebmucnE218seitilibail gniylrednu htiw stessa derebmucnE
Total assets, Group 2,628
Accumulated coverage ratio in % of unsecured funding*
Accumulated coverage ratio in % of unsecured funding*
* Issued short and long non-secured funding and liabilities to credit institutions.** Over-collateralisation in cover pool (OC).
53 Handelsbanken
INTERIM REPORT JANUARY – JUNE 2017

INTERIM REPORT JANUARY – JUNE 2017
53 Handelsbanken
Condensed set of financial statements – Parent company INCOME STATEMENT – PARENT COMPANY
STATEMENT OF COMPREHENSIVE INCOME – PARENT COMPANY
Comment on results for parent company, January – June 2017 compared with January – June 2016
The parent company’s accounts cover parts of the operations that, in organisational terms, are included in branch operations within and outside Sweden, Capital Markets, and central departments and staff functions. Although most of Handelsbanken’s business comes from the local branches and is co-ordinated by them, in legal terms a sizeable part of business volumes are outside the parent company in wholly-owned subsidiaries – particularly in the Stadshypotek AB mortgage institution. Thus, the performance of the parent company is not equivalent to the performance of business operations in the Group as a whole.
The parent company’s operating profit decreased by 47% to SEK 4,628m (8,770), chiefly owing to reduced dividends, as well as lower net gains/losses on financial transactions. Profit for the period decreased by 54% to SEK 3,711m (8,045). Net interest income rose by 10% to SEK 7,976m (7,233), and net fee and commission income increased by 4% to SEK 3,351m (3,228). Since the start of the year, the parent company’s equity has decreased to SEK 109,358m (116,642).
SEK mQ2
2017Q1
2017 ChangeQ2
2016 ChangeJan-Jun
2017Jan-Jun
2016 ChangeFull year
2016
Net interest income 4,131 3,845 7% 3,644 13% 7,976 7,233 10% 15,011Dividends received 1,043 -3 2,481 -58% 1,040 4,783 -78% 17,045Net fee and commission income 1,731 1,620 7% 1,665 4% 3,351 3,228 4% 6,509Net gains/losses on financial transactions 263 602 -56% 469 -44% 865 1,667 -48% 3,076
Other operating income 419 394 6% 392 7% 813 775 5% 1,647Total income 7,587 6,458 17% 8,651 -12% 14,045 17,686 -21% 43,288Staff costs -3,122 -2,631 19% -2,604 20% -5,753 -5,661 2% -10,427Other administrative expenses -1,372 -1,379 -1% -1,310 5% -2,751 -2,555 8% -5,224Depreciation, amortisation and impairment of property, equipment and intangible assets -261 -270 -3% -133 96% -531 -265 100% -591Total expenses before loan losses -4,755 -4,280 11% -4,047 17% -9,035 -8,481 7% -16,242Profit before loan losses 2,832 2,178 30% 4,604 -38% 5,010 9,205 -46% 27,046Net loan losses -194 -188 3% -259 -25% -382 -435 -12% -1,730Impairment of financial assets - - - - - -20Operating profit 2,638 1,990 33% 4,345 -39% 4,628 8,770 -47% 25,296Appropriations 29 28 4% 13 123% 57 50 14% -193Profit before tax 2,667 2,018 32% 4,358 -39% 4,685 8,820 -47% 25,103Taxes -447 -527 -15% -432 3% -974 -775 26% -4,503
Profit for the period 2,220 1,491 49% 3,926 -43% 3,711 8,045 -54% 20,600
SEK mQ2
2017Q1
2017 ChangeQ2
2016 ChangeJan-Jun
2017Jan-Jun
2016 ChangeFull year
2016Profit for the period 2,220 1,491 49% 3,926 -43% 3,711 8,045 -54% 20,600
Other comprehensive incomeItems that may subsequently be reclassified to profit or lossCash flow hedges -286 1,010 996 724 2,913 -75% -1,882Available-for-sale instruments 21 37 -43% 536 -96% 58 -564 -1,152Translation differences for the period -850 -1,187 28% 686 -2,037 -467 -336% 387 of which hedging net investment in foreign operations -18 -802 98% 29 -820 -174 -371% -65Tax related to other comprehensive income 57 -48 -226 9 -546 538 of which cash flow hedges 55 -222 -219 -167 -641 74% 414 of which available-for-sale instruments -2 -2 0% 0 -4 57 110 of which hedging net investment in foreign operations 4 176 -98% -7 180 38 374% 14Total items that may subsequently be reclassified to profit or loss -1,058 -188 -463% 1,992 -1,246 1,336 -2,109Total other comprehensive income for the period -1,058 -188 -463% 1,992 -1,246 1,336 -2,109Total comprehensive income for the period 1,162 1,303 -11% 5,918 -80% 2,465 9,381 -74% 18,491
54 Handelsbanken
INTERIM REPORT JANUARY – JUNE 2017

INTERIM REPORT JANUARY – JUNE 2017
54 Handelsbanken
BALANCE SHEET – PARENT COMPANY
SEK m30 Jun
201731 Mar
201731 Dec
201630 Sep
201630 Jun
2016
Assets Cash and balances with central banks 436,848 387,092 199,362 353,680 501,696Interest-bearing securities eligible as collateral with central banks 116,399 94,096 94,236 116,301 114,485Loans to credit institutions 692,429 670,211 593,125 684,565 638,845Loans to the public 779,600 778,918 763,567 781,690 770,214Bonds and other interest-bearing securities 57,779 61,788 60,311 50,394 42,794Shares 20,400 22,363 19,339 34,838 51,704Shares in subsidiaries and investmentsin associates 47,205 46,358 46,363 46,382 45,773Assets where the customer bears the value change risk 4,079 3,969 4,172 3,860 3,743Derivative instruments 66,804 77,322 87,061 82,232 96,260Intangible assets 2,428 2,336 2,268 2,146 2,056Property, equipment and leasing assets 2,911 2,914 2,970 1,101 1,081Current tax assets 1,313 448 - 2,322 1,484Deferred tax assets 310 365 425 472 471Other assets 8,968 12,727 16,713 13,307 20,061Prepaid expenses and accrued income 4,139 3,761 4,792 4,075 4,068Total assets 2,241,612 2,164,668 1,894,704 2,177,365 2,294,735
Liabilities and equityDue to credit institutions 212,715 209,637 189,176 218,830 217,291Deposits and borrowing from the public 1,118,658 1,048,659 827,753 1,007,257 1,132,359Liabilities where the customer bears the value change risk 4,166 4,027 4,271 3,927 3,793Issued securities 684,792 674,987 648,977 712,465 707,071Derivative instruments 48,645 44,266 54,491 57,377 59,539Short positions 7,876 11,753 1,572 11,441 8,581Current tax liabilities - - 184 - -Deferred tax liabilities 932 1,066 1,066 2,026 2,234Provisions 328 307 429 426 455Other liabilities 12,909 20,939 8,786 12,931 14,383Accrued expenses and deferred income 7,717 6,841 7,164 8,343 8,614Subordinated liabilities 32,782 33,199 33,400 33,008 32,903Total liabilities 2,131,520 2,055,681 1,777,269 2,068,031 2,187,223
Untaxed reserves 734 762 793 535 539
Share capital 3,013 3,013 3,013 3,008 3,001Share premium 5,629 5,629 5,628 5,410 5,081Other funds 8,218 9,156 9,242 12,056 12,456Retained earnings 88,787 88,936 78,159 78,285 78,390Profit for the period 3,711 1,491 20,600 10,040 8,045Total equity 109,358 108,225 116,642 108,799 106,973Total liabilities and equity 2,241,612 2,164,668 1,894,704 2,177,365 2,294,735
55 Handelsbanken
INTERIM REPORT JANUARY – JUNE 2017

INTERIM REPORT JANUARY – JUNE 2017
55 Handelsbanken
CHANGE IN SHAREHOLDER’S EQUITY – PARENT COMPANY
During the January–June 2017 period, convertibles for a nominal value of SEK 1m (1,951) relating to subordinated convertible bonds were converted into 22,151 class A shares (28,800,955). At the end of the period, the number of Handelsbanken shares in the trading book was 0 (0).
January – June 2017 SEK mShare capital
Statutory reserve
Fund forinternally
developed software
Share premium
Hedge reserve *
Fair value reserve *
Translation reserve *
Retained earnings Total
Opening equity 3,013 2,682 1,766 5,628 -119 974 3,939 98,759 116,642Profit for the period 3,711 3,711
Other comprehensive income 557 54 -1,857 -1,246Total comprehensive income for the period 557 54 -1,857 3,711 2,465
Dividend -9,721 -9,721
Group contributions provided -37 -37
Tax effect on Group contribution 8 8Effects of convertible subordinated loans 0 1 1
Fund for internally developed software 222 -222
Closing equity 3,013 2,682 1,988 5,629 438 1,028 2,082 92,498 109,358
January – December 2016 SEK mShare capital
Statutory reserve
Fund forinternally
developed software
Share premium
Hedge reserve *
Fair value reserve *
Translation reserve *
Retained earnings Total
Opening equity 2,956 2,682 3,204 1,349 2,016 3,538 91,367 107,112Profit for the period 20,600 20,600
Other comprehensive income -1,468 -1,042 401 -2,109Total comprehensive income for the period -1,468 -1,042 401 20,600 18,491
Dividend -11,442 -11,442Effects of convertible subordinated loans 57 2,424 2,481
Fund for internally developed software 1,766 -1,766
Closing equity 3,013 2,682 1,766 5,628 -119 974 3,939 98,759 116,642
January – June 2016 SEK mShare capital
Statutory reserve
Fund forinternally
developed software
Share premium
Hedge reserve *
Fair value reserve *
Translation reserve *
Retained earnings Total
Opening equity 2,956 2,682 3,204 1,349 2,016 3,538 91,367 107,112Profit for the period 8,045 8,045
Other comprehensive income 2,272 -507 -429 1,336Total comprehensive income for the period 2,272 -507 -429 8,045 9,381
Dividend -11,442 -11,442Effects of convertible subordinated loans 45 1,877 1,922
Fund for internally developed software 1,535 -1,535
Closing equity 3,001 2,682 1,535 5,081 3,621 1,509 3,109 86,435 106,973
* Included in fair value fund.
Unrestricted equity
Unrestricted equity
Restricted equity
Restricted equity
Restricted equity Unrestricted equity
56 Handelsbanken
INTERIM REPORT JANUARY – JUNE 2017
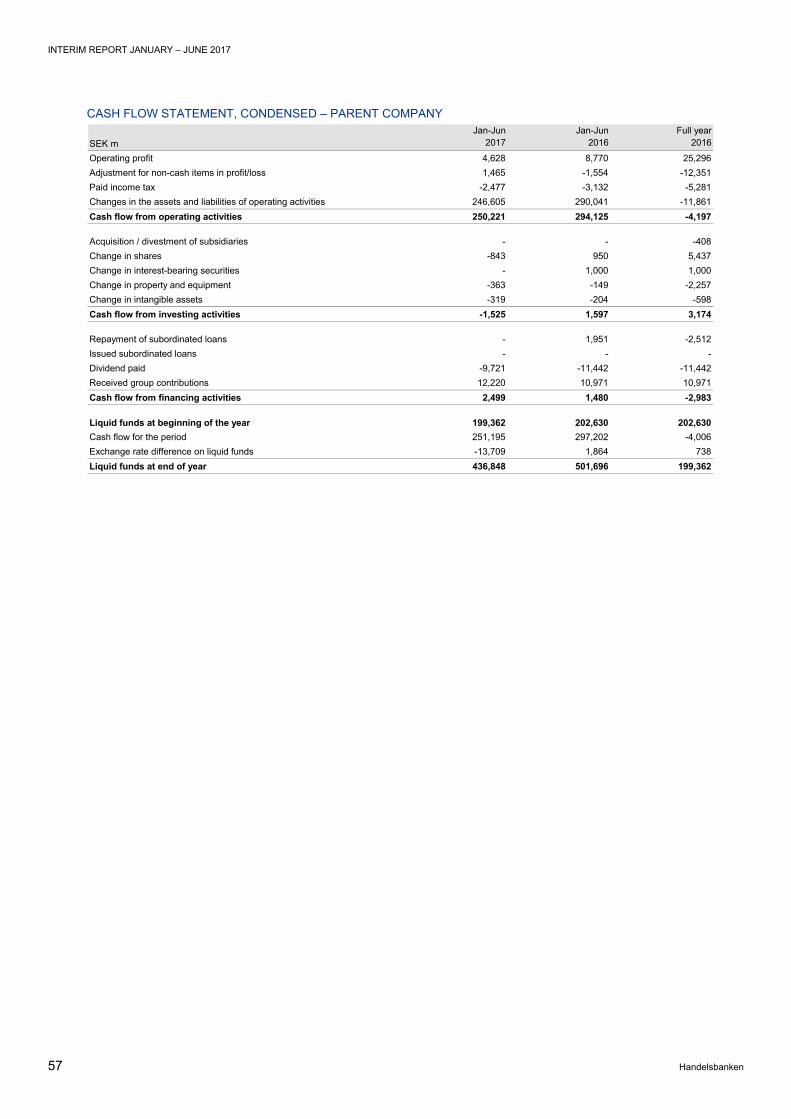
INTERIM REPORT JANUARY – JUNE 2017
56 Handelsbanken
CASH FLOW STATEMENT, CONDENSED – PARENT COMPANY
SEK mJan-Jun
2017Jan-Jun
2016Full year
2016
Operating profit 4,628 8,770 25,296Adjustment for non-cash items in profit/loss 1,465 -1,554 -12,351Paid income tax -2,477 -3,132 -5,281Changes in the assets and liabilities of operating activities 246,605 290,041 -11,861Cash flow from operating activities 250,221 294,125 -4,197
Acquisition / divestment of subsidiaries - - -408Change in shares -843 950 5,437Change in interest-bearing securities - 1,000 1,000Change in property and equipment -363 -149 -2,257Change in intangible assets -319 -204 -598Cash flow from investing activities -1,525 1,597 3,174
Repayment of subordinated loans - 1,951 -2,512Issued subordinated loans - - -Dividend paid -9,721 -11,442 -11,442Received group contributions 12,220 10,971 10,971Cash flow from financing activities 2,499 1,480 -2,983
Liquid funds at beginning of the year 199,362 202,630 202,630Cash flow for the period 251,195 297,202 -4,006Exchange rate difference on liquid funds -13,709 1,864 738Liquid funds at end of year 436,848 501,696 199,362
57 Handelsbanken
INTERIM REPORT JANUARY – JUNE 2017

INTERIM REPORT JANUARY – JUNE 2017
57 Handelsbanken
OWN FUNDS AND CAPITAL REQUIREMENT – PARENT COMPANY
Own funds and capital ratios – Parent company
Capital requirement – Parent company
Capital requirement credit risks, standardised approach * – Parent company
SEK m30 Jun
201731 Mar
201731 Dec
201630 Sep
201630 Jun
2016
Common equity tier 1 capital 101,639 101,698 102,883 96,742 95,408
Total tier 1 capital 113,650 114,296 115,651 108,898 107,453
Total tier 2 capital 16,302 16,164 16,225 16,263 16,006
Total own funds 129,952 130,460 131,876 125,161 123,459
Capital ratios and buffersCommon equity tier 1 ratio, CRR 21.8% 22.3% 23.4% 21.8% 20.8%
Tier 1 ratio, CRR 24.4% 25.0% 26.3% 24.5% 23.5%
Total capital ratio, CRR 27.9% 28.5% 30.0% 28.2% 27.0%
Risk exposure amount, CRR 466,443 456,975 439,657 444,468 457,600
Own funds in relation to capital requirement according to transitional rules 255% 258% 260% 244% 241%
Institution-specific buffer requirements 3.7% 3.6% 3.4% 3.4% 3.4%
of which capital conservation buffer requirement 2.5% 2.5% 2.5% 2.5% 2.5%
of which countercyclical capital buffer requirement 1.2% 1.1% 0.9% 0.9% 0.9%
of which systemic risk buffer requirement - - - - -Common equity tier 1 capital available for use as a buffer 17.3% 17.8% 18.9% 17.3% 16.3%
SEK m30 Jun
201731 Mar
201731 Dec
201630 Sep
201630 Jun
2016
Credit risk according to standardised approach 11,367 11,136 11,258 11,390 11,190
Credit risk according to IRB Approach 21,317 20,466 19,043 19,295 20,657
Market risk 800 936 873 817 711
Credit valuation adjustment risk (CVA) 438 627 594 650 645
Operational risk 3,393 3,393 3,405 3,405 3,405Total capital requirement 37,315 36,558 35,173 35,557 36,608
Adjustment according to Basel I floor 14,421 14,686 16,010 16,137 15,147Capital requirement, Basel I floor 51,736 51,244 51,183 51,694 51,755
Total own funds, Basel I floor 131,739 132,262 133,016 126,315 124,606
SEK m30 Jun
201731 Mar
201731 Dec
201630 Sep
201630 Jun
2016
Sovereign and central banks 0 14 6 4 5
Municipalities 0 2 2 3 1
Multilateral development banks 0 0 0 0 0
International organisations 0 0 0 0 0
Institutions 65 61 64 65 58
Corporates 903 771 783 917 818
Households 995 992 1,011 957 938
Collateral in real estate 2,808 2,762 2,665 2,574 2,487
Past due items 27 26 21 19 19
Equities 6,115 6,111 6,111 6,354 6,372
Other items 455 397 595 497 492Total 11,367 11,136 11,258 11,390 11,190
* Information about capital requirements for the exposure classes where there are exposures.
58 Handelsbanken
INTERIM REPORT JANUARY – JUNE 2017

INTERIM REPORT JANUARY – JUNE 2017
58 Handelsbanken
Capital requirement credit risks IRB – Parent company
Capital requirement market risks – Parent company
Leverage ratio – Parent company
SEK m30 Jun
201731 Mar
201731 Dec
201630 Sep
201630 Jun
2016
Sovereign and central banks 587
Corporates 16,429 15,875 14,512 15,107 15,314
Households 2,050 2,261 2,265 2,343 2,335
Private individuals 1,575 1,779 1,788 1,847 1,831
of which property loans 845 821 812 836 830
of which other loans 730 958 976 1,011 1,001
Small companies 475 482 477 496 504
Institutions 1,121 1,443 1,392 1,301 1,381
Equity exposures 1,038 794 780 456 1,541
of which listed shares - - - - 949
of which other shares 1,038 794 780 456 593
Non credit-obligation assets 90 91 92 88 86
Securitisation positions 2 2 2 0 0Total IRB 21,317 20,466 19,043 19,295 20,657
SEK m30 Jun
201731 Mar
201731 Dec
201630 Sep
201630 Jun
2016
Position risk in the trading book 793 928 864 810 703
Interest rate risk 784 917 855 801 694
of which positions in securitisation instruments - - - - 0 Equity price risk 9 11 9 9 9
Exchange rate risk - - - - -
Commodities risk 7 8 9 7 8
Settlement risk 0 - 0 0 0Total capital requirement for market risks 800 936 873 817 711
SEK m30 Jun
201731 Mar
201731 Dec
201630 Sep
201630 Jun
2016
Balance sheet according to accounting regulations 2,241,612 2,164,668 1,894,704 2,177,365 2,294,735Adjustment for differences between carrying amount and leverage ratio exposure - derivatives -23,522 -24,891 -12,825 -18,977 -16,621Adjustment for differences between carrying amount and leverage ratio exposure - repos and securities loans 3,342 3,856 4,440 5,447 8,471Assets reported off the balance sheet, gross (before adjustment for conversion factor) 541,924 530,052 539,468 539,151 531,167Deduction from assets off the balance sheet after application of conversion factor -352,673 -345,307 -348,431 -347,254 -343,000Assets reported off the balance sheet, net 189,251 184,745 191,037 191,897 188,167Additional adjustment -619,930 -574,506 -572,136 -563,981 -8,361Assets on which the leverage ratio is calculated 1,790,753 1,753,872 1,505,220 1,791,751 2,466,391
Capital on which the leverage ratio can be calculatedTier 1 capital 113,650 114,296 115,651 108,898 107,453
Leverage ratioLeverage ratio calculated on tier 1 capital 6.3% 6.5% 7.7% 6.1% 4.4%
59 Handelsbanken
INTERIM REPORT JANUARY – JUNE 2017
INTERIM REPORT JANUARY – JUNE 2017
59 Handelsbanken
We hereby declare that this half-yearly report provides a true and fair view of the Bank’s and the Group’s operations, financial position and performance and describes material risks and uncertainty factors faced by the Bank and the companies that are part of the Group.
Stockholm, 18 July 2017
Pär Boman Fredrik Lundberg Karin Apelman Chairman of the Board Vice Chairman Board Member
Jon Fredrik Baksaas Kerstin Hessius Jan-Erik Höög Board Member Board Member Board Member
Ole Johansson Lise Kaae Benthe Rathe Board Member Board Member Board Member
Charlotte Skog Anders Bouvin Board Member Group Chief Executive
60 Handelsbanken
INTERIM REPORT JANUARY – JUNE 2017

INTERIM REPORT JANUARY – JUNE 2017
60 Handelsbanken
PRESS AND TELEPHONE CONFERENCE A press and analyst conference is being arranged at the Bank’s head office at 9 a.m. (CET) on 18 July.
A phone conference will be held at 10:30 a.m. (CET) on 18 July.
Press releases, presentations, the Fact Book and a recording of the telephone conference will be available at handelsbanken.se/ireng.
The interim report for January–September 2017 will be published on 18 October 2017.
For further information, please contact: Anders Bouvin, President and Group Chief Executive Tel: +46 (0)8 22 92 20
Rolf Marquardt, CFO Tel: +46 (0)8 22 92 20
Mikael Hallåker, Head of Investor Relations Tel: +46 (0)8 701 29 95, [email protected]
61 Handelsbanken
INTERIM REPORT JANUARY – JUNE 2017

INTERIM REPORT JANUARY – JUNE 2017
61 Handelsbanken
Auditors’ review report To the Board of Svenska Handelsbanken AB (publ), corporate identity number 502007-7862
INTRODUCTION We have reviewed the interim report for Svenska Handelsbanken AB (publ) as at 30 June 2017 and for the six-month period then ended. The Board of Directors and the Chief Executive are responsible for the preparation and presentation of this interim report in accordance with IAS 34 and the Swedish Annual Accounts Act for Credit Institutions and Securities Companies. Our responsibility is to express a conclusion on this interim report based on our review.
SCOPE OF THE REVIEW We conducted our review in accordance with the International Standard on Review Engagements ISRE 2410 Review of Interim Financial Statements Performed by the Independent Auditor of the Entity. A review consists of making inquiries, primarily of persons responsible for financial and accounting matters, and applying analytical and other review procedures. A review is substantially less in scope
than an audit conducted in accordance with International Standards on Auditing and other generally accepted auditing standards in Sweden. The procedures performed in a review do not enable us to obtain assurance that we would become aware of all significant matters that might be identified in an audit. Accordingly, we do not express an audit opinion.
CONCLUSION Based on our review, nothing has come to our attention that causes us to believe that the interim report is not prepared, in all material respects, in accordance with IAS 34 and the Swedish Annual Accounts Act for Credit Institutions and Securities Companies regarding the Group, and in accordance with the Swedish Annual Accounts Act for Credit Institutions and Securities Companies regarding the parent company.
Stockholm, 18 July 2017
Ernst & Young AB PricewaterhouseCoopers AB Jesper Nilsson, Authorised Public Accountant Johan Rippe, Authorised Public Accountant
62 Handelsbanken
INTERIM REPORT JANUARY – JUNE 2017

INTERIM REPORT JANUARY – JUNE 2017
62 Handelsbanken
Share price performance and other informationThe Swedish stock market grew by 6% during the first six months of the year. The Stockholm stock exchange’s bank index rose by 1%. Handelsbanken’s class A shares closed at SEK 120.60, a decline of 5%, but including the dividend paid amounting to SEK 5.00, the total return was -1%. Since 1 January 2000, Handelsbanken’s share price has increased by 238%, excluding dividends, while the Stockholm stock exchange has risen by 34%.
SHARE PRICE PERFORMANCE SINCE 31 DEC 1999
ANALYSTS WHO MONITOR THE BANK
Svenska Handelsbanken AB (publ), Corporate identity no. 502007-7862 SE-106 70 Stockholm, Sweden, Telephone: +46 (0)8-701 10 00, handelsbanken.com
0
50
100
150
200
250
300
350
400
450
Dec
-99
Dec
-00
Dec
-01
Dec
-02
Dec
-03
Dec
-04
Dec
-05
Dec
-06
Dec
-07
Dec
-08
Dec
-09
Dec
-10
Dec
-11
Dec
-12
Dec
-13
Dec
-14
Dec
-15
Dec
-16
Index 100 = 31 December1999
SHB A OMX Stockhom Banks OMX Stockholm 30 Index
Company Analyst Email addressABG SUNDAL COLLIER Magnus Andersson [email protected]
ARCTIC SECURITIES Roy Tilley [email protected]
AUTONOMOUS Jacob Kruse [email protected]
BANK OF AMERICA MERRILL LYNCH
BARCLAYS Paulina Sokolova [email protected]
BERENBERG BANK Adam Barrass [email protected]
CARNEGIE Jens Hallen [email protected]
CITIGROUP Ronit Ghose [email protected]
CREDIT SUISSE Jan Wolter [email protected] BANK Matti Ahokas [email protected]
DEUTSCHE BANK Benjamin Goy [email protected]
DNB Nicholas McBeath [email protected]
EVLI Jaakko Tyrväinen [email protected]
EXANE BNP PARIBAS Andreas Håkansson [email protected]
GOLDMAN SACHS Willis Palermo [email protected]
JEFFERIES INTERNATIONAL Kapilan Pillai [email protected]
J P MORGAN Vivek Gautam [email protected]
KEEFE, BRUYETTE & WOODS Karl Morris [email protected]
MACQUARIE SECURITIES Edward Firth [email protected]
MEDIOBANCA Riccardo Rovere [email protected]
MORGAN STANLEY Alice Timperley [email protected]
NORDEA Maths Liljedahl [email protected]
PARETO Robin Rane [email protected]
REDBURN Amal Shah [email protected]
ROYAL BANK OF CANADA Adrian Cighi [email protected]
SEB ENSKILDA EQUITIES Peter Kessiakoff [email protected]
SOCIETE GENERALE Geoff Dawes [email protected]
SPAREBANK 1 MARKETS Odd Weidel [email protected]
SWEDBANK Bengt Kirkøen [email protected]
UBS Anton Kryachok [email protected]
63 Handelsbanken
INTERIM REPORT JANUARY – JUNE 2017

handelsbanken.com | +46 (0)8 701 10 00 | SE-106 70 Stockholm, Sweden