interim report, q2, april – june 2016mb.cision.com/main/1169/2046429/540420.pdfconfectionery...
TRANSCRIPT
Interim report, Q2, April – June 2016Stockholm, 15 July 2016
Net sales for the quarter increased by 6.4 per cent to SEK 1,362m (1,280), including a negative impact from foreign exchange rates of –0.5 per cent. Organic growth was 2.0 per cent.
Operating profit increased to SEK 142m (130).
Cash flow from operating activities amounted to SEK 114m (163).
Net debt/EBITDA ratio was 2.82x (3.30).
Second quarter 6 months Rolling 12 Full year
SEKmApr–Jun
2016Apr–Jun
2015Change,
%Jan–Jun
2016Jan–Jun
2015Change,
%Jul 2015– Jun 2016
2015
Net sales 1,362 1,280 6.42 2,720 2,593 4.9² 5,801 5,674
Operating profit, adjusted 150 133 12.8 276 241 14.5 725 690
Operating profit margin, adjusted, % 11.0 10.4 0.6-pts 10.1 9.3 0.8-pts 12.5 12.2
Operating profit (EBIT) 142 130 9.2 250 220 13.6 701 671
Operating profit margin (EBIT margin), % 10.4 10.2 0.2-pts 9.2 8.5 0.7-pts 12.1 11.8
Profit before tax 110 91 20.9 172 133 29.3 532 493
Profit for the period 77 66 16.7 121 99 22.2 408 386
Earnings per share, basic and diluted, SEK 0.27 0.23 17.4 0.42 0.35 20.0 1.43 1.35
Net debt/EBITDA, x (Rolling 12 months) 2.82 3.30 –14.5 2.82 3.30 –14.5 2.82 3.03
Cash flow from operating activities 114 163 –30.1 367 386 –4.9 908 927
1) European Securities and Markets Authority (ESMA) guidelines on Alternative Performance Measures (APMs) have been applied as of Q2 2016. In addition to the financial measures defined or specified in IFRS, certain key figures, which qualify as APMs, are presented to reflect the underlying business performance and enhance comparability from period to period. These APMs should not be considered in isolation as a substitute for performance measures in accordance with IFRS. The reconciliation of APMs to the most directly reconcilable IFRS measures in the financial statements has been included in the “Financial state-ments in summary” section of this report.
2) Organic growth at constant exchange rates and comparable units was 2.0 per cent for the quarter and 0.6 per cent for the first half year. See further under Net sales on page 3.
Key ratios1

2
Clo
etta [ Interim rep
ort, Q
2 2016
]
Message from the CEO
Message from the CEO
Good sales growth and improved operating profit
Cloetta’s sales were up in the quarter, both organically and through acquisitions. Operating profit (EBIT) for the quarter im-proved and amounted to SEK 142m (130). Operating profit, adjusted for items affecting comparability, also strengthened to SEK 150m (133). Profit after tax increased to SEK 77m (66). Both operating profit margin and operating profit margin adjusted, improved to 10.4 per cent (10.2) and 11.0 per cent (10.4) respectively. The improvement in profit and margins was mainly driven by higher efficiency in supply chain but also growth in sales.
Strong cash flow Cash flow from operating activities before changes in working capital improved to SEK 149m (100). Cash flow from changes in working capital was negatively impacted by the increase of inventories mainly related to build up of seasonals and changes in production planning. Cash flow from operating activities therefore amounted to SEK 114m (163). Cloetta’s cash-generating ability has thus been further demon-strated. The ambition is to use future cash flows for repayment of debt and distributions of dividends, while at the same time providing financial flexibility for complementary acquisitions.
Stable net debt/EBITDA ratio despite dividend paymentsThe net debt/EBITDA ratio has decreased compared to the same quarter of last year, but was stable compared to the first quarter of 2016. During the quarter, dividend of SEK 144m (–) was paid. The net debt/EBITDA ratio at the end of the quarter was 2.82x (3.30). The long-term target is a net debt/EBITDA ratio of 2.5x. Loans of SEK 90m (34) were repaid during the quarter. Confectionery marketThe confectionery market was predominantly negative in Finland, the Netherlands, Norway and Denmark. In Sweden and Italy, market development remained unchanged.
Good sales growthCloetta’s sales for the quarter increased by 6.4 per cent, of which organic growth accounted for 2.0 per cent, the acquisition of Lonka for 4.9 per cent and exchange rate differences for –0.5 per cent.
Sales in the quarter were up in Sweden, Finland, Norway and Denmark. In Germany, sales were flat. The positive trend in Sweden was driven by both improved distribution among certain customers and higher sales in pick-and-mix, while Finland was fuelled by pick-and-mix sales and pastilles.
Sales were down in the UK, the Netherlands, Italy and the export markets. The reported drop in sales in the UK is partly attributable to a weaker British pound following the Brexit referendum. Less than 5 per cent of the Group’s sales come from the UK and the possible future impact of Brexit is therefore not expected to be material for Cloetta. The decrease in sales in the Netherlands is explained by weak market development. In Italy Cloetta’s sales were slightly down, although the total market there stabilised during the quarter.
Closure of factory in Dieren according to planThe planned closure of the factory in Dieren, the Netherlands, as part of the integration of Lonka following the acquisition one year ago, is proceeding according to plan and production there is expected to cease at the end of 2016. Expansion of the factory in Levice, Slovakia, to which production from Dieren will be transferred at the beginning of 2017, is under construction. As previously communicated, the acquisition of Lonka is expected to generate annual cost savings of approximately SEK 35m.
Continued gradual improvementCloetta is returning to organic growth, which is highly satisfying.
In the past quarter Cloetta continued its gradual improvement in both operating profit and operating margin. The net debt/EBITDA ratio has decreased in relation to the same quarter of 2015 and was largely unchanged compared to the first quarter of 2016, despite the payment of dividend during the quarter. We have thus taken further steps towards meeting our long-term financial targets.
David NuutinenPresident and CEO
David Nuutinen, President and CEO

3
Clo
etta [ Interim rep
ort, Q
2 2016
]Financial overview
Financial overview
Development in the second quarterNet salesNet sales for the second quarter rose by 82m to SEK 1,362m (1,238) compared to the same period of last year. Organic growth was 2.0 per cent, acquisitions accounted for 4.9 per cent and changes in exchange rates accounted for –0.5 per cent.
Sales in the quarter were up in Sweden, Finland, Norway and Denmark. In Germany, sales were unchanged. Sales were down in the UK, the Netherlands, Italy and the export markets.
Changes in net sales1, % Apr–Jun 2016 Jan–Jun 2016
Organic growth 2.0 0.6
Structural changes 4.9 4.9
Changes in exchange rates – 0.5 – 0.6
Total 6.4 4.9
1) See page 1, footnote 1 under Key ratios.
Gross profitGross profit amounted to SEK 572m (524), which is equal to a gross margin of 42.0 per cent (40.9). The improvement in gross margin is mainly due to higher efficiency in the supply chain.
Operating profitOperating profit improved to SEK 142m (130). The improvement is mainly due to higher efficiency in the supply chain and increased sales. Operating profit, adjusted, improved to SEK 150m (133).
Items affecting comparabilityOperating profit for the quarter includes items affecting compara-bility that mainly are related to the planned closure of the factory in Dieren, the Netherlands.
Net financial itemsNet financial items for the quarter amounted to SEK –32m (–39). Interest expenses related to external borrowings were SEK –24m (–28) and other financial items amounted to SEK –8m (–11). Of the total net financial items SEK –5m (–9) is non-cash in nature.
Profit for the periodProfit for the period was SEK 77m (66), which is equal to basic and diluted earnings per share of SEK 0.27 (0.23). Income tax for the period was SEK –33m (–25). The effective tax rate for the quarter is 30.0 per cent (27.5).
Acquisitions and divestmentsNo acquisitions or divestments took place in the second quarter.
Developments in the first half of the yearNet salesNet sales for the first half of the year increased by SEK 127m to SEK 2,720m (2,593) compared to the same period of last year. Organic growth was 0.6 per cent, acquisitions accounted for 4.9 per cent and changes in exchange rates accounted for –0.6 per cent.
Sales increased or were unchanged in Sweden, Finland, Norway, Denmark and Germany, but declined in The Netherlands, Italy, the UK and the export markets.
Gross ProfitGross profit amounted to SEK 1,078m (1,015), which is equal to a gross margin of 39.6 per cent (39.1). The improvement in gross margin is mainly due to higher efficiency in the supply chain.
Operating profit Operating profit improved to SEK 250m (220).The improvement is mainly due to higher efficiency in the supply chain. Operating profit, adjusted, improved to SEK 276m (241).

4
Clo
etta [ Interim rep
ort, Q
2 2016
]
Financial overview
Operating profit
SEKm
0
50
100
150
200
250
Q4Q3Q2Q1
2015 2016
Net salesSEKm
2015
0
200
400
600
800
1,000
1,200
1,400
1,600
1,800
Q4Q3Q2Q1
2016
Items affecting comparabilityOperating profit for the first half year includes items affecting compa-rability that are mainly related to a remeasurement in the contingent considerations for acquisitions but also to the planned closure of the factory in Dieren, the Netherlands.
Net financial itemsNet financial items for the first half year amounted to SEK –78m (–87). Interest expenses related to external borrowings were SEK –49m (–67) and other financial items amounted to SEK –29m (–20). Of the total net financial items SEK–11m (–21) is non-cash in nature.
Profit for the periodProfit for the first half year was SEK 121m (99), which is equal to basic and diluted earnings per share of SEK 0.42 (0.35). Income tax for the period was SEK –51m (–34). The effective tax rate for the first half year is 29.7 per cent (25.6).
Acquisitions and divestmentsNo acquisitions or divestments took place in the first half of the year.
Cash flow from operating and investing activitiesCash flow for the second quarterCash flow from operating activities before changes in working capital was SEK 149m (100). The improvement compared to prior year is mainly the result of an improved operating profit, lower interest expenses and improved cash flows from changes in provisions for a total of SEK 35m. The cash flow from changes in working capital was SEK –35m (63). Cash flow from operating and investing activities was SEK 82m (135).
Working CapitalCash flow from changes in working capital in the quarter was negatively impacted by the increase of inventories for an amount of
SEK –61m (–22) mainly related to build up of seasonals and change in production planning. The cash flow from the decrease in receivables in the quarter amounted to SEK 30m (87) mainly related to the last collections of the receivables from the seasonal sales in Italy. The cash flow from payables followed normal seasonal pattern of SEK –4m (–2).
InvestmentsCash flow from investing activities was SEK –32m (–28), fully attributable to investments in property, plant and equipment and intangibles.
Cash flow for the first half of the yearCash flow from operating activities before changes in working capital was SEK 270m (166). The improvement compared to prior year is mainly the result of an improved operating profit, lower interest expenses, lower cash flows from corporate income taxes and im-proved cash flows from changes in provisions for an amount of in total SEK 90m. The cash flow from changes in working capital was SEK 97m (220). Cash flow from operating and investing activities was SEK 297m (303).
Working capitalCash flow from changes in working capital was negatively impacted by the increase of inventories for an amount of SEK–99m (4) and the increase in payables for an amount of SEK 72m (31), mainly related to build up of seasonals and change in production planning. The cash flow from the decrease in receivables in the quarter amounted to SEK 124m (247) mainly related to collection of the receivables com-ing from the seasonal sales in Italy.
InvestmentsCash flow from investing activities was SEK –70m (–83), fully attributable to investments in property, plant and equipment and intangibles.
Cash flow from operating activities
SEKm
0
50
100
150
200
250
300
350
400
Q4Q3Q2Q1
2015 2016

5
Clo
etta [ Interim rep
ort, Q
2 2016
]Financial overview
Financial positionConsolidated equity at 30 June 2016 amounted to SEK 4, 377m (4,117), which is equal to SEK 15.2 (14.3) per share. Net debt at 30 June 2016 was SEK 2,695m (2,960).
Non-current borrowings totalled SEK 2,485m (2,786) and con-sisted of SEK 1,493m (1,809) in gross loans from credit institutions, senior secured notes of SEK 1,000m (1,000) and SEK –8m (–23) in capitalised transaction costs.
Total current borrowings amounted to SEK 346m (325) and consisted of SEK 360m (341) in gross loans from credit institutions, SEK –15m (–17) in capitalised transaction costs and accrued interest on loans from credit institutions and senior secured notes for an amount of SEK 1m (1). The short-term gross loans from credit insti-tutions in an amount of SEK 360m (341) consist of the short-term repayment obligation.
SEKm30 Jun
201630 Jun
201531 Dec
2015
Gross non-current borrowings 1,493 1,809 1,625
Gross current borrowings 360 341 360
Senior secured notes 1,000 1,000 1,000
Derivative financial instruments (current and non-current) 74 70 78
Interest payable 1 1 1
Gross debt 2,928 3,221 3,064 Cash and cash equivalents –233 –261 –246
Net debt 2,695 2,960 2,818
Cash and cash equivalents at 30 June 2016, excluding long-term unutilised overdraft facilities, amounted to SEK 233m (261). At 30 June 2016 Cloetta had unutilised overdraft facilities for a total of SEK 698m (717).
Other disclosuresSeasonal variationsCloetta’s sales and operating profit are subject to some seasonal variations. Sales in the first and second quarters are affected by the Easter holiday, depending on in which quarter it occurs. In the fourth quarter, sales are usually higher than in the first three quarters of the year, which is mainly attributable to the sale of products in Sweden and Italy in connection with the holiday season.
EmployeesThe average number of employees during the quarter was 2,603 (2,453). The increase is mainly attributable to the impact of the acquisition of Locawo B.V. including its subsidiaries.
Guidelines on Alternative Performance MeasuresOn 8 December 2015 the Swedish Financial Supervisory Authority (FSA) (”Finansinspektionen”) announced its intention to follow the ESMA (European Securities and Markets Authority) guidelines on Alternative Performance Measures (APMs). These guidelines are applicable for (interim) financial statements published after 3 July 2016. In accordance with these guidelines additional informa-tion on the use of APMs, including explanations of use and reconcilia-tion of the APMs to the most directly reconcilable IFRS measures in the financial statements, have been included in these interim financial statements.
APMs presented in these interim financial statements should not be considered as a substitute for measures of performance in accordance with IFRS and may not be comparable to similarly titled measures by other companies.
Acquisition of remaining 25 per cent of the shares in Aran Candy Ltd.On 4 July 2016 Cloetta Ireland Holding Ltd. acquired the remaining 25 per cent of the outstanding shares in Aran Candy Ltd., resulting in the settlement of the contingent consideration arising from the option agreement for an amount of SEK 106m.
Events after the balance sheet dateAfter the end of the reporting period, no significant events have taken place that could affect the company’s operations.

6
Clo
etta [ Interim rep
ort, Q
2 2016
]
Examples of new launches during the second quarter
FinlandAakkoset–EmojiAllsorts–Black WhiteJenkki–Hopea ToffeeLäkerol – Fizzy Cola YummiusCloetta Sprinkle– Crispy mintCloetta Sprinkle– Crunchy mangoTupla–Roasted corn
Sweden and NorwayPlopp RabarberGott&Blandat–FruktsalladLäkerol YUP–Melon sour
The NetherlandsRedBand– SmikkelsRedBand– SmullersVenco–Drop uitdeelmix
SwedenAhlgrens Bilar– Modell A16
Norway and FinlandCloetta Sprinkle–Ice cream waffelCloetta Sprinkle–Raspberry licorice
NorwayLäkerol Strawberry Lime
Travel Retail NordicThe Jelly Bean FactoryJenkki–Polka mintSkipper s Pipes 22-pack

7
Clo
etta [ Interim rep
ort, Q
2 2016
]
The Board of Directors hereby gives its assurance that the interim report provides a true and fair view of the business activities, financial position and results of operations of the Group and the Parent Company, and describes the significant risks and uncertainties
to which the Parent Company and the Group companies are exposed.
Stockholm, 15 July 2016Cloetta AB (publ)
Lilian Fossum BinerChairman
David NuutinenPresident and CEO
The information in this interim report has not been reviewed by the company’s auditors.
Lottie KnutsonMember of the Board
Mikael NormanMember of the Board
Adriaan NühnMember of the Board
Hans PoratMember of the Board
Camilla SvenfeltMember of the Board
Mikael SvenfeltMember of the Board
Lena GrönedalEmployee Board member
Mikael Ström Employee Board member

8
Clo
etta [ Interim rep
ort, Q
2 2016
]
Financial statements in summary
Financial statements in summaryConsolidated profit and loss account
Second quarter 6 months Rolling 12 Full year
SEKmApr–Jun
2016Apr–Jun
2015Jan–Jun
2016Jan–Jun
2015Jul 2015– Jun 2016 2015
Net sales 1,362 1,280 2,720 2,593 5,801 5,674
Cost of goods sold –790 –756 –1,642 –1,578 –3,527 –3,463
Gross profit 572 524 1,078 1,015 2,274 2,211
Other income – 0 – 0 0 0
Selling expenses –255 –239 –481 –484 –946 –949
General and administrative expenses –175 –155 –347 –311 – 627 – 591
Operating profit 142 130 250 220 701 671
Exchange differences on borrowings and cash and cash equivalents in foreign currencies 2 3 – 6 9 –16 –1
Other financial income 5 0 7 0 13 6
Other financial expenses –39 –42 –79 –96 –166 –183
Net financial items –32 –39 –78 –87 –169 –178
Profit before tax 110 91 172 133 532 493 Income tax –33 –25 –51 –34 –124 –107
Profit for the period 77 66 121 99 408 386
Profit for the period attributable to:
Owners of the Parent Company 77 66 121 99 408 386
Earnings per share, SEK Basic 0.27 0.23 0.42 0.35 1.43 1.35 Diluted1 0.27 0.23 0.42 0.35 1.43 1.35
Number of shares at end of period 288,619,299 288,619,299 288,619,299 288,619,299 288,619,299 288,619,299
Average number of shares (basic)1 286,159,369 286,481,689 286,105,529 286,481,689 286,103,275 286,290,840
Average number of shares (diluted)1 286,471,820 286,810,369 286,286,202 286,687,243 286,251,815 286,561,607
1) Cloetta entered into forward contracts to repurchase own shares to fulfill its future obligation to deliver the shares to the participants of the long-term share-based incentive plan. The table on page 16 presents the movements in the contracts as from 1 January 2014.

9
Clo
etta [ Interim rep
ort, Q
2 2016
]Financial statements in summary
Consolidated statement of comprehensive incomeSecond quarter 6 months Rolling 12 Full year
SEKmApr–Jun
2016Apr–Jun
2015Jan–Jun
2016Jan–Jun
2015Jul 2015– Jun 2016 2015
Profit for the period 77 66 121 99 408 386 Other comprehensive income
Remeasurement of defined benefit pension plans –46 81 –89 47 –9 127
Income tax on other comprehensive income that will not be reclassified subse-quently to profit or loss for the period 10 –18 20 –11 3 –28
Items that will never be reclassified to profit or loss for the period
–36 63 –69 36 –6 99
Currency translation differences 103 –43 140 –86 102 –124
Hedge of a net investment in a foreign operation –23 9 –29 20 –24 25
Income tax on other comprehensive income that will be reclassified subse-quently to profit or loss for the period, when specific conditions are met 5 –2 6 –4 5 –5
Items that are or may be reclassified to profit or loss for the period
85 –36 117 –70 83 –104
Total other comprehensive income 49 27 48 –34 77 –5
Total comprehensive income, net of tax 126 93 169 65 485 381
Total comprehensive income for the period attributable to:Owners of the Parent Company 126 93 169 65 485 381
Net financial itemsSecond quarter 6 months Rolling 12 Full year
SEKmApr–Jun
2016Apr–Jun
2015Jan–Jun
2016Jan–Jun
2015Jul 2015– Jun 2016 2015
Exchange differences on borrowings and cash 2 3 –6 9 –16 –1
Other financial income, third parties 1 0 1 0 2 1
Unrealized gains on single currency interest rate swaps 4 – 6 – 11 5
Other financial income 5 0 7 0 13 6
Interest expenses on third-party borrowings and realized losses on single currency interest rate swaps –24 –28 –49 – 67 –102 –120
Interest expenses, contingent earn-out liabilities –4 –4 –7 –7 –13 –13
Amortization of capitalized transaction costs –4 –5 –9 –9 –18 –18
Unrealized losses on single currency interest rate swaps – 2 – 0 – –
Other financial expenses –7 –7 –14 –13 –33 –32
Other financial expenses –39 –42 –79 –96 –166 –183
Net financial items –32 –39 –78 –87 –169 –178

10
Clo
etta [ Interim rep
ort, Q
2 2016
]
Financial statements in summary
Condensed consolidated balance sheetSEKm 30 Jun 2016 30 Jun 2015 31 Dec 2015
ASSETSNon-current assetsIntangible assets 6,073 5,806 5,948
Property, plant and equipment 1,696 1,615 1,698
Deferred tax asset 56 74 64
Other financial assets 20 112 27
Total non-current assets 7,845 7,607 7,737
Current assetsInventories 901 839 786
Other current assets 866 867 978
Derivative financial instruments 2 2 1
Cash and cash equivalents 233 261 246
Total current assets 2,002 1,969 2,011
Assets held for sale 8 16 11
TOTAL ASSETS 9,855 9,592 9,759
EQUITY AND LIABILITIESEquity 4,377 4,117 4,344
Non-current liabilitiesLong-term borrowings 2,485 2,786 2,612
Deferred tax liability 647 508 621
Derivative financial instruments 13 38 44
Other non-current liabilities – 88 43
Provisions for pensions and other long-term employee benefits 463 457 378
Provisions 9 11 10
Total non-current liabilities 3,617 3,888 3,708
Current liabilitiesShort-term borrowings 346 325 344
Derivative financial instruments 63 34 35
Other current liabilities 1,438 1,218 1,271
Provisions 14 10 57
Total current liabilities 1,861 1,587 1,707
TOTAL EQUITY AND LIABILITIES 9,855 9,592 9,759

11
Clo
etta [ Interim rep
ort, Q
2 2016
]Financial statements in summary
Condensed consolidated statement of changes in equity6 months Full year
SEKm Jan–Jun 2016 Jan–Jun 2015 2015
Equity at beginning of period 4,344 4,048 4,048
Profit for the period 121 99 386
Other comprehensive income 48 –34 –5
Total comprehensive income 169 65 381
Transactions with ownersReversal of capital contribution – – –842
Forward contract to repurchase own shares1 –3 – –12
Result on forward contract to repurchase own shares1 7 – –
Shares granted to participants LTI'131 –4 – –
Share-based payments 8 4 11
Dividend –144 – –
Total transactions with owners –136 4 –85
Equity at end of period 4,377 4,117 4,344
1) The forward contract to repurchase own shares covering 937,610 Cloetta AB shares for an amount of SEK 18.50678 has been settled in May 2016. 227,880 shares have been granted to participants of the long-term share-based incentive plan 2013 in May 2016. For the remaining 709,730 shares Cloetta entered into a forward contract to repurchase own shares for an amount of SEK 28.50 in June 2016.
2) Reversal of the capital contribution relates to the derecognition of the tax indemnity receivable. This reversal is non-cash in nature.
Condensed consolidated cash flow statementSecond quarter 6 months Rolling 12 Full year
SEKmApr–Jun
2016Apr–Jun
2015Jan–Jun
2016Jan–Jun
2015Jul 2015– Jun 2016 2015
Cash flow from operating activities before changes in working capital 149 100 270 166 801 697
Cash flow from changes in working capital –35 63 97 220 107 230
Cash flow from operating activities 114 163 367 386 908 927
Cash flow from investments in property, plant and equipment and intangible assets –32 –28 –70 –83 –148 –161
Cash flow from other investing activities – – – – –206 –206
Cash flow from investing activities –32 –28 –70 –83 –354 –367
Cash flow from operating and investing activities 82 135 297 303 554 560
Cash flow from financing activities –232 –34 –322 –279 –561 –518
Cash flow for the period –150 101 –25 24 –7 42
Cash and cash equivalents at beginning of period 374 150 246 229 261 229
Cash flow for the period –150 101 –25 24 –7 42
Foreign exchange difference 9 10 12 8 –21 –25
Cash and cash equivalents at end of period 233 261 233 261 233 246

12
Clo
etta [ Interim rep
ort, Q
2 2016
]
Financial statements in summary
Condensed consolidated key figures1
Second quarter 6 months Rolling 12 Full year
SEKmApr–Jun
2016Apr–Jun
2015Jan–Jun
2016Jan–Jun
2015Jul 2015– Jun 2016 2015
Profit
Net sales 1,362 1,280 2,720 2,593 5,801 5,674
Net sales, change, % 6.4 3.4 4.9 6.7 6.0 6.8
Organic net sales, change, % 2.0 0.8 0.6 2.4 0.6 1.5
Gross margin, % 42.0 40.9 39.6 39.1 39.2 39.0
Depreciation –59 –55 –117 –110 –234 –227
Amortization –2 –1 –3 –2 –5 –4
Operating profit, adjusted 150 133 276 241 725 690
Operating profit margin, adjusted, % 11.0 10.4 10.1 9.3 12.5 12.2
Operating profit (EBIT) 142 130 250 220 701 671
Operating profit margin (EBIT margin), % 10.4 10.2 9.2 8.5 12.1 11.8
EBITDA, adjusted 211 189 396 353 964 921
EBITDA 203 186 370 332 940 902
Profit margin, % 8.1 7.1 6.3 5.1 9.2 8.7
Financial position
Working capital 543 591 543 591 543 628
Capital expenditure –32 –28 –70 –83 –148 –161
Net debt 2,695 2,960 2,695 2,960 2,695 2,818
Capital employed 7,747 7,756 7,747 7,756 7,747 7,756
Return on capital employed, % (Rolling 12 months) 9.2 8.5 9.2 8.5 9.2 8.6
Equity/assets ratio, % 44.4 42.9 44.4 42.9 44.4 44.5
Net debt/equity, % 61.6 71.9 61.6 71.9 61.6 64.9
Return on equity, % (Rolling 12 months) 9.3 8.4 9.3 8.4 9.3 8.9
Equity per share, SEK 15.2 14.3 15.2 14.3 15.2 15.1
Net debt/EBITDA, x (Rolling 12 months) 2.82 3.30 2.82 3.30 2.82 3.03
Cash flow
Cash flow from operating activities 114 163 367 386 908 927
Cash flow from investing activities –32 –28 –70 –83 –354 –367
Cash flow after investments 82 135 297 303 554 560
Cash conversion, %2 84.8 85.2 82.3 76.5 84.6 82.5
Cash flow from operating activities per share, SEK 0.4 0.6 1.3 1.3 3.1 3.2
Employees
Average number of employees 2,603 2,453 2,592 2,443 2,538 2,583
1) See page 1, footnote 1 under Key ratios.2) Comparative figures have been restated due to a change in the definition of the cash conversion.
13
Clo
etta [ Interim rep
ort, Q
2 2016
]Financial statements in summary
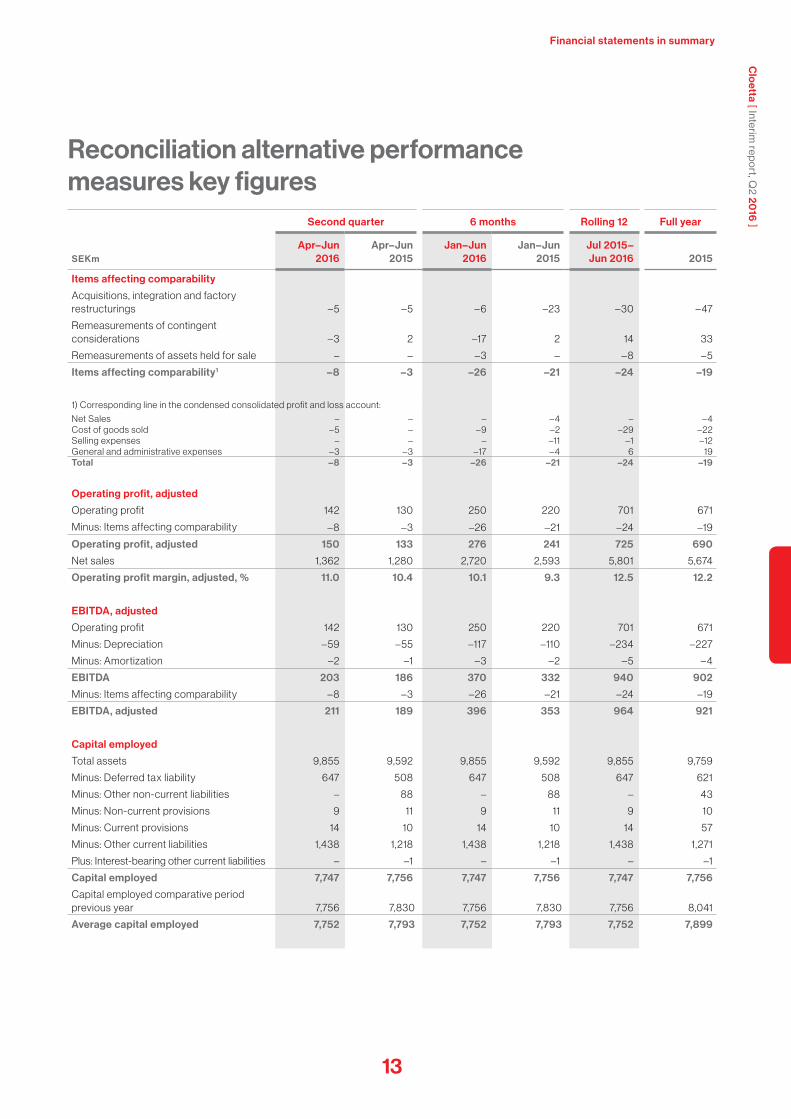
Reconciliation alternative performance measures key figures
Second quarter 6 months Rolling 12 Full year
SEKmApr–Jun
2016Apr–Jun
2015Jan–Jun
2016Jan–Jun
2015Jul 2015– Jun 2016 2015
Items affecting comparability
Acquisitions, integration and factory restructurings –5 –5 – 6 –23 –30 –47
Remeasurements of contingent considerations –3 2 –17 2 14 33
Remeasurements of assets held for sale – – –3 – –8 –5
Items affecting comparability1 –8 –3 –26 –21 –24 –19
1) Corresponding line in the condensed consolidated profit and loss account:
Net Sales – – – – 4 – – 4 Cost of goods sold – 5 – –9 –2 –29 –22 Selling expenses – – – –11 –1 –12 General and administrative expenses –3 –3 –17 – 4 6 19 Total –8 –3 –26 –21 –24 –19
Operating profit, adjusted
Operating profit 142 130 250 220 701 671
Minus: Items affecting comparability –8 –3 –26 –21 –24 –19
Operating profit, adjusted 150 133 276 241 725 690
Net sales 1,362 1,280 2,720 2,593 5,801 5,674
Operating profit margin, adjusted, % 11.0 10.4 10.1 9.3 12.5 12.2
EBITDA, adjusted
Operating profit 142 130 250 220 701 671
Minus: Depreciation –59 –55 –117 –110 –234 –227
Minus: Amortization –2 –1 –3 –2 –5 –4
EBITDA 203 186 370 332 940 902
Minus: Items affecting comparability –8 –3 –26 –21 –24 –19
EBITDA, adjusted 211 189 396 353 964 921
Capital employed
Total assets 9,855 9,592 9,855 9,592 9,855 9,759
Minus: Deferred tax liability 647 508 647 508 647 621
Minus: Other non-current liabilities – 88 – 88 – 43
Minus: Non-current provisions 9 11 9 11 9 10
Minus: Current provisions 14 10 14 10 14 57
Minus: Other current liabilities 1,438 1,218 1,438 1,218 1,438 1,271
Plus: Interest-bearing other current liabilities – –1 – –1 – –1
Capital employed 7,747 7,756 7,747 7,756 7,747 7,756
Capital employed comparative period previous year 7,756 7,830 7,756 7,830 7,756 8,041
Average capital employed 7,752 7,793 7,752 7,793 7,752 7,899

14
Clo
etta [ Interim rep
ort, Q
2 2016
]
Financial statements in summary
Second quarter 6 months Rolling 12 Full year
SEKmApr–Jun
2016Apr–Jun
2015Jan–Jun
2016Jan–Jun
2015Jul 2015– Jun 2016 2015
Return on capital employed
Operating profit (rolling 12 months) 701 660 701 660 701 671
Financial income (rolling 12 months) 13 1 13 1 13 6
Operating profit plus financial income (rolling 12 months) 714 661 714 661 714 677
Average capital employed 7,752 7,793 7,752 7,793 7,752 7,899
Return on capital employed, % 9.2 8.5 9.2 8.5 9.2 8.6
Cash conversion
EBITDA, adjusted 211 189 396 353 964 921
Minus: Capital expenditures –32 –28 –70 –83 –148 –161
EBITDA, adjusted less capital expenditures 179 161 326 270 816 760
EBITDA, adjusted 211 189 396 353 964 921
Cash conversion, % 84.8 85.2 82.3 76.5 84.6 82.5
Changes in net sales
Net sales 1,362 1,280 2,720 2,593 5,801 5,674
Net sales comparative period previous year 1,280 1,238 2,593 2,431 5,475 5,313
Net sales, change 82 42 127 162 326 361
Minus: Structural changes 63 15 127 47 288 208
Minus: Changes in exchange rates –7 17 –17 57 2 77
Organic growth 26 10 17 58 36 76
Structural changes, % 4.9 1.2 4.9 1.9 5.3 3.9
Organic growth, % 2.0 0.8 0.6 2.4 0.6 1.4
Reconciliation alternative performance measures key figures, Continued
15
Clo
etta [ Interim rep
ort, Q
2 2016
]Financial statements in summary
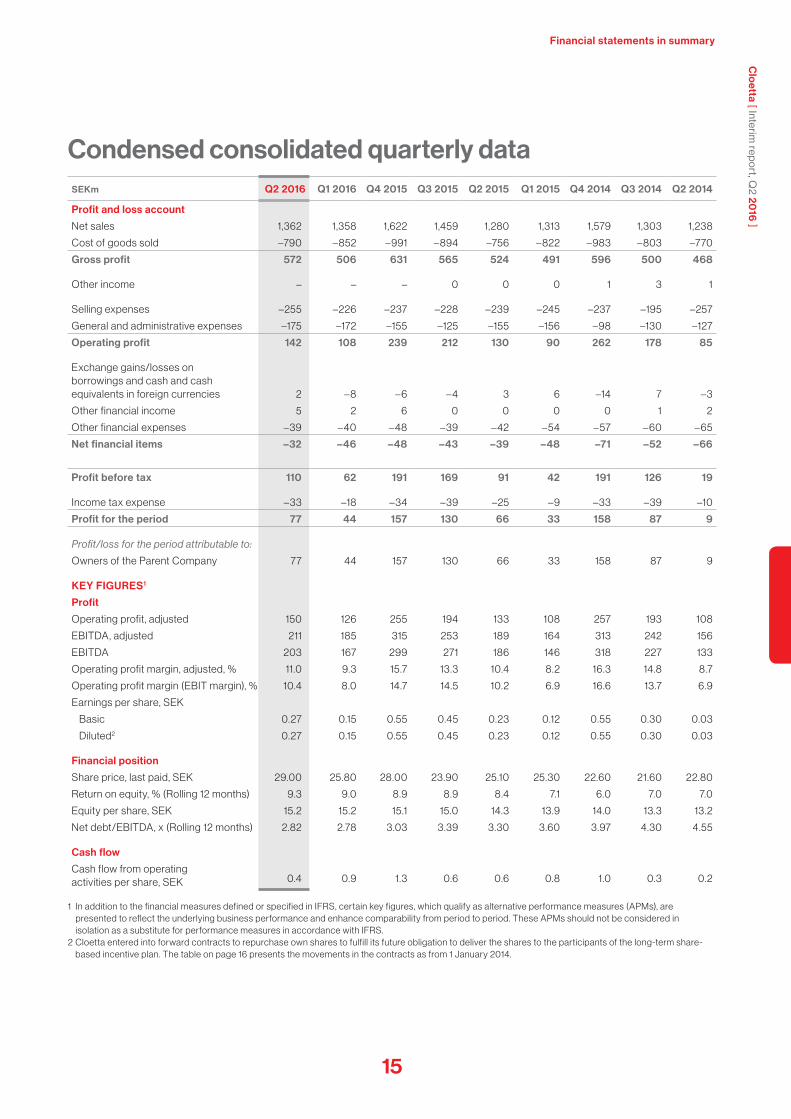
Condensed consolidated quarterly dataSEKm Q2 2016 Q1 2016 Q4 2015 Q3 2015 Q2 2015 Q1 2015 Q4 2014 Q3 2014 Q2 2014
Profit and loss account
Net sales 1,362 1,358 1,622 1,459 1,280 1,313 1,579 1,303 1,238
Cost of goods sold –790 –852 –991 –894 –756 –822 –983 –803 –770
Gross profit 572 506 631 565 524 491 596 500 468
Other income – – – 0 0 0 1 3 1
Selling expenses –255 –226 –237 –228 –239 –245 –237 –195 –257
General and administrative expenses –175 –172 –155 –125 –155 –156 –98 –130 –127
Operating profit 142 108 239 212 130 90 262 178 85
Exchange gains/losses on borrowings and cash and cash equivalents in foreign currencies 2 –8 – 6 –4 3 6 –14 7 –3
Other financial income 5 2 6 0 0 0 0 1 2
Other financial expenses –39 –40 –48 –39 –42 –54 –57 – 60 – 65
Net financial items –32 –46 –48 –43 –39 –48 –71 –52 –66
Profit before tax 110 62 191 169 91 42 191 126 19
Income tax expense –33 –18 –34 –39 –25 –9 –33 –39 –10
Profit for the period 77 44 157 130 66 33 158 87 9
Profit/loss for the period attributable to:
Owners of the Parent Company 77 44 157 130 66 33 158 87 9
KEY FIGURES1
Profit
Operating profit, adjusted 150 126 255 194 133 108 257 193 108
EBITDA, adjusted 211 185 315 253 189 164 313 242 156
EBITDA 203 167 299 271 186 146 318 227 133
Operating profit margin, adjusted, % 11.0 9.3 15.7 13.3 10.4 8.2 16.3 14.8 8.7
Operating profit margin (EBIT margin), % 10.4 8.0 14.7 14.5 10.2 6.9 16.6 13.7 6.9
Earnings per share, SEK
Basic 0.27 0.15 0.55 0.45 0.23 0.12 0.55 0.30 0.03
Diluted2 0.27 0.15 0.55 0.45 0.23 0.12 0.55 0.30 0.03
Financial position
Share price, last paid, SEK 29.00 25.80 28.00 23.90 25.10 25.30 22.60 21.60 22.80
Return on equity, % (Rolling 12 months) 9.3 9.0 8.9 8.9 8.4 7.1 6.0 7.0 7.0
Equity per share, SEK 15.2 15.2 15.1 15.0 14.3 13.9 14.0 13.3 13.2
Net debt/EBITDA, x (Rolling 12 months) 2.82 2.78 3.03 3.39 3.30 3.60 3.97 4.30 4.55
Cash flow
Cash flow from operating activities per share, SEK 0.4 0.9 1.3 0.6 0.6 0.8 1.0 0.3 0.2
1 In addition to the financial measures defined or specified in IFRS, certain key figures, which qualify as alternative performance measures (APMs), are presented to reflect the underlying business performance and enhance comparability from period to period. These APMs should not be considered in isolation as a substitute for performance measures in accordance with IFRS.
2 Cloetta entered into forward contracts to repurchase own shares to fulfill its future obligation to deliver the shares to the participants of the long-term share-based incentive plan. The table on page 16 presents the movements in the contracts as from 1 January 2014.

16
Clo
etta [ Interim rep
ort, Q
2 2016
]
Financial statements in summary
Number of shares
Transaction Date Contract 1 Contract 2 Contract 3 Contract 4
Balance 1 Jan 2014 1,037,610 – – –
Roll-forward 17 Jun 2014 –100,000 100,000
New contract 17 Jun 2014 1,100,000
Balance 31 Dec 2014 937,610 1,200,000 – – New contract 20 Jul 2015 430,000
Balance 31 Dec 2015 937,610 1,200,000 430,000 –
Settlement 18 May 2016 –227,880
Roll-forward 15 Jun 2016 –709,730 709,730
Balance 30 Jun 2016 – 1,200,000 430,000 709,730
Price, SEK 18.50678 23.00000 26.40000 28.50000
Movements forward contracts to repurchase own shares
17
Clo
etta [ Interim rep
ort, Q
2 2016
]Financial statements in summary
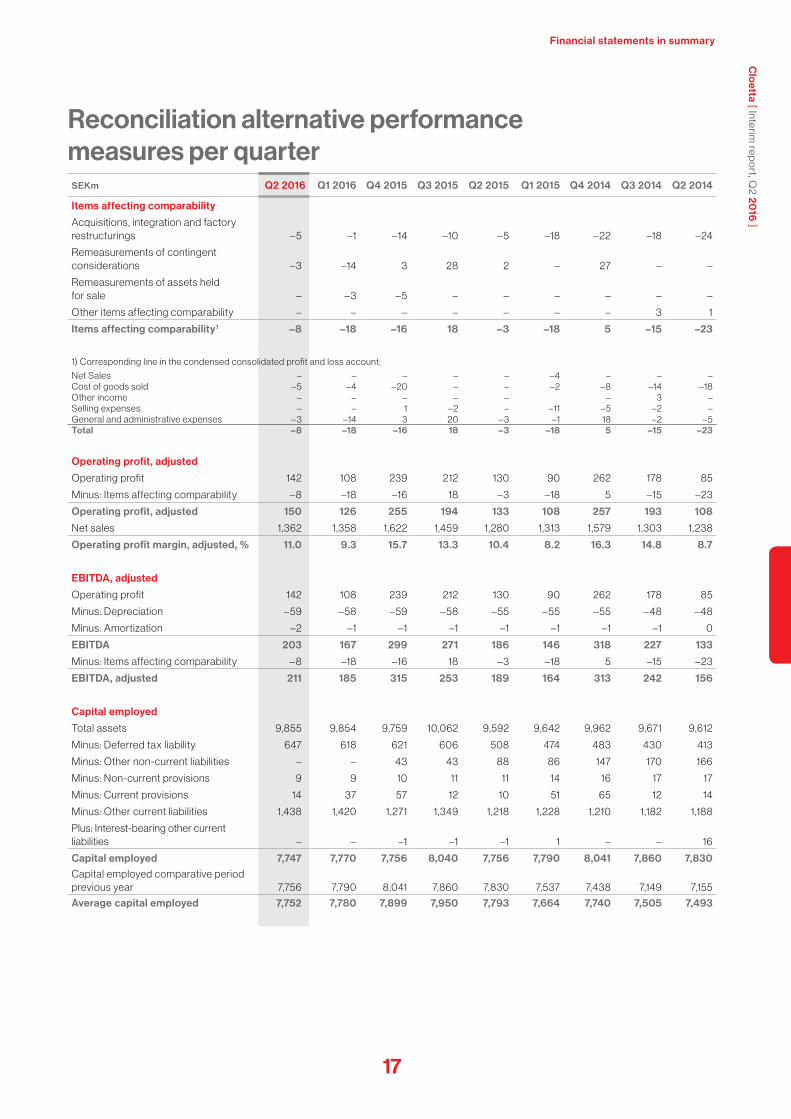
Reconciliation alternative performance measures per quarter
SEKm Q2 2016 Q1 2016 Q4 2015 Q3 2015 Q2 2015 Q1 2015 Q4 2014 Q3 2014 Q2 2014
Items affecting comparability
Acquisitions, integration and factory restructurings –5 –1 –14 –10 –5 –18 –22 –18 –24
Remeasurements of contingent considerations –3 –14 3 28 2 – 27 – –
Remeasurements of assets held for sale – –3 –5 – – – – – –
Other items affecting comparability – – – – – – – 3 1
Items affecting comparability1 –8 –18 –16 18 –3 –18 5 –15 –23
1) Corresponding line in the condensed consolidated profit and loss account:
Net Sales – – – – – – 4 – – – Cost of goods sold – 5 – 4 –20 – – –2 – 8 –14 –18 Other income – – – – – – 3 – Selling expenses – – 1 –2 – –11 – 5 –2 – General and administrative expenses –3 –14 3 20 –3 –1 18 –2 – 5 Total –8 –18 –16 18 –3 –18 5 –15 –23
Operating profit, adjusted
Operating profit 142 108 239 212 130 90 262 178 85
Minus: Items affecting comparability –8 –18 –16 18 –3 –18 5 –15 –23
Operating profit, adjusted 150 126 255 194 133 108 257 193 108
Net sales 1,362 1,358 1,622 1,459 1,280 1,313 1,579 1,303 1,238
Operating profit margin, adjusted, % 11.0 9.3 15.7 13.3 10.4 8.2 16.3 14.8 8.7
EBITDA, adjusted
Operating profit 142 108 239 212 130 90 262 178 85
Minus: Depreciation –59 –58 –59 –58 –55 –55 –55 –48 –48
Minus: Amortization –2 –1 –1 –1 –1 –1 –1 –1 0
EBITDA 203 167 299 271 186 146 318 227 133
Minus: Items affecting comparability –8 –18 –16 18 –3 –18 5 –15 –23
EBITDA, adjusted 211 185 315 253 189 164 313 242 156
Capital employed
Total assets 9,855 9,854 9,759 10,062 9,592 9,642 9,962 9,671 9,612
Minus: Deferred tax liability 647 618 621 606 508 474 483 430 413
Minus: Other non-current liabilities – – 43 43 88 86 147 170 166
Minus: Non-current provisions 9 9 10 11 11 14 16 17 17
Minus: Current provisions 14 37 57 12 10 51 65 12 14
Minus: Other current liabilities 1,438 1,420 1,271 1,349 1,218 1,228 1,210 1,182 1,188
Plus: Interest-bearing other current liabilities – – –1 –1 –1 1 – – 16
Capital employed 7,747 7,770 7,756 8,040 7,756 7,790 8,041 7,860 7,830 Capital employed comparative period previous year 7,756 7,790 8,041 7,860 7,830 7,537 7,438 7,149 7,155
Average capital employed 7,752 7,780 7,899 7,950 7,793 7,664 7,740 7,505 7,493

18
Clo
etta [ Interim rep
ort, Q
2 2016
]
Financial statements in summary
SEKm Q2 2016 Q1 2016 Q4 2015 Q3 2015 Q2 2015 Q1 2015 Q4 2014 Q3 2014 Q2 2014
Return on capital employed
Operating profit (rolling 12 months) 701 689 671 694 660 615 577 490 443
Financial income (rolling 12 months) 13 8 6 0 1 3 4 6 7
Operating profit plus financial income (rolling 12 months) 714 697 677 694 661 618 581 496 450
Average capital employed 7,752 7,780 7,899 7,950 7,793 7,664 7,740 7,505 7,493
Return on capital employed, % 9.2 9.0 8.6 8.7 8.5 8.1 7.5 6.6 6.0
Cash conversion
EBITDA, adjusted 211 185 315 253 189 164 313 242 156
Minus: Capital expenditures –32 –38 –47 –31 –28 –55 – 62 –44 –44
EBITDA, adjusted less capital expenditures 179 147 268 222 161 109 251 198 112
EBITDA, adjusted 211 185 315 253 189 164 313 242 156
Cash conversion, % 84.8 79.5 85.1 87.7 85.2 66.5 80.2 81.8 71.8
Changes in net sales
Net sales 1,362 1,358 1,622 1,459 1,280 1,313 1,579 1,303 1,238
Net sales comparative period previous year 1,280 1,313 1,579 1,303 1,238 1,193 1,441 1,194 1,131
Net sales, change 82 45 43 156 42 120 138 109 107
Minus: Structural changes 63 64 75 86 15 32 69 69 41
Minus: Changes in exchange rates –7 –10 4 15 17 40 45 47 41
Organic growth 26 –9 –36 55 10 48 24 –7 25
Structural changes, % 4.9 4.9 4.7 6.6 1.2 2.7 4.8 5.8 3.6
Organic growth, % 2.0 – 0.7 –2.3 4.2 0.8 4.0 1.7 – 0.6 2.2
Reconciliation alternative performance measures per quarter, Continued

19
Clo
etta [ Interim rep
ort, Q
2 2016
]Financial statements in summary
Second quarter 6 months Rolling 12 Full year
SEKmApr–Jun
2016Apr–Jun
2015Jan–Jun
2016Jan–Jun
2015Jul 2015– Jun 2016 2015
Net sales 27 24 47 42 93 88
Gross profit 27 24 47 42 93 88
Other income – – – – – –
General and administrative expenses –36 –29 – 62 –57 –118 –113
Operating loss –9 –5 –15 –15 –25 –25
Net financial items –8 –7 –15 –18 30 27
Profit or loss before tax –17 –12 –30 –33 5 2
Income tax 4 3 6 7 –1 0
Profit or loss for the period –13 –9 –24 –26 4 2
Profit or loss for the period corresponds to comprehensive income for the period.
Parent CompanyCondensed parent company profit and loss account

20
Clo
etta [ Interim rep
ort, Q
2 2016
]
Financial statements in summary
Condensed parent company balance sheetSEKm 30 Jun 2016 30 Jun 2015 31 Dec 2015
ASSETSNon-current assets 5,330 5,300 5,307
Current assets 25 59 90
TOTAL ASSETS 5,355 5,359 5,397
EQUITY AND LIABILITIES
Equity 4,058 4,183 4,218
Non-current liabilitiesBorrowings 1,125 1,119 1,122
Derivative financial instruments – 9 3
Provisions 1 1 1
Total non-current liabilities 1,126 1,129 1,126
Current liabilities
Derivative financial instruments 12 12 14
Current liabilities 159 35 39
Total current liabilities 171 47 53
TOTAL EQUITY AND LIABILITIES 5,355 5,359 5,397
Condensed parent company statement of changes in equity
6 months Full year
SEKm Jan–Jun 2016 Jan–Jun 2015 2015
Equity at beginning of period 4,218 4,205 4,205
Profit or loss for the period –24 –26 2
Total comprehensive income –24 –26 2
Transactions with ownersShare-based payments 8 4 11
Dividend –144 – –
Total transactions with owners –136 4 11
Equity at end of period 4,058 4,183 4,218
21
Clo
etta [ Interim rep
ort, Q
2 2016
]Accounting and valuation policies, disclosures and risk factors
Accounting and valuation policies, disclosures and risk factors
Accounting and valuation policies Compliance with legislation and accounting standardsThe consolidated financial statements are presented in accordance with the International Financial Reporting Standards (IFRS) estab-lished by the International Accounting Standards Board (IASB) and the interpretations issued by the IFRS Interpretations Committee (IFRIC) which have been endorsed by the European Commission for application in the EU. The applied standards and interpreta-tions are those that were in force and had been endorsed by the EU at 1 January 2016. Furthermore, the Swedish Financial Reporting Board’s recommendation RFR 1, Supplementary Accounting Rules for Groups, has been applied. The consolidated interim report is presented compliant with IAS 34, Interim Financial Reporting, and in compliance with the relevant provisions in the Swedish Annual Accounts Act and the Swedish Securities Market Act. The interim report for the Parent Company has been prepared in accordance with the Swedish Annual Accounts Act and the Swedish Securities Market Act, which are consistent with the provisions in recommendation RFR 2, Accounting for Legal Entities.
Basis of accountingThe same accounting policies and methods of computation are ap-plied in the interim financial statements as in the most recent annual financial statements, except for amendments to standards that are effective for annual periods beginning on 1 January 2016 that had not been already applied in preparing the 2015 consolidated financial statements. Reference is made to Note 34 ‘Changes in accounting policies’ in the annual report for 2015. Standards effective for annual periods beginning on 1 January 2016 that had not already been applied in preparing the 2015 consolidated financial statements have not had any impact on the consolidated financial statements except for the disclosures.
DisclosuresParent CompanyCloetta AB’s primary activities include head office functions such as group-wide management and administration. The comments below refer to the period from 1 January to 30 June 2016. Net sales in the Parent Company reached SEK 47m (42) and referred mainly to intra-group services. Operating profit was SEK –15m (–15). Net financial items totalled SEK –15m (–18). Profit before tax was SEK –30m (–33) and profit after tax was SEK –24m (–26). Cash and cash equivalents and short-term investments amounted to SEK 0m (0).
The Cloetta share Cloetta´s class B share is listed on Nasdaq Stockholm, Mid Cap. Dur-ing the period from 1 January to 30 June 2016, a total of 92,739,386
shares were traded for a combined value of SEK 2,457m, equal to around 33 per cent of the total number of class B shares at the end of the period.
The highest quoted bid price during the period from 1 January to 30 June 2016 was SEK 29.00 (30 June) and the lowest was SEK 24.10 (18 February). The share price on 30 June 2016 was SEK 29.00 (last price paid).
During the period from 1 January to 30 June 2016, the Cloetta share increased by 4 per cent while the Nasdaq OMX Stockholm PI index decreased by 7 per cent.
Cloetta´s share capital at 30 June 2016 amounted to SEK 1,443,096,495. The total number of shares is 288,619,299, consisting of 9,861,614 class A shares and 278,757,685 class B shares, equal to a quota value of SEK 5 per share.
ShareholdersOn 30 June 2016 Cloetta AB had 14,219 shareholders. The largest shareholder was AB Malfors Promotor with a holding corresponding to 42.1 per cent of the votes and 24.3 per cent of the share capital in the company. Threadneedle (Ameriprise Financial Inc.) was the second largest shareholder with 5.1 per cent of the votes and 6.6 per cent of the share capital. The third largest shareholder was Artisan Partners Asset Management Inc. with 4.0 per cent of the votes and 5.2 per cent of the share capital.
Institutional investors held 91.2 per cent of the votes and 88.5 per cent of the share capital. Foreign shareholders held 37.8 per cent of the votes and 49.4 per cent of the share capital.
TaxesThe net effect of international tax rate differences, changes in filing positions and non-deductible expenses impacted the effective tax rate of the group unfavourably. Cloetta’s deferred tax balances have been calculated using the enacted or substantially enacted tax rates.
Fair value measurementThe only items recognized at fair value after initial recognition are the interest rate swaps and forward foreign currency contracts cat-egorised at level 2 of the fair value hierarchy in all periods presented and the contingent earn-out consideration related to the acquisition of Alrifai Nutisal AB (currently known as Cloetta Nutisal AB) and the contingent consideration arising from the option agreement for Aran Candy Ltd. categorized at level 3, as well as assets held for sale, in cases where the fair value less cost of disposal is below the carrying amount. The fair values of financial assets (loans and receivables) and liabilities measured at amortised cost are approximately equal to their carrying amounts. The fair value of financial assets and liabilities for measurement purposes is estimated by discounting the
22
Clo
etta [ Interim rep
ort, Q
2 2016
]
Accounting and valuation policies, disclosures and risk factors
future contractual cash flows at the current market interest rate that is available to the Group for similar financial instruments. The fair value measurements by level according to the fair value measurement hierarchy are as follows:• Quoted prices (unadjusted) in active markets for identical assets or
liabilities (level 1).• Inputs other than quoted prices included within level 1 that are
observable for the asset or liability, either directly (that is, as prices) or indirectly (that is, derived from prices) (level 2).
• Inputs for the asset or liability that are not based on observable market data (that is, unobservable inputs) (level 3).
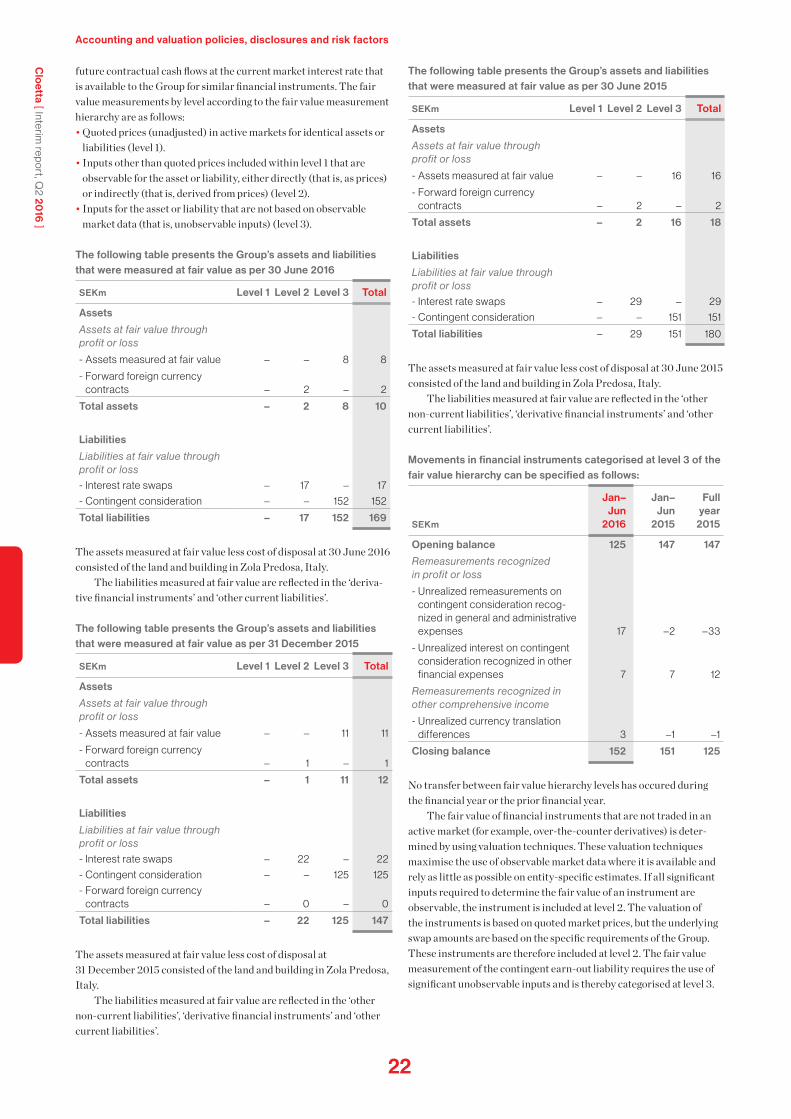
The following table presents the Group’s assets and liabilities that were measured at fair value as per 30 June 2016
SEKm Level 1 Level 2 Level 3 Total
Assets
Assets at fair value through profit or loss
- Assets measured at fair value – – 8 8
- Forward foreign currency contracts – 2 – 2
Total assets – 2 8 10
Liabilities
Liabilities at fair value through profit or loss
- Interest rate swaps – 17 – 17
- Contingent consideration – – 152 152
Total liabilities – 17 152 169
The assets measured at fair value less cost of disposal at 30 June 2016 consisted of the land and building in Zola Predosa, Italy.
The liabilities measured at fair value are reflected in the ‘deriva-tive financial instruments’ and ‘other current liabilities’.
The following table presents the Group’s assets and liabilities that were measured at fair value as per 31 December 2015
SEKm Level 1 Level 2 Level 3 Total
Assets
Assets at fair value through profit or loss
- Assets measured at fair value – – 11 11
- Forward foreign currency contracts – 1 – 1
Total assets – 1 11 12
Liabilities
Liabilities at fair value through profit or loss
- Interest rate swaps – 22 – 22
- Contingent consideration – – 125 125
- Forward foreign currency contracts – 0 – 0
Total liabilities – 22 125 147
The assets measured at fair value less cost of disposal at 31 December 2015 consisted of the land and building in Zola Predosa, Italy.
The liabilities measured at fair value are reflected in the ‘other non-current liabilities’, ‘derivative financial instruments’ and ‘other current liabilities’.
The following table presents the Group’s assets and liabilities that were measured at fair value as per 30 June 2015
SEKm Level 1 Level 2 Level 3 Total
Assets
Assets at fair value through profit or loss
- Assets measured at fair value – – 16 16
- Forward foreign currency contracts – 2 – 2
Total assets – 2 16 18
Liabilities
Liabilities at fair value through profit or loss
- Interest rate swaps – 29 – 29
- Contingent consideration – – 151 151
Total liabilities – 29 151 180
The assets measured at fair value less cost of disposal at 30 June 2015 consisted of the land and building in Zola Predosa, Italy.
The liabilities measured at fair value are reflected in the ‘other non-current liabilities’, ‘derivative financial instruments’ and ‘other current liabilities’.
Movements in financial instruments categorised at level 3 of the fair value hierarchy can be specified as follows:
SEKm
Jan–Jun
2016
Jan–Jun
2015
Full year
2015
Opening balance 125 147 147
Remeasurements recognized in profit or loss
- Unrealized remeasurements on contingent consideration recog-nized in general and administrative expenses 17 –2 –33
- Unrealized interest on contingent consideration recognized in other financial expenses 7 7 12
Remeasurements recognized in other comprehensive income
- Unrealized currency translation differences 3 –1 –1
Closing balance 152 151 125
No transfer between fair value hierarchy levels has occured during the financial year or the prior financial year.
The fair value of financial instruments that are not traded in an active market (for example, over-the-counter derivatives) is deter-mined by using valuation techniques. These valuation techniques maximise the use of observable market data where it is available and rely as little as possible on entity-specific estimates. If all significant inputs required to determine the fair value of an instrument are observable, the instrument is included at level 2. The valuation of the instruments is based on quoted market prices, but the underlying swap amounts are based on the specific requirements of the Group. These instruments are therefore included at level 2. The fair value measurement of the contingent earn-out liability requires the use of significant unobservable inputs and is thereby categorised at level 3.

23
Clo
etta [ Interim rep
ort, Q
2 2016
]Accounting and valuation policies, disclosures and risk factors
The valuation techniques and inputs used to value financial instruments are:• Quoted market prices or dealer quotes for similar instruments.• The fair value of interest rate swaps is calculated as the present
value of the estimated future cash flows based on observable yield curves.
• The fair value of forward foreign currency contracts is calculated using the difference between the exchange rate on the spot date with the contractually agreed upon exchange rates.
• The fair value of the assets held for sale is based on valuations by external independent valuators.
• Other techniques, such as discounted cash flow analysis, are used to determine the fair value of the remaining financial instruments.
The fixed assets measured at fair value are identified as a non- recurring fair value measurement and are related to the assets held for sale. The assets are valued at fair value in case the fair value less cost of disposal is below the carrying amount. The contingent earn-out liabilities are measured at fair value using a scenario model with an earn-out threshold, different results and related changes, and an applicable multiplier as input. These data are aligned with the earn-out contracts.
The inter-relationship between significant unobservable inputs and fair value measurement are:• The estimated fair value of the contingent earn-out consideration
would increase (decrease) if the forecasted profit before indirect cost for 2016 were higher (lower).
• The estimated fair value of the contingent consideration arising from option agreements would increase (decrease) if:
–the working capital at 31 December 2015 was higher (lower),–the cash balance at 31 December 2015 was higher (lower),–the adjusted gross profit for 2015 was higher (lower).
For detailed information about the accounting policies, see Cloetta’s annual report for 2015 at www.cloetta.com.
Acquisition of Locawo B.V.On 17 July 2015, Cloetta acquired control of Locawo B.V. including its subsidiaries, a manufacturer of a wide range of sweets, by means of acquiring 100 per cent of the total outstanding ordinary shares. This transaction provides Cloetta with 100 per cent of the voting rights in Locawo B.V. The primary reason for the acquisition is to broaden the Cloetta product portfolio as part of its ‘Munchy Moments’ strategy and to gain access to the adult candy and chocolate market in The Netherlands.
SEKm
Consideration paid
Cash paid 206
Contingent consideration –
Consideration transferred 206
Recognized amounts of identifiable assets and liabilities assumed:
Non-current assets 264
Intangible assets (excl. goodwill) 143
Property, plant and equipment 119
Other non-current assets 2
Current assets 76
Inventories 31
Trade and other receivables 45
Cash and cash equivalents –
Non-current liabilities –72
Borrowings –21
Provisions –2
Deferred tax liabilities –49
Current liabilities –107
Borrowings –30
Trade payables –26
Derivative financial instruments –3
Taxes and social security premiums – 6
Payables to related parties –27
Other current liabilities –15
Total identifiable net assets 161
Goodwill 45
Consideration transferred 206
The total consideration comprises SEK 206m of cash. No contingent consideration is arranged in the transaction.
The goodwill of SEK 45m relates primarily to the potential of new distribution channels, the workforce, creating diversity in Cloetta’s branded portfolio and new market/sales opportunities in Cloetta’s markets. The total goodwill of SEK 45m is not expected to be deductible for tax purposes.
The acquired receivables consist of accounts receivable of SEK 34m which are collected in full. The contingent liabilities recog-nised as part of the purchase price allocation amount to SEK 1m. The total of transaction cost related to the acquisition amounted to SEK 9m and are fully recognised in the income statement of the period concerned as ‘General & Administration expenses’.
Due to the short-term nature of the receivables, the fair value approximates the gross contractual amounts. The contractual cash flows which are expected not to be collected are immaterial.
Locawo B.V. contributed SEK 278m to the consolidated revenues of Cloetta as from acquisition date up to 30 June 2016. The account-ing for the business combination has been finalized. The goodwill acquired is allocated to the cash-generating unit Middle.
Risk factorsCloetta is an internationally active company that is exposed to a num-ber of market and financial risks. All identified risks are monitored continuously and, if needed, risk mitigating measures are taken to limit their impact. The most relevant risk factors are described in the annual report for 2015 and consist of industry- and market-related risks, operational risks and financial risks. Compared to the annual report for 2015, which was issued on 10 March 2016, no new risks have been identified.

24
Clo
etta [ Interim rep
ort, Q
2 2016
]
Definitions, glossary, exchange rates
DefinitionsGeneral All amounts in the tables are presented in SEK millions unless otherwise stated. All amounts in brackets ()
represent comparative figures for the same period of the prior year, unless otherwise stated.
Margins Definition/calculation Purpose
Gross margin Net sales less cost of goods sold as a percentage of net sales.
Gross margin measures production profitability.
Operating profit margin (EBIT margin)
Operating profit expressed as a percentage of net sales.
Operating profit margin is used for measuring the operational profitability.
Operating profit margin, adjusted
Operating profit, adjusted for items affecting comparability, as a percentage of net sales.
Operating profit margin, adjusted excludes the impact of items affecting comparability, enabling a comparison of operational profitability.
Profit margin Profit/loss before tax expressed as a percentage of net sales.
This measure enables the profitability to be com-pared across locations where corporate taxes differ.
Return Definition/calculation Purpose
Cash conversion Operating profit, adjusted for items affecting com-parability, before depreciation and amortization less capital expenditures as a percentage of operating profit, adjusted for items affecting comparability, before depreciation and amortization.
Cash conversion measures the proportion of profits that are converted to cash flow. Its use is to analyze how much of the profit attributable to shareholders is turned into cash that could be paid to investors with-out damaging the business, except for cash flows related to interest and tax.
Return on capital employed Operating profit plus financial income as a per-centage of average capital employed. The average capital employed is calculated by taking the capital employed per period end and the capital employed by period end of the comparative period in the previ-ous year divided by two.
Return on capital employed is used to analyse profitability, based on the amount of capital used. The leverage of the company is the reason that this metric is used next to return on equity, because it not only includes equity, but takes into account borrowings and other liabilities as well.
Return on equity Profit for the period as a percentage of total equity. Return on equity is used to measure profit generation, given the resources attributable to the owners of the Parent Company.
Capital structure Definition/calculation Purpose
Capital employed Total assets less interest-free liabilities (including deferred tax).
Capital employed measures the amount of capital used and serves as input for return on capital employed.
Equity/assets ratio Equity at the end of the period as a percentage of total assets. The equity/assets ratio represents the amount of assets on which shareholders have a residual claim.
This ratio is an indicator of the company’s leverage used to finance the firm.
Gross debt Gross current and non-current borrowings, credit overdraft facilities, derivative financial instruments and interest payables.
Gross debt represents the total debt obligation of the company irrespective its maturity.
Net debt Gross debt less cash and cash equivalents. Net debt is used as an indication of the ability to pay off all debts if these were to fall due simultaneously on the day of calculation, using only available cash and cash equivalents.
Net debt/EBITDA Net debt/EBITDA according to the definition in the credit facility agreement. The difference between net debt in the credit facility agreement and the external net debt definition is that the definition in the credit facility agreement includes the minimum contingent earn-out considerations but excludes financial de-rivative instruments. The definition of EBITDA in the credit facility agreement corresponds to operating profit, adjusted, before depreciation and amortization, and includes the rolling twelve-month EBITDA of acquired companies.
The net debt/EBITDA ratio approximates the com-pany’s ability to decrease its debt. It represents the number of years it would take to pay back debt if net debt and EBITDA are held constant, ignoring the impact from cash flows from interest, tax and capital expenditure.
Net debt/equity ratio Net debt at the end of the period divided by equity at the end of the period.
The net debt/equity ratio measures the extent to which the company is funded by debt. Because cash and overdraft facilities can be used to pay off debt at short notice, this is calculated based on net debt rather than gross debt.
Working capital Total inventories and trade and other receivables adjusted for trade and other payables.
Working capital is used to measure the company’s ability, besides cash and cash equivalents, to meet current operational obligations.

25
Clo
etta [ Interim rep
ort, Q
2 2016
]Definitions, glossary, exchange rates
Pick-and-mix concept Cloetta’s range of candy and natural snacks that are picked by the consumers themselves.
Glossary
Exchange rates 30 Jun 2016 30 Jun 2015 31 Dec 2015
EUR, average 9.3005 9.3309 9.3445
EUR, end of period 9.4330 9.1984 9.1679
NOK, average 0.9882 1.0786 1.0432
NOK, end of period 1.0132 1.0488 0.9563
GBP, average 11.9212 12.7645 12.8736
GBP, end of period 11.4353 12.9701 12.4835
DKK, average 1.2486 1.2515 1.2529
DKK, end of period 1.2681 1.2330 1.2287
Data per share Definition/calculation Purpose
Cash flow from operating activities per share
Cash flow from operating activities in the period divided by the average number of shares.
The cash flow from operating activities per share measures the amount of cash the company gener-ates per share from the revenues it brings in irrespec-tive the capital investments and cash flows related to the financing structure of the company.
Earnings per share Profit for the period divided by the average number of shares adjusted for the effect of forward contracts to repurchase own shares.
The earnings per share measures the amount of net profit that is available for payment to its shareholders per share.
Equity per share Equity at the end of the period divided by number of shares at the end of the period.
Equity per share measures the net-asset value backing up each share of the company’s equity and determines if a company is increasing shareholder value over time.
Other definitions Definition/calculation Purpose
EBIT Operating profit consists of comprehensive income before net financial items and income tax.
This measure enables the profitability to be compared across locations where corporate taxes differ and irrespective the financing structure of the company.
EBITDA Operating profit before depreciation and amortization.
EBITDA is used to measure the cash flow generated from operating activities, eliminating the impact of financing and accounting decisions.
EBITDA, adjusted Operating profit, adjusted for items affecting comparability, before depreciation and amortization.
EBITDA, adjusted increases the comparability of EBITDA.
Effective tax rate Income tax as a percentage of profit before tax. This measure enables comparison of income tax across locations where corporate taxes differ.
Items affecting comparability
Items affecting comparability are items such as restructurings and impact from acquisitions.
Items affecting comparability increases the comparability within the profit and loss account.
Net financial items The total of exchange differences on borrowings and cash and cash equivalents in foreign currencies, other financial income and other financial expenses.
The net financial items reflects the company's total costs of the external financing.
Net sales, change Net sales as a percentage of net sales in the comparative period of the previous year.
Net sales, change reflects the company's realized top-line growth over time.
Operating profit, adjusted Operating profit adjusted for items affecting comparability.
Operating profit, adjusted increases the comparability of operating profit.
Organic growth Net sales, change excluding acquisition-driven growth and changes in exchanges rates.
Organic growth excludes the impact of changes in group structure and exchange rates, enabling a comparison on net sales growth over time.
Structural changes Net sales, change resulting from changes in group structure.
Structural changes measure the contribution of changes in group structure to net sales growth.

26
Clo
etta [ Interim rep
ort, Q
2 2016
]
AGM in Stockholm4 April 2017Annual Report
Year-end report Q41 Feb 2017
VisionTo be the most admired satisfier of Munchy MomentsThe vision, together with the goals and strategies, expresses Cloetta’s business concept.
Business modelCloetta’s business model is to offer strong local brands in Munchy Moments and provide effective sales and distribu-tion to the retail trade. Together, this will ensure continued positive development of the company’s leading market positions.
Long-term financial targets• Cloetta’s target is to increase organic sales at least in line
with market growth.• Cloetta’s target is an EBIT margin, adjusted for items
affecting comparability, of at least 14 per cent.• Cloetta’s long-term target is a net debt/EBITDA ratio of
around 2.5x.• Cloetta’s long-term intention is a dividend payout of
40–60 per cent of profit after tax.
Strategies• Focus on margin expansion and volume growth.• Focus on cost-efficiency.• Focus on employee development.
Value drivers• Strong brands and market positions in a non-cyclical
market.• Excellent availability in the retail trade with the help of a
strong and effective sales and distribution organization.• Good consumer knowledge and loyalty.• Innovative product and packaging development. • Effective production with high and consistent quality.
Financial calendar
2017
This information is information that Cloetta AB is obliged to make public pursuant to the EU Market Abuse Regulation and the Securities Markets Act. The information was submitted for publication, through the agency of the contact person set out above, at 8:00 a.m. CET on 15 July 2016.
ContactsJacob Broberg, Senior Vice President Corporate Communications and Investor Relations, +46 70-190 00 33Danko Maras, Chief Financial Officer, +46 76-627 69 46
Interim report Q3 27 October 2016
2016
JUL AUG SEP OCT NOV DEC JAN FEB MAR APR MAY JUN JUL AUG
Interim report Q1 21 April 2017
Interim report Q2 15 July 2016

More information about Cloetta is available at www.cloetta.com
Cloetta AB (publ) • Corp. ID no. 556308-8144 • Kista Science Tower, SE-164 51 Kista, Sweden.Tel +46 8-52 72 88 00 • www.cloetta.com
About CloettaCloetta, founded in 1862, is a leading confectionery company in the Nordic region, the Netherlands and Italy. In total, Cloetta products are sold in more than 50 countries worldwide. Cloetta owns some of the strongest brands on the market, such as Läkerol, Cloetta, Jenkki, Kexchoklad, Malaco, Sportlife, Saila, Red Band and Sperlari. Cloetta has 13 production units in six countries. Cloetta’s class B shares are traded on Nasdaq Stockholm.