interim results for the period ended 30 june 2018 …/media/files/g/golar-partners/documents/... ·...
TRANSCRIPT
1 Refer to section 'Non-GAAP measures' for definition.
INTERIM RESULTS FOR THE PERIOD ENDED 30 JUNE 2018
Highlights
• Golar LNG Partners LP (“Golar Partners” or “the Partnership”) reports net income attributable to
unit holders of $28.4 million and operating income of $36.6 million for the second quarter of 2018.
• Generated distributable cash flow1 of $23.0 million for the second quarter with a distribution
coverage ratio1 of 0.56.
• FLNG Hilli Episeyo accepted by charterers Perenco and SNH.
Subsequent Events
• Completed acquisition of initial equity interest in Golar Hilli LLC on July 12, 2018 and resume
discussions on the potential acquisition of an additional equity interest.
• Shipping market shows solid signs of improvement. Secured 10-month charter for Golar Maria.
• Selected FSRU Golar Freeze to service 15-year Atlantic project. Vessel enters Dubai Drydocks.
• Declared an unchanged distribution for the second quarter of $0.5775 per unit.
Financial Results Overview
Golar Partners reports net income attributable to unit holders of $28.4 million and operating income of
$36.6 million for the second quarter of 2018 (“the second quarter” or “2Q”), as compared to net income
attributable to unit holders of $14.8 million and operating income of $26.1 million for the first quarter of
2018 (“the first quarter” or “1Q”) and net income attributable to unit holders of $53.8 million and operating
income of $87.4 million for 2Q 2017.
1 Refer to section 'Non-GAAP measures' for definition.
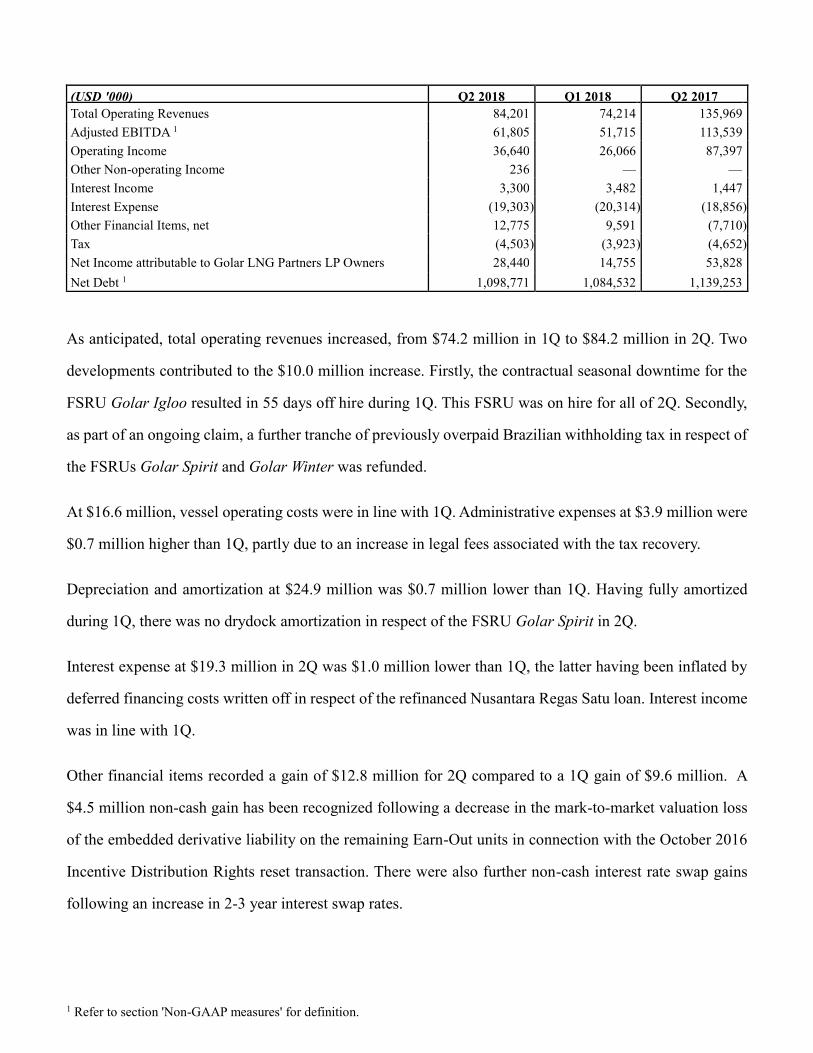
(USD '000) Q2 2018 Q1 2018 Q2 2017
Total Operating Revenues 84,201 74,214 135,969
Adjusted EBITDA 1 61,805 51,715 113,539
Operating Income 36,640 26,066 87,397
Other Non-operating Income 236 — —
Interest Income 3,300 3,482 1,447
Interest Expense (19,303 ) (20,314 ) (18,856 )
Other Financial Items, net 12,775 9,591 (7,710 )
Tax (4,503 ) (3,923 ) (4,652 )
Net Income attributable to Golar LNG Partners LP Owners 28,440 14,755 53,828
Net Debt 1 1,098,771 1,084,532 1,139,253
As anticipated, total operating revenues increased, from $74.2 million in 1Q to $84.2 million in 2Q. Two
developments contributed to the $10.0 million increase. Firstly, the contractual seasonal downtime for the
FSRU Golar Igloo resulted in 55 days off hire during 1Q. This FSRU was on hire for all of 2Q. Secondly,
as part of an ongoing claim, a further tranche of previously overpaid Brazilian withholding tax in respect of
the FSRUs Golar Spirit and Golar Winter was refunded.
At $16.6 million, vessel operating costs were in line with 1Q. Administrative expenses at $3.9 million were
$0.7 million higher than 1Q, partly due to an increase in legal fees associated with the tax recovery.
Depreciation and amortization at $24.9 million was $0.7 million lower than 1Q. Having fully amortized
during 1Q, there was no drydock amortization in respect of the FSRU Golar Spirit in 2Q.
Interest expense at $19.3 million in 2Q was $1.0 million lower than 1Q, the latter having been inflated by
deferred financing costs written off in respect of the refinanced Nusantara Regas Satu loan. Interest income
was in line with 1Q.
Other financial items recorded a gain of $12.8 million for 2Q compared to a 1Q gain of $9.6 million. A
$4.5 million non-cash gain has been recognized following a decrease in the mark-to-market valuation loss
of the embedded derivative liability on the remaining Earn-Out units in connection with the October 2016
Incentive Distribution Rights reset transaction. There were also further non-cash interest rate swap gains
following an increase in 2-3 year interest swap rates.
1 Refer to section 'Non-GAAP measures' for definition.
As a result of the foregoing, 2Q distributable cash flow1 increased $9.6 million to $23.0 million, compared
to $13.3 million in 1Q. The distribution coverage ratio1 increased accordingly from 0.32 in 1Q to 0.56 in
2Q.
Commercial Review
On January 19, 2018 the Partnership executed a 15-year charter with an energy and logistics company for
the provision of an FSRU in the Atlantic Basin. FSRU service is currently expected to commence around
year end and the FSRU Golar Freeze, which entered Dubai Drydocks in July, has been selected to service
this project. The vessel's current charterer is obligated to pay charterhire for the vessel until April 2019.
The charterparty for the FSRU Golar Igloo is due to conclude before the end of February 2019. Charterers
KNPC will need an FSRU after conclusion of the original agreement. The Golar Igloo has performed with
100% uptime and KNPC has been very pleased with operations to date. In line with Kuwait tendering
procedures, the Partnership expects to participate in a KNPC tender for future services. Although the
Partnership hopes to be successful in this bidding process, the Golar Igloo is also designed to trade as a
conventional 170,000cbm carrier and the shipping market represents an increasingly compelling alternative
should the contract not be renewed.
Golar Maria secured a 10-month charter during the quarter. Commencing in August, this charter will
contribute additional distributable cash through to 2Q 2019. An increasing number of spot inquiries are
also being received for the Golar Mazo. Ahead of winter, the Partnership expects to remove the vessel from
warm layup.
Acquisitions
By late April 2018, stable levels of production were being achieved on board FLNG Hilli Episeyo. A
commissioning cargo was subsequently offloaded. Official acceptance testing commenced thereafter and
completed on May 31, 2018. The acceptance certificate was signed shortly afterwards on June 2, 2018. All
four trains have been commissioned and tested to at or above nameplate capacity and the vessel has been
operating with 100% commercial availability. The vessel is currently on schedule to export its sixth LNG
cargo.
1 Refer to section 'Non-GAAP measures' for definition.
Vessel acceptance was a key trigger for final drawdown against the $960 million CSSCL sale and leaseback
facility. Final drawdown against this facility was completed on June 20, 2018. Both vessel acceptance and
execution of the final sale and leaseback facility were conditions precedent to closing the Hilli Episeyo
acquisition. Golar and affiliates of Keppel Shipyard Limited and Black & Veatch closed the sale of 50% of
the common units in Golar Hilli LLC, the disponent owner of Hilli Episeyo, to the Partnership on July 12,
2018. Equivalent to 50% of the two liquefaction trains currently contracted for 8-years to Perenco Cameroon
SA and Société Nationale Des Hydrocarbures, out of a total of four, this initial interest includes a pro-rated
5% stake in any future distributions generated by the currently uncontracted expansion capacity, but does
not include exposure to the oil linked component of the vessel's earnings stream. Adding approximately
$800 million in effective revenue backlog1, the Partnership estimates that its proportionate share of Hilli
Episeyo's annual contracted revenues less operating expenses under the Liquefaction Tolling Agreement
will be approximately $82 million. Golar Partners will account for its stake in Golar Hilli LLC as an equity
investment and will reflect its share of net income on its income statement as "equity in net earnings of
affiliates". The actual net earnings reported will be reduced by the non-cash amortization of the fair value
of assets and liabilities that were valued on dropdown.
With a view to further strengthening the Partnership's financial position and providing additional support to
the distribution, Golar and the Partnership have also resumed discussions with respect to the potential
dropdown of additional common units in Golar Hilli LLC.
Operational Review
Once again, the fleet performed well during the quarter achieving 100% availability for scheduled
operations. After accounting for warm layup of Golar Mazo and idle time in the spot market for Golar
Maria, utilization of 85% was recorded for the quarter.
Two of the Partnership's vessels have scheduled drydockings in 3Q. FSRU Golar Freeze entered Dubai
Drydocks on July 19, 2018. As the vessel will be expected to remain in service for up to 15 years in her
new location without drydock, works undertaken will be extensive. Minor modifications will also be
required to ensure compatibility with the vessel's new receiving terminal. Works are expected to complete

1 Refer to section 'Non-GAAP measures' for definition.
in October 2018. The FSRU will continue to receive the capital element of its hire rate during drydock
from the current charterer. The LNG carrier Methane Princess is scheduled to drydock at a European yard
in the coming days. Including an upgrade to the vessel's ballast water treatment system, this vessel drydock
is expected to result in approximately 33 days off hire.
Financing and Liquidity
As of June 30, 2018, the Partnership had cash and cash equivalents of $115.9 million, restricted cash of
$172.0 million and available and undrawn revolving credit facilities of $75.0 million. The Partnership's total
net debt1 as at June 30, 2018 was $1,098.8 million. Based on the above net debt1 amount and annualized1
2Q 2018 Adjusted EBITDA1, Golar Partners’ net debt1 to Adjusted EBITDA1 ratio was 4.4. As of June 30,
2018, Golar Partners had interest rate swaps with a notional outstanding value of approximately $1,723.6
million (including swaps with a notional value of $400.0 million in connection with the Partnership’s bonds)
representing approximately 139% of total debt and capital lease obligations net of long-term restricted cash.
In anticipation of closing the Hilli Acquisition and the assumption of a proportionate share of its associated
debt, the Partnership entered into a $480 million 8-year interest rate swap commencing March 31, 2018.
Upon closing on July 12, 2018, the proportion of debt swapped to a fixed rate reverted to around 100%.
The average fixed interest rate of swaps related to bank debt is approximately 2.2% with an average
remaining period to maturity of approximately 5 years as of June 30, 2018.
Outstanding bank debt as of June 30, 2018 was $876.0 million, which had average margins, in addition to
LIBOR, of approximately 2.14%. The Partnership also has a 2020 maturing $150.0 million Norwegian USD
bond with a swapped all-in rate of 6.275% and a 2021 maturing $250 million Norwegian USD bond with a
swapped all-in rate of 8.194%. Excluding a portion of the revolving component of the $800 million multi
vessel facility, the $150.0 million Norwegian USD bond represents the Partnership's next scheduled debt
maturity.
1 Refer to section 'Non-GAAP measures' for definition.
Corporate and Other Matters
As of June 30, 2018, there were 71,286,849 common and general partner units outstanding in the
Partnership. During the quarter, 96,100 common units were repurchased under the Partnership's $25.0
million authorized repurchase program and subsequently cancelled at a cost of $1.5 million.
Of the 71,286,849 common and general partner units outstanding at June 30, 2018, 22,662,977, including
1,436,391 General Partner units, were owned by Golar, representing a 31.8% interest in the Partnership.
In July 2018, Golar Partners declared a distribution for 2Q of $0.5775 per unit for common and general
partner unitholders of record on August 7, 2018. The distribution was paid in August 2018 on total units of
71,286,850. A cash distribution of $0.546875 per Series A preferred unit for the period covering 15 May
through to 14 August, 2018 was also declared. This was also paid in August 2018 to all Series A preferred
unitholders of record on August 8, 2018.
Total outstanding unit options as at June 30, 2018 were 99,000.
The Partnership’s Annual General Meeting is scheduled for September 26, 2018 in Bermuda and the record
date for voting was August 1.
Outlook
Timely closing of the acquisition of the initial interest in Hilli Episeyo represents a material step toward
addressing the Partnership's re-contracting risk. The encouraging start to operations also supports the
decision to resume discussions on the potential acquisition of an additional interest in Hilli Episeyo.
Having entered drydock, the nominated FSRU Golar Freeze is on track to commence operations for the 15-
year Atlantic FSRU contract starting around year-end. Golar Freeze is expected to add a further $380
million of effective revenue backlog1 and generate between $18 and $22 million of annual contracted
revenues less operating expenses.
1 Refer to section 'Non-GAAP measures' for definition.
The shipping market recovery is also developing as expected. A material step-up in inquiries for long term
vessel charters, the recent ten month fixture for the Golar Maria, the emerging interest in charters for the
Golar Mazo and the lower than theoretical rate differential between steam turbine and newer vessels are all
reassuring indicators of an underlying recovery. The recovering shipping market also represents a solid
backstop should the FSRU Golar Igloo contract not be renewed by her current charterer.
Although distribution coverage is expected to increase in 3Q and further in 4Q, some uncertainty remains.
A steep amortization profile on some its debt facilities means that EBITDA1 generated by new contracts (or
share of earnings under the equity method for Hilli Episeyo) does not necessarily translate into similar levels
of replacement cashflow generation. Work to stretch the Partnership's debt amortization profile to better
match the economic life of its assets continues. In view of the current net debt1 to EBITDA1 ratio of around
4.4 and revenue backlog1 of $2.5 billion, there should be ample financial flexibility to re-leverage several
assets.
The Board is pleased by the improvement in order backlog and new coverage which the Partnership has
secured over the last six months. Although uncertainty around the level of sustainable distributions remains,
initial forecasts provided by Management indicate that any potential reduction in distributions will be lower
than the market appears to be expecting based on the current yield for Golar Partners units. These forecasts
together with preliminary 3Q results and commercial developments over the next two months will guide
the Boards decision in October with respect to the 3Q distribution. Thereafter, a firm financial footing, solid
coverage ratios and strong growth in the LNG industry should create attractive new business opportunities
for the Partnership.
Non-GAAP measures
Adjusted EBITDA: Adjusted EBITDA is defined as earnings before interest, other financial items, taxes, depreciation and
amortization and non-controlling interest. Adjusted EBITDA is a non-GAAP financial measure. A non-GAAP financial measure
is generally defined by the Securities and Exchange Commission as one that purports to measure historical or future financial
performance, financial position or cash flows, but excludes or includes amounts that would not be so adjusted in the most
comparable U.S. GAAP measure. We have presented Adjusted EBITDA as we believe it provides useful information to investors
because it is a basis upon which we measure our operations and efficiency. Adjusted EBITDA is not a measure of our financial
performance under U.S. GAAP and should not be construed as an alternative to net income/(loss) or other financial measures
presented in accordance with U.S. GAAP. Refer to our most recent quarterly investor presentation on our investor relations
section on our website (www.golarlngpartners.com) for a reconciliation to the most directly comparable financial measure under
US GAAP.
Annualized: Annualized means the figure for the quarter multiplied by 4.
Distributable cash flow: Distributable cash flow (DCF) is a non-GAAP financial measure used by investors to measure the
performance of master limited partnerships. Refer to our most recent quarterly investor presentation on our investor relations
section on our website (www.golarlngpartners.com) for a reconciliation to the most directly comparable financial measure under
US GAAP.
Distribution coverage ratio: Distribution coverage ratio represents the ratio of distributable cash flow to total cash distributions
paid. Refer to our most recent quarterly investor presentation on our investor relations section on our website
(www.golarlngpartners.com) for a reconciliation to the most directly comparable financial measure under US GAAP.
EBITDA: EBITDA is defined as operating income before interest, tax, depreciation and amortization. EBITDA is a non-GAAP
financial measure. A non-GAAP financial measure is generally defined by the Securities and Exchange Commission as one that
purports to measure historical or future financial performance, financial position or cash flows, but excludes or includes amounts
that would not be so adjusted in the most comparable U.S. GAAP measure. We have presented EBITDA as we believe it provides
useful information to investors because it is a basis upon which we measure our operations and efficiency. EBITDA is not a
measure of our financial performance under U.S. GAAP and should not be construed as an alternative to net income/(loss) or
other financial measures presented in accordance with U.S. GAAP.
Effective revenue backlog: Effective revenue backlog is defined as the contracted daily charter rate for each vessel multiplied
by the number of scheduled hire days for the remaining contract term, which includes our pro-rata share of Hilli Episeyo
contractual billings which will be recorded as "Equity in net earnings of affiliates".
Net debt: Net Debt is a non-GAAP financial measure and is defined as short-term debt and long-term debt, plus obligations
under capital leases, less cash and cash equivalents, less restricted cash and short-term deposits. Net Debt is used by investors
to measure our performance and should not be considered as an alternative to any other indicator of our performance calculated
in accordance with U.S. GAAP. We believe that net debt assists our management and investors by increasing the comparability
of our combined indebtedness and cash position against other companies in our industry. Net Debt is not a measure of our
financial performance under U.S. GAAP and should not be construed as an alternative to other financial measures presented in
accordance with U.S. GAAP. Refer to our most recent quarterly investor presentation on our investor relations section on our
website (www.golarlngpartners.com) for a reconciliation to the most directly comparable financial measure under US GAAP.
FORWARD LOOKING STATEMENTS
This press release contains certain forward-looking statements concerning future events and Golar Partners’
operations, performance and financial condition. Forward-looking statements include, without limitation,
any statement that may predict, forecast, indicate or imply future results, performance or achievements, and
may contain the words “believe,” “anticipate,” “expect,” “estimate,” “project,” “will be,” “will continue,”
“will likely result,” “plan,” “intend” or words or phrases of similar meanings. These statements involve
known and unknown risks and are based upon a number of assumptions and estimates that are inherently
subject to significant uncertainties and contingencies, many of which are beyond Golar Partners’ control.
Actual results may differ materially from those expressed or implied by such forward-looking statements.
Important factors that could cause actual results to differ materially include, but are not limited to:
• our ability to maintain cash distributions and the amount of any such distributions;
• market trends in the floating storage and regasification unit (or FSRU), liquefied natural gas (or LNG)
carrier and floating liquefied natural gas vessel (or FLNG) industries, including charter rates, factors
affecting supply and demand, and opportunities for the profitable operations of FSRUs, LNG carriers
and FLNGs;
• the ability of Golar LNG Partners LP (“Golar Partners,” “we,” “us” and “our”) and Golar LNG Limited
(“Golar”) to retrofit vessels as FSRUs or FLNGs and the timing of the delivery and acceptance of any
such retrofitted vessels by their respective charterers;
• our ability to consummate the acquisition of additional common units in Golar Hilli LLC, the
disponent owner of the Hilli Episeyo on a timely basis or at all;
• our ability to integrate and realize the expected benefits from acquisitions and potential acquisitions,
including the Hilli Episeyo;
• the future share of earnings relating to the Hilli Episeyo, which will be accounted for under the equity
method;
• our ability to realize the expected benefits from the Atlantic Project;
• our anticipated growth strategies;
• the effect of a worldwide economic slowdown;
• turmoil in the global financial markets;
• fluctuations in currencies and interest rates;
• general market conditions, including fluctuations in charter hire rates and vessel values;
• changes in commodity prices;
• the liquidity and creditworthiness of our charterers;
• changes in our operating expenses, including drydocking, insurance costs and bunker prices;
• our future financial condition or results of operations and future revenues and expenses;
• the repayment of debt and settling of interest rate swaps;
• our and Golar's ability to make additional borrowings and to access debt and equity markets;
• planned capital expenditures and availability of capital resources to fund capital expenditures;
• our ability to maintain long-term relationships with major LNG traders;
• our ability to leverage the relationships and reputation of Golar and Golar Power Limited (or Golar
Power) in the LNG industry;
• our ability to purchase vessels from Golar and Golar Power in the future;
• our continued ability to enter into long-term time charters, including our ability to re-charter FSRUs and
carriers following the termination or expiration of their time charters;
• our ability to maximize the use of our vessels, including the re-deployment or disposition of vessels no
longer under long-term time charter;
• timely purchases and deliveries of newbuilding vessels;
• future purchase prices of newbuildings and secondhand vessels;
• our ability to compete successfully for future chartering and newbuilding opportunities;
• acceptance of a vessel by its charterer;
• termination dates and extensions of charters;
• the expected cost of, and our ability to comply with, governmental regulations, maritime self-regulatory
organization standards, as well as standard regulations imposed by its charterers applicable to our
business;
• availability of skilled labor, vessel crews and management;
• our general and administrative expenses and its fees and expenses payable under the fleet management
agreements and the management and administrative services agreement;
• the anticipated taxation of our partnership and distributions to our unitholders;
• challenges by authorities to the tax benefits we previously obtained;
• estimated future maintenance and replacement capital expenditures;
• our and Golar's ability to retain key employees;
• customers’ increasing emphasis on environmental and safety concerns;
• potential liability from any pending or future litigation;
• potential disruption of shipping routes due to accidents, political events, piracy or acts by terrorists;
• our business strategy and other plans and objectives for future operations; and
• other factors listed from time to time in the reports and other documents that we file with the U.S.
Securities and Exchange Commission (the “SEC”).
Factors may cause actual results to be materially different from those contained in any forward-looking
statement. Golar Partners does not intend to release publicly any updates or revisions to any forward-looking
statements contained herein to reflect any change in Golar Partners’ expectations with respect thereto or any
change in events, conditions or circumstances on which any such statement is based.
August 23, 2018
Golar LNG Partners L.P.
Hamilton, Bermuda
Questions should be directed to:
c/o Golar Management Ltd - +44 207 063 7900
Brian Tienzo - Chief Executive and Chief Financial Officer
Stuart Buchanan - Head of Investor Relations
Golar LNG Partners LP
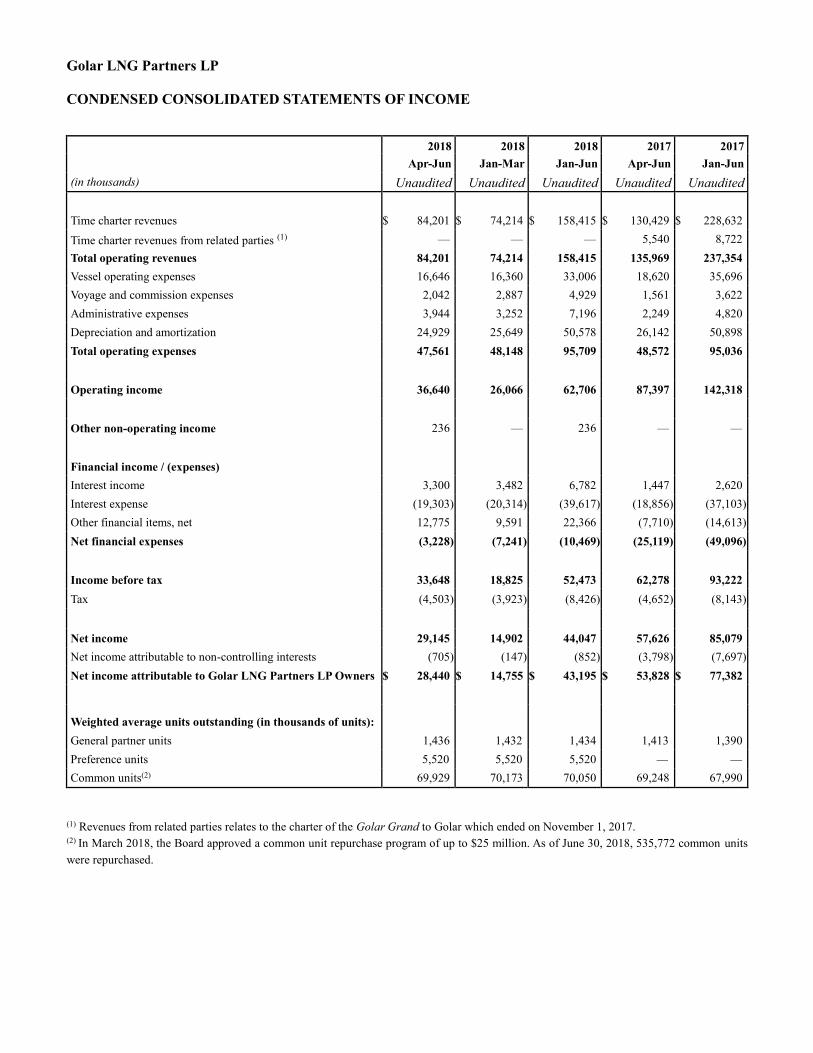
CONDENSED CONSOLIDATED STATEMENTS OF INCOME
2018 2018 2018 2017 2017
Apr-Jun Jan-Mar Jan-Jun Apr-Jun Jan-Jun
(in thousands) Unaudited Unaudited Unaudited Unaudited Unaudited
Time charter revenues $ 84,201 $ 74,214 $ 158,415 $ 130,429 $ 228,632
Time charter revenues from related parties (1) — — — 5,540 8,722
Total operating revenues 84,201 74,214 158,415 135,969 237,354
Vessel operating expenses 16,646 16,360 33,006 18,620 35,696
Voyage and commission expenses 2,042 2,887 4,929 1,561 3,622
Administrative expenses 3,944 3,252 7,196 2,249 4,820
Depreciation and amortization 24,929 25,649 50,578 26,142 50,898
Total operating expenses 47,561 48,148 95,709 48,572 95,036
Operating income 36,640 26,066 62,706 87,397 142,318
Other non-operating income 236 — 236 — —
Financial income / (expenses)
Interest income 3,300 3,482 6,782 1,447 2,620
Interest expense (19,303 ) (20,314 ) (39,617 ) (18,856 ) (37,103 )
Other financial items, net 12,775 9,591 22,366 (7,710 ) (14,613 )
Net financial expenses (3,228 ) (7,241 ) (10,469 ) (25,119 ) (49,096 )
Income before tax 33,648 18,825 52,473 62,278 93,222
Tax (4,503 ) (3,923 ) (8,426 ) (4,652 ) (8,143 )
Net income 29,145 14,902 44,047 57,626 85,079
Net income attributable to non-controlling interests (705 ) (147 ) (852 ) (3,798 ) (7,697 )
Net income attributable to Golar LNG Partners LP Owners $ 28,440 $ 14,755 $ 43,195 $ 53,828 $ 77,382
Weighted average units outstanding (in thousands of units):
General partner units 1,436 1,432 1,434 1,413 1,390
Preference units 5,520 5,520 5,520 — —
Common units(2) 69,929 70,173 70,050 69,248 67,990
(1) Revenues from related parties relates to the charter of the Golar Grand to Golar which ended on November 1, 2017.
(2) In March 2018, the Board approved a common unit repurchase program of up to $25 million. As of June 30, 2018, 535,772 common units
were repurchased.
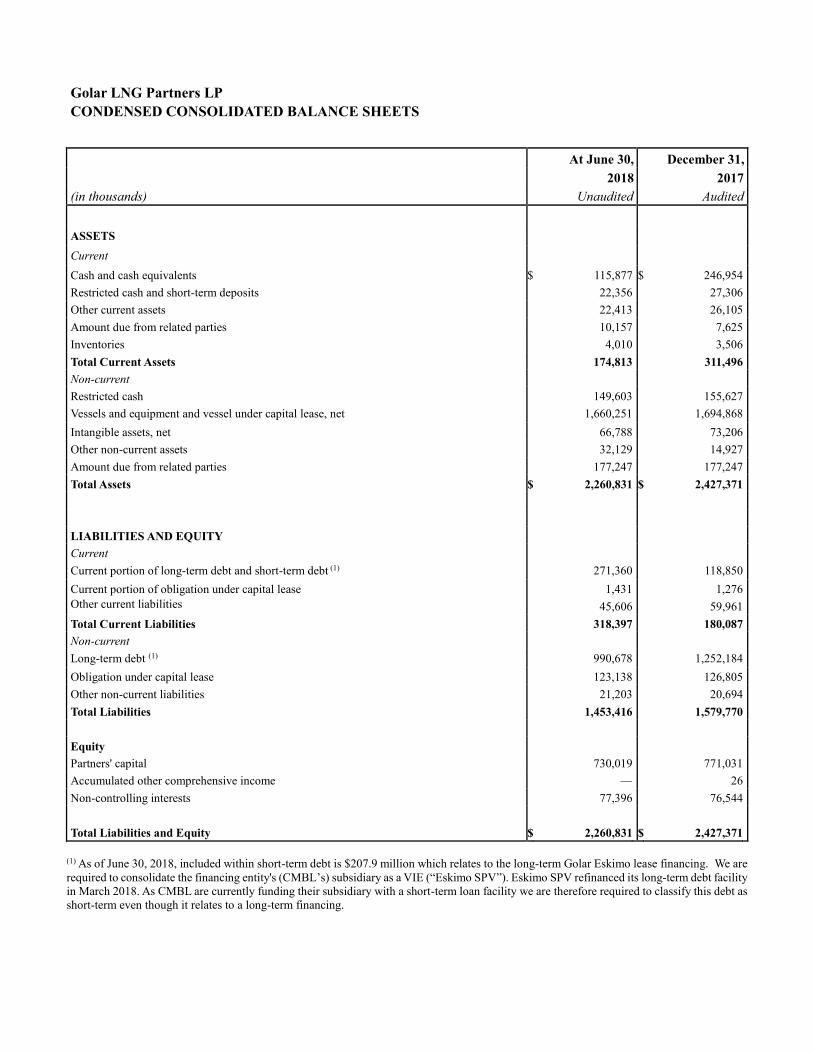
Golar LNG Partners LP
CONDENSED CONSOLIDATED BALANCE SHEETS
At June 30, December 31,
2018 2017
(in thousands) Unaudited Audited
ASSETS
Current
Cash and cash equivalents $ 115,877 $ 246,954
Restricted cash and short-term deposits 22,356 27,306
Other current assets 22,413 26,105
Amount due from related parties 10,157 7,625
Inventories 4,010 3,506
Total Current Assets 174,813 311,496
Non-current
Restricted cash 149,603 155,627
Vessels and equipment and vessel under capital lease, net 1,660,251 1,694,868
Intangible assets, net 66,788 73,206
Other non-current assets 32,129 14,927
Amount due from related parties 177,247 177,247
Total Assets $ 2,260,831 $ 2,427,371
LIABILITIES AND EQUITY
Current
Current portion of long-term debt and short-term debt (1) 271,360 118,850
Current portion of obligation under capital lease 1,431 1,276
Other current liabilities
45,606 59,961
Total Current Liabilities 318,397 180,087
Non-current
Long-term debt (1) 990,678 1,252,184
Obligation under capital lease 123,138 126,805
Other non-current liabilities 21,203 20,694
Total Liabilities 1,453,416 1,579,770
Equity
Partners' capital 730,019 771,031
Accumulated other comprehensive income — 26
Non-controlling interests 77,396 76,544
Total Liabilities and Equity $ 2,260,831 $ 2,427,371
(1) As of June 30, 2018, included within short-term debt is $207.9 million which relates to the long-term Golar Eskimo lease financing. We are
required to consolidate the financing entity's (CMBL’s) subsidiary as a VIE (“Eskimo SPV”). Eskimo SPV refinanced its long-term debt facility
in March 2018. As CMBL are currently funding their subsidiary with a short-term loan facility we are therefore required to classify this debt as
short-term even though it relates to a long-term financing.
Golar LNG Partners LP
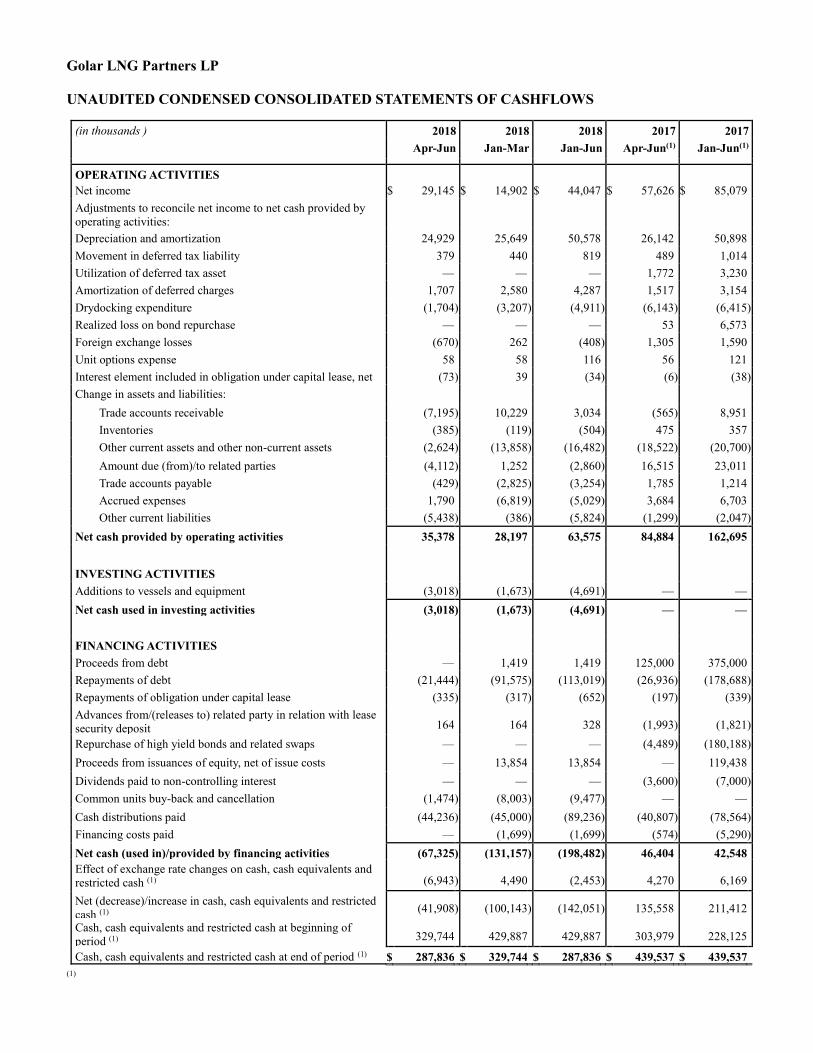
UNAUDITED CONDENSED CONSOLIDATED STATEMENTS OF CASHFLOWS
(in thousands ) 2018 2018 2018 2017 2017
Apr-Jun Jan-Mar Jan-Jun Apr-Jun(1) Jan-Jun(1)
OPERATING ACTIVITIES Net income $ 29,145 $ 14,902 $ 44,047 $ 57,626 $ 85,079
Adjustments to reconcile net income to net cash provided by
operating activities:
Depreciation and amortization 24,929 25,649 50,578 26,142 50,898
Movement in deferred tax liability 379 440 819 489 1,014
Utilization of deferred tax asset — — — 1,772 3,230
Amortization of deferred charges 1,707 2,580 4,287 1,517 3,154
Drydocking expenditure (1,704 ) (3,207 ) (4,911 ) (6,143 ) (6,415 )
Realized loss on bond repurchase — — — 53 6,573
Foreign exchange losses (670 ) 262 (408 ) 1,305 1,590
Unit options expense 58 58 116 56 121
Interest element included in obligation under capital lease, net (73 ) 39 (34 ) (6 ) (38 )
Change in assets and liabilities:
Trade accounts receivable (7,195 ) 10,229 3,034 (565 ) 8,951
Inventories (385 ) (119 ) (504 ) 475 357
Other current assets and other non-current assets (2,624 ) (13,858 ) (16,482 ) (18,522 ) (20,700 )
Amount due (from)/to related parties (4,112 ) 1,252 (2,860 ) 16,515 23,011
Trade accounts payable (429 ) (2,825 ) (3,254 ) 1,785 1,214
Accrued expenses 1,790 (6,819 ) (5,029 ) 3,684 6,703
Other current liabilities (5,438 ) (386 ) (5,824 ) (1,299 ) (2,047 )
Net cash provided by operating activities 35,378 28,197 63,575 84,884 162,695
INVESTING ACTIVITIES
Additions to vessels and equipment (3,018 ) (1,673 ) (4,691 ) — —
Net cash used in investing activities (3,018 ) (1,673 ) (4,691 ) — —
FINANCING ACTIVITIES
Proceeds from debt — 1,419 1,419 125,000 375,000
Repayments of debt (21,444 ) (91,575 ) (113,019 ) (26,936 ) (178,688 )
Repayments of obligation under capital lease (335 ) (317 ) (652 ) (197 ) (339 )
Advances from/(releases to) related party in relation with lease
security deposit 164
164
328
(1,993 ) (1,821 )
Repurchase of high yield bonds and related swaps — — — (4,489 ) (180,188 )
Proceeds from issuances of equity, net of issue costs — 13,854 13,854 — 119,438
Dividends paid to non-controlling interest — — — (3,600 ) (7,000 )
Common units buy-back and cancellation (1,474 ) (8,003 ) (9,477 ) — —
Cash distributions paid (44,236 ) (45,000 ) (89,236 ) (40,807 ) (78,564 )
Financing costs paid — (1,699 ) (1,699 ) (574 ) (5,290 )
Net cash (used in)/provided by financing activities (67,325 ) (131,157 ) (198,482 ) 46,404 42,548
Effect of exchange rate changes on cash, cash equivalents and
restricted cash (1) (6,943 ) 4,490
(2,453 ) 4,270
6,169
Net (decrease)/increase in cash, cash equivalents and restricted
cash (1) (41,908 ) (100,143 ) (142,051 ) 135,558
211,412
Cash, cash equivalents and restricted cash at beginning of
period (1) 329,744
429,887
429,887
303,979
228,125
Cash, cash equivalents and restricted cash at end of period (1) $ 287,836 $ 329,744 $ 287,836 $ 439,537 $ 439,537
(1)

Following the adoption of the amendments to ASC 230, the statement of cash flows presents the change in the period in total cash, cash
equivalents and restricted cash. These amendments have been applied retrospectively for all prior periods presented.
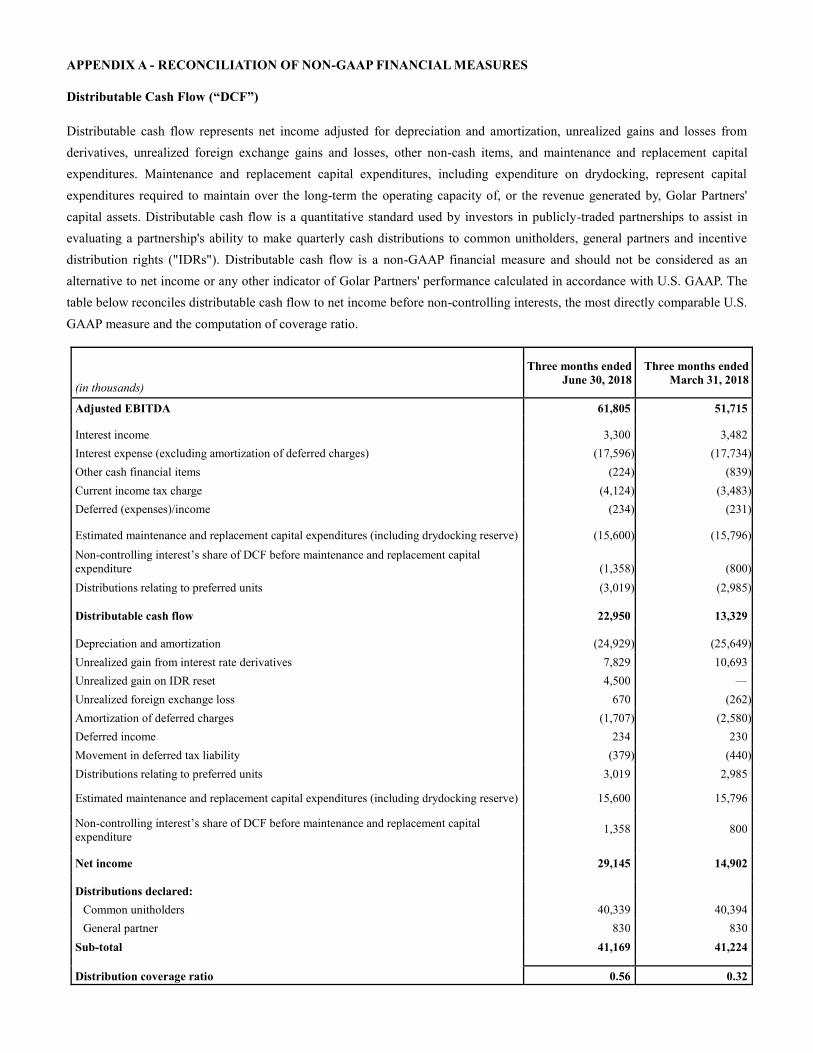
APPENDIX A - RECONCILIATION OF NON-GAAP FINANCIAL MEASURES
Distributable Cash Flow (“DCF”)
Distributable cash flow represents net income adjusted for depreciation and amortization, unrealized gains and losses from
derivatives, unrealized foreign exchange gains and losses, other non-cash items, and maintenance and replacement capital
expenditures. Maintenance and replacement capital expenditures, including expenditure on drydocking, represent capital
expenditures required to maintain over the long-term the operating capacity of, or the revenue generated by, Golar Partners'
capital assets. Distributable cash flow is a quantitative standard used by investors in publicly-traded partnerships to assist in
evaluating a partnership's ability to make quarterly cash distributions to common unitholders, general partners and incentive
distribution rights ("IDRs"). Distributable cash flow is a non-GAAP financial measure and should not be considered as an
alternative to net income or any other indicator of Golar Partners' performance calculated in accordance with U.S. GAAP. The
table below reconciles distributable cash flow to net income before non-controlling interests, the most directly comparable U.S.
GAAP measure and the computation of coverage ratio.
(in thousands)
Three months ended
June 30, 2018
Three months ended
March 31, 2018
Adjusted EBITDA 61,805 51,715
Interest income 3,300 3,482
Interest expense (excluding amortization of deferred charges) (17,596 ) (17,734 )
Other cash financial items (224 ) (839 )
Current income tax charge (4,124 ) (3,483 )
Deferred (expenses)/income (234 ) (231 )
Estimated maintenance and replacement capital expenditures (including drydocking reserve) (15,600 ) (15,796 )
Non-controlling interest’s share of DCF before maintenance and replacement capital
expenditure (1,358 ) (800 )
Distributions relating to preferred units (3,019 ) (2,985 )
Distributable cash flow 22,950 13,329
Depreciation and amortization (24,929 ) (25,649 )
Unrealized gain from interest rate derivatives 7,829 10,693
Unrealized gain on IDR reset 4,500 —
Unrealized foreign exchange loss 670 (262 )
Amortization of deferred charges (1,707 ) (2,580 )
Deferred income 234 230
Movement in deferred tax liability (379 ) (440 )
Distributions relating to preferred units 3,019 2,985
Estimated maintenance and replacement capital expenditures (including drydocking reserve) 15,600
15,796
Non-controlling interest’s share of DCF before maintenance and replacement capital
expenditure 1,358
800
Net income 29,145 14,902
Distributions declared:
Common unitholders 40,339 40,394
General partner 830 830
Sub-total 41,169 41,224
Distribution coverage ratio 0.56 0.32
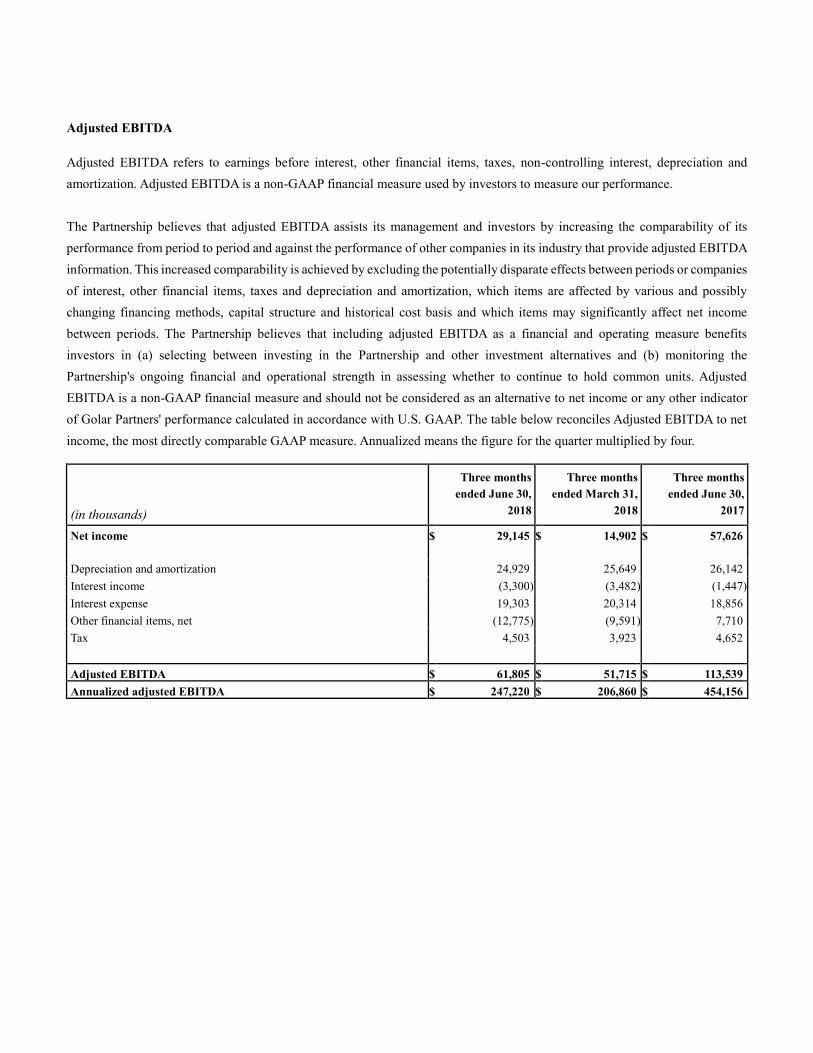
Adjusted EBITDA
Adjusted EBITDA refers to earnings before interest, other financial items, taxes, non-controlling interest, depreciation and
amortization. Adjusted EBITDA is a non-GAAP financial measure used by investors to measure our performance.
The Partnership believes that adjusted EBITDA assists its management and investors by increasing the comparability of its
performance from period to period and against the performance of other companies in its industry that provide adjusted EBITDA
information. This increased comparability is achieved by excluding the potentially disparate effects between periods or companies
of interest, other financial items, taxes and depreciation and amortization, which items are affected by various and possibly
changing financing methods, capital structure and historical cost basis and which items may significantly affect net income
between periods. The Partnership believes that including adjusted EBITDA as a financial and operating measure benefits
investors in (a) selecting between investing in the Partnership and other investment alternatives and (b) monitoring the
Partnership's ongoing financial and operational strength in assessing whether to continue to hold common units. Adjusted
EBITDA is a non-GAAP financial measure and should not be considered as an alternative to net income or any other indicator
of Golar Partners' performance calculated in accordance with U.S. GAAP. The table below reconciles Adjusted EBITDA to net
income, the most directly comparable GAAP measure. Annualized means the figure for the quarter multiplied by four.
(in thousands)
Three months
ended June 30,
2018
Three months
ended March 31,
2018
Three months
ended June 30,
2017
Net income $ 29,145 $ 14,902 $ 57,626
Depreciation and amortization 24,929 25,649 26,142
Interest income (3,300 ) (3,482 ) (1,447 )
Interest expense 19,303 20,314 18,856
Other financial items, net (12,775 ) (9,591 ) 7,710
Tax 4,503 3,923 4,652
Adjusted EBITDA $ 61,805 $ 51,715 $ 113,539
Annualized adjusted EBITDA $ 247,220 $ 206,860 $ 454,156

Net Debt
Net Debt is defined as short-term and long-term debt including current portion plus obligations under capital leases less cash and
cash equivalents and restricted cash. Net Debt is a non-GAAP financial measure used by investors to measure our performance
and should not be considered as an alternative to any other indicator of Golar Partners' performance calculated in accordance
with U.S. GAAP. The Partnership believes that net debt assists its management and investors by increasing the comparability of
its combined indebtedness and cash position against other companies in its industry. This increased comparability is achieved by
providing a comparative measure of debt levels irrespective of the levels of cash that a company maintains. We provide a ratio
of net debt to annualized adjusted EBITDA to enable our investors to understand better our liquidity position and our ability to
service our debt obligations.
At June 30, At March 31, At June 30,
(in thousands) 2018 2018 2017
Current portion of long-term debt and short-term debt 271,360 275,608 115,758
Current portion of obligation under capital lease
1,431 2,696 1,081
Long-term debt 990,678 1,006,151 1,339,098
Obligation under capital lease - non current 123,138 129,821 122,853
Total Debt $ 1,386,607 $ 1,414,276 $ 1,578,790
Cash and cash equivalents 115,877 142,629 301,486
Restricted cash and short term deposits - current 22,356 28,752 16,845
Restricted cash - non current 149,603 158,363 121,206
Total Cash, Cash Equivalents and Restricted Cash $ 287,836 $ 329,744 $ 439,537
Net Debt $ 1,098,771 $ 1,084,532 $ 1,139,253
Net Debt to Annualized Adjusted EBITDA 4.4 5.2 2.5