interim results presentation 13 august
TRANSCRIPT

2015 Interim Results 13th August 2015

Financial Review

Financial Highlights
Statutory revenue growth of 22.5%
Statutory EBITDA2 growth of 41.0%
Investment in new sites of £41.6m and
existing estate £5.7m
Strong cash generation – net debt reduced to
£270.5m (Dec 2014 - £281.9m)
Adjusted EPS up 45.0%
Interim dividend increased by 31.6% to 5.0p
1. Group statutory results includes the results for Cinema City for 17 weeks in H1 2014 and 44 weeks in FY 2014
2. EBITDA is defined as operating profit before depreciation and amortisation, impairment charges, adjustments to goodwill, onerous leases and other non- recurring charges, transaction and reorganisation
costs and profit on disposal of cinema sites
Group
H1 2015
Group
H1 20141
Group
FY 20141
Admissions 44.9m 35.8m 82.9m
Box office £217.1m £180.0m £399.2m
Retail £76.5m £61.6m £141.9m
Other £35.5m £27.0m £78.3m
Total revenue £329.1m £268.6m £619.4m
EBITDA £64.7m £45.9m £126.6m
Adjusted profit before tax £39.3m £22.6m £61.2m
Adjusted diluted EPS 11.6p 8.0p 24.4p
Dividend per share 5.0p 3.8p 13.5p
2

Pro Forma Performance
UK & Ireland CEE & Israel
Group
H1
2015
% PY1
H1
2015
% PY2
H1
2015
% PY
Admissions 25.0m + 2.5% 19.9m + 9.3% 44.9m + 5.4%
Box office £150.4m + 10.5% £66.7m + 11.7% £217.1m + 10.9%
Retail £50.6m + 10.8% £25.9m + 17.3% £76.5m + 12.9%
Other £18.3m + 16.3% £17.2m + 4.9% £17.2m + 10.4%
Total revenue £219.3m + 11.0% £109.8m + 11.8% £329.1m + 11.3%
EBITDA £40.0m + 26.4% £24.7m + 16.6% £64.7m + 22.5%
EBITDA Margin 18.2% + 2.2 ppts +22.5% + 1.0 ppts 19.6% + 1.8 ppts
1. Pro forma performance of UK & Ireland compares the 26 week period ended 2 July 2015 to the 26 week period ended 3 July 2014
2. Pro forma performance of CEE & Israel compared the 26 week period ended 2 July 2015 to the 26 week period ended 3 July 2014, with % change calculated on a constant currency basis 3
Group revenue growth of
11.3%
Group EBITDA growth of
22.5%
Group EBITDA margin of
19.6%, an improvement of
1.8 percentage points

Box Office and Retail Performance
Admissions - m Average Ticket Price
Retail Spend Per Person
(3.7%)
6.8%
3.0%
14.5% (8.3%)
(0.8%) 10.7% (1.2%)
90.9
(0.5%)
4.0%
(1.5%)
1.9% 1.1%
(3.7%)
(0.7%)
1.1%
0.3% 1.3%
6.3%
(2.9%)
8.9% 1.1%
0.2%
6.4%
1.4%
3.7%
3.6%
0.0
10.0
20.0
30.0
40.0
50.0
£2.50
£3.50
£4.50
£5.50
£0.50
£1.50
4
Mil
lio
ns

Other Income
Other income includes advertising, distribution, and other
Overall, other income has increased by 10.4% on a pro forma basis1
Good distribution income during the first half
− Distributor of key titles across the CEE & Israel
Increase in revenue generated from the sale of advertising in both the UK and CEE & Israel
1. Year on year performance compares the 26 week period ended 2 July 2015 to the 26 week period ended 3 July 2014, with % change calculated on a constant currency basis 5

Group Income Statement
Includes depreciation of £18.9m, of which £11.5m
relates to the UK and £7.4m relates to CEE & Israel
Of the £4.8m amortisation, £2.9m is acquisition
accounting related and £1.9m is the amortisation of
acquired movie rights
The £2.8m net exceptional income includes the
following cash items:
− £0.4m of reorganisation costs
− £3.2m impairment charges
− £6.4m profit on disposal of Cambridge
Net finance income of £3.3m includes £3.8m of
underlying net cash interest paid on bank loans,
£8.9m foreign exchange gains, and £1.8m other non-
cash finance charges
1. Adjusted information presented to demonstrate the basis of the adjusted diluted EPS
calculation.
2. Foreign exchange losses relates to translation losses recognised in EBITDA.
3. Adjusted finance income and expense presented after eliminating the £8.9m forex gain on the
translation of the Euro term (2014: £3.0m) and in the case of 2014, other non-recurring finance
costs in respect of restructuring the debt facility totalling £2.6m.
Adjusted basis1 Statutory basis
£m H1 2015 H1 2014 H1 2015 H1 2014
Revenue 329.1 268.6 329.1 268.6
EBITDA 64.7 45.9 64.7 45.9
Depreciation and amortisation (20.8) (17.5) (23.7) (19.9)
Exceptional income / (cost) - - 2.8 (6.4)
Foreign exchange losses2 1.3 0.3 - -
Operating profit 45.2 28.7 43.8 19.6
Finance income / (expense)3 (5.6) (5.9) 3.3 (5.5)
Share of JV losses (0.3) (0.2) (0.3) (0.2)
Profit before tax 39.3 22.6 46.8 13.9
Tax (8.3) (4.0) (9.9) (2.1)
Profit after tax 31.0 18.6 36.9 11.8
Diluted EPS 13.9p 5.1p
Adjusted diluted EPS 11.6p 8.0p 6
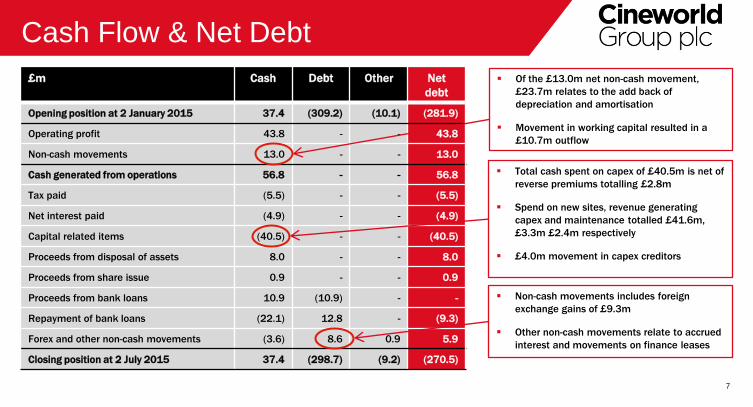
Cash Flow & Net Debt
£m Cash Debt Other
Net
debt
Opening position at 2 January 2015 37.4 (309.2) (10.1) (281.9)
Operating profit 43.8 - - 43.8
Non-cash movements 13.0 - - 13.0
Cash generated from operations 56.8 - - 56.8
Tax paid (5.5) - - (5.5)
Net interest paid (4.9) - - (4.9)
Capital related items (40.5) - - (40.5)
Proceeds from disposal of assets 8.0 - - 8.0
Proceeds from share issue 0.9 - - 0.9
Proceeds from bank loans 10.9 (10.9) - -
Repayment of bank loans (22.1) 12.8 - (9.3)
Forex and other non-cash movements (3.6) 8.6 0.9 5.9
Closing position at 2 July 2015 37.4 (298.7) (9.2) (270.5)
Of the £13.0m net non-cash movement,
£23.7m relates to the add back of
depreciation and amortisation
Movement in working capital resulted in a
£10.7m outflow
Total cash spent on capex of £40.5m is net of
reverse premiums totalling £2.8m
Spend on new sites, revenue generating
capex and maintenance totalled £41.6m,
£3.3m £2.4m respectively
£4.0m movement in capex creditors
Non-cash movements includes foreign
exchange gains of £9.3m
Other non-cash movements relate to accrued
interest and movements on finance leases
7
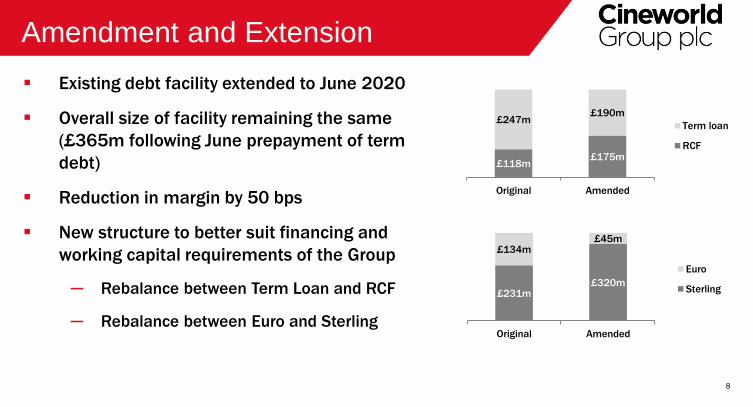
Amendment and Extension
Existing debt facility extended to June 2020
Overall size of facility remaining the same
(£365m following June prepayment of term
debt)
Reduction in margin by 50 bps
New structure to better suit financing and
working capital requirements of the Group
─ Rebalance between Term Loan and RCF
─ Rebalance between Euro and Sterling
8
£118m £175m
£247m £190m
Original Amended
Term loan
RCF
£231m £320m
£134m £45m
Original Amended
Euro
Sterling

Financial Outlook
Business on track to be marginally ahead of our plans for 2015
On track with £3.5m - £4.0m synergies savings in 2015 on an annualised basis,
with scope for further business initiatives going forward
Acquisition accounting adjustments now finalised and no changes from 2014 year
end
Net debt to remain level
Tax rate expected to remain consistent at 21%
9

Business Update

Solid financial performance in all territories
Strong film slate during H1
Continuing to integrate the business
Expansion plans on track
Investing in the existing estate
Focus on the customer experience and new technology
Promising slate for the remainder of the year
Business Update
11

2015 New Openings
12
Nine new sites and 93 screens opened since the start of the year
─ UK – 4 sites, 34 screens
─ Romania – 2 sites, 24 screens
─ Poland – 2 sites, 15 screens
─ Israel – 1 site, 16 screens
Current chain has 210 sites with 1,960 screens
Plan to open 10 additional sites with 85 screens by the year end
Over 2,000 screens by the end of the year

2015 New Openings
No. of screens UK Poland Romania Israel Czech
Rep
Other Group
2 January 2015 897 339 154 104 111 270 1,875
Swindon 6 6
Broughton 11 11
Silverburn 14 14
East Dulwich 3 3
Letnany1 4 4
Bucharest 14 14
Lublin 9 9
Starograd Gdanski 6 6
Constanta 10 10
Jerusalem 16 16
Closures2 (8) (8)
13 August 2015 931 354 178 112 115 270 1,960
Target for the end of
the year…
978 354 198 130 115 270 2,045 1. Letnany – 4 screens added to an existing site
2. Closures in Israel relate to Gat (1 screen) and the old
site in Jerusalem (7) which was replaced by the new site 13

New Sites – UK
Swindon – 6 screens
14
Broughton – 11 screens

New Sites – Poland
Lublin – 9 screens
15
Starogard Gdanski – 6 screens

New sites – How to Make A Cinema
16
Mega Mall Romania
Opened May 2015
14 Screens
IMAX and 4DX

Investment in our Estate
Milton Keynes successful during H1 2015
− New format
− First 4DX in the UK – strong occupancy
− Superscreen
− Starbucks
Picturehouse Central
More to follow
− Sheffield (underway)
− Glasgow
17

The Customer Experience
18
Cinema of the Future
− Providing our customers with the choice of how they see the movie
The best technology
− IMAX
− 4DX
− Superscreen
The cinema experience
− VIP concept

Films for H2 2015
Q4
Q3
Plus…
Adam Jones
Hotel Transylvania 2
Crimson Peak
Black Mass
The Good Dinosaur
Steve Jobs
Bridge Of Spies
19

2016 – Key Titles
20

2016 – Key Titles
21

Q & A

Appendices

New Openings : Signed Contracts1
2015 H2 2016 2017 2018 +
Sites Screens Sites Screens Sites Screens Sites Screens
UK (including Picturehouse) 6 47 11 69 4 38 3 23
Poland 1 11 1 20 4 49
Romania 3 20 5 54 12 116 8 67
Bulgaria 1 12
Czech Rep 1 18
Israel 1 18 1 12
Total 10 85 18 146 18 192 16 151
24
1. The new openings schedule is based on signed contracts. Management believe that the expected opening dates of the cinemas are accurate as at the time of this presentation. The Group
continues to work together with third parties to develop sites and there is therefore also the risk that a site may be subject to delays which are out the control of the Group.
