interim results presentation for the six months ended 3
TRANSCRIPT

Geoffrey Wilding, Executive ChairmanPhilippe Hamers, Group Chief ExecutiveMike Scott, Group Finance Director
Interim Results Presentationfor the six months ended 3 October 2020
H1 FY21 Results OverviewExecutive summary
2
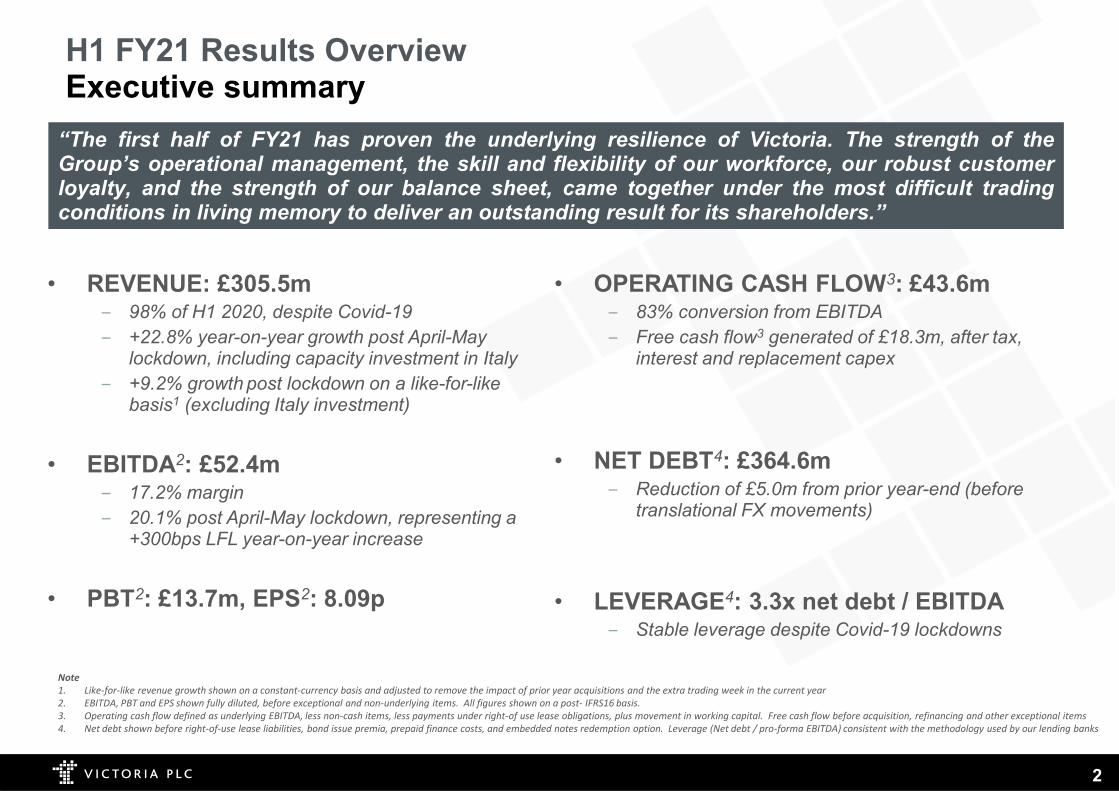
• REVENUE: £305.5m‒ 98% of H1 2020, despite Covid-19‒ +22.8% year-on-year growth post April-May
lockdown, including capacity investment in Italy‒ +9.2% growth post lockdown on a like-for-like
basis1 (excluding Italy investment)
• EBITDA2: £52.4m‒ 17.2% margin‒ 20.1% post April-May lockdown, representing a
+300bps LFL year-on-year increase
• PBT2: £13.7m, EPS2: 8.09p
• OPERATING CASH FLOW3: £43.6m‒ 83% conversion from EBITDA‒ Free cash flow3 generated of £18.3m, after tax,
interest and replacement capex
• NET DEBT4: £364.6m‒ Reduction of £5.0m from prior year-end (before
translational FX movements)
• LEVERAGE4: 3.3x net debt / EBITDA‒ Stable leverage despite Covid-19 lockdowns
“The first half of FY21 has proven the underlying resilience of Victoria. The strength of theGroup’s operational management, the skill and flexibility of our workforce, our robust customerloyalty, and the strength of our balance sheet, came together under the most difficult tradingconditions in living memory to deliver an outstanding result for its shareholders.”
2
Note1. Like-for-like revenue growth shown on a constant-currency basis and adjusted to remove the impact of prior year acquisitions and the extra trading week in the current year2. EBITDA, PBT and EPS shown fully diluted, before exceptional and non-underlying items. All figures shown on a post- IFRS16 basis.3. Operating cash flow defined as underlying EBITDA, less non-cash items, less payments under right-of use lease obligations, plus movement in working capital. Free cash flow before acquisition, refinancing and other exceptional items4. Net debt shown before right-of-use lease liabilities, bond issue premia, prepaid finance costs, and embedded notes redemption option. Leverage (Net debt / pro-forma EBITDA) consistent with the methodology used by our lending banks

H1 FY21 Results OverviewSegmental performance
3
Note1. Figures presented are underlying and pre-exceptional items
Continuing operations£m
27 weeks ended 3 October 2020 26 weeks ended 28 September 2019
UK & Europe –soft flooring
UK & Europe– ceramic
tilesAustralia Central
costs TOTAL UK & Europe- soft flooring
UK & Europe – ceramic
tilesAustralia Central
costs TOTAL
Revenue 126.0 132.5 47.0 - 305.5 140.6 122.0 49.7 - 312.3 % growth -10.4% +8.6% -5.4% - -2.2% +4.4% +49.3% -6.4% - +15.8%
Gross profit 40.8 47.0 14.5 - 102.3 46.8 52.7 15.0 - 114.5 % margin 32.4% 35.5% 30.9% - 33.5% 33.3% 43.2% 30.2% - 36.7%
Underlying EBITDA1 19.2 27.7 6.2 (0.7) 52.4 19.4 34.4 5.6 (0.9) 58.5
% margin 15.2% 20.9% 13.2% - 17.2% 13.8% 28.2% 11.3% - 18.7%
Underlying EBIT1 10.2 15.2 3.8 (1.0) 28.2 10.5 26.8 3.3 (0.9) 39.7% margin 8.1% 11.5% 8.1% - 9.2% 7.5% 22.0% 6.6% - 12.7%

4
H1 FY21 Results OverviewRevenue growth: +9.2% like-for-like post lockdown
Year-on-year revenue growth
27 weeks ended 3 October 2020
H1 Total April – MayLockdown June - September
AbsoluteUK & Europe – soft flooring -10.4% -80.0% +27.8%UK & Europe – ceramic tiles +8.6% -24.7% +27.4%Australia -5.4% -12.1% -2.4%Group total -2.2% -48.1% +22.8%
Like-for-like1
UK & Europe – soft flooring +21.2%UK & Europe – ceramic tiles -2.6%Australia Jun-Aug: +14.7%Group total -13.9% -55.6% +9.2%
Australia revenues impacted in the latter part of August and September by local lockdown in the Melbourne area
Note1. Like-for-like revenues are shown on a constant-currency basis, after removing the impact of prior year acquisitions, and the extra trading week in the current year

5
H1 FY21 Results OverviewMargin improvement: +300bps like-for-like post lockdown
Underlying EBITDA margin
27 weeks ended 3 October 2020
H1 Total June - September
UK & Europe – soft flooring
EBITDA margin 15.2% 18.5%
LFL margin variance to prior year1 +150bps +500bps
UK & Europe – ceramic tiles
EBITDA margin 20.9% 24.2%
LFL margin variance to prior year1 -350bps +150bps
Australia
EBITDA margin 13.2% 14.0%
LFL margin variance to prior year1 +210bps +260bps
Group total
EBITDA margin 17.2% 20.1%
LFL margin variance to prior year1 -50bps +300bps
Note1. LFL margin variance shown after removing the impact of prior year acquisitions. Variances rounded to nearest 10bps
Additional reduction in reported margin versus prior year of 100bps simply due to mix effect of prior year acquisitions of lower-margin businesses

6
H1 FY21 Results OverviewNon-underlying items
Non-underlying items from continuing operations£m
H1 FY21 H1 FY20Reorg & Covid-19 related
Refinancing related
Acquisition related Other Total Total
Exceptional items
Acquisition and disposal related costs (0.4) (0.4) (1.0)Reorganisation and Covid-related exceptional costs (3.0) (3.0) (1.8)Negative goodwill arising on acquisition - 0.6
(3.0) - (0.4) - (3.4) (2.2)
Other operational items
Non-cash share incentive plan charge (0.5) (0.5) (1.0)Amortisation of acquired intangibles (13.5) (13.5) (12.1)Acquisition-related performance plan charge - (0.6)
- - (13.5) (0.5) (14.0) (13.7)
Finance items
Interest on short-term draw of Group revolving credit facility (1.4) (1.4) -Release of prepaid finance costs - (2.8)Underwriting fees and costs relating to previous bank facilities - (6.2)Fair value adjustment to notes redemption option 0.7 0.7 -Deferred consideration – unwinding of discount and other adj. 0.6 0.6 (2.7)Mark to market adj. on foreign exchange forward contracts (2.6) (2.6) 1.6Translation difference on foreign currency loans 3.5 3.5 4.0
(1.4) 0.7 0.6 0.9 0.8 (6.1)
Key: Cash items

H1 FY21 Results OverviewConsistent strong operational cash generation
7
£mH1
FY21H1
FY20Full year
FY20
Revenue 305.5 312.3 621.5% growth -2.2% 15.8% 9.7%
Underlying EBITDA (post credit loss provision) 52.4 58.5 115.3% margin 17.2% 18.7% 18.6%
Payments under right-of-use lease obligations (6.6) (6.6) (11.6)
Non-cash items (0.5) (0.4) (0.8)
Underlying movement in working capital (1.7) (6.8) (5.2)
Operating cash flow before interest, tax and exceptional items 43.6 44.7 97.6% EBITDA conversion 83% 76% 85%
Interest paid (16.1) (5.6) (25.0)Income tax paid (0.6) (4.4) (8.6)Replacement capex (9.1) (12.3) (25.4)Proceeds from fixed asset disposals 0.5 0.4 0.7
Free cash flow before exceptional items 18.3 22.8 39.2% EBIT conversion 65% 57% 53%

8
H1 FY21 Results OverviewFocused treasury management through the pandemic
Note1. Net debt shown before bond issue premia; notes redemption option; prepaid finance costs; and obligations under right-of-use leases

9
H1 FY21 Results OverviewStable leverage
Breakdown of net debt£m
H1FY21
H1 FY20
Full year FY20
Net cash and cash equivalents 129.6 82.1 174.7
Senior secured debt (at par) (453.0) (293.9) (448.4)
Revolving credit facility - - (75.0)
Term Loan - (143.2) -
Unsecured loans and finance leases (pre- IFRS16) (41.2) (17.4) (17.2)
Net debt (before obligations under right-of-use leases) (364.6) (372.4) (365.9)
Bond issue premium - cash (6.6) - (7.5)
Bond issue premium - non-cash (related to embedded redemption option) (6.1) - (6.8)
Notes redemption option (at fair value) 0.8 - -
Pre-paid finance costs 8.7 8.1 9.9
Obligations under right-of-use leases (incremental) (78.5) (60.3) (78.2)
Statutory net debt (net of prepaid finance costs) (446.3) (424.6) (448.5)
Adjusted net debt / pro-forma EBITDA1 3.3x 3.3x 3.0x
Note1. Leverage (Net debt / pro-forma EBITDA) consistent with the methodology used by our lending banks
Operational Highlights

11
UK & Europe - Soft Flooring: Post-lockdown LFL operating margin +500bps
• Strong H1 margin growth (+200bps) due to FY19 & FY20 investment/reorganisation
• Ongoing focus on margin expansion
• Bottom slicing of margin-dilutive products
• Full production integration of G-Tuft plant (acquired in 2019) completed. Resulting efficiency has enabled 30% more production with 12% fewer employees
• Key differentiator – driving market share gains
• OTD of stock increased from 91% to 94% -resulting in retailers favouring Victoria as a supplier over competitors with slower & less certain delivery
• Productivity of the three distribution centres also jumped as the impact of our investment in FY19 and FY20 arrived. We are now cutting and delivering 45% more orders with 25% fewer employees
• Reorganisation and productivity enhancements have also delivered more spare capacity –allowing for future growth of more than 20% without further capex investment required
Carpet Logistics
11
Underlay
• Demand at 100% capacity. Focus on improving output via removing production bottlenecks
• Logistics brought in-house, improving margin
• Diversified supply chain to ensure raw material availability post-Brexit
H1 FY21Total
June – September(post-lockdown)
Revenue £126.0m £94.3m
Absolute growth % -10.4% +27.8%
LFL growth % - +21.2%
Underlying EBITDA margin 15.2% 18.5%
LFL margin variance % +150bps +500bps

12
UK & Europe - Ceramic Tiles: Post-lockdown sales +27.4% year-on-year
• Production capacity added in March 20 following very strong growth, by acquiring the factory and assets of a neighbouring business facing closure. A highly efficient way to add immediate production capacity versus the 18-24 months it takes to build a new factory, instal the plant, and acquire emission rights
• Full integration completed of the acquired factory into the current Italian structure, allowing for a reduction of employees from 368 to 250 FTE alongside production output increasing by 1.2m m² of red body tiles and 0.7m m² of porcelain tiles
• Capacity has again been filled and production is again being outsourced. We will look to add additional capacity in the New Year
• With a longer duration and less government support, Q1 was more negatively influenced by the Covid-19 lockdown than our Italian factories
• Q2 saw a strong recovery in demand other than the Saloni brand, which is more focussed on the commercial/construction market, which has been slower to recover than consumer/redecorating markets
• Significant improvements in the overall production cost in Q2 due OPEX initiatives and reduced cost of utilities
• Strong consumer demand through the longer lockdown has resulted in significant backorders, which the business is now working at full capacity to meet. This is expected to deliver a very good H2
Italy Spain
12
H1 FY21Total
June – September(post-lockdown)
Revenue £132.5m £100.5m
Absolute growth % +8.6% +27.4%
LFL growth % - -2.6%
Underlying EBITDA margin 20.9% 24.2%
LFL margin variance % -350bps +150bps

13
Australia: H1 LFL Margin +210bps and EBITDA +10.7%
13
• Delivered an outstanding result with the H1 EBITDA +10.7% versus last year, despite revenues being down slightly at -5.4%. Operating margins have been markedly improved by management actions taken last year and the result for H1 would have been even better but for the very strict seven-week lockdown in August/September, which required the total shutdown of our Victoria State businesses
• Loyal retailers continued to sell Victoria product to consumers despite our inability to deliver due to the lockdown. Record back orders have been received, which will fuel October and November revenues
• We have a significant pipeline of new products which will further carry momentum in H2
• The underlay factory consolidation previously announced continues to drive efficiencies, with the H1 budget achieved, despite the impact of Covid-19
Carpets & Underlay
H1 FY21Total
June – September(post-lockdown)
Revenue £47.0m £32.3m
Absolute growth % -5.4% -2.4%
LFL growth % -2.2% Jun-Aug: +14.7%
Underlying EBITDA margin 13.2% 14.0%
LFL margin variance % +210bps +260bps
14
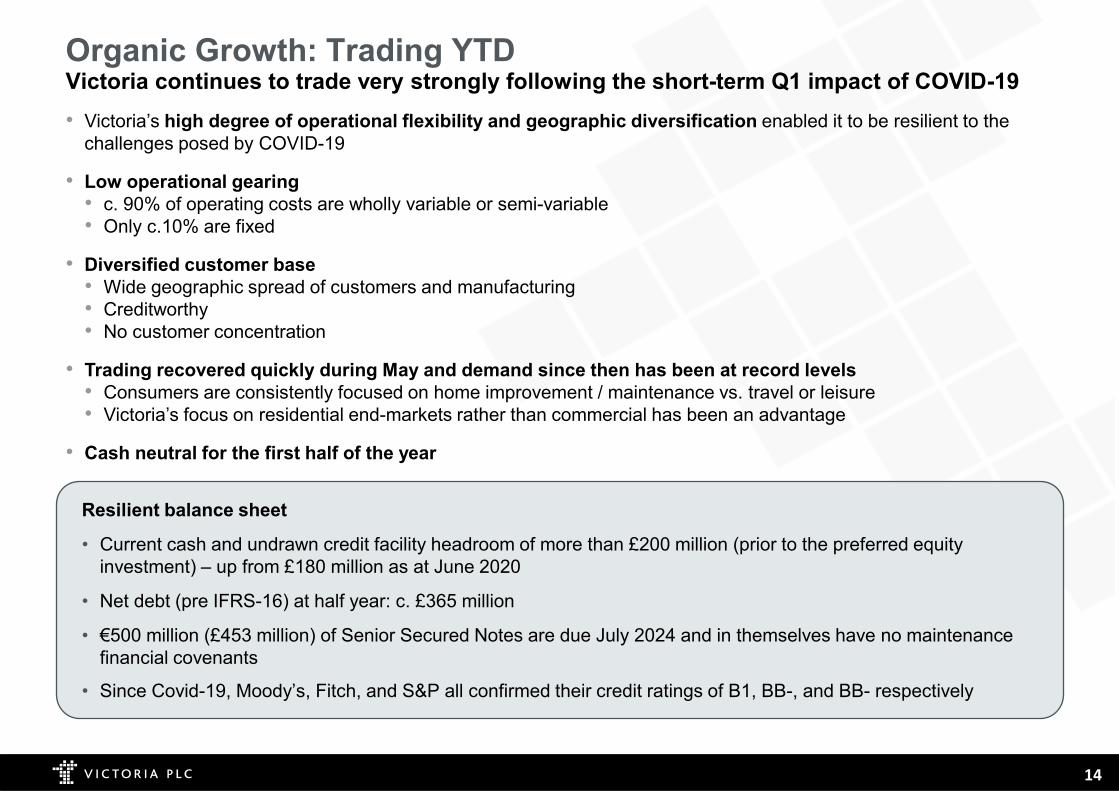
Organic Growth: Trading YTD Victoria continues to trade very strongly following the short-term Q1 impact of COVID-19• Victoria’s high degree of operational flexibility and geographic diversification enabled it to be resilient to the
challenges posed by COVID-19
• Low operational gearing• c. 90% of operating costs are wholly variable or semi-variable• Only c.10% are fixed
• Diversified customer base• Wide geographic spread of customers and manufacturing• Creditworthy• No customer concentration
• Trading recovered quickly during May and demand since then has been at record levels • Consumers are consistently focused on home improvement / maintenance vs. travel or leisure• Victoria’s focus on residential end-markets rather than commercial has been an advantage
• Cash neutral for the first half of the year
Resilient balance sheet
• Current cash and undrawn credit facility headroom of more than £200 million (prior to the preferred equity investment) – up from £180 million as at June 2020
• Net debt (pre IFRS-16) at half year: c. £365 million
• €500 million (£453 million) of Senior Secured Notes are due July 2024 and in themselves have no maintenance financial covenants
• Since Covid-19, Moody’s, Fitch, and S&P all confirmed their credit ratings of B1, BB-, and BB- respectively

Koch Equity Development Investment

16
Koch Equity Development (“Koch”) becomes a major shareholder and supportive investor in Victoria
Preferred equity capital to fund the acquisition of up to £100m of EBITDA
Victoria will continue its conservative financial policy
“We are delighted to be partnering with Victoria… we are confident in Victoria’s strategy, its management team, and the size of the market opportunity. This investment will help Victoria accelerate execution of its clear growth plans, creating value for all the company’s shareholders.”
Blake Ressel, Managing Director, Koch Equity Dev.
• Koch undertook extensive due diligence on Victoria’s business, management team, and the market opportunity• Koch have acquired 10.7% of Victoria’s equity in the secondary market• Koch has committed to £175 million of perpetual preferred equity – “fuel in the tank”
• Preferred equity will be invested in cash-flow generating acquisitions targets
• New perpetual preferred equity reinforces its prudent approach to capital management• Victoria is committed to its financial policy of c. 3x senior net debt/EBITDA post-acquisition, falling to 2x when in
‘steady state’• If the perpetual preferred equity does not convert, then it may be refinanced via a similar instrument or common
equity
Koch Equity Development Investment£175 million of preferred equity to accelerate Victoria’s acquisition plans

17
Koch Equity Development InvestmentA supportive long-term partner with demonstrated experience in industrial investments
Koch Industries
• Founded in 1940
• Owned by the Koch family
• Under the leadership of its current CEO, Charles Koch, the company has grown revenues from around US$400m to $115bn and is now one of the largest privately-held companies in the US
• Koch owns a diverse group of companies involved in refining, chemicals and biofuels; forest and consumer products; fertilizers; polymers and fibres; electronics, software and data analytics; automotive components; process and pollution control equipment and technologies; commodity trading; minerals; ranching; and investments
• Koch has significant experience and expertise in the flooring sector through its Invista and Stainmastercarpet businesses, predominantly focused on the US markets
Koch Equity Development (“KED”)
• Koch Equity Development is Koch’s acquisition and investment subsidiary and has the primary responsibility in investing the firm’s excess capital
• It has invested $30 billion since 2012
• With its long-term investment horizon, KED is an attractive partner for Victoria and will bring expertise and market access alongside its shareholding and capital contribution
• KED has high structuring and duration flexibility and a streamlined decision making process, with a minimum investment of $100m

Victoria Share Buyback

19
• Decision to proceed taken after reviewing:
• Trading outlook. The Board was encouraged by the sustainability of the trading recovery previously advised to shareholders as revenue continued to strengthen each month
• Liquidity. Victoria has a resilient balance sheet with more than £200m of cash and undrawn credit-lines (up from £180m as at 30 June and prior to the Koch investment) to which it continues to add each month.
• Value: Given Victoria’s trading prospects, the Board considered Victoria’s shares very materially undervalued
• Alternative uses for excess cash
The buy-back reduced Victoria’s ordinary shares outstanding by 6.8%, thereby increasing current and future EPS and FCF per shares by 7.3%
It is important to stress that the buy-back does not imply a departure from the Company’s financial policy, either in terms of leverage appetite or payment of dividends
The Directors are firmly of the view that the buy-back, in conjunction with the new preferred equity being raised, was an optimal use of capital and will be value-enhancing for shareholders
“Wise capital allocation is the single largest driver of value creation over the medium term”
Share Buy-back: Concentrates benefits of value creation

Outlook

21
Organic Growth: Outlook positive Victoria continues to trade very strongly following the initial short-term impact of COVID-19
Economic factors
• Victoria’s key market – residential renovation – has proven to be extremely resilient as consumers are spending more time at home and re-focusing expenditure away from travel and leisure (see chart bottom right. Source Bank of England)
• As a result of people spending more time at home, household savings have increased dramatically (see chart top right). This savings growth has been weighted towards higher income households – Victoria’s key market
• UK house sales – a driver of renovation (people generally replace flooring 6-12 months after purchase) – have rebounded and are +50% in October (vs last year) according to Rightmove
• Unemployment biased towards the young (working in retail and hospitality), who tend not to be homeowners
Victoria unique factors
• Victoria’s diversified exposure to a number of different economies = resilience. Recession or lockdown in one geography is offset by others
• More productivity enhancements to come (without significant cost) – driving further margin expansion
• Victoria’s focus on residential end-markets rather than commercial, and ability to react extremely fast to shut and re-open operations, has been a key advantage
• Customers seeking mid-high end products have been more resilient
Savings as a percentage of disposable income

22
Acquisitions: attractive prospectsValue-accretive acquisitions have grown EBITDA from £2.3m (2013) to £107.2m (2020)
Illustrative example: Buying £100m EBITDA
Deal structure minimises downside risk
European flooring sector is worth €23 billionat factory gate
Better buying power on raw materials
Rationalisation of product lines and cross selling via new distribution channels
Ability to affect price increases
Distribution, warehousing and logistics
Consolidation of manufacturing capacity
Consolidator in a fragmented industry
Synergies create strong levers for margin expansion
Motivated sellers – retirement, capital structure under pressure
Pro-active deal origination – Victoria actively prospects for opportunities
Purchase price:
£100m EBITDA (from one or more targets)at 7x multiple: £700m
Funding:
Senior debt: 3 x £100 million EBITDA: £300mConvertible Preferred Equity: £167mEarn-out (33% of purchase price): £233m
Total funding: £700m

Investment Highlights

24
Key investment highlights
Diversified business across products, customers and geographies
The Victoria Group presents a unique equity story
Global business with a focus on the mid to high-end products1
Stable flooring market underpinned by the resilient improvement and repair segment
2
High structural barriers to entry
3
4
Low operational gearing through a flexible cost base and limited capex intensity5
Proven acquisition track record and ability to realize synergies6
Experienced management team with proven track record of sustainable value creation7

25
Global business with a focus on the mid to high-end products
Underlay and accessories
Ceramic tiles (39% FY20 Revenue)(28% Adj. EBITDA margin1)
Soft flooring (61% FY20 Revenue)(14% Adj. EBITDA margin1)
Brands span from mid-end
mass market up to high-end
covering every price point
Market position
UK & Europe AustraliaStrong market positions across key markets
in UKCarpets(2)
in UK Underlay and
accessories(2)
in Underlay and
accessories(3)
#1 #1
inCarpets(3)
#2 #1
Artificial grass
LVT
Carpet
LVT
Underlay and accessories
Carpet
UK & Europe -soft flooring
45%
UK & Europe -ceramic tiles
39%
Australia15%
Source: FY20 Company information.
(1) Adj. EBITDA margin is post IFRS 16 and before credit loss provision.(2) Largest UK manufacturer by volume.(3) By sales.

26
Diversified business across products, customers and geographies
Ceramic tiles62%
Carpets18%
Underlay16%
Artificial Grass
4%
Well balanced product portfolioHighly diversified geographic exposure
Low customer concentrationMulti-channel customer base
Wide product offering increases cross selling opportunities, visibility
and pricing power
Flexibility to producein and serve multiple
geographies
Largest group of customers are
independent flooring retailers having brand loyalty and long term
relationships
Split of revenue by customer type(2)
Split of EBITDA by destination country(1)
Split of EBITDA by product category(1)
Split of revenue by key customer(2)
Top 10 customers account for 18% sales with largest customer
accounting for 3%
UK28%
Spain24%France
10%
Australia9%
Rest of Europe
17%
Other11%
Independent retailers43%
National retailers24%
DIY retailers6%
Wholesalers / Distributors
22%
Commercial –hospitality, leisure and construction
1%
Other4% 3% 3%
3%2% 1% 1%
1%1%
1%1%
82%
Source: Company information.(1) Based on FY19 underlying EBITDA.(2) Based on FY19 pro-forma revenues.

27
Stable flooring market underpinned by the resilient improvement and repair segment
Improvement & repair is the primary driver of the Western European and Australian residential flooring markets
85%
15%
I&R - Non-Cyclical New Build - Cyclical
FY171.2bn sqm
Key advantages of I&Rvs. new build
• End users less price sensitive• More stable through the cycle
given lower cost vs. new build
2,100 2,240 2,395 2,535
173222
231254
2,2732,462
2,6262,789
FY12 FY17 FY22 FY27
Western Europe Australia
We operate in developed markets with steady growth driversWestern European and Australian flooring market (m sqm)
5.1%
1.3%
CAGRFY12-17
CAGRFY17-22
1.6% 1.3%
0.8%
1.3%
I&R end market 5-6x larger than new
construction
Source: Freedonia Global Flooring Market Report (Jan-19).

28
High structural barriers to entry
Fragmented customer base – focus on long-standing relationships with broad network of independent retailers
Established and trusted brands – well known with retailers for certainty of supply and quality
Product handling – specialist warehousing and distribution required; difficult over long distances
Scale is key – smaller operations / contract manufacturing significantly less efficient than long production runs
Proximity to customers helps influence designs/trends and maintain customer relationships
Deep product knowledge and technical expertise – vital to underpin operational efficiency and innovation

29
Low operational gearing through a flexible cost base and limited capex intensity
Logistics11%
Sales & Marketing
8%
Administration2%
21%of
revenues
Capex % of revenue – low maintenance requirement
3.7% 3.3% 4.0% 4.1%
1.0% 2.2% 3.4%
1.4%
FY17 FY18 FY19 FY20
Maintenance Expansionary
Cost of sales(1) SG&A(1) Total cost base(1)
Materials45%
Direct Labour
11%
Overheads6%
Variable cost – varies directly with revenues
Semi-variable cost – flexibility within a few months
Fixed cost (can still be subject to synergies)
62%of
revenues
Variable45%
Semi-variable
30%
Fixed8%
83%of
revenues
Note: Based on underlying FY19 figures.(1) Represent costs within underlying EBITDA.
30
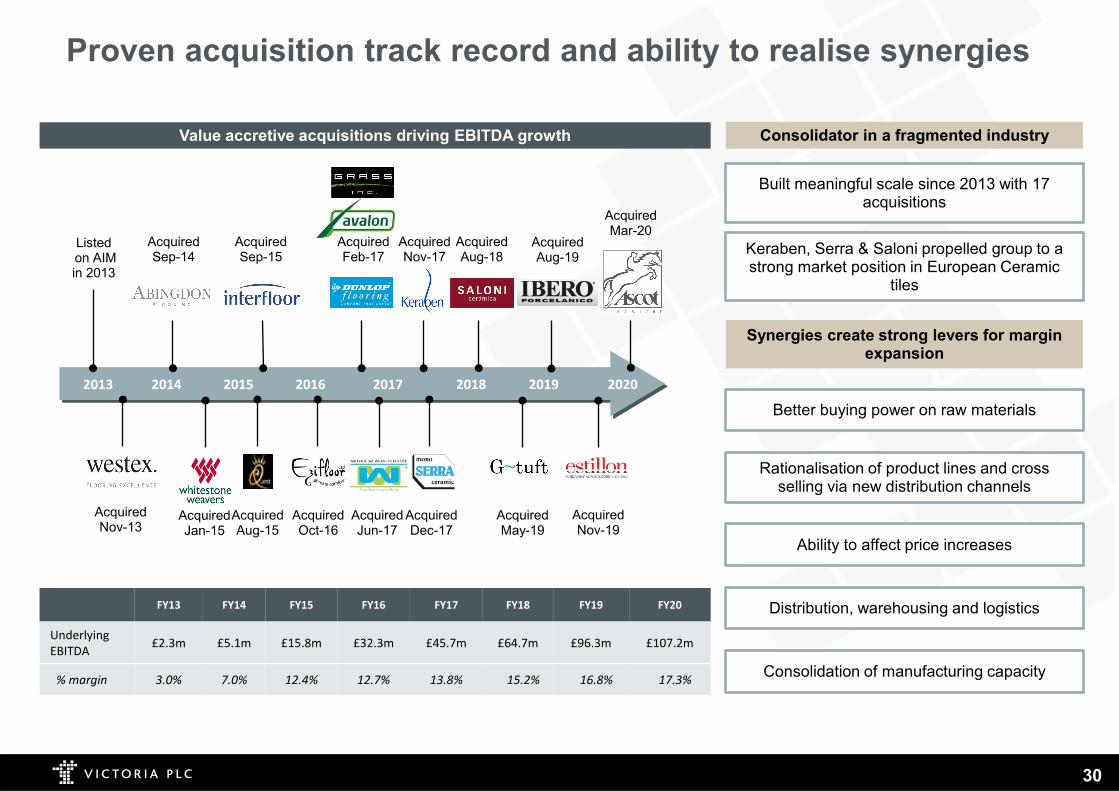
Proven acquisition track record and ability to realise synergies
FY13 FY14 FY15 FY16 FY17 FY18 FY19 FY20
Underlying EBITDA £2.3m £5.1m £15.8m £32.3m £45.7m £64.7m £96.3m £107.2m
% margin 3.0% 7.0% 12.4% 12.7% 13.8% 15.2% 16.8% 17.3%
Value accretive acquisitions driving EBITDA growth
Listedon AIM in 2013
AcquiredNov-13
AcquiredSep-14
AcquiredJan-15
AcquiredSep-15
AcquiredOct-16
AcquiredFeb-17
AcquiredNov-17
AcquiredJun-17
AcquiredDec-17
AcquiredAug-15
AcquiredAug-18
Built meaningful scale since 2013 with 17 acquisitions
Keraben, Serra & Saloni propelled group to a strong market position in European Ceramic
tiles
Better buying power on raw materials
Rationalisation of product lines and cross selling via new distribution channels
Ability to affect price increases
Distribution, warehousing and logistics
Consolidation of manufacturing capacity
Consolidator in a fragmented industry
Synergies create strong levers for margin expansion
AcquiredMay-19
AcquiredNov-19
AcquiredAug-19
AcquiredMar-20
2013 2014 2015 2016 2017 2018 2019 2020

31
Experienced management team with proven track record of sustainable value creation
Philippe HamersChief Executive
Retention of management
Geoffrey WildingExecutive Chairman
Wider Management Team
Michael ScottGroup Finance Director
Value Creation
All managers retained post acquisition earn-out period, excluding retirees
Almost all managers have meaningful amounts of their net worth invested in VCP
Of 17 acquisitions to date, 9 have completed earn-out and 5 did not have earn-outs
15 Managing Directors responsible for individual business units
Extensive industry experience
Actively incentivized in Victoria’s future with significant investment in shares, LTIP plans, and cross-unit Board membership / project
Experience, product knowledge, enthusiasm, skill second to none
Revenues (£m) 71
EBITDA margin (%) 7.2%
Market Cap (£m) 23
FY14
622
17.3%(1)
Adj. PF 2020
707(2)
Notes: (1) FY20 EBITDA margin based on underlying EBITDA, pre IFRS 16 and before movement in credit loss provision, from continuing operations.(2) As of 27 November 2020.

Appendix

33
H1 FY21 Income Statement
Continuing operations£m
H1 2021
H12020
H1 2021 margin
Revenue 305.5 312.3 Cost of sales (203.2) (197.8)
Gross profit 102.3 114.5 33.5%
Distribution and admin. expenses (75.6) (76.3)Other operating income 1.5 1.5
Underlying operating profit 28.2 39.7 9.2%
Underlying finance costs (14.5) (12.2)
Underlying PBT 13.7 27.5 4.5%
Amortisation of acquired intangibles (13.5) (12.1)Exceptional costs (3.9) (3.8)Non-underlying finance costs (2.7) (10.1)Translation difference on foreign currency loans 3.5 4.0
Reported PBT (2.9) 5.5

34
H1 FY21 Balance Sheet
£m 3 Oct 2020 28 Sep 2019 28 Mar 2020
Property, plant & equipment 208.8 202.5 211.8 Current assets 282.5 285.4 309.5 Current liabilities (178.7) (154.0) (210.1)Non-current liabilities (17.5) (24.1) (16.8)
Net tangible operating assets 295.1 301.7 294.4
Net cash and cash equivalents 129.6 82.1 174.7 Senior secured debt (at par) (453.0) (293.9) (448.4)Revolving credit facility - - (75.0)Term Loan - (143.2) -Bond issue premium - cash (6.6) - (7.5)Bond issue premium - non-cash (related to embedded redemption option) (6.1) - (6.8)Fair value adjustment to notes redemption premium 0.8 - -Unsecured loans (40.8) (15.7) (15.6)Obligations under right-of-use leases (78.9) (62.0) (79.8)Pre-paid finance costs 8.7 8.1 9.9
Net debt including right-of-use leases (446.3) (424.6) (448.5)
Goodwill and intangibles 433.0 466.6 439.9 Deferred tax liability (64.7) (59.2) (64.7)Right-of-use lease assets 73.4 63.8 78.5 Deferred and contingent earn-out liabilities (28.8) (32.7) (39.0)
Intangible assets and other items 412.9 438.5 414.7
Overall net assets 261.7 323.7 260.6

35
Disclaimer
NOT FOR RELEASE, PUBLICATION OR DISTRIBUTION, IN WHOLE OR IN PART, DIRECTLY OR INDIRECTLY, IN, INTO OR FROM THE UNITED STATES OF AMERICA, AUSTRALIA, CANADA, NEW ZEALAND,JAPAN, THE REPUBLIC OF SOUTH AFRICA OR THE REPUBLIC OF IRELAND OR ANY JURISDICTION WHERE SUCH DISTRIBUTION IS UNLAWFUL.
The following presentation, including any printed or electronic copy of these slides, information communicated during any delivery of the presentation and any question and answer session or any document or materialdistributed at or in connection with the presentation (together, the “Presentation”), has been prepared by Victoria plc (the “Company”). By attending (whether in person or by telephone) or reading the Presentation, youagree to the conditions set out below.
The Presentation is confidential and its distribution in certain jurisdictions is restricted by law. Therefore it must not be distributed, published or reproduced (in whole or in part) or disclosed by its recipients to any otherperson for any purpose.
The Presentation is provided for general information only and does not purport to contain all the information that may be required to evaluate the Company. The information in the Presentation is subject to updating,completion, revision and verification. The Presentation is not intended to, and does not, constitute or form part of any offer or invitation to sell or issue, or any solicitation of any offer to purchase or subscribe for, anyshares or other securities of the Company, nor shall it (or any part of it), or the fact of its distribution, form the basis of, or be relied on in connection with or act as any inducement to enter into, any contract whatsoeverrelating to any securities. Neither the Presentation nor any copy of it nor the information contained herein is being issued or may be distributed or redistributed directly or indirectly to or into any jurisdiction where suchdistribution would be unlawful, including but not limited to Australia, Canada, New Zealand, Japan, the Republic of South Africa, the Republic of Ireland or the United States of America, its territories or possessions.
The securities of the Company have not been, and will not be, registered under the United States Securities Act of 1933 (the "Securities Act") or with any securities regulatory authority of any state or jurisdiction of theUnited States and may not be taken up, offered, sold, resold, pledged, transferred, delivered or distributed, directly or indirectly, within, into or from the United States, or to, or for the account or benefit of, any person with aregistered address in, or who is a resident or ordinary resident in, or a citizen of the United States. Any securities will only be offered or sold outside the United States in "offshore transactions" within the meaning of and inreliance on the safe harbour from the registration requirements under the Securities Act provided by Regulation S promulgated thereunder.
The securities of the Company have not been, and will not be, registered under the securities laws of Australia, Canada, New Zealand, Japan, the Republic of South Africa, the Republic of Ireland or any state, province orterritory thereof and may not be taken up, offered, sold, resold, pledged, transferred, delivered or distributed, directly or indirectly, within, into or from Australia, Canada, New Zealand, Japan, the Republic of South Africa,the Republic of Ireland, or to, or for the account or benefit of, any person with a registered address in, or who is a resident or ordinary resident in, or a citizen of such jurisdictions or to any person in any country or territorywhere to do so would or might contravene applicable securities laws or regulations except pursuant to an applicable exemption.
In the European Economic Area (the “EEA”), the Presentation is being made, supplied and directed only to and at persons in member states of the EEA who are qualified investors within the meaning of Article 2 E of theProspectus Regulation (Regulation 2017/1129 as amended from time to time) (the “Prospectus Regulation”) and, additionally in the United Kingdom, to qualified investors who (i) fall within the definition of "investmentprofessionals" contained in article 19(5) of the Financial Services and Markets Act 2000 (Financial Promotion) Order 2005 (as amended) (the "Order"), (ii) are persons falling within article 49(2)(a) to (d) (high net worthcompanies, unincorporated associations, etc.) of the Order, or (iii) fall within another exemption to the Order (all such persons referred to in (i) to (iii) above together being referred to as "Relevant Persons"). Any personwho is not a Relevant Person must not act or rely on this communication or any of its contents. Any investment or investment activity to which this communication relates is available only to Relevant Persons and will beengaged in only with Relevant Persons.
To the extent permitted by law and regulation, no undertaking, representation or warranty or other assurance, express or implied, is made or given by or on behalf of the Company or any of its subsidiary undertakings orany of their respective directors, officers, partners, employees, agents, affiliates, representatives or advisers, or any other person, as to the accuracy, completeness or fairness of the information or opinions contained inthe Presentation.
Neither the Company nor its affiliates and advisers, agents and/or any other party undertakes or is under any duty to update the Presentation or to correct any inaccuracies in any such information which may becomeapparent or to provide you with any additional information. Save in the case of fraud, no responsibility or liability is accepted by any such person for any errors, omissions or inaccuracies in such information or opinions orfor any loss, cost or damage suffered or incurred, however arising, directly or indirectly, from any use of, as a result of the reliance on, or otherwise in connection with, the Presentation.
The contents of the Presentation have not been verified by the Company or its advisers. No liability is accepted by the Company or its advisers for any information or opinions contained in the Presentation.
The Presentation includes statements that are, or may be deemed to be, forward-looking statements. These forward-looking statements include certain statements, estimates, opinions and projections provided by theCompany in relation to strategies, plans, intentions, expectations, objectives and anticipated future performance of the Company and its subsidiaries. By their nature, such forward-looking statements, estimates, opinionsand projections involve risk and uncertainty since they are based on various assumptions made by the Company concerning anticipated results which may or may not prove to be correct and because they may relate toevents and depend on circumstances that may or may not occur in the future and may be beyond the Company’s ability to control or predict. No representations or warranties of any kind are made by any person that anyof the events expressed or implied in any such forward-looking statements, estimates, opinions or projections will actually occur. No person is under any obligation, or has any intention, to update or revise any suchforward-looking statements, estimates, opinions or projections following the date of the Presentation. No forward-looking statement in the Presentation is intended as a profit forecast or a profit estimate.