interim statement€¦ · group financial review 22 calculation of key figures 23 ... 2 financial...
TRANSCRIPT

INTERIM STATEMENT JANUARY – SEPTEMBER 2016
3 November 2016

INTERIM STATEMENT FOR JANUARY – SEPTEMBER 2016
2
CONTENTS Summary 3
Third quarter 2016 in brief 5
Business areas 6P&C insurance 6Associated company Nordea Bank AB 9Life insurance 11Holding 13
Other developments 14Mandatory offer for Topdanmark 14 Mandatum Life’s agency agreement with Danske Bank 14Personnel 15Remuneration 15Shares and share capital 15Shares in the joint book-entry account 17 Internal dividends 17Ratings 17Solvency 18Debt financing 19
Outlook 20Outlook for the rest of 2016 20The major risks and uncertainties to the Group in the near-term 20
Tables 22Group financial review 22Calculation of key figures 23 Group quarterly comprehensive income statement 25Statement of profit and other comprehensive income, IFRS 26Consolidated balance sheet, IFRS 27Statement of changes in equity, IFRS 28 Statement of cash flows, IFRS 29
Notes 30Accounting policies 30Comprehensive income statement by segment for nine months ended 30 September 2016 31Comprehensive income statement by segment for nine months ended 30 September 2015 32Consolidated balance sheet by segment at 30 September 2016 33Consolidated balance sheet by segment at 31 December 2015 34
Other notes 351 Net income from investments 352 Financial assets 383 Result analysis of P&C insurance business 404 Sampo plc’s income statement and balance sheet (FAS) 41

INTERIM STATEMENT FOR JANUARY – SEPTEMBER 2016
Summary
3
Sampo Group’s results for January – September 2016
Sampo Group’s profit before taxes for January – September 2016 amounted to EUR 1,343 million (1,475). The total comprehensive income for the period, taking changes in the market value of assets into account, rose to EUR 1,212 million (1,031).
• Earnings per share decreased to EUR 2.11 (2.31). Mark-to-market earnings per share rose to EUR 2.16 (1.84). The return on equity for the Group was 14.1 per cent (12.6) for January – September 2016. Net asset value per share on 30 September 2016 amounted to EUR 21.81 (23.79).
• Profit before taxes for the P&C insurance segment amounted to EUR 660 million (756). Combined ratio for January-September 2016 improved further to 84.0 per cent (84.6). Following a review of mortality tables by the Swedish insurance federation, EUR 72 million was released from the Swedish MTPL reserves in the first quarter of 2016. Excluding this release combined ratio was 86.3 per cent. Return on equity was 22.3 per cent (18.6). The contribution of Topdanmark’s net profit for January-September 2016 amounted to EUR 35 million (37).
• Sampo’s share of Nordea’s net profit for January - September 2016 amounted to EUR 546 million (577). Operating profit excluding non-recurring items increased 11 per cent during the third quarter compared to the third quarter of 2015. The return on equity improved 1.2 percentage points to 11.6 per cent. Nordea Group’s Basel III CET1 capital ratio increased to 17.9 per cent at the end of the third quarter of 2016. In segment reporting the share of Nordea’s profit is included in the segment ‘Holding’.
• Profit before taxes in life insurance operations amounted to EUR 157 million (132). Return on equity rose to 18.0 per cent (5.3). Premium income on own account decreased to EUR 669 million (838).
• As a result of the mandatory bid to the shareholders of Topdanmark A/S announced on 7 September 2016, Sampo plc acquired altogether 7,374,306 Topdanmark shares and held 41.1 per cent of all Topdanmark shares on 26 October 2016. Sampo intends to propose a change of distribution policy to the next Topdanmark AGM, whereby a dividend would be reinstated and the share buyback program discontinued. If approved, buybacks would end immediately after Topdanmark's 2017 AGM. For further information on the bid, see section Other Developments.
• Mandatum Life decided on 20 October 2016 not to prolong the agency agreement with Danske Bank as of 31 December 2016. According to the agreement Mandatum Life has the right to sell the insurance portfolio sold through Danske Bank's branch network in Finland, to Danske Bank. Mandatum Life decided on 27 October 2016 to use this option. For further information, see section Other Developments.
3 November 2016
INTERIM STATEMENT FOR JANUARY – SEPTEMBER 2016
4
Exchange rates used in reporting
1–9/2016 1–6/2016 1–3/2016 1–12/2015 1–9/2015
EUR 1 = SEK
Income statement (average) 9.3712 9.3023 9.3241 9.3534 9.3709
Balance sheet (at end of period) 9.6210 9.4242 9.2253 9.1895 9.4083
DKK 1 = SEK
Income statement (average) 1.2586 1.2486 1.2501 1.2542 1.2567
Balance sheet (at end of period) 1.2912 1.2668 1.2381 1.2314 1.2612
NOK 1 = SEK
Income statement (average) 0.9998 0.9875 0.9790 1.0475 1.0646
Balance sheet (at end of period) 1.0706 1.0133 0.9799 0.9570 0.9878
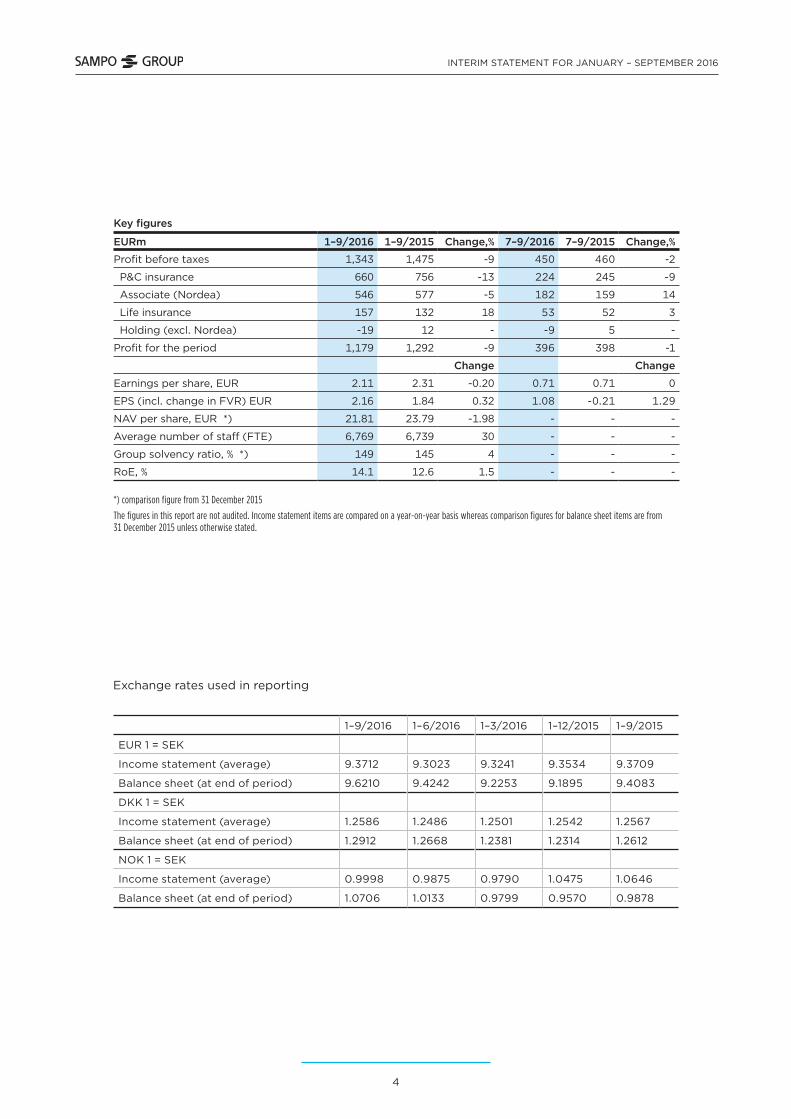
Key figures
EURm 1–9/2016 1–9/2015 Change,% 7–9/2016 7–9/2015 Change,%
Profit before taxes 1,343 1,475 -9 450 460 -2
P&C insurance 660 756 -13 224 245 -9
Associate (Nordea) 546 577 -5 182 159 14
Life insurance 157 132 18 53 52 3
Holding (excl. Nordea) -19 12 - -9 5 -
Profit for the period 1,179 1,292 -9 396 398 -1
Change Change
Earnings per share, EUR 2.11 2.31 -0.20 0.71 0.71 0
EPS (incl. change in FVR) EUR 2.16 1.84 0.32 1.08 -0.21 1.29
NAV per share, EUR *) 21.81 23.79 -1.98 - - -
Average number of staff (FTE) 6,769 6,739 30 - - -
Group solvency ratio, % *) 149 145 4 - - -
RoE, % 14.1 12.6 1.5 - - -
*) comparison figure from 31 December 2015
The figures in this report are not audited. Income statement items are compared on a year-on-year basis whereas comparison figures for balance sheet items are from 31 December 2015 unless otherwise stated.
INTERIM STATEMENT FOR JANUARY – SEPTEMBER 2016
Third quarter 2016 in brief
5
Sampo Group’s profit before taxes for the third quarter 2016 amounted to EUR 450 million (460). Earnings per share amounted to EUR 0.71 (0.71). Marked-to-market earnings per share increased to EUR 1.08 (-0.21).
Net asset value per share increased EUR 2.98 during the third quarter and was EUR 21.81. The increase is due to the positive development of Nordea’s share price and strong capital market development in general.
Combined ratio in P&C operations for the third quarter was 84.6 per cent (83.8). Profit before taxes decreased to EUR 224 million (245). Share of the profits of the associated company Topdanmark amounted to EUR 17 million (13).
Sampo’s share of Nordea’s third quarter 2016 net profit rose to EUR 182 million (159).
Profit before taxes for the life insurance operations was EUR 53 million (52). Premiums written grew 9 per cent to EUR 177 million from EUR 162 million at the corresponding period a year ago.
Third quarter 2016 in brief
INTERIM STATEMENT FOR JANUARY – SEPTEMBER 2016
Business areas
6
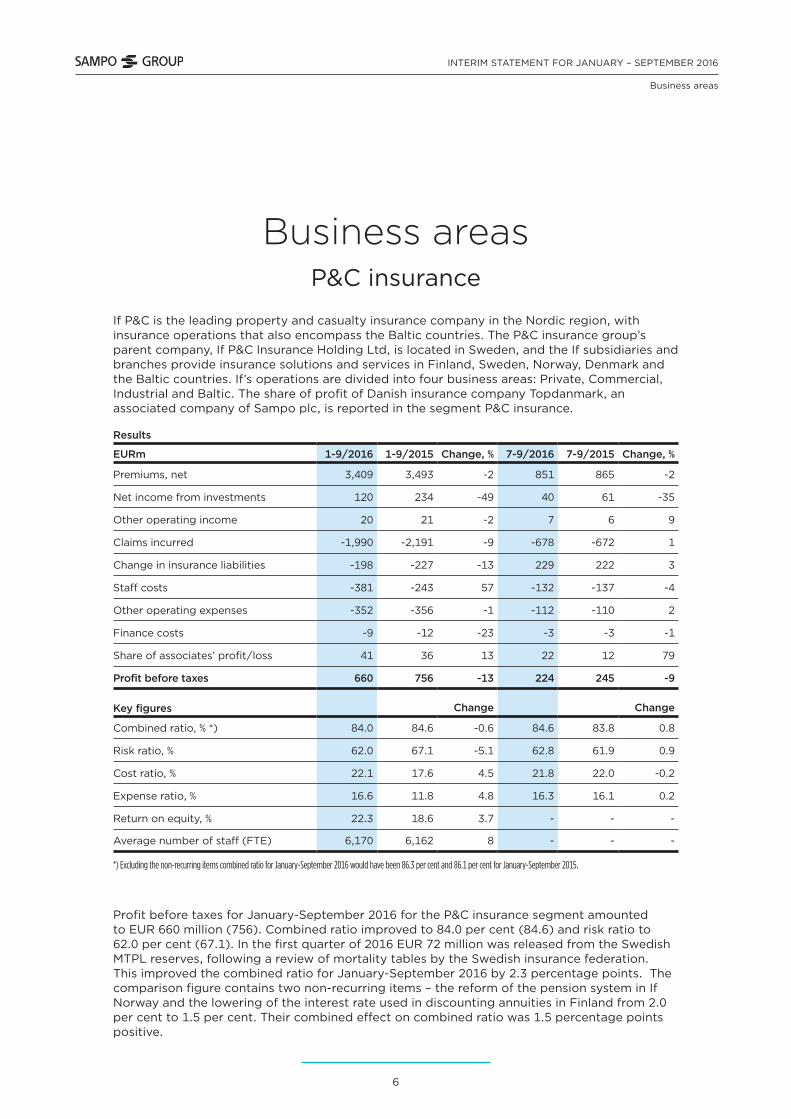
Business areas P&C insurance
If P&C is the leading property and casualty insurance company in the Nordic region, with insurance operations that also encompass the Baltic countries. The P&C insurance group’s parent company, If P&C Insurance Holding Ltd, is located in Sweden, and the If subsidiaries and branches provide insurance solutions and services in Finland, Sweden, Norway, Denmark and the Baltic countries. If’s operations are divided into four business areas: Private, Commercial, Industrial and Baltic. The share of profit of Danish insurance company Topdanmark, an associated company of Sampo plc, is reported in the segment P&C insurance.
Profit before taxes for January-September 2016 for the P&C insurance segment amounted to EUR 660 million (756). Combined ratio improved to 84.0 per cent (84.6) and risk ratio to 62.0 per cent (67.1). In the first quarter of 2016 EUR 72 million was released from the Swedish MTPL reserves, following a review of mortality tables by the Swedish insurance federation. This improved the combined ratio for January-September 2016 by 2.3 percentage points. The comparison figure contains two non-recurring items – the reform of the pension system in If Norway and the lowering of the interest rate used in discounting annuities in Finland from 2.0 per cent to 1.5 per cent. Their combined effect on combined ratio was 1.5 percentage points positive.
Results
EURm 1-9/2016 1-9/2015 Change, % 7-9/2016 7-9/2015 Change, %
Premiums, net 3,409 3,493 -2 851 865 -2
Net income from investments 120 234 -49 40 61 -35
Other operating income 20 21 -2 7 6 9
Claims incurred -1,990 -2,191 -9 -678 -672 1
Change in insurance liabilities -198 -227 -13 229 222 3
Staff costs -381 -243 57 -132 -137 -4
Other operating expenses -352 -356 -1 -112 -110 2
Finance costs -9 -12 -23 -3 -3 -1
Share of associates’ profit/loss 41 36 13 22 12 79
Profit before taxes 660 756 -13 224 245 -9
Key figures Change Change
Combined ratio, % *) 84.0 84.6 -0.6 84.6 83.8 0.8
Risk ratio, % 62.0 67.1 -5.1 62.8 61.9 0.9
Cost ratio, % 22.1 17.6 4.5 21.8 22.0 -0.2
Expense ratio, % 16.6 11.8 4.8 16.3 16.1 0.2
Return on equity, % 22.3 18.6 3.7 - - -
Average number of staff (FTE) 6,170 6,162 8 - - -
*) Excluding the non-recurring items combined ratio for January-September 2016 would have been 86.3 per cent and 86.1 per cent for January-September 2015.

INTERIM STATEMENT FOR JANUARY – SEPTEMBER 2016
Business areas
7
Combined ratio,% Risk ratio,%
1-9/2016 1-9/2015 Change 1-9/2016 1-9/2015 Change
Private 82.8 88.9 -6.1 60.8 66.5 -5.7
Commercial 86.0 90.4 -4.4 63.4 67.5 -4.1
Industrial 87.6 94.5 -6.9 65.5 73.3 -7.8
Baltic 90.3 85.1 5.2 61.8 55.6 6.2
Sweden 80.0 85.0 -5.0 59.5 63.3 -3.8
Norway 86.4 87.6 -1.2 63.7 65.0 -1.3
Finland 83.4 99.6 -16.2 61.4 77.9 -16.5
Denmark 94.3 90.6 3.7 67.4 64.0 3.4
Combined ratio,% Risk ratio,%
7-9/2016 7-9/2015 Change 7-9/2016 7-9/2015 Change
Private 85.8 86.7 -0.9 64.2 64.9 -0.7
Commercial 82.6 82.4 0.2 60.0 59.7 0.3
Industrial 84.1 72.0 12.1 62.4 51.4 11.0
Baltic 89.8 86.0 3.8 61.6 58.0 3.6
Sweden 87.1 80.8 6.3 66.3 59.7 6.6
Norway 82.9 82.2 0.7 60.5 60.4 0.1
Finland 80.3 89.8 -9.5 59.3 67.8 -8.5
Denmark 93.4 86.6 6.8 66.9 61.0 5.9
The release from the Swedish MTPL reserves in the first quarter of 2016 affected the January-September 2016 result positively. The comparison figures for the Finnish business are burdened by the change in the Finnish discount rate in the second quarter of 2015. Large claims in BA Industrial were EUR 22 million better than expected in January-September 2016 and the total large claims for If P&C ended up EUR 30 million better than expected for the period.
Swedish discount rate used to discount the annuity reserves decreased to -0.31 per cent by the end of September 2016 and had a negative effect of EUR 49 million in January-September
EUR 100 million, including the Swedish MTPL release, was released from technical reserves relating to prior year claims in January – September 2016. In the same period in 2015 the reserves were strengthened by EUR 83 million mainly explained by the lowering of the interest rate used in discounting annuities in Finland. Return on equity (RoE) rose to 22.3 per cent (18.6) and the fair value reserve at the end of September 2016 was EUR 482 million (391). The contribution of Topdanmark’s net profit in January-September 2016 amounted to EUR 35 million (37).
Technical result amounted to EUR 514 million (522). Insurance margin (technical result in relation to net premiums earned) was 16.1 per cent (16.0).

INTERIM STATEMENT FOR JANUARY – SEPTEMBER 2016
Business areas
8
results. The negative effect on third quarter results amounted to EUR 10 million. The discount rate was 0.41 per cent at the end of 2015. In Finland the discount rate for annuities was unchanged at 1.5 per cent.
Gross written premiums amounted to EUR 3,565 million (3,659) in January-September 2016. Adjusted for currency, premium growth was -0.4 per cent. Growth was positive in business area Private, and negative in business areas Commercial, Industrial and Baltic. Operations in Sweden and Denmark showed growth but in Finland and Norway premiums decreased.
Cost ratio amounted to 22.1 per cent (17.6) while expense ratio was 16.6 per cent (11.8). The comparison figures are positively impacted, 4.7 percentage points, by the non-recurring reform of the pension system in If Norway. Excluding the non-recurring items the cost ratio for January-September 2016 was 0.2 per cent lower than in the corresponding period a year ago.
At the end of September 2016, the total investment assets of If P&C amounted to EUR 12.3 billion (11.4), of which fixed income investments constituted 76 per cent (74), money market 11 per cent (12) and equity 12 per cent (13). Net income from investments decreased to EUR 120 million (234). Investment return marked-to-market for January-September 2016 amounted to 2.4 per cent (0.9). Duration for interest bearing assets was 1.4 years (1.2) and average maturity 2.8 years (2.6). Fixed income running yield as at 30 September 2016 was 1.6 per cent (1.8).
If P&C’s solvency position is described in the section Solvency.
INTERIM STATEMENT FOR JANUARY – SEPTEMBER 2016
Business areas
9
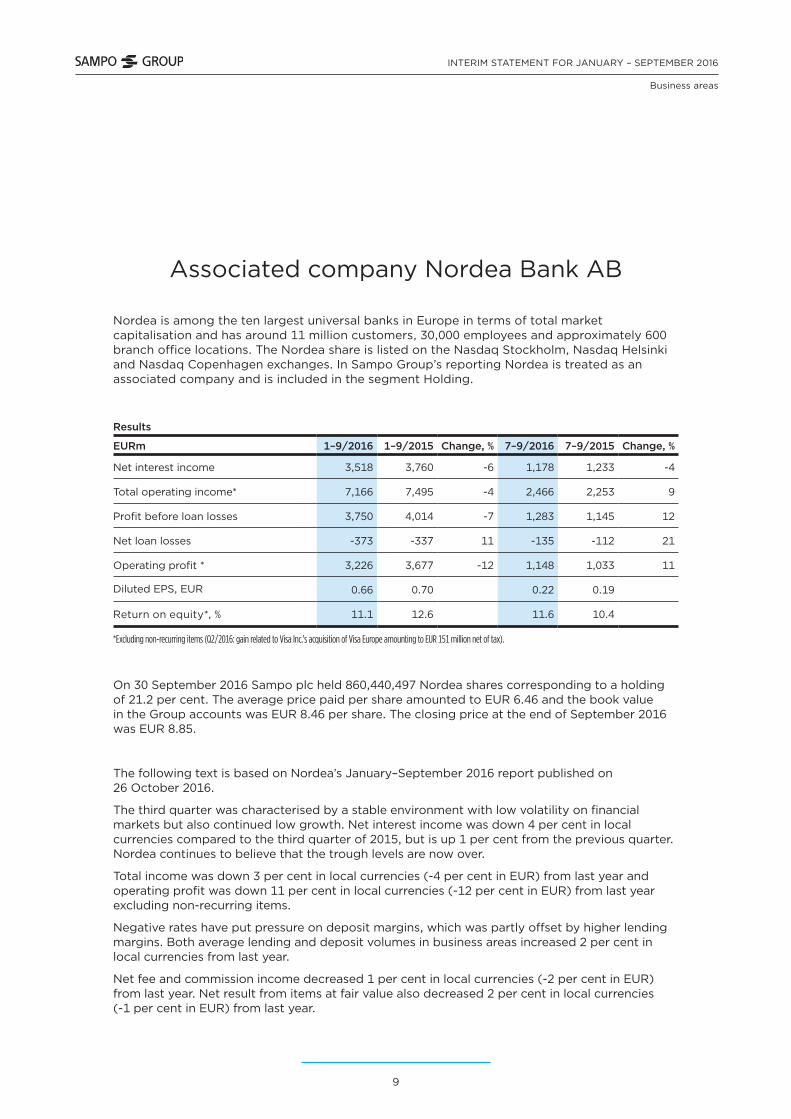
Nordea is among the ten largest universal banks in Europe in terms of total market capitalisation and has around 11 million customers, 30,000 employees and approximately 600 branch office locations. The Nordea share is listed on the Nasdaq Stockholm, Nasdaq Helsinki and Nasdaq Copenhagen exchanges. In Sampo Group’s reporting Nordea is treated as an associated company and is included in the segment Holding.
On 30 September 2016 Sampo plc held 860,440,497 Nordea shares corresponding to a holding of 21.2 per cent. The average price paid per share amounted to EUR 6.46 and the book value in the Group accounts was EUR 8.46 per share. The closing price at the end of September 2016 was EUR 8.85.
The following text is based on Nordea’s January–September 2016 report published on 26 October 2016.
The third quarter was characterised by a stable environment with low volatility on financial markets but also continued low growth. Net interest income was down 4 per cent in local currencies compared to the third quarter of 2015, but is up 1 per cent from the previous quarter. Nordea continues to believe that the trough levels are now over.
Total income was down 3 per cent in local currencies (-4 per cent in EUR) from last year and operating profit was down 11 per cent in local currencies (-12 per cent in EUR) from last year excluding non-recurring items.
Negative rates have put pressure on deposit margins, which was partly offset by higher lending margins. Both average lending and deposit volumes in business areas increased 2 per cent in local currencies from last year.
Net fee and commission income decreased 1 per cent in local currencies (-2 per cent in EUR) from last year. Net result from items at fair value also decreased 2 per cent in local currencies (-1 per cent in EUR) from last year.
Results
EURm 1–9/2016 1–9/2015 Change, % 7–9/2016 7–9/2015 Change, %
Net interest income 3,518 3,760 -6 1,178 1,233 -4
Total operating income* 7,166 7,495 -4 2,466 2,253 9
Profit before loan losses 3,750 4,014 -7 1,283 1,145 12
Net loan losses -373 -337 11 -135 -112 21
Operating profit * 3,226 3,677 -12 1,148 1,033 11
Diluted EPS, EUR 0.66 0.70 0.22 0.19
Return on equity*, % 11.1 12.6 11.6 10.4
Liiketoiminta-alueet Associated company Nordea Bank AB
*Excluding non-recurring items (Q2/2016: gain related to Visa Inc.’s acquisition of Visa Europe amounting to EUR 151 million net of tax).

INTERIM STATEMENT FOR JANUARY – SEPTEMBER 2016
Business areas
10
Costs are following the plan. Cost to income ratio excluding non-recurring items improved 1 percentage point from the last year to 48.1 per cent. Total expenses were up 4 per cent in local currencies (2 per cent in EUR) from the previous year and amounted to EUR 3,567 million.
Net profit decreased 4 per cent in local currencies (5 per cent in EUR) to EUR 2,666 million.
Nordea’s credit quality remains solid with a loan loss level at the 10-year average. Net loan loss provisions increased to EUR 373 million, corresponding to a loan loss ratio of 15 bps (13 bps for the first nine months of 2015).
Currency fluctuations had a reducing effect of 1 percentage point on income and expenses and no effect on loan and deposit volumes compared to a year ago.
Nordea Group’s Basel III Common equity tier 1 (CET1) capital ratio was in line with Nordea’s capital policy. CET 1 ratio increased to 17.9 per cent at the end of the third quarter of 2016 from 16.8 per cent at the end of the second quarter of 2016. The increase to the CET1 capital ratio was due to a decrease in REA (risk exposure amount) of EUR 6.7 billion mainly driven by the new securitisation transaction, market risk and an increase in Common equity tier 1 capital of EUR 0.4 billion mainly driven by a dividend pay-out from NLP and profit generation.
Further information on Nordea Bank AB and its January–September 2016 result is available at www.nordea.com.

INTERIM STATEMENT FOR JANUARY – SEPTEMBER 2016
Business areas
11
Profit before taxes for life insurance operations in January-September 2016 amounted to EUR 157 million (132). The total comprehensive income for the period after tax reflecting the changes in market values of assets increased strongly to EUR 193 million from EUR 50 million in the corresponding period a year earlier. Return on equity (RoE) improved to 18.0 per cent (5.3).
Net investment income, excluding income on unit-linked contracts, amounted to EUR 224 million (316). Net income from unit-linked contracts was EUR 135 million (23). In January-September 2016 fair value reserve increased to EUR 598 million (532).
Total technical reserves of Mandatum Life Group were EUR 10.9 billion (10.9). The unit-linked reserves exceeded EUR 6 billion and amounted to EUR 6.1 billion (5.9) at the end of September 2016, which corresponds to 56 per cent (54) of total technical reserves. With profit reserves decreased to EUR 4.8 billion (5.0) in January-September 2016. Reserves related to the higher guarantees of 4.5 and 3.5 per cent decreased EUR 165 million to EUR 2.9 billion in the same period.
Mandatum Life Group comprises Mandatum Life Insurance Co. Ltd., a wholly-owned subsidiary of Sampo plc, operating in Finland, and its five subsidiaries. Parent company, Mandatum Life, is responsible for sales functions and all the functions required by the Insurance Companies Act. The subsidiaries are Mandatum Life Services Ltd, Mandatum Life Investment Services Ltd., Mandatum Life Fund Management S.A., Innova Services Ltd. and Mandatum Life Insurance Baltic SE.
Results
EURm 1–9/2016 1–9/2015 Change, % 7–9/2016 7–9/2015 Change, %
Premiums written 669 838 -20 177 162 9
Net income from investments 361 340 6 279 -260 -
Other operating income 11 11 1 4 2 84
Claims incurred -775 -777 0 -214 -189 13
Change in liabilities for inv. and ins. contracts -18 -185 -90 -164 363 -
Staff costs -34 -35 -2 -12 -11 8
Other operating expenses -51 -54 -4 -16 -14 13
Finance costs -5 -5 1 -2 -2 10
Profit before taxes 157 132 18 53 52 3
Key figures Change Change
Expense ratio, % 103.6 99.4 4.2 - - -
Return on equity, % 18.0 5.3 12.7 - - -
Average number of staff (FTE) 543 521 22 - - -
Liiketoiminta-alueet Life insurance
INTERIM STATEMENT FOR JANUARY – SEPTEMBER 2016
Business areas
12
Mandatum Life has all in all supplemented its technical reserves with a total of EUR 223 million (244) due to low level of interest rates. The figure does not take into account the reserves relating to the segregated fund. The discount rates used for 2016, 2017 and 2018 are 0.5 per cent, 0.75 per cent, and 1.50 per cent, respectively. Discount rate applied to the segregated fund is 0.75 per cent.
On 30 September 2016 Mandatum Life Group’s investment assets, excluding the assets of EUR 6.1 billion (5.9) covering unit-linked liabilities, amounted to EUR 6.6 billion (6.7) at market values.
The assets covering Mandatum Life’s original with profit liabilities on 30 September 2016 amounted to EUR 5.4 billion (5.5) at market values. 43 per cent (47) of the assets are in fixed income instruments, 11 per cent (7) in money market, 31 per cent (29) in equities and 15 per cent (16) in alternative investments. The investment return marked-to-market for January - September 2016 was 5.1 per cent (3.7). The duration of fixed income assets at the end of September 2016 was 2.1 years (2.1) and average maturity 2.5 years (2.8). Fixed income (incl. money market) running yield was 3.1 per cent (3.2).
The assets covering the segregated fund amounted to EUR 1.2 billion (1.2), of which 74 per cent (71) was in fixed income, 7 per cent (9) in money market, 12 per cent (12) in equities and 7 per cent (8) in alternative investments. Segregated fund’s investment return marked-to-market for January – September 2016 was 3.6 per cent (2.3). At the end of September 2016 the duration of fixed income assets was 2.6 years (2.3) and average maturity 3.8 years (3.8). Fixed income (incl. money market) running yield was 1.9 per cent (0.9).
Mandatum Life’s solvency position is described in the section Solvency.
Expense result for life insurance segment decreased to EUR 15 million (20) and risk result amounted to EUR 15 million (15).
Mandatum Life Group’s premium income on own account decreased to EUR 669 million (838) in January - September 2016. However, in the third quarter of 2016 premiums grew by 9 per cent to EUR 177 million. Mandatum Life’s market share in Finland amounted to 20.4 per cent (17.3).
INTERIM STATEMENT FOR JANUARY – SEPTEMBER 2016
Business areas
13
Sampo plc owns and controls its subsidiaries engaged in P&C and life insurance. In addition Sampo plc held on 30 September 2016 approximately 21.2 per cent of the share capital of Nordea, the largest bank in the Nordic countries. Sampo plc also owned 41.1 per cent of Danish insurance company Topdanmark on 26 October 2016. Nordea and Topdanmark are associated companies to Sampo plc. Sampo plc’s share of Topdanmark’s profit continues to be reported in the P&C insurance segment.
Holding segment’s profit before taxes for January – September 2016 amounted to EUR 527 million (589), of which EUR 546 million (577) relates to Sampo’s share of Nordea’s January - September 2016 profit. Segment’s profit excluding Nordea was EUR -19 million (-12).
Investment income ended up EUR 2 million (60) negative because of realized equity losses in the third quarter amounting to EUR 8 million. Finance costs continued to decrease because of low interest rates and the weakness of Swedish krone.
Sampo plc’s holding in Nordea Bank was booked in the consolidated balance sheet at EUR 7.3 billion. The market value of the holding was EUR 7.6 billion, i.e. EUR 8.85 per share, at 30 September 2016. In addition the assets on Sampo plc’s balance sheet included holdings in subsidiaries for EUR 2.4 billion (2.4).
Results
EURm 1–9/2016 1–9/2015 Change, % 7–9/2016 7–9/2015 Change, %
Net investment income -2 60 - -5 8 -
Other operating income 12 12 -2 4 4 2
Staff costs -10 -14 -29 -4 -4 -1
Other operating expenses -10 -9 17 -3 -2 70
Finance costs -9 -38 -76 -1 -1 -41
Share of associates’ profit 546 577 -5 182 159 14
Profit before taxes 527 589 -11 173 164 6
Key figures Change Change
Average number of staff (FTE) 56 56 0 - - -
Liiketoiminta-alueet Holding

INTERIM STATEMENT FOR JANUARY – SEPTEMBER 2016
Other developments
14
Other developments
Mandatory offer for Topdanmark Sampo plc announced on 7 September 2016 the obligation to make a mandatory offer to the shareholders of Topdanmark A/S. In the mandatory offer, Sampo offered to acquire all outstanding shares, excluding treasury shares, and other financial instruments, warrants and share options, if applicable, issued by Topdanmark and shares held by Topdanmark shareholders resident in certain restricted jurisdictions. The cash price offered in the mandatory offer was DKK 183 for each share issued by Topdanmark. The offer period commenced on 27 September 2016 and expired on 25 October 2016. As a result of the offer, Sampo plc acquired altogether 7,374,306 Topdanmark shares and held on 26 October 2016 41.1 per cent of all Topdanmark shares.
The mandatory offer was made pursuant to the Danish Takeover Order (no. 562 of 2 June 2014) Section 2(1). The obligation to make the Mandatory Offer arose as a result of Sampo in the period from 6 September 2016 until 7 September having acquired 200,000 Topdanmark shares in the market with the highest purchase price being DKK 183 and thereby crossing the applicable Danish threshold of one third of the total outstanding voting rights of Topdanmark. In connection herewith, Sampo also acquired 31,476,920 Topdanmark shares at a price of DKK 183 per share, representing approximately 33.13 per cent of the entire issued share capital and of all voting rights of Topdanmark (including treasury shares), from its wholly owned subsidiary If P&C Insurance Holding Ltd. Following Sampo's acquisition of If's shareholding in Topdanmark, If no longer holds any shares in Topdanmark.
If P&C booked a sales gain of approx. EUR 450 million in this transaction but as Sampo plc’s share of Topdanmark’s profit will continue to be shown in the P&C insurance segment, this effectively means that the sales gain is eliminated in the segment and not at all visible in Sampo Group reported numbers.
Mandatum Life’s agency agreement with Danske Bank
In connection with the acquisition of Sampo’s banking operations by Danske Bank A/S in early 2007, Sampo Bank plc (now Danske Bank Plc), and Sampo Life Insurance Company Ltd (now Mandatum Life Insurance Company Ltd) signed an agency agreement that guaranteed Sampo Life the exclusive right to sell life and pension insurance products through Sampo Bank’s branch network in Finland.
Mandatum Life decided 20 October 2016 not to prolong the agency agreement as of 31 December 2016. In relation to the agency agreement Mandatum Life has the right to sell the insurance portfolio sold through Danske Bank's branch network in Finland, to Danske Bank. Mandatum Life decided on 27 October 2016 to use this option.
The valuation of the portfolio will be conducted by a third party in accordance with the terms and conditions of the bank transaction agreement referred to above. The valuation is estimated to take until the summer of 2017 and the transfer of the portfolio is estimated to take place during the fourth quarter of 2017. The transfer is subject to regulatory approvals.
The portfolio consists of 151,000 policies and the technical reserves related to the portfolio amounted to EUR 3,060 million at the end of 2015. The portfolio accrued premiums of EUR 453
INTERIM STATEMENT FOR JANUARY – SEPTEMBER 2016
Other developments
15
million in 2015 and contains almost exclusively unit linked and loan insurance products. The amount of with profit technical reserves is EUR 212 million.
Personnel The number of full-time equivalent staff in Sampo Group on 30 September 2016 was 6,837 employees compared to 6,782 employees at the end of 2015. The number of staff increased slightly in both P&C and life insurance.
During January-September 2016 approximately 91 per cent of the staff worked in P&C insurance, 8 per cent in life insurance and 1 per cent in the Group’s parent company Sampo plc. Geographically, 32 per cent worked in Finland, 28 per cent in Sweden, 20 per cent in Norway and 21 per cent in the Baltic and other countries.
The average number of employees during January-September 2016 was 6,769. A year earlier the corresponding figure was 6,739.
Remuneration In January-September 2016 payments of EUR 37 million (34), including social costs, were made on the basis of the long-term incentive schemes. The result impact of the long-term incentive schemes in force in January-September 2016 was EUR 8 million (25). At the end of September 2016 Sampo Group had provisioned EUR 15 million (35) for future payments of long-term incentive schemes. EUR 37 million (31), including social costs, was paid as short-term incentives during the same period.
The terms of the long-term incentive schemes are available at www.sampo.com/incentiveterms.
Shares and share capitalAs at 30 September 2016, Sampo plc had 560,000,000 shares, which were divided into 558,800,000 A shares and 1,200,000 B shares. Total number of votes attached to the shares is 564,800,000. Each A share entitles the holder to one vote and each B share entitles the holder to five votes at the General Meeting of Shareholders.
The Annual General Meeting held on 21 April 2016 authorized the Board to repurchase a maximum of 50,000,000 Sampo A shares. At the end of September 2016, neither Sampo plc nor its Group companies held any Sampo A shares.
During the first nine months of 2016 Sampo plc received altogether 25 notifications of change in holding pursuant to Chapter 9, Section 5 of the Securities Markets Act, of which 23 related to the total number of Sampo A shares or related voting rights owned by BlackRock, Inc. (tax ID 32-0174421) and its funds directly or through financial instruments.
The notified changes are illustrated in the table below.

INTERIM STATEMENT FOR JANUARY – SEPTEMBER 2016
Other developments
16
In addition Sampo plc has received in January-September 2016 two notifications regarding the total number of Sampo A shares and related voting rights owned by Capital Income Builder (CIB), a 100 per cent owned subsidiary of the Capital Group Companies, Inc., directly or through financial instruments.
The details of the notifications are available at www.sampo.com/share/flagging-notifications.
Notifications by BlackRock, Inc. in 2016
% of shares and voting rights
% of shares and voting rights through financial instruments Total
Date of the change Shares Voting rights Shares Voting rights Shares Voting rights
25 Jan 2016 5.02% <5% 0.03% <5% 5.04% <5%
26 Jan 2016 - - - - <5% <5%
29 Jan 2016 5.00% <5% 0.02% <5% 5.02% <5%
1 Feb 2016 - - - - <5% <5%
3 Feb 2016 5.01% <5% 0.02% <5% 5.03% <5%
4 Feb 2016 - - - - <5% <5%
4 Apr 2016 4.96% <5% 0.05% <5% 5.01% <5%
5 Apr 2016 5.01% 4.97% 0.03% 0.03% 5.05% 5.00%
6 Apr 2016 5.08% 5.04% 0.01% 0.01% 5.09% 5.05%
22 Apr 2016 4.94% 4.90% 0.24% 0.24% 5.19% 5.14%
25 Apr 2016 5.01% 4.97% 0.17% 0.16% 5.18% 5.14%
26 Apr 2016 5.24% 5.19% 0.14% 0.14% 5.38% 5.33%
8 Jul 2016 5.04% 4.995% 0.06% 0.06% 5.10% 5.05%
12 Jul 2016 4.98% 4.94% 0.11% 0.11% 5.09% 5.05%
22 Jul 2016 5.02% 4.98% 0.04% 0.04% 5.06% 5.02%
25 Jul 2016 4.96% 4.92% 0.04% 0.04% 5.00% 4.96%
26 Jul 2016 5.05% 5.00% 0.04% 0.04% 5.09% 5.04%
28 Jul 2016 5.01% 4.97% 0.04% 0.04% 5.05% 5.01%
8 Aug 2016 5.07% 5.03% 0.04% 0.04% 5.11% 5.06%
10 Aug 2016 5.02% 4.98% 0.05% 0.05% 5.06% 5.02%
17 Aug 2016 4.96% 4.92% 0.12% 0.12% 5.08% 5.04%
30 Aug 2016 4.88% 4.84% 0.14% 0.14% 5.03% 4.99%
31 Aug 2016 <5% <5% <5% <5% <5% <5%
INTERIM STATEMENT FOR JANUARY – SEPTEMBER 2016
Other developments
17
Shares in the joint book-entry accountWhen Sampo plc’s shares were incorporated to the book-entry system in 1997 shareholders were obliged to provide the share certificates and request registration of the shares into their book-entry accounts during the registration period set in the General Meeting’s resolution to incorporate the shares into the book-entry system. A joint book-entry account in the name of the Company was opened for those shareholders who did not request the registration of their shares.
According to the Finnish Companies Act the Annual General Meeting may after September 2016 resolve that the shares in the joint book-entry account and the rights that those shares carry have been forfeited. After the General Meeting’s resolution the provisions on treasury shares apply to forfeited shares and the Board may, for example, resolve on cancellation of treasury shares.
As this will be the first time the Annual General Meeting has an option to resolve the issue, the Audit Committee has initiated a project to look into the procedure and consequences of such a resolution by the Annual General Meeting with a particular view on the equal treatment of all shareholders.
Internal dividendsMandatum Life paid a dividend of EUR 125 million to Sampo plc in March 2016. On 17 March 2016 Nordea Bank AB’s Annual General Meeting decided to pay a dividend of EUR 0.64 per share. With its current holding Sampo plc’s share amounted to EUR 551 million. The dividend was paid on 30 March 2016.
If P&C normally pays its dividend towards the end of the calendar year. If P&C made a sales gain in connection to the mandatory offer on Topdanmark shares and paid an extra SEK 2.8 billion (EUR 293 million) dividend to Sampo plc on 22 September 2016. In December 2016 If P&C plans to pay a normal dividend of SEK 5.8 billion to Sampo plc.
Ratings All the ratings for Sampo Group companies remained unchanged in the third quarter of 2016. The table below illustrates all the ratings of Sampo Group companies at the end of September 2016.
Rated company Moody’s Standard & Poor’s
Rating Outlook Rating Outlook
Sampo plc Baa2 Positive A- Stable
If P&C Insurance Ltd (Sweden) A2 Positive A+ Stable
If P&C Insurance Company Ltd (Finland) A2 Positive A+ Stable

INTERIM STATEMENT FOR JANUARY – SEPTEMBER 2016
Other developments
18
Solvency As of 1 January 2016 insurance subgroups If P&C and Mandatum Life apply Solvency II rules in their regulatory solvency calculations. Both subgroups use a standard model in calculating their solvency requirements and eligible own funds.
On 30 September 2016 If P&C Group’s Solvency II capital requirement under standard model amounted to EUR 1,940 million (2,073) and own funds to EUR 3,818 million (3,202). Solvency ratio was 197 per cent (154). S&P rating total capital charge for If P&C Group was EUR 2,961 million (3,058) at the end of September 2016 while the capital base amounted to EUR 3,714 million (3,455).
Mandatum Life’s solvency ratio after transitional measures remained strong at 153 per cent (158). Own funds of EUR 1,743 million (1,913) exceed Solvency Capital Requirement (SCR) of EUR 1,141 million (1,212) by EUR 602 million. Without transitional measures, own funds would have amounted to EUR 1,283 and the solvency capital requirement EUR 1,334 million leading to a solvency ratio of 96 per cent.
Sampo Group is regarded as a financial and insurance conglomerate according to the Act on the Supervision of Financial and Insurance Conglomerates (2004/699). The Act is based on Directive 2002/87/EC of the European Parliament and of the Council on the supplementary supervision of credit institutions, insurance undertakings and investment. The Act was amended as of 1 January 2016 to correspond to Solvency II and Basel III rules.
The starting point for the Group’s solvency capital is the consolidated Group equity. The sectoral items are added to it and the intangibles and other deductibles are subtracted from it.
Sampo Group solvency
EURm 30 Sep 2016 31 Dec 2015
Group capital 11,445 11,411
Goodwill, other intangibles and deductibles -2,752 -3,371
Sectoral items 1,741 2,254
Group's own funds, total 10,433 10,294
Minimum requirements for own funds, total 6,999 7,114
Group solvency 3,434 3,179
Group solvency ratio (Own funds % of minimum requirements) 149 145
Group’s conglomerate solvency ratio (own funds in relation to minimum requirements for own funds) using Solvency II rules for the insurance subsidiaries was 149 per cent (145) as at 30 September 2016.
More information on Sampo Group’s capital policy is available at the Risk Management section of the Annual Report 2015.

INTERIM STATEMENT FOR JANUARY – SEPTEMBER 2016
Other developments
19
Debt financing Sampo plc’s debt financing on 30 September 2016 amounted to EUR 2,845 million (2,302) and interest bearing assets to EUR 992 million (1,343). Interest bearing assets include bank accounts, fixed income instruments and EUR 623 million (579) of hybrid capital and subordinated debt instruments issued by the subsidiaries and associated companies. At the end of the third quarter of 2016 the net debt amounted to EUR 1,853 million (959). The net debt calculation only takes into account interest bearing assets and liabilities. Gross debt to Sampo plc’s equity was 41 per cent (32) and financial leverage 29 per cent (24).
In connection to the mandatory bid on Topdanmark, Sampo plc increased the amount of commercial papers issued from EUR 338 million at the end of the second quarter 2016 to EUR 702 million on 30 September 2016.
On 30 September 2016 financial liabilities in Sampo plc’s balance sheet consisted of issued senior bonds and notes of EUR 2,142 million (1,997) and EUR 702 million (305) of CPs issued. The average interest, net of interest rate swaps, on Sampo plc’s debt as of 30 September 2016 was 1.17 per cent (1.65).
More information on Sampo Group’s outstanding debt issues is available at www.sampo.com/debtfinancing.

INTERIM STATEMENT FOR JANUARY – SEPTEMBER 2016
Outlook
20
Outlook
Outlook for the rest of 2016 Sampo Group’s business areas are expected to report good operating results for 2016.
However, the mark-to-market results are, particularly in life insurance, highly dependent on capital market developments. The continuing low interest rate level also creates a challenging environment for reinvestment in fixed income instruments.
The P&C insurance operations are expected to reach a combined ratio of 86–88 per cent excluding the release from the Swedish MTPL reserves.
Nordea’s contribution to the Group’s profit is expected to be significant.
The major risks and uncertainties to the Group in the near-term
In its day-to-day business activities Sampo Group is exposed to various risks and uncertainties mainly through its separately managed major business units. Parent company Sampo plc’s contribution to risks is a minor one.
Major risks affecting the Group companies’ profitability and its variation are market, credit, insurance and operational risks that are quantified independently by the major business units. At the Group level sources of risks are same, but they are not additive because of diversification effects.
Uncertainties in the form of major unforeseen events may have an immediate impact on the Group’s profitability. Identification of unforeseen events is easier than estimation of their probabilities, timing and potential outcomes. Currently there are a number of widely identified macro-economic, political and other sources of uncertainty which can in various ways affect financial services industry negatively.
Other sources of uncertainty are unforeseen structural changes in the business environment and already identified trends and potential wide-impact events. These external drivers may also have a long-term impact on how the business shall be conducted.
SAMPO PLC Board of Directors
INTERIM STATEMENT FOR JANUARY – SEPTEMBER 2016
Information
21
Distribution: Nasdaq Helsinki London Stock Exchange The principal media Financial Supervisory Authority www.sampo.com
For more information, please contact:Peter Johansson, Group CFO, tel. +358 10 516 0010
Jarmo Salonen, Head of Investor Relations and Group Communications, tel. +358 10 516 0030
Essi Nikitin, IR Manager, tel. +358 10 516 0066
Maria Silander, Communications Manager, tel. +358 10 516 0031
Conference callAn English-language conference call for investors and analysts will be arranged at 4 pm Finnish time (2 pm UK time). Please call tel. +44 (0)20 3 043 2003, +46 (0)8 5033 6574, +1 719 457 2086 or +358 (0)9 7479 0361. Confirmation Code: 9535979
The conference call can also be followed live at www.sampo.com/result. A recorded version will later be available at the same address.
In addition the Supplementary Financial Information Package is available at www.sampo.com/result.
Sampo will publish the Full-year Financial Report for 2016 on 8 February 2017.

INTERIM STATEMENT FOR JANUARY – SEPTEMBER 2016
22
Group financial review
Financial highlightsGroup 1–9/2016 1–9/2015Profit before taxes EURm 1,343 1,475Return on equity (at fair value) % 14.1 12.6Return on assets (at fair value) % 6.9 6.5Equity/assets ratio % 31.5 31.2Group solvency ¹) EURm 3,434 3,179Group solvency ratio % 149 145Average number of staff 6,769 6,739
Property & casualty insurancePremiums written before reinsurers' share EURm 3,565 3,659Premiums earned EURm 3,211 3,267Profit before taxes EURm 660 756Return on equity (at current value) % 22.3 18,6Risk ratio ²) % 62.0 67.1Cost ratio ²) % 22.1 17.6Loss ratio, excl. unwinding of discounting ²) % 67.4 72.8Expense ratio ²) % 16.6 11.8Combined ratio, excl. unwinding of discounting % 84.0 84.6Average number of staff 6,170 6,162
Life insurancePremiums written before reinsurers' share EURm 674 843Profit before taxes EURm 157 132Return on equity (at current value) % 18.0 5.3Expense ratio % 103.6 99.4Average number of staff 543 521
HoldingProfit before taxes EURm 527 589Average number of staff 56 56
Per share key figuresEarnings per share EUR 2.11 2.31Earnings per share, incl. other comprehensive income EUR 2.16 1.84Capital and reserves per share EUR 20.44 19.42Net asset value per share EUR 21.81 22.77Adjusted share price, high EUR 46.56 49.40Adjusted share price, low EUR 34.42 37.72Market capitalisation EURm 22,176 24,237
¹) The Group solvency is calculated according to the consolidation method defined in Chapter 3 of the Act on the Supervision of Financial and Insurance Conglomerates (2004/699).
²) The key figures for P&C Insurance are based on activity based costs and cannot, therefore, be calculated directly from the consolidated income statement. The result analysis of P&C insurance is presented in note 3.
The number of shares used at the balance sheet date and as the average number during the financial period was 560,000,000.
The valuation differences on investment property have been taken into account in calculating the return on assets, return on equity, equity/assets ratio and net asset value per share. The tax component includes the tax corresponding to the result for the period, and the deferred tax liability related to valuation differences on investment property.
The total comprehensive income has been used in the calculation of the return on assets and return on equity.
The key figures for the insurance business have been calculated in accordance with the decree issued by the Ministry of Finance and the specifying regulations and instructions of the Finance Supervisory Authority.
Taulukot 31.3.2015
INTERIM STATEMENT FOR JANUARY – SEPTEMBER 2016
23
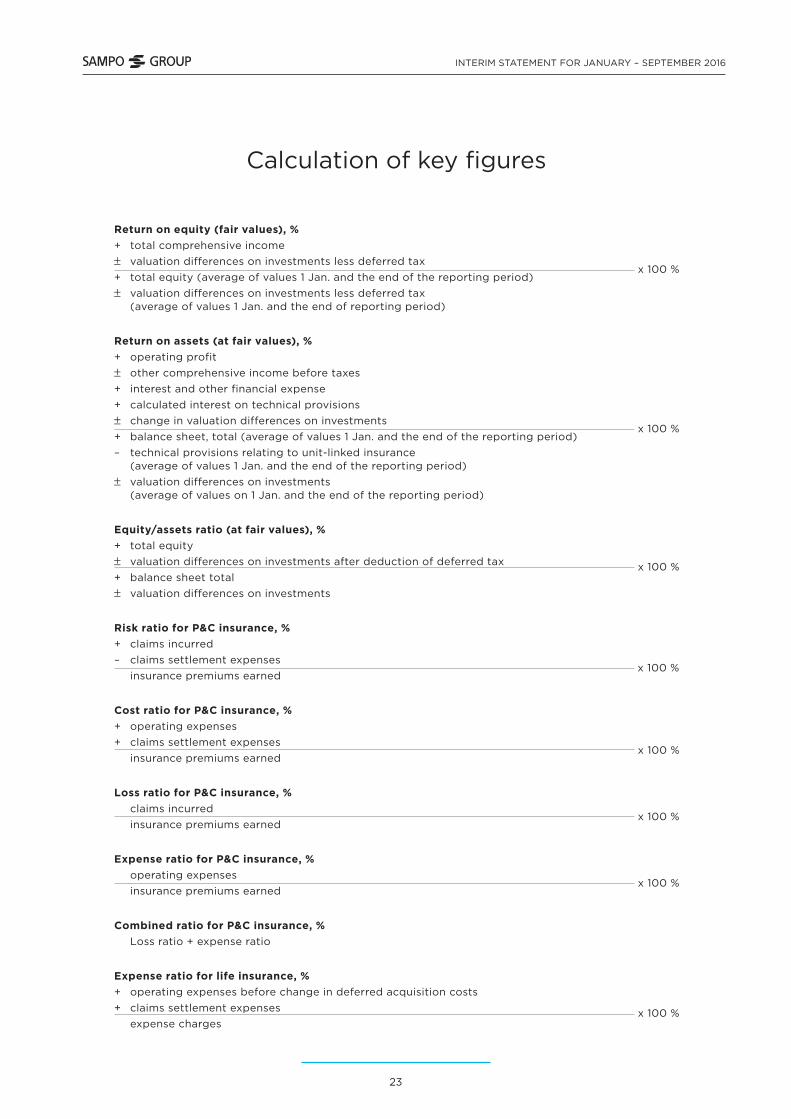
Calculation of key figures
Return on equity (fair values), % + total comprehensive income
valuation differences on investments less deferred tax x 100 %
+ total equity (average of values 1 Jan. and the end of the reporting period) valuation differences on investments less deferred tax
(average of values 1 Jan. and the end of reporting period)
Return on assets (at fair values), % + operating profit
other comprehensive income before taxes+ interest and other financial expense + calculated interest on technical provisions
change in valuation differences on investments x 100 %
+ balance sheet, total (average of values 1 Jan. and the end of the reporting period) – technical provisions relating to unit-linked insurance (average of values 1 Jan. and the end of the reporting period)
valuation differences on investments (average of values on 1 Jan. and the end of the reporting period)
Equity/assets ratio (at fair values), % + total equity
valuation differences on investments after deduction of deferred tax x 100 %+ balance sheet total
valuation differences on investments
Risk ratio for P&C insurance, % + claims incurred – claims settlement expenses
x 100 %
insurance premiums earned
Cost ratio for P&C insurance, % + operating expenses + claims settlement expenses
x 100 % insurance premiums earned
Loss ratio for P&C insurance, % claims incurred
x 100 % insurance premiums earned
Expense ratio for P&C insurance, % operating expenses
x 100 % insurance premiums earned
Combined ratio for P&C insurance, % Loss ratio + expense ratio
Expense ratio for life insurance, % + operating expenses before change in deferred acquisition costs + claims settlement expenses x 100 % expense charges
INTERIM STATEMENT FOR JANUARY – SEPTEMBER 2016
24
Per share key figures
Earnings per share profit for the financial period attributable to the parent company’s equity holders adjusted average number of shares
Equity per share equity attributable to the parent company’s equity holders adjusted number of shares at the balance sheet date
Net asset value per share+ equity attributable to the parent company’s equity holders valuation differences on listed associates in the Group valuation differences after the deduction of deferred taxes
adjusted number of shares at balance sheet date
Market capitalisation number of shares at the balance sheet date x closing share price at the balance sheet date
INTERIM STATEMENT FOR JANUARY – SEPTEMBER 2016
25
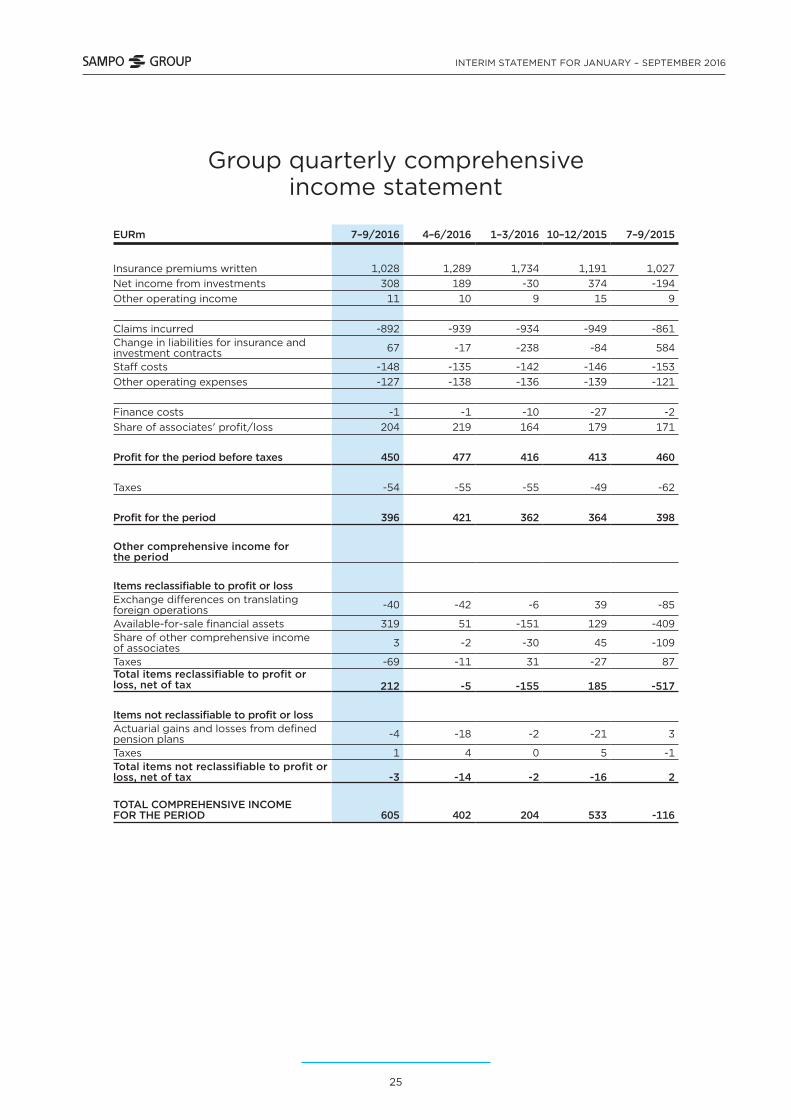
Group quarterly comprehensive income statement
EURm 7–9/2016 4–6/2016 1–3/2016 10–12/2015 7–9/2015
Insurance premiums written 1,028 1,289 1,734 1,191 1,027Net income from investments 308 189 -30 374 -194Other operating income 11 10 9 15 9
Claims incurred -892 -939 -934 -949 -861Change in liabilities for insurance and investment contracts 67 -17 -238 -84 584
Staff costs -148 -135 -142 -146 -153Other operating expenses -127 -138 -136 -139 -121
Finance costs -1 -1 -10 -27 -2Share of associates' profit/loss 204 219 164 179 171
Profit for the period before taxes 450 477 416 413 460
Taxes -54 -55 -55 -49 -62
Profit for the period 396 421 362 364 398
Other comprehensive income for the period
Items reclassifiable to profit or lossExchange differences on translating foreign operations -40 -42 -6 39 -85
Available-for-sale financial assets 319 51 -151 129 -409Share of other comprehensive income of associates 3 -2 -30 45 -109
Taxes -69 -11 31 -27 87Total items reclassifiable to profit or loss, net of tax 212 -5 -155 185 -517
Items not reclassifiable to profit or lossActuarial gains and losses from defined pension plans -4 -18 -2 -21 3
Taxes 1 4 0 5 -1Total items not reclassifiable to profit or loss, net of tax -3 -14 -2 -16 2
TOTAL COMPREHENSIVE INCOME FOR THE PERIOD 605 402 204 533 -116
INTERIM STATEMENT FOR JANUARY – SEPTEMBER 2016
26
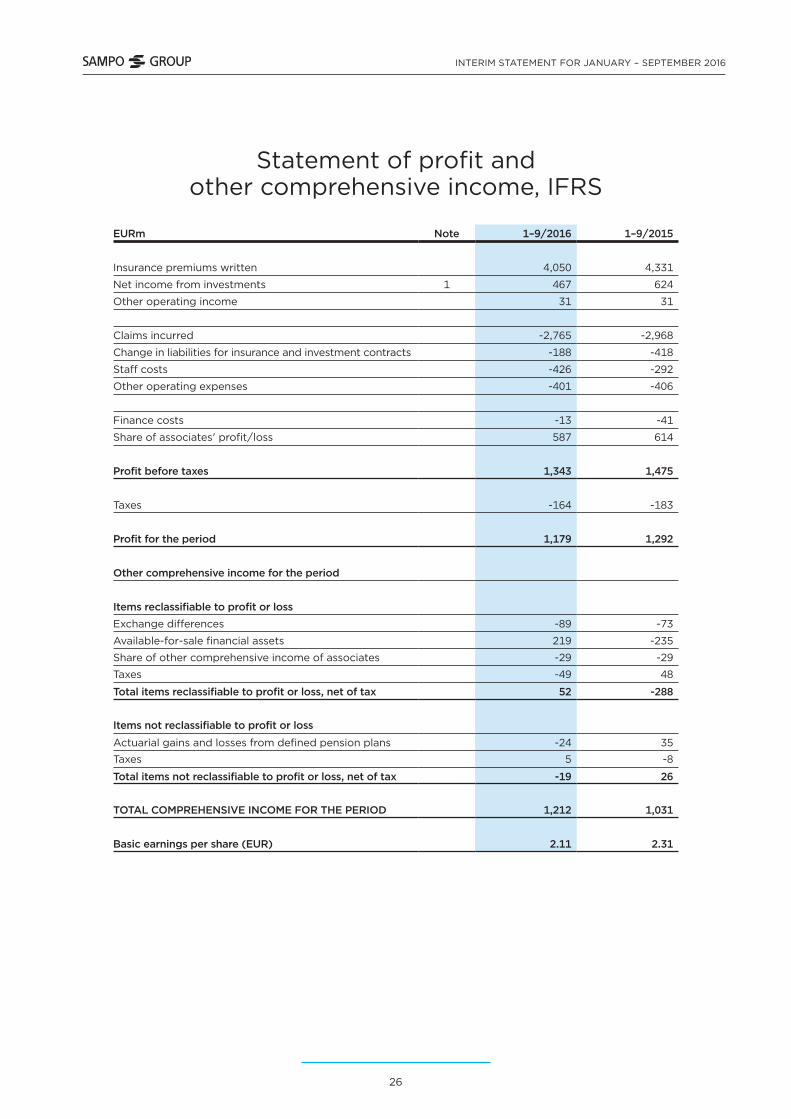
Statement of profit and other comprehensive income, IFRS
EURm Note 1–9/2016 1–9/2015
Insurance premiums written 4,050 4,331
Net income from investments 1 467 624
Other operating income 31 31
Claims incurred -2,765 -2,968
Change in liabilities for insurance and investment contracts -188 -418
Staff costs -426 -292
Other operating expenses -401 -406
Finance costs -13 -41
Share of associates' profit/loss 587 614
Profit before taxes 1,343 1,475
Taxes -164 -183
Profit for the period 1,179 1,292
Other comprehensive income for the period
Items reclassifiable to profit or lossExchange differences -89 -73
Available-for-sale financial assets 219 -235
Share of other comprehensive income of associates -29 -29
Taxes -49 48
Total items reclassifiable to profit or loss, net of tax 52 -288
Items not reclassifiable to profit or loss
Actuarial gains and losses from defined pension plans -24 35
Taxes 5 -8
Total items not reclassifiable to profit or loss, net of tax -19 26
TOTAL COMPREHENSIVE INCOME FOR THE PERIOD 1,212 1,031
Basic earnings per share (EUR) 2.11 2.31

INTERIM STATEMENT FOR JANUARY – SEPTEMBER 2016
27
Consolidated balance sheet, IFRS
EURm Note 9/2016 12/2015
Assets
Property, plant and equipment 26 26
Investment property 206 191
Intangible assets 698 724
Investments in associates 7,664 7,679
Financial assets 2 17,509 17,189
Investments related to unit-linked insurance contracts 6,063 5,847
Tax assets 34 36
Reinsurers' share of insurance liabilities 229 242
Other assets 1,758 1,708
Cash and cash equivalents 2,156 1,997
Total assets 36,343 35,639
Liabilities
Liabilities for insurance and investment contracts 14,380 14,447Liabilities for unit-linked insurance and investment contracts
6,041 5,841
Financial liabilities 2,900 2,375
Tax liabilities 513 468
Provisions 34 51
Employee benefits 100 90
Other liabilities 930 957
Total liabilities 24,898 24,228
Equity
Share capital 98 98
Reserves 1,531 1,531
Retained earnings 9,231 9,325
Other components of equity 585 457
Total equity 11,445 11,411
Total equity and liabilities 36,343 35,639

INTERIM STATEMENT FOR JANUARY – SEPTEMBER 2016
28
Statement of changes in equity, IFRS
EURm Share capital Legal reserve
Invested unrestricted
equity
Retained earnings
1)
Translation of
foreign operations
2)
Available- for-sale
financial assets
3) Total
Equity at 1 Jan. 2015 98 4 1,527 8,655 -400 1,039 10,924
Changes in equityRecognition of undrawn dividends 8 8
Dividends -1,092 -1,092Share of associates' other changes in equity 6 6
Profit for the period 1,292 1,292Other comprehensive income for the period 41 -95 -208 -262
Equity at 30 September 2015 98 4 1,527 8,911 -495 832 10,876
Equity at 1 Jan. 2016 98 4 1,527 9,325 -472 929 11,411
Changes in equityRecognition of undrawn dividends 9 9
Dividends -1,204 -1,204
Share of associates' other changes in equity 17 17
Profit for the period 1,179 1,179
Other comprehensive income for the period -95 -62 190 33
Equity at 30 September 2016 98 4 1,527 9,231 -534 1,119 11,445
1) IAS 19 Pension benefits had a net effect of EURm -95 (41) on retained earnings.
2) The total comprehensive income includes also the share of the associate Nordea's other comprehensive income, in accordance with the Group's share holding. The retained earnings thus include EURm -76 (15) of Nordea's actuarial gains/losses from defined pension plans. The exchange differences include the share of Nordea's exchange differences EURm 27 (-22). Respectively, available-for-sale financial assets include EURm 20 (-21) of Nordea's valuation differences.
3) The amount recognised in equity from available-for-sale financial assets for the period totalled EURm 140 (103). The amount transferred to p/l amounted to EURm 47 (-286). EURm 17 (4) was transferred to the Segregated Suomi portfolio.
The amount included in the translation, available-for-sale, cash flow hedge reserves and defined benefit plans represent other comprehensive income for each component, net of tax.
INTERIM STATEMENT FOR JANUARY – SEPTEMBER 2016
29
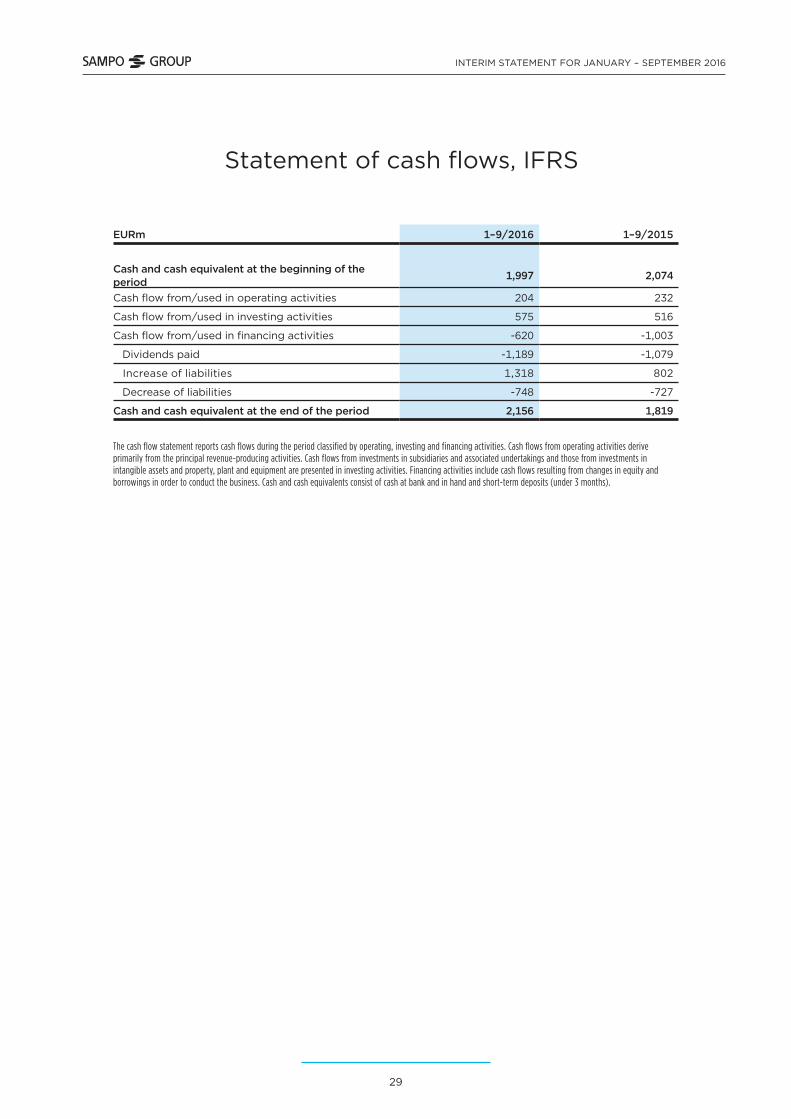
Statement of cash flows, IFRS
EURm 1–9/2016 1–9/2015
Cash and cash equivalent at the beginning of the period 1,997 2,074
Cash flow from/used in operating activities 204 232
Cash flow from/used in investing activities 575 516
Cash flow from/used in financing activities -620 -1,003
Dividends paid -1,189 -1,079
Increase of liabilities 1,318 802
Decrease of liabilities -748 -727
Cash and cash equivalent at the end of the period 2,156 1,819
The cash flow statement reports cash flows during the period classified by operating, investing and financing activities. Cash flows from operating activities derive primarily from the principal revenue-producing activities. Cash flows from investments in subsidiaries and associated undertakings and those from investments in intangible assets and property, plant and equipment are presented in investing activities. Financing activities include cash flows resulting from changes in equity and borrowings in order to conduct the business. Cash and cash equivalents consist of cash at bank and in hand and short-term deposits (under 3 months).

INTERIM STATEMENT FOR JANUARY – SEPTEMBER 2016
30
Notes
Accounting policies Sampo Group’s consolidated financial statements are prepared in accordance with the International Financial Reporting Standards (IFRS) adopted by the EU. The interim financial statements are not presented in accordance with IAS 34 standard as Sampo applies the statues of security markets act (1278/2015), regarding the regular disclosure requirements. The same accounting policies and methods of computation are applied as in the financial statements for 2015.
Sampo adopted new or revised standards and interpretations at the beginning of the year 2016. These standards and interpretations are explained in Sampos accounting policies for the financial year 2015. The financial statements are available on Sampo’s website at www.sampo.com/annualreport.
Accounting policies

INTERIM STATEMENT FOR JANUARY – SEPTEMBER 2016
31
Comprehensive income statement by segment for nine months ended 30 September 2016
EURm P&C insurance Life insurance Holding Elimination Group
Insurance premius written 3,409 669 - -28 4,050Net income from investments 120 361 -2 -11 467Other operating income 20 11 12 -12 31
Claims incurred -1,990 -775 - 0 -2,765Change in liabilities for insurance and investment contracts -198 -18 - 28 -188
Staff costs -381 -34 -10 - -426Other operating expenses -352 -51 -10 12 -401
Finance costs -9 -5 -9 11 -13Share of associates' profit/loss 41 0 546 - 587
Profit before taxes 660 157 527 0 1,343Taxes -134 -29 -1 - -164
Profit for the period 526 128 526 0 1,179
Other comprehensive income for the period
Items reclassifiable to profit or lossExchange differences -89 - - - -89Available-for-sale financial assets 115 86 17 - 219Share of other comprehensive income of associates
- - -29 - -29
Taxes -25 -21 -3 - -49Total items reclassifiable to profit or loss, net of tax 1 66 -15 - 52
Items not reclassifiable to profit or lossActuarial gains and losses from defined pension plans -24 - - - -24
Taxes 5 - - - 5Total items not reclassifiable to profit or loss, net of tax -19 - - - -19
TOTAL COMPREHENSIVE INCOME FOR THE PERIOD 508 193 510 0 1,212

INTERIM STATEMENT FOR JANUARY – SEPTEMBER 2016
32
Comprehensive income statement by segment for nine months ended 30 September 2015
EURm P&C insurance Life insurance Holding Elimination Group
Insurance premius written 3,493 838 - - 4,331Net income from investments 234 340 60 -10 624Other operating income 21 11 12 -13 31
Claims incurred -2,191 -777 - - -2,968Change in liabilities for insurance and investment contracts -227 -185 - -6 -418
Staff costs -243 -35 -14 - -292Other operating expenses -356 -54 -9 13 -406
Finance costs -12 -5 -38 14 -41Share of associates' profit/loss 36 0 577 - 614
Profit before taxes 756 132 589 -2 1,475
Taxes -157 -24 -2 0 -183
Profit for the period 599 108 588 -2 1,292
Other comprehensive income for the period
Items reclassifiable to profit or lossExchange differences -73 - - - -73Available-for-sale financial assets -150 -72 -21 8 -235Share of other comprehensive income of associates - - -29 - -29
Taxes 32 14 4 -2 48Total items not reclassifiable to profit or loss, net of tax -191 -58 -45 6 -288
Items not reclassifiable to profit or lossActuarial gains and losses from defined pension plans 35 - - - 35
Taxes -8 - - - -8Total items not reclassifiable to profit or loss, net of tax 26 - - - 26
TOTAL COMPREHENSIVE INCOME FOR THE PERIOD 434 50 543 4 1,031

INTERIM STATEMENT FOR JANUARY – SEPTEMBER 2016
33
Consolidated balance sheet by segment at 30 September 2016
EURmP&C
insuranceLife
insurance Holding Elimination Group
AssetsProperty, plant and equipment 19 4 3 - 26Investment property 14 195 - -4 206Intangible assets 538 159 0 - 698Investments in associates 385 0 7,278 - 7,664Financial assets 11,174 5,838 3,156 -2,659 17,509Investments related to unit-linked insurance contracts - 6,108 - -45 6,063
Tax assets 29 - 9 -4 34Reinsurers' share of insurance liabilities 226 3 - - 229
Other assets 1,655 102 18 -16 1,758Cash and cash equivalents 1,308 503 345 - 2,156Total assets 15,349 12,912 10,810 -2,728 36,343
LiabilitiesLiabilities for insurance and investment contracts 9,588 4,793 - - 14,380
Liabilities for unit-linked insurance and investment contracts - 6,086 - -45 6,041
Financial liabilities 227 115 2,848 -289 2,900Tax liabilities 344 169 - 0 513Provisions 34 - - - 34Employee benefits 100 - - - 100Other liabilities 705 148 94 -17 930Total liabilities 10,997 11,311 2,941 -351 24,898
EquityShare capital 98Reserves 1,531Retained earnings 9,231Other components of equity 585Total equity 11,445
Total equity and liabilities 36,343
INTERIM STATEMENT FOR JANUARY – SEPTEMBER 2016
34
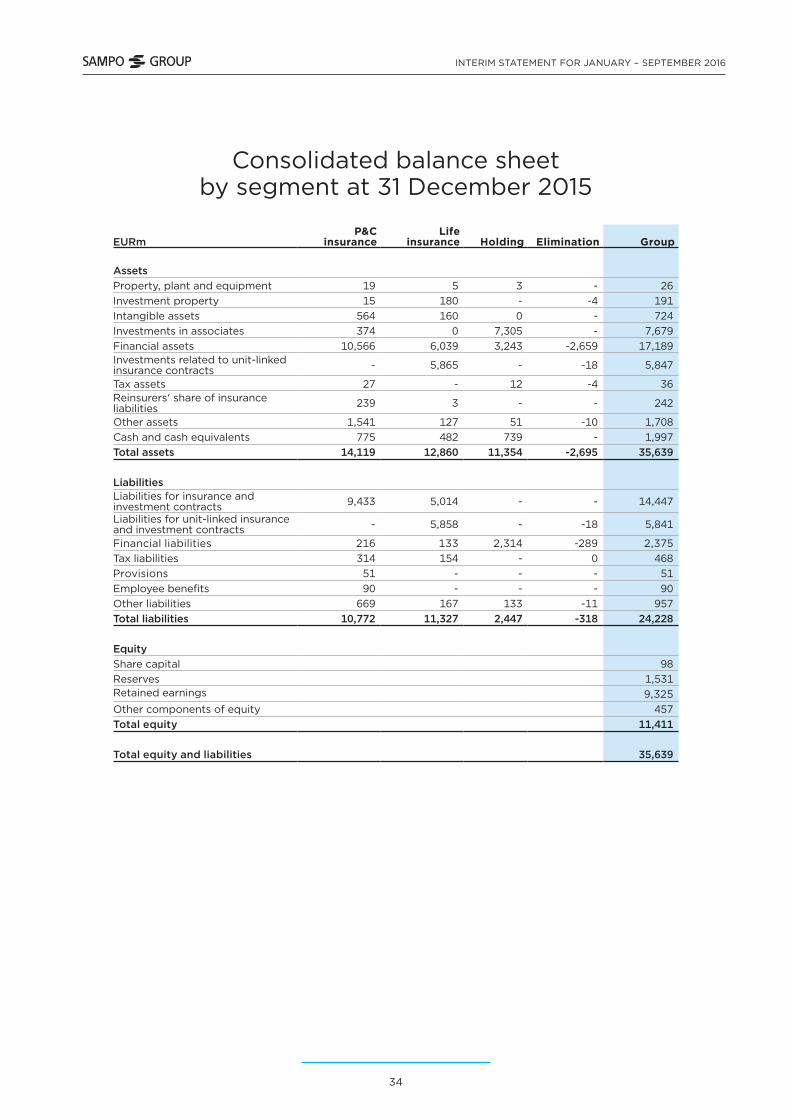
Consolidated balance sheet by segment at 31 December 2015
EURmP&C
insuranceLife
insurance Holding Elimination Group
Assets Property, plant and equipment 19 5 3 - 26Investment property 15 180 - -4 191Intangible assets 564 160 0 - 724Investments in associates 374 0 7,305 - 7,679Financial assets 10,566 6,039 3,243 -2,659 17,189Investments related to unit-linked insurance contracts - 5,865 - -18 5,847
Tax assets 27 - 12 -4 36Reinsurers' share of insurance liabilities 239 3 - - 242
Other assets 1,541 127 51 -10 1,708Cash and cash equivalents 775 482 739 - 1,997Total assets 14,119 12,860 11,354 -2,695 35,639
LiabilitiesLiabilities for insurance and investment contracts 9,433 5,014 - - 14,447
Liabilities for unit-linked insurance and investment contracts - 5,858 - -18 5,841
Financial liabilities 216 133 2,314 -289 2,375Tax liabilities 314 154 - 0 468Provisions 51 - - - 51Employee benefits 90 - - - 90Other liabilities 669 167 133 -11 957Total liabilities 10,772 11,327 2,447 -318 24,228
EquityShare capital 98Reserves 1,531Retained earnings 9,325Other components of equity 457Total equity 11,411
Total equity and liabilities 35,639

INTERIM STATEMENT FOR JANUARY – SEPTEMBER 2016
35
Other notes, EURm1 Net income from investments >
P&C Insurance 1–9/2016 1–9/2015
Financial assets Derivative financial instruments -7 -7
Loans and receivables 5 13
Financial asset available-for-sale Debt securities 113 149 Equity securities 42 122Total 155 271
Total financial assets 154 278
Fee and commission expense -10 -12
Expense on other than financial liabilities -3 -4
Effect of discounting annuities -22 -28
P&C insurance, total 120 234
INTERIM STATEMENT FOR JANUARY – SEPTEMBER 2016
36
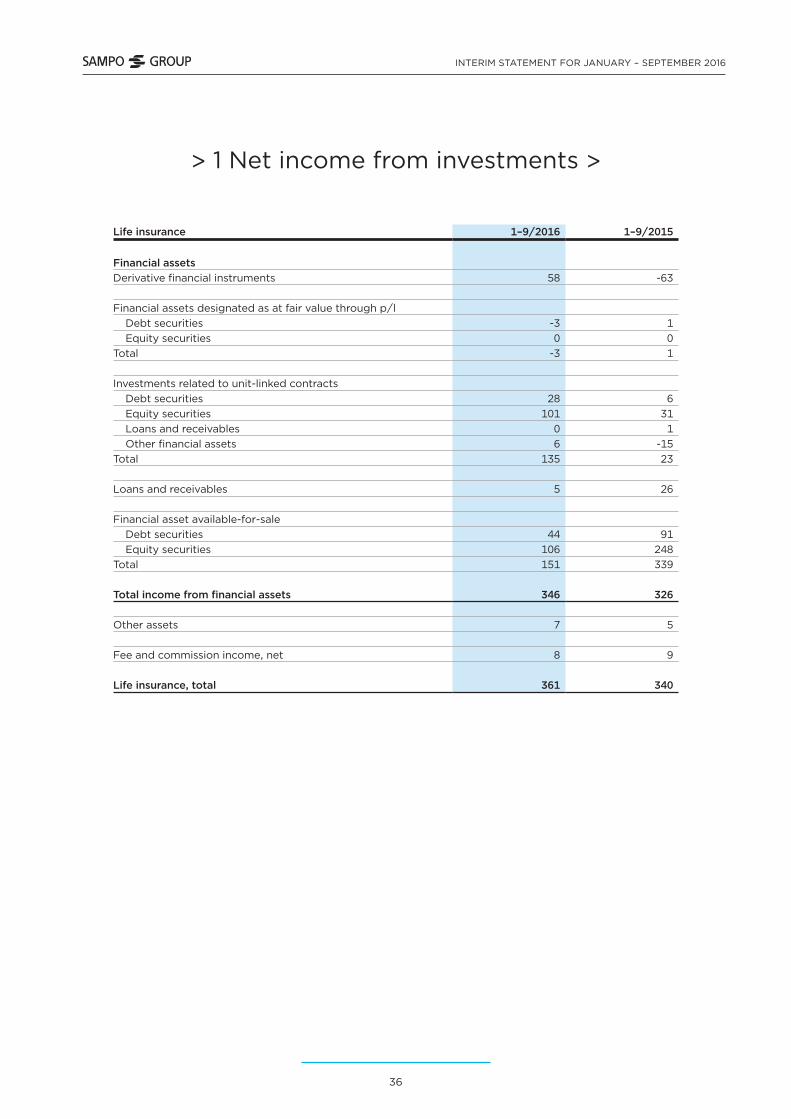
> 1 Net income from investments >
Life insurance 1–9/2016 1–9/2015
Financial assetsDerivative financial instruments 58 -63
Financial assets designated as at fair value through p/l Debt securities -3 1 Equity securities 0 0Total -3 1
Investments related to unit-linked contracts Debt securities 28 6 Equity securities 101 31 Loans and receivables 0 1 Other financial assets 6 -15Total 135 23
Loans and receivables 5 26
Financial asset available-for-sale Debt securities 44 91 Equity securities 106 248Total 151 339
Total income from financial assets 346 326
Other assets 7 5
Fee and commission income, net 8 9
Life insurance, total 361 340

INTERIM STATEMENT FOR JANUARY – SEPTEMBER 2016
37
> 1 Net income from investments
Holding 1–9/2016 1–9/2015
Financial assetsDerivative financial instruments 8 6
Loans and other receivables -18 4
Financial assets available-for-sale Debt securities 21 30 Equity securities -14 21Total 8 50
Total income from financial assets -3 60
Fee and commission income, net 1 0
Holding, total -2 60
Elimination items between segments -11 -10
Group, total 467 624
INTERIM STATEMENT FOR JANUARY – SEPTEMBER 2016
38
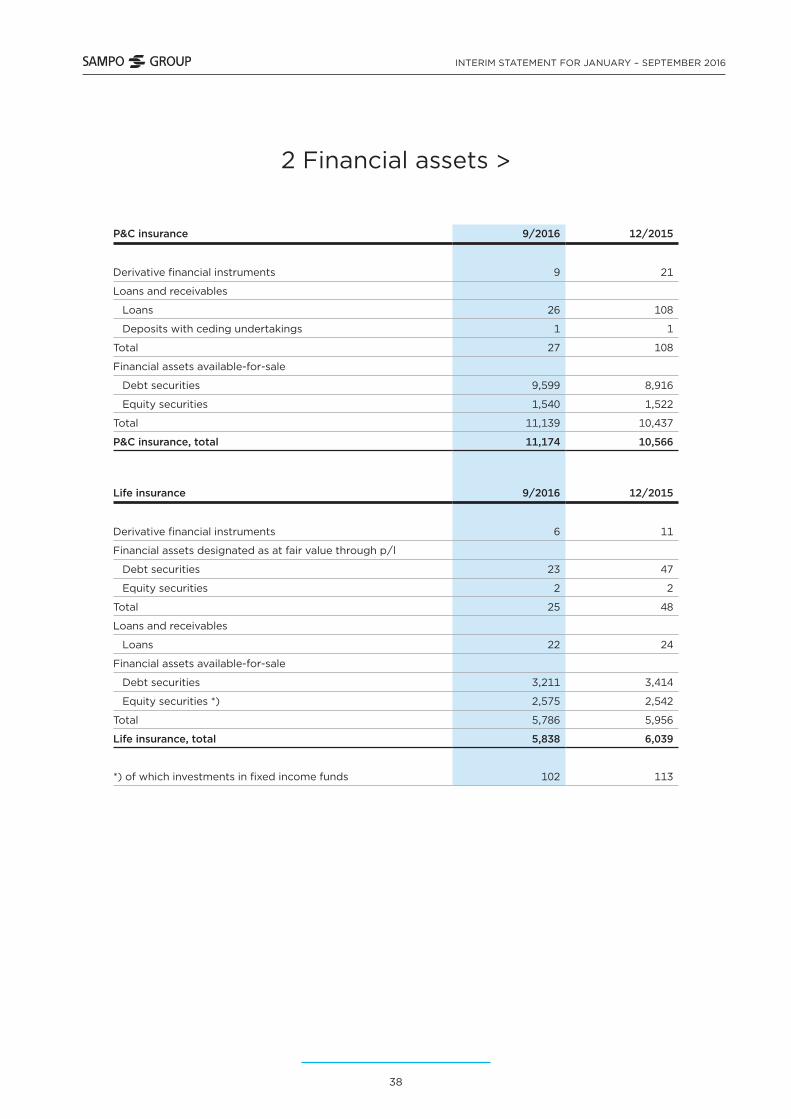
2 Financial assets >
P&C insurance 9/2016 12/2015
Derivative financial instruments 9 21
Loans and receivables
Loans 26 108
Deposits with ceding undertakings 1 1
Total 27 108
Financial assets available-for-sale
Debt securities 9,599 8,916
Equity securities 1,540 1,522
Total 11,139 10,437
P&C insurance, total 11,174 10,566
Life insurance 9/2016 12/2015
Derivative financial instruments 6 11
Financial assets designated as at fair value through p/l
Debt securities 23 47
Equity securities 2 2
Total 25 48
Loans and receivables
Loans 22 24
Financial assets available-for-sale
Debt securities 3,211 3,414
Equity securities *) 2,575 2,542
Total 5,786 5,956
Life insurance, total 5,838 6,039
*) of which investments in fixed income funds 102 113

INTERIM STATEMENT FOR JANUARY – SEPTEMBER 2016
39
> 2 Financial assets
Holding 9/2016 12/2015
Derivative financial instruments 2 21
Loans and receivables
Deposits 1 1
Financial assets available-for-sale
Debt securities 647 603
Equity securities 137 248
Total 784 852
Investments in subsidiaries 2,370 2,370
Holding, total 3,156 3,243
Elimination items between segments -2,659 -2,659
Group, total 17,509 17,189

INTERIM STATEMENT FOR JANUARY – SEPTEMBER 2016
40
3 Result analysis of P&C insurance business
1–9/2016 1–9/2015
Premiums earned 3,211 3,267
Claims incurred -2,165 -2,379
Operating expenses -534 -386
Other technical income and expenses -3 -1Allocated investment return transferred from the non-technical account
4 21
Technical result 514 522
Investment result 132 250
Allocated investment return transferred to the technical account -26 -49
Other income and expenses 40 33
Operating result 660 756

INTERIM STATEMENT FOR JANUARY – SEPTEMBER 2016
41
4 Sampo plc’s income statement and balance sheet (FAS)
INCOME STATEMENT 1–9/2016 1–9/2015
Other operating income 12 12
Staff expenses -10 -14
Depreciation and impairment 0 0
Other operating expenses -10 -8
Operating profit -8 -10Finance income and expenses 957 656
Profit before appropriations and income taxes 949 646Income taxes -1 -2
Profit for the financial period 948 644
BALANCE SHEET 9/2016 12/2015
ASSETSIntangible assets 0 0
Property, plant and equipment 3 3
Investments
Shares in Group companies 2,370 2,370
Receivables from Group companies 299 296
Shares in participating undertakings 6,336 5,557
Receivables from participating undertakings 324 196
Other shares and participations 137 248
Other receivables 24 111
Receivables 29 84
Cash and cash equivalents 345 739
TOTAL ASSETS 9,867 9,606
LIABILITIESEquityShare capital 98 98
Fair value reserve 22 8
Invested unrestricted equity 1,527 1,527
Other reserves 273 273
Retained earnings 4,059 4,026
Profit for the year 948 1,228
Total equity 6,926 7,159
LiabilitiesLong-term 2,142 1,997
Short-term 799 450
Total liabilities 2,941 2,447
TOTAL LIABILITIES 9,867 9,606

Sampo plc
Fabianinkatu 27
00100 Helsinki, Finland
Phone +358 10 516 0100
Business ID: 0142213-3
www.sampo.com
@Sampo_plc
sampo-plc