sampo group · 2014. 10. 2. · sampo group interim report q2/2013 - 3 - summary boring is good...
TRANSCRIPT


Sampo Group Interim Report Q2/2013
- 2 -
Contents
Contentssummary 3 seCond quarter 2013 in brief 4
business areas 5 P&C insurance 5 Associated company Nordea Bank Ab 8 Life insurance 10 Holding 12
other developments 13 Annual General Meeting 13 Personnel 13 Remuneration 14 Shares and share capital 14 Internal dividends 14 Ratings 15 Group solvency 15 Debt financing 16
outlook for the rest of 2013 17 The major risks and uncertainties to the Group in the near term 17
tables 30 june 2013 19 Group financial review 19 Calculation of key figures 20 Group quarterly comprehensive income statement 22 Consolidated comprehensive income statement, IFRS 23 Consolidated balance sheet, IFRS 24 Statement of changes in equity, IFRS 25 Statement of cash flows, IFRS 26
notes 27 Accounting policies 27 Comprehensive income statement by segment for six months ended 30 June 2013 28 Comprehensive income statement by segment for six months ended 30 June 2012 29 Consolidated balance sheet by segment at 30 June 2013 30 Consolidated balance sheet by segment at 31 December 2012 3 1
other notes 32 1 Insurance premiums 32 2 Net income from investments 33 3 Claims incurred 36 4 Staff costs 37 5 Intangible assets 38 6 Financial assets 39 7 Derivative financial instruments 4 1 8 Determination and hierarchy of fair values 42 9 Movements in level 3 financial instruments measured at fair value 45 10 Sensitivity analysis of level 3 financial instruments measured at fair value 47 11 Investments related to unit-linked insurance 47 12 Liabilities for insurance and investment contracts 48 13 Liabilities from unit-linked insurance and investment contracts 50 14 Financial liabilities 50 15 Contingent liabilities and commitments 5 1 16 Result analysis of P&C insurance business 53 17 Sampo plc’s income statement and balance sheet (FAS) 54

Sampo Group Interim Report Q2/2013
- 3 -
Summary
borinG is GoodSampo Group’s profit before taxes for the first half of 2013 amounted to EUR 825 million (813). The total comprehensive income for the period, taking changes in the market value of assets into account, decreased to EUR 579 million (846) largely because of the depreciation of Swedish krona and the decrease in the market value of investment assets.
• Earnings per share rose to EUR 1.27 (1.24) and mark-to-market EPS was EUR 1.03 per share (1.51). The return on equity for the Group amounted to 11.6 per cent for the period (18.9).
• Net asset value per share on 30 June 2013 was EUR 19.27 (17.38). The fair value reserve after tax on the Group level decreased to EUR 710 million (749).
• P&C insurance operations reported an excellent combined ratio of 88.8 per cent (88.8) for the first half of 2013, despite the lowering of the interest rate used to discount the Finnish annuity reserves to 2.5 per cent. The profit before taxes was EUR 473 million (452). Mark-to-market result decreased to EUR 312 million (434) and return on equity was 21.7 per cent (35.8).
• Nordea is accounted for as an associated company and Sampo’s share of Nordea’s profit for the first half of 2013 was EUR 319 million (326).
• Profit before taxes for the life insurance operations rose to EUR 69 million (65). The interest rate used to discount with profit liabilities was lowered and consequently all with profit policies are discounted with 2.5 per cent in 2013 and 2014. The mark-to-market result decreased to EUR 25 million (105). The return on equity at market value was 4.6 per cent (23.0).
SAMPO PLC INTERIM REPORT 7 August 2013
Sampo Group’s results for January–June 2013
key fiGuresEURm 1–6/2013 1–6/2012 Change, % 4–6/2013 4–6/2012 Change, %
Profit before taxes 825 813 1 455 444 3 P&C insurance 473 452 5 270 254 6 Associate (Nordea) 319 326 -2 157 168 -7 Life insurance 69 65 7 33 32 5 Holding (excl. Nordea) -34 -29 16 -4 -10 -57Profit for the period 710 696 2 390 375 4
Change ChangeEarnings per share, EUR 1.27 1.24 0.03 0.70 0.67 0.03EPS (incl. change in FVR) EUR 1.03 1.51 -0.48 0.16 0.33 -0.18NAV per share, EUR *) 19.27 17.38 1.89 - - -Average number of staff (FTE) 6,827 6,833 -6 - - -Group solvency ratio, % *) 179.2 170.4 8.8 - - -RoE, % 11.6 18.9 -7.3 - - -
*) comparison figure from 31.12.2012
The figures in this report are not audited. Income statement items are compared on a year-on-year basis whereas comparison figures for balance sheet items are from 31 December 2012 unless otherwise stated.
Due to the adoption of the revised accounting standard IAS 19 on Employee benefits, the comparison figures for 2012 have been restated and differ from the earlier published figures. The changes concern directly the P&C insurance segment but are consequently reflected in the consolidated items as well.
The average EUR-SEK exchange rate used for income statement items for January - June 2013 is 8.5302 and the end of period exchange rate used for balance sheet items is 8.7773.
Sampo Group Interim Report Q2/2013
- 4 -
Second quarter 2013 in brief
seCond quarter 2013 in brief
Sampo Group’s profit before taxes for the second quarter 2013 increased 3 per cent to EUR 455 million (444). Earnings per share amounted to EUR 0.70 (0.67). Mark-to-market earnings per share were EUR 0.16 (0.33).
The dividend of EUR 1.35 per share paid in April 2013 and the decrease in Nordea’s share price explain the drop in net asset value per share in the second quarter of 2013 to EUR 19.27 from EUR 21.03 at the end of March 2013.
Combined ratio in the P&C operation continued to be excellent at 86.7 per cent (85.9) for the second quarter. Profit before taxes increased to EUR 270 million (254). Share of the profits of the associated company Topdanmark amounted to EUR 18 million (16). The second quarter results are burdened by the EUR 75 million used to lower the interest rates used to discount the Finnish annuity reserves. On the other hand the interest rate used to discount the Swedish annuities rose decreasing the reserves by EUR 37 million.
Sampo’s share of Nordea’s second quarter 2013 net profit amounted to EUR 157 million (168). Total expenses in Nordea have now been unchanged for 11 consecutive quarters. Core tier one capital ratio improved to 14.0 per cent.
Profit before taxes for the life insurance operations amounted to EUR 33 million (32). Premiums written increased 23 per cent to EUR 288 million (234). The interest rate used for discounting all with profit liabilities was lowered to 2.5 per cent for 2014. The discount rate for 2013 was already earlier lowered to 2.5 per cent.

Sampo Group Interim Report Q2/2013
- 5 -
Business areas
business areas P&C insurance
If P&C is the leading property and casualty insurance company in the Nordic region, with insurance operations that also encompass the Baltic countries. The P&C insurance group’s parent company, If P&C Insurance Holding Ltd, is located in Sweden, and the If subsidiaries provide insurance solutions and services in Finland, Sweden, Norway, Denmark and the Baltic countries. If’s operations are divided into four business areas: Private, Commercial, Industrial and Baltic.
Business areas in 2011
resultsEURm 1–6/2013 1–6/2012 Change, % 4–6/2013 4–6/2012 Change, %
Premiums, net 2,737 2,593 6 1,076 1,002 7
Net income from investments 198 200 -1 106 97 9
Other operating income 14 17 -14 7 8 -9
Claims incurred -1,486 -1,400 6 -731 -663 10
Change in insurance liabilities -482 -473 2 63 52 22
Staff costs -289 -259 12 -144 -127 14
Other operating expenses -243 -242 0 -120 -123 -3
Finance costs -8 -9 -12 -4 -5 -21
Share of associates’ profit/loss 33 25 33 17 14 24
Profit before taxes 473 452 5 270 254 6
key fiGures Change Change
Combined ratio, % 88.8 88.8 0.0 86.7 85.9 -0.8
Risk ratio, % 65.9 66.0 -0.1 64.2 63.0 1.2
Cost ratio, % 22.9 22.8 0.1 22.5 22.9 -0.4
Expense ratio, % 16.7 16.7 0.0 16.5 16.8 -0.3
Return on equity, % 21.7 35.8 -14.1 - - -
Average number of staff (FTE) 6,218 6,243 -25 - - -
Profit before taxes for P&C insurance amounted to EUR 473 million (452) for the first half of 2013. Combined ratio remained unchanged at 88.8 per cent (88.8). EUR 39 million (81) was released from technical reserves relating to prior year claims.
Technical result was EUR 292 million (295) the lower allocated investment income burdening the result. Technical result improved in all business areas except Baltic, amounting to EUR 181 million (180) for Private, EUR 79 million (72) for Commercial and EUR 14 million (12) for business area Industrial. The technical result for business area Baltic decreased to EUR 7 million (11). Insurance margin (technical result in relation to net premiums earned) amounted to 12.9 per cent (13.8).

Sampo Group Interim Report Q2/2013
- 6 -
Business areas
Combined ratio,% Risk ratio,%
1–6/2013 1–6/2012 Change 1–6/2013 1–6/2012 Change
Private 87.8 87.7 0.1 64.6 64.3 0.3
Commercial 89.6 91.3 -1.7 66.0 67.7 -1.7
Industrial 95.6 97.9 -2.3 74.1 75.1 -1.0
Baltic 89.8 83.5 6.3 57.4 51.2 6.2
Sweden 90.4 95.2 -4.8 67.1 71.5 -4.4
Norway 85.0 81.1 3.9 63.0 58.5 4.5
Finland 95.4 89.0 6.4 72.0 66.1 5.9
Denmark 87.3 110.6 -23.3 60.1 83.1 -23.0
The 1.8 percentage point increase in the risk ratio of business area Private in the second quarter of 2013 is explained by the flooding in Norway and the lowering of annuity discount rates in Finland. The significant improvement in the Swedish combined ratio is due to fewer large claims and the increase in the interest rate used to discount annuity reserves corresponding to an effect of EUR 37 million. In Finland the technical reserves increased EUR 75 million as a result of the
Return on equity (RoE) decreased to 21.7 per cent (35.8) due to the lower investment returns. Fair value reserve on 30 June 2013 decreased from the end of 2012 to EUR 351 million (364).
Topdanmark’s profit contribution for January-June 2013 was EUR 34 million (28). At the end of June 2013 If P&C held altogether 31,476,920 Topdanmark shares, corresponding to over 25 per cent of all shares. The increase in the number of shares held is due to the 1:10 share split that Topdanmark conducted with effect from 13 March 2013. All Topdanmark shares held by Sampo Group have as of 18 June 2013 been concentrated in If P&C Insurance Holding Ltd (publ).
Combined ratio,% Risk ratio,%
4–6/2013 4–6/2012 Change 4–6/2013 4–6/2012 Change
Private 85.2 84.1 1.1 62.5 60.7 1.8
Commercial 87.2 87.9 -0.7 63.6 64.4 -0.8
Industrial 99.2 105.0 -5.8 77.3 79.1 -1.8
Baltic 85.1 78.0 7.1 53.1 45.1 8.0
Sweden 88.4 103.4 -15.0 65.8 79.2 -13.4
Norway 80.8 68.9 11.9 59.6 47.1 12.5
Finland 98.9 85.4 13.5 74.3 61.6 12.7
Denmark 80.2 113.4 -33.2 53.5 84.5 -32.0

Sampo Group Interim Report Q2/2013
- 7 -
Business areas
Long-termFixedIncome80%
Equities10%
MoneyMarket9%
Other1%
lowering of the interest rate used to discount the annuity reserves from 3.0 per cent to 2.5 per cent. In Denmark risk ratio improved significantly as the comparison period contains significant large claims. All in all large claims costs for January-June 2013 were EUR 5 million lower than expected.
Gross written premiums increased 4.4 per cent to EUR 2,907 million (2,785). Adjusted for currency, premiums rose 2.5 per cent. All business areas except business area Industrial had positive growth. Cost ratio increased 0.1 percentage point to 22.9 per cent but expense ratio remained at 16.7 per cent (16.7). Cost ratio for comparison period has been restated due to adoption of the revised IAS 19 accounting standard regarding employee benefits. The effect of the technical adjustments reduced January–June 2012 cost ratio by 0.6 percentage point.
At the end of June 2013 the total investment assets of If P&C amounted to EUR 11.7 billion (11.7).
Net income from investments amounted to EUR 198 million (200). Investment return mark-to-market for January–June 2013 was 1.9 per cent (3.0).
Duration for interest bearing assets was 1.2 years (1.3) and average maturity 2.3 years (2.5). Fixed income running yield was 3.1 per cent (3.8).
If P&C’s solvency ratio as at 30 June 2013 (solvency capital in relation to net written premiums) rose to 83 per cent (75). Solvency capital amounted to EUR 3,702 million (3,359). Reserve ratios remained stable and were 161 per cent (163) of net written premiums and 228 per cent (221) of claims paid. Main drivers for the increase in the latter ratio were the lowered of annuity discount rates in Finland and the consolidation of Tryg’s Finnish portfolio.
The acquisition of the insurance business of the Finnish branch of Tryg Forsikring A/S was completed on 2 May 2013 after all necessary approvals for the acquisition were obtained.
Investment Allocation P&C insurance, 30 June 2013
total11.7
EUR BILLION

Sampo Group Interim Report Q2/2013
- 8 -
Business areas
Associated company Nordea Bank Ab
Nordea Bank is the largest Nordic bank and among the ten largest universal banks in Europe in terms of total market capitalization. The bank is headquartered in Stockholm, Sweden, and has around 11 million customers. The Nordea share is listed on the NASDAQ OMX Nordic Exchange in Stockholm, Helsinki and Copenhagen.
resultsEURm 1–6/2013 1–6/2012 Change, % 4–6/2013 4–6/2012 Change, %
Net interest income 2,749 2,788 -1 1,391 1,415 -2
Total operating income 4,996 5,016 0 2,490 2,546 -2
Profit before loan losses 2,473 2,513 -2 1,234 1,287 -4
Net loan losses -384 -418 -8 -186 -203 -8
Loan loss ratio (ann.), bps 23 24 22 24
Operating profit 2,089 2,095 0 1,048 1,084 -3
Risk-adjusted profit 1,707 1,678 2 853 867 -2
Diluted EPS, EUR 0.39 0.40 0.19 0.21
Return on equity, % 11.3 12.1 11.5 12.5
On 30 June 2013 Sampo plc held 860,440,497 Nordea shares corresponding to a holding of 21.2 per cent. The average price paid per share amounted to EUR 6.46 and the book value in the Group accounts was EUR 7.69 per share. The closing price as at end of June 2013 was EUR 8.55. Nordea is accounted as an associated company in Sampo Group’s accounts.
The following text is taken from Nordea’s January - June 2013 interim report published on 17 July 2013.
The volatility in the financial markets has increased and uncertainty has grown related to Bank of Japan’s liquidity injection and the US Federal Reserve’s asset purchase program. General activity levels in the economies are still low, and interest rates continue to be under pressure. However, Nordea stands strong in this environment, with stronger customer relations, a continued high profitability and strengthened capital position.
Total income was largely unchanged compared to the first half year of 2012. Operating profit was also unchanged compared to the same period last year. Risk-adjusted profit increased by 2 per cent compared to the preceding year. Net interest income decreased 1 per cent compared to the same period last year. Lending volumes were down 2 per cent excluding reversed repurchase agreements in local currencies and corporate lending margins were higher, while deposit margins have decreased from 2012. Net fee and commission income increased 8 per cent and the net result from items at fair value decreased by 10 per cent compared to the same period last year.
Sampo Group Interim Report Q2/2013
- 9 -
Business areas
Total expenses were down 1 per cent compared to the first half year of 2012 in local currencies when excluding performance-related salaries and profit-sharing, i.e. with the cost definition for the cost target in the financial plan. Staff costs were down 2 per cent in local currencies when excluding performance-related salaries and profit-sharing.
Net loan loss provisions decreased to EUR 384 million for the continued operations, corresponding to a loan loss ratio of 23 basis points (24 basis points last year).
Net profit increased in the continued operations 1 per cent to EUR 1,583 million. Net profit in the total operations was down 2 per cent to EUR 1,567 million.
Total lending, excluding reversed repurchase agreements, amounted to EUR 305 billion, down 1 per cent compared to the previous quarter in local currencies and adjusted for the divestment of the Polish operations. Overall, the credit quality in the loan portfolio remained solid in the second quarter, with a largely stable effect from migration in both the corporate and retail portfolios.
The Group’s core tier 1 capital ratio, excluding transition rules, was 14.0 per cent at the end of the second quarter, a strengthening of 0.8 percentage point from the end of the previous quarter. The tier 1 capital ratio excluding transition rules increased 0.8 percentage point to 14.8 per cent. The total capital ratio excluding transition rules increased 0.9 percentage point to 17.4 per cent. Improved core tier 1 capital ratio has been achieved by RWA efficiency initiatives and strong profit generation.
RWA were EUR 161.6 billion excluding transition rules, a decrease of EUR 6.7 billion, or 4.0 per cent, compared to the previous quarter. RWA reduction of EUR 1.8 billion has been realised in the quarter via RWA initiatives. Additionally, currency fluctuation effects and reduced exposures contributed to a lower RWA.
In order to meet its financial targets and according to its strategy to concentrate on markets where it can deliver a superior customer experience and significant scale benefits based on a leading market position, Nordea has on June 12, 2013 signed an agreement to divest its Polish banking, financing and life insurance operations, including Nordea Bank Polska S.A., Nordea Finance Polska S.A. and Nordea Polska Towarzystwo Ubezpieczen na Zycie S.A., to PKO Bank Polski for EUR 694 million.
The transaction is expected to lead to a minor capital gain and profit and loss effect. In addition, due to the release of risk-weighted assets, it has a positive impact on the Nordea Group’s core tier 1 ratio of approx. 50 basis points, of which approximately half is expected to be realized during 2013 on closing of the transaction. The remaining part of the benefit to core tier 1 capital will be realised as a transitional risk-sharing and funding support that Nordea will provide ends. This transitional risk-sharing and funding will impact the Group’s profit and loss statement insignificantly.

Sampo Group Interim Report Q2/2013
- 10 -
Business areas
Profit before taxes in life insurance for January-June 2013 amounted to EUR 69 million (65). The interest rate used to discount all with profit liabilities in 2014 was lowered to 2.5 per cent. The discount rate for 2013 has already earlier been lowered to 2.5 per cent. All in all, Mandatum Life has increased its technical reserves with a total of EUR 125 million due to low level of interest rates.
Return on equity (RoE) decreased to 4.6 per cent (23.0). The total comprehensive income for the period, taking changes in the market value of assets into account, decreased to EUR 25 million (105), because of the drop in the market value of assets in the second quarter of 2013.
Excluding the assets of EUR 4.2 billion (3.8) covering unit-linked liabilities, Mandatum Life Group’s investment assets on 30 June 2013 amounted to EUR 5.3 billion (5.5) at market values.
Net income from investments, excluding income on unit-linked contracts, amounted to EUR 141 million (149). Net income from unit-linked investments decreased to EUR 31 million (88).
Investment return mark-to-market during January–June 2013 was 1.7 per cent (3.9). The fair value reserve decreased from the end of 2012 by EUR 29 million to EUR 362 million. At the end of June 2013 the duration of fixed income assets was 1.8 years (1.8) and average maturity 2.1 years (2.4). Fixed income running yield decreased to 4.2 per cent (5.3).
Life insurance
Mandatum Life Group consists of Mandatum Life, a wholly-owned subsidiary of Sampo plc, operating in Finland, and its subsidiary Mandatum Life Insurance Baltic SE headquartered in Estonia. It operates in the other Baltic countries through branches.
resultsEURm 1–6/2013 1–6/2012 Change, % 4–6/2013 4–6/2012 Change, %
Premiums written 549 493 11 288 234 23
Net income from investments 176 244 -28 -12 -27 -55
Other operating income 2 2 21 1 1 14
Claims incurred -386 -371 4 -173 -168 3Change in liabilities for inv. and ins. contracts
-216 -246 -12 -42 20 -
Staff costs -24 -21 15 -12 -10 10
Other operating expenses -30 -31 -4 -15 -15 1
Finance costs -4 -4 -17 -2 -2 -10
Profit before taxes 69 65 7 33 32 5
key fiGures Change
Expense ratio, % 113.7 117.5 -3.8 - - -
Return on equity, % 4.6 23.0 -18.4 - - -
Average number of staff (FTE) 557 536 21 - - -

Sampo Group Interim Report Q2/2013
- 11 -
Business areas
Long-termFixedIncome44%
Equities29%
MoneyMarket13%
Other10%
PrivateEquity5%
Investment Allocation Life insurance, 30 June 2013
Mandatum Life’s solvency position is strong and Mandatum Life Group’s solvency ratio as at 30 June 2013 was 26.1 per cent (27.7). The small decrease is due to the dividend of EUR 100 million paid in April 2013 to Sampo plc. Mandatum Life’s capital requirement is to a very large degree related to with profit technical reserves and the investments covering these reserves. The with profit reserves are expected to continue to annually decrease by roughly EUR 200 million for the next five years. This will decrease the required capital and contributed to company’s ability to pay a dividend.
Mandatum Life Group’s total technical reserves amounted to EUR 8.1 billion (7.9), of which unit-linked reserves accounted for EUR 4.1 billion (3.8) and the continuously declining with profit reserves for EUR 4.0 billion (4.1). The unit-linked reserves reached an all-time high and their share of total technical reserves was 51 per cent (48).
Mandatum Life Group’s premium income on own account increased 11 per cent and amounted to EUR 549 million (493). Premium income from the Baltic countries rose to EUR 15 million (13). Mandatum Life’s overall market share in Finland at the end of June 2013 measured by premium income was 18.8 per cent (26.9) and market share in unit-linked business was 18.8 per cent (28.8).
total5.3
EUR BILLION

Sampo Group Interim Report Q2/2013
- 12 -
Business areas
Holding
Sampo plc controls its subsidiaries engaged in P&C and life insurance. In addition on 30 June 2013 Sampo plc held 21.2 per cent of the share capital of Nordea, the largest bank in the Nordic countries. Nordea is an associated company to Sampo plc.
The segment’s profit before taxes amounted to EUR 285 million (297), of which EUR 319 million (326) relates to Sampo’s share of Nordea’s January - June 2013 profit. The segment, excluding share of Nordea’s profit, reported a loss of EUR 34 million (-29).
Sampo plc’s holding in Nordea Bank was booked in the consolidated balance sheet at EUR 6.6 billion. The market value of the holding was EUR 7.4 billion as at 30 June 2013. In addition the assets on Sampo plc’s balance sheet as at 30 June 2013 included holdings in subsidiaries for EUR 2.4 billion (2.4).
resultsEURm 1–6/2013 1–6/2012 Change, % 4–6/2013 4–6/2012 Change, %
Net investment income 6 18 -67 -2 8 -
Other operating income 8 7 2 4 4 2
Staff costs -12 -8 43 -5 -4 37
Other operating expenses -6 -8 -17 -4 -4 -12
Finance costs -29 -38 -24 3 -14 -
Share of associates’ profit 319 326 -2 157 168 -7
Profit before taxes 285 297 -4 152 158 -3
key fiGures Change ChangeAverage number of staff (FTE)
52 54 -2 - - -

Sampo Group Interim Report Q2/2013
- 13 -
Other developments
other developments
Annual General MeetingThe Annual General Meeting of Sampo plc, held on 18 April 2013, decided to distribute a dividend of EUR 1.35 per share for 2012.
The Annual General Meeting elected eight members to the Board decreasing the number of the members by one. The following members were re-elected to the Board of Directors: Anne Brunila, Adine Grate Axén, Veli-Matti Mattila, Eira Palin-Lehtinen, Per Sørlie, Matti Vuoria and Björn Wahlroos. Of the old members Jukka Pekkarinen and Christoffer Taxell were not available for re-election. Jannica Fagerholm was elected as a new Board member.
At its organizational meeting, the Board elected Björn Wahlroos as Chairman and Matti Vuoria as Vice Chairman. The following members were elected to the Nomination and Compensation Committee: Veli-Matti Mattila, Eira Palin-Lehtinen, Matti Vuoria, and Björn Wahlroos (Chairman). Anne Brunila (Chairman), Jannica Fagerholm, Adine Grate Axén, and Per Sørlie were elected to the Audit Committee.
The Annual General Meeting decided to pay the following fees to the members of the Board of Directors until the close of the 2014 Annual General Meeting: the Chairman of the Board will be paid EUR 160,000 per year, the Vice Chairman EUR 100,000 per year and the other members EUR 80,000 per year. A Board member shall in accordance with the resolution of the Annual General Meeting acquire Sampo plc’s A shares at the price paid in public trading for 50 per cent of his/her annual fee excluding taxes and similar payments.
Ernst & Young Oy was elected as Auditor. The Auditor will be paid a fee determined by an invoice approved by Sampo. Heikki Ilkka, APA, will continue as the principally responsible auditor.
Personnel The number of full-time equivalent staff increased to 6,884 employees (6,820) as at 30 June 2013. In P&C insurance, the number of staff increased in Finland due to integration of Tryg’s Finnish P&C insurance operations. In other countries, the number of staff in P&C insurance decreased. In life insurance, the number of staff decreased both in Finland and in Baltic countries.
On 8 May 2013 If began a cooperation procedure in Finland involving 60 people in order to coordinate the acquired Tryg business with existing operations. The procedure was completed in late June 2013. As a result of the procedure, the number of employees decreased by 26. Dismissals were avoided in the process.
During January-June 2013, approximately 91 per cent of the staff worked in P&C insurance, 8 per cent in life insurance and 1 per cent in the Group’s parent company Sampo plc. Geographically, 33 per cent worked in Finland, 26 per cent in Sweden, 21 per cent in Norway and 19 per cent in the Baltic and other countries. The average number of employees during January-June 2013 was 6,827. A year earlier the corresponding figure was 6,833.
Sampo Group Interim Report Q2/2013
- 14 -
Other developments
Remuneration Remuneration in Sampo Group is based on the Remuneration Principles which Sampo plc’s Board approved on 9 November 2012. The core of the Remuneration Principles is that all remuneration systems in Sampo Group shall safeguard the financial stability of the Group and comply with regulatory and ethical standards. They shall also be designed to balance the interests of different stakeholder groups such as shareholders, employees, customers and supervisory authorities.
Variable compensation is based either on the contribution to the company’s profitability (e.g. short-term incentive programs) or linked to committing employees to the Group for a longer period of time (long-term incentive programs). During 2013 Sampo plc’s Board has not adopted new long-term incentive schemes.
In January - June 2013 no payments (0) were made on the basis of the long-term incentive schemes. EUR 34 million (30), including social costs, was paid as short-term incentives during the same period. At the end of June 2013 Sampo Group had provisioned EUR 45 million (23) for future payments of long-term incentive schemes.
The terms of the long-term incentive schemes are available at www.sampo.com/remuneration.
Shares and share capitalAs at 30 June 2013, Sampo plc had 560,000,000 shares, which were divided into 558,800,000 A shares and 1,200,000 B shares. Total number of votes attached to the shares is 564,800,000. Each A share entitles the holder to one vote and each B share entitles the holder to five votes at the General Meeting of Shareholders.
The Annual General Meeting of 18 April 2013 authorized the Board to acquire in one or several lots a maximum of 50,000,000 Sampo A shares. Shares can be repurchased in other proportion than the shareholders’ proportional shareholdings (private repurchase). The share price will be no higher than the highest price paid for Sampo shares in public trading at the time of purchase. The authorization will be valid until the close of the next Annual General Meeting, nevertheless not more than 18 months after AGM’s decision. Sampo plc didn’t repurchase its own shares during the first half of 2013 and held none of its own shares at the end of June 2013. The other Group companies held no shares in the parent company either.
Internal dividendsOn 25 April 2013 Mandatum Life paid a dividend of EUR 100 million and on 26 March 2013 Nordea Bank AB a dividend of 293 million to Sampo plc.
If P&C pays its dividend normally in the last quarter of the year.

Sampo Group Interim Report Q2/2013
- 15 -
Other developments
Ratings All the ratings for Sampo Group companies remained unchanged in the second quarter of 2013.
Rated company Moody’s Standard and Poor’s
Rating Outlook Rating Outlook
Sampo plc Baa2 Stable Not rated -
If P&C Insurance Ltd (Sweden) A2 Stable A Stable
If P&C Insurance Company Ltd (Finland) A2 Stable A Stable
Group solvency Sampo Group is regarded as a financial and insurance conglomerate according to the Act on the Supervision of Financial and Insurance Conglomerates (2004/699). Group solvency is calculated according to Chapter 3 of the Act on the Supervision of Financial and Insurance Conglomerates (2004/699). The Act is based on Directive 2002/87/EC of the European Parliament and of the Council on the supplementary supervision of credit institutions, insurance undertakings and investment.
Sampo Group solvency
EURm 30 June 2013 31 December 2012
Group capital 9,800 1 0,1 1 3Sectoral items 1,342 1,285Intangibles and other deductibles -2,754 -3,274Group's own funds, total 8,389 8,125Minimum requirements for own funds, total 4,682 4,767Group solvency 3,707 3,358Group solvency ratio(Own funds % of minimum requirements) 179.2 170.4
The Group’s solvency ratio (own funds in relation to minimum requirements for own funds) was 179.2 per cent (170.4) as at 30 June 2013. Nordea is treated as an associated company in the solvency calculation and the part of Nordea’s capital requirement corresponding to Sampo’s holding in Nordea is taken into account in the Group’s capital requirement.
In Sampo Group solvency is assessed internally by comparing the capital required to the capital available. Capital requirement assessment is based on an economic capital framework, in which Group companies quantify the amount of capital required for measurable risks over a one year time horizon at 99.5 per cent's confidence level. In addition to economic capital companies are assessing their capital need related to non-measurable risks like risks in business environment.

Sampo Group Interim Report Q2/2013
- 16 -
Other developments
Capital available or Adjusted Solvency Capital include regulatory capital and in addition other loss absorbing items like the effect of discounting technical reserves and other reserves excluded from regulatory capital.
The economic capital tied up in Group’s operations on 30 June 2013 was EUR 5,276 million (4,560) and adjusted solvency capital was EUR 9,039 million (8,197). The increase in the economic capital is due to Nordea recalibrating its EC calculations to reflect new increased capital targets in the first quarter of 2013.
Debt financingSampo plc’s debt financing on 30 June 2013 amounted to EUR 2,090 million (2,162) and interest bearing assets including bank accounts to EUR 521 million (1,048). During the first half of 2013 the net debt increased EUR 456 million to EUR 1,569 million (1,113). The increase was mainly due to the dividend of EUR 756 million Sampo plc paid in April 2013. Gross debt to Sampo plc’s equity was 33 per cent (32).
As at 30 June 2013 financial liabilities in Sampo plc’s balance sheet consisted of issued senior bonds and notes of EUR 1,783 million (1,710) and EUR 307 million (451) of outstanding CPs issued. The average interest on Sampo plc’s debt as of 30 June 2013 was 2.29 per cent (2.33).
On 28 May 2013 Sampo plc issued two senior unsecured floating rate notes of SEK 2,000 million maturing on 28 May 2015 and 29 May 2018, respectively. Simultaneously Sampo plc bought back SEK 3,391 million of SEK 4,000 million notes maturing 16.9.2013.
To balance the risks on the Group level Sampo plc’s debt is tied to short-term interest rates and issued in euro or Swedish krona. Interest rate swaps are used to obtain the desired characteristics for the debt portfolio. These derivatives are valued at fair value in the profit and loss account although economically they are related the underlying bonds. As a result Sampo plc maintains the flexibility to adjust derivative position if needed but this comes at the cost of increased volatility in the Holding segment’s net finance costs.
The underlying objective of Sampo plc is to maintain a well-diversified debt structure, relatively low leverage and strong liquidity in order for the company to be able to arrange financing for strategic projects if needed. Strong liquidity and the ability to acquire financing are essential factors in maintaining Sampo Group’s strategic flexibility.
On 20 June 2013 If P&C Insurance Company Ltd., the Finnish subsidiary of If P&C Insurance Holding Ltd (publ), issued a capital loan of EUR 90 million. The first call date for the floating rate perpetual capital loan is 26 November 2018.
More information on Sampo Group’s outstanding debt issues is available at www.sampo.com/debtfinancing.

Sampo Group Interim Report Q2/2013
- 17 -
Outlook for the rest of 2013
outlook for the rest of 2013
Sampo Group’s business areas are expected to report good operating results for 2013.
However, the mark-to-market results are, particularly in life insurance, highly dependent on capital market developments. The low interest rate level also creates a challenging environment for reinvestment in fixed income assets.
The P&C insurance operations are expected to reach their long-term combined ratio target of below 95 per cent in 2013 and achieve a combined ratio of 88–91 per cent. Nordea’s contribution to the Group’s profit is expected to be significant.
The major risks and uncertainties to the Group in the near termIn its day-to-day business activities Sampo Group is exposed to various risks. As a financial group the major sources of profitability and its variation for Sampo Group are market, credit and insurance risks. Their contributions to the Group’s Economic Capital - used as an internal basis for capital needs – currently represent normal levels of 32 per cent, 45 per cent and 12 per cent, respectively.
Major unforeseen events or abrupt structural changes in the business environment may impact the profitability of Sampo Group or they can affect Group’s ability to conduct its business activities. For example the continuing political and financial crises in Europe combined with slow growth may escalate in ways that can affect Group’s activities unfavourably. This is, however, mitigated by the fact that Sampo Group companies have no direct investment exposures in sovereigns under pressure and have small exposure to banking sector outside the Nordic region.
SAMPO PLC Board of Directors

Sampo Group Interim Report Q2/2013
- 18 -
Information
DISTRIBUTION: NASDAQ OMX Helsinki The principal media Financial Supervisory Authority www.sampo.com
For more information, please contact
Peter Johansson, Group CFO, tel. +358 10 516 0010
Jarmo Salonen, Head of Investor Relations and Group Communications, tel. +358 10 516 0030
Maria Silander, Press Officer, tel. +358 10 516 0031
Press Conference and Conference CallSampo will today arrange a Finnish-language press conference (Savoy, Eteläesplanadi 14, Helsinki), at 12.30 pm Finnish time.
An English-language conference call for investors and analysts will be arranged at 4 pm Finnish time (2 pm UK time).
Please call +44 (0)20 7162 0077 or +1 334 323 6201. Please be ready to state the ID number 934057 and title ‘Sampo’.
The conference call can also be followed live at www.sampo.com/result. A recorded version will later be available at the same address.
In addition a Supplementary Financial Information Package is available at www.sampo.com/result.
Interim Report for January–September 2013Sampo will publish the third quarter 2013 interim report on 5 November 2013.

Sampo Group Interim Report Q2/2013
- 19 -
Tables 30 June 2013
Group financial review
finanCial hiGhliGhts
Group 1–6/2013 1–6/2012Profit before taxes EURm 825 813Return on equity (at fair value) % 11.6 18.9Return on assets (at fair value) % 6.0 8.6Equity/assets ratio % 30.7 28.8Group solvency ¹) EURm 3,707 2,491Group solvency ratio % 179.2 151.0Average number of staff 6,827 6,833
property & Casualty insuranCePremiums written before reinsurers' share EURm 2,907 2,785Premiums earned EURm 2,255 2,120Profit before taxes EURm 473 452Return on equity (at current value) % 21.7 35.8Risk ratio ²) % 65.9 66.0Cost ratio ²) % 22.9 22.8Loss ratio, excl. unwinding of discounting ²) % 72.0 72.2Expense ratio ²) % 16.7 16.7Combined ratio, excl. unwinding of discounting % 88.8 88.8Average number of staff 6,218 6,243
life insuranCePremiums written before reinsurers' share EURm 553 498Profit before taxes EURm 69 65Return on equity (at current value) % 4.6 23.0Expense ratio % 113.7 117.5Average number of staff 557 536
holdinGProfit before taxes EURm 285 297Average number of staff 52 54
per share key fiGuresEarnings per share EUR 1.27 1.24Earnings per share, incl. other comprehensive income EUR 1.03 1.51Capital and reserves per share EUR 17.50 16.04Net asset value per share EUR 19.27 15.23Adjusted share price, high EUR 32.18 22.19Adjusted share price, low EUR 25.04 17.91Market capitalisation EURm 16,766 11,738
¹) The Group solvency is calculated according to the consolidation method defined in Chapter 3 of the Act on the Supervision of Financial and Insurance Conglomerates (2004/699).
²) The key figures for P&C Insurance are based on activity based costs and cannot, therefore, be calculated directly from the consolidated income statement. The result analysis of P&C insurance is presented in note 13.
The number of shares used at the balance sheet date and as the average number during the financial period was 560,000,000.
The valuation differences on investment property have been taken into account in calculating the return on assets, return on equity, equity/assets ratio and net asset value per share. The tax component includes the tax corresponding to the result for the period, and the deferred tax liability related to valuation differences on investment property.
The total comprehensive income has been used in the calculation of the return on assets and return on equity.
The key figures for the insurance business have been calculated in accordance with the decree issued by the Ministry of Finance and the specifying regulations and instructions of the Finance Supervisory Authority.

Sampo Group Interim Report Q2/2013
- 20 -
Tables 30 June 2013
Calculation of key figures
Return on equity (fair values), % + total comprehensive income
valuation differences on investments less deferred tax x 100 %
+ total equity valuation differences on investments less deferred tax
(average of values 1 Jan. and the end of reporting period) Return on assets (at fair values), % + operating profit
other comprehensive income before taxes+ interest and other financial expense + calculated interest on technical provisions
change in valuation differences on investments x 100 %
+ balance sheet, total – technical provisions relating to unit-linked insurance
valuation differences on investments (average of values on 1 Jan. and the end of the reporting period) Equity/assets ratio (at fair values), % + total equity
valuation differences on investments after deduction of deferred tax x 100 %+ balance sheet total
valuation differences on investments Risk ratio for P&C Insurance, % + claims incurred – claims settlement expenses
x 100 %
insurance premiums earned Cost ratio for P&C Insurance, % + operating expenses + claims settlement expenses
x 100 % insurance premiums earned Loss ratio for P&C Insurance, % claims incurred
x 100 % insurance premiums earned Expense ratio for P&C Insurance, % operating expenses
x 100 % insurance premiums earned
Combined ratio for P&C Insurance, % Loss ratio + expense ratio
Expense ratio for life insurance, % + operating expenses before change in deferred acquisition costs + claims settlement expenses x 100 % expense charges
Sampo Group Interim Report Q2/2013
- 21 -
Tables 30 June 2013
per share key fiGures
Earnings per share profit for the financial period attributable to the parent company’s equity holders adjusted average number of shares
Equity per share equity attributable to the parent company’s equity holders adjusted number of shares at the balance sheet date
Net asset value per share+ equity attributable to the parent company’s equity holders
valuation differences on listed associates in the Group valuation differences after the deduction of deferred taxes
adjusted number of shares at balance sheet date
Market capitalisation number of shares at the balance sheet date x closing share price at the balance sheet date

Sampo Group Interim Report Q2/2013
- 22 -
Tables 30 June 2013
Group quarterly comprehensive income statement
EURm 4–6/2013 1–3/2013 10–12/2012 7–9/2012 4–6/2012
Insurance premiums written 1,364 1,922 1,240 1,092 1,236Net income from investments 87 282 205 308 74Other operating income 6 9 10 8 7
Claims incurred -904 -968 -872 -898 -831Change in liabilities for insurance and investment contracts
21 -719 -37 31 71
Staff costs -161 -164 -129 -164 -141Other operating expenses -134 -137 -174 -130 -138
Finance costs 1 -34 -4 -26 -16Share of associates' profit/loss 174 179 201 148 181
Profit for the period before taxes 455 370 439 370 444
Taxes -66 -50 -42 -55 -68
Profit for the period 390 320 397 315 375
Other comprehensive income for the period
Items reclassifiable to profit or lossExchange differences on translating foreign operations
-118 30 -48 67 12
Available-for-sale financial assets -178 127 71 257 -227Cash flow hedges 0 0 0 0 0Share of other comprehensive income of associates
-56 12 -17 11 -3
Taxes 42 -30 -3 -65 56Total items reclassifiable to profit or loss, net of tax -311 139 4 270 -162
Items not reclassifiable to profit or lossActuarial gains and losses from defined pension plans
12 41 87 -8 -36
Taxes -3 -10 -25 2 10Total items not reclassifiable to profit or loss, net of tax 10 31 62 -6 -26
TOTAL COMPREHENSIVE INCOME FOR THE PERIOD 88 490 462 580 187
Profit attributable to Owners of the parent 390 320 397 315 375 Non-controlling interests - - - - 0Total comprehensive income attributable to Owners of the parent 88 490 462 580 187 Non-controlling interests - - - - 0

Sampo Group Interim Report Q2/2013
- 23 -
Tables 30 June 2013
Consolidated comprehensive income statement, IFRS
EURm Note 1–6/2013 1–6/2012
Insurance premiums written 1 3,286 3,081Net income from investments 2 370 454Other operating income 15 17
Claims incurred 3 -1,872 -1,771Change in liabilities for insurance and investment contracts -698 -714Staff costs 4 -325 -288Other operating expenses -271 -272
Finance costs -32 -45Share of associates' profit/loss 353 351
Profit before taxes 825 813
Taxes -115 -117
Profit for the period 710 696
Other comprehensive income for the period
Items reclassifiable to profit or lossExchange differences -87 27Available-for-sale financial assets -51 180Cash flow hedges 0 -1Share of other comprehensive income of associates -44 15Taxes 12 -46Total items reclassifiable to profit or loss, net of tax -171 175
Items not reclassifiable to profit or lossActuarial gains and losses from defined pension plans 53 -35Taxes -13 10Total items not reclassifiable to profit or loss, net of tax 40 -25
TOTAL COMPREHENSIVE INCOME FOR THE PERIOD 579 846
Profit attributable to Owners of the parent 710 321 Non-controlling interests - 0
Total comprehensive income attributable to Owners of the parent 579 846 Non-controlling interests - 0
Basic earnings per share (eur) 1.27 1.24

Sampo Group Interim Report Q2/2013
- 24 -
Tables 30 June 2013
Consolidated balance sheet, IFRS
EURm Note 6/2013 12/2012
Assets
Property, plant and equipment 27 26
Investment property 124 122
Intangible assets 5 758 771
Investments in associates 6,999 7,049
Financial assets6, 7, 8, 9, 10
16,573 16,857
Investments related to unit-linked insurance contracts 11 4,158 3,833
Tax assets 60 78
Reinsurers' share of insurance liabilities 554 580
Other assets 1,888 1,729
Cash and cash equivalents 854 1,034
Total assets 31,995 32,079
Liabilities
Liabilities for insurance and investment contracts 12 14,189 13,925
Liabilities for unit-linked insurance and investment contracts 13 4,133 3,832
Financial liabilities 14 2,269 2,378
Tax liabilities 499 542
Provisions 52 56
Employee benefits 136 203
Other liabilities 918 1,123
Total liabilities 22,195 22,059
Equity
Share capital 98 98
Reserves 1,531 1,531
Retained earnings 7,444 7,494
Other components of equity 727 898
Equity attributable to owners of the parent 9,800 10,020
Non-controlling interests - -
Total equity 9,800 10,020
Total equity and liabilities 31,995 32,079
Sampo Group Interim Report Q2/2013
- 25 -
Tables 30 June 2013
Statement of changes in equity, IFRS
EURmShare
capital
Share premium account
Legal reserve
Invested unrest-
ricted equity
Retained earnings
Trans- lation
of foreignope-
rations 1)
Available-for-sale
financial assets
2)
Cash flow
hedges 3) Total
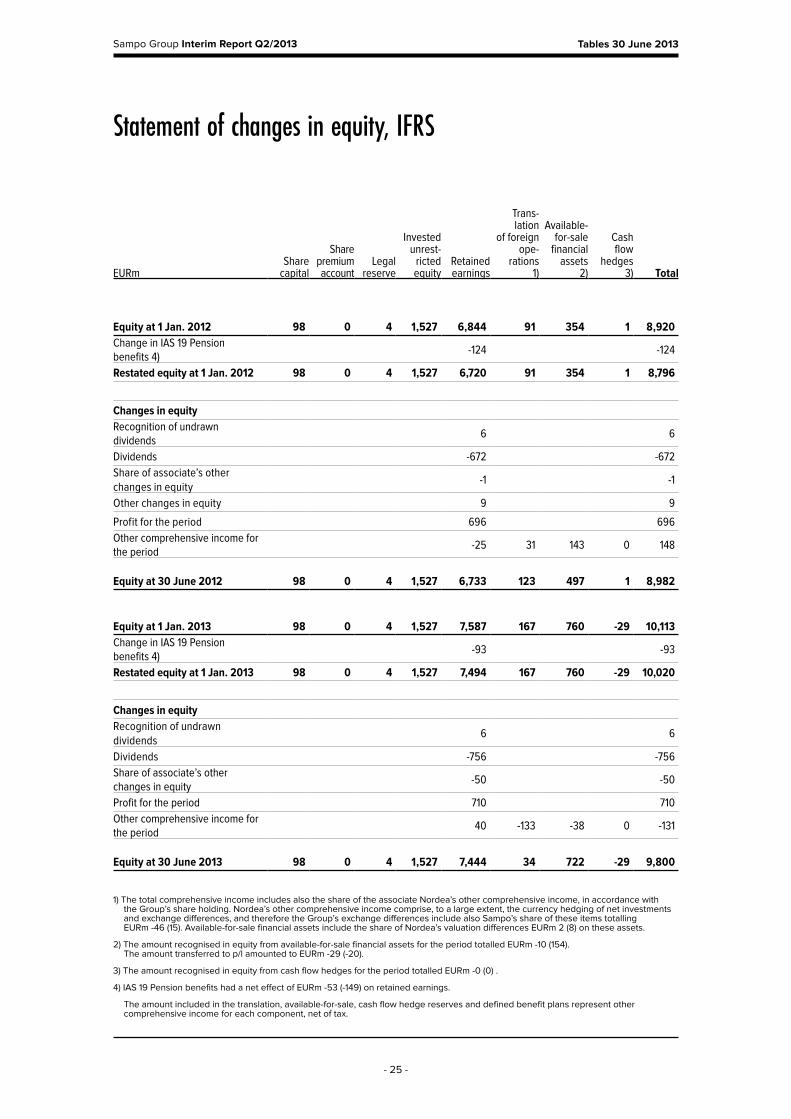
Equity at 1 Jan. 2012 98 0 4 1,527 6,844 91 354 1 8,920Change in IAS 19 Pension benefits 4)
-124 -124
Restated equity at 1 Jan. 2012 98 0 4 1,527 6,720 91 354 1 8,796
Changes in equityRecognition of undrawn dividends
6 6
Dividends -672 -672Share of associate’s other changes in equity
-1 -1
Other changes in equity 9 9
Profit for the period 696 696Other comprehensive income for the period
-25 31 143 0 148
Equity at 30 June 2012 98 0 4 1,527 6,733 123 497 1 8,982
Equity at 1 Jan. 2013 98 0 4 1,527 7,587 167 760 -29 10,113Change in IAS 19 Pension benefits 4)
-93 -93
Restated equity at 1 Jan. 2013 98 0 4 1,527 7,494 167 760 -29 10,020
Changes in equityRecognition of undrawn dividends
6 6
Dividends -756 -756Share of associate’s other changes in equity
-50 -50
Profit for the period 710 710Other comprehensive income for the period
40 -133 -38 0 -131
Equity at 30 June 2013 98 0 4 1,527 7,444 34 722 -29 9,800
1) The total comprehensive income includes also the share of the associate Nordea’s other comprehensive income, in accordance with the Group’s share holding. Nordea’s other comprehensive income comprise, to a large extent, the currency hedging of net investments and exchange differences, and therefore the Group’s exchange differences include also Sampo’s share of these items totalling EURm -46 (15). Available-for-sale financial assets include the share of Nordea’s valuation differences EURm 2 (8) on these assets.
2) The amount recognised in equity from available-for-sale financial assets for the period totalled EURm -10 (154). The amount transferred to p/l amounted to EURm -29 (-20).
3) The amount recognised in equity from cash flow hedges for the period totalled EURm -0 (0) .
4) IAS 19 Pension benefits had a net effect of EURm -53 (-149) on retained earnings.
The amount included in the translation, available-for-sale, cash flow hedge reserves and defined benefit plans represent other comprehensive income for each component, net of tax.

Sampo Group Interim Report Q2/2013
- 26 -
Tables 30 June 2013
Statement of cash flows, IFRS
EURm 1–6/2013 1–6/2012
Cash and cash equivalent at the beginning of the period 1,034 572
Cash flow from/used in operating activities 315 392
Cash flow from/used in investing activities 302 219
Cash flow from/used in financing activities -783 -696
Dividends paid -746 -664
Increase of liabilities 865 1,598
Decrease of liabilities -902 -1,631
Cash and cash equivalent at the end of the period 868 487
The cash flow statement reports cash flows during the period classified by operating, investing and financing activities. Cash flows from operating activities derive primarily from the principal revenue-producing activities. Cash flows from investments in subsidiaries and associated undertakings and those from investments in intangible assets and property, plant and equipment are presented in investing activities. Financing activities include cash flows resulting from changes in equity and borrowings in order to conduct the business. Cash and cash equivalents consist of cash at bank and in hand and short-term deposits (under 3 months).
Sampo Group Interim Report Q2/2013
- 27 -
Tables 30 June 2013
Notes
aCCountinG poliCies Sampo Group’s consolidated financial statements are prepared in accordance with the International Financial Reporting Standards (IFRS) adopted by the EU. The interim financial statements are presented in accordance with IAS 34 Interim Financial Reporting. In preparing the interim financial statements, the same accounting policies and methods of computation are applied as in the financial statements for 2012.
Sampo adopted new or revised standards and interpretations at the beginning of the year 2013. These standards and interpretations are explained in Sampos accounting policies for the financial year 2012. The financial statements are available on Sampo’s website at www.sampo.com/annualreport.
One of the adopted changes was in IAS 19 Employee Benefits that amends all actuarial gains and losses be recognised immediately in other comprehensive income, thus the so-called corridor method is eliminated and the benefit cost is determined based on the net funding. As a result of the change, the employee benefit liability for the comparison year was increased by EURm 127 and the related deferred tax asset by EURm 34. The net effect on the equity was EURm 93.

Sampo Group Interim Report Q2/2013
- 28 -
Tables 30 June 2013
Comprehensive income statement by segment for six months ended 30 June 2013
EURm P&C insurance Life insurance Holding Elimination Group
Insurance premius written 2,737 549 - 0 3,286Net income from investments 198 176 6 -11 370Other operating income 14 2 8 -9 15
Claims incurred -1,486 -386 - - -1,872Change in liabilities for insurance and investment contracts
-482 -216 - 0 -698
Staff costs -289 -24 -12 - -325Other operating expenses -243 -30 -6 9 -271
Finance costs -8 -4 -29 9 -32Share of associates' profit/loss 33 1 319 - 353
Profit before taxes 473 69 285 -2 825
Taxes -102 -14 0 1 -115
Profit for the period 371 55 286 -2 710
Other comprehensive income for the period
Items reclassifiable to profit or lossExchange differences -87 0 - - -87Available-for-sale financial assets -16 -39 5 -2 -51Cash flow hedges - 0 - - 0Share of other comprehensive income of associates
- - -44 - -44
Taxes 3 10 -1 0 12Total items reclassifiable to profit or loss, net of tax -100 -30 -40 -2 -171
Items not reclassifiable to profit or lossActuarial gains and losses from defined pension plans
53 - - - 53
Taxes -13 - - - -13Total items not reclassifiable to profit or loss, net of tax 40 - - - 40
TOTAL COMPREHENSIVE INCOME FOR THE PERIOD 312 25 245 -3 579
Profit attributable to Owners of the parent 710 Non-controlling interests -
Total comprehensive income attributable to Owners of the parent 579 Non-controlling interests -

Sampo Group Interim Report Q2/2013
- 29 -
Tables 30 June 2013
Comprehensive income statement by segment for six months ended 30 June 2012
EURm P&C insurance Life insurance Holding Elimination Group
Insurance premius written 2,593 493 - -5 3,081Net income from investments 200 244 18 -7 454Other operating income 17 2 7 -9 17
Claims incurred -1,400 -371 - - -1,771Change in liabilities for insurance and investment contracts
-473 -246 - 5 -714
Staff costs -259 -21 -8 - -288Other operating expenses -242 -31 -8 9 -272
Finance costs -9 -4 -38 7 -45Share of associates' profit/loss 25 0 326 - 351
Profit before taxes 452 65 297 0 813
Taxes -104 -14 0 0 -117
Profit for the period 348 51 297 0 696
Other comprehensive income for the period
Items reclassifiable to profit or lossExchange differences 27 0 - - 27Available-for-sale financial assets 113 73 0 -5 180Cash flow hedges - -1 - - -1Share of other comprehensive income of associates
- - 15 - 15
Taxes -29 -18 0 0 -46Total items not reclassifiable to profit or loss, net of tax 111 54 15 -5 175
Items not reclassifiable to profit or lossActuarial gains and losses from defined pension plans
-35 - - - -35
Taxes 10 - - - 10Total items not reclassifiable to profit or loss, net of tax -25 - - - -25
TOTAL COMPREHENSIVE INCOME FOR THE PERIOD 434 105 311 -5 846
Profit attributable to Owners of the parent 696 Non-controlling interests 0
Total comprehensive income attributable to Owners of the parent 846 Non-controlling interests 0
Sampo Group Interim Report Q2/2013
- 30 -
Tables 30 June 2013
Consolidated balance sheet by segment at 30 June 2013
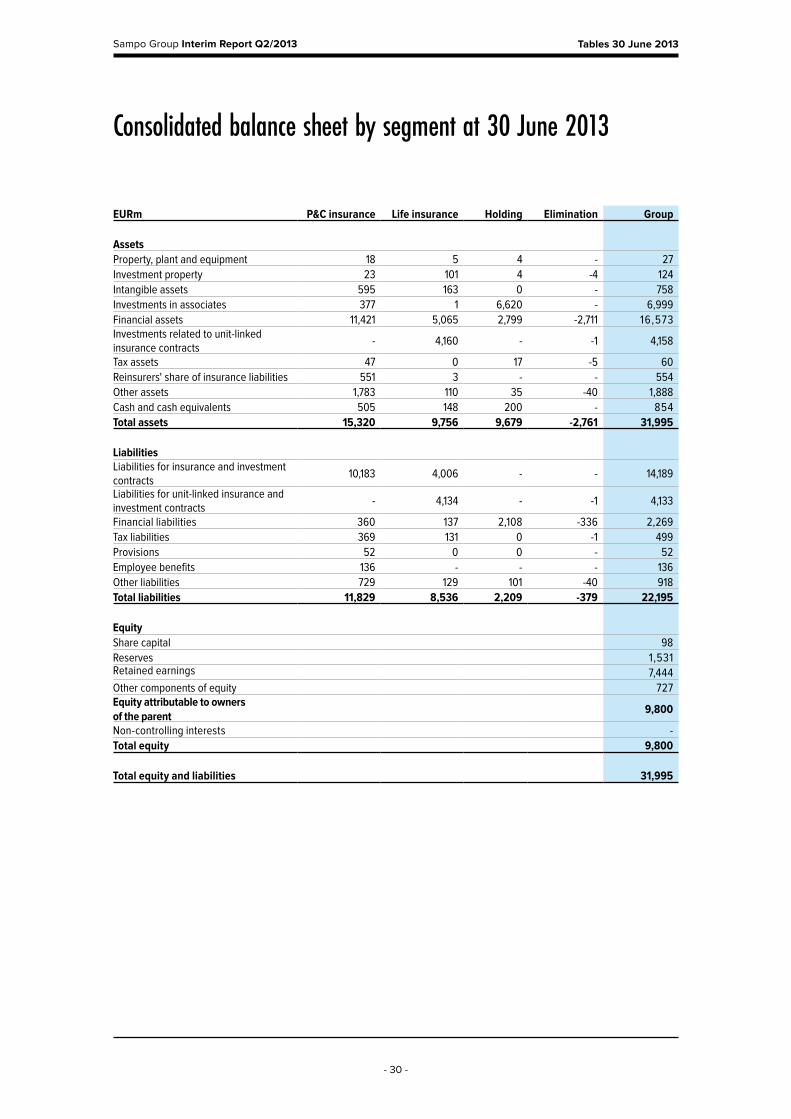
EURm P&C insurance Life insurance Holding Elimination Group
AssetsProperty, plant and equipment 18 5 4 - 27Investment property 23 101 4 -4 124Intangible assets 595 163 0 - 758Investments in associates 377 1 6,620 - 6,999Financial assets 11,421 5,065 2,799 -2,711 16,573Investments related to unit-linked insurance contracts
- 4,160 - -1 4,158
Tax assets 47 0 17 -5 60Reinsurers' share of insurance liabilities 551 3 - - 554Other assets 1,783 110 35 -40 1,888Cash and cash equivalents 505 148 200 - 854Total assets 15,320 9,756 9,679 -2,761 31,995
LiabilitiesLiabilities for insurance and investment contracts
10,183 4,006 - - 14,189
Liabilities for unit-linked insurance and investment contracts
- 4,134 - -1 4,133
Financial liabilities 360 137 2,108 -336 2,269Tax liabilities 369 131 0 -1 499Provisions 52 0 0 - 52Employee benefits 136 - - - 136Other liabilities 729 129 101 -40 918Total liabilities 11,829 8,536 2,209 -379 22,195
EquityShare capital 98Reserves 1,531Retained earnings 7,444Other components of equity 727Equity attributable to owners of the parent
9,800
Non-controlling interests -Total equity 9,800
Total equity and liabilities 31,995

Sampo Group Interim Report Q2/2013
- 31 -
Tables 30 June 2013
Consolidated balance sheet by segment at 31 December 2012
EURm P&C insurance Life insurance Holding Elimination Group
AssetsProperty, plant and equipment 16 5 4 - 26Investment property 27 95 4 -4 122Intangible assets 606 164 0 - 771Investments in associates 362 0 6,687 - 7,049Financial assets 11,200 5,269 3,028 -2,641 16,857Investments related to unit-linked insurance contracts
- 3,834 - -1 3,833
Tax assets 65 0 18 -5 78Reinsurers' share of insurance liabilities 577 3 - - 580Other assets 1,592 109 41 -13 1,729Cash and cash equivalents 407 154 473 - 1,034Total assets 14,852 9,635 10,256 -2,663 32,079
LiabilitiesLiabilities for insurance and investment contracts
9,854 4,071 - - 13,925
Liabilities for unit-linked insurance and investment contracts
- 3,833 - -1 3,832
Financial liabilities 362 105 2,181 -270 2,378Tax liabilities 389 153 - 0 542Provisions 56 - - - 56Employee benefits 203 - - - 203Other liabilities 807 177 152 -13 1 ,1 2 3Total liabilities 11,671 8,340 2,333 -284 22,059
EquityShare capital 98Reserves 1,531Retained earnings 7,494Other components of equity 898Equity attributable to owners of the parent
10,020
Non-controlling interests -Total equity 10,020
Total equity and liabilities 32,079

Sampo Group Interim Report Q2/2013
- 32 -
Tables 30 June 2013
OTHER NOTES, EURm
1 Insurance premiums
P&C insurance 1–6/2013 1–6/2012
Premiums from insurance contractsPremiums written, direct insurance 2,836 2,711Premiums written, assumed reinsurance 71 75Premiums written, gross 2,907 2,785Ceded reinsurance premiums written -171 -192P&C insurance, total 2,737 2,593
Change in unearned premium provision -540 -529Reinsurers' share 58 56Premiums earned for P&C insurance, total 2,255 2,120
Life insurance 1–6/2013 1–6/2012
Premiums from insurance contractsPremiums from contracts with discretionary participation feature 89 103Premiums from unit-linked contracts 242 186Premiums from other contracts 1 1Insurance contracts, total 331 289Assumed reinsurance 2 1Premiums from investment contractsPremiums from contracts with discretionary participation feature 0 0Premiums from unit-linked contracts 219 208Investment contracts, total 219 208Reinsurers' shares -3 -5Life insurance, total 549 493
Single and regular premiums from direct insuranceRegular premiums, insurance contracts 231 216Single premiums, insurance contracts 100 73Single premiums, investment contracts 219 208Total 551 497
Elimination items between segments 0 -5
Group, total 3,286 3,081

Sampo Group Interim Report Q2/2013
- 33 -
Tables 30 June 2013
2 Net income from investments >
P&C insurance 1–6/2013 1–6/2012
Financial assetsDerivative financial instruments -4 -4
Financial assets designated as at fair value through p/l Debt securities 0 4 Equity securities 6 1Total 6 5
Loans and receivables 11 9
Financial asset available-for-sale Debt securities 161 204 Equity securities 59 23Total 220 226
Total financial assets 234 237
Income from other assets 0 0
Fee and commission expense -6 -6
Expense on other than financial liabilities -2 -2
Effect of discounting annuities -28 -29
P&C insurance, total 198 200

Sampo Group Interim Report Q2/2013
- 34 -
Tables 30 June 2013
> 2 Net income from investments >
Life insurance 1–6/2013 1–6/2012
Financial assetsDerivative financial instruments -7 4
Financial assets designated as at fair value through p/l Debt securities 0 0 Equity securities 0 0Total 0 0
Investments related to unit-linked contracts Debt securities 0 33 Equity securities 22 81 Loans and receivables 0 1 Other financial assets 10 -27Total 31 88
Loans and receivables -1 2
Financial asset available-for-sale Debt securities 71 91 Equity securities 77 52Total 148 143
Total income from financial assets 172 237
Other assets 0 3
Fee and commission income, net 5 4
Life insurance, total 176 244

Sampo Group Interim Report Q2/2013
- 35 -
Tables 30 June 2013
> 2 Net income from investments
Holding 1–6/2013 1–6/2012
Financial assetsDerivative financial instruments 0 1
Loans and other receivables -1 0
Financial assets available-for-sale Debt securities 7 15 Equity securities 1 1Total 7 17
Other assets 0 0
Fee income, net 0 1
Holding, total 6 18
Elimination items between segments -11 -7
Group, total 370 454

Sampo Group Interim Report Q2/2013
- 36 -
Tables 30 June 2013
3 Claims incurred
P&C insurance 1–6/2013 1–6/2012
Claims paid -1,566 -1,549
Reinsurers' share 111 54
Claims paid, net -1,455 -1,495
Change in provision for claims outstanding 39 9
Reinsurers' share -71 87
P&C insurance total -1,486 -1,400
Life insurance 1–6/2013 1–6/2012
Claims paid -369 -351
Reinsurers' share 3 4
Claims paid, net -366 -347
Change in provision for claims outstanding -20 -24
Reinsurers' share 0 0
Life insurance, total -386 -371
Group, total -1,872 -1,771
Sampo Group Interim Report Q2/2013
- 37 -
Tables 30 June 2013
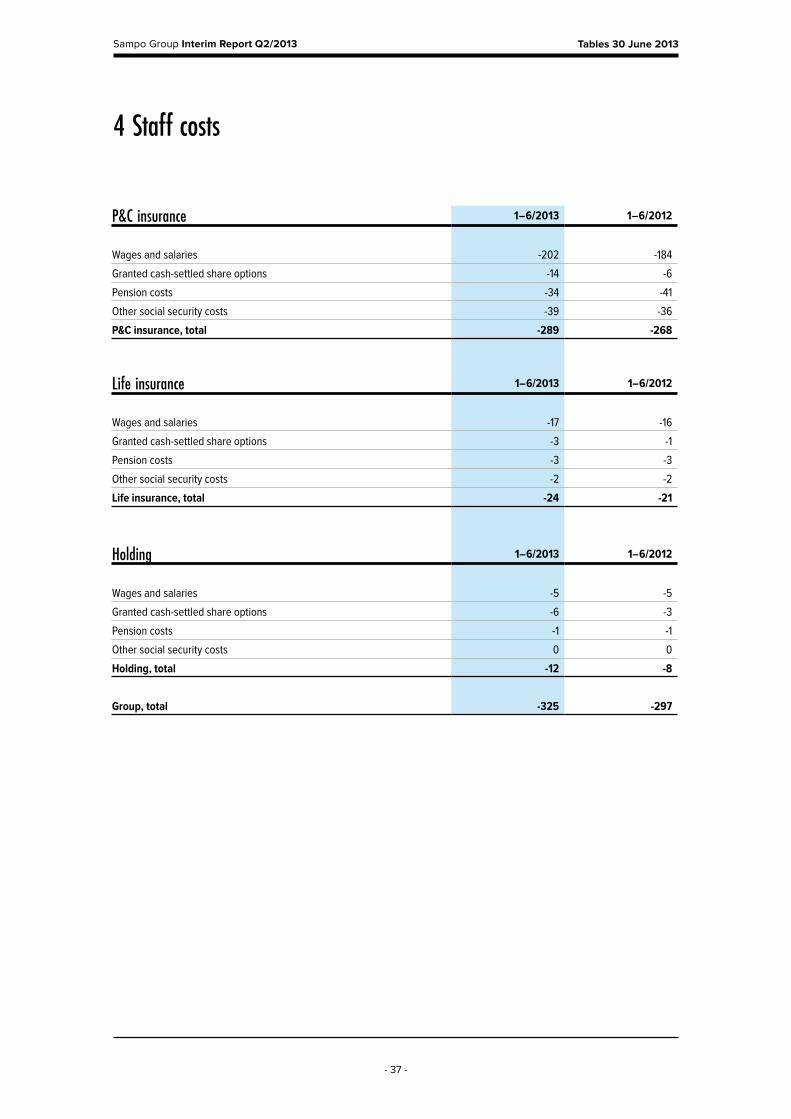
4 Staff costs
P&C insurance 1–6/2013 1–6/2012
Wages and salaries -202 -184
Granted cash-settled share options -14 -6
Pension costs -34 -41
Other social security costs -39 -36
P&C insurance, total -289 -268
Life insurance 1–6/2013 1–6/2012
Wages and salaries -17 -16
Granted cash-settled share options -3 -1
Pension costs -3 -3
Other social security costs -2 -2
Life insurance, total -24 -21
Holding 1–6/2013 1–6/2012
Wages and salaries -5 -5
Granted cash-settled share options -6 -3
Pension costs -1 -1
Other social security costs 0 0
Holding, total -12 -8
Group, total -325 -297
Sampo Group Interim Report Q2/2013
- 38 -
Tables 30 June 2013
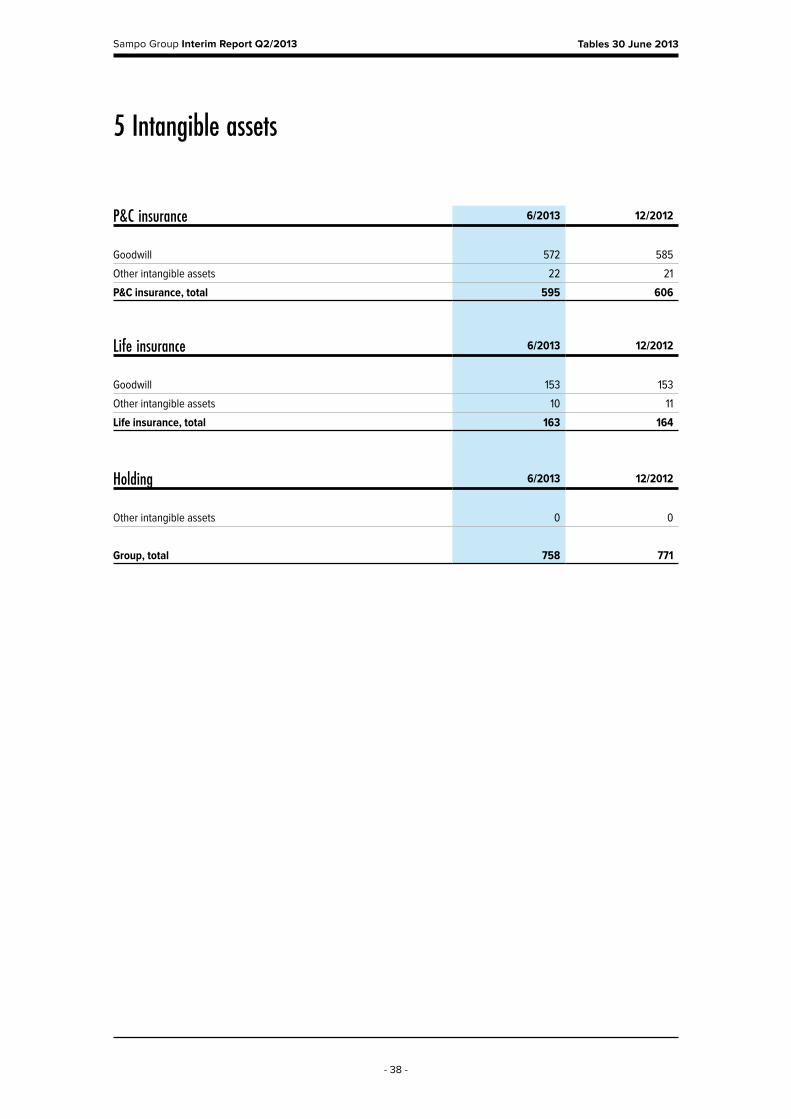
5 Intangible assets
P&C insurance 6/2013 12/2012
Goodwill 572 585
Other intangible assets 22 21
P&C insurance, total 595 606
Life insurance 6/2013 12/2012
Goodwill 153 153
Other intangible assets 10 11
Life insurance, total 163 164
Holding 6/2013 12/2012
Other intangible assets 0 0
Group, total 758 771

Sampo Group Interim Report Q2/2013
- 39 -
Tables 30 June 2013
6 Financial assets >
P&C insurance 6/2013 12/2012
Derivative financial instruments (Note 7) 19 49
Financial assets designated as at fair value through p/l
Debt securities 4 19
Equity securities 3 2
Total 6 22
Loans and receivables
Loans 195 83
Deposits with ceding undertakings 1 1
Total 197 85
Financial assets available-for-sale
Debt securities 9,917 9,675
Equity securities 1,283 1,370
Total 11,199 11,045
P&C insurance, total 11,421 11,200
Life insurance 6/2013 12/2012
Derivative financial instruments (Note 7) 24 60
Financial assets designated as at fair value through p/l
Debt securities 45 47
Equity securities 1 1
Total 47 48
Loans and receivables
Loans 20 22
Deposits with ceding undertakings 1 1
Total 21 23
Financial assets available-for-sale
Debt securities 2,722 2,786
Equity securities *) 2,251 2,353
Total 4,973 5,138
Life insurance, total 5,065 5,269
*) of which investments in fixed income funds 158 204
Sampo Group Interim Report Q2/2013
- 40 -
Tables 30 June 2013
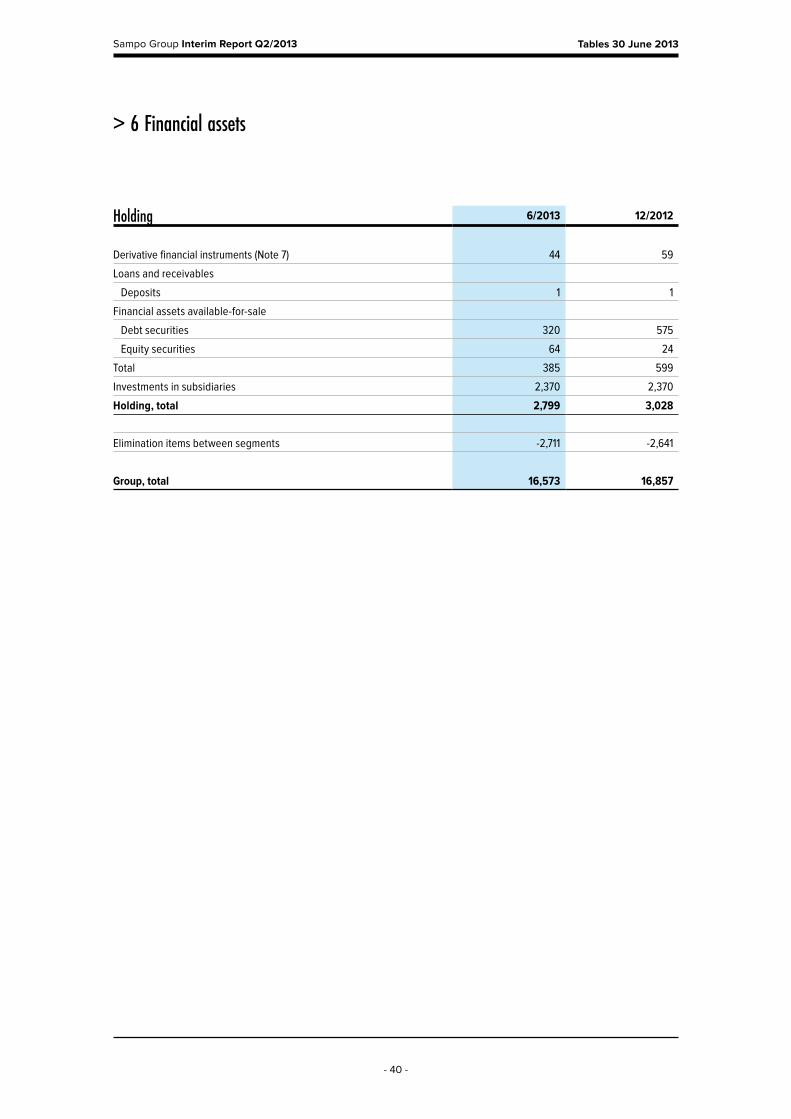
> 6 Financial assets
Holding 6/2013 12/2012
Derivative financial instruments (Note 7) 44 59
Loans and receivables
Deposits 1 1
Financial assets available-for-sale
Debt securities 320 575
Equity securities 64 24
Total 385 599
Investments in subsidiaries 2,370 2,370
Holding, total 2,799 3,028
Elimination items between segments -2,711 -2,641
Group, total 16,573 16,857

Sampo Group Interim Report Q2/2013
- 41 -
Tables 30 June 2013
7 Derivative financial instruments
6/2013 12/2012
P&C insurance Fair value Fair value Fair value Fair value
Contract/ notional amount
Assets LiabilitiesContract/
notional amount
Assets Liabilities
Derivatives held for trading
Interest rate derivatives 933 1 6 213 2 1
Foreign exchange derivatives 2,066 18 5 2,173 38 36
Equity derivatives 0 0 - 0 0 -
Total 3,000 19 12 2,386 40 37
Derivatives held for hedging
Fair value hedges - - - 372 9 1
P&C Insurance, total 3,000 19 12 2,759 49 38
6/2013 12/2012
Life insurance Fair value Fair value Fair value Fair value
Contract/ notional amount
Assets LiabilitiesContract/
notional amount
Assets Liabilities
Derivatives held for trading
Interest rate derivatives 5,378 21 12 778 19 2
Credit risk derivatives 535 - 2 531 - 2
Foreign exchange derivatives 917 3 15 1,248 17 2
Total 6,830 24 29 2,556 37 5
Derivatives held for hedging
Cash flow hedges 9 0 0 9 0 -
Fair value hedges 564 0 8 575 23 -
Total 573 0 8 584 23 0
Life insurance, total 7,403 24 37 3,141 60 5
6/2013 12/2012
Holding Fair value Fair value Fair value Fair value
Contract/ notional amount
Assets LiabilitiesContract/
notional amount
Assets Liabilities
Derivatives held for trading
Interest rate derivatives 800 28 - 800 42 -
Credit risk derivatives 20 0 - 20 1 -
Foreign exchange derivatives 58 0 0 5 - 0
Equity derivatives 93 16 18 90 16 19
Holding, total 971 44 19 915 59 19

Sampo Group Interim Report Q2/2013
- 42 -
Tables 30 June 2013
8 Determination and hierarchy of fair values >
Financial assets 30.6.2013 Level 1 Level 2 Level 3 Total
Derivative financial instruments
Interest rate swaps 0 49 - 49
Other interest derivatives - 0 - 0
Foreign exchange derivatives - 22 - 22
Equity derivatives - 16 - 16
Total 0 86 - 87
Financial assets designated at fair value through profit or lossEquity securities 1 - 0 1
Debt securities - 49 0 49
Total 1 49 0 51
Financial assets related to unit-linked insurance
Equity securities 271 1 14 286
Debt securities 7 953 19 979
Derivative financial instruments 1,911 721 61 2,694
Mutual funds -1 14 - 13
Total 2,187 1,690 94 3,971
Financial assets available-for-sale
Equity securities 1,475 0 74 1,549
Debt securities 993 11,582 42 12,617
Mutual funds 1 ,1 3 5 113 803 2,052
Total 3,604 11,695 919 16,218
Total financial assests measured at fair value 5,792 13,520 1,014 20,326
A large majority of Sampo Group’s financial assets are valued at fair value. The valuation is based on either published price quatations or valuation techniques based on market observable inputs, where available. For a limited amount of assets the value needs to be determined using other techniques.
The financial instruments measured at fair value have been classified into three hierarchy levels in the notes, depending on e.g. if the market for the instrument is active, or if the inputs used in the valuation technique are observable.
On level 1, the measurement of the instrument is based on quoted prices in active markets for identical assets or liabilities.
On level 2, inputs for the measurement of the instrument include also other than quoted prices observable for the asset or liability, either directly or indirectly by using valuation techniques.
In level 3, the measurement is based on other inputs rather than observable market data.
Sampo Group Interim Report Q2/2013
- 43 -
Tables 30 June 2013
> 8 Determination and hierarchy of fair values >
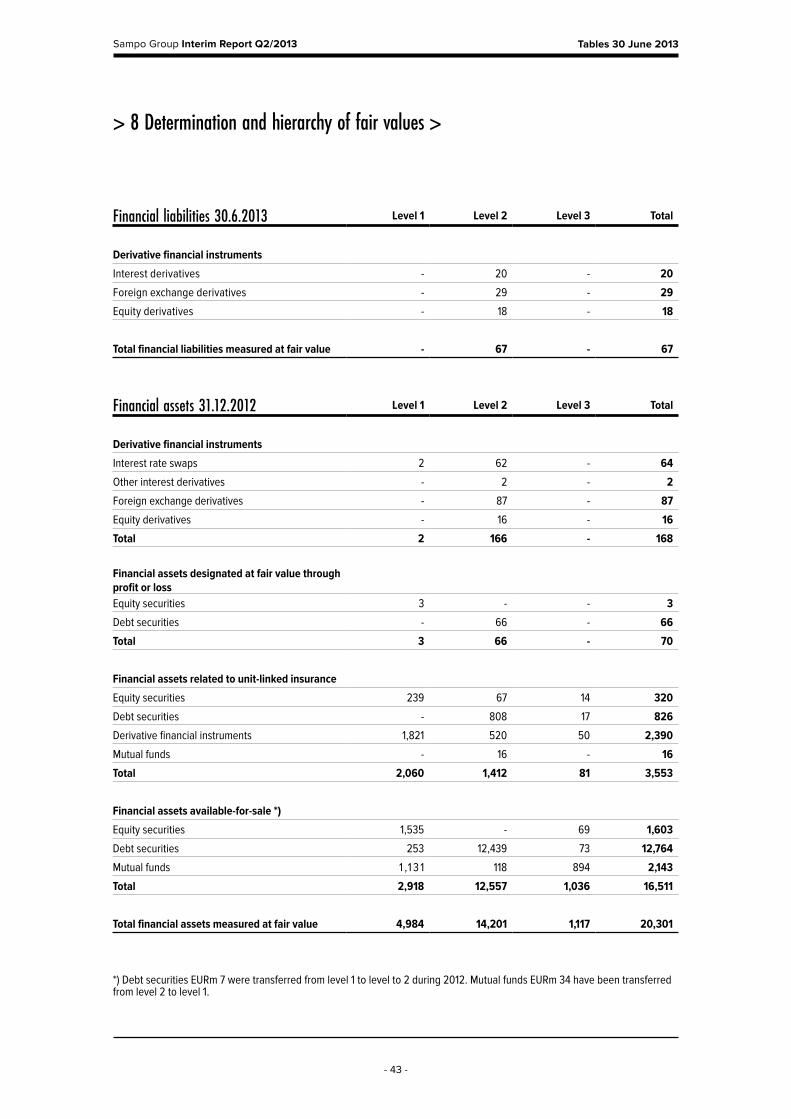
Financial liabilities 30.6.2013 Level 1 Level 2 Level 3 Total
Derivative financial instruments
Interest derivatives - 20 - 20
Foreign exchange derivatives - 29 - 29
Equity derivatives - 18 - 18
Total financial liabilities measured at fair value - 67 - 67
Financial assets 31.12.2012 Level 1 Level 2 Level 3 Total
Derivative financial instruments
Interest rate swaps 2 62 - 64
Other interest derivatives - 2 - 2
Foreign exchange derivatives - 87 - 87
Equity derivatives - 16 - 16
Total 2 166 - 168
Financial assets designated at fair value through profit or lossEquity securities 3 - - 3
Debt securities - 66 - 66
Total 3 66 - 70
Financial assets related to unit-linked insurance
Equity securities 239 67 14 320
Debt securities - 808 17 826
Derivative financial instruments 1,821 520 50 2,390
Mutual funds - 16 - 16
Total 2,060 1,412 81 3,553
Financial assets available-for-sale *)
Equity securities 1,535 - 69 1,603
Debt securities 253 12,439 73 12,764
Mutual funds 1 ,1 3 1 118 894 2,143
Total 2,918 12,557 1,036 16,511
Total financial assets measured at fair value 4,984 14,201 1,117 20,301
*) Debt securities EURm 7 were transferred from level 1 to level to 2 during 2012. Mutual funds EURm 34 have been transferred from level 2 to level 1.

Sampo Group Interim Report Q2/2013
- 44 -
Tables 30 June 2013
> 8 Determination and hierarchy of fair values
Financial liabilities 31.12.2012 Level 1 Level 2 Level 3 Total
Derivative financial instruments
Interest derivatives - 4 - 4
Foreign exchange derivatives - 39 0 39
Equity derivatives - - 19 19
Total financial liabilities measured at fair value - 43 19 62
Sensitivity analysis of fair values
The sensitivity of financial assets and liabilites to changes in exchange rates is assessed on business area level due to differenct base currencies. In P&C insurance, 10 percentage point depreciation of all other currencies against SEK would result in an effect recognised in profit/loss of EURm 14 (15) and in an effect recognised directly in equity of EURm -14 (-11). In Life insurance, 10 percentage point depreciation of all other currencies against EUR would result in an effect recognised in profit/loss of EURm -6 (52) and in an effect recognised directly in equity of EURm -60 (-64). In Holding, 10 percentage point depreciation of all other currencies against EUR would have no impact in profit/loss, but an effect recognised in equity of EURm -10 (-3). The comparison figures are as of 31 Dec. 2012.
The sensitivity analysis of the Group’s fair values of financial assets and liabilities in differenct market risk scenarios is presented below. The effects represent the instantaneous effects of a one-off change in the underlying market variable on the fair values on 30 June 2013.
The sensitivity analysis includes the effects of derivative positions. All sensitivities are calculated before taxes.
The debt issued by Sampo plc is not included.
Interest rate Equity
Other financial
assets1 % parallel shift down
1 % parallel shift up
20 % fall in prices
20 % fall in prices
Effect recognised in profit/loss -26 8 0 -4
Effect recognised directly in equity 156 -151 -556 -173
Total effect 130 -143 -556 -177
Sampo Group Interim Report Q2/2013
- 45 -
Tables 30 June 2013
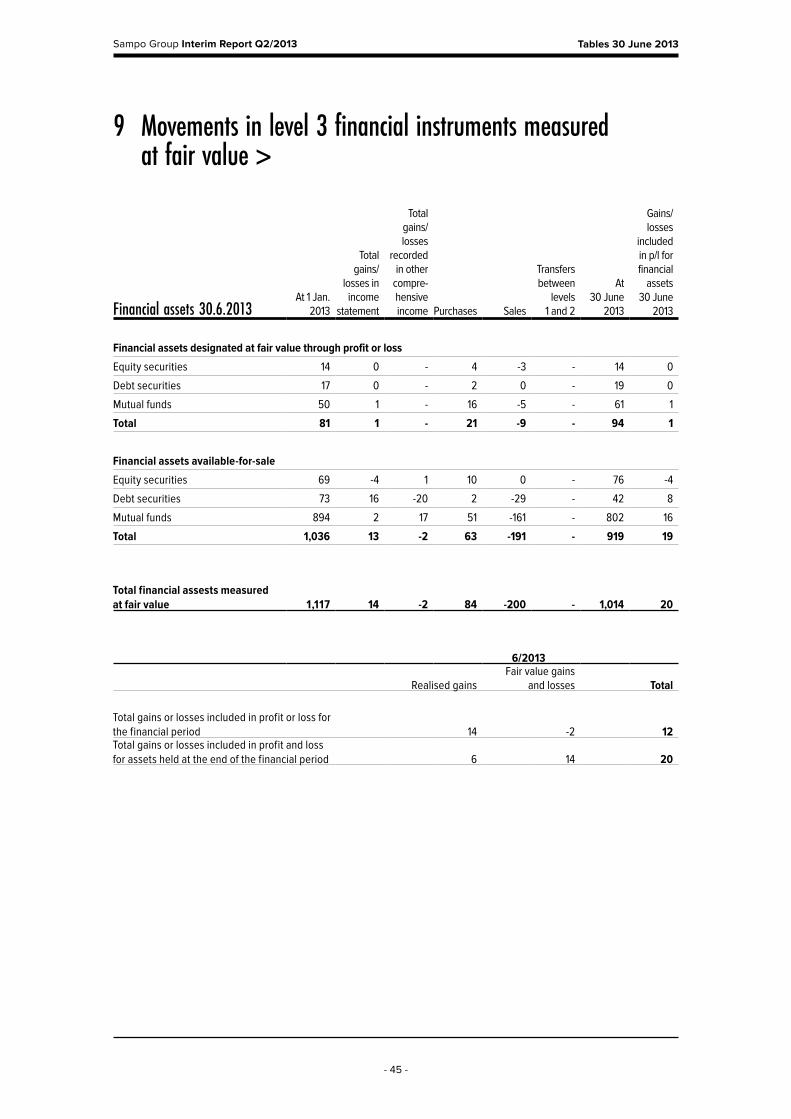
9 Movements in level 3 financial instruments measured at fair value >
Financial assets 30.6.2013 At 1 Jan.
2013
Total gains/
losses in income
statement
Total gains/losses
recorded in other
compre-hensive income Purchases Sales
Transfers between
levels 1 and 2
At 30 June
2013
Gains/losses
included in p/l for financial
assets 30 June
2013
Financial assets designated at fair value through profit or loss
Equity securities 14 0 - 4 -3 - 14 0
Debt securities 17 0 - 2 0 - 19 0
Mutual funds 50 1 - 16 -5 - 61 1
Total 81 1 - 21 -9 - 94 1
Financial assets available-for-sale
Equity securities 69 -4 1 10 0 - 76 -4
Debt securities 73 16 -20 2 -29 - 42 8
Mutual funds 894 2 17 51 -161 - 802 16
Total 1,036 13 -2 63 -191 - 919 19
Total financial assests measured at fair value 1,117 14 -2 84 -200 - 1,014 20
6/2013
Realised gainsFair value gains
and losses Total
Total gains or losses included in profit or loss for the financial period 14 -2 12Total gains or losses included in profit and loss for assets held at the end of the financial period 6 14 20

Sampo Group Interim Report Q2/2013
- 46 -
Tables 30 June 2013
> 9 Movements in level 3 financial instruments measured at fair value
Financial assets 31.12.2012 At 1 Jan.
2012
Total gains/
losses in income
statement
Total gains/losses
recorded in other
compre-hensive income Purchases Sales
Transfers between
levels 1 and 2
At 31 Dec.
2012
Gains/losses
included in p/l for financial
assets 31 Dec. 2012
Financial assets designated at fair value through profit or loss
Equity securities 0 0 - 19 -6 - 13 0
Debt securities 0 1 - 17 0 - 17 1
Mutual funds 62 2 - 31 -45 0 50 2
Total 63 2 0 66 -50 0 81 3
Financial assets available-for-sale
Equity securities 72 0 1 2 -6 - 69 -1
Debt securities 99 17 -16 4 -31 - 73 15
Mutual funds 904 4 13 168 -196 - 894 12
Total 1,074 21 -2 174 -232 - 1,035 25
Total financial assests measured at fair value 1,137 23 -2 240 -282 0 1,117 28
12/2012
Realised gainsFair value gains
and losses Total
Total gains or losses included in profit or loss for the financial period 23 5 29Total gains or losses included in profit and loss for assets held at the end of the financial period 23 5 28

Sampo Group Interim Report Q2/2013
- 47 -
Tables 30 June 2013
10 Sensitivity analysis of level 3 financial instruments measured at fair value
6/2013 12/2012
Carrying amount
Effect of reasonably
possible alternative
assumptions (+ / -) Carrying amount
Effect of reasonably
possible alternative
assumptions (+ / -)
Financial assets
Financial assets available-for-sale
Equity securities 74 -15 69 -14
Debt securities 43 -2 73 -3
Mutual Funds 823 -149 894 -163
Total 939 -166 1,036 -180
11 Investments related to unit-linked insurance
Life insurance 6/2013 12/2012
Financial assets as at fair value through p/lDebt securities 979 826Equity securities 2,980 2,711Loans and receivables 187 281Derivatives 13 16Life insurance, total 4,160 3,834
Elimination items between segments -1 -1
Group, total 4,158 3,833
The value of financial assets regarding the debt security instruments has been tested by assuming a rise of 1 per cent point in interest rate level in all maturities. For other financial assets, the prices were assumed to go down by 20%. Sampo Group bears no investment risks related to unit-linked insurance, so a change in assumptions regarding these assets does not affect profit or loss. On the basis of the these alternative assumptions, a possible change in interest levels at 30 June 2013 would cause descend of EURm 2 for the debt instruments, and EURm 164 valuation loss for other instruments in the Group’s other compre-hensive income. The reasonably possible effect, proportionate to the Group’s equity, would thus be 1.7% . At the year end 2012, the comparable figures were EURm 3 and EURm 177 and the reasonably possible effect 1.8%.
Sampo Group Interim Report Q2/2013
- 48 -
Tables 30 June 2013
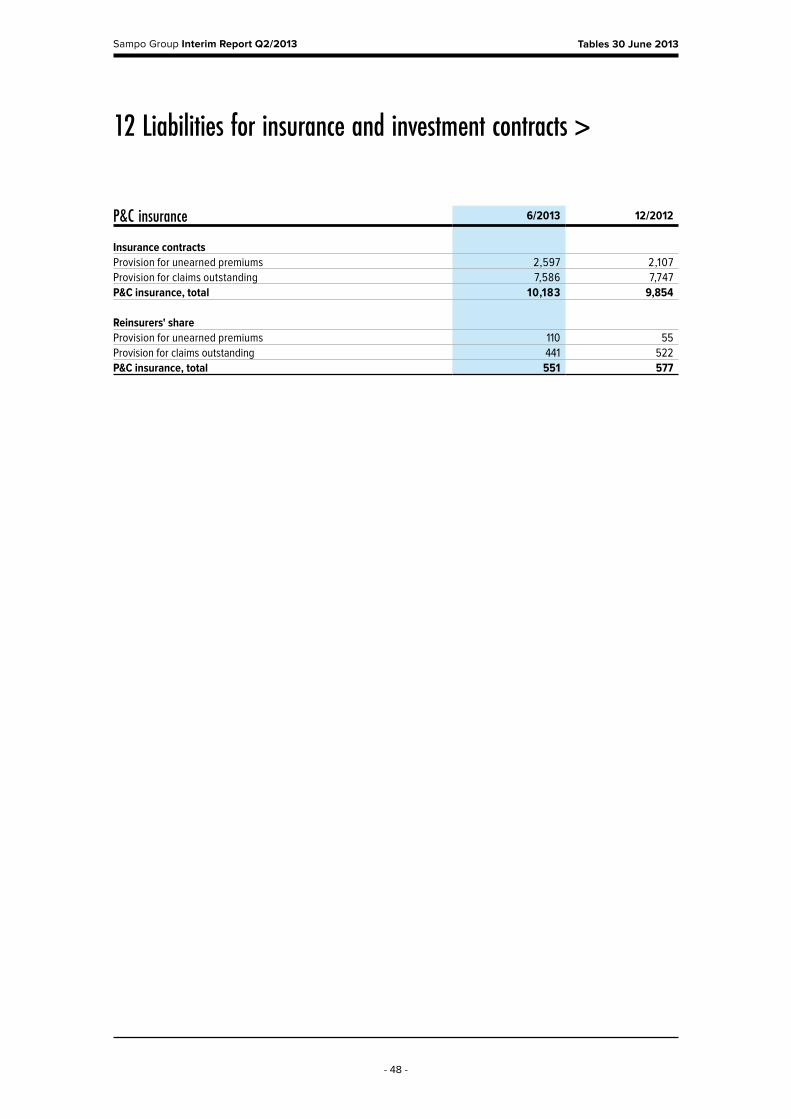
12 Liabilities for insurance and investment contracts >
P&C insurance 6/2013 12/2012
Insurance contractsProvision for unearned premiums 2,597 2,107Provision for claims outstanding 7,586 7,747P&C insurance, total 10,183 9,854
Reinsurers' shareProvision for unearned premiums 110 55Provision for claims outstanding 441 522P&C insurance, total 551 577

Sampo Group Interim Report Q2/2013
- 49 -
Tables 30 June 2013
> 12 Liabilities for insurance and investment contracts
Life insurance 6/2013 12/2012
Insurance contractsLiabilities for contracts with DPF Provision for unearned premiums 2,017 2,090 Provision for claims outstanding 1,980 1,972Total 3,998 4,062Liabilities for contracts without DPF Provision for unearned premiums 0 0 Provision for claims outstanding 1 1Total 1 1Total 3,998 4,063
Assumed reinsurance Provision for unearned premiums 2 1 Provision for claims outstanding 1 1Total 3 2
Insurance contracts, totalProvision for unearned premiums 2,020 2,091Provision for claims outstanding 1,982 1,975Total 4,002 4,065
Investment contractsLiabilities for contracts with DPF Provision for unearned premiums 4 6
Liabilities for insurance and investment contracts, totalProvision for unearned premiums 2,024 2,096Provision for claims outstanding 1,982 1,975Life insurance, total 4,006 4,071
Recoverable from reinsurersProvision for unearned premiums 0 0Provision for claims outstanding 3 3Life insurance, total 3 3
Investment contracts do not include a provision for claims outstanding.
Liability adequacy test does not give rise to supplementary claims.
Exemption allowed in IFRS 4 Insurance contracts has been applied to investment contracts with DPF or contracts with a right to trade-off for an investment contract with DPF. These investment contracts have been valued like insurance contracts.
Group, total 14,189 13,925

Sampo Group Interim Report Q2/2013
- 50 -
Tables 30 June 2013
13 Liabilities from unit-linked insurance and investment contracts
14 Financial liabilities
Life insurance 6/2013 12/2012
Unit-linked insurance contracts 2,822 2,665Unit-linked investment contracts 1,312 1 ,168Life insurance, total 4,134 3,833
Elimination items between segments -1 -1
Group, total 4,133 3,832
P&C insurance 6/2013 12/2012
Derivative financial instruments (Note 7) 12 38
Subordinated debt securitiesSubordinated loans 348 324
P&C insurance, total 360 362
Life insurance 6/2013 12/2012
Derivative financial instruments (Note 7) 37 5
Subordinated debt securitiesSubordinated loans 100 100
Life insurance, total 137 105
Holding 6/2013 12/2012
Derivative financial instruments (Note 7) 19 19
Debt securities in issueCommercial papers 307 451Bonds 1,783 1,710Total 2,090 2,162
Holding, total 2,108 2,181
Elimination items between segments -336 -270
Group, total 2,269 2,378

Sampo Group Interim Report Q2/2013
- 51 -
Tables 30 June 2013
15 Contingent liabilities and commitments >
P&C insurance 6/2013 12/2012
Off-balance sheet itemsGuarantees 32 37Other irrevocable commitments 16 6Total 48 43
Assets pledged as collateral for liabilities or contingent liabilities
6/2013 6/2013 12/2012 12/2012
Assets pledged as collateral Assets pledged
Liabilities/ commitments
Assets pledged
Liabilities/ commitments
Cash and cash equivalents 6 4 6 4Investments- Investment securities 267 155 285 153Total 273 158 290 157
Assets pledged as security for derivative contracts, carrying value 6/2013 12/2012
Investment securities 40 40
The pledged assets are included in the balance sheet item Other assets.
Non-cancellable operating leases 6/2013 12/2012Minimum lease payments - not later than one year 35 37- later than one year and not later than five years 102 110- later than five years 87 101Total 224 248

Sampo Group Interim Report Q2/2013
- 52 -
Tables 30 June 2013
> 15 Contingent liabilities and commitments
Life insurance 6/2013 12/2012
Off-balance sheet itemsInvestment commitments 378 367Acquisition of IT-software 1 1Total 379 368
Assets pledged as security for derivative contracts, carrying value
Cash and cash equivalents 14 6
The pledged assets are included in the balance sheet item Other assets.
Non-cancellable operating leases Minimum lease payments - not later than one year 2 2- later than one year and not later than five years 8 4Total 10 6
Holding 6/2013 12/2012
Off-balance sheet itemsInvestment commitments 1 1
Non-cancellable operating leases Minimum lease payments - not later than one year 1 1- later than one year and not later than five years 3 3Total 3 4

Sampo Group Interim Report Q2/2013
- 53 -
Tables 30 June 2013
16 Result analysis of P&C insurance business
1–6/2013 1–6/2012
Premiums earned 2,255 2,120
Claims incurred -1,624 -1,535
Operating expenses -378 -361
Other technical income and expenses 1 3
Allocated investment return transferred from the non-technical account 37 55
Technical result 292 282
Investment result 217 220
Allocated investment return transferred to the technical account -65 -84
Other income and expenses 29 25
Operating result 473 442

Sampo Group Interim Report Q2/2013
- 54 -
Tables 30 June 2013
17 Sampo plc’s income statement and balance sheet (FAS)
Income statement 1–6/2013 1–6/2012
Other operating income 8 8Staff expenses -12 -8Depreciation and impairment 0 0Other operating expenses -7 -8Operating profit -11 -9Finance income and expenses 369 203Profit before appropriations and income taxes 359 194Income taxes 0 -Profit for the financial period 359 194
Balance sheet 6/2013 12/2012
ASSETSNon-current assetsIntangible assets 0 0Property, plant and equipment 4 4Investments Shares in Group companies 2,370 2,370 Receivables from Group companies 320 225 Shares in participating undertakings 5,557 5,557 Other shares and participations 68 28 Other receivables - 350Receivables 95 118Cash and cash equivalents 200 473
TOTAL ASSETS 8,616 9,126
LIABILITIESEquityShare capital 98 98Fair value reserve 4 0Invested unrestricted equity 1,527 1,527Other reserves 273 273Retained earnings 4,146 4,158Profit for the year 359 737Total equity 6,407 6,793
LiabilitiesLong-term 1,783 1,710Short-term 426 622Total liabilities 2,209 2,333
TOTAL LIABILITIES 8,616 9,126