risk management report 2019 - sampo group · 2020-03-17 · risk management report focus on...
TRANSCRIPT

SAMPO GROUP’S RISKSAND CORE RISK
MANAGEMENT ACTIVITIES
IF GROUP
SAMPO GROUP’SSTRUCTURE ANDBUSINESS MODEL
TOPDANMARKGROUP
SAMPO GROUPCAPITALIZATION APPENDICESMANDATUM LIFE
GROUP
RISK CONSIDERATIONSAT SAMPO GROUP LEVEL
AND SAMPO PLC
RISK MANAGEMENT REPORT 2019 1
RISK MANAGEMENT REPORT
2019

CONTENTS
REPORTS FOR THE YEAR 2019 WWW.SAMPO.COM/YEAR2019
Sampo Group’s Structure and Business Model . . . . . . . . . . . . . . . . . . . . . . . . . . . . . . . . . . . . . . . . . . . . . . . . 3
Sampo Group’s Risks and Core Risk Management Activities . . . . . . . . . . . . . . . . . . . . . . . . . 6
Sampo Group’s Risks and Core Risk Management Activities . . . . . . . . . . . . . . . . . . . . . . . . . . . . . . . . . . . . . . . . . . . . . . . . . . . . . . . . . . . 7Group’s Risks . . . . . . . . . . . . . . . . . . . . . . . . . . . . . . . . . . . . . . . . . . . . . . . . . . . . . 7Core Risk Management Activities . . . . . . . . . . . . . . . . . . . . . . . 11
If Group . . . . . . . . . . . . . . . . . . . . . . . . . . . . . . . . . . . . . . . . . . . . . . . . . . . . . . . . . . . . 13If Group . . . . . . . . . . . . . . . . . . . . . . . . . . . . . . . . . . . . . . . . . . . . . . . . . . . . . . . . . . . 14Underwriting Risks and Performance . . . . . . . . . . . . . . . . . 14Market Risks and Investment Performance . . . . . . . . . . 21Counterparty Default Risks . . . . . . . . . . . . . . . . . . . . . . . . . . . . . . . . 26Operational Risks . . . . . . . . . . . . . . . . . . . . . . . . . . . . . . . . . . . . . . . . . . . . . 28Capitalization . . . . . . . . . . . . . . . . . . . . . . . . . . . . . . . . . . . . . . . . . . . . . . . . . . . 28
Topdanmark Group . . . . . . . . . . . . . . . . . . . . . . . . . . . . . . . . . . . . . . 31Topdanmark Group . . . . . . . . . . . . . . . . . . . . . . . . . . . . . . . . . . . . . . . . . . . 32Underwriting Risks and Performance . . . . . . . . . . . . . . . . . . 34Market Risks and Investment Performance . . . . . . . . . . 42Counterparty Default Risks . . . . . . . . . . . . . . . . . . . . . . . . . . . . . . . . 49Operational Risks . . . . . . . . . . . . . . . . . . . . . . . . . . . . . . . . . . . . . . . . . . . . . 49Capitalization . . . . . . . . . . . . . . . . . . . . . . . . . . . . . . . . . . . . . . . . . . . . . . . . . . . 51
Mandatum Life Group . . . . . . . . . . . . . . . . . . . . . . . . . . . . . . . . . . 54Mandatum Life Group . . . . . . . . . . . . . . . . . . . . . . . . . . . . . . . . . . . . . . . 55Underwriting Risks and Performance . . . . . . . . . . . . . . . . . . 55Market Risks and Investment Performance . . . . . . . . . . 62Counterparty Default Risks . . . . . . . . . . . . . . . . . . . . . . . . . . . . . . . . 69Operational Risks . . . . . . . . . . . . . . . . . . . . . . . . . . . . . . . . . . . . . . . . . . . . . 70Capitalization . . . . . . . . . . . . . . . . . . . . . . . . . . . . . . . . . . . . . . . . . . . . . . . . . . . 70
Risk Considerations at Sampo Group Level and Sampo plc . . . . . . . . . . 73
Risk Considerations at Sampo Group Level and Sampo plc . . . . . . . . . . . . . . . . . . . . . . . . . . . . . . . . . . . . . . . . . . . . . . . . . . . . . . . 74Underwriting Risks at Sampo Group . . . . . . . . . . . . . . . . . . . 74Market Risks at Sampo Group Level . . . . . . . . . . . . . . . . . . . . 75The Role of Sampo plc . . . . . . . . . . . . . . . . . . . . . . . . . . . . . . . . . . . . . . 85
Sampo Group Capitalization . . . . . . . . . . . . . . . . . . . . . . . 87Sampo Group Capitalization . . . . . . . . . . . . . . . . . . . . . . . . . . . . . . 88Group’s Own Funds and Solvency According to Solvency II . . . . . . . . . . . . . . . . . . . . . . . . . . . . . . . . . . . . . . . . . . . . . . . . . . . 88
Appendices . . . . . . . . . . . . . . . . . . . . . . . . . . . . . . . . . . . . . . . . . . . . . . . . . . . . . . 91Appendix 1: Sampo Group Steering Framework and Risk Management Process . . . . . . . . . . 92
Parent Company’s Guidance . . . . . . . . . . . . . . . . . . . . . . . . . 92Subsidiaries’ Activities and Risk Management . . . . . . . . . . . . . . . . . . . . . . . . . . . . . . . . . . . . . . . . 93Parent Company’s Oversight and Activities . . . . 96Risk Governance . . . . . . . . . . . . . . . . . . . . . . . . . . . . . . . . . . . . . . . . . . 97
Appendix 2: Risk Definitions . . . . . . . . . . . . . . . . . . . . . . . . . . . 103Underwriting Risks . . . . . . . . . . . . . . . . . . . . . . . . . . . . . . . . . . . 103Market Risks . . . . . . . . . . . . . . . . . . . . . . . . . . . . . . . . . . . . . . . . . . . . 107Balance Sheet Level Market Risks or ALM Risks . . . . . . . . . . . . . . . . . . . . . . . . . 109Counterparty Default Risks . . . . . . . . . . . . . . . . . . . . . . . . 111Operational Risks . . . . . . . . . . . . . . . . . . . . . . . . . . . . . . . . . . . . . 112Business Risks . . . . . . . . . . . . . . . . . . . . . . . . . . . . . . . . . . . . . . . . . . 113
Appendix 3: Selected Management Principles . . . 115Principles of Balance Sheet Management (ALM) . . . . . . . . . . . . . . . . . . . . . . . . . . . . . . . . . . 115Principles of Investment Portfolio Management and Control of Investment Activities . . . . . . . . . . . . . . . . . . . . . . . . . . . . . . . . . . . . . . . . . . . . . . . . . .116Principles of Operational Risks Management . . . . . . . . . . . . . . . . . . . . . . . . . . . . . . . . . . . . .119
Appendix 4: Profitability, Risks and Capital . . . . . . 120Capitalization at the Sub-Group Level . . . . . . . . . 121Capitalization at the Group Level . . . . . . . . . . . . . . . 123
Appendix 5: Valuation for Solvency Purposes . . . 126Assets . . . . . . . . . . . . . . . . . . . . . . . . . . . . . . . . . . . . . . . . . . . . . . . . . . . . . 128Technical Provisions According to Solvency II in Sampo Group . . . . . . . . . . . . . . . . . . . . . . . 129Technical Provisions According to Solvency II in If . . . . . . . . . . . . . . . . . . . . . . . . . . . . . . . . . . . . . . . . . .131Technical Provisions According to Solvency II in Topdanmark . . . . . . . . . . . . . . . . . . . . . . . . . 132Technical Provisions According to Solvency II in Mandatum Life . . . . . . . . . . . . . . . . . . . . . 133Other Liabilities . . . . . . . . . . . . . . . . . . . . . . . . . . . . . . . . . . . . . . . . 133
SAMPO GROUP’S RISKSAND CORE RISK
MANAGEMENT ACTIVITIES
IF GROUP
TOPDANMARKGROUP
SAMPO GROUPCAPITALIZATION APPENDICESMANDATUM LIFE
GROUP
RISK CONSIDERATIONSAT SAMPO GROUP LEVEL
AND SAMPO PLC
SAMPO GROUP’SSTRUCTURE ANDBUSINESS MODEL
RISK MANAGEMENT REPORT 2019 2
Sampo Group Risk Management Disclosure 2019
Sampo Group’s Structure and Business Model
Sampo Group (“Group”) is engaged in non-life insurance,
life insurance and banking mainly in the Nordics.
Non-life insurance and life insurance activities are
conducted by the subsidiaries If P&C Insurance Holding
Ltd (publ) (“If”), Mandatum Life Insurance Company Ltd
(“Mandatum Life”) and Topdanmark A/S (“Topdanmark”).
The first two are wholly owned by the Group’s parent
company, Sampo plc (“parent company” or “Sampo”). The
parent company is a listed holding company and has no
insurance or banking activities of its own. Sampo has a
46.7 per cent holding of shares and 48.2 per cent of votes
in Topdanmark.
In addition to the insurance subsidiaries, as at
31 December 2019 the Group’s parent company held
equity stakes of 19.9 per cent in Nordea Bank Abp
(“Nordea”) and 36.25 per cent in NDX Intressenter AB
(“NDX”) through which Sampo Group is engaged in
banking business. Sampo plc paid in August 2019 an
extra dividend in the form of Nordea shares, which took
Sampo’s ownership in Nordea under 20 per cent. In
financial accounting Nordea remains as an associated
company of Sampo but in Solvency II, the treatment
changed, and Nordea is treated as an equity investment
in Sampo Group’s own funds and Solvency Capital
Requirement (“SCR”).
The legal structure of Sampo Group including major
operative companies of subsidiaries is shown is shown in
the graph Sampo Group Legal Structure.
As a holding company, Sampo manages its subsidiaries
and associated companies separately from each other
meaning that the legal sub-groups If, Topdanmark and
Mandatum Life and the associated companies Nordea
and NDX conduct their businesses independently of
each other. The independent sub-groups have their own
infrastructures and management as well as operative
processes in place. In instances where the subsidiaries
and the associated companies cooperate in some business
areas, cooperation is conducted similarly as with any
third-party.
The primary management tool is the work in the
companies’ Boards of Directors. The Boards of If and
Mandatum Life consist of Sampo Group’s management.
Regarding its wholly owned subsidiaries, Sampo gives
more exact guidance on how activities should be
organized in terms of Group-wide principles and there is a
frequent dialogue between Sampo and the subsidiaries in
major operative issues. In addition, Sampo is monitoring
performance, risks and capitalisation at detailed levels.
In Topdanmark, the Chairman and two other board
members are from Sampo Group’s management and
they constitute three of the total six board members
elected by the annual general meeting. Topdanmark has
also adopted Sampo’s main Group-wide principles and
policies, including the risk management principles. The
dialogue between Sampo and Topdanmark as well as the
Risk Management report focus on performance, risk and
capitalization reporting and is not as detailed as between
Sampo and its wholly-owned subsidiaries.
Nordea and NDX are associated companies in financial
accounting and not controlled by Sampo. Because of
this their risk management is not covered in Sampo
Group’s Risk Management Report. Nordea has, however,
a material effect on the Group’s profits, risks and capital
needs. Hence, Nordea is carefully analysed by Sampo
as a separate business and as a component of Sampo’s
portfolio of Nordic financial companies.
IF GROUP
TOPDANMARKGROUP
SAMPO GROUPCAPITALIZATION APPENDICESMANDATUM LIFE
GROUP
RISK CONSIDERATIONSAT SAMPO GROUP LEVEL
AND SAMPO PLC
SAMPO GROUP’SSTRUCTURE ANDBUSINESS MODEL
SAMPO GROUP’S RISKSAND CORE RISK
MANAGEMENT ACTIVITIES
RISK MANAGEMENT REPORT 2019 3

Group Structure31 December 2019
Sampo plcFinland
If P&C Insurance Ltd (publ)Sweden
If P&C Insurance ASEstonia
If Livförsäkring ABSweden
If P&C Insurance Holding Ltd (publ)
Sweden
Nordea Bank Abp
Finland
100% < 20%
100%
100%
100%
100%
100%
Topdanmark A/S
Denmark
Topdanmark Kapitalforvaltning A/SDenmark
Topdanmark Forsikring A/SDenmark
Topdanmark Liv Holding A/SDenmark
Topdanmark Livsforsikring A/SDenmark
100%
100%
46.7%
Mandatum Life Services Ltd Finland
Mandatum Life Investment Services Ltd Finland
Mandatum LifeFund Management S.A.Luxembourg
Mandatum Life Insurance Company Ltd
Finland
100%
100%
100%
100%
IF GROUP
TOPDANMARKGROUP
SAMPO GROUPCAPITALIZATION APPENDICESMANDATUM LIFE
GROUP
RISK CONSIDERATIONSAT SAMPO GROUP LEVEL
AND SAMPO PLC
SAMPO GROUP’SSTRUCTURE ANDBUSINESS MODEL
SAMPO GROUP’S RISKSAND CORE RISK
MANAGEMENT ACTIVITIES
RISK MANAGEMENT REPORT 2019 4

NDX Intressenter AB, of which Sampo owns 36.25 per
cent, has been an associate company of the Group since
2018. The company was established for the takeover of
Nordax Group AB, which is a Swedish specialist bank
providing unsecured consumer loans, mortgages and
deposits to customers in Sweden, Norway, Finland and
Germany. In addition, Sampo plc has built a portfolio
of holdings in companies operating in the financial
service industry. The portfolio amounts to approximately
EUR 1 billion at the end of 2019. This portfolio includes
companies such as Saxo Bank Group, of which Sampo
has a holding of 19.9 per cent. Neither NDX nor the other
financial service companies are covered in the Risk
Management report as they are not controlled by Sampo.
As described above, Sampo Group’s legal structure and
business model are both straightforward and simple. In
addition, there are only a limited amount of intragroup
exposures, of which the most material are as follows:
Sampo’s holdings of hybrid capital and subordinated loan
instruments issued by If, Mandatum Life, Topdanmark
and Nordea, internal dividends and service charges.
Service charges are related to intragroup outsourcing
agreements. If and Mandatum have outsourced a part of
their investment management processes to Sampo and
Sampo has outsourced its IT platform services and payroll
accounting to If. Between Sampo and Topdanmark there
are no outsourcing agreements.
As dividends are the parent company’s major source of
income, Sampo’s primary target for every sub-group is
to maintain a healthy balance between profits, risks and
capital, in order to facilitate a steady stream of dividend
payments in the long run. The second target is ensuring
stable profitability at business portfolio level. Especially
potential risk concentrations in Sampo and the correla-
tion of reported profits are generally monitored closely,
and their sources are analysed. To the extent possible
risk concentrations are proactively prevented by strategic
decisions. Thirdly, generally Sampo prefers lower leverage
and adequate liquidity buffers to be able to generate
liquidity as needed. The size of assessed diversification
benefit of the Group companies’ profits is reflected in
Sampo’s decisions on own capital structure and liquidity
position.
Further information on Sampo Group’s steering
framework and risk management process can be found in
Appendix 1 Sampo Group Steering Framework and
Risk Management Process.
Sampo has a diversified shareholder base and the major
shareholders (Shareholders, Board of Directors’
Report, www.sampo.com/year2019) have owned their
holdings for many years. Sampo Group’s main supervisor
is the Finnish Financial Supervisory Authority. Due
to Sampo Group’s activities in the Nordic and Baltic
countries, other Nordic and Baltic supervisors have
supervisory responsibilities as well. Sampo Group’s
auditor is Ernst & Young Oy.
IF GROUP
TOPDANMARKGROUP
SAMPO GROUPCAPITALIZATION APPENDICESMANDATUM LIFE
GROUP
RISK CONSIDERATIONSAT SAMPO GROUP LEVEL
AND SAMPO PLC
SAMPO GROUP’SSTRUCTURE ANDBUSINESS MODEL
SAMPO GROUP’S RISKSAND CORE RISK
MANAGEMENT ACTIVITIES
RISK MANAGEMENT REPORT 2019 5

SAMPO GROUP’S RISKS AND CORE RISK MANAGEMENT ACTIVITIES
7Sampo Group’s Risks
and Core Risk Management
Activities
7Group’s Risks
11Core Risk
Management Activities
SAMPO GROUP’SSTRUCTURE ANDBUSINESS MODEL
TOPDANMARKGROUP
SAMPO GROUPCAPITALIZATION APPENDICESMANDATUM LIFE
GROUP
RISK CONSIDERATIONSAT SAMPO GROUP LEVEL
AND SAMPO PLC
SAMPO GROUP’S RISKSAND CORE RISK
MANAGEMENT ACTIVITIES
IF GROUP
RISK MANAGEMENT REPORT 2019 6

Sampo Group’s Risks and Core Risk Management Activities
and in the long run they may also endanger the existence
of Sampo Group’s business models.
External drivers behind such changes are varied,
including for instance general economic development,
changes in commonly shared values, developments
in the institutional and physical environment and
technological innovations. Because external drivers are
inter-connected, the customer preferences and demand
can change unpredictably and there may be a need to
change regulations as well. In case the company’s internal
understanding of needed changes or willingness and
ability to act accordingly is inadequate and competitors
are more able to meet clients’ and regulation’s altered
expectations, the company is highly exposed to business
risk.
Due to the predominantly external nature of the drivers
and development in the competitive environment,
managing business risks is the responsibility of the
executive level senior management. Proactive strategic
decision making is the central tool in managing business
risks, which relate to the competitive advantage. The
maintenance of internal operational flexibility – i.e. the
ability to adjust the business model and cost structure
when needed – is also an efficient tool in managing
business risks.
Business risks do not have the regulatory capital charge,
although they may be a material source of earnings
volatility. Because of this, business risk may have an effect
on the amount and structure of actual capital base, if
deemed prudent in the existing business environment.
Corporate Responsibility as a Business Risk Driver
The issues related to corporate responsibility are
changing the preferences and values of Sampo Group
companies’ stakeholders and, as a result, the operating
and competitive environment is also changing in different
ways. The Group companies operate mainly in the Nordic
countries, which are characterized by an inherent respect
for human rights, high transparency, and low levels of
corruption and bribery. There is high compliance with
labor rights, health and environmental legislation and
freedom of speech and association. These themes are also
inherent in the operations of all Sampo Group companies.
Managing the economic, social, and environmental
impacts and stakeholder relationships of Sampo Group
businesses is increasingly important. Investors and
governmental authorities are putting an increasing focus
on corporate responsibility, but also consumers and
Sampo Group companies operate in business areas where
specific features of value creation are the pricing of risks
and the active management of risk portfolios in addition
to sound client services. Hence common risk definitions
are needed as a basis for business activities.
Group’s Risks
In Sampo Group, the risks associated with business
activities fall into three main categories as shown in
the picture Classification of Risks in Sampo Group:
business risks, reputational risk and risks inherent in the
business operations. The first two risk classes are only
briefly described in this Risk Management Disclosure as
the focus is on the third risk class.
Business Risks
Business risk is the risk of losses due to changes in
the competitive environment and/or lack of internal
operational flexibility. Unexpected abrupt changes or
already identified, but internally neglected trends can
cause larger than expected fluctuations in profitability
when volumes, margins, costs and capital charges change
SAMPO GROUP’SSTRUCTURE ANDBUSINESS MODEL
TOPDANMARKGROUP
SAMPO GROUPCAPITALIZATION APPENDICESMANDATUM LIFE
GROUP
RISK CONSIDERATIONSAT SAMPO GROUP LEVEL
AND SAMPO PLC
SAMPO GROUP’S RISKSAND CORE RISK
MANAGEMENT ACTIVITIES
IF GROUP
RISK MANAGEMENT REPORT 2019 7

employees are emphasizing these topics when choosing a
brand or a company.
The key corporate responsibility related risk drivers for
Sampo Group can be divided into four main areas:
Responsible business management and practices are
fundamental to Sampo Group companies’ operations.
Good governance in Sampo Group means effective poli-
cies and management practices, which provide assurance
that the Group companies and their business partners,
such as suppliers in claims handling, comply with laws,
regulations and generally accepted principles on human
rights, labor rights, environment, anti-money laundering,
counter-terrorism financing and anti- corruption and
bribery. Further, it comprises comprehensive information
security governance systems, cybersecurity preparedness
and personal data protection activities. Additionally,
responsible business practices require being attentive
of the risks relating to inappropriate customer advice
and product sales, lack of clarity on conditions, prices
and fees, and errors in claims handling and complaint
processes. Sales and marketing practices’ focus is on
meeting the demands and needs of the customer and
providing the customer with the information necessary
for them to make well-informed decisions on their
insurance coverage needs.
Responsible corporate culture includes factors relating
to the work environment, diversity, equality, employee
well-being, employee engagement, professional
development, and talent attraction and retention. Sampo
Group companies want to provide customers with the
best service in all situations. Here skilled and motivated
employees is an essential success factor. Losing talent or
being perceived as an unattractive employer would pose
large risks for the businesses. Therefore, Sampo Group
companies strive to ensure a sound work environment,
not only because it is stipulated by law, but also because it
lays the foundation for sustainable business performance.
Diversity and equality are key focus areas for Sampo
Group companies, which are committed in providing
a non-discriminatory, open and agreeable working
environment where everyone is treated fairly and equally.
Risks related to these themes are managed for example by
having strong internal policies, conducting organizational
development programs, and offering employees
training, interesting career opportunities and attractive
remuneration packages.
Responsible investment management and operations are
important in managing long-term investment risks and
in mitigating potential adverse impacts on the Group’s
reputation. Therefore, Sampo Group companies take
environmental, social and governance (“ESG”) issues into
account when assessing the security, quality, liquidity,
profitability and availability of investments. Investment
opportunities are carefully studied before any invest-
ments are made and ESG issues are considered along
with other factors that might affect the risk-return ratio of
separate investments. ESG issues have an impact on the
long-term performance, risk and value of all companies.
Taking these issues into consideration in the investment
process is an important mean to improve the risk-return
profile of investments, and it is a critical success factor
of investment activities. Depending on the asset class,
Sampo uses different ESG strategies to ensure the
effective consideration and management of investment
risks arising from ESG issues. The strategies used include
for example ESG integration, sector-based screening,
norm-based screening, and active ownership. Sampo
Group is also a signatory of the United Nations Principles
for Responsible Investment (“PRI”).
Environmental issues and climate change are factors affect-
ing Sampo Group’s businesses via investment operations,
but effects are also recognized in insurance operations
in an increasing manner. Sampo Group companies help
customers to manage risks and they provide customers
support when accidents occur. By providing customers
SAMPO GROUP’SSTRUCTURE ANDBUSINESS MODEL
TOPDANMARKGROUP
SAMPO GROUPCAPITALIZATION APPENDICESMANDATUM LIFE
GROUP
RISK CONSIDERATIONSAT SAMPO GROUP LEVEL
AND SAMPO PLC
SAMPO GROUP’S RISKSAND CORE RISK
MANAGEMENT ACTIVITIES
IF GROUP
RISK MANAGEMENT REPORT 2019 8

with guidance on how to prevent losses, the Group
companies help customers to reduce risks and economic
costs, and at the same time to protect the environment.
Natural catastrophes and extreme weather conditions,
on the other hand, are risk factors affecting the financial
position and results of non-life insurers. Since climate
change could increase the frequency and/or severity
of natural catastrophes, Sampo Group companies have
conducted sensitivity analyses, using scenarios where the
severity of natural catastrophes is assumed to increase. As
a potential side effect, climate change could also result in
large migrations or prolonged concentrations of people
and animals where deceases can be transmitted or the
change in environment could create new versions of
known diseases. These risks are managed effectively with
reinsurance programs.
Further information on corporate responsibility in Sampo
Group is available in the Corporate Responsibility
Report 2019 published in May 2020.
Reputational Risk
Managing stakeholder relationships means satisfied
customers, professional staff, good co-operation
with authorities and the trust and approval of the
environment. These contribute to a key success factor of
the company, its reputation.
Reputational risk refers to the risk that adverse
publicity regarding the company’s business practices or
associations, whether accurate or not, causes a loss of
confidence in the integrity of the institution. Reputational
risk is often a consequence of a materialized operational
or compliance risk and often manifests as a deterioration
of reputation amongst customers and other stakeholders.
Reputational risk is related to all activities shown in the
graph Classification of Risks in Sampo Group. As the
roots of reputational risk are varied, the tools to prevent
it must be diverse and embedded within the corporate
culture. These are reflected in how Sampo deals with
environmental issues and its core stakeholders (i.e.
customers, personnel, investors, other co-operation
partners, tax authorities and supervisory authorities)
and how Sampo Group has organized its Corporate
Governance system.
SAMPO GROUP’SSTRUCTURE ANDBUSINESS MODEL
TOPDANMARKGROUP
SAMPO GROUPCAPITALIZATION APPENDICESMANDATUM LIFE
GROUP
RISK CONSIDERATIONSAT SAMPO GROUP LEVEL
AND SAMPO PLC
SAMPO GROUP’S RISKSAND CORE RISK
MANAGEMENT ACTIVITIES
IF GROUP
RISK MANAGEMENT REPORT 2019 9

Risks Inherent in Business Operations
In its underwriting and investment operations, Sampo
Group is consciously taking certain risks in order to
generate earnings. These earnings risks are carefully
selected and actively managed. Underwriting risks are
priced to reflect their inherent risk levels and the expected
return of investments is compared to the related risks.
Furthermore, earnings related risk exposures are adjusted
continuously and their impact on the capital need is
assessed regularly.
Successful management of underwriting risks and invest-
ment portfolio market risks is the main source of earnings
for Sampo Group companies. Day-to-day management of
these risks, i.e. maintaining them within given limits and
authorizations is the responsibility of the business areas
and the investment unit.
Classification of Risks in Sampo Group
External drivers
Negative impact on financial results, capitalization and long-term profitability
Non-life insurance underwriting risks
Premium and Catastrophe risks
Reserve risks
Reputational risk
Life insurance underwriting risks
Biometric risksPolicyholder
behavior risksExpense risk
Investment portfolio market
risks
Interest rate riskCurrency riskSpread riskEquity riskOther risks
Counterparty default risks
Derivative counterpartyReinsurance counterparty
Operational risks
ProcessesPersonnelSystems
External eventsLegal risk
Compliance risk
Business risks
VolumesMargins
Number of Clients
Concentration risk Concentration risk Concentration risk Concentration risk Concentration risk Concentration risk
ALM risks
Earnings risks / capital charge
Earnings risks / no capital charge
Consequential risks / capital charge
Consequential risks / no capital charge
SAMPO GROUP’SSTRUCTURE ANDBUSINESS MODEL
TOPDANMARKGROUP
SAMPO GROUPCAPITALIZATION APPENDICESMANDATUM LIFE
GROUP
RISK CONSIDERATIONSAT SAMPO GROUP LEVEL
AND SAMPO PLC
SAMPO GROUP’S RISKSAND CORE RISK
MANAGEMENT ACTIVITIES
IF GROUP
RISK MANAGEMENT REPORT 2019 10

Some risks, such as counterparty default risks and
operational risks presented in the graph Classification
of Risks in Sampo Group are indirect repercussions of
Sampo’s normal business activities. They are one-sided
risks, which in principle have no related earnings
potential. Accordingly, the risk management objective
is to mitigate these risks efficiently rather than actively
manage them. Mitigation of consequential risks is the
responsibility of the business areas and the investment
unit. The capital need for these risks is measured by
independent risk management functions. It has to be
noted that the categorization of risks between earnings
and consequential risks varies depending on the industry.
For Sampo Group’s clients, for instance, the events that
are subject to insurance policies are consequential risks
and for Sampo Group these same risks are earnings risks.
Some risks such as interest rate, currency and liquidity
risks are by their nature simultaneously linked to various
activities. In order to manage these risks efficiently,
Sampo Group companies have to have a detailed
understanding of expected cash flows and their variance
within each of the company’s activities. In addition, a
thorough understanding of how the market values of
assets and liabilities may fluctuate at the total balance
sheet level under different scenarios is needed. These
balance sheet level risks are commonly defined as Asset
and Liability Management (“ALM”) risks. In addition to
interest rate, currency and liquidity risk, inflation risk and
risks relating to GDP growth rates are central ALM risks
in Sampo Group. The ALM risks are one of the focus areas
of senior management because of their relevance to risks
and earnings in the long run.
In general, concentration risk arises when the company’s
risk exposures are not diversified enough. When this is
the case, an individual extremely unfavourable claim or
financial market event, for instance, could threaten the
solvency of the company.
Concentrations can evolve within separate activities
– large single name or industry specific insurance or
investment exposures – or across activities when a single
name or an industry is contributing widely to the profit-
ability and risks of the company through both insurance
and investment activities.
Concentration risk may also materialize indirectly when
profitability and capital position react similarly to general
economic developments or to structural changes in the
institutional environment in different areas of business.
More detailed risk definitions can be found in
Appendix 2 Risk Definitions.
Core Risk Management Activities
To create value for all stakeholders in the long run, Sampo
Group companies must have the following forms of
capital in place:
• Financial flexibility in the form of adequate capital and
liquidity.
• Good technological infrastructure.
• Intellectual capital in the form of comprehensive
proprietary actuarial data and analytical tools to
convert this data to information.
• Human capital in the form of skilful and motivated
employees.
• Social and relationship capital in the form of good
relationships with society and clients to understand the
changing needs of different stakeholders.
At the company level, these resources are continuously
developed. They are in use when the following core
activities related to risk pricing, risk taking, and active
management of risk portfolios are conducted.
SAMPO GROUP’SSTRUCTURE ANDBUSINESS MODEL
TOPDANMARKGROUP
SAMPO GROUPCAPITALIZATION APPENDICESMANDATUM LIFE
GROUP
RISK CONSIDERATIONSAT SAMPO GROUP LEVEL
AND SAMPO PLC
SAMPO GROUP’S RISKSAND CORE RISK
MANAGEMENT ACTIVITIES
IF GROUP
RISK MANAGEMENT REPORT 2019 11

Appropriate selection and pricing of underwriting risks
• Underwriting risks are carefully selected and are priced
to reflect their inherent risk levels.
• Insurance products are developed proactively to meet
clients’ changing needs and preferences.
Effective management of underwriting exposures
• Diversification is actively sought.
• Reinsurance is used effectively to reduce largest
exposures.
Careful selection and execution of investment transactions
• Risk return ratios and sustainability issues of separate
investments opportunities are carefully analysed.
• Transactions are executed effectively.
Effective mitigation of consequential risks
• Counterparty default risks are mitigated by carefully
selecting counterparties, applying collateral
agreements and assuring adequate diversification.
• High quality and cost-efficient business processes are
maintained.
• Continuity and recovery plans are continuously
developed to secure business continuity.
Effective management of investment portfolios and the
balance sheet
• Balance between expected returns and risks in invest-
ment portfolios and the balance sheet is optimized,
considering the features of insurance liabilities,
internally assessed capital needs, regulatory solvency
rules and rating requirements.
• Liquidity risks are managed by having an adequate
portion of investments in liquid instruments. The
portion is mainly dependent on the features of the
liabilities.
At the Group level, the risk management focus is on
the Group-wide capitalization and liquidity. It is also
essential to identify potential risk concentrations and to
have a thorough understanding of how reported profits
of companies would develop under different scenarios.
These concentrations and correlations may have an effect
on the Group level capitalization and liquidity buffers as
well as on the Group level management actions.
When the above-mentioned core activities are success-
fully implemented, a balance between profits, risks and
capitalization can be achieved both at company and
group level and shareholder value can be created.
SAMPO GROUP’SSTRUCTURE ANDBUSINESS MODEL
TOPDANMARKGROUP
SAMPO GROUPCAPITALIZATION APPENDICESMANDATUM LIFE
GROUP
RISK CONSIDERATIONSAT SAMPO GROUP LEVEL
AND SAMPO PLC
SAMPO GROUP’S RISKSAND CORE RISK
MANAGEMENT ACTIVITIES
IF GROUP
RISK MANAGEMENT REPORT 2019 12

IF GROUP
14If Group
14Underwriting Risks
and Performance
21Market Risks and
Investment Performance
26Counterparty Default Risks
28Operational
Risks
28Capitalization
SAMPO GROUP’S RISKSAND CORE RISK
MANAGEMENT ACTIVITIES
SAMPO GROUP’SSTRUCTURE ANDBUSINESS MODEL
SAMPO GROUPCAPITALIZATION APPENDICESMANDATUM LIFE
GROUP
RISK CONSIDERATIONSAT SAMPO GROUP LEVEL
AND SAMPO PLC
IF GROUP
TOPDANMARKGROUP
RISK MANAGEMENT REPORT 2019 13

If Group
If Group (“If”) conducts property and casualty insurance
operations in the Nordic and Baltic countries and
underwrites policies that cover various risks for both
individuals and corporations over a geographically
diverse area. Corporate customers with global operations
are further served by branch offices in France, Germany,
the Netherlands and the United Kingdom as well as via an
international partner network. In addition to geographical
diversification, the underwriting business is also well
diversified over product lines and clients.
The Nordic P&C (property and casualty) insurance market
is relatively concentrated with the four largest insurers
accounting for approximately 70 to 90 per cent of the
markets in Norway, Finland and Sweden. In Denmark, the
market is less concentrated. Many of the main insurers
are established in more than one Nordic country, but If is
the only company with a significant market share in all
Nordic countries. Other market characteristics are high
customer retention levels and low expense ratios in the
range of 15 to 20 per cent.
If remains committed to reinforcing the market position
as the undifficult insurer. The basis for this position is
that an insurance should be easy to understand, buy and
use, which requires strong customer focus, leading digital
capabilities and underwriting excellence.
Underwriting Risks and Performance
If’s Nordic insurance operations are organized in
accordance with customer segments into the cross-border
Business Areas Private, Commercial (small and medium
sized companies) and Industrial (large corporates). The
Baltic operations comprise a separate Business Area
carried out through the Estonian company with branches
in Latvia and Lithuania. Business Area Private accounts
for more than half of the total premium income.
During 2019 the total underwriting performance for If
increased from EUR 630.6 million to EUR 669.1 million.
The performance for each Business Area is presented
below:
• Business Area Private: The underwriting performance
improved during the year due to premium growth
supported by good customer loyalty, relatively stable
claims costs and continued operational cost efficiency.
• Business Area Commercial: The underwriting result
deteriorated during the year mainly due to lower
run-off gains. The cost ratio was slightly improved.
The premium growth was altogether strong and well
above last year’s level.
• Business Area Industrial: The underwriting
performance improved during the year, mainly
reflecting the impact of a strong premium growth
compared to the preceding year. Also, a lower large
claims costs compared to the preceding year together
with continued operational cost efficiency contributed
positively to the overall performance development.
• Business Area Baltic: The underwriting performance
improved during the year due to a favourable frequency
claims outcome and continued operational cost
efficiency. The premium income was altogether stable
and in line with last year’s level.
The three major Solvency II Lines of Business in If are
Motor vehicle liability insurance, Other motor insurance
and Fire and other damage to property insurance. The
table Underwriting Performance, If, 31 December 2019
and 31 December 2018 presents the development of the
premiums, claims, operating expenses, reinsurer’s share
and underwriting performance per Solvency II Lines of
Business for the last two years.
SAMPO GROUP’S RISKSAND CORE RISK
MANAGEMENT ACTIVITIES
SAMPO GROUP’SSTRUCTURE ANDBUSINESS MODEL
SAMPO GROUPCAPITALIZATION APPENDICESMANDATUM LIFE
GROUP
RISK CONSIDERATIONSAT SAMPO GROUP LEVEL
AND SAMPO PLC
IF GROUP
TOPDANMARKGROUP
RISK MANAGEMENT REPORT 2019 14

Underwriting PerformanceIf, 31 December 2019 and 31 December 2018
Premiums written
Premiums earned
Claims incurred
Operating expense
Reinsurers share per LoB
Total underwriting performance direct
insuranceUnderwriting performance by SII LoB, EURm 2019 2018 2019 2018 2019 2018 2019 2018 2019 2018 2019 2018Medical expense insurance 274.6 137.9 269.0 136.9 186.7 76.5 68.4 36.4 1.0 0.1 12.8 23.8
Income protection insurance 331.4 422.9 320.8 410.9 193.3 252.1 86.6 93.4 -1.2 -1.6 42.1 67.0
Workers' compensation insurance 187.1 184.7 190.7 189.8 61.8 53.8 38.4 40.0 -4.8 2.8 95.3 93.2
Motor vehicle liability insurance 541.1 551.3 544.8 560.4 138.3 254.4 138.6 157.7 0.6 0.6 267.3 147.7
Other motor insurance 1,376.6 1,338.5 1,346.7 1,315.5 973.8 910.4 264.6 257.6 1.4 1.6 106.9 145.9
Marine, aviation and transport insurance 117.2 114.8 117.1 114.6 95.7 71.4 23.2 23.7 3.5 7.2 -5.3 12.3
Fire and other damage to property insurance 1,504.9 1,424.4 1,464.2 1,418.7 911.5 914.7 268.1 275.2 93.3 87.9 191.3 140.9
General liability insurance 297.3 273.2 285.7 266.1 172.4 108.8 51.1 46.0 6.7 34.2 55.5 77.2
Assistance 0.0 13.2 0.0 13.8 0.0 12.3 0.0 3.0 0.0 0.0 0.0 -1.5
Other life insurance 44.6 40.7 42.2 39.2 11.5 11.4 9.6 8.3 2.0 1.9 19.0 17.5
Annuities stemming from non-life insurance contracts and relating to health insurance obligations 0.0 0.0 0.0 0.0 73.8 59.7 0.0 0.0 0.0 0.0 -73.8 -59.7
Annuities stemming from non-life insurance contracts and relating to insurance obligations other than health insurance obligations 0.0 0.0 0.0 0.0 40.3 41.3 0.0 0.0 0.0 0.0 -40.3 -41.4
Total (excluding other expenses) 4,674.8 4,501.6 4,581.2 4,465.9 2,859.1 2,766.8 948.8 941.3 102.4 134.8 670.9 623.0
Other expenses 0.0 0.0 0.0 0.0 0.0 0.0 0.0 0.0 0.0 0.0 -1.8 7.7
Total 4,674.8 4,501.6 4,581.2 4,465.9 2,859.1 2,766.8 948.8 941.3 102.4 134.8 669.1 630.6
The figures are segmented in accordance with Solvency II defined Lines of Business, which differ from the insurance class segmentation according to local GAAP or IFRS requirements that are used in other tables.
SAMPO GROUP’S RISKSAND CORE RISK
MANAGEMENT ACTIVITIES
SAMPO GROUP’SSTRUCTURE ANDBUSINESS MODEL
SAMPO GROUPCAPITALIZATION APPENDICESMANDATUM LIFE
GROUP
RISK CONSIDERATIONSAT SAMPO GROUP LEVEL
AND SAMPO PLC
IF GROUP
TOPDANMARKGROUP
RISK MANAGEMENT REPORT 2019 15

Graph 1, 2, 3
Breakdown of Gross Written PremiumsIf, 31 December 2019, total EUR 4,675 million
● Private 2,706
● Commercial 1,188
● Industrial 632
● Baltic 149
The following adjustments from IFRS LoBs to Solvency II LoBs are made:• IFRS Line of Business Motor other and Motor third party liability (1,918) include Solvency II Line of Business Motor vehicle liability insurance (541) and Other motor insurance (1,377). • IFRS Line of Business Accident (651) includes Solvency II Line of Businesss Income protection insurance (331), Other life (45), Medical expense insurance (275) and Assistance (0).
By Business Area By Country By Line of Business
● Norway 1,641
● Sweden 1,481
● Finland 963
● Denmark 441
● Baltic 149
● Motor other and motor third party liability 1,918
● Workers' compensation 187
● Liability 291
● Accident 651
● Property 1,511
● Marine, aviation, transport 117
Premium and Catastrophe Risk and Their Management and Control
Definitions of premium and catastrophe risk can be found
in Appendix 2 Risk Definitions.
Despite the diversified portfolio, risk concentrations
and consequently severe claims may arise through, for
example, exposures to natural catastrophes such as
storms and floods. The geographical areas most exposed
to such events are Denmark, Norway and Sweden. In
addition to natural catastrophes, single large claims could
have an impact on the result of insurance operations. The
negative economic impact of natural catastrophes and
single large claims is effectively mitigated by having a
well-diversified portfolio and a group-wide reinsurance
program in place.
The following adjustments from IFRS Lines of Business to Solvency II Lines of Business are made:
• IFRS Line of Business Motor other and Motor third party liability (1,918) include Solvency II Line of Business Motor vehicle liability insurance (541) and Other motor insurance (1,377).
• IFRS Line of Business Accident (651) includes Solvency II Line of Businesses Income protection insurance (331), Other Life (45), Medical expense insurance (275) and Assistance (0).
As shown in the following graph Breakdown of Gross
Written Premiums by Business Area, Country and
Line of Business, If, 31 December 2019, the If insurance
portfolio is well diversified across Business Areas,
Countries and Lines of Business. The six Lines of Business
are segmented in accordance with insurance class
segmentation used in IFRS.
There are minor differences between the figures reported
by Sampo Group and If due to differences in foreign
exchange rates used in consolidation.
SAMPO GROUP’S RISKSAND CORE RISK
MANAGEMENT ACTIVITIES
SAMPO GROUP’SSTRUCTURE ANDBUSINESS MODEL
SAMPO GROUPCAPITALIZATION APPENDICESMANDATUM LIFE
GROUP
RISK CONSIDERATIONSAT SAMPO GROUP LEVEL
AND SAMPO PLC
IF GROUP
TOPDANMARKGROUP
RISK MANAGEMENT REPORT 2019 16

The sensitivity of the underwriting result and hence
underwriting risk is presented by changes in certain
key figures in the table Sensitivity Test of Underwriting
Result, If, 31 December 2019 and 31 December 2018.
The Underwriting Committee shall give its opinion on
and propose actions in respect of various issues related
to underwriting risk. The committee also considers and
proposes changes to the Underwriting Policy, which is
the principal policy for underwriting, and sets general
principles, restrictions and directions for the under-
writing activities. This document shall be reviewed and
approved at least yearly by the Boards of Directors.
The Chairman of the Underwriting Committee is respon-
sible for the approval of underwriting deviations defined
in the Underwriting Policy and other issues dealt with by
the committee.
The Underwriting Policy is supplemented with guidelines
outlining in greater detail how to conduct underwriting
within each Business Area. These guidelines cover areas
such as tariff and rating models for pricing, guidelines in
respect of standard conditions and manuscript wordings,
as well as authorities and limits. In accordance with
the instructions for the Underwriting Committee, the
Committee monitors compliance with the established
underwriting principles.
The Business Areas manage the underwriting risk
on a day-to-day basis. A crucial factor affecting the
profitability and risk of non-life insurance operations
is the ability to accurately estimate future claims and
expenses and thereby correctly price insurance contracts.
The premiums within the Private Business Area and
the premiums for smaller risks within the Commercial
Business Area are set through tariffs. The underwriting of
risks in the Industrial Business Area and of more complex
risks within the Commercial Business Area is to a greater
extent based on principles and individual underwriting
than on tariffs. In general, pricing is based on statistical
analyses of historical claims data and assessments of
the future development of claims frequency and claims
inflation.
If’s Reinsurance Policy stipulates guidelines for the
purchase of reinsurance. The need and optimal choice
of reinsurance is evaluated by considering the expected
cost versus the benefit of the reinsurance, the impact
on result volatility and capital requirements. The main
tool for this evaluation is If’s internal model in which
frequency claims, large claims and natural catastrophes
are modelled.
A group-wide reinsurance program has been in place in
If since 2003. In 2019, retention levels were between SEK
100 million (approximately EUR 9.4 million) and SEK 250
million (approximately EUR 23.6 million) per risk and SEK
250 million (approximately EUR 23.6 million) per event.
Sensitivity Test of Underwriting ResultIf, 31 December 2019 and 31 December 2018
Effect on pretax profit, EURm
Key figureCurrent
level (2019) Change in current level 2019 2018Combined ratio, business area Private 82.0% +/- 1 percentage point +/- 26 +/- 26
Combined ratio, business area Commercial 88.3% +/- 1 percentage point +/- 12 +/- 12
Combined ratio, business area Industrial 89.3% +/- 1 percentage point +/- 4 +/- 4
Combined ratio, business area Baltics 87.0% +/- 1 percentage point +/- 1 +/- 1
Net premiums earned (EURm) 4,388 +/- 1 per cent +/- 44 +/- 43
Net claims incurred (EURm) 3,000 +/- 1 per cent +/- 30 +/- 30
Ceded written premiums (EURm) 200 +/- 10 per cent +/- 20 +/- 18
SAMPO GROUP’S RISKSAND CORE RISK
MANAGEMENT ACTIVITIES
SAMPO GROUP’SSTRUCTURE ANDBUSINESS MODEL
SAMPO GROUPCAPITALIZATION APPENDICESMANDATUM LIFE
GROUP
RISK CONSIDERATIONSAT SAMPO GROUP LEVEL
AND SAMPO PLC
IF GROUP
TOPDANMARKGROUP
RISK MANAGEMENT REPORT 2019 17

Reserve Risk and Its Management and Control
Definition of reserve risk can be found in Appendix 2
Risk Definitions.
The main reserve risks for If are stemming from
uncertainty in the claim amounts caused by higher
than expected claims inflation, change in the indexing
of annuities in Sweden, change in discount rates or an
increased retirement age with the consequences that both
annuities and lump sum payments would increase.
In the table Technical Provisions by Line of Business
and Major Geographical Area, If, 31 December 2019, the
technical provisions and durations of If are presented by
Line of Business and major geographical area. Finland’s
and Sweden’s share of technical provisions is larger than
the share of gross written premiums, which is mainly due
to Sweden and Finland having a long duration of Motor
other and Motor third party liability (“MTPL”) and Finland
also having a long duration of Workers compensation. The
long duration is mainly due to annuities in these Lines
of Business, which increases the amount of technical
provisions. The duration of the provisions, and thus the
sensitivity to changes in interest rates, varies with each
product portfolio. The weighted average duration for 2019
across the product portfolios was 6.5 years.
Technical Provisions by Line of Business and Major Geographical AreaIf, 31 December 2019
Sweden Norway Finland Denmark Baltics TotalEURm Duration EURm Duration EURm Duration EURm Duration EURm Duration EURm Duration
Motor other and MTPL 2,120 7.2 534 1.4 1,020 13.3 160 1.7 111 4.5 3,945 7.7
Workers' compensation 0 0.0 186 4.9 1,169 12.4 258 8.0 0 0.0 1,613 10.9
Liability 280 2.8 114 3.2 105 4.0 77 2.8 26 2.7 601 3.1
Accident 371 6.3 397 5.1 169 4.3 104 1.6 7 0.6 1,048 5.0
Property 402 1.1 493 1.1 239 0.9 103 0.8 34 0.8 1,271 1.0
Marine, aviation, transport 25 1.3 36 1.1 8 1.3 17 1.0 2 0.7 89 1.1
Total 3,198 5.9 1,760 2.6 2,710 10.9 719 3.5 181 3.3 8,568 6.5
SAMPO GROUP’S RISKSAND CORE RISK
MANAGEMENT ACTIVITIES
SAMPO GROUP’SSTRUCTURE ANDBUSINESS MODEL
SAMPO GROUPCAPITALIZATION APPENDICESMANDATUM LIFE
GROUP
RISK CONSIDERATIONSAT SAMPO GROUP LEVEL
AND SAMPO PLC
IF GROUP
TOPDANMARKGROUP
RISK MANAGEMENT REPORT 2019 18

Reserves are exposed mainly to inflation and discount
rates and to some extent to life expectancy. The sensitivity
of If’s technical provisions to an increase in inflation, an
increase in life expectancy and a decrease in the discount
rate is presented in the table Sensitivities of Technical
Provisions, If, 31 December 2019.
The technical provisions are further analyzed by claims
years. The output from this analysis is illustrated
both before and after reinsurance in the claims cost
trend tables. These are disclosed in the Note 26 to the
Financial Statements (www.sampo.com/year2019).
The anticipated inflation trend is considered when
calculating all provisions and is of the utmost importance
for claims settled over a long period of time, such as Motor
other, Motor third party liability and Workers’ compen-
sation. The anticipated inflation is based on external
assessments of the inflation trend in various areas, such
as the consumer price index and payroll index, combined
with If’s own estimation of costs for various types of
claims. For Lines of Business such as Motor other, Motor
third party liability and Workers’ compensation, legis-
lation differs significantly between countries. Some of
the technical provisions for these lines include annuities
which are sensitive to changes in mortality assumptions
and discount rates. The proportion of technical provisions
related to Motor other, Motor third party liability and
Workers’ compensation was 65 per cent.
The indexing of Swedish Motor third party liability
annuities is one of the factors that affects the value of
annuities. The choice of index is stipulated in regulation
and is therefore exposed to regulatory change through e.g.
a political decision. The retirement age is another factor
that affects the value of annuities since these decrease or
expire at retirement. An increased retirement age through
for example a political decision, will therefore increase
the value of annuities. The present value of annuities
is also sensitive to changes in the discount rates used
to discount the nominal cash flows. The most material
balances in If of annuities with significant sensitivity to
discount rates relates to the business in Sweden, Finland
and Denmark.
The Board of Directors of If decides on the guidelines
governing the calculation of technical provisions.
The Chief Actuary is responsible for developing and
Sensitivities of Technical Provisions If, 31 December 2019
Technical provision item Risk factor Change in risk parameter CountryEffect
EURm 2019
Nominal provisions Inflation increase Increase by
1 percentage point
Sweden 158.3
Denmark 12.2
Norway 51.5
Finland 33.4
Annuities and estimated share of claims provisions to future annuities Decrease in mortality
Life expectancy increase
by 1 year
Sweden 24.5
Denmark 1.7
Finland 67.0
Discounted provisions (annuities and part of Finnish IBNR)
Decrease in discount rate Decrease by
1 percentage point
Sweden 68.0
Denmark 17.8
Finland 299.4
SAMPO GROUP’S RISKSAND CORE RISK
MANAGEMENT ACTIVITIES
SAMPO GROUP’SSTRUCTURE ANDBUSINESS MODEL
SAMPO GROUPCAPITALIZATION APPENDICESMANDATUM LIFE
GROUP
RISK CONSIDERATIONSAT SAMPO GROUP LEVEL
AND SAMPO PLC
IF GROUP
TOPDANMARKGROUP
RISK MANAGEMENT REPORT 2019 19

presenting guidelines on how the technical provisions
are to be calculated and for assessing whether the level of
total provisions is sufficient. On If level, the Chief Actuary
issues a quarterly report on the adequacy of technical
provisions.
The Actuarial Committee is a preparatory and advisory
board for If Chief Actuary. The committee secures a
comprehensive view over reserve risk, discusses and
gives recommendations on policies and guidelines for
calculating technical provisions.
The actuaries continuously monitor the level of
provisions to ensure that they comply with the
established guidelines. The actuaries also develop
methods and systems to support these processes.
The actuarial estimates are based on historical claims and
existing exposures that are available at the balance sheet
date. Factors that are monitored include loss development
trends, the level of unpaid claims, changes in legislation,
case-law and economic conditions. When setting the
non-life and life provisions, established actuarial and
statistical methods are used.
SAMPO GROUP’S RISKSAND CORE RISK
MANAGEMENT ACTIVITIES
SAMPO GROUP’SSTRUCTURE ANDBUSINESS MODEL
SAMPO GROUPCAPITALIZATION APPENDICESMANDATUM LIFE
GROUP
RISK CONSIDERATIONSAT SAMPO GROUP LEVEL
AND SAMPO PLC
IF GROUP
TOPDANMARKGROUP
RISK MANAGEMENT REPORT 2019 20

Market Risks and Investment Performance
Fixed income investments and listed equity
instruments form the major part of the investment
portfolio of EUR 11,109 million (11,092). A large part of
the fixed income investments was at 31 December 2019
concentrated to financial institutions. The role of real
estate, private equity, and other alternative investments is
immaterial.
The composition of the investment portfolios by asset
classes in If at year end 2019 and at year end 2018 and
average maturities of fixed income investments are shown
in the table Investment Allocation, If, 31 December 2019
and 31 December 2018.
Investment AllocationIf, 31 December 2019 and 31 December 2018
31 Dec 2019 31 Dec 2018
Asset ClassMarket value,
EURm WeightAverage maturity,
yearsMarket value,
EURm WeightAverage maturity,
yearsFixed income total 9,808 88% 2.8 9,949 90% 2.7
Money market securities and cash 454 4% 0.1 370 3% 0.0
Government bonds 662 6% 3.8 884 8% 3.1
Credit bonds, funds and loans 8,692 78% 2.8 8,696 78% 2.8
Covered bonds 2,616 24% 2.5 2,683 24% 2.4
Investment grade bonds and loans 3,582 32% 2.8 3,770 34% 2.7
High-yield bonds and loans 1,587 14% 3.4 1,469 13% 3.4
Subordinated / Tier 2 467 4% 3.2 428 4% 4.0
Subordinated / Tier 1 440 4% 2.2 346 3% 2.5
Hedging swaps 0 0% - 0 0% -
Policy loans 0 0% 0.0 0 0% 0.0
Listed equity total 1,281 12% - 1,113 10% -
Finland 0 0% - 0 0% -
Scandinavia 865 8% - 769 7% -
Global 417 4% - 344 3% -
Alternative investments total 21 0% - 31 0% -
Real estate 3 0% - 12 0% -
Private equity 9 0% - 19 0% -
Biometric 0 0% - 0 0% -
Commodities 0 0% - 0 0% -
Other alternative 9 0% - 0 0% -
Trading derivatives 0 0% - -2 0% -
Asset classes total 11,109 100% - 11,092 100% -
FX Exposure, gross position 113 - - 229 - -
SAMPO GROUP’S RISKSAND CORE RISK
MANAGEMENT ACTIVITIES
SAMPO GROUP’SSTRUCTURE ANDBUSINESS MODEL
SAMPO GROUPCAPITALIZATION APPENDICESMANDATUM LIFE
GROUP
RISK CONSIDERATIONSAT SAMPO GROUP LEVEL
AND SAMPO PLC
IF GROUP
TOPDANMARKGROUP
RISK MANAGEMENT REPORT 2019 21

Graph 4
20142010 20152011 20162012 20172013 2018
%
15
10
5
0
-5
Annual Investment Returns at Market ValuesIf, 2010–2019
4.1
7.4
1.51.82.9
6.1
2.6 -0.8
5.0
2019
5.0
Market Risks of Fixed Income and Equity Instruments
Spread Risk and Equity Risk
Spread risk and equity risk are derived only from the asset
side of the balance sheet. Exposures in fixed income and
During 2019 the market volatility decreased, spreads were
tightening and the performance in equities was strong.
The return of investments during 2019 amounted to 5.0
per cent. The average return of investments has been
3.6 per cent during the years 2010–2019. Returns have
rebound in 2019 despite lowering interest rates, mainly
due to strong equity markets.
If’s investment management strategy is conservative, with
a low equity share and low fixed-income duration.
Both investment performance and market risk are actively
monitored and controlled by the Investment Control
Committee monthly and reported to the Own Risk and
Solvency Assessment Committee (“ORSA Committee”)
quarterly. In addition, the allocation limits, issuer and
counterparty limits, the sensitivity limits for interest
rates and credit spreads as well as regulatory capital
requirements are regularly monitored.
equity instruments are presented by sector, asset class
and rating in the following table, which also includes
counterparty risk exposures relating to derivative
transactions. Counterparty default risks are described in
more detail in section Counterparty Default Risks. Due
to differences in the reporting treatment of derivatives,
the figures in the table are not fully comparable with other
tables in Sampo Group’s Financial Statements.
SAMPO GROUP’S RISKSAND CORE RISK
MANAGEMENT ACTIVITIES
SAMPO GROUP’SSTRUCTURE ANDBUSINESS MODEL
SAMPO GROUPCAPITALIZATION APPENDICESMANDATUM LIFE
GROUP
RISK CONSIDERATIONSAT SAMPO GROUP LEVEL
AND SAMPO PLC
IF GROUP
TOPDANMARKGROUP
RISK MANAGEMENT REPORT 2019 22

Exposures by Sector, Asset Class and RatingIf, 31 December 2019
EURm AAA
AA+ -
AA-
A+ -
A-
BBB+ -
BBB-
BB+ -
C DNon- rated
Fixed income
totalListed
equities OtherCounter-
party risk Total
Change from
31 Dec 2018
Basic industry 0 0 20 87 20 0 11 139 39 0 0 178 18
Capital goods 0 0 61 41 10 0 121 232 454 0 0 686 134
Consumer products 0 0 170 275 16 0 85 546 221 0 0 768 -83
Energy 0 0 0 0 34 0 128 163 8 0 0 171 -140
Financial institutions 37 1,015 1,058 743 84 0 54 2,991 0 0 3 2,995 115
Governments 9 0 0 0 0 0 0 9 0 0 0 9 -124
Government guaranteed 9 27 0 0 0 0 0 36 0 0 0 36 0
Health care 7 0 10 27 0 0 36 80 82 0 0 162 -4
Insurance 0 0 42 82 26 0 42 192 0 0 0 192 2
Media 0 0 0 0 0 0 16 16 0 0 0 16 -6
Packaging 0 0 0 0 0 0 15 15 0 0 0 15 10
Public sector, other 514 66 0 0 0 0 0 579 0 0 0 579 -136
Real estate 0 5 88 268 55 0 545 961 0 3 0 965 171
Services 0 0 0 44 69 0 33 146 0 0 0 146 -34
Technology and electronics 0 0 19 13 10 0 105 147 0 0 0 147 48
Telecommunications 0 0 21 133 48 0 0 202 60 0 0 261 -22
Transportation 0 58 27 31 0 0 231 347 1 0 0 348 77
Utilities 0 0 61 114 118 0 29 322 0 0 0 322 -46
Others 0 26 0 0 0 0 27 53 0 9 0 63 21
Asset-backed securities 0 0 0 0 0 0 0 0 0 0 0 0 0
Covered bonds 2,535 70 11 0 0 0 0 2,616 0 0 0 2,616 -67
Funds 0 0 0 0 0 0 0 0 417 8 0 425 62
Clearing house 0 0 0 0 0 0 0 0 0 0 0 0 0
Total 3,110 1,268 1,589 1,858 491 0 1,478 9,794 1,281 21 3 11,099 -3
Change from 31 Dec 2018 -270 -111 -124 80 102 0 161 -163 168 -10 2 -3 0
The figures include bank account balances related to insurance activities.
SAMPO GROUP’S RISKSAND CORE RISK
MANAGEMENT ACTIVITIES
SAMPO GROUP’SSTRUCTURE ANDBUSINESS MODEL
SAMPO GROUPCAPITALIZATION APPENDICESMANDATUM LIFE
GROUP
RISK CONSIDERATIONSAT SAMPO GROUP LEVEL
AND SAMPO PLC
IF GROUP
TOPDANMARKGROUP
RISK MANAGEMENT REPORT 2019 23

Most of the fixed income exposures are in investment
grade issues and currently the role of Nordic covered
bonds and Nordic banks as issuers is central. Within fixed
income investments part of the money market securities,
cash and investment grade government bonds form a
liquidity buffer.
In the equity portfolio, most of the equity investments
are selectively chosen direct investments in the Nordic
markets. When investing in non-Nordic equities, funds
or other assets, third party managed investments are
mainly used. The changes in equity positions during the
year can be seen in the graph Breakdown of Listed Equity
Investments by Geographical Regions, If, 31 December
2019 and 31 December 2018.
Market Risks of Balance Sheet
Asset and Liability Management Risk
Asset and Liability Management (“ALM”) risk is defined in
Appendix 2 Risk Definitions.
The ALM risk is considered through the risk appetite
framework and its management and governance are based
on If’s Investment Policies. In general, to maintain the
ALM risk within the overall risk appetite, the cash flows
of insurance liabilities are matched by investing in fixed
146 120
83 86
117 147
48 26
748 622
139 112
Breakdown of Listed Equity Investments by Geographical RegionsIf
● Denmark 0%
● Norway 9%
● Sweden 58%
● Finland 0%
● Western Europe 11%
● Eastern Europe 0%
● North America 7%
● Latin America 4%
● Far East 11%
● Denmark X
● Norway X
● Sweden X
● Finland X
● Länsi-Eurooppa X
● Itä-Eurooppa X
● Pohjois-Amerikka X
● Latinalainen Amerikka X
● Kaukoitä X
● Denmark 0%
● Norway 13%
● Sweden 56%
● Finland 0%
● Western Europe 10%
● Eastern Europe 0%
● North America 8%
● Latin America 2%
● Far East 11%
31 December 2019total EUR 1,281 million
31 December 2018Total EUR 1,113 million
income instruments denominated in the same currencies
as the liabilities. Derivatives can be used to manage the
ALM risk.
Interest Rate Risk
In general, If is negatively affected when interest rates
are decreasing or remaining at low levels, as the duration
of liabilities in If is longer than the duration of assets.
If has over the years gradually decreased its combined
ratio level to counteract falling interest rates. Interest
rate sensitivity in terms of the average duration of fixed
income investments was 1.3. The respective duration of
insurance liabilities was 6.5. Interest rate risk is managed
by changing the duration of assets and interest rate
derivatives based on the market view and risk appetite.
In the financial accounts, most of the technical
provisions are nominal, while the annuity and annuity
IBNR reserves, are discounted using interest rates in
accordance with the regulatory rules. Accordingly,
SAMPO GROUP’S RISKSAND CORE RISK
MANAGEMENT ACTIVITIES
SAMPO GROUP’SSTRUCTURE ANDBUSINESS MODEL
SAMPO GROUPCAPITALIZATION APPENDICESMANDATUM LIFE
GROUP
RISK CONSIDERATIONSAT SAMPO GROUP LEVEL
AND SAMPO PLC
IF GROUP
TOPDANMARKGROUP
RISK MANAGEMENT REPORT 2019 24

from an accounting perspective, If is mainly exposed
to changes in inflation and regulatory discount rates.
From an economic perspective, in which the cash flows
of insurance liabilities are discounted with prevailing
interest rates, If is exposed to changes both in inflation
and nominal interest rates. For more information see the
table Sensitivities of Technical Provisions, If, 2019 in
the section Underwriting Risks and Performance.
Currency Risk
If writes insurance policies that are mostly denominated
in the Scandinavian currencies and in the euro. The
currency risk is to a large extent reduced by matching
technical provisions with investment assets denominated
in the corresponding currencies or by using currency
derivatives. The currency exposure in insurance
operations is hedged to the base currency on a regular
basis. The currency exposure in investment assets is
controlled weekly and hedged when the exposure has
reached a specific level, set with respect to cost efficiency
and minimum transaction size. An active currency
management can be performed within set limits. The
transaction risk positions against the Swedish krona
are shown in the table Transaction Risk Position, If, 31
December 2019. The table shows the net transaction risk
exposures and the changes in the value of positions given
a 10 per cent decrease in the value of the base currency.
In addition to transaction risk, If is also exposed to
translation risk which at the Group level stems from
foreign operations with other base currencies than SEK.
Translation risk, and its management principles in Sampo
Group, are described in the Appendix 4 Profitability,
Risks and Capital.
Transaction Risk PositionIf, 31 December 2019Base currency, SEKm EUR USD JPY GBP SEK NOK CHF DKK Other Total, netInsurance operations -3,276 -143 -1 -3 -8 -1,977 -3 -806 -17 -6,232
Investments 2,311 453 0 0 0 2,112 0 132 1 5,009
Derivatives 947 -345 0 2 16 -113 4 681 7 1,199
Transaction risk, net position -18 -35 0 -1 9 22 1 7 -9 -24
Sensitivity: SEK -10% -2 -3 0 0 1 2 0 1 -1 -2
If's transaction risk position in SEK represents exposure in foreign subsidiaries /branches within If with base currency other than SEK.
SAMPO GROUP’S RISKSAND CORE RISK
MANAGEMENT ACTIVITIES
SAMPO GROUP’SSTRUCTURE ANDBUSINESS MODEL
SAMPO GROUPCAPITALIZATION APPENDICESMANDATUM LIFE
GROUP
RISK CONSIDERATIONSAT SAMPO GROUP LEVEL
AND SAMPO PLC
IF GROUP
TOPDANMARKGROUP
RISK MANAGEMENT REPORT 2019 25

Liquidity Risk
In If, liquidity risk is limited, since premiums are
collected in advance and large claims payments are
usually known a long time before they fall due. Liquidity
risks are managed by cash management functions which
are responsible for liquidity planning. Liquidity risk is
reduced by having investments that are readily tradable
resulting from expected cash inflows and outflows arising
from financial assets and liabilities as well as technical
provisions.
If has a relatively low amount of financial liabilities and
thus the refinancing risk is small.
in liquid markets. The liquidity of financial assets is
analysed and reported to the ORSA Committee.
The maturities of technical provisions and financial
assets and liabilities are presented in the table Cash Flows
According to Contractual Maturity, If, 31 December 2019.
The average maturity of fixed income investments was 2.8
years in If. The table shows the financing requirements
Cash Flows According to Contractual MaturityIf, 31 December 2019
EURm
Carrying amount
total
Carrying amount without
contractual maturity
Carrying amount with contractual
maturity
Cash flows
2020 2021 2022 2023 2024 2025–2034 2035–Financial assets 12,679 1,626 11,053 1,477 2,167 2,033 1,590 1,839 898 0
of which interest rate swaps 0 0 0 0 0 0 0 0 0 0
Financial liabilities 1,118 2 1,116 -30 -316 -3 -96 0 0 0
of which interest rate swaps 25 0 25 -26 -1 0 0 0 0 0
Lease liabilities 124 0 124 -23 -23 -19 -13 -11 -47 0
Net technical provisions 8,568 0 8,568 -3,061 -993 -589 -417 -334 -1,868 -1,695
In the table, financial assets and liabilities are divided into contracts that have an exact contractual maturity profile, and other contracts. Only the carrying amount is shown for the other contracts. In addition, the table shows expected cash flows for net technical provisions, which by their nature, are associated with a certain degree of uncertainty.
Counterparty Default Risks
In If, the major three sources of counterparty risk are
reinsurance, financial derivatives and other receivables.
Counterparty default risk arising from receivables from
policyholders and other receivables related to commercial
transactions is very limited, because non-payment
of premiums generally results in cancellation of the
insurance policies.
Reinsurance Counterparty Risk
Reinsurance is used regularly to utilize If’s own capital
base efficiently and reduce the cost of capital, limit large
fluctuations of underwriting results and have access to the
reinsurers’ competence base. The Reinsurance Committee
(“RC”) is a collaboration forum for reinsurance related
issues in general and shall give its opinion on and propose
actions in respect of such issues. The committee shall
consider and propose changes to the Reinsurance Policy
and the Internal Reinsurance Policy. The Chairman is
responsible for reporting policy deviations and other
issues dealt with by the committee.
SAMPO GROUP’S RISKSAND CORE RISK
MANAGEMENT ACTIVITIES
SAMPO GROUP’SSTRUCTURE ANDBUSINESS MODEL
SAMPO GROUPCAPITALIZATION APPENDICESMANDATUM LIFE
GROUP
RISK CONSIDERATIONSAT SAMPO GROUP LEVEL
AND SAMPO PLC
IF GROUP
TOPDANMARKGROUP
RISK MANAGEMENT REPORT 2019 26

The distribution of reinsurance receivables and
reinsurers’ portion of outstanding claims on 31 December
2019 per rating category is presented in the table
Reinsurance Recoverables, If, 31 December 2019 and
31 December 2018. In the table EUR 136 million (142) of
reinsurance recoverables are excluded, which mainly
relates to captives and statutory pooled solutions.
Because the recoverables reported above are typically not
covered by collaterals the whole amount is exposed to
counterparty risk.
If has a Reinsurance Security Policy that sets require-
ments for the reinsurers’ minimum credit ratings
and the maximum exposure to individual reinsurers.
Also, the own credit-analysis plays a central role when
counterparties are selected.
The Reinsurance Security Committee shall give input
and suggestions to decisions in respect of various issues
regarding reinsurance default risk and risk exposure,
as well as proposed deviations from the Reinsurance
Security Policy. The Chairman is responsible for reporting
policy deviations and other issues dealt with by the
committee.
Most of the reinsurers have ratings between AA+ and
A-. The ten largest individual reinsurance recoverables
amounted to EUR 161 million, representing 70 per cent of
the total reinsurance recoverables including captives and
statutory pooled solutions.
The total ceded premium related to treaty and facultative
reinsurance amounted to EUR 55.2 million. Of this
amount, 100 per cent was related to reinsurance counter-
parties with a credit rating of A- or higher.
Counterparty Risk Related to Financial Derivatives
In If, the default risk of derivative counterparties is
a by-product of managing market risks. The role of
long-term interest rate derivatives has been immaterial
and counterparty risk stems mainly from short-term FX
derivatives. The counterparty risk of bilaterally settled
derivatives is mitigated by a careful selection of counter-
parties, by diversification of counterparties to prevent
risk concentrations and by using collateral techniques,
e.g. ISDA Master Agreements backed by Credit Support
Annexes. If settles interest rate swaps in central clearing
houses, which mitigates bilateral counterparty risk but
also results in a systemic risk exposure related to central-
ised clearing parties.
Reinsurance RecoverablesIf, 31 December 2019 and 31 December 2018
31 Dec 2019 31 Dec 2018Rating Total, EURm % Total, EURm %AAA 0 0% 0 0%
AA+ - A- 94 99% 82 99%
BBB+ - BBB- 1 1% 1 1%
BB+ - C 0 0% 0 0%
D 0 0% 0 0%
Non-rated 0 0% 0 0%
Total 95 100% 83 100%
SAMPO GROUP’S RISKSAND CORE RISK
MANAGEMENT ACTIVITIES
SAMPO GROUP’SSTRUCTURE ANDBUSINESS MODEL
SAMPO GROUPCAPITALIZATION APPENDICESMANDATUM LIFE
GROUP
RISK CONSIDERATIONSAT SAMPO GROUP LEVEL
AND SAMPO PLC
IF GROUP
TOPDANMARKGROUP
RISK MANAGEMENT REPORT 2019 27

Operational Risks
If has issued several steering documents which are
relevant for the management of operational risks. These
include but are not limited to the Operational Risk Policy,
Business Continuity and Security Policy and Information
Security Policy. Also, If has processes and instructions
in place to manage the risk of external and internal
fraud. Policies and other internal steering documents are
reviewed and updated at least yearly. Internal training on
ethical rules and guidelines is provided to employees on a
regular basis.
Operational risks are identified and assessed through
the Operational and Compliance Risk Assessment
(“OCRA”) process. Self-assessments to identify, measure,
manage and monitor operational risks are performed and
reported by the line organization periodically. Identified
operational risks are assessed from a likelihood and
impact perspective. The residual risk for each operational
risk is assessed using a traffic light system. The process
is supported by an operational risk coordinator network
and the results are challenged and aggregated by the Risk
Management function. The most significant risks are
reported to the Operational Risk Committee, the ORSA
Committee and to the Board of Directors.
A system is implemented for incident reporting proce-
dures and follow-up. Incident data is used to analyse
operational risks and severe incidents are tracked to
ensure proper actions are taken.
Capitalization
If’s subsidiaries calculate their solo regulatory Solvency
Capital Requirements (“SCR”) as follows:
• If P&C Insurance Ltd (publ) is applying a partial internal
model approved by the Swedish Financial Supervisory
Authority for the calculation of the SCR. The main
non-life underwriting risks are calculated according to
an internal model while the standard formula (“SF”)
with transitional equity measures is applied for other
risk modules.
• Other companies use the SF when calculating SCRs.
For If Group, there is no regulatory requirement to
calculate SCR or own funds. However, for management
purposes a so-called Economic Capital (“EC”) is
calculated by applying internal methods for the main
non-life underwriting risks in all geographical areas and
for market risks. The SF is applied for other risks. The
EC is used for the quantification of own solvency needs,
internal risk reporting and decision-making and as a
basis for capital allocation. Further, If aims to maintain
an A-rating for If P&C Insurance Ltd (publ) by S&P and
Moody's.
As input to the Sampo Group level capital requirement,
If applies the SF with transitional equity measures.
Since the SF SCR does not consider any geographical
diversification between countries the contribution of
underwriting risks of If are conservative at Sampo Group
level.
To maintain consistency within this Sampo Group risk
report, only the SF figures applying transitional equity
measures of If are disclosed in the following paragraphs.
SAMPO GROUP’S RISKSAND CORE RISK
MANAGEMENT ACTIVITIES
SAMPO GROUP’SSTRUCTURE ANDBUSINESS MODEL
SAMPO GROUPCAPITALIZATION APPENDICESMANDATUM LIFE
GROUP
RISK CONSIDERATIONSAT SAMPO GROUP LEVEL
AND SAMPO PLC
IF GROUP
TOPDANMARKGROUP
RISK MANAGEMENT REPORT 2019 28

Graph 6
SolvencyIf, 31 December 2019
EURm
Insurance risk
1,890 3,592
Market risk
1,265
Counter-party risk
Diversifi- cation
Operational risk
LAC of DT*
1,153
SCR
101
-483 154 10
Own funds
* Loss absorbing capacity of deferred taxes
Related under- takings
4,000
3,500
3,000
2,500
2,000
1,500
1,000
500
0
-309
In If, own funds at the end of 2019 were EUR 3,592 million
(3,599) while the SF SCR applying transitional measures
on equity holdings was EUR 1,890 million (1,833). Hence,
the solvency ratio was 190 per cent (196) and the buffer
was EUR 1,702 million (1,766). In the graph Solvency, If,
31 December 2019, SCR is divided into risk contributions.
The diversification benefit between risks is also presented
in the graph.
If’s own funds structure is presented in the table Eligible
Own Funds, If, 31 December 2019 and 31 December
2018. Tier 1 items cover 82 per cent of own funds and the
amount of Tier 3 items is immaterial. Norwegian Natural
Perils Fund forms 52 per cent of Tier 2.
Over the last four years If has paid dividends to Sampo
plc almost equal to its net profit. The remaining net
profits have accumulated into the retained earnings in the
reconciliation reserve that is included in Tier 1.
Eligible Own FundsIf, 31 December 2019 and 31 December 2018EURm 2019 2018Tier 1 Total 2,952 2,971
Ordinary share capital 261 266
Reconciliation reserve 2,594 2,609
Subordinated liabilities 96 97
Tier 2 Total 639 626
Subordinated liabilities 307 313
Untaxed reserves 332 313
Tier 3 Total 1 2
Deferred tax assets 1 2
Eligible own funds 3,592 3,599
SAMPO GROUP’S RISKSAND CORE RISK
MANAGEMENT ACTIVITIES
SAMPO GROUP’SSTRUCTURE ANDBUSINESS MODEL
SAMPO GROUPCAPITALIZATION APPENDICESMANDATUM LIFE
GROUP
RISK CONSIDERATIONSAT SAMPO GROUP LEVEL
AND SAMPO PLC
IF GROUP
TOPDANMARKGROUP
RISK MANAGEMENT REPORT 2019 29

EUR 403 million (409) i.e. 11.2 per cent (11.4) of own
funds consisted of subordinated debt at the end of 2019.
As at 31 December 2019, Sampo plc holds subordinated
liabilities issued by If with a nominal value of EUR 98.9
Solvency II Compliant Subordinated LiabilitiesIf, 31 December 2019
Issuer Instrument Nominal amountCarrying amount
in EUR (IFRS) First call TieringNominal amount in
Sampo plc's portfolioIf P&C Insurance Ltd (publ) (Sweden) 30NC10 EUR 110,000,000 109,739,310 08/12/2021 Tier 2 EUR 98,935,000
If P&C Insurance Holding Ltd (Sweden) 30NC5 SEK 500,000,000 47,725,323 01/12/2021 Tier 2 0
If P&C Insurance Holding Ltd (Sweden) 30NC5 SEK 1,500,000,000 143,178,991 01/12/2021 Tier 2 0
If P&C Insurance Holding Ltd (Sweden) PerpNC5 SEK 1,000,000,000 95,075,433 22/03/2023 Tier 1 0
395,719,056
million, as presented in the table Solvency II Compliant
Subordinated Liabilities, If, 31 December 2019.
In summary, If’s solvency is adequate, and the capital
structure is strong. High and stable profitability and
capacity to issue subordinated debt if needed puts If in
a strong position to generate capital and to maintain a
capital level needed for operations in the future as well.
SAMPO GROUP’S RISKSAND CORE RISK
MANAGEMENT ACTIVITIES
SAMPO GROUP’SSTRUCTURE ANDBUSINESS MODEL
SAMPO GROUPCAPITALIZATION APPENDICESMANDATUM LIFE
GROUP
RISK CONSIDERATIONSAT SAMPO GROUP LEVEL
AND SAMPO PLC
IF GROUP
TOPDANMARKGROUP
RISK MANAGEMENT REPORT 2019 30
TOPDANMARK GROUP
32Topdanmark
Group
34Underwriting
Risks and Performance
42Market Risks
and Investment Performance
49Counterparty Default Risks
49Operational
Risks
51Capitalization
SAMPO GROUP’S RISKSAND CORE RISK
MANAGEMENT ACTIVITIES
IF GROUP
SAMPO GROUP’SSTRUCTURE ANDBUSINESS MODEL
SAMPO GROUPCAPITALIZATION APPENDICESMANDATUM LIFE
GROUP
RISK CONSIDERATIONSAT SAMPO GROUP LEVEL
AND SAMPO PLC
TOPDANMARKGROUP
RISK MANAGEMENT REPORT 2019 31
Topdanmark provides insurance and pension services
in Denmark through the non-life insurance company
Topdanmark Forsikring A/S and the life insurance
company Topdanmark Livsforsikring A/S.
The strategy emphasizes creating synergies by having
both non-life and life insurance business within the
same group, and to improve customer experience and
cost efficiency by digitalization, innovation and new
technology. In June 2019 Topdanmark had a major
change in the organisation, which centralized the
company’s analysis and data resources. The purpose with
this is to support Topdanmark’s strategy, which includes
emphasizing digitalization and AI.
For many years Topdanmark has aimed at achieving a
low risk profile. The risk strategy is to lower the risk by
diversifying both market risk and insurance risk and by
avoiding big individual risks or risk concentrations.
To increase the business and to mitigate the commercial
risk elements Topdanmark applies a multibrand strategy
and a multi distribution channel strategy. Topdanmark’s
strategy is to offer customers a choice of how to commu-
nicate with Topdanmark regarding sales, services and
claims handling.
Topdanmark Group
reinsurance programme is assessed by the partial internal
model.
Topdanmark has no strategic financial investments. The
portfolio is diversified on asset classes and within each
asset class. The risk appetite is stipulated by the Board by
an overall risk framework for market risk. There is a high
level of matching between assets and liabilities with the
aim of keeping the interest rate risk low. The biggest part
of the financial investments is in Danish mortgage bonds
with AAA ratings.
Topdanmark Livsforsikring is the fifth biggest commercial
life insurance company in Denmark. The company is
providing pension schemes, life insurance products
and some non-life health products. These products are
bundled together on the same policy for one policyholder.
The majority of policies are part of company pension
schemes, but policies are also written on an individual
basis.
New policies are written as unit-linked or with profit
products. The majority of new policies are unit-linked
pension products, on which the policyholder holds the
market risks. The risk profiles are different for these two
Topdanmark Forsikring is the second largest non-life
insurer in Denmark. Topdanmark Forsikring mainly
provides insurance cover for personal, SME (small and
medium size enterprises) and agricultural customers.
This fits well with the strategy of providing services in
Denmark.
The insurance risk of Topdanmark Forsikring is mitigated
by a comprehensive reinsurance programme. The
reinsurance program focuses on catastrophe risk such as
storm, cloudburst, fire and other cumulative risks, where
several policyholders are affected by the same event. The
biggest retentions are on storm with DKK 100 million plus
reinstatement for each event, while the biggest retention
on fire is DKK 25 million. The insurance risk is dominated
by workers compensation reserve risk. The level of risk
is based on time lack between event and settlement of
the claim and the risk of supreme court judgements on
administrative practice, which can have an effect on
former years settlements of claims.
Nearly all insurance risks in Topdanmark Forsikring are
measured by a partial internal model. The partial internal
model has been approved by the Danish Supervisory
Authorities for solvency calculations. The efficiency of the
SAMPO GROUP’S RISKSAND CORE RISK
MANAGEMENT ACTIVITIES
IF GROUP
SAMPO GROUP’SSTRUCTURE ANDBUSINESS MODEL
SAMPO GROUPCAPITALIZATION APPENDICESMANDATUM LIFE
GROUP
RISK CONSIDERATIONSAT SAMPO GROUP LEVEL
AND SAMPO PLC
TOPDANMARKGROUP
RISK MANAGEMENT REPORT 2019 32

main types of products. The main risks for the company
are the market risks and the life insurance and biometric
risks.
Unit-linked products have a low risk for the company
as the policyholders bear the market risk themselves.
Topdanmark Livsforsikring holds the risk on the
insurance cover. The insurance risk is life insurance risk
with mortality, longevity and health risk features.
With profit products have a very different risk structure.
Policies have been split into contribution groups
according to the guaranteed benefit scheme. The policy-
holders are guaranteed a basic yield over the lifetime of
the policy. Older policies have higher yield guarantees
compared to newer policies. The yield credited to a policy
stems from the investment yield and is smoothened by
building up bonus potentials in years with high invest-
ment yield and transferring from the bonus potentials
to the policies in less good years. The bonus system is
traditional in Denmark and an efficient risk mitigating
technique. The maximum of the mitigation effect is the
size of the bonus potentials by group of policyholders.
Beside the bonus potentials, an important risk mitigation
for Topdanmark Livsforsikring is diversification in the
financial investments including a high share of AAA rated
Danish mortgage bonds. As part of the risk mitigation,
the interest rate risk is kept low by asset and liability
management.
SAMPO GROUP’S RISKSAND CORE RISK
MANAGEMENT ACTIVITIES
IF GROUP
SAMPO GROUP’SSTRUCTURE ANDBUSINESS MODEL
SAMPO GROUPCAPITALIZATION APPENDICESMANDATUM LIFE
GROUP
RISK CONSIDERATIONSAT SAMPO GROUP LEVEL
AND SAMPO PLC
TOPDANMARKGROUP
RISK MANAGEMENT REPORT 2019 33

Underwriting Risks and Performance
Non-Life Underwriting Performance and Risks
The premiums and underwriting performance by
Solvency II lines of business are presented in the table
Non-Life Underwriting Performance, Topdanmark,
31 December 2019 and 31 December 2018.
There was a moderate growth in premiums of 2.9 per
cent in 2019, being a result of the company´s actions to
maintain a balance between growth and profitability in
a competitive market. The growth indicates a low risk
development in the portfolio.
Topdanmark’s distribution agreement with Danske Bank
was terminated at the end of Q2 2019, which had a neg-
ative influence on the sale of new policies. Topdanmark
and Nordea have signed an agreement for the distribution
of non-life products on the Danish market that became
effective from 1 January 2020. It is, like the previous
agreement with Danske Bank was, a referral concept in
which Nordea will refer customers to Topdanmark, which
will provide the final guidance and sale.
The combined ratio was 88.3 per cent in 2019 before
run-off gains and 83.7 per cent respectively after run-off
gains.
Non-Life Underwriting PerformanceTopdanmark, 31 December 2019 and 31 December 2018
Premiums written Premiums earned Claims incurred Operating expense
Reinsurers share
per LoB
Total underwriting performance
direct insuranceUnderwriting performance by SII LoB, EURm 2019 2018 2019 2018 2019 2018 2019 2018 2019 2018 2019 2018Medical expense insurance 0.0 0.0 0.0 0.0 0.0 0.0 0.0 0.0 0.0 0.0 0.0 0.0
Income protection insurance 217.0 210.2 204.7 202.5 160.5 135.1 26.2 25.3 1.4 0.5 16.7 41.6
Workers' compensation insurance 97.9 87.4 93.6 87.0 54.1 75.0 8.8 10.7 -3.9 -0.2 34.6 1.5
Motor vehicle liability insurance 86.4 86.9 89.3 91.3 43.7 55.6 17.3 16.3 0.4 0.1 28.0 19.2
Other motor insurance 201.6 193.0 199.7 193.5 123.3 117.3 32.2 29.6 0.4 1.3 43.8 45.3
Marine, aviation and transport insurance 7.5 7.2 7.6 6.6 4.7 4.5 0.9 1.3 0.1 0.2 1.9 0.7
Fire and other damage to property insurance 551.6 542.1 550.4 540.7 355.0 363.8 97.4 95.2 34.4 9.7 63.6 71.9
General liability insurance 76.1 75.5 79.3 71.9 54.1 36.8 10.5 11.8 -1.3 3.4 16.1 19.9
Assistance 33.6 32.7 33.8 32.3 22.8 21.8 5.2 4.8 0.0 0.0 5.7 5.7
Other Life insurance 0.0 0.0 0.0 0.0 0.0 0.0 0.0 0.0 0.0 0.0 0.0 0.0
Annuities stemming from non-life insurance contracts and relating to health insurance obligations 0.0 0.0 0.0 0.0 0.0 0.0 0.0 0.0 0.0 0.0 0.0 0.0
Annuities stemming from non-life insurance contracts and relating to insurance obligations other than health insurance obligations 0.0 0.0 0.0 0.0 0.0 0.0 0.0 0.0 0.0 0.0 0.0 0.0
Total 1,271.6 1,235.0 1,258.6 1,225.7 818.2 810.0 198.6 195.0 31.4 14.9 210.4 205.8
SAMPO GROUP’S RISKSAND CORE RISK
MANAGEMENT ACTIVITIES
IF GROUP
SAMPO GROUP’SSTRUCTURE ANDBUSINESS MODEL
SAMPO GROUPCAPITALIZATION APPENDICESMANDATUM LIFE
GROUP
RISK CONSIDERATIONSAT SAMPO GROUP LEVEL
AND SAMPO PLC
TOPDANMARKGROUP
RISK MANAGEMENT REPORT 2019 34
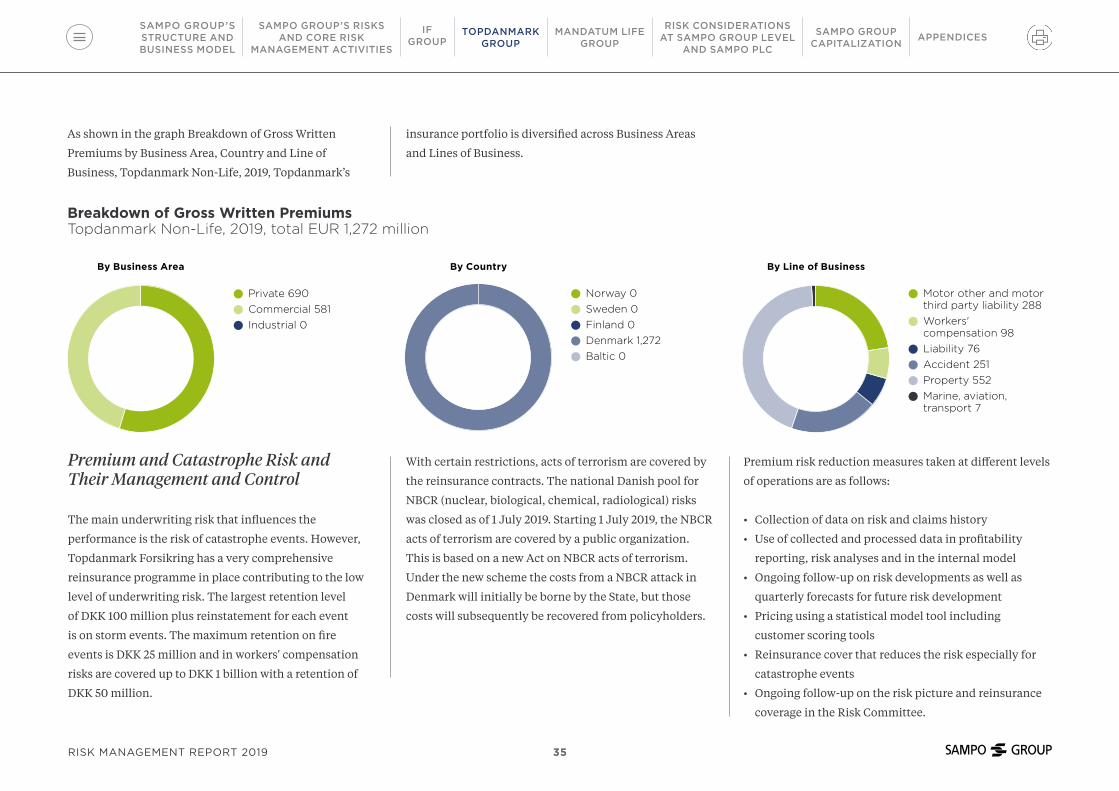
Graph 7, 8, 9
Breakdown of Gross Written Premiums Topdanmark Non-Life, 2019, total EUR 1,272 million
● Norway 0
● Sweden 0
● Finland 0
● Denmark 1,272
● Baltic 0
By Business Area By Country By Line of Business
● Motor other and motor third party liability 288
● Workers' compensation 98
● Liability 76
● Accident 251
● Property 552
● Marine, aviation, transport 7
● Private 690
● Commercial 581
● Industrial 0
Premium and Catastrophe Risk and Their Management and Control
The main underwriting risk that influences the
performance is the risk of catastrophe events. However,
Topdanmark Forsikring has a very comprehensive
reinsurance programme in place contributing to the low
level of underwriting risk. The largest retention level
of DKK 100 million plus reinstatement for each event
is on storm events. The maximum retention on fire
events is DKK 25 million and in workers' compensation
risks are covered up to DKK 1 billion with a retention of
DKK 50 million.
With certain restrictions, acts of terrorism are covered by
the reinsurance contracts. The national Danish pool for
NBCR (nuclear, biological, chemical, radiological) risks
was closed as of 1 July 2019. Starting 1 July 2019, the NBCR
acts of terrorism are covered by a public organization.
This is based on a new Act on NBCR acts of terrorism.
Under the new scheme the costs from a NBCR attack in
Denmark will initially be borne by the State, but those
costs will subsequently be recovered from policyholders.
Premium risk reduction measures taken at different levels
of operations are as follows:
• Collection of data on risk and claims history
• Use of collected and processed data in profitability
reporting, risk analyses and in the internal model
• Ongoing follow-up on risk developments as well as
quarterly forecasts for future risk development
• Pricing using a statistical model tool including
customer scoring tools
• Reinsurance cover that reduces the risk especially for
catastrophe events
• Ongoing follow-up on the risk picture and reinsurance
coverage in the Risk Committee.
As shown in the graph Breakdown of Gross Written
Premiums by Business Area, Country and Line of
Business, Topdanmark Non-Life, 2019, Topdanmark’s
insurance portfolio is diversified across Business Areas
and Lines of Business.
SAMPO GROUP’S RISKSAND CORE RISK
MANAGEMENT ACTIVITIES
IF GROUP
SAMPO GROUP’SSTRUCTURE ANDBUSINESS MODEL
SAMPO GROUPCAPITALIZATION APPENDICESMANDATUM LIFE
GROUP
RISK CONSIDERATIONSAT SAMPO GROUP LEVEL
AND SAMPO PLC
TOPDANMARKGROUP
RISK MANAGEMENT REPORT 2019 35
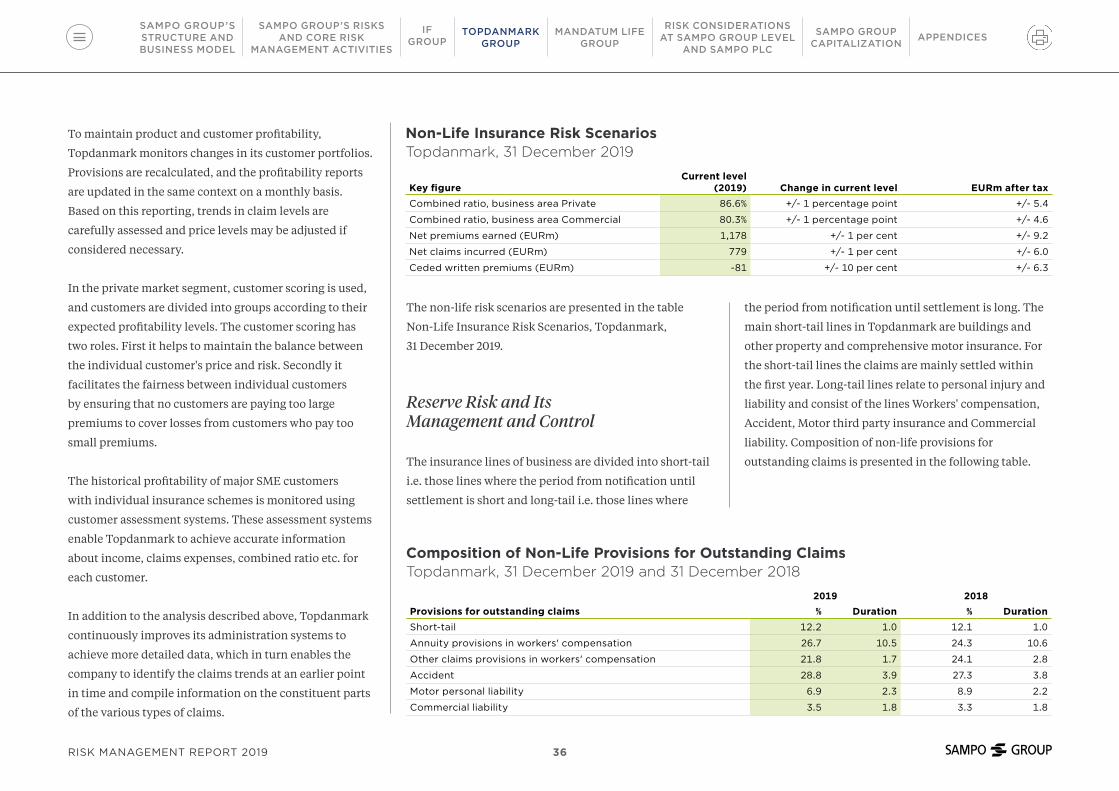
To maintain product and customer profitability,
Topdanmark monitors changes in its customer portfolios.
Provisions are recalculated, and the profitability reports
are updated in the same context on a monthly basis.
Based on this reporting, trends in claim levels are
carefully assessed and price levels may be adjusted if
considered necessary.
In the private market segment, customer scoring is used,
and customers are divided into groups according to their
expected profitability levels. The customer scoring has
two roles. First it helps to maintain the balance between
the individual customer's price and risk. Secondly it
facilitates the fairness between individual customers
by ensuring that no customers are paying too large
premiums to cover losses from customers who pay too
small premiums.
The historical profitability of major SME customers
with individual insurance schemes is monitored using
customer assessment systems. These assessment systems
enable Topdanmark to achieve accurate information
about income, claims expenses, combined ratio etc. for
each customer.
In addition to the analysis described above, Topdanmark
continuously improves its administration systems to
achieve more detailed data, which in turn enables the
company to identify the claims trends at an earlier point
in time and compile information on the constituent parts
of the various types of claims.
The non-life risk scenarios are presented in the table
Non-Life Insurance Risk Scenarios, Topdanmark,
31 December 2019.
Reserve Risk and Its Management and Control
The insurance lines of business are divided into short-tail
i.e. those lines where the period from notification until
settlement is short and long-tail i.e. those lines where
the period from notification until settlement is long. The
main short-tail lines in Topdanmark are buildings and
other property and comprehensive motor insurance. For
the short-tail lines the claims are mainly settled within
the first year. Long-tail lines relate to personal injury and
liability and consist of the lines Workers' compensation,
Accident, Motor third party insurance and Commercial
liability. Composition of non-life provisions for
outstanding claims is presented in the following table.
Non-Life Insurance Risk ScenariosTopdanmark, 31 December 2019
Key figureCurrent level
(2019) Change in current level EURm after taxCombined ratio, business area Private 86.6% +/- 1 percentage point +/- 5.4
Combined ratio, business area Commercial 80.3% +/- 1 percentage point +/- 4.6
Net premiums earned (EURm) 1,178 +/- 1 per cent +/- 9.2
Net claims incurred (EURm) 779 +/- 1 per cent +/- 6.0
Ceded written premiums (EURm) -81 +/- 10 per cent +/- 6.3
Composition of Non-Life Provisions for Outstanding ClaimsTopdanmark, 31 December 2019 and 31 December 2018
2019 2018Provisions for outstanding claims % Duration % DurationShort-tail 12.2 1.0 12.1 1.0
Annuity provisions in workers' compensation 26.7 10.5 24.3 10.6
Other claims provisions in workers' compensation 21.8 1.7 24.1 2.8
Accident 28.8 3.9 27.3 3.8
Motor personal liability 6.9 2.3 8.9 2.2
Commercial liability 3.5 1.8 3.3 1.8
SAMPO GROUP’S RISKSAND CORE RISK
MANAGEMENT ACTIVITIES
IF GROUP
SAMPO GROUP’SSTRUCTURE ANDBUSINESS MODEL
SAMPO GROUPCAPITALIZATION APPENDICESMANDATUM LIFE
GROUP
RISK CONSIDERATIONSAT SAMPO GROUP LEVEL
AND SAMPO PLC
TOPDANMARKGROUP
RISK MANAGEMENT REPORT 2019 36

Due to the longer period of claims settlement, the
long-tail lines of business are generally riskier than the
short-tail lines. It is not unusual that claims in long-tail
lines are settled three to five years after notification and in
rare cases up to 10–15 years.
The reserve risk is calculated using Topdanmark’s partial
internal model for insurance risk. Workers’ compensation
claims provision has by far the biggest risk, followed by
the other long-tail claims provisions.
During such a long period of settlement, the levels of
compensation could be significantly affected by changes
in legislation, case-law or practice in the compensation
of claim incidents adopted by the Danish Labour Market
Insurance which decides on compensation for injury
and loss of earnings potential in all cases of serious
industrial injuries. The practice adopted by the Danish
Labour Market Insurance also has some impact on the
levels of compensation for accident and personal injury
within motor, liability and commercial liability insurance.
Supreme court decisions can also influence the provisions
for former years especially for Workers’ compensation.
The provisioning risk represents mostly the ordinary
uncertainty of calculation and claims inflation, i.e. an
increase in the level of compensation due to the annual
increase in compensation per policy being higher than
the general development in prices or due to a change
in judicial practice or legislation. The sufficiency of
the provisions is tested in key lines by calculating the
provisions using alternative models as well, and then
comparing the compensation with information from
external sources, primarily statistical material from the
Danish Labour Market Insurance and the Danish Road
Sector/Road Directorate.
The actuarial team has a continuous dialogue with the
claims departments on any changes in the practices
regarding new legislation, case-law or compensation
practices as well as on the impact of such changes on the
routines used to calculate individual provisions.
Graph 10
20142010 20152011 20162012 20172013 2018 2019
Development of With Profit and Unit-Linked Technical ProvisionsTopdanmark Life Insurance, 2010–2019
EURm
8,000
6,000
4,000
2,000
0
1,4585142,178
502
3,060639
4,015 4,435 6,245
952
● Unit-Linked
1,072
2,600
1,101
2,510
1,135
2,598
1,064
2,503
1,062
2,366
978
2,289
963
2,323 2,307 2,261 2,337
925 837 825
● With Profit (guarantees below 3.5%)
● With Profit (3.5% and over 3.5% guarantees)
Life Underwriting Performance and Risks
The development of the provisions for with profit and
for unit-linked business during the years 2010–2019 is
illustrated in the following graph.
SAMPO GROUP’S RISKSAND CORE RISK
MANAGEMENT ACTIVITIES
IF GROUP
SAMPO GROUP’SSTRUCTURE ANDBUSINESS MODEL
SAMPO GROUPCAPITALIZATION APPENDICESMANDATUM LIFE
GROUP
RISK CONSIDERATIONSAT SAMPO GROUP LEVEL
AND SAMPO PLC
TOPDANMARKGROUP
RISK MANAGEMENT REPORT 2019 37

The split of premiums between products during the
last two years is presented in the table Sources of Gross
Premiums, Topdanmark Life Insurance, 31 December 2019
and 31 December 2018.
The focus of sales is on unit-linked schemes and the
premiums received are mostly of unit-linked schemes.
The regular premiums are growing steadily while the
single premiums are fluctuating more from year to year.
The risk inherent in the life business is firstly related to
the with profit technical provisions. As the majority of
new contracts are written as unit-linked contracts, the
risk will not increase as much as the volume of premiums
and total provisions.
Group life insurance is a collective life insurance without
savings – that is, a risk insurance – where the sum insured
is paid only to the beneficiaries in case of the insured’s
death during the insurance period. It is irrelevant whether
the death is due to accident or illness.
Risk return on shareholders’ equity together with other
main components of life business result are shown in the
table Result of Life Insurance, Topdanmark 31 December
2019 and 31 December 2018.
The profit improvement of DKK 99 million (EUR 13.3
million) comes primarily from the investment return
on shareholders’ equity and insurance risk. The equity
investment return improved as a result of developments
in the financial markets. The result of insurance risk
has been improved due to non-recurring adjustments
and gains resulting from better than expected disability
results.
Sources of Gross PremiumsTopdanmark Life Insurance, 31 December 2019 and 31 December 2018
EURm 2019 2018With profit schemes 62.4 66.1
Unit-linked schemes 340.2 273.7
Group life 36.0 43.2
Regular premiums 438.6 383.0
With profit schemes 46.1 71.3
Unit-linked schemes 1,002.8 902.3
Single premiums 1,048.9 973.6
Gross premiums 1,487.5 1,356.6
Result of Life InsuranceTopdanmark, 31 December 2019 and 31 December 2018
EURm 2019 2018Investment return on shareholders' equity 24.9 14.7
Sales and administration -2.9 -2.7
Insurance risk 3.0 -0.3
Risk return on shareholders' equity 18.8 18.8
Profit on life insurance 43.9 30.5
SAMPO GROUP’S RISKSAND CORE RISK
MANAGEMENT ACTIVITIES
IF GROUP
SAMPO GROUP’SSTRUCTURE ANDBUSINESS MODEL
SAMPO GROUPCAPITALIZATION APPENDICESMANDATUM LIFE
GROUP
RISK CONSIDERATIONSAT SAMPO GROUP LEVEL
AND SAMPO PLC
TOPDANMARKGROUP
RISK MANAGEMENT REPORT 2019 38

Profit on life insurance consists of the following items:
• Investment return on shareholders’ equity, which is the
actual return on assets allocated to own funds.
• Sales and administration, which consists mainly of
the cost fees received from the customers deducted by
actual costs.
• Insurance risk, which is the insurance risk result on
death, invalidity, and other such items.
• Risk return on shareholders’ equity (divided into a
fair risk return and a profit margin) from with profit
schemes. The risk return is calculated for each contri-
bution group and has been based on their estimated
risk for the company and the desired level of profit
margin. The risk return is conditional. The risk return is
transferred to shareholders’ equity if it can be covered
primarily by collective bonus potentials.
The main risks of Topdanmark Livsforsikring can be
summarized as follows:
• Limited loss-absorbing buffers (bonus potentials)
combined with low interest rates environment
• Disability risk
• Longevity risk
A low interest rate level with material elements of nega-
tive interest rates and, in particular, sustained low interest
rates along with prolonged lives represent a significant
risk scenario for insurers with guaranteed benefits as
there will be a reduction of the collective and individual
bonus potentials used for loss absorption by interest and
risk groups. When a risk event occurs, the effect on the
profit will depend on the size of bonus potentials which
are a loss absorbing capacity (“LAC”) within the insurance
liabilities. When the loss absorbing capacity is higher than
the losses, losses on the insurance liabilities are covered
Bonus Potentials by Contribution Interest GroupsTopdanmark Life Insurance, 31 December 2019
Contribution interest group 9 10 1 3 2 4 5 6 7Guaranteed rate 1% 1% > 1% - 2% > 1% – 2% > 2% – 3% > 2% – 3% > 3% – 4% > 4% – < 5% 5%
Life insurance provisions, EURm 348 96 1147 110 377 139 379 434 11
Bonus rate: share of individual and collective bonus potentials as a percentage of the retrospective life insurance provisions. 8.6% 8.8% 7.3% 12.1% 5.7% 12.2% 16.2% 22.3% 246.0%
by the bonus potentials. For risk groups where the bonus
potentials are fully used, the equity will cover the risk.
The bonus potentials are presented by contribution
interest groups in the table Bonus Potentials by
Contribution Interest Groups, Topdanmark Life
Insurance, 31 December 2019. The contribution groups
have been defined by Topdanmark Livsforsikring
within frames set by the Danish FSA (Danish Financial
Supervisory Authority).
Bonus rate is defined as ‘Share of individual and collective
bonus potential as a percentage of the retrospective
life insurance provisions’. As explained before, policies
have been split into contribution groups according to
the guaranteed benefit scheme. The policyholders are
guaranteed a basic yield over the lifetime of the policy.
The yield credited to a policy stems from the investment
yield and is smoothened by building up bonus potentials
in years with high investment yield and transferring from
the bonus potentials to the policies in less good years.
SAMPO GROUP’S RISKSAND CORE RISK
MANAGEMENT ACTIVITIES
IF GROUP
SAMPO GROUP’SSTRUCTURE ANDBUSINESS MODEL
SAMPO GROUPCAPITALIZATION APPENDICESMANDATUM LIFE
GROUP
RISK CONSIDERATIONSAT SAMPO GROUP LEVEL
AND SAMPO PLC
TOPDANMARKGROUP
RISK MANAGEMENT REPORT 2019 39

Life Insurance Underwriting Risk Control
The loss-absorbing buffers are a crucial part of the
with profit concept in leveling of yields and claims
over time. Therefore, Topdanmark Livsforsikring has
continuous focus on the solvency position, the changes in
the individual risks and the development of the loss-
absorbing buffers. The latter is important because over
time it can level out the market and insurance risks within
the individual risk groups.
The Solvency Capital Requirement is calculated quarterly.
When deemed necessary, due to market developments,
the frequency of calculation is increased and, if necessary,
the number and type of scenarios are increased.
Trends in product claim levels are assessed on top of
the calculation of the insurance provisions. Profitability
models are applied systematically as a follow-up on
customer and portfolio levels. This assessment is used to
identify price adjustment needs.
Loss Absorbing Buffers in the Event of Low Interest RatesCustomers’ individual and collective bonus potential
together creates the loss absorbing buffers in Danish life
insurance against any losses incurred by customers on
investment activities and insurance covers.
Low interest rates mean that the market value of the
guarantees granted is high, and hence the related
individual bonus potential is low. The lower the individ-
ual bonus potential is, the higher is the risk of any losses
to be absorbed wholly or partially by shareholder's equity.
In case interest rates are high, the same losses could, to a
larger degree, be absorbed by the bonus potential.
Declines in the collective bonus potential are most
frequent, due to the investment return being lower than
the annual addition of interest to deposits.
In order to protect shareholders' equity, it will, in general,
be relevant to reduce market risks in the event of lower
interest rates.
All policies have been split into contribution groups
according to the guaranteed benefit scheme. For all
contribution groups, there are separate loss absorbing
buffers and hence in each contribution group, the
separate investment policy must be in line with risk
taking capacity to ensure the ability to meet the
guaranteed benefits. Market risk is adjusted continuously
in accordance with the risk capacity of the contribution
groups, and the movements in interest rates are
monitored so that risk reducing actions can be taken
when needed.
DisabilityDisability risk is the risk of increased disability intensity
or declines in the rates of resumption of work. Losses may
incur due to an increase in disability frequency or due to
inadequate health evaluation when the policy is written.
Extra costs, due to a permanent change in disability risk,
will be partially covered by individual and collective
bonus potential. The remainder affects the result for the
year and consequently shareholders' equity.
LongevityLongevity risk is the risk that customers with life
dependent policies, primarily annuities, live longer
than expected. That will increase provisions for lifetime
products.
Extra costs, due to longer lifetimes, will be partially
covered by individual and collective bonus potential.
The remainder affects profit/loss for the year and
consequently shareholders' equity.
SAMPO GROUP’S RISKSAND CORE RISK
MANAGEMENT ACTIVITIES
IF GROUP
SAMPO GROUP’SSTRUCTURE ANDBUSINESS MODEL
SAMPO GROUPCAPITALIZATION APPENDICESMANDATUM LIFE
GROUP
RISK CONSIDERATIONSAT SAMPO GROUP LEVEL
AND SAMPO PLC
TOPDANMARKGROUP
RISK MANAGEMENT REPORT 2019 40

The following risk reduction measures and methods are
used in Topdanmark Livsforsikring:
• All policies in the average return environment are
divided according to the granted benefit guarantee and
the investment policy is designed to ensure the ability
to meet the guarantees
• Market risk is freely adjustable in relation to the
individual customer groups’ risk capacity
• Normal fluctuations in ROI and risk results in the
average interest rate environment are captured by
bonus potentials per contribution group
• Reinsurance
• Prices for death and disability covers are adjusted
continuously in relation to the market situation and the
observed claims history
• The basis of new subscription is changed as needed
• Establishing business procedures that ensure that the
products are sold at the right price/risk mix
• Changes in insurance contract conditions that
contribute to risk mitigation for similar claims in the
future
The life insurance risk scenarios can be found in the
following table.
The monitoring of whether the risk reduction methods
are still effective is i.a. via continuous follow-up of the
company’s risk profile and reinsurance cover in the Risk
Committee and via the on-going follow-up of forecasts. If
the forecasts are not met, the risk reduction methods may
need to be corrected.
The run-off profile of the life insurance with profit
liabilities presented in the following graph shows that
the provisions on high guarantees are decreasing. New
with profit policies are written, but only with a very low
guaranteed accumulated return.
Risk Scenarios in Life InsuranceTopdanmark, 31 December 2019 and 31 December 2018
EURm after tax 2019 2018Disability intensity - 35% increase* -1.0 -1.4
Mortality intensity - 20% decline -3.4 -3.3
*35% increase first year, subsequently 25%, coincident with 20% decline in reactivation rates
SAMPO GROUP’S RISKSAND CORE RISK
MANAGEMENT ACTIVITIES
IF GROUP
SAMPO GROUP’SSTRUCTURE ANDBUSINESS MODEL
SAMPO GROUPCAPITALIZATION APPENDICESMANDATUM LIFE
GROUP
RISK CONSIDERATIONSAT SAMPO GROUP LEVEL
AND SAMPO PLC
TOPDANMARKGROUP
RISK MANAGEMENT REPORT 2019 41

Graph 11
20232019 2024 20282020 2025 20292021 20262022 2027 2030 2031
Forecast of Run-off of With Profit LiabilitiesTopdanmark Livsforsikring, 2019–2031
EURm
3,500
3,000
2,500
2,000
1,500
1,000
500
0
● With Profit Liabilities (below 3.5 % guarantees) ● With Profit Liabilities (3.5% and over 3.5% guarantees)
Market Risks and Investment Performance
In general, the long-term value creation shall be
based mainly on the acceptance of insurance risks.
To supplement the Group’s profit from its insurance
activities, Topdanmark accepts a certain level of financial
market risks as well, given its strong liquidity position and
stable, high earnings from insurance operations. Hence,
in addition to fixed income instruments, Topdanmark has
invested, among other things, in equities, properties and
CDOs in order to improve the average investment return.
Market risks are limited to the extent that is considered
appropriate, so that it is highly probable that the
company gains a profit even in the very unfavourable
financial market scenarios. Large risk exposures or highly
correlated risks are covered to prevent unnecessary losses
and market risks originating from insurance operations.
The investment portfolio shall be managed in a way
that market risk taking shall not endanger the normal
operations or implementation of planned actions in
unfavourable market conditions.
To reach the aforementioned general goals, the invest-
ment policy sets the company's objectives, strategies,
organization and reporting practices on investments.
SAMPO GROUP’S RISKSAND CORE RISK
MANAGEMENT ACTIVITIES
IF GROUP
SAMPO GROUP’SSTRUCTURE ANDBUSINESS MODEL
SAMPO GROUPCAPITALIZATION APPENDICESMANDATUM LIFE
GROUP
RISK CONSIDERATIONSAT SAMPO GROUP LEVEL
AND SAMPO PLC
TOPDANMARKGROUP
RISK MANAGEMENT REPORT 2019 42

The investment strategy is more precisely determined
in terms of market risk limits and specific requirements
for certain types of positions and sub-portfolios (risk
appetite). The investment strategy is determined by
the Board and revised at least once a year. Appropriate
financial risk mitigation techniques are used.
When selecting the investment assets, a portfolio compo-
sition that matches the risk features of the corresponding
liabilities is sought. The purpose of the investment policy
is also to ensure that the company has implemented
effectively the organization, systems and processes
necessary to identify, measure, monitor, manage and
report on investment risks to which it is exposed.
At the same time, the policy sets the framework for
investment of customers' savings, bonus schemes and
unit-linked savings (customer funds) in Topdanmark
Livsforsikring, so that the company can continue to offer
attractive savings products to its clients with competitive
returns in relation to the investment risks accepted by the
clients.
In addition to the investment policies, the companies
have a capital plan and a capital emergency plan if sudden
changes occur on the asset or liability side.
When market risks are measured and managed, all
exposures are included, regardless of whether they arise
from active portfolio management of investments or from
annuities, which are considered as market risk.
SAMPO GROUP’S RISKSAND CORE RISK
MANAGEMENT ACTIVITIES
IF GROUP
SAMPO GROUP’SSTRUCTURE ANDBUSINESS MODEL
SAMPO GROUPCAPITALIZATION APPENDICESMANDATUM LIFE
GROUP
RISK CONSIDERATIONSAT SAMPO GROUP LEVEL
AND SAMPO PLC
TOPDANMARKGROUP
RISK MANAGEMENT REPORT 2019 43

Asset Allocations and Investment Performance: Topdanmark Excluding Unit-Linked
As described earlier, in life insurance different
contribution groups have their own investment strategies
and their loss absorbing buffers and hence it is relevant
to assess allocations and returns of these assets only
in relation to their respective contribution groups.
However, the company bears some market risk and thus
the non-life and life investment allocations are shown
in the Investment Allocations Excluding Unit-Linked,
Topdanmark, 31 December 2019 and 31 December 2018
table without assets covering unit-linked liabilities.
The equity portfolios are well diversified and without
major single positions, when associated companies are
disregarded.
The main investment assets are government and
mortgage bonds, which comprise primarily Danish
mortgage bonds. The assets in this asset class are interest
rate sensitive and to a significant extent equivalent to
the interest rate sensitivity of the non-life insurance
provisions. Consequently, the return on government and
mortgage bonds should be assessed in connection with
return and revaluation of non-life insurance provisions.
Investment Allocations Excluding Unit-LinkedTopdanmark, 31 December 2019 and 31 December 2018
Topdanmark Non-Life Topdanmark Life31 Dec 2019 31 Dec 2018 31 Dec 2019 31 Dec 2018
Asset classMarket value,
EURm WeightMarket value,
EURm WeightMarket value,
EURm WeightMarket value,
EURm WeightFixed income total 2,089 90% 1,992 91% 4,103 77% 3,283 72%
Money market securities and cash 127 5% 258 12% 241 5% 329 7%
Government and mortgage bonds 1,812 78% 1,585 72% 3,456 65% 2,507 55%
Credit bonds 6 0% 14 1% 141 3% 168 4%
Index-linked bonds 72 3% 68 3% 170 3% 167 4%
CDOs 72 3% 68 3% 95 2% 112 2%
Listed equity total 124 5% 104 5% 360 7% 430 9%
Denmark 38 2% 30 1% 73 1% 84 2%
Scandinavia 2 0% 2 0% 8 0% 8 0%
Global 84 4% 72 3% 279 5% 337 7%
Alternative investments total 107 5% 93 4% 869 16% 852 19%
Real estate 57 2% 47 2% 520 10% 501 11%
Unlisted equities and hedge funds 50 2% 46 2% 349 7% 351 8%
Asset classes total 2,321 100% 2,189 100% 5,332 100% 4,564 100%
The exposure in equities outside Denmark and credit bonds has been adjusted by the use of derivatives. Unlisted equities and hedge funds include also private equity and direct holdings in non-listed equities.
SAMPO GROUP’S RISKSAND CORE RISK
MANAGEMENT ACTIVITIES
IF GROUP
SAMPO GROUP’SSTRUCTURE ANDBUSINESS MODEL
SAMPO GROUPCAPITALIZATION APPENDICESMANDATUM LIFE
GROUP
RISK CONSIDERATIONSAT SAMPO GROUP LEVEL
AND SAMPO PLC
TOPDANMARKGROUP
RISK MANAGEMENT REPORT 2019 44

Credit bonds are composed of a well-diversified portfolio,
primarily exposed to businesses in Europe, predomi-
nantly in the investment grade segment.
Index-linked bonds comprise bonds – primarily Danish
mortgage bonds – for which the coupon and principal are
index-linked.
The CDO category primarily includes positions in CDO
equity tranches. The underlying assets consist for
Graph 12
20142010 20152011 20162012 20172013 2018 2019
%
10
8
6
4
2
0
Annual Investment Returns at Market ValuesTopdanmark Excluding Life, 2010–2019
3.4
4.8
1.0
3.1
4.4
6.9
2.1
3.4
0.0
4.1
Market Risks of Balance Sheet
Interest Rate Risk
Interest rate risk is calculated for assets, liabilities and
derivative instruments, for which the carrying amount is
dependent on the interest rate level. Regarding insurance
liabilities Topdanmark is exposed to interest rate risk due
to provisions for outstanding claims in non-life insurance
and guaranteed benefits in life insurance.
Shifting the market yield curve upwards and downwards
or changing its shape leads to changed market values of
assets and derivatives and thus to unrealized gains or
losses.
When assessing the value and sensitivity of insurance
provisions Topdanmark uses the Solvency II discount
curve that has its basis on market yield curve with
volatility adjustment (“VA”). The VA component of DKK
yield curve comprises a corrective element based on the
spreads of Danish mortgage bonds and European credit
bonds. The VA component was 45 bps at the end of 2018
and 19 bps at the end of 2019.
Generally, the interest rate risk is limited and controlled
by investing in interest-bearing assets in order to reduce
the overall interest rate exposure of the assets and
liabilities to the desired level. Therefore, the Danish
the most part of senior secured bank loans, while the
remaining part consists primarily of investment grade
investments in corporate bonds. The real estate portfolio
comprises mainly owner-occupied real estate.
The annual investment return for 2019 compared to
earlier years is presented in the graph Annual Investment
Returns at Market Values, Topdanmark Excluding Life
Insurance, 2010–2019.
SAMPO GROUP’S RISKSAND CORE RISK
MANAGEMENT ACTIVITIES
IF GROUP
SAMPO GROUP’SSTRUCTURE ANDBUSINESS MODEL
SAMPO GROUPCAPITALIZATION APPENDICESMANDATUM LIFE
GROUP
RISK CONSIDERATIONSAT SAMPO GROUP LEVEL
AND SAMPO PLC
TOPDANMARKGROUP
RISK MANAGEMENT REPORT 2019 45

mortgage bonds and government bonds have a central
role in the asset portfolios. To further decrease the
interest rate sensitivity of the balance sheet, swaps and
standard swaptions have been used for hedging purposes.
Equity Risk
The Danish part of the equity portfolio is composed
based on the OMXCCAP index. The rest of the equity
holdings are in the foreign equity portfolio that is based
on the MSCI World DC in its original currency. As a result,
Topdanmark’s equity holdings are well-diversified. A
breakdown of Topdanmark’s listed equity investments by
geographical regions is presented in the adjacent graph.
Real Estate Risk
The real estates are all located in Denmark, with the
material part in the areas of Copenhagen and Århus. The
holding is covering life insurance provisions and it is
diversified over office buildings and residential buildings.
The majority of the holding related to Topdanmark’s
property within equity is Topdanmark’s own offices. The
properties are valued in accordance with the rules of the
Danish FSA i.e. at market value taking the level of rent and
the terms of the tenancy agreements into consideration.
Graph 13Breakdown of Listed Equity Investments by Geographical RegionsTopdanmark
● Denmark 111
● Norway 6
● Sweden 4
● Finland 0
● Western Europe 129
● Eastern Europe 0
● North America 232
● Latin America 0
● Far East 2
● Denmark 114
● Norway 6
● Sweden 4
● Finland 0
● Western Europe 139
● Eastern Europe 0
● North America 270
● Latin America 0
● Far East 0
31 December 2019 total EUR 483 million
31 December 2018 total EUR 534 million
23% 21%
48% 51%1%
1%
27%26%
1%1%
Equities held by unit-linked customers in Topdanmark Livsforsikring are excluded.
Spread Risk
Most of Topdanmark's interest-bearing assets comprise
of AAA rated Danish mortgage bonds and debt issued
or guaranteed by top-rated European states. The risk of
losses is considered to be minor due to the high credit
quality of the issuers and because investments have been
made at spreads which are in balance with Topdanmark’s
desired risk ratio levels. The portfolio is well diversified
both geographically and by issuer type and, therefore, the
exposure to concentration risk is insignificant.
The investment policy stipulates that the portfolio must
be well-diversified by the number of counterparties and
by the amount of exposure to individual counterparties.
The main source of spread risk is the mortgage bonds.
SAMPO GROUP’S RISKSAND CORE RISK
MANAGEMENT ACTIVITIES
IF GROUP
SAMPO GROUP’SSTRUCTURE ANDBUSINESS MODEL
SAMPO GROUPCAPITALIZATION APPENDICESMANDATUM LIFE
GROUP
RISK CONSIDERATIONSAT SAMPO GROUP LEVEL
AND SAMPO PLC
TOPDANMARKGROUP
RISK MANAGEMENT REPORT 2019 46

Due to high allocation of these investments in the portfo-
lios, spread risk is the most material source of market risk
SCR and it was EUR 311.4 million on 31 December 2019.
Concentration Risk
Topdanmark’s fixed income investments by rating classes
are presented in the table Interest-bearing Assets by
Rating, Topdanmark, 31 December 2019 and 31 December
2018.
Topdanmark has no significant concentrations on the
investment side, except for the category treasury and
mortgage bonds that consists primarily of AAA rated
Danish mortgage bonds.
As earlier described, these assets have an interest rate
sensitivity that significantly corresponds to the interest
rate sensitivity of the technical provisions.
Currency Risk
In practice, the investment assets are the only source of
currency risk while the insurance liabilities are in Danish
krones. The currency risk is mitigated by derivatives and
net exposures in different currencies are minor except in
the euro.
The currency risk is assessed based on SCR. The value of
the base currency is shocked by 25 per cent against most
of the currencies except against the euro where the largest
exposure exists, and the shock is 0.39 per cent, because
the Danish krone is pegged to the euro.
Inflation Risk
Future inflation is implicitly included in the models
Topdanmark uses to calculate its provisions. The general
principles regarding the inclusion of an allowance for
inflation differs when you look at the Workers' compen-
sation and Illness and Accident insurance. In the former
the provisions are calculated based on the expected future
indexation of wages and salaries, and in the latter based
on the expected development in the net price index.
An expected higher future inflation rate would generally
be included in the provisions with a certain time delay,
while at the same time the result would be impacted by
higher future indexation of premiums. To reduce the risk
of inflation within Workers' compensation and Illness
and Accident insurance, Topdanmark uses index-linked
bonds and derivatives to hedge a significant proportion of
the expected cash flows sensitive to future inflation.
Interest-bearing Assets by RatingTopdanmark, 31 December 2019 and 31 December 2018
Rating class, % 2019 2018>A+ 82.2 75.9
A+, A, A- 6.7 3.8
BBB+, BBB, BBB- 0.3 0.4
<BBB- 9.0 11.0
Money market deposits 1.8 8.9
SAMPO GROUP’S RISKSAND CORE RISK
MANAGEMENT ACTIVITIES
IF GROUP
SAMPO GROUP’SSTRUCTURE ANDBUSINESS MODEL
SAMPO GROUPCAPITALIZATION APPENDICESMANDATUM LIFE
GROUP
RISK CONSIDERATIONSAT SAMPO GROUP LEVEL
AND SAMPO PLC
TOPDANMARKGROUP
RISK MANAGEMENT REPORT 2019 47
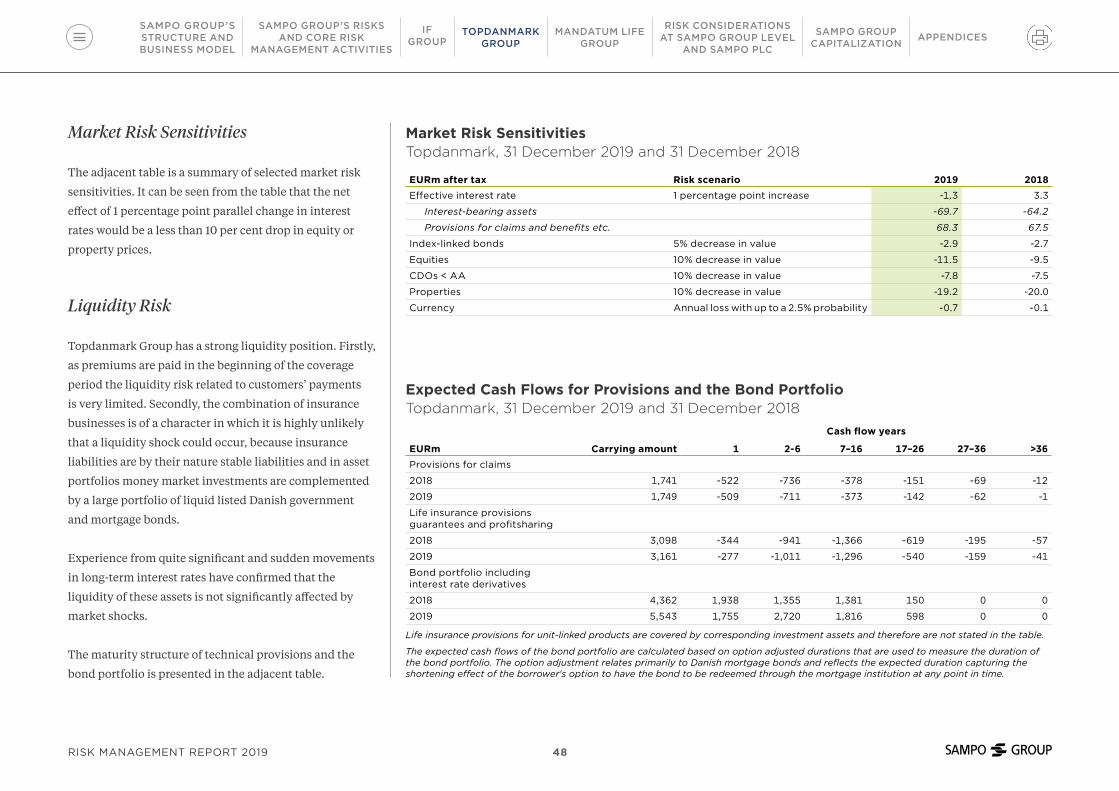
Market Risk Sensitivities
The adjacent table is a summary of selected market risk
sensitivities. It can be seen from the table that the net
effect of 1 percentage point parallel change in interest
rates would be a less than 10 per cent drop in equity or
property prices.
Liquidity Risk
Topdanmark Group has a strong liquidity position. Firstly,
as premiums are paid in the beginning of the coverage
period the liquidity risk related to customers’ payments
is very limited. Secondly, the combination of insurance
businesses is of a character in which it is highly unlikely
that a liquidity shock could occur, because insurance
liabilities are by their nature stable liabilities and in asset
portfolios money market investments are complemented
by a large portfolio of liquid listed Danish government
and mortgage bonds.
Experience from quite significant and sudden movements
in long-term interest rates have confirmed that the
liquidity of these assets is not significantly affected by
market shocks.
The maturity structure of technical provisions and the
bond portfolio is presented in the adjacent table.
Market Risk SensitivitiesTopdanmark, 31 December 2019 and 31 December 2018
EURm after tax Risk scenario 2019 2018Effective interest rate 1 percentage point increase -1.3 3.3
Interest-bearing assets -69.7 -64.2
Provisions for claims and benefits etc. 68.3 67.5
Index-linked bonds 5% decrease in value -2.9 -2.7
Equities 10% decrease in value -11.5 -9.5
CDOs < AA 10% decrease in value -7.8 -7.5
Properties 10% decrease in value -19.2 -20.0
Currency Annual loss with up to a 2.5% probability -0.7 -0.1
Expected Cash Flows for Provisions and the Bond PortfolioTopdanmark, 31 December 2019 and 31 December 2018
Cash flow years
EURm Carrying amount 1 2-6 7–16 17–26 27–36 >36Provisions for claims
2018 1,741 -522 -736 -378 -151 -69 -12
2019 1,749 -509 -711 -373 -142 -62 -1
Life insurance provisions guarantees and profitsharing
2018 3,098 -344 -941 -1,366 -619 -195 -57
2019 3,161 -277 -1,011 -1,296 -540 -159 -41
Bond portfolio including interest rate derivatives
2018 4,362 1,938 1,355 1,381 150 0 0
2019 5,543 1,755 2,720 1,816 598 0 0
Life insurance provisions for unit-linked products are covered by corresponding investment assets and therefore are not stated in the table.
The expected cash flows of the bond portfolio are calculated based on option adjusted durations that are used to measure the duration of the bond portfolio. The option adjustment relates primarily to Danish mortgage bonds and reflects the expected duration capturing the shortening effect of the borrower's option to have the bond to be redeemed through the mortgage institution at any point in time.
SAMPO GROUP’S RISKSAND CORE RISK
MANAGEMENT ACTIVITIES
IF GROUP
SAMPO GROUP’SSTRUCTURE ANDBUSINESS MODEL
SAMPO GROUPCAPITALIZATION APPENDICESMANDATUM LIFE
GROUP
RISK CONSIDERATIONSAT SAMPO GROUP LEVEL
AND SAMPO PLC
TOPDANMARKGROUP
RISK MANAGEMENT REPORT 2019 48
Because of the aforementioned reasons Topdanmark's
liquidity risk is primarily related to the parent company
Topdanmark A/S. Topdanmark A/S finances its activities
and dividend programme by receiving dividends from its
subsidiaries. Further financing requirements are covered
by short-term money market loans, typically with a
maturity of one month or less.
Counterparty Default Risks
Topdanmark is exposed to counterparty risk in both its
insurance and investment activities. The default risk
related to fixed income and equity investments is covered
by spread-risk and equity-risk models in SCR calculations
and hence they are not discussed in this context.
The main sources of counterparty risk are deposits made
to individual banks, derivative contracts with banks and
current receivables from reinsurance companies with the
addition of potential receivables that will arise in case of a
200-year catastrophe event. Topdanmark's counterparty
risk is assessed by the SCR standard formula.
Reinsurance
Within insurance activities the reinsurance companies'
ability to pay is the most important counterparty risk
factor. Topdanmark minimises this risk by primarily
buying reinsurance cover from reinsurance companies
with a minimum rating of A- and by spreading
reinsurance cover over many reinsurers.
For reinsurance counterparties, the Board approves
security guidelines which determine the maximum size of
reinsurance contract cover per a separate reinsurer. This
portion is dependent on the reinsurer's rating as well as
on Topdanmark’s own assessment of the reinsurer. The
largest risk concentrations may occur in case of major
catastrophe events, including storms and cloudbursts.
Investments
Topdanmark may suffer losses due to their counter-
parties’ inability to meet their obligations on bonds, loans
and other contracts including derivatives. The majority
of Topdanmark’s interest bearing assets comprise of
Danish mortgage bonds. In order to minimize the risk
to a single debtor, Topdanmark strives to always have a
well- diversified portfolio of bonds not only in regard to a
debtor but also geographically.
To limit the counterparty risk of financial contracts,
including derivative contracts, the choice of counter-
parties is restrictive, and collateral is required when
the value of the financial contracts exceeds the pre-
determined limits. The size of the limits depends on the
counterparty's credit rating and the terms of the contract.
Operational Risks
The Board of Directors has set the overall principles and
framework for how to organize internal control activities
and how to ensure independency between the various
organizational functions.
These organizational functions include business areas
and other functions that have ongoing responsibility for
managing and limiting operational risks and thus mini-
mizing the risk of errors or offenses which have economic
and reputational loss consequences for the company. Full
organizational independence is not required if it is not
SAMPO GROUP’S RISKSAND CORE RISK
MANAGEMENT ACTIVITIES
IF GROUP
SAMPO GROUP’SSTRUCTURE ANDBUSINESS MODEL
SAMPO GROUPCAPITALIZATION APPENDICESMANDATUM LIFE
GROUP
RISK CONSIDERATIONSAT SAMPO GROUP LEVEL
AND SAMPO PLC
TOPDANMARKGROUP
RISK MANAGEMENT REPORT 2019 49

possible to organize it or if it is considered appropriate not
to have full independence. In case there is no established
full organizational independence, there is a requirement
for compensatory checks.
With well-documented business practices and procedures
as well as an effective control environment, Topdanmark
minimizes the risk of errors in internal processes and
insurance fraud. There are contingency plans for the
most important areas. In addition, business practices and
procedures in all critical areas are continuously reviewed
by Internal Audit. Internal Audit assesses risks and may
make recommendations for limiting individual risks.
Topdanmark continuously develops its IT systems.
Responsibility for risk management in this connection
lies with the responsible business entities. Projects must
always prepare a risk assessment containing a description
of risks, possible consequences and measures to limit
these risks.
Topdanmark monitors and regularly reports on
operational risks. For this purpose, the company has a
process of recording operational risk events. The events
are collected centrally into a register and communicated
further in the management system. This way the organi-
zation can learn from its errors.
Topdanmark has numerous documents in which
instructions regarding operational risks are given. The
most important ones are Policy and Guidelines for
Operational Risks, Compliance and Internal Control,
Information Security Policy, IT-Preparedness Strategy and
IT-Preparedness Plan.
Operational risks are included as part of Topdanmark's
ORSA and reported to the Risk Committee in
Topdanmark's Risk Registry.
SAMPO GROUP’S RISKSAND CORE RISK
MANAGEMENT ACTIVITIES
IF GROUP
SAMPO GROUP’SSTRUCTURE ANDBUSINESS MODEL
SAMPO GROUPCAPITALIZATION APPENDICESMANDATUM LIFE
GROUP
RISK CONSIDERATIONSAT SAMPO GROUP LEVEL
AND SAMPO PLC
TOPDANMARKGROUP
RISK MANAGEMENT REPORT 2019 50
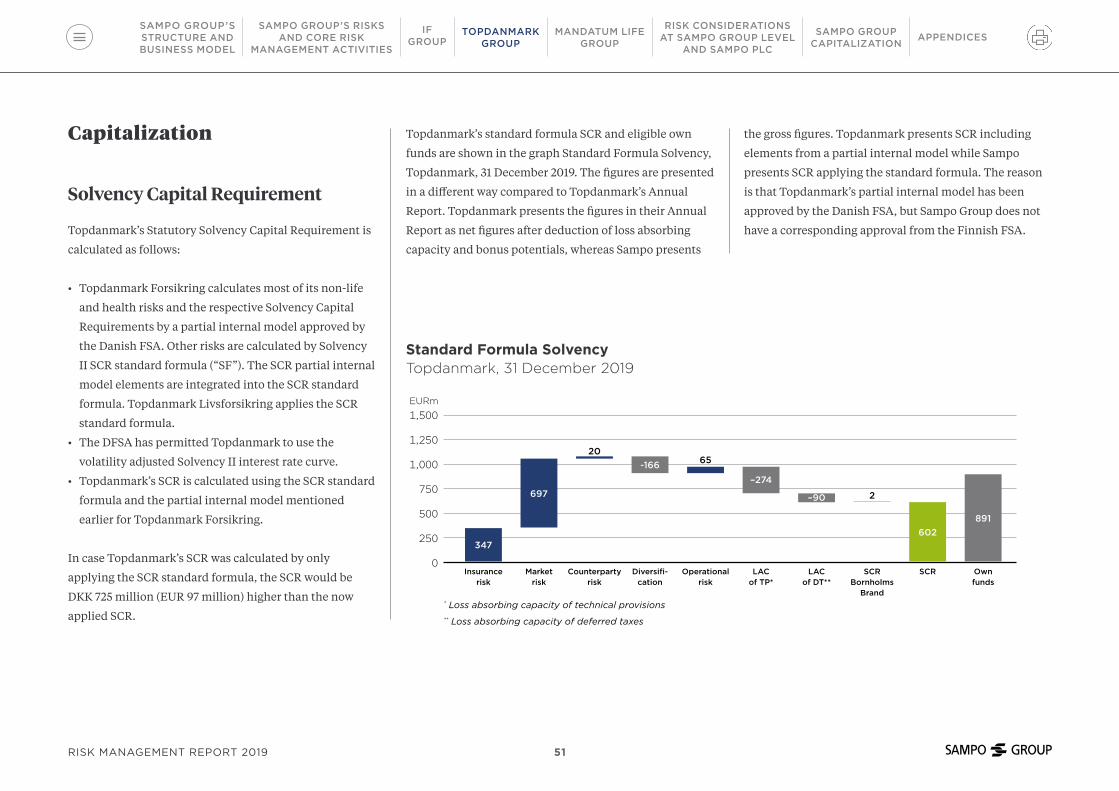
Graph 14Standard Formula SolvencyTopdanmark, 31 December 2019
EURm
1,500
1,250
1,000
750
500
250
0Insurance
riskMarket
riskCounterparty
riskDiversifi-
cationOperational
riskLAC
of TP*LAC
of DT**SCR Own
funds
697
-166–274
–90 2
602891
347
* Loss absorbing capacity of technical provisions ** Loss absorbing capacity of deferred taxes
2065
SCR Bornholms
Brand
Capitalization
Solvency Capital Requirement
Topdanmark’s Statutory Solvency Capital Requirement is
calculated as follows:
• Topdanmark Forsikring calculates most of its non-life
and health risks and the respective Solvency Capital
Requirements by a partial internal model approved by
the Danish FSA. Other risks are calculated by Solvency
II SCR standard formula (“SF”). The SCR partial internal
model elements are integrated into the SCR standard
formula. Topdanmark Livsforsikring applies the SCR
standard formula.
• The DFSA has permitted Topdanmark to use the
volatility adjusted Solvency II interest rate curve.
• Topdanmark’s SCR is calculated using the SCR standard
formula and the partial internal model mentioned
earlier for Topdanmark Forsikring.
In case Topdanmark’s SCR was calculated by only
applying the SCR standard formula, the SCR would be
DKK 725 million (EUR 97 million) higher than the now
applied SCR.
Topdanmark’s standard formula SCR and eligible own
funds are shown in the graph Standard Formula Solvency,
Topdanmark, 31 December 2019. The figures are presented
in a different way compared to Topdanmark’s Annual
Report. Topdanmark presents the figures in their Annual
Report as net figures after deduction of loss absorbing
capacity and bonus potentials, whereas Sampo presents
the gross figures. Topdanmark presents SCR including
elements from a partial internal model while Sampo
presents SCR applying the standard formula. The reason
is that Topdanmark’s partial internal model has been
approved by the Danish FSA, but Sampo Group does not
have a corresponding approval from the Finnish FSA.
SAMPO GROUP’S RISKSAND CORE RISK
MANAGEMENT ACTIVITIES
IF GROUP
SAMPO GROUP’SSTRUCTURE ANDBUSINESS MODEL
SAMPO GROUPCAPITALIZATION APPENDICESMANDATUM LIFE
GROUP
RISK CONSIDERATIONSAT SAMPO GROUP LEVEL
AND SAMPO PLC
TOPDANMARKGROUP
RISK MANAGEMENT REPORT 2019 51

Own Funds
The purpose of the capital plan is, based on Topdanmark's
strategy and risk appetite, to estimate future eligible own
funds and Solvency Capital Requirements, assuming
Topdanmark continues the operations in line with own
expectations. The future eligible own funds are affected
by earnings, dividends and issue of capital. The eligible
own funds estimate covers a 5-year period.
At the company and group level, the starting point of
eligible own funds is equity that is adjusted by some
corrective items of which the most significant are:
Eligible Own FundsTopdanmark, 31 December 2019 and 31 December 2018
EURm 2019 2018Tier 1 Total 710 690
Ordinary share capital 12 12
Reconciliation reserve 645 625
Subordinated liabilities 54 54
Tier 2 Total 181 181
Subordinated liabilities 181 181
Untaxed reserves 0 0
Tier 3 Total 0 0
Deferred tax assets 0 0
Eligible own funds 891 872
Own Funds:
Shareholders’ equity
- Proposed dividend
+ Deferred tax on security funds
+ Profit margin
- Intangible assets
+ Tax effect
+ Usable share, subordinated loan Tier 1 (max. 20% of
Tier 1 capital)
+ Usable share, subordinated notes (max. 50% of SCR)
Own funds
The proposed dividends are deducted from own funds
on the balance sheet date. Extraordinary dividends
are deducted when decided by the Board of Directors
based on authorization from the General Meeting.
Topdanmark’s eligible own funds structure is presented in
the table Eligible Own Funds, Topdanmark, 31 December
2019 and 31 December 2018.
SAMPO GROUP’S RISKSAND CORE RISK
MANAGEMENT ACTIVITIES
IF GROUP
SAMPO GROUP’SSTRUCTURE ANDBUSINESS MODEL
SAMPO GROUPCAPITALIZATION APPENDICESMANDATUM LIFE
GROUP
RISK CONSIDERATIONSAT SAMPO GROUP LEVEL
AND SAMPO PLC
TOPDANMARKGROUP
RISK MANAGEMENT REPORT 2019 52

Solvency II Compliant Subordinated LiabilitiesTopdanmark, 31 December 2019
Issuer Instrument Nominal amountCarrying amount
in EUR (IFRS) First Call Tiering
Nominal amount in Sampo Group's
portfoliosTopdanmark Forsikring A/S (Denmark) 10NC5 DKK 500,000,000 67,375,885 11/12/2020 Tier 2 135,000,000
Topdanmark Forsikring A/S (Denmark) 10NC5.5 DKK 850,000,000 113,765,643 11/06/2021 Tier 2 270,000,000
Topdanmark A/S (Denmark) PerpNC5 DKK 400,000,000 53,536,773 23/11/2022 Tier 1 133,000,000
234,678,301
Eligible own funds include the following Solvency II
Compliant Subordinated Liabilities of Topdanmark as at
31 December 2019. Sampo Group’s holdings in these assets
are also presented in the following table.
SAMPO GROUP’S RISKSAND CORE RISK
MANAGEMENT ACTIVITIES
IF GROUP
SAMPO GROUP’SSTRUCTURE ANDBUSINESS MODEL
SAMPO GROUPCAPITALIZATION APPENDICESMANDATUM LIFE
GROUP
RISK CONSIDERATIONSAT SAMPO GROUP LEVEL
AND SAMPO PLC
TOPDANMARKGROUP
RISK MANAGEMENT REPORT 2019 53

MANDATUM LIFE GROUP
55Mandatum Life
Group
55Underwriting
Risks and Performance
62Market Risks
and Investment Performance
69Counterparty Default Risks
70Operational
Risks
70Capitalization
SAMPO GROUP’S RISKSAND CORE RISK
MANAGEMENT ACTIVITIES
IF GROUP
SAMPO GROUP’SSTRUCTURE ANDBUSINESS MODEL
TOPDANMARKGROUP
SAMPO GROUPCAPITALIZATION APPENDICES
RISK CONSIDERATIONSAT SAMPO GROUP LEVEL
AND SAMPO PLC
MANDATUM LIFEGROUP
RISK MANAGEMENT REPORT 2019 54

Mandatum Life Group
Mandatum Life operates in Finland and in the Baltic
countries and offers savings and pension policies as well
as policies covering mortality, morbidity and disability
risks.
Mandatum Life is a leading pension provider in the
corporate segment which is the main focus in Mandatum
Life’s customer strategy. During the last few years
Mandatum Life has extended its business area outside
the life insurance activities e.g. to mutual fund business.
These areas are still small from a performance point of
view but do require proper management of operational
risks stemming from these activities.
The existing with profit liabilities and assets backing
these liabilities are the most critical areas from a risk
management point of view, since the business in question
forms a major part of Mandatum Life’s Solvency Capital
Requirement (around 75 per cent of total SCR). Mandatum
Life’s strategy is to maintain a sufficiently strong solvency
position, which makes it possible to seek a higher long-
term investment return than average guarantees.
Underwriting Risks and Performance
In this section, the underwriting risks and performance
as well as the development of technical provisions are
presented. Further details of technical provisions can be
found in Appendix 5 Valuation for Solvency Purposes.
The unit-linked business has been Mandatum Life’s main
focus area since 2001. Since then the trend of unit-linked
technical provisions has been upward and the average
annual growth in unit-linked technical provisions has
been around 20 per cent per annum. Due to the nature of
the unit-linked business, volatility between the years has
been relatively high.
SAMPO GROUP’S RISKSAND CORE RISK
MANAGEMENT ACTIVITIES
IF GROUP
SAMPO GROUP’SSTRUCTURE ANDBUSINESS MODEL
TOPDANMARKGROUP
SAMPO GROUPCAPITALIZATION APPENDICES
RISK CONSIDERATIONSAT SAMPO GROUP LEVEL
AND SAMPO PLC
MANDATUM LIFEGROUP
RISK MANAGEMENT REPORT 2019 55

Graph 15
20142010 20152011 20162012 20172013 2018 2019
Development of With Profit and Unit-Linked Technical ProvisionsMandatum Life, 2010–2019
EURm
12,500
10,000
7,500
5,000
2,500
0
● Unit-Linked ● Other With Profit
3,124
4,040
370
3,054
3,871
378
3,833
3,685
386
5,312
3,262
1,803
5,858
3,075
1,939
6,440
2,861
1,960
7,066
1,937
2,635
4,617
3,488
439
6,955 8,117
1,7961,764
2,426 2,161
● With Profit (3.5–4.5% guarantees)
In contrast to the unit-linked trend, the trend of with
profit technical provisions has been downward since 2005
(except for year 2014 when the group pension portfolio
from Suomi Mutual was transferred to Mandatum Life).
In particular, the parts of technical provisions with the
highest guarantees (4.5 per cent and 3.5 per cent) have
decreased. The development of with profit and unit-
linked portfolios is presented in the graph Development
of With Profit and Unit-Linked Technical Provisions,
Mandatum Life, 2010–2019.
The above-mentioned group pension portfolio transferred
from Suomi Mutual and related assets are separated
from the rest of the Mandatum Life balance sheet into
a segregated group pension portfolio. The segregated
group pension portfolio has its own profit-sharing rules,
investment policy and Asset and Liability Committee. The
with profit liabilities other than in the segregated group
pension portfolio are hereafter referred to as the “original”
with profit liabilities.
During the year 2019 insurance liabilities developed as
planned. Unit-linked business increased and reached
their all-time high and ended up being EUR 8,117 million.
On the other hand, the technical provisions with the
highest guarantees fell by EUR 264 million. In total, the
with profit technical provisions decreased by EUR 296
million and were EUR 3,926 million.
The development of insurance liabilities during 2019 is
shown in the table Analysis of the Change in Provisions
Before Reinsurance, Mandatum Life, 31 December 2019.
SAMPO GROUP’S RISKSAND CORE RISK
MANAGEMENT ACTIVITIES
IF GROUP
SAMPO GROUP’SSTRUCTURE ANDBUSINESS MODEL
TOPDANMARKGROUP
SAMPO GROUPCAPITALIZATION APPENDICES
RISK CONSIDERATIONSAT SAMPO GROUP LEVEL
AND SAMPO PLC
MANDATUM LIFEGROUP
RISK MANAGEMENT REPORT 2019 56

Analysis of the Change in Provisions Before ReinsuranceMandatum Life, 31 December 2019
EURmLiability
2018 Premiums Claims paidExpense charges
Guaranteed interest Bonuses Other
Liability 2019 Share %
Unit-linked, excl. Baltic 6,810 1,448 -1,116 -77 0 0 886 7,952 66% Individual pension insurance 1,298 55 -19 -14 0 0 191 1,511 13%
Individual life 2,195 285 -474 -21 0 0 291 2,277 19%
Capital redemption operations 2,519 1,018 -601 -31 0 0 259 3,164 26%
Group pension 797 89 -22 -10 0 0 145 1,000 8%
With profit and others, excl. Baltic 4,208 125 -457 -33 112 8 -49 3,913 32%Group pension insurance, segregated portfolio 1,008 2 -57 -1 22 8 -17 964 8%
Basic liabilities. guaranteed rate 3.5% 658 2 -57 -1 22 8 -7 623 5%
Reserve for decreased discount rate (3.5% -> 0.50%) 250 0 0 0 0 0 13 263 2%
Future bonus reserves 100 0 0 0 0 0 -22 78 1%
Group pension 1,879 51 -225 -6 57 0 -25 1,732 14%Guaranteed rate 3.5% 1,603 2 -193 -3 53 0 -40 1,424 12%
Guaranteed rate 2.5%, 1.5% or 0.0% 276 48 -32 -3 4 0 14 308 3%
Individual pension insurance 763 7 -138 -4 28 0 28 684 6%Guaranteed rate 4.5% 567 4 -77 -3 23 0 -19 495 4%
Guaranteed rate 3.5% 128 2 -32 -1 4 0 21 122 1%
Guaranteed rate 2.5% or 0.0% 68 1 -29 0 1 0 26 67 1%
Individual life insurance 153 31 -27 -10 5 0 -10 142 1%Guaranteed rate 4.5% 52 1 -1 -1 2 0 -6 48 0%
Guaranteed rate 3.5% 76 1 -8 -3 3 0 4 73 1%
Guaranteed rate 2.5% or 0.0% 25 30 -18 -6 0 0 -9 22 0%
Capital redemption operations 24 0 0 0 0 0 1 25 0%Guaranteed rate 3.5% 0 0 0 0 0 0 0 0 0%
Guaranteed rate 2.5% or 0.0% 24 0 0 0 0 0 1 25 0%
Future bonus reserves 0 0 0 0 0 0 0 0 0%Reserve for decreased discount rate 232 0 0 0 0 0 -2 230 2%Longevity reserve 95 0 0 0 0 0 -9 86 1%Assumed reinsurance 3 0 0 0 0 0 0 3 0%Other liabilities 50 34 -11 -13 0 0 -15 47 0%Total, excl. Baltic 11,017 1,574 -1,573 -110 112 8 836 11,865 99%Baltic 159 30 -24 -4 1 0 17 178 1%
Unit-linked liabilities 145 28 -22 -3 0 0 18 166 1%
Other liabilities 14 2 -2 -1 1 0 0 13 0%
Mandatum Life Group total 11,176 1,603 -1,597 -114 113 8 854 12,043 100%
SAMPO GROUP’S RISKSAND CORE RISK
MANAGEMENT ACTIVITIES
IF GROUP
SAMPO GROUP’SSTRUCTURE ANDBUSINESS MODEL
TOPDANMARKGROUP
SAMPO GROUPCAPITALIZATION APPENDICES
RISK CONSIDERATIONSAT SAMPO GROUP LEVEL
AND SAMPO PLC
MANDATUM LIFEGROUP
RISK MANAGEMENT REPORT 2019 57
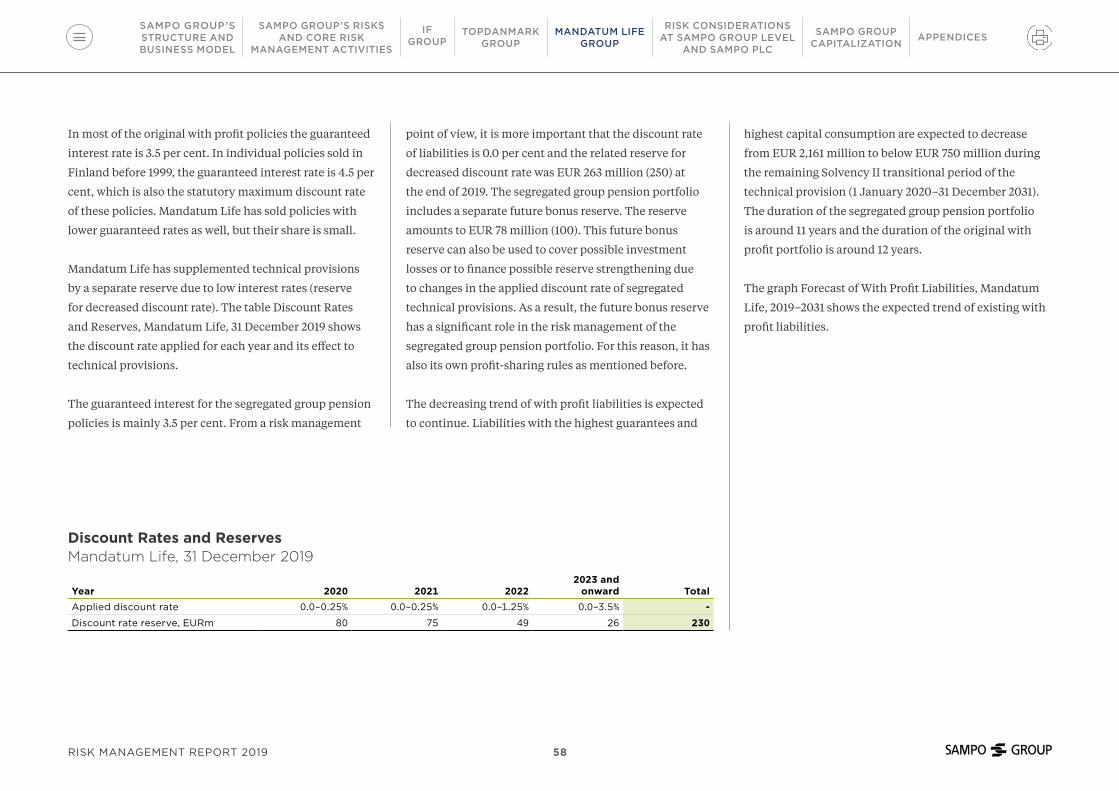
In most of the original with profit policies the guaranteed
interest rate is 3.5 per cent. In individual policies sold in
Finland before 1999, the guaranteed interest rate is 4.5 per
cent, which is also the statutory maximum discount rate
of these policies. Mandatum Life has sold policies with
lower guaranteed rates as well, but their share is small.
Mandatum Life has supplemented technical provisions
by a separate reserve due to low interest rates (reserve
for decreased discount rate). The table Discount Rates
and Reserves, Mandatum Life, 31 December 2019 shows
the discount rate applied for each year and its effect to
technical provisions.
The guaranteed interest for the segregated group pension
policies is mainly 3.5 per cent. From a risk management
point of view, it is more important that the discount rate
of liabilities is 0.0 per cent and the related reserve for
decreased discount rate was EUR 263 million (250) at
the end of 2019. The segregated group pension portfolio
includes a separate future bonus reserve. The reserve
amounts to EUR 78 million (100). This future bonus
reserve can also be used to cover possible investment
losses or to finance possible reserve strengthening due
to changes in the applied discount rate of segregated
technical provisions. As a result, the future bonus reserve
has a significant role in the risk management of the
segregated group pension portfolio. For this reason, it has
also its own profit-sharing rules as mentioned before.
The decreasing trend of with profit liabilities is expected
to continue. Liabilities with the highest guarantees and
highest capital consumption are expected to decrease
from EUR 2,161 million to below EUR 750 million during
the remaining Solvency II transitional period of the
technical provision (1 January 2020–31 December 2031).
The duration of the segregated group pension portfolio
is around 11 years and the duration of the original with
profit portfolio is around 12 years.
The graph Forecast of With Profit Liabilities, Mandatum
Life, 2019–2031 shows the expected trend of existing with
profit liabilities.
Discount Rates and ReservesMandatum Life, 31 December 2019
Year 2020 2021 20222023 and
onward TotalApplied discount rate 0.0–0.25% 0.0–0.25% 0.0–1.25% 0.0–3.5% -
Discount rate reserve, EURm 80 75 49 26 230
SAMPO GROUP’S RISKSAND CORE RISK
MANAGEMENT ACTIVITIES
IF GROUP
SAMPO GROUP’SSTRUCTURE ANDBUSINESS MODEL
TOPDANMARKGROUP
SAMPO GROUPCAPITALIZATION APPENDICES
RISK CONSIDERATIONSAT SAMPO GROUP LEVEL
AND SAMPO PLC
MANDATUM LIFEGROUP
RISK MANAGEMENT REPORT 2019 58

Graph 16
20232019 20242020 20252021 20262022 2027 2028 2029 2030 2031
Forecast of With Profit LiabilitiesMandatum Life, 2019–2031
● With Profit Liabilities (4.5% guarantee)
● With Profit Liabilities (3.5% guarantee)● Segregated Group Pension
● Other With Profit Liabilities (excl. Segregated Group Pension)
EURm
5,000
4,000
3,000
2,000
1,000
0
Biometric Risks
Mandatum Life’s main biometric risks are longevity,
mortality and disability. In general, the long duration of
policies and Mandatum Life’s restricted right to change
policy terms and conditions and tariffs increase biometric
risks. A definition of biometric risk can be found in
Appendix 2 Risk Definitions. If the premiums turn out
to be inadequate and cannot be increased, technical
provisions have to be supplemented by an amount
corresponding to the increase in expected losses.
Longevity risk is the most critical biometric risk in
Mandatum Life. The Solvency Capital Requirement of
longevity risk is also highly dependent on the interest rate
level, which in practice means that the lower the applied
discount rate is, the higher the longevity SCR would be.
Most of the longevity risk arises from the with profit group
pension portfolio. With profit group pension policies have
mostly been closed for new members for years and due to
this the average age of members is relatively high, almost
70 years. In the unit-linked group pension and individual
pension portfolio the longevity risk is less significant
because most of these policies are fixed term annuities
including death cover compensating the longevity risk.
SAMPO GROUP’S RISKSAND CORE RISK
MANAGEMENT ACTIVITIES
IF GROUP
SAMPO GROUP’SSTRUCTURE ANDBUSINESS MODEL
TOPDANMARKGROUP
SAMPO GROUPCAPITALIZATION APPENDICES
RISK CONSIDERATIONSAT SAMPO GROUP LEVEL
AND SAMPO PLC
MANDATUM LIFEGROUP
RISK MANAGEMENT REPORT 2019 59
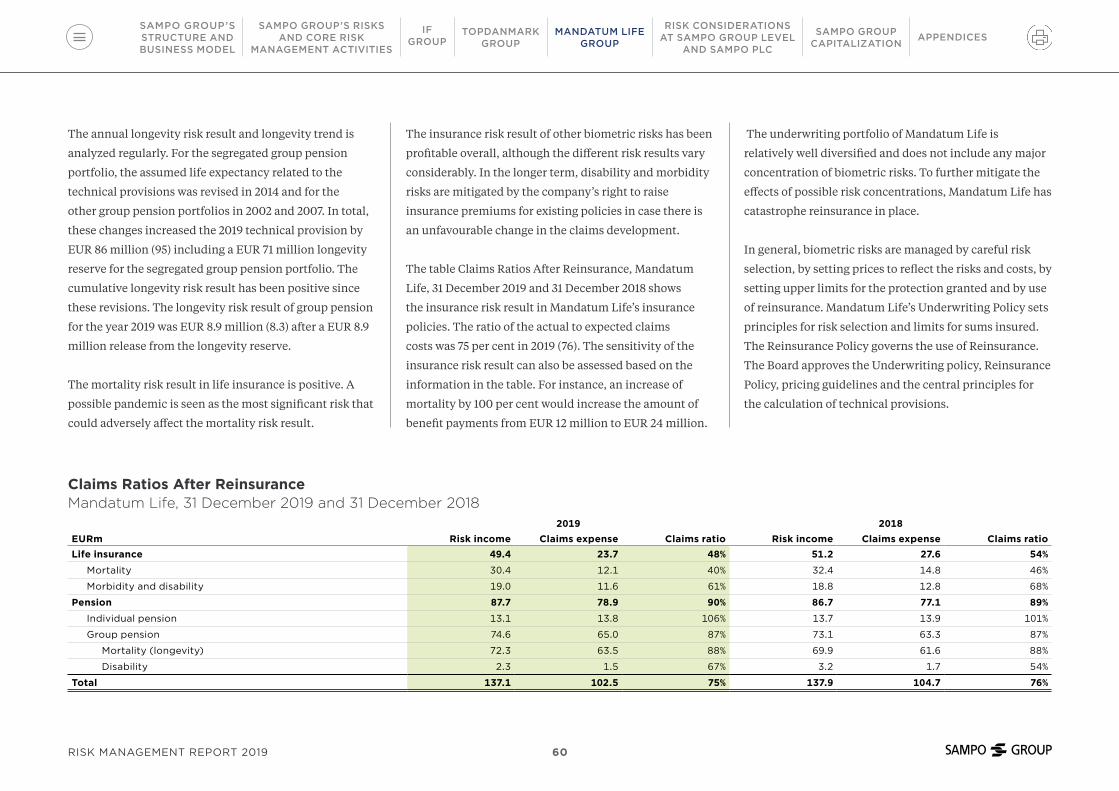
The annual longevity risk result and longevity trend is
analyzed regularly. For the segregated group pension
portfolio, the assumed life expectancy related to the
technical provisions was revised in 2014 and for the
other group pension portfolios in 2002 and 2007. In total,
these changes increased the 2019 technical provision by
EUR 86 million (95) including a EUR 71 million longevity
reserve for the segregated group pension portfolio. The
cumulative longevity risk result has been positive since
these revisions. The longevity risk result of group pension
for the year 2019 was EUR 8.9 million (8.3) after a EUR 8.9
million release from the longevity reserve.
The mortality risk result in life insurance is positive. A
possible pandemic is seen as the most significant risk that
could adversely affect the mortality risk result.
The insurance risk result of other biometric risks has been
profitable overall, although the different risk results vary
considerably. In the longer term, disability and morbidity
risks are mitigated by the company’s right to raise
insurance premiums for existing policies in case there is
an unfavourable change in the claims development.
The table Claims Ratios After Reinsurance, Mandatum
Life, 31 December 2019 and 31 December 2018 shows
the insurance risk result in Mandatum Life’s insurance
policies. The ratio of the actual to expected claims
costs was 75 per cent in 2019 (76). The sensitivity of the
insurance risk result can also be assessed based on the
information in the table. For instance, an increase of
mortality by 100 per cent would increase the amount of
benefit payments from EUR 12 million to EUR 24 million.
The underwriting portfolio of Mandatum Life is
relatively well diversified and does not include any major
concentration of biometric risks. To further mitigate the
effects of possible risk concentrations, Mandatum Life has
catastrophe reinsurance in place.
In general, biometric risks are managed by careful risk
selection, by setting prices to reflect the risks and costs, by
setting upper limits for the protection granted and by use
of reinsurance. Mandatum Life’s Underwriting Policy sets
principles for risk selection and limits for sums insured.
The Reinsurance Policy governs the use of Reinsurance.
The Board approves the Underwriting policy, Reinsurance
Policy, pricing guidelines and the central principles for
the calculation of technical provisions.
Claims Ratios After ReinsuranceMandatum Life, 31 December 2019 and 31 December 2018
2019 2018EURm Risk income Claims expense Claims ratio Risk income Claims expense Claims ratioLife insurance 49.4 23.7 48% 51.2 27.6 54%
Mortality 30.4 12.1 40% 32.4 14.8 46%
Morbidity and disability 19.0 11.6 61% 18.8 12.8 68%
Pension 87.7 78.9 90% 86.7 77.1 89%
Individual pension 13.1 13.8 106% 13.7 13.9 101%
Group pension 74.6 65.0 87% 73.1 63.3 87%
Mortality (longevity) 72.3 63.5 88% 69.9 61.6 88%
Disability 2.3 1.5 67% 3.2 1.7 54%
Total 137.1 102.5 75% 137.9 104.7 76%
SAMPO GROUP’S RISKSAND CORE RISK
MANAGEMENT ACTIVITIES
IF GROUP
SAMPO GROUP’SSTRUCTURE ANDBUSINESS MODEL
TOPDANMARKGROUP
SAMPO GROUPCAPITALIZATION APPENDICES
RISK CONSIDERATIONSAT SAMPO GROUP LEVEL
AND SAMPO PLC
MANDATUM LIFEGROUP
RISK MANAGEMENT REPORT 2019 60

The Insurance Risk Committee is responsible for
maintaining the Underwriting Policy and monitoring the
functioning of the risk selection and claims processes.
The Committee also reports all deviations from the
Underwriting Policy to the RMC. The Insurance Risk
Committee is chaired by the Chief Actuary who is
responsible for ensuring that the principles for pricing
policies and for the calculation of technical provisions are
adequate and in line with the underwriting and claims
management processes.
Reinsurance is used to limit the amount of individual
mortality and disability risks. The Board of Directors
annually approves the Reinsurance Policy and determines
the maximum amount of risk to be retained on the
company’s own account. The highest retention of
Mandatum Life is EUR 1.5 million per insured.
The risk result is actively followed and thoroughly
analyzed on an annual basis. Mandatum Life measures
the efficiency of risk selection and the adequacy of
tariffs by collecting information about the actual claims
expenditure for each product line and each type of risk
and comparing it to the claims expenditure assumed in
insurance premiums of every risk cover.
Technical provisions are analyzed and the possible
supplemental needs are assessed regularly. Assumptions
related to technical provisions are reviewed annually. The
adequacy of the technical provisions is tested quarterly.
Tariffs for new policies are set and the Underwriting
Policy and assumptions used in calculating technical
provisions are updated based on adequacy tests and risk
result analysis.
Policyholder Behavior and Expense Risks
From an Asset and Liability Management point of view,
surrender risk is not material because in Mandatum Life
around 90 per cent of with profit technical provisions
consists of pension policies in which surrender is possible
only in exceptional cases. Surrender risk is therefore only
relevant in individual life and capital redemption policies
of which the related technical provisions amount to less
than 5 per cent (below EUR 200 million) of the total with
profit technical provisions. Furthermore, the supplements
to technical provisions are not paid out at surrender
which also reduces the surrender risk related to the with
profit policies. Due to the limited surrender risk, the
future cash flows of Mandatum Life’s insurance liabilities
are quite predictable.
SAMPO GROUP’S RISKSAND CORE RISK
MANAGEMENT ACTIVITIES
IF GROUP
SAMPO GROUP’SSTRUCTURE ANDBUSINESS MODEL
TOPDANMARKGROUP
SAMPO GROUPCAPITALIZATION APPENDICES
RISK CONSIDERATIONSAT SAMPO GROUP LEVEL
AND SAMPO PLC
MANDATUM LIFEGROUP
RISK MANAGEMENT REPORT 2019 61

Policy terms and tariffs cannot usually be changed
materially during the lifetime of the insurance, which
increases the expense risk. The behavior of financial
markets has also an influence on expense risk since
normally the company’s fee income is linked to
policy reserves in unit-linked policies. The main
challenge is to keep the expenses related to insurance
administrative processes and complex IT infrastructure
at an effective and competitive level. In year 2019, the
expense result of Mandatum Life Group was EUR 24
million (35). Mandatum Life does not defer insurance
acquisition costs. Since 2012 the expense result has grown
significantly, especially due to increased fee income from
unit-linked business, as presented in the graph Expense
Result, Mandatum Life Group, 2010–2019.
Market Risks and Investment Performance
This section covers market risk related to Mandatum
Life’s with profit business i.e. that part of the business
where Mandatum Life carries the investment risk. As
mentioned earlier, the behavior of financial markets has
also an influence on unit-linked business since normally
the company’s fee income is linked to policy reserves in
unit-linked policies. This risk is taken into account as part
of expense risk.
In Mandatum Life, the approach to market risk
management is based on an analysis of technical
provisions’ expected cash flows, interest rate level and
current solvency position, i.e. active Asset and Liability
Management. A common feature for all with profit
technical provisions is the guaranteed rate and bonuses.
The cash flows of Mandatum Life's technical provisions
are relatively well predictable because in most of the
company’s with profit policies, surrenders and additional
investments are not possible.
Mandatum Life’s market risks arise mainly from equity
investments and interest rate risk related to fixed income
assets and insurance liabilities with a guaranteed interest
rate. The most significant interest rate risk in the life
insurance business is that fixed income investments will
not, over a long period of time, generate a return at least
equal to the guaranteed interest rate of technical provi-
sions. The probability of this risk increases when market
interest rates fall and stay at a low level. The duration
gap between the balance sheet’s technical provisions and
fixed income investments is constantly monitored and
managed. Control levels based on an internal risk capacity
model are used to manage and ensure adequate capital in
different market situations.
Mandatum Life has prepared for low interest rates on
the liability side by for example reducing the minimum
guaranteed interest rate in new contracts and by
supplementing the technical provisions with reserve
for decreased discount rate. In addition, existing
contracts have been changed to accommodate improved
management of reinvestment risk. Guarantees and other
main features of with profit liabilities are presented in the
section Underwriting Risks and Performance.20 255 3010 15 35
2019
2018
2017
2016
2015
2014
2013
2012
2011
2010
Expense Result Mandatum Life Group, 2010–2019
EURm
34.5
24.4
33.2
26.1
26.8
19.6
15.3
6.8
9.8
7.8
SAMPO GROUP’S RISKSAND CORE RISK
MANAGEMENT ACTIVITIES
IF GROUP
SAMPO GROUP’SSTRUCTURE ANDBUSINESS MODEL
TOPDANMARKGROUP
SAMPO GROUPCAPITALIZATION APPENDICES
RISK CONSIDERATIONSAT SAMPO GROUP LEVEL
AND SAMPO PLC
MANDATUM LIFEGROUP
RISK MANAGEMENT REPORT 2019 62
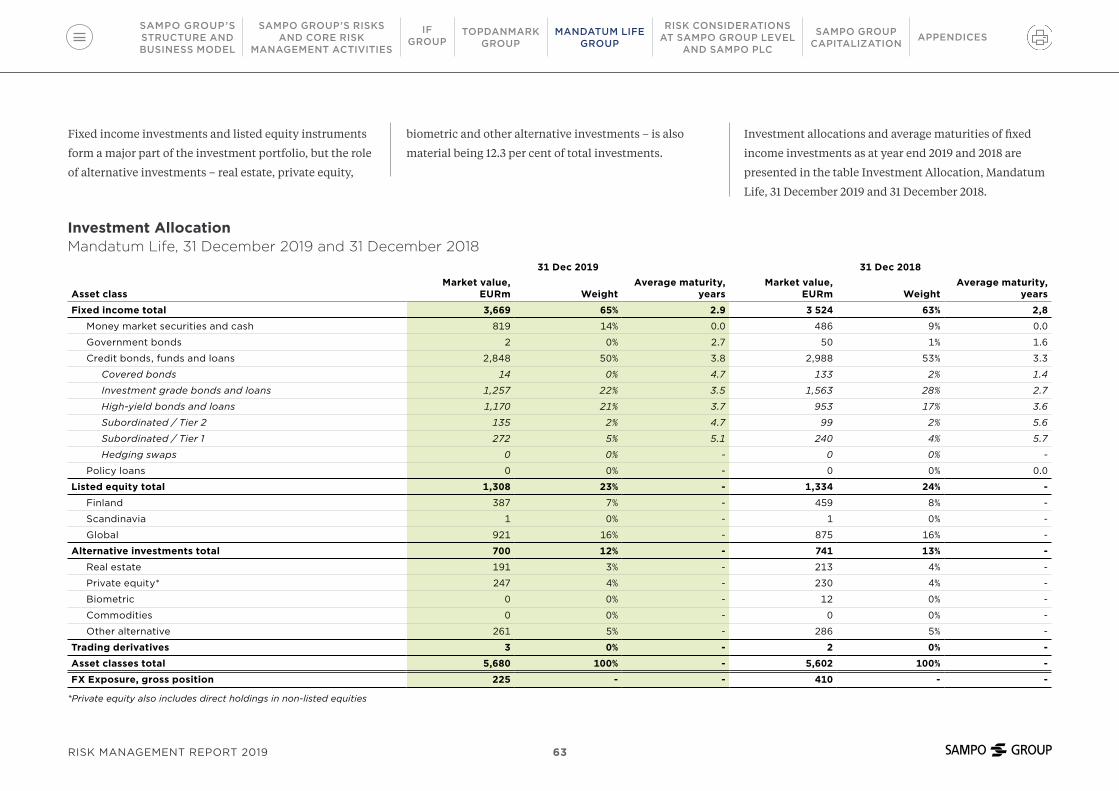
Fixed income investments and listed equity instruments
form a major part of the investment portfolio, but the role
of alternative investments – real estate, private equity,
biometric and other alternative investments – is also
material being 12.3 per cent of total investments.
Investment allocations and average maturities of fixed
income investments as at year end 2019 and 2018 are
presented in the table Investment Allocation, Mandatum
Life, 31 December 2019 and 31 December 2018.
Investment AllocationMandatum Life, 31 December 2019 and 31 December 2018
31 Dec 2019 31 Dec 2018
Asset classMarket value,
EURm WeightAverage maturity,
yearsMarket value,
EURm WeightAverage maturity,
years
Fixed income total 3,669 65% 2.9 3 524 63% 2,8
Money market securities and cash 819 14% 0.0 486 9% 0.0
Government bonds 2 0% 2.7 50 1% 1.6
Credit bonds, funds and loans 2,848 50% 3.8 2,988 53% 3.3
Covered bonds 14 0% 4.7 133 2% 1.4
Investment grade bonds and loans 1,257 22% 3.5 1,563 28% 2.7
High-yield bonds and loans 1,170 21% 3.7 953 17% 3.6
Subordinated / Tier 2 135 2% 4.7 99 2% 5.6
Subordinated / Tier 1 272 5% 5.1 240 4% 5.7
Hedging swaps 0 0% - 0 0% -
Policy loans 0 0% - 0 0% 0.0
Listed equity total 1,308 23% - 1,334 24% -
Finland 387 7% - 459 8% -
Scandinavia 1 0% - 1 0% -
Global 921 16% - 875 16% -
Alternative investments total 700 12% - 741 13% -
Real estate 191 3% - 213 4% -
Private equity* 247 4% - 230 4% -
Biometric 0 0% - 12 0% -
Commodities 0 0% - 0 0% -
Other alternative 261 5% - 286 5% -
Trading derivatives 3 0% - 2 0% -
Asset classes total 5,680 100% - 5,602 100% -
FX Exposure, gross position 225 - - 410 - -
*Private equity also includes direct holdings in non-listed equities
SAMPO GROUP’S RISKSAND CORE RISK
MANAGEMENT ACTIVITIES
IF GROUP
SAMPO GROUP’SSTRUCTURE ANDBUSINESS MODEL
TOPDANMARKGROUP
SAMPO GROUPCAPITALIZATION APPENDICES
RISK CONSIDERATIONSAT SAMPO GROUP LEVEL
AND SAMPO PLC
MANDATUM LIFEGROUP
RISK MANAGEMENT REPORT 2019 63
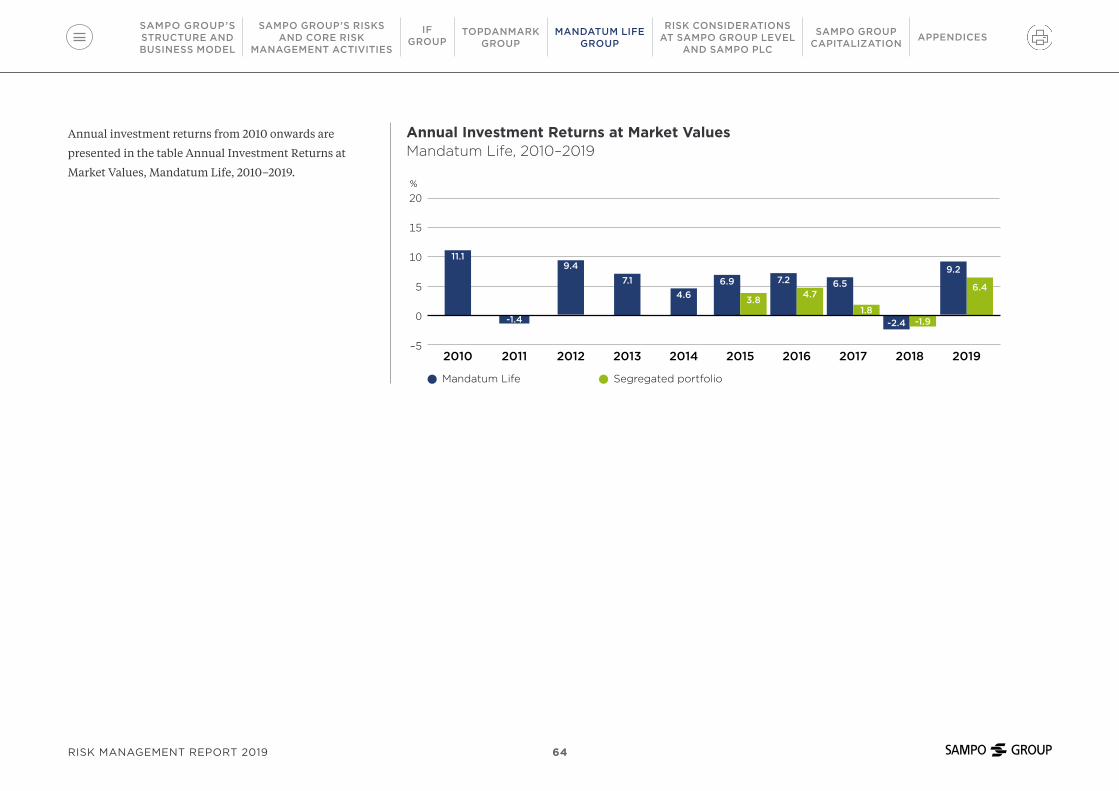
Annual investment returns from 2010 onwards are
presented in the table Annual Investment Returns at
Market Values, Mandatum Life, 2010–2019.
Graph 17
20142010 20152011 20162012 20172013 2018 2019
%
20
15
10
5
0
–5
Annual Investment Returns at Market ValuesMandatum Life, 2010–2019
-1.4
4.6
11.1
7.2 6.5
1.8
4.73.8
6.99.2
6.4
9.47.1
● Mandatum Life ● Segregated portfolio
-2.4 -1.9
SAMPO GROUP’S RISKSAND CORE RISK
MANAGEMENT ACTIVITIES
IF GROUP
SAMPO GROUP’SSTRUCTURE ANDBUSINESS MODEL
TOPDANMARKGROUP
SAMPO GROUPCAPITALIZATION APPENDICES
RISK CONSIDERATIONSAT SAMPO GROUP LEVEL
AND SAMPO PLC
MANDATUM LIFEGROUP
RISK MANAGEMENT REPORT 2019 64

Market Risks of Fixed Income and Equity Exposures
Fixed income and equity exposures are presented by
sector, asset class and rating together with counterparty
risk exposures relating to reinsurance and derivative
transactions in the table Exposures by Sector, Asset Class
and Rating, Mandatum Life, 31 December 2019. Counter-
party default risks are described in more detail in the
section Counterparty Default Risks. Due to differences
in the reporting treatment of derivatives, the figures in the
table may not be fully comparable with other tables in this
annual report.
Exposures by Sector, Asset Class and RatingMandatum Life, 31 December 2019
EURm AAA
AA+ -
AA-
A+ -
A-
BBB+ -
BBB-
BB+ -
C DNon- rated
Fixed income
totalListed
equities OtherCounter-
party risk Total
Change from
31 Dec 2018Basic industry 0 0 0 10 60 0 15 85 85 0 0 170 52
Capital goods 0 0 4 5 26 0 60 95 152 0 0 247 24
Consumer products 0 0 52 95 77 0 20 245 127 0 0 372 -89
Energy 0 1 0 0 0 0 47 47 0 8 0 55 5
Financial institutions 0 560 823 354 65 0 17 1,819 32 8 5 1,864 108
Governments 0 0 0 0 0 0 0 0 0 0 0 0 0
Government guaranteed 0 0 0 0 0 0 0 0 0 0 0 0 0
Health care 0 0 5 23 90 0 33 151 92 18 0 261 21
Insurance 0 0 17 51 0 0 17 85 3 8 0 96 12
Media 0 0 0 0 6 0 0 6 9 0 0 15 -12
Packaging 0 0 0 0 9 0 24 33 12 0 0 44 18
Public sector, other 0 2 25 0 0 0 0 27 0 0 0 27 -47
Real estate 0 0 1 87 5 0 144 236 0 175 0 411 89
Services 0 0 4 44 157 0 60 265 86 0 0 351 58
Technology and electronics 1 0 6 5 47 0 11 70 188 10 0 268 58
Telecommunications 0 0 8 44 72 0 0 124 15 0 0 139 -22
Transportation 0 0 0 12 0 0 1 12 29 0 0 42 8
Utilities 0 0 2 38 111 0 0 150 0 0 0 151 36
Others 0 0 0 0 16 0 2 17 0 25 0 42 -15
Asset-backed securities 0 0 0 0 0 0 0 0 0 0 0 0 0
Covered bonds 14 0 0 0 0 0 0 14 0 0 0 14 -120
Funds 0 0 0 0 0 0 187 187 478 448 0 1,112 -108
Clearing house 0 0 0 0 0 0 0 0 0 0 6 6 2
Total 15 563 946 767 741 0 637 3,669 1,308 700 11 5,688 79
Change from 31 Dec 2018 -134 -44 -164 151 262 0 73 145 -26 -41 2 79
SAMPO GROUP’S RISKSAND CORE RISK
MANAGEMENT ACTIVITIES
IF GROUP
SAMPO GROUP’SSTRUCTURE ANDBUSINESS MODEL
TOPDANMARKGROUP
SAMPO GROUPCAPITALIZATION APPENDICES
RISK CONSIDERATIONSAT SAMPO GROUP LEVEL
AND SAMPO PLC
MANDATUM LIFEGROUP
RISK MANAGEMENT REPORT 2019 65

The role of non-investment grade bonds is material in
Mandatum Life’s portfolio. A part of the money market
securities issued by Nordic banks and cash in Nordic
banks form a liquidity buffer within the fixed income
investments. At the moment, the total amount of these
investments is higher than what is needed for liquidity
purposes.
Nordic equity exposure includes almost only direct
investments to Finnish equities and they account for
almost one third of equity exposure. Two thirds of equity
investments are allocated globally consisting of both fund
investments and direct investments. The breakdown
of Mandatum Life’s listed equity investments by
geographical regions is presented in the adjacent graph.
Alternative Investments
The role of alternative investments has been significant
in Mandatum Life over the years. The current allocation
weight is 12 per cent.
The amount of private equity and alternative investments
has remained at the same level as in 2018. Since the
beginning of 2018, these asset classes have been managed
by Sampo plc’s investment operations instead of external
asset managers. The real estate portfolio is also managed
by Sampo Group’s own real estate management unit. The
real estate portfolio includes both direct investments in
properties and indirect investments in real estate funds as
Breakdown of Listed Equity Investments by Geographical RegionsMandatum Life
● Denmark 0
● Norway 0
● Sweden 1
● Finland 387
● Western Europe 430
● Eastern Europe 24
● North America 251
● Latin America 0
● Far East 215
● Denmark 0
● Norway 0
● Sweden 1
● Finland 459
● Western Europe 521
● Eastern Europe 24
● North America 180
● Latin America 0
● Far East 151
31 December 2019total EUR 1,308 million
31 December 2018total EUR 1,334 million
19%
2%
2%
16%11%
13%
33% 39%
30%
34%
well as in shares of real estate companies and it has been
quite stable.
Market Risks of Balance Sheet
The Board of Directors of Mandatum Life annually
approves the Investment Policy, which covers both the
segregated assets and the company’s other assets that
carry investment risk. This policy sets principles and
limits for investment portfolio activities and they are
based on the features of insurance liabilities, risk taking
capacity and shareholders’ return requirements.
The Investment Policy for segregated assets defines the
risk bearing capacity and the corresponding control
levels for the respective portfolio. Since the future bonus
reserves of the segregated group pension portfolio is the
first buffer against possible investment losses, the risk
bearing capacity is also based on the amount of the future
bonus reserve. Different control levels are based on the
fixed stress scenarios of assets.
SAMPO GROUP’S RISKSAND CORE RISK
MANAGEMENT ACTIVITIES
IF GROUP
SAMPO GROUP’SSTRUCTURE ANDBUSINESS MODEL
TOPDANMARKGROUP
SAMPO GROUPCAPITALIZATION APPENDICES
RISK CONSIDERATIONSAT SAMPO GROUP LEVEL
AND SAMPO PLC
MANDATUM LIFEGROUP
RISK MANAGEMENT REPORT 2019 66

The Investment Policy for other investment assets defines
the company level risk bearing capacity, the control levels
for the maximum acceptable risk and respective measures
to manage the risk. The control levels are set above the
Solvency II SCR and are based on predetermined market
stress tests. The general objective of these control levels
and respective guidelines is to maintain the required
solvency. When the above-mentioned control levels are
crossed, the Asset and Liability Committee reports to the
Board which then takes responsibility for the decisions
related to the capitalization and the market risks in the
balance sheet.
The cash flows of Mandatum Life’s with profit technical
provisions are relatively predictable, because in most
of the company’s with profit products, surrenders and
premiums are restricted. In addition, the company’s
claims costs do not contain a significant inflation risk
element.
The long-term target for investments is to provide
sufficient return to cover the guaranteed interest rate plus
bonuses based on the principle of fairness as well as the
shareholder’s return requirement with an acceptable level
of risk. In the long run, the most significant risk is that
fixed income investments will not generate an adequate
return compared to the applied discount rate.
In addition to investment and capitalization decisions,
Mandatum Life has implemented active measures on the
liability side to manage the balance sheet level interest
rate risk. The company has reduced the minimum
guaranteed interest rate in new contracts, supplemented
the technical provisions with discount rate reserves and
adjusted policy terms and conditions as well as policy
administration processes to enable more efficient interest
rate risk management.
Interest Rate Risk
Mandatum Life is negatively affected when rates are
decreasing or staying at low levels, because the duration
of liabilities is longer than the duration of assets. A
growing part of Mandatum Life’s business, i.e. unit-linked
and life and health business, is not interest rate sensitive,
which partially mitigates the whole company’s interest
rate risk.
The average duration of fixed income investments was
2.8 years including the effect of hedging derivatives. The
respective duration of the insurance liabilities was around
12 years. Interest rate risk is managed at the balance sheet
level by changing the duration of assets and by using
interest rate derivatives.
SAMPO GROUP’S RISKSAND CORE RISK
MANAGEMENT ACTIVITIES
IF GROUP
SAMPO GROUP’SSTRUCTURE ANDBUSINESS MODEL
TOPDANMARKGROUP
SAMPO GROUPCAPITALIZATION APPENDICES
RISK CONSIDERATIONSAT SAMPO GROUP LEVEL
AND SAMPO PLC
MANDATUM LIFEGROUP
RISK MANAGEMENT REPORT 2019 67

Transaction Risk PositionMandatum Life, 31 December 2019
Base currency, EURm EUR USD JPY GBP SEK NOK CHF DKK Other Total, netTechnical provisions 0 0 0 0 -3 0 0 0 0 -3
Investments 0 767 8 94 47 51 71 17 182 1,237
Derivatives 0 -736 -1 -94 -45 23 -76 -20 -82 -1,032
Transaction risk, net position 0 31 7 0 -1 73 -4 -3 100 203
Sensitivity: EUR -10% 0 3 1 0 0 7 0 0 10 20
Currency Risk
Currency risk can be divided into transaction and
translation risk. Mandatum Life is exposed to transaction
risk, which refers to currency risk arising from contractual
cash flows in foreign currencies. For more detailed
risk definition of currency risk see Appendix 2 Risk
Definitions.
In Mandatum Life, transaction risk arises mainly from
investments in other currencies than the euro as the
company’s technical provisions are denominated in the
euro. Mandatum Life does not automatically close its FX
position in foreign currencies, but instead, the currency
risk strategy is based on active management of the
currency position. The objective is to achieve a positive
return compared to a situation where the currency risk
exposure is fully hedged.
The transaction risk positions of Mandatum Life against
the euro are shown in the table Transaction Risk Position,
Mandatum Life, 31 December 2019. The table shows the
net transaction risk exposures and the changes in the
value of positions given a 10 per cent decrease in the value
of the base currency.
SAMPO GROUP’S RISKSAND CORE RISK
MANAGEMENT ACTIVITIES
IF GROUP
SAMPO GROUP’SSTRUCTURE ANDBUSINESS MODEL
TOPDANMARKGROUP
SAMPO GROUPCAPITALIZATION APPENDICES
RISK CONSIDERATIONSAT SAMPO GROUP LEVEL
AND SAMPO PLC
MANDATUM LIFEGROUP
RISK MANAGEMENT REPORT 2019 68
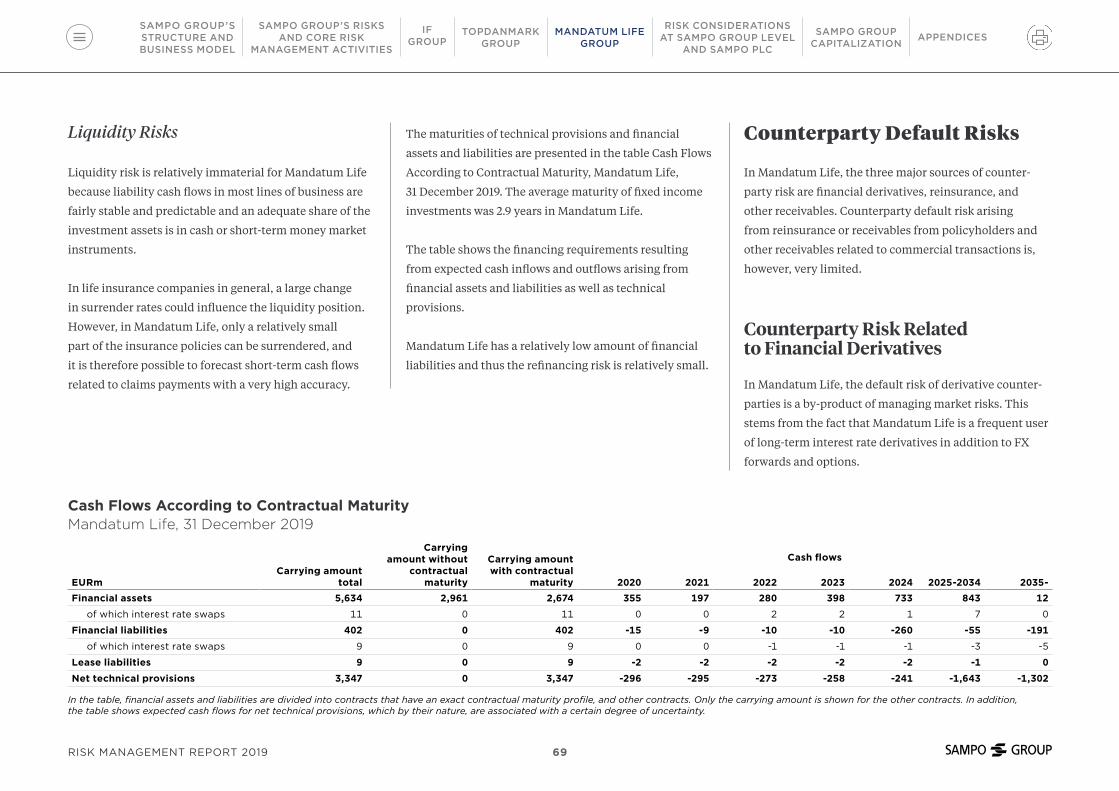
Liquidity Risks
Liquidity risk is relatively immaterial for Mandatum Life
because liability cash flows in most lines of business are
fairly stable and predictable and an adequate share of the
investment assets is in cash or short-term money market
instruments.
In life insurance companies in general, a large change
in surrender rates could influence the liquidity position.
However, in Mandatum Life, only a relatively small
part of the insurance policies can be surrendered, and
it is therefore possible to forecast short-term cash flows
related to claims payments with a very high accuracy.
The maturities of technical provisions and financial
assets and liabilities are presented in the table Cash Flows
According to Contractual Maturity, Mandatum Life,
31 December 2019. The average maturity of fixed income
investments was 2.9 years in Mandatum Life.
The table shows the financing requirements resulting
from expected cash inflows and outflows arising from
financial assets and liabilities as well as technical
provisions.
Mandatum Life has a relatively low amount of financial
liabilities and thus the refinancing risk is relatively small.
Counterparty Default Risks
In Mandatum Life, the three major sources of counter-
party risk are financial derivatives, reinsurance, and
other receivables. Counterparty default risk arising
from reinsurance or receivables from policyholders and
other receivables related to commercial transactions is,
however, very limited.
Counterparty Risk Related to Financial Derivatives
In Mandatum Life, the default risk of derivative counter-
parties is a by-product of managing market risks. This
stems from the fact that Mandatum Life is a frequent user
of long-term interest rate derivatives in addition to FX
forwards and options.
Cash Flows According to Contractual MaturityMandatum Life, 31 December 2019
EURmCarrying amount
total
Carrying amount without
contractual maturity
Carrying amount with contractual
maturity
Cash flows
2020 2021 2022 2023 2024 2025-2034 2035-Financial assets 5,634 2,961 2,674 355 197 280 398 733 843 12
of which interest rate swaps 11 0 11 0 0 2 2 1 7 0
Financial liabilities 402 0 402 -15 -9 -10 -10 -260 -55 -191
of which interest rate swaps 9 0 9 0 0 -1 -1 -1 -3 -5
Lease liabilities 9 0 9 -2 -2 -2 -2 -2 -1 0
Net technical provisions 3,347 0 3,347 -296 -295 -273 -258 -241 -1,643 -1,302
In the table, financial assets and liabilities are divided into contracts that have an exact contractual maturity profile, and other contracts. Only the carrying amount is shown for the other contracts. In addition, the table shows expected cash flows for net technical provisions, which by their nature, are associated with a certain degree of uncertainty.
SAMPO GROUP’S RISKSAND CORE RISK
MANAGEMENT ACTIVITIES
IF GROUP
SAMPO GROUP’SSTRUCTURE ANDBUSINESS MODEL
TOPDANMARKGROUP
SAMPO GROUPCAPITALIZATION APPENDICES
RISK CONSIDERATIONSAT SAMPO GROUP LEVEL
AND SAMPO PLC
MANDATUM LIFEGROUP
RISK MANAGEMENT REPORT 2019 69

The counterparty risk of bilaterally settled derivatives
is mitigated by careful selection of counterparties,
by diversification of counterparties to prevent risk
concentrations and by using collateral arrangements,
e.g. ISDA Master Agreements backed by Credit Support
Annexes. Since 2016, Sampo Group companies apart from
Topdanmark have settled interest rate swaps in central
counterparty clearing houses, which, while further
mitigating bilateral counterparty risk, also expose Sampo
Group companies to the systemic risk related to central
counterparty clearing houses.
Operational Risks
The objective of operational risk management in
Mandatum Life is to recognize the risks proactively,
manage the risks efficiently and to minimize the potential
effects of realized risks in a manner as cost-effective as
possible.
Business units are responsible for the identification,
assessment and management of their own operational
risks, including organizing adequate internal controls.
The Operational Risk Committee (“ORC”) monitors
and coordinates risk management issues regarding
operational risks within Mandatum Life. The committee
ensures that risks are identified, and internal control and
risk management have been organized in a proper way.
The committee also analyses deviations from operational
risk management policies and monitors operational risks
identified in the self-assessments as well as in occurred
incidents. In addition to this, the Committee analyzes and
handles operational risks, e.g. in relation to new products
and services, changes in processes and risks as well as
realized operational risk incidents. The committee meets
four times a year at a minimum. Significant observations
on operational risks are reported to the Risk Management
Committee (“RMC”) and the Board of Directors. The ORC
is also responsible for monitoring that the continuity and
contingency plans are prepared accordingly within the
business units.
In order to limit operational risks, Mandatum Life has
approved a number of policies including e.g. Internal
Control Policy, Compliance Policy, Security Policies,
Continuity Plan, Procurement and Outsourcing Policy,
Complaints Handling Policy and a number of other
policies related to ongoing operative activities. Deviations
against different policies are followed up in each business
unit and are reported to the Compliance Function and the
ORC.
The internal control system aims at preventing and
identifying negative incidents and minimizing their
impact. In addition, would there be an operational risk
event or a near miss, this must be analyzed and reported
to ORC.
Capitalization
Mandatum Life applies the Solvency II standard formula
with transitional measures on equity in the calculation
of SCR. Solvency II own funds (“OF”) is also affected by
transitional measures, because Mandatum Life applies
transitional measures on its technical provisions in regard
to its original pension policies with 3.5 per cent and
4.5 per cent guarantees. A volatility adjustment is also
applied when technical provisions are calculated. The size
of Solvency II liabilities with transitional measures of EUR
11,374 million is less than the respective figure without
transitional measures (EUR 11,826 million). Hence
the transitional measures increase the amount of OF.
Mandatum Life does not apply any undertaking-specific
parameters in the underwriting risk modules or apply
SAMPO GROUP’S RISKSAND CORE RISK
MANAGEMENT ACTIVITIES
IF GROUP
SAMPO GROUP’SSTRUCTURE ANDBUSINESS MODEL
TOPDANMARKGROUP
SAMPO GROUPCAPITALIZATION APPENDICES
RISK CONSIDERATIONSAT SAMPO GROUP LEVEL
AND SAMPO PLC
MANDATUM LIFEGROUP
RISK MANAGEMENT REPORT 2019 70

Graph 20
SolvencyMandatum Life, 31 December 2019
EURm2,250
2,000
1,750
1,500
1,250
1,000
750
500
250
0
-305-111
-301
1,204
2,1171,397
438
52
35
Insurance risk
Market risk
Counterparty risk
Diversifi- cation
Operational risk
LAC of TP*
LAC of DT**
SCR Own funds
* Loss absorbing capacity of technical provisions ** Loss absorbing capacity of deferred taxes
simplified calculations for any of the risk modules of the
standard formula.
The OF of Mandatum Life was EUR 2,117 million while the
SCR was EUR 1,204 million. The solvency ratio (OF/SCR)
was 176 per cent and the buffer was EUR 913 million. OF
without transitional measures on Technical Provisions
would be EUR 1,756 million, and the SCR without
transitional measures on equity risk would be EUR 1,234
million.
In the graph Solvency, Mandatum Life, 31 December 2019
SCR is divided into risk contributions. The diversification
benefit between risks is also presented in the graph.
The solvency position without the transitional
measures is expected to develop favourably during the
transitional period. The amount of with profit liabilities
is decreasing (see graph Forecast of With Profit
Liabilities, Mandatum Life, 2019–2031 within chapter
Underwriting Risks and Performance) and liabilities
with the highest guarantees are expected to decrease
significantly, from EUR 2,161 million to around EUR 750
million during the transitional period. Hence, most of
the capital consuming with profit liabilities will decrease
during the period. This creates a decreasing trend to the
SCR and, simultaneously, a positive trend to own funds
without transitional measures is anticipated. Mandatum
Life forecasts the development of solvency ratios with
and without the transitional measures internally and
these both have an influence on the company’s business
decisions.
SAMPO GROUP’S RISKSAND CORE RISK
MANAGEMENT ACTIVITIES
IF GROUP
SAMPO GROUP’SSTRUCTURE ANDBUSINESS MODEL
TOPDANMARKGROUP
SAMPO GROUPCAPITALIZATION APPENDICES
RISK CONSIDERATIONSAT SAMPO GROUP LEVEL
AND SAMPO PLC
MANDATUM LIFEGROUP
RISK MANAGEMENT REPORT 2019 71

Mandatum Life’s structure of OF is presented in the
table Eligible Own Funds, Mandatum Life, 31 December
2019 and 31 December 2018. In 2019 OF consists of both
Tier 1 and Tier 2 items of which EUR 349 million (i.e.
16.5 per cent of OF) was subordinated debt at the end
of 2019 as presented in the table Solvency II Compliant
Subordinated Liabilities, Mandatum Life, 31 December
2019. The subordinated debt, which is classified as a
restricted Tier 1 item due to Grandfathering principles,
amounted to EUR 100 million. Transitional measures on
technical provisions contribute EUR 361 million to OF at
the end of 2019.
In summary, the solvency and the capital structure of
Mandatum Life is adequate. During the transitional
period on technical provisions the liabilities with high
guarantees will decrease significantly.
Eligible Own FundsMandatum Life, 31 December 2019 and 31 December 2018
EURm 2019 2018Tier 1 Total 1,868 1,740
Ordinary share capital 181 181
Reconciliation reserve 1,587 1,459
Subordinated liabilities 100 100
Tier 2 Total 249 0
Subordinated liabilities 249 0
Untaxed reserves 0 0
Tier 3 Total 0 0
Deferred tax assets 0 0
Eligible own funds 2,117 1,740
Solvency II Compliant Subordinated LiabilitiesMandatum Life, 31 December 2019
Issuer Instrument Nominal amountCarrying amount
in EUR (IFRS) First Call TieringNominal amount in
Sampo plc's portfolioMandatum Life Insurance Company Ltd PerpNC10 EUR 100,000,000 100,000,000 31 Dec 2012 Tier 1 100,000,000
Mandatum Life Insurance Company Ltd 30NC5 EUR 250,000,000 249,061,469 04 Oct 2024 Tier 2 0
349,061,469
SAMPO GROUP’S RISKSAND CORE RISK
MANAGEMENT ACTIVITIES
IF GROUP
SAMPO GROUP’SSTRUCTURE ANDBUSINESS MODEL
TOPDANMARKGROUP
SAMPO GROUPCAPITALIZATION APPENDICES
RISK CONSIDERATIONSAT SAMPO GROUP LEVEL
AND SAMPO PLC
MANDATUM LIFEGROUP
RISK MANAGEMENT REPORT 2019 72

RISK CONSIDERATIONS AT SAMPO GROUP LEVEL AND SAMPO PLC
74Risk
Considerations at Sampo Group
Level and Sampo plc
74Underwriting
Risks at Sampo Group
75Market Risks at Sampo Group
Level
85The Role of Sampo plc
SAMPO GROUP’S RISKSAND CORE RISK
MANAGEMENT ACTIVITIES
IF GROUP
SAMPO GROUP’SSTRUCTURE ANDBUSINESS MODEL
TOPDANMARKGROUP
SAMPO GROUPCAPITALIZATION APPENDICESMANDATUM LIFE
GROUP
RISK CONSIDERATIONSAT SAMPO GROUP LEVEL
AND SAMPO PLC
RISK MANAGEMENT REPORT 2019 73

Sampo Group is first and foremost exposed to general
performance of the Nordic economies. However, the
Nordic economies typically are at any given time in some-
what different stages of their economic cycles, because
of reasons such as different economic structures and
separate currencies. Also, geographically the Nordics as a
large area is more a source of underwriting diversification
than a concentration. Hence, inherently the Nordic area is
a good basis for diversified business.
To further maintain diversification of businesses Sampo
Group proactively prevents concentrations to the extent
possible by segregating the duties of separate business
areas. As a result, separate companies have very few
overlapping areas in their underwriting and investments
activities. Despite proactive strategic decisions on
segregation of duties, concentrations in underwriting and
investments may appear and hence liabilities and assets
are monitored at the Group level to identify potential
concentrations at a single company or risk factor level.
Risk Considerations at Sampo Group Level and Sampo plc
It is regarded that the current business model where all
companies have their own processes and agreements with
counterparties is preventing accumulation of counter-
party default risks and operational risks. Hence, these
risks are mainly managed at company level.
The amount of intragroup exposures between the Group
companies is small and the parent company is the only
source of internal liquidity and the main source of capital
within the Group. This effectively prevents the contagion
risk, and hence potential problems of one company will
not affect directly the other Group companies.
Underwriting and market risk concentrations and their
management are described in the next sections as well as
the parent company's role as a risk manager of group-wide
risks and as a source of liquidity.
Underwriting Risks at Sampo Group
With respect to the underwriting businesses carried out
in the subsidiary companies, it has been established that
If, Topdanmark and Mandatum Life all operate within
the Nordic countries, but mostly in different geographical
areas and in different lines of business and hence their
underwriting risks are different by nature. There are
some common risk factors like the life expectancy in
Finland. Also, in Denmark If and Topdanmark have
some over lapping areas. However, there are no material
underwriting risk concentrations in the normal course of
business.
Consequently, business lines as such are contributing
diversification benefits rather than a concentration of
risks. This general risk picture has not changed with
increased holding in Topdanmark, because Topdanmark
SAMPO GROUP’S RISKSAND CORE RISK
MANAGEMENT ACTIVITIES
IF GROUP
SAMPO GROUP’SSTRUCTURE ANDBUSINESS MODEL
TOPDANMARKGROUP
SAMPO GROUPCAPITALIZATION APPENDICESMANDATUM LIFE
GROUP
RISK CONSIDERATIONSAT SAMPO GROUP LEVEL
AND SAMPO PLC
RISK MANAGEMENT REPORT 2019 74

Underwriting Solvency Capital Requirement of Insurance Sub-Group31 December 2019
Underwriting risk, EURm If Topdanmark Mandatum Life Sampo plc Diversified
Sampo Group Sum of the parts Delta Life underwriting 83 72 437 0 568 593 -24
Health underwriting 511 231 2 0 729 744 -16
Non-life underwriting 1,145 232 0 0 1,361 1,377 -16
Sum of sub-risks 1,739 535 439 0 2,658 2,714 -56
Diversification -474 -188 -1 0 -951 -663 -288
Underwriting risk 1,265 347 438 0 1,707 2,050 -344
underwrites mainly Danish risks with a focus on client
bases which only marginally overlap with If’s client bases.
In the table Underwriting Solvency Capital Requirements
of Insurance Sub-Group, 31 December 2019, underwriting
activities and sensitivities to related risks of three oper-
ative insurance companies are compared to each other
based on their standard formula gross SCRs, because the
reported Sampo Group underwriting SCR is based on
them. Standard formula SCRs do not reflect the risks as
well as internal models used by If and Topdanmark, but
in this context, they can be used as a common basis for
comparison purposes.
In terms of SCRs If is contributing most to the Group
SCR and it has clear focus on non-life underwriting and
related health underwriting. Business is well spread over
all Nordic countries but having the smallest portion of the
business in Denmark. Geographical diversification is not
considered by standard formula and hence If’s internally
assessed capital need of EUR 608 million is much smaller.
Mandatum Life has focus on Finnish life insurance
risks and hence it has practically no lines of business or
geographical diversification benefits within underwriting.
In Topdanmark capital consumption is most evenly
spread over the various underwriting risk types, although
they are written solely in Denmark. Topdanmark’s
company specific diversification benefit over lines of
businesses is relatively largest compared to other Sampo
Group companies.
All in all, at Sampo Group level, the underwriting activi-
ties are well-diversified by lines of businesses, geograph-
ical areas and client-groups. At Sampo Group level the SF
gives diversification benefit of EUR 344 million because
underwriting activities at the Group level are more evenly
distributed over lines of businesses than in separate
companies. Sampo considers that the diversified Group
SCR of EUR 1,707 million is a relatively conservative
measure of the underwriting capital requirement, because
SF at the sub-group and Sampo Group level does not take
into account geographical and client base diversifications.
Market Risks at Sampo Group Level
For all subsidiaries, their insurance liabilities and the
company specific risk appetite are the starting points
for their investment activities. The insurance liabilities
including loss absorbing buffers as well as the risk appetite of
Mandatum Life, If and Topdanmark differ, and as a result the
structures and risks of the investment portfolios and balance
sheets of the three companies differ respectively. Companies’
average investment returns, and volatilities of investment
returns also differ as presented earlier in the Annual Invest-
ment Returns at Market Values, 2010–2019 -graphs. Sampo
Group’s investment assets presented in the tables and graphs
in this section do not include investments in the subsidiaries
or in the associated companies (e.g. Nordea).
The total amount of Sampo Group’s investment assets as
at 31 December 2019 was EUR 26,820 million (25,887) as
presented in the following graph. Mandatum Life’s and
Topdanmark’s investment assets presented here do not
include assets which cover unit-linked contracts.
SAMPO GROUP’S RISKSAND CORE RISK
MANAGEMENT ACTIVITIES
IF GROUP
SAMPO GROUP’SSTRUCTURE ANDBUSINESS MODEL
TOPDANMARKGROUP
SAMPO GROUPCAPITALIZATION APPENDICESMANDATUM LIFE
GROUP
RISK CONSIDERATIONSAT SAMPO GROUP LEVEL
AND SAMPO PLC
RISK MANAGEMENT REPORT 2019 75

Graph 21
● Fixed income 88% 65% 60% 81% 90% 63% 70% 78%
● Listed equity 12% 23% 29% 6% 10% 24% 20% 8%
● Private equity* 0% 4% 11% 3% 0% 4% 9% 3%
● Real estate 0% 3% 0% 8% 0% 4% 0% 8%
● Other alternative investments 0% 5% 0% 2% 0% 5% 0% 3%
Sampo plc's figures do not include debt instruments issued by the insurance subsidiaries *Private Equity also includes direct holdings in non-listed equities
If Mandatum Life Sampo plc Topdanmark
Development of InvestmentsIf, Mandatum Life, Sampo plc and Topdanmark
EURm
14,000
12,000
10,000
8,000
6,000
4,000
2,000
0
7,653
6,754
2,378 2,440
5,680 5,602
11,109 11,092
If Mandatum Life Sampo plc Topdanmark
31 December 2019 Total EUR 26,820 million
31 December 2018Total EUR 25,887 million
SAMPO GROUP’S RISKSAND CORE RISK
MANAGEMENT ACTIVITIES
IF GROUP
SAMPO GROUP’SSTRUCTURE ANDBUSINESS MODEL
TOPDANMARKGROUP
SAMPO GROUPCAPITALIZATION APPENDICESMANDATUM LIFE
GROUP
RISK CONSIDERATIONSAT SAMPO GROUP LEVEL
AND SAMPO PLC
RISK MANAGEMENT REPORT 2019 76

Investment activities and market risk taking are arranged
pro-actively in such a way that there is virtually no
overlap between the wholly-owned subsidiaries’ single-
name risks except with regards to Nordic banks where
companies have their extra funds in the forms of short-
term money market assets and cash. From the asset side’s
Market Risk Solvency Capital Requirements of Sub-Groups and Sampo plc31 December 2019
Market risk, EURm If Topdanmark Mandatum Life Sampo plc Diversified
Sampo Group Sum of the parts Delta Interest rate / down shock 138 26 77 3 244 244 0
Equity 446 280 905 2,624 4,233 4,255 -23
Property 1 170 43 1 215 215 0
Spread 487 311 451 9 1,259 1,259 0
Concentration / Group level 16 34 7 707 637 764 -127
Currency / Group level 431 14 132 239 904 816 88
Sum of sub-risks 1,520 834 1,616 3,583 7,492 7,553 -61
Diversification -367 -137 -221 -789 -1,615 -1,514 -100
Market risk 1,153 697 1,395 2,794 5,877 6,038 -161
diversification perspective Topdanmark is a positive
factor because the role of Danish assets is dominant in
portfolios and especially the role of Danish covered bonds
is central. In Sampo Group’s other insurance companies’
portfolios the weight of Danish investments has been
immaterial.
When market risks of three operative insurance sub-
groups and respective figures of the parent company
Sampo are compared to each other by their SCRs the
following things can be seen at Sampo Group level.
SAMPO GROUP’S RISKSAND CORE RISK
MANAGEMENT ACTIVITIES
IF GROUP
SAMPO GROUP’SSTRUCTURE ANDBUSINESS MODEL
TOPDANMARKGROUP
SAMPO GROUPCAPITALIZATION APPENDICESMANDATUM LIFE
GROUP
RISK CONSIDERATIONSAT SAMPO GROUP LEVEL
AND SAMPO PLC
RISK MANAGEMENT REPORT 2019 77

Mandatum Life takes the largest market risks both in
absolute and relative terms and currently equity risk
is its dominant risk contributor. In If currency and
spread risks are the main risk contributors and there is a
relatively larger diversification effect than in Mandatum
Life because of a more evenly spread market risk profile.
Topdanmark is matching its liabilities with assets and
hence the capital requirements for interest rate risk and
currency risk are minor and equity, spread and property
risks are main contributors of market risk SCR. In all
companies, there is some concentration risk, but at
Sampo Group level the effect comes almost entirely from
Sampo plc, due to Nordea being treated as an equity
investment in Sampo Group’s solvency calculations.
A summary of Sampo Group’s market risk sensitivities
and estimated solvency sensitivities on market risk
factors are presented in the following tables.
The solvency sensitivity to spreads is presented in the
table above. This is affected by the spread sensitivity of
fixed income investments and the Solvency II volatility
adjustment (“VA”) applied by Mandatum Life and
Topdanmark when valuing their technical provisions.
The VA is assumed to increase by 25 bps in this spread
stress, and it is buffering the effects that movements in
spreads have on the solvency ratio.
Estimated Solvency Sensitivities on Market Risk FactorsSampo Group, 31 December 2019
Interest rates Spreads Equity prices31 Dec 2019 -1% +1% +1% -10% -20% -30%
Solvency ratio 167% 154% 176% 165% 171% 170% 158%
Market Risk SensitivitiesSampo Group, 31 December 2019
EURm Scenario If Mandatum Life Topdanmark Sampo plc Sampo Group
Equities-10% -128 -131 -15 -69 -342
10% 128 131 15 69 342
Interest rates
-100 bps 137 103 3 42 374
+100 bps -132 -85 -6 -40 -341
Other-10% -2 -70 -46 -28 -144
10% 2 70 46 28 144
Local currency
-5% -1 11 9 52 -
5% 1 -11 -9 -52 -
Topdanmark’s interest rate scenario figures show the net of financial assets and technical provisions. The company figures do not sum up to the Sampo Group figures due to eliminations and the exclusion of Topdanmark's technical provisions from the Sampo Group figures. The figures in this table do not completely reconcile with the table Market Risk Sensitivities, Topdanmark, 31 December 2019 and 31 December 2018 due to differences in calculation methods.
It can be seen from the table Estimated Solvency Sensitiv-
ities on Market Risk Factors, Sampo Group, 31 December
2019, that Sampo Group is exposed to a fall in interest
rates. This sensitivity follows mainly from the fact that the
duration of insurance liabilities is longer than the fixed
income asset duration in If and Mandatum Life.
SAMPO GROUP’S RISKSAND CORE RISK
MANAGEMENT ACTIVITIES
IF GROUP
SAMPO GROUP’SSTRUCTURE ANDBUSINESS MODEL
TOPDANMARKGROUP
SAMPO GROUPCAPITALIZATION APPENDICESMANDATUM LIFE
GROUP
RISK CONSIDERATIONSAT SAMPO GROUP LEVEL
AND SAMPO PLC
RISK MANAGEMENT REPORT 2019 78
The Solvency II symmetric adjustment (“SA”) of the
equity capital charge was -0.08% at the end of 2019. The
SA is assumed to reach a value of -5.5% in the scenario
where equity prices fall by 10%. Furthermore, the SA is
assumed to reach its lower bound -10% set in the solvency
regulations in the other equity price scenarios (-20%
and -30%). As can be seen from the sensitivities, the
SA buffers equity market risk when the SA is within its
bounds [-10%, +10%] set in the solvency regulations. The
SA is based on the ratio of the current level of a broad
equity index (defined by EIOPA) and its 36-month moving
average. The SA buffers consequently systematic, but not
a company specific, equity risk. In the case that the price
development of a single equity investment, e.g. Sampo’s
equity investment in Nordea shares, deviates from the
aforementioned index, the SA does not buffer the effect
that this deviation has on the Group’s solvency ratio.
In the next paragraphs concentrations by homogenous
risk groups and by single names are presented first and
after that balance sheet level risks are discussed shortly.
Holdings by Sector, Geographical Area and Asset Class
Regarding fixed income and equity exposures financial
institutions and covered bonds have a material weight
in the group-wide portfolios whereas the role of public
sector investments is quite limited. Most of these assets
are issued by Nordic corporates and institutions. Most
corporate issuers, although being based in the Nordic
countries, are operating at global markets and hence their
performance is not that dependent on the Nordic markets.
Exposures by sector, asset class and rating are presented
in the following table.
SAMPO GROUP’S RISKSAND CORE RISK
MANAGEMENT ACTIVITIES
IF GROUP
SAMPO GROUP’SSTRUCTURE ANDBUSINESS MODEL
TOPDANMARKGROUP
SAMPO GROUPCAPITALIZATION APPENDICESMANDATUM LIFE
GROUP
RISK CONSIDERATIONSAT SAMPO GROUP LEVEL
AND SAMPO PLC
RISK MANAGEMENT REPORT 2019 79

Exposures by Sector, Asset Class and RatingSampo Group, 31 December 2019
EURm AAA
AA+ -
AA-
A+ -
A-
BBB+ -
BBB-
BB+ -
C DNon- rated
Fixed income
totalListed
equities OtherCounter-
party risk Total
Change from 31
Dec 2018Basic industry 0 0 20 97 80 0 73 270 130 0 0 400 96
Capital goods 0 0 64 46 36 0 181 327 606 0 0 933 157
Consumer products 0 0 222 370 94 0 106 791 348 0 0 1,140 -171
Energy 0 1 0 0 34 0 175 210 8 8 0 226 -135
Financial institutions 37 2,279 2,477 1,188 149 0 71 6,201 429 8 8 6,647 69
Governments 9 0 0 0 0 0 0 9 0 0 0 9 -124
Government guaranteed 9 27 0 0 0 0 0 36 0 0 0 36 0
Health care 7 0 15 50 90 0 69 232 174 18 0 423 17
Insurance 0 0 59 133 26 0 59 277 3 25 0 305 15
Media 0 0 0 0 6 0 16 22 9 0 0 30 -18
Packaging 0 0 0 0 9 0 39 48 12 0 0 60 28
Public sector, other 514 68 25 0 0 0 0 606 0 0 0 606 -183
Real estate 0 5 88 355 60 0 689 1,198 0 181 0 1,378 260
Services 0 0 4 88 226 0 93 411 362 0 0 773 90
Technology and electronics 1 0 25 18 57 0 115 217 188 10 0 415 106
Telecommunications 0 0 30 176 120 0 0 326 75 0 0 401 -44
Transportation 0 58 27 43 0 0 231 359 30 0 0 390 84
Utilities 0 0 62 152 229 0 29 472 0 0 0 472 -10
Others 0 26 0 0 16 0 29 71 0 34 0 105 7
Asset-backed securities 0 0 0 0 0 0 0 0 0 0 0 0 0
Covered bonds 2,548 70 11 0 0 0 0 2,630 0 0 0 2,630 -187
Funds 0 0 0 0 0 0 187 187 906 693 0 1,786 -24
Clearing house 0 0 0 0 0 0 0 0 0 0 16 16 -34
Total excluding Topdanmark 3,125 2,534 3,131 2,716 1,232 0 2,161 14,900 3,281 977 25 19,182 -1Change from 31 Dec 2018 -404 -398 -185 91 364 0 257 -275 344 -29 -42 -1
Topdanmark TotalGroup excluding life insurance 1,670 0 142 0 0 0 150 1,963 124 108 127 2,321
Life insurance 3,221 0 239 11 9 0 381 3,862 359 870 241 5,332
Total Topdanmark 4,892 0 382 11 9 0 531 5,825 483 978 367 7,653
SAMPO GROUP’S RISKSAND CORE RISK
MANAGEMENT ACTIVITIES
IF GROUP
SAMPO GROUP’SSTRUCTURE ANDBUSINESS MODEL
TOPDANMARKGROUP
SAMPO GROUPCAPITALIZATION APPENDICESMANDATUM LIFE
GROUP
RISK CONSIDERATIONSAT SAMPO GROUP LEVEL
AND SAMPO PLC
RISK MANAGEMENT REPORT 2019 80

Most of the financial institutions and covered bonds are
in the Nordic countries as can be seen in the table Fixed
Income Investments in the Financial Sector, Sampo
Group Excluding Topdanmark, 31 December 2019.
The public-sector exposure includes government bonds,
government guaranteed bonds and other public-sector
investments as shown in the table Fixed Income
Investments in the Public Sector, Sampo Group Excluding
Topdanmark, 31 December 2019. The public sector has
had a relatively minor role in Sampo Group’s portfolios
and these exposures have been mainly in the Nordic
countries. AAA rated mortgage bonds have a material role
in Topdanmark’s portfolios.
The listed equity investments of Sampo Group totaled
EUR 3,281 million at the end of year 2019 (2,937). At the
end of year 2019, the listed equity exposure of If was EUR
1,281 million (1,113). The proportion of listed equities in
If’s investment portfolio was 12 per cent. In Mandatum
Life, the listed equity exposure was EUR 1,308 million at
the end of year 2019 (1,334) and the proportion of listed
equities was 23 per cent of the investment portfolio.
In Topdanmark Group, the listed equity exposure was
EUR 484 million at the end of year 2019 (534). Within
Topdanmark Group, the allocation to listed equity is
higher in the life company.
Fixed Income Investments in the Financial SectorSampo Group Excluding Topdanmark, 31 December 2019
EURm Covered bonds
Cash and money market
securitiesLong-term
senior debt
Long-term subordinated
debt Total %Finland 101 1,598 479 219 2,398 27.2%
Sweden 1,703 5 551 133 2,392 27.1%
Norway 612 469 339 1,420 16.1%
France 568 168 736 8.3%
Denmark 167 226 233 626 7.1%
Netherlands 268 42 310 3.5%
United States 217 217 2.5%
Canada 34 148 182 2.1%
United Kingdom 12 2 134 17 165 1.9%
Iceland 72 41 113 1.3%
Germany 66 0 66 0.7%
New Zealand 37 37 0.4%
Spain 28 28 0.3%
Guernsey 27 27 0.3%
Australia 1 26 26 0.3%
Ireland 23 23 0.3%
Estonia 15 7 22 0.3%
Switzerland 17 17 0.2%
Austria 12 12 0.1%
Bermuda 10 10 0.1%
Cayman Islands 2 2 0.0%
Total 2,630 2,189 2,978 1,034 8,829 100.0%
Fixed Income Investments in the Public SectorSampo Group Excluding Topdanmark, 31 December 2019
Milj. e GovernmentsGovernment guaranteed
Public sector, other Total
Norway 329 329
Sweden 9 253 262
Finland 27 25 52
Denmark 9 9
Total 9 36 606 652
SAMPO GROUP’S RISKSAND CORE RISK
MANAGEMENT ACTIVITIES
IF GROUP
SAMPO GROUP’SSTRUCTURE ANDBUSINESS MODEL
TOPDANMARKGROUP
SAMPO GROUPCAPITALIZATION APPENDICESMANDATUM LIFE
GROUP
RISK CONSIDERATIONSAT SAMPO GROUP LEVEL
AND SAMPO PLC
RISK MANAGEMENT REPORT 2019 81

The geographical core of Sampo Group’s equity
investments is in the Nordic companies. The proportion
of Nordic companies’ equities corresponds to 59 per
cent of the total equity portfolio. This is in line with
Sampo Group’s investment strategy of focusing on
Nordic companies. However, these Nordic companies
are mainly competing in global markets: only a few are
operationally purely domestic companies. Hence, the
ultimate risk is not highly dependent on the Nordic
economies. A breakdown of the listed equity exposures of
Sampo Group is shown in the graph Breakdown of Listed
Equity Investments by Geographical Regions, Sampo
Group Excluding Topdanmark, 31 December 2019 and
31 December 2018.
Graph 22
Breakdown of Listed Equity Investments by Geographical RegionsSampo Group Excluding Topdanmark
● Denmark 284
● Norway 231
● Sweden 932
● Finland 484
● Western Europe 582
● Eastern Europe 24
● North America 334
● Latin America 48
● Far East 362
● Denmark 264
● Norway 147
● Sweden 761
● Finland 537
● Western Europe 643
● Eastern Europe 24
● North America 265
● Latin America 26
● Far East 271
31 December 2019total EUR 3,281 million
28%26%
1%1%
1%
1%
9% 9%11% 9%
10%9%7% 5%
18%22%
15% 18%
31 December 2018total EUR 2,937 million
SAMPO GROUP’S RISKSAND CORE RISK
MANAGEMENT ACTIVITIES
IF GROUP
SAMPO GROUP’SSTRUCTURE ANDBUSINESS MODEL
TOPDANMARKGROUP
SAMPO GROUPCAPITALIZATION APPENDICESMANDATUM LIFE
GROUP
RISK CONSIDERATIONSAT SAMPO GROUP LEVEL
AND SAMPO PLC
RISK MANAGEMENT REPORT 2019 82

Largest Holdings by Single Name
The largest exposures by individual issuers and counter-
parties are presented in the table Largest Exposures
by Issuer and Asset Class, Sampo Group Exluding
Topdanmark, 31 December 2019. The largest single name
investments in Topdanmark’s portfolios are in AAA rated
Danish covered bonds.
Largest Exposures by Issuer and Asset ClassSampo Group Excluding Topdanmark, 31 December 2019
Issuer, EURm Total
% of total investment
assets
Cash & short-term fixed
income
Long-term fixed
income, total
Long-term fixed
income: Government guaranteed
Long-term fixed
income: Covered
bonds
Long-term fixed
income: Senior bonds
Long-term fixed
income: Tier 1 and
Tier 2 Equities
Uncolla-teralized
part of derivatives
Nordea Bank 1,268 7% 425 839 0 459 189 191 0 4
Skandinaviska Enskilda Banken 873 5% 676 196 0 177 6 13 0 0
Danske Bank 770 4% 503 265 0 155 59 51 0 3
BNP Paribas 627 3% 568 59 0 0 59 0 0 0
Svenska Handelsbanken 543 3% 0 543 0 485 18 40 0 0
DnB 514 3% 0 514 0 194 196 125 0 0
Norway 474 3% 0 474 0 0 372 102 0 0
Swedbank 427 2% 0 427 0 277 119 31 0 0
Saxo Bank 301 2% 0 17 0 0 0 17 284 0
Landshypotek 254 1% 0 254 0 200 34 20 0 0
Total top 10 exposures 6,051 32% 2,172 3,588 0 1,948 1,049 590 284 7
Other 12,847 68%
Total investment assets 18,898 100%
SAMPO GROUP’S RISKSAND CORE RISK
MANAGEMENT ACTIVITIES
IF GROUP
SAMPO GROUP’SSTRUCTURE ANDBUSINESS MODEL
TOPDANMARKGROUP
SAMPO GROUPCAPITALIZATION APPENDICESMANDATUM LIFE
GROUP
RISK CONSIDERATIONSAT SAMPO GROUP LEVEL
AND SAMPO PLC
RISK MANAGEMENT REPORT 2019 83

Ten Largest Direct High Yield and Non-rated Fixed Income Investments and Direct Listed Equity InvestmentsSampo Group Excluding Topdanmark, 31 December 2019
Ten largest direct high yield and non-rated fixed income investments Rating
Total, EURm
% of total direct fixed income investments
High Street Shopping NR 154 1.1%
TDC B+ 99 0.7%
Teollisuuden Voima BB+ 98 0.7%
Sponda NR 95 0.7%
Evergood 4 ApS B+ 80 0.6%
Trevian Finland Properties I NR 77 0.5%
Saab NR 57 0.4%
Pohjolan Voima NR 52 0.4%
Veningen NR 51 0.4%
Intrum BB 50 0.3%
Total top 10 exposures 812 5.6%
Other direct fixed income investments 13,622 94.4%
Total direct fixed income investments 14,435 100.0%
Ten largest direct listed equity investmentsTotal, EURm
% of total direct equity investments
Saxo Bank 284 11.9%
Intrum 184 7.7%
Volvo 134 5.6%
Nobia 122 5.1%
Norwegian Finans Holding 114 4.8%
Asiakastieto 92 3.9%
ABB 86 3.6%
Sectra 80 3.3%
Veidekke 67 2.8%
Telia Company 60 2.5%
Total top 10 exposures 1,222 51.4%
Other direct equity investments 1,156 48.6%
Total direct equity investments 2,378 100.0%
The largest high-yield and non-rated fixed income
investment single-name exposures are presented in
the table Ten Largest Direct High Yield and Non-rated
Fixed Income Investments, Sampo Group Excluding
Topdanmark, 31 December 2019. Furthermore, the largest
direct listed equity exposures are presented in the table
Ten Largest Direct Listed Equity Investments, Sampo
Group Excluding Topdanmark, 31 December 2019.
The exposures in fixed income instruments issued by
non-investment grade issuers are significant, because a
relatively small number of Nordic companies are rated.
Further, many of the rated companies have a rating lower
than investment grade rating (high yield).
Balance Sheet Concentrations
In general Sampo Group is structurally dependent on
the performance of the Nordic economies as already
described earlier. Sampo Group is also economically
exposed to a fall in interest rates, as can be seen in the
table Estimated Solvency Sensitivities on Market Risk
Factors, Sampo Group, 31 December 2019 presented
above. The lower the rates and the flatter the yield
curve, the more challenging the environment is for the
current business models especially when the duration
of insurance liabilities is longer than fixed income asset
duration in If and Mandatum Life. In Topdanmark
SAMPO GROUP’S RISKSAND CORE RISK
MANAGEMENT ACTIVITIES
IF GROUP
SAMPO GROUP’SSTRUCTURE ANDBUSINESS MODEL
TOPDANMARKGROUP
SAMPO GROUPCAPITALIZATION APPENDICESMANDATUM LIFE
GROUP
RISK CONSIDERATIONSAT SAMPO GROUP LEVEL
AND SAMPO PLC
RISK MANAGEMENT REPORT 2019 84

interest rate risk of the balance sheet is being actively
hedged and hence Topdanmark is not increasing interest
rate risk materially at the Group level.
Sampo Group would benefit materially in case interest
rates would rise, because economic value of insurance
liabilities would decrease more than value of assets
backing them. At the same time the net interest income of
Nordea should increase as well.
The Role of Sampo plc
Sampo plc is a long-term investor in Nordic financials and
a source of liquidity within the Group. Hence, the healthy
funding structure and the capacity to generate funds if
needed are on continuous focus.
As at 31 December 2019 Sampo had long-term strategic
holdings of EUR 8,841 million and they were funded
mainly by capital of EUR 7,596 million and senior debt
of EUR 3,414 million. Average remaining maturity of
senior debt was 5.1 years and EUR 1,600 million of it had
a maturity longer than 5 years. Senior debt is used to fund
other financial assets as well. The average maturity of
subordinated loans and fixed income instruments of EUR
405 million was 1.8 years. Funding structure of strategic
holdings and other holdings can be considered strong.
The capacity to generate funds is dependent on leverage
and liquidity buffers which can be inferred from the table
Balance Sheet Structure, Sampo plc, 31 December 2019
and 31 December 2018.
Balance Sheet StructureSampo plc, 31 December 2019 and 31 December 2018
EURm 31 Dec 2019 31 Dec 2018Assets total 11,625 12,073
Liquidity 1,320 1,447
Investment assets 1,022 770
Real estate 2 2
Fixed income 46 23
Equity & private equity 973 745
Subordinated loans 359 489
Equity holdings 8,841 9,200
Subsidiaries 3,401 3,401
Associated 5,440 5,799
Other assets 84 167
EURm 31 Dec 2019 31 Dec 2018Liabilities total 11,625 12,073
CPs issued 0 124
Long-term senior debt 3,414 3,943
Private placements 98 122
Bonds issued 3,316 3,821
Subordinated debt 494 0
Capital 7,596 7,890
Undistributable capital 98 98
Distributable capital 7,497 7,792
Other liabilities 121 115
SAMPO GROUP’S RISKSAND CORE RISK
MANAGEMENT ACTIVITIES
IF GROUP
SAMPO GROUP’SSTRUCTURE ANDBUSINESS MODEL
TOPDANMARKGROUP
SAMPO GROUPCAPITALIZATION APPENDICESMANDATUM LIFE
GROUP
RISK CONSIDERATIONSAT SAMPO GROUP LEVEL
AND SAMPO PLC
RISK MANAGEMENT REPORT 2019 85

The leverage of Sampo plc was modest at year end
according to for example these measures:
• The financial leverage measured as the portion of debt
within all liabilities was 34 (34) per cent.
• Sampo’s net debt of EUR 2,183 (2,108) million is modest
when compared to Sampo’s equity holdings and
financial assets.
In regard to liquidity, the liquid funds of Sampo plc were
EUR 1,320 (1,447) million. Liquidity is mainly affected by
received and paid dividends as well as changes in issued
debt instruments and changes in investments. Sampo’s
dividend payment takes place in April and it will signifi-
cantly lower the liquidity position of Sampo. A significant
portion of subordinated loans issued by the Group
companies (359) and a part of other investment assets
(1,022) can be sold in case liquidity is needed. Short-term
liquidity can be considered to be adequate.
All in all, Sampo plc is in a good position to refinance
its current debt and even issue more debt. This capacity
together with the tradable financial assets, means that
Sampo plc is able to generate liquid funds.
Currently Sampo Group has a capital buffer in excess of
the Solvency Capital Requirement. The subordinated
loans presented in the table Balance Sheet Structure,
Sampo plc, 31 December 2019 and 31 December 2018 are
all issued by If, Mandatum Life, Nordea and Topdanmark.
Apart from Nordea, they are eliminated from Group’s own
funds. In case these assets would be sold, in addition to
liquidity in Sampo plc, also own funds and Sampo Group
solvency ratio would increase.
Sampo plc balances risks within Sampo Group. When
Sampo plc is managing its funding, capital structure and
liquidity it takes into account that some of its operative
companies have other base currencies (the Swedish krona,
the Danish krone) than the euro, and that all its operative
business areas are exposed to low interest rates. These
risks may affect Sampo’s decisions on the issuance of
debt instruments and the composition of the liquidity
portfolio.
This is why part of Sampo plc’s debt instruments are
issued in the Swedish krona and interest rate duration
is maintained relatively short. However, management’s
market views are also affecting these decisions and for
instance at the moment the Swedish krona denominated
dividends paid by If are still in the Swedish krona,
and the Swedish krona debt is converted into the euro
using cross-currency swaps, due to tactical market view
reasons.
SAMPO GROUP’S RISKSAND CORE RISK
MANAGEMENT ACTIVITIES
IF GROUP
SAMPO GROUP’SSTRUCTURE ANDBUSINESS MODEL
TOPDANMARKGROUP
SAMPO GROUPCAPITALIZATION APPENDICESMANDATUM LIFE
GROUP
RISK CONSIDERATIONSAT SAMPO GROUP LEVEL
AND SAMPO PLC
RISK MANAGEMENT REPORT 2019 86

SAMPO GROUP CAPITALIZATION
88Sampo Group Capitalization
88Group’s Own Funds
and Solvency According to Solvency II
SAMPO GROUP’S RISKSAND CORE RISK
MANAGEMENT ACTIVITIES
IF GROUP
SAMPO GROUP’SSTRUCTURE ANDBUSINESS MODEL
TOPDANMARKGROUP APPENDICESMANDATUM LIFE
GROUP
RISK CONSIDERATIONSAT SAMPO GROUP LEVEL
AND SAMPO PLC
SAMPO GROUPCAPITALIZATION
RISK MANAGEMENT REPORT 2019 87

Sampo Group Capitalization
The principles of Sampo Group capitalization and
the calculation methods are described in detail in
Appendix 4 Profitability, Risks and Capital.
Group’s Own Funds and Solvency According to Solvency II
Sampo Group’s own funds and SCR are presented in
the graph Solvency by Solvency II Rules, Sampo Group,
31 December 2019. Sampo Group’s Ratio of Eligible own
funds to Group SCR at the end of 2019 was 167 per cent
(140). Sampo Group has been continuously compliant
with the regulatory capital requirement during 2019.
Until 21 October 2019, Sampo Group also calculated
the Group FICO solvency according to the Act on the
Supervision of Financial and Insurance Conglomerates
(2004/699). In connection with the extra dividend which
Sampo plc distributed in the form of Nordea shares in
August 2019, Sampo plc filed an application with the FIN-
FSA for the termination of the Financial and Insurance
Conglomerate rules. The application was approved on
21 October 2019. The conglomerate solvency ratio was
reported for the last time on 30 September 2019 and
going forward Sampo Group’s solvency will be calculated
only by the Solvency II rules. The treatment of Nordea
was changed in the Solvency II, and as of 30 September
2019, Nordea is treated as an equity investment in Sampo
Group’s solvency.
The Group SCR decreased by EUR 1,282 million mainly
due to the changed treatment of Nordea in the Solvency
II. This means that Nordea is now treated as an equity
investment in the SCR calculation, resulting in a lower
Group SCR. Sampo’s share of NDX Intressenter and the
capital requirements of other related undertakings that
are not consolidated were included in the Group SCR
as well. In Solvency II Sampo Group has not applied for
approval to use the PIM SCRs of If and Topdanmark,
and therefore the standard formula SCRs are applied in
Solvency II.
Graph 23
Solvency by Solvency II RulesSampo Group, 31 December 2019
EURm
12,000
10,000
8,000
6,000
4,000
2,000
0
Solvency ratio 167%
Market risk
Insurance risk
Counter-party risk
Diversifi- cation
Operational risk
LAC of TP*
LAC of DT**
NDX & other
Total SCR
Own Funds
* Loss absorbing capacity of technical provisions** Loss absorbing capacity of deferred taxes
-989
1,707
5,877
-647 100
6,131
10,210
216253 -385
SAMPO GROUP’S RISKSAND CORE RISK
MANAGEMENT ACTIVITIES
IF GROUP
SAMPO GROUP’SSTRUCTURE ANDBUSINESS MODEL
TOPDANMARKGROUP APPENDICESMANDATUM LIFE
GROUP
RISK CONSIDERATIONSAT SAMPO GROUP LEVEL
AND SAMPO PLC
SAMPO GROUPCAPITALIZATION
RISK MANAGEMENT REPORT 2019 88

Eligible Own FundsSampo Group, 31 December 2019 and 31 December 2018
EURm 2019 2018Tier 1 total 9,075 10,010
Ordinary share capital 98 98
Reconciliation reserve 8,975 10,273
Net effect of other financial sectors -130 -495
Tier 1 - restricted 132 133
Tier 2 (Subordinated liabilities) 1,135 333
Tier 3 (Deferred tax assets) 0 13
Eligible own funds 10,210 10,355
Composition of the Reconciliation ReserveSampo Group, 31 December 2019 and 31 December 2018
EURm 2019 2018Reserves, retained earnings and net income for the year (before SII adjustments) 12,444 12,916
Foreseeable dividends, distributions and charges -1,222 -1,583
Own shares (held directly and indirectly) -129 -145
Other non-available own funds -281 -301
Net deferred tax assets shown separately in Tier 3 0 -13
Valuation adjustments according to Solvency II -1,838 -601
Reconciliation reserve 8,975 10,273
The table Eligible Own Funds, Sampo Group, 31 December
2019 and 31 December 2018 presents Sampo Group’s own
funds by tiers.
The Group’s own funds consists of ordinary share capital,
reconciliation reserve as well as subordinated liabilities,
which are eligible at the Group level. As at 31 December
2019 the Group’s own funds were EUR 10,210 million
(10,355).
The entire ordinary share capital of EUR 98 million
and reconciliation reserve of EUR 8,975 million (10,273)
fully meet with the requirements for inclusion in Tier 1
unrestricted items. In comparison, IFRS Consolidated
Group equity as at 31 December 2019 was EUR 12,542
million (13,014) (see Appendix 5 Valuation for Solvency
II purposes). All in all, the structure of own funds is
solid because Tier 1 items make up almost 90 per cent of
all own funds and the reconciliation reserve is a major
contributor. After the change in the treatment of Nordea
in the Group’s own funds, Nordea is included in the own
funds as an equity investment at fair value. However, in
accordance with the IFRS, Nordea is still booked as an
associated company in Sampo Group's accounts and thus
the treatments under IFRS and Solvency II differ in this
respect.
The reconciliation reserve is a sum of retained earnings,
net income for the financial year and other reserves
deducted by proposed dividends and other distributions
and adjusted by Solvency II valuation differences,
net deferred tax assets, own shares held directly and
Topdanmark’s minority interest. The composition
of the reconciliation reserve is presented in the table
Composition of the Reconciliation Reserve, Sampo Group,
31 December 2019 and 31 December 2018.
In the table Eligible Own Funds, Sampo Group,
31 December 2019 and 31 December 2018 the own funds
items included in Sampo Group’s Tier 1 restricted and Tier
2 capital, amounting to EUR 132 million and EUR 1,135
million respectively as at 31 December 2019, consists of
subordinated debt instruments held by external investors.
As at 31 December 2019 EUR 100 million of a total of EUR
349 million of the subordinated debt issued by Mandatum
Life was in Sampo’s investment portfolio and about
SAMPO GROUP’S RISKSAND CORE RISK
MANAGEMENT ACTIVITIES
IF GROUP
SAMPO GROUP’SSTRUCTURE ANDBUSINESS MODEL
TOPDANMARKGROUP APPENDICESMANDATUM LIFE
GROUP
RISK CONSIDERATIONSAT SAMPO GROUP LEVEL
AND SAMPO PLC
SAMPO GROUPCAPITALIZATION
RISK MANAGEMENT REPORT 2019 89

a quarter of If’s subordinated debt of EUR 400 million
was held by Sampo plc as well. Topdanmark has issued
three subordinated debt instruments by nominal amount
of DKK 1,750 million in total, and 31 per cent of these are
held in Sampo Group companies’ investment portfolios.
The details of subordinated debt instruments issued by If,
Topdanmark and Mandatum are shown in the companies’
respective tables. Full instrument details are available
in Sampo’s web-pages www.sampo.com/investors/
debt-instruments/if and www.sampo.com/investors/
debt-instruments/topdanmark.
Both Sampo plc and Mandatum Life issued subordinated
debt during 2019. Sampo plc issued a EUR 500 million
Tier 2 subordinated loan in May and Mandatum Life a
EUR 250 million Tier 2 subordinated loan in October.
The Group’s own funds decreased by EUR 145 million
over the reporting period. The biggest change was the
extra dividend in the form of Nordea shares in August,
which decreased the Group’s equity and allowed Sampo
to change Nordea’s treatment in the Group’s own funds.
As a result, own funds decreased in the third quarter. New
Solvency II eligible subordinated loans issued by Sampo
plc and Mandatum Life increased own funds by their full
amount. The proposed dividend of EUR 1,222 million is
deducted from own funds at the year end, but as the total
comprehensive income of the subsidiaries is in line with
the proposed dividend, the impact of it on own funds
compared to the previous year is small. Because of a lower
Group SCR, Ratio of eligible own funds to Group SCR
increased to 167 per cent (140). Because of the regulatory
limitation that the Tier 2 items can only cover up to 20 per
cent of the Minimum Consolidated Group SCR (“MCR”),
there is a restriction affecting the availability and transfer-
ability of Tier 2 own funds at the Group level during the
period when calculating Tier 2 capital and Ratio of eligible
own funds to MCR.
SAMPO GROUP’S RISKSAND CORE RISK
MANAGEMENT ACTIVITIES
IF GROUP
SAMPO GROUP’SSTRUCTURE ANDBUSINESS MODEL
TOPDANMARKGROUP APPENDICESMANDATUM LIFE
GROUP
RISK CONSIDERATIONSAT SAMPO GROUP LEVEL
AND SAMPO PLC
SAMPO GROUPCAPITALIZATION
RISK MANAGEMENT REPORT 2019 90

APPENDICES
115Appendix 3:
Selected Management Principles
103Appendix 2:
Risk Definitions
120Appendix 4:
Profitability, Risks and Capital
126Appendix 5:
Valuation for Solvency Purposes
92Appendix 1:
Sampo Group Steering Framework and Risk Management Process
Principles of Balance Sheet Management (ALM) .....................................115Principles of Investment Portfolio Management and Control of Investment Activities ........116Principles of Operational Risks Management ............119
Capitalization at the Sub-Group Level ................121Capitalization at the Group Level ..........................123
Parent Company’s Guidance ................................. 92Subsidiaries’ Activities and Risk Management ........ 93Parent Company’s Oversight and Activities......................... 96Risk Governance ................... 97
Assets.....................................128Technical Provisions According to Solvency II in Sampo Group .................129Technical Provisions According to Solvency II in If ..........................................131Technical Provisions According to Solvency II in Topdanmark ....................132Technical Provisions According to Solvency II in Mandatum Life ...............133Other Liabilities ..................133
Underwriting Risks ............103Market Risks .........................107Balance Sheet Level Market Risks or ALM Risks .............................109Counterparty Default Risks .......................................111Operational Risks ...............112Business Risks .....................113
SAMPO GROUP’S RISKSAND CORE RISK
MANAGEMENT ACTIVITIES
IF GROUP
SAMPO GROUP’SSTRUCTURE ANDBUSINESS MODEL
TOPDANMARKGROUP
SAMPO GROUPCAPITALIZATION
MANDATUM LIFEGROUP
RISK CONSIDERATIONSAT SAMPO GROUP LEVEL
AND SAMPO PLCAPPENDICES
RISK MANAGEMENT REPORT 2019 91

Appendix 1: Sampo Group Steering Framework and Risk Management Process
Disclosures
Regulators and Supervisors Public and media Rating Agencies D
ebt inv
esto
rs
Sampo Group’s Steering Framework
Associated Companies
Nordea
NDX Intressenter
Sampo plc
Business P
artners Clients Employees Shareholders
If Mandatum Life Topdanmark
General level reporting
Board oversight, targets & principles
Board work & active dialogue
Reporting
Cost efficient and high quality
processes
Balance between risks, capital and profits
Strategic and operational flexibility
Governance structure
Authorizations
Strategies
Policies
Guidelines
Company specific targets
TopdanmarkContinuous analysis of opportunities
Finan
cial & R
isk Managem
ent
Act
ions
Underwriting
Investment
Un
der
wri
tin
g
Investment
Ind
epend
ent Risk M
anagement
Financial &
Risk M
anagement
When Sampo Group is organizing its business and risk
management activities, clear responsibilities and simple
and flat operational structures are the fundamental
principles. The responsibilities and operational structures
followed in Sampo plc and wholly-owned subsidiaries, as
illustrated in the graph Sampo Group’s Steering Framework
are described in the following paragraphs. Topdanmark
has also adopted Sampo’s main Group-wide principles
and policies, including the risk management principles,
although there may be some small differences. Thus, the
steering framework and risk management processes of
Topdanmark may be slightly different than described next.
Parent Company’s Guidance
The Group’s parent company steers the wholly-owned
subsidiaries by setting targets and by defining the main
preconditions for the subsidiaries’ operations in the form
of the Group-wide principles.
Target Setting: The Board of Directors of Sampo
plc decides on the subsidiaries’ return on equity
SAMPO GROUP’S RISKSAND CORE RISK
MANAGEMENT ACTIVITIES
IF GROUP
SAMPO GROUP’SSTRUCTURE ANDBUSINESS MODEL
TOPDANMARKGROUP
SAMPO GROUPCAPITALIZATION
MANDATUM LIFEGROUP
RISK CONSIDERATIONSAT SAMPO GROUP LEVEL
AND SAMPO PLCAPPENDICES
RISK MANAGEMENT REPORT 2019 92
targets which are currently 17.5 per cent for both If and
Mandatum Life. In addition, If has a long-term target of
maintaining the combined ratio below 95 per cent.
The parent company assesses the adequate level of cap-
italization and the suitability of the capital structure as
described in the section Capitalization at the Sub-Group
Level in Appendix 4 Profitability, Risks and Capital.
Based on this analysis, the parent company estimates the
amount of dividends distributed by the subsidiaries to
the parent company. In Sampo Group, the excess capital
from an operational point of view is held by the parent
company which capitalizes the subsidiaries if needed.
The Board of Directors of Sampo plc decides on the main
guidelines governing the subsidiaries’ business activities
and risk management. The most significant of these
guidelines are the Code of Conduct, Risk Management
Principles, Remuneration Principles and Compliance
Principles. There are also further guidelines which are
followed to prevent reputational and compliance risks, for
example the Disclosure Policy.
Moreover, Sampo plc’s Board of Directors’ decisions and
thereby also the guidance given to subsidiaries may be
impacted by the external regulatory environment and
expectations of different stakeholders on Sampo Group’s
operations. Further information on Sampo Group’s
relations with its stakeholders is available within the
Code of Conduct at www.sampo.com/codeofconduct.
Subsidiaries’ Activities and Risk Management
Subsidiaries organize their activities independently,
considering the specific characteristics of their business
operations and the guidance from the parent company
relating to targets and Group-wide principles. The
stakeholders’ expectations and external regulations also
have a direct effect on the subsidiaries’ activities.
Sampo Group’s subsidiaries decide independently on the
governance structure of their operations. The executive
management of the subsidiaries have extensive experi-
ence in the insurance industry as well as in financial and
risk management. The members of different committees
and governing bodies represent expertise related to
business and other functions. The subsidiaries’ opera-
tions are monitored by the different governing bodies and
ultimately by the Boards of Directors whose members are
mainly in senior management positions in Sampo or in
Sampo Group companies.
Since only the main guidelines are prepared by the parent
company, the subsidiaries’ management have the power
and responsibility to incorporate the specific character-
istics of their own operations into the company specific
policies, limits, authorizations and guidelines.
The subsidiaries focus on the effective execution of
insurance operations and financial and risk management
activities at the operational level. Investments are
managed according to the Investment Policies which
are approved by the Boards of Directors of the respective
subsidiaries. The parent company leads day-to-day
management of investments, facilitates simultaneous
effective execution of the subsidiaries’ investment
policies, and maintains Group-wide oversight of the
investment portfolios. Topdanmark, however, manages
its investments independently.
The risk management process consists of continuous
activities that are partly the responsibility of the
personnel involved in business activities and partly
the responsibility of independent risk management
specialists. Although the responsibilities of business
lines and independent risk management are clearly
segregated in Sampo Group, these functions are in
continuous dialogue with each other. Sampo Group has
defined the roles and responsibilities of different internal
stakeholders in the Internal Control Policy.
Parties independent of business activities are responsible
for the risk management governance framework, risk
policies, risk limits and authorizations which form
the structure that sets the limits for business and
investment units’ risk taking as well as principles for risk
monitoring. These structures are one prerequisite for the
risk management process; they reflect capital adequacy
targets and the risk appetite in general.
SAMPO GROUP’S RISKSAND CORE RISK
MANAGEMENT ACTIVITIES
IF GROUP
SAMPO GROUP’SSTRUCTURE ANDBUSINESS MODEL
TOPDANMARKGROUP
SAMPO GROUPCAPITALIZATION
MANDATUM LIFEGROUP
RISK CONSIDERATIONSAT SAMPO GROUP LEVEL
AND SAMPO PLCAPPENDICES
RISK MANAGEMENT REPORT 2019 93

Company Level Financial and Risk Management Process
Cost efficient and high quality
processes
Balance between risks, capital
and profits
Strategic and operational flexibility
Governance structure
Authorizations
Strategies
Policies
Guidelines
Company specific targets
TopdanmarkContinuous analysis of opportunities
Financial &
Risk M
anagem
ent
Act
ions
Underwriting
Investment
Un
der
wri
tin
g
Investment
Indep
endent R
isk Managem
ent
Financial &
Risk M
anagement
SAMPO GROUP’S RISKSAND CORE RISK
MANAGEMENT ACTIVITIES
IF GROUP
SAMPO GROUP’SSTRUCTURE ANDBUSINESS MODEL
TOPDANMARKGROUP
SAMPO GROUPCAPITALIZATION
MANDATUM LIFEGROUP
RISK CONSIDERATIONSAT SAMPO GROUP LEVEL
AND SAMPO PLCAPPENDICES
RISK MANAGEMENT REPORT 2019 94

The graph Company Level Financial and Risk
Management Process illustrates the prerequisites, the
tasks together with the responsible functions and the
targets of company level risk management.
The central prerequisites for facilitating successful risk
management include the following:
• Risk management governance structure and
authorizations (see Risk Governance section and clear
division of responsibilities between business lines and
independent functions
• Companies’ own risk policies and more detailed
instructions related to risk management
• Prudent valuation, risk measurement and reporting
procedures.
The tasks included in the risk management process can be
classified as follows:
Independent Risk Management
Financial and risk management functions are explicitly
responsible for preparing the above prerequisites for
risk management. Operationally they are responsible
for independent measurement and control, including
the monitoring of operations in general as well as
profitability, risk and capitalization calculations.
The following items are examples of these responsibilities:
• Detailed reporting on risks to the subsidiaries’ and
Sampo’s Risk Committees and the Boards of Directors
• Internal reporting on Capital need and actual available
Capital at least on a quarterly basis
• Internal reporting on regulatory and rating agency
capital charges and capital positions on a quarterly
basis
• Disclosure of internal and regulatory capitalization
figures quarterly.
Continuous Analysis of Opportunities and Risks
Both the business lines and the financial and risk manage-
ment functions are active in supporting the business with
continuous analysis and assessment of opportunities. The
insurance and investment business units assess business
opportunities, especially their risk return ratios, on a daily
basis. In the financial and risk management functions, on
the other hand, a considerable amount of time is spent
on risk analysis and reporting as well as capital planning.
This assessment of opportunities generates, for example,
the following outputs:
• Identification of business opportunities (e.g.
product and service development and investment
opportunities) and analysis of respective earnings
potential and capital consumption
• Intra-group and external dividend plans
• Hybrid and senior debt issuance initiatives.
Actions
Actions, i.e. transactions representing the actual
insurance and investment operations, are performed in
accordance with the given authorizations, risk policies
and other instructions. These actions are the responsi-
bility of business, and centralized functions such as the
investment unit. Activities related to capitalization and
liquidity positions are included in this part of the process.
In Sampo Group, proactive actions to manage profita-
bility, risks and capital are seen as the most important
phase in the risk and capital management process. Hence,
risk policies, limits and decision-making authorizations,
together with profitability targets, are set up in a way that
they facilitate business, and investment units to take
carefully considered risks. Examples of the actions are as
follows:
• Pricing of insurance policies and execution of
investment asset transactions
• Dividend payments, share buy-backs, hybrid issuances
and senior debt issuances
• Derivative and reinsurance transactions
• Business acquisitions and divestments.
SAMPO GROUP’S RISKSAND CORE RISK
MANAGEMENT ACTIVITIES
IF GROUP
SAMPO GROUP’SSTRUCTURE ANDBUSINESS MODEL
TOPDANMARKGROUP
SAMPO GROUPCAPITALIZATION
MANDATUM LIFEGROUP
RISK CONSIDERATIONSAT SAMPO GROUP LEVEL
AND SAMPO PLCAPPENDICES
RISK MANAGEMENT REPORT 2019 95

High quality execution of the above tasks contributes to
the achievement of the three central targets of the risk
management process:
Balance Between Risks, Capital and Earnings
• The risks affecting profitability as well as other material
risks are identified, assessed and analyzed.
• Capitalization is adequate in terms of risks inherent in
business activities and strategic risks, considering the
expected profitability of the businesses.
• Risk bearing capacity is allocated to different business
areas in accordance with the strategy.
• Underwriting risks are priced to reflect their inherent
risk levels, expected returns from investment activities
are in balance with their risks, and consequential risks
are mitigated sufficiently.
Cost Efficient and High-Quality Processes
• Client service processes and internal operative
processes are cost efficient and of high quality.
• Decision making is based on accurate, adequate and
timely information.
• Continuity of operations is ensured and in the case of a
discontinuity event, recovery is fast and comprehensive.
Strategic and Operational Flexibility
• External risk drivers and potential business risks are
identified, and the company is in a good position in
terms of capital structure and management skills to
react to changes in the business environment.
• Corporate structure, knowledge and processes in
the companies facilitate effective implementation of
changes.
When the above targets are met, risk management con-
tributes positively to return on equity and mitigates the
yearly fluctuations in profitability. The risk management
process is therefore considered to be one of the contribu-
tors in creating value for the shareholders of Sampo.
Parent Company’s Oversight and Activities
Sampo reviews the Group as a business portfolio and is
active especially in matters related to the Group’s capitali-
zation and risks as well as related to the parent company’s
capital structure and liquidity.
Sampo reviews quarterly the performance of Sampo
Group both on a company level and on the Group level
based on the reporting provided by the subsidiaries
and the associated companies. The information on the
associated companies is, however, based on publicly
available material and is therefore less detailed. Reporting
on the subsidiaries’ performance to the Board of Directors
and Audit Committee (“AC”) of Sampo is based mainly
on the reporting produced by the subsidiaries. The
reporting concentrates on the balance between risks,
capitalization and profitability. The parent company is
responsible for reporting on its own activities. Reporting
from the wholly-owned subsidiaries is more detailed than
reporting from Topdanmark.
At the Group level, the central focus areas are potential
concentrations arising from the Group companies’
operations as well as the Group’s capitalization and the
parent company’s ability to generate liquidity. The parent
company is also projecting and analyzing the Group
companies’ profitability, risks and capitalization with
uniform scenarios to have company specific forecasts that
are additive at the Group level.
Based on the aforementioned sub-group level and
Sampo Group level internal work Sampo Group prepares
annually or more often if needed a Single Own Risk and
Solvency Assessment document (“Single ORSA report”).
The Single ORSA report has virtually the same structure
and contents as quarterly Audit Committee reporting. The
only substance difference is the addition of Group-wide
solvency forecasts, which are not normally part of the
quarterly reporting.
Based on both the company and the Group level infor-
mation, the Board of Directors of Sampo decides on the
Group’s capitalization as well as sets the guidelines on the
parent company’s capital structure and liquidity reserve.
The underlying objective for Sampo is to maintain a
prudent capital structure and adequate liquidity in order
to finance strategic projects if needed. Strong liquidity
and the ability to get financing are essential factors in
maintaining Sampo Group’s strategic flexibility.
SAMPO GROUP’S RISKSAND CORE RISK
MANAGEMENT ACTIVITIES
IF GROUP
SAMPO GROUP’SSTRUCTURE ANDBUSINESS MODEL
TOPDANMARKGROUP
SAMPO GROUPCAPITALIZATION
MANDATUM LIFEGROUP
RISK CONSIDERATIONSAT SAMPO GROUP LEVEL
AND SAMPO PLCAPPENDICES
RISK MANAGEMENT REPORT 2019 96

Risk Governance
This section describes the governance framework of
Sampo Group and its subsidiaries from a risk manage-
ment perspective. A more detailed description of Sampo
Group’s corporate governance and internal control system
is included in the Corporate Governance Statement
available at www.sampo.com/year2019.
Risk Governance at the Group Level
The Board of Directors of Sampo is responsible for
ensuring that the Group’s risks are properly managed
and controlled. The Board of Directors of Sampo defines
financial targets for the subsidiaries and approves the
Group level principles which steer the subsidiaries’
activities. The risk exposures and capitalization reports of
the subsidiaries are consolidated at the Group level on a
quarterly basis and reported to the Board and to the Audit
Committee of Sampo.
The reporting lines of different governing bodies at the
Group level are described in the graph Risk Governance in
Sampo Group.
The Audit Committee is responsible, on behalf of the
Board of Directors, for the preparation of Sampo Group’s
risk management principles and other related guidelines.
The AC shall ensure that the operations are in compliance
with these guidelines, control Sampo Group’s risks and
risk concentrations as well as control the quality and
scope of risk management in the Group companies. The
committee shall also monitor the implementation of risk
policies, capitalization and the development of risks and
profit. At least three members of the AC must be elected
from members of the Board who do not hold management
positions in Sampo Group and are independent of the
company. The AC meets on a quarterly basis.
The Group Chief Risk Officer (“CRO”) is responsible for
assuring the appropriateness of risk management at
the Group level. The CRO’s responsibility is to monitor
Risk Governance in Sampo Group
Board of Directors Sampo plc
ORSA Committee Risk Management Committee Topdanmark
Risk Management Committee Mandatum Life
Group CRO
Audit CommitteeSampo plc
Board of Directors Topdanmark
Boards of Directors If
Board of Directors Mandatum Life
SAMPO GROUP’S RISKSAND CORE RISK
MANAGEMENT ACTIVITIES
IF GROUP
SAMPO GROUP’SSTRUCTURE ANDBUSINESS MODEL
TOPDANMARKGROUP
SAMPO GROUPCAPITALIZATION
MANDATUM LIFEGROUP
RISK CONSIDERATIONSAT SAMPO GROUP LEVEL
AND SAMPO PLCAPPENDICES
RISK MANAGEMENT REPORT 2019 97
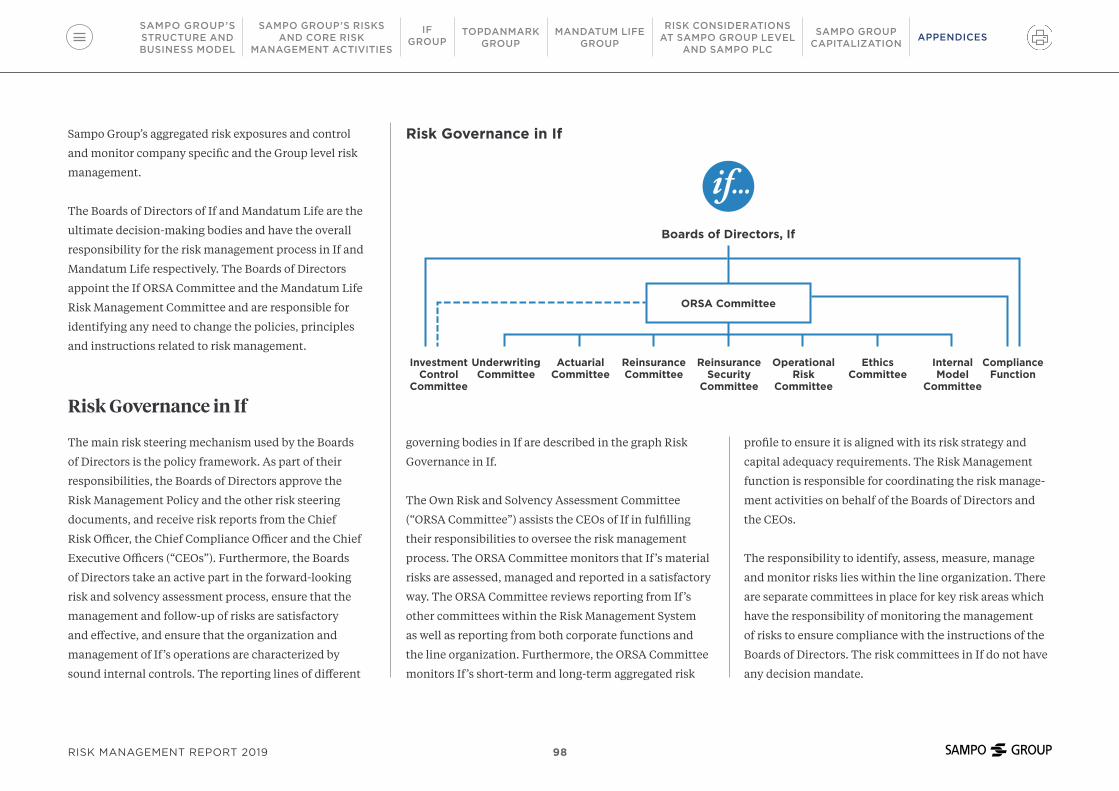
Sampo Group’s aggregated risk exposures and control
and monitor company specific and the Group level risk
management.
The Boards of Directors of If and Mandatum Life are the
ultimate decision-making bodies and have the overall
responsibility for the risk management process in If and
Mandatum Life respectively. The Boards of Directors
appoint the If ORSA Committee and the Mandatum Life
Risk Management Committee and are responsible for
identifying any need to change the policies, principles
and instructions related to risk management.
Risk Governance in If
The main risk steering mechanism used by the Boards
of Directors is the policy framework. As part of their
responsibilities, the Boards of Directors approve the
Risk Management Policy and the other risk steering
documents, and receive risk reports from the Chief
Risk Officer, the Chief Compliance Officer and the Chief
Executive Officers (“CEOs”). Furthermore, the Boards
of Directors take an active part in the forward-looking
risk and solvency assessment process, ensure that the
management and follow-up of risks are satisfactory
and effective, and ensure that the organization and
management of If’s operations are characterized by
sound internal controls. The reporting lines of different
governing bodies in If are described in the graph Risk
Governance in If.
The Own Risk and Solvency Assessment Committee
(“ORSA Committee”) assists the CEOs of If in fulfilling
their responsibilities to oversee the risk management
process. The ORSA Committee monitors that If’s material
risks are assessed, managed and reported in a satisfactory
way. The ORSA Committee reviews reporting from If’s
other committees within the Risk Management System
as well as reporting from both corporate functions and
the line organization. Furthermore, the ORSA Committee
monitors If’s short-term and long-term aggregated risk
profile to ensure it is aligned with its risk strategy and
capital adequacy requirements. The Risk Management
function is responsible for coordinating the risk manage-
ment activities on behalf of the Boards of Directors and
the CEOs.
The responsibility to identify, assess, measure, manage
and monitor risks lies within the line organization. There
are separate committees in place for key risk areas which
have the responsibility of monitoring the management
of risks to ensure compliance with the instructions of the
Boards of Directors. The risk committees in If do not have
any decision mandate.
Risk Governance in If
Boards of Directors, If
ORSA Committee
InvestmentControl
Committee
ReinsuranceSecurity
Committee
ActuarialCommittee
Ethics Committee
Underwriting Committee
OperationalRisk
Committee
ReinsuranceCommittee
InternalModel
Committee
Compliance Function
SAMPO GROUP’S RISKSAND CORE RISK
MANAGEMENT ACTIVITIES
IF GROUP
SAMPO GROUP’SSTRUCTURE ANDBUSINESS MODEL
TOPDANMARKGROUP
SAMPO GROUPCAPITALIZATION
MANDATUM LIFEGROUP
RISK CONSIDERATIONSAT SAMPO GROUP LEVEL
AND SAMPO PLCAPPENDICES
RISK MANAGEMENT REPORT 2019 98

There are policies in place for each risk area which specify
restrictions and limits chosen to reflect and ensure
that the risk level is in compliance with the overall risk
appetite and capital adequacy constraints of If. The
committees also monitor the effectiveness of policies and
give input to changes and updates, if needed.
In addition to the risk specific committees, there are
two other committees included in the Risk Governance
structure. Their responsibilities are described as follows:
• The Ethics Committee coordinates and discusses
ethical issues in If. The committee gives
recommendations on ethical issues and proposes
changes to the Ethics Policy. The Chairman is
responsible for the reporting of identified risks related
to ethics issues brought to the committee.
• The Internal Model Committee’s tasks are to identify
sources for potential model changes and to give its
opinion to the Chairman on the assessment and classifi-
cation of potential changes, further validation activities
or internal model developments. The Committee
discusses and prioritizes actions to be taken based on
the validation findings and gives input to subsequent
validation. In addition, the Committee monitors the use
of the internal model and development activities.
The Compliance Function forms part of the system of
governance. The Compliance Function reports identified
compliance risks to ORSA Committee and to the Boards of
Directors on a quarterly basis.
SAMPO GROUP’S RISKSAND CORE RISK
MANAGEMENT ACTIVITIES
IF GROUP
SAMPO GROUP’SSTRUCTURE ANDBUSINESS MODEL
TOPDANMARKGROUP
SAMPO GROUPCAPITALIZATION
MANDATUM LIFEGROUP
RISK CONSIDERATIONSAT SAMPO GROUP LEVEL
AND SAMPO PLCAPPENDICES
RISK MANAGEMENT REPORT 2019 99

Risk Governance in Topdanmark
Topdanmark's policy is to hedge against risks arising
from the Company's activities or to limit such risks to
a level that allows the Company to maintain normal
operations and implement its planned measures even in
the case of highly unfavourable events in the operating
environment. Because of this policy, for several years, the
Company has identified and reduced or eliminated the
risks which could potentially cause losses exceeding what
Topdanmark considers to be acceptable.
The Board of Directors determines the overall risk
policies and limits. The internal auditors report to the
Board of Directors and report on, among other things, the
observance of these risk policies and limits.
The responsibility to identify, evaluate, control
and manage risks lies within the line organization.
Topdanmark's Central Risk Management Function
consolidates the risk picture, manages the ORSA and
produces Solvency Capital Requirement and capital
plans. It reports to the Risk Management Committee,
which is responsible for risk policies, risk limits, solvency
calculation, capital plans, Topdanmark's ORSA, and
Topdanmark's partial, internal model for non-life
insurance risks. The members of the Risk Management
Committee are the CFO of the Group, the head of the
Compliance Function and the heads of the primary risk
areas, which are: Asset Management, Statistical Services,
Reinsurance, Finance and Life Actuarial Services.
The Risk Management Committee reports and recom-
mends to the Board of Directors via the Executive Board.
The Risk Management Committee has set up the
Internal Model Committee, which is responsible for
developing and operating Topdanmark's internal model
for calculation of results probabilities and risks of the
non-life insurance portfolio based on random simulation.
The model is used for, among other things, optimising
the reinsurance programme, calculation of cost of capital,
forecast testing and calculating capital requirements.
SAMPO GROUP’S RISKSAND CORE RISK
MANAGEMENT ACTIVITIES
IF GROUP
SAMPO GROUP’SSTRUCTURE ANDBUSINESS MODEL
TOPDANMARKGROUP
SAMPO GROUPCAPITALIZATION
MANDATUM LIFEGROUP
RISK CONSIDERATIONSAT SAMPO GROUP LEVEL
AND SAMPO PLCAPPENDICES
RISK MANAGEMENT REPORT 2019 100

Risk Governance in Topdanmark
Board of Directors, Topdanmark
Audit Committee Topdanmark
Executive Board Topdanmark Forsikring
Risk Management Committee
Asset Management Committee
Board of Directors Topdanmark Livsforsikring
Executive Board Topdanmark LivsforsikringCompliance
Board of Directors Topdanmark
Kapitalforvaltning (Asset Management)
Reinsurance Topdanmark Kapitalforvaltning
(Asset Management)
Central Risk Management
Function/ External Finance
Actuarial Non-Life
FinanceAccounting Actuarial Life
Reports to the Asset Management Committee
Internal Model Committee
Board of Directors/Executive Boards The Risk Management Function
The reporting lines of the main governing bodies in
Topdanmark are described in the graph Risk Governance
in Topdanmark.
The risk management function implements an annual
ORSA process identifying risks in the business, quanti-
fying these risks and collecting them in a risk register.
Additionally, the principles of solvency calculation are
reviewed, and the risk management process is updated.
An ORSA report has been prepared, which, together
with the risk register and risk management process, was
reviewed at a Board seminar in the autumn of 2019.
The risk management function in Topdanmark is a
virtual organization. The Central Risk Management
Function collects information about specific risks from
the decentral risk management units, who are responsible
for reporting the SCR for their respective areas (“Actuarial
Non-Life”, “Actuarial Life”, “Asset Management”,
“Finance”, “Accounting” and “Reinsurance”). Based
on this, the total SCR is calculated in the Central Risk
Management Function.
Likewise, three “Economy Partners” organizationally
located in Finance act as risk ambassadors for the
divisions Private, Commercial and Life. One of their tasks,
the divisions themselves still having the main respon-
sibility, is to report to the Central Risk Management all
substantially changed risk conditions for the divisions.
SAMPO GROUP’S RISKSAND CORE RISK
MANAGEMENT ACTIVITIES
IF GROUP
SAMPO GROUP’SSTRUCTURE ANDBUSINESS MODEL
TOPDANMARKGROUP
SAMPO GROUPCAPITALIZATION
MANDATUM LIFEGROUP
RISK CONSIDERATIONSAT SAMPO GROUP LEVEL
AND SAMPO PLCAPPENDICES
RISK MANAGEMENT REPORT 2019 101

Risk Governance in Mandatum Life
In Mandatum Life, the Board of Directors is responsible
for risk management and the adequacy of internal
control. The Board of Directors annually approves the
Risk Management Policy, Investment Policy, Capital
Management Policy and other risk management and
internal control instructions.
The CEO of Mandatum Life has the overall responsibility
for risk management according to the Board of Directors’
instructions. The CEO is the Chairman of the Risk
Management Committee which coordinates and monitors
all risks in Mandatum Life. The key role of the Asset and
Liability Committee (“ALCO”) is to monitor and control
the market risks arising from the with profit business.
The reporting lines of the main governing bodies in
Mandatum Life are described in the graph Risk Govern-
ance in Mandatum Life.
In addition to the specific committees, the duties
related to compliance and risk management of the other
operations have been organized as follows:
• Compliance Function takes care of compliance matters
and the Head of the Unit is a member of the Risk
Management Committee.
• Subsidiaries operating in the investment service and
mutual fund business have their own risk management
procedures. All major incidents are also reported to
Mandatum Life’s Operational Risk Committee.
Internal Audit, through its audit recommendations, has a
role to ensure that adequate internal controls are in place
and provides Internal Audit’s annual review to the Board
of Directors.
Risk Governance in Mandatum Life
Risk Management Committee
Compliance Function
Insurance Risk Committee
Operational Risk Committee
Risk Management in Subsidiaries
Asset and Liability Committee
Board
SAMPO GROUP’S RISKSAND CORE RISK
MANAGEMENT ACTIVITIES
IF GROUP
SAMPO GROUP’SSTRUCTURE ANDBUSINESS MODEL
TOPDANMARKGROUP
SAMPO GROUPCAPITALIZATION
MANDATUM LIFEGROUP
RISK CONSIDERATIONSAT SAMPO GROUP LEVEL
AND SAMPO PLCAPPENDICES
RISK MANAGEMENT REPORT 2019 102
Appendix 2: Risk Definitions
Underwriting Risks
In general, the book value of insurance liabilities (techni-
cal provisions) and economic value of insurance liabilities
are dependent on the size and timing of future claims
payments including expenses and the interest rates used
to discount these claims payments to the current date.
The first component is a source of underwriting risk and
the second component affects the interest rate risk to the
balance sheet.
Underwriting risk can be generally defined as a change
in the value of insurance liabilities caused by variance
between the final costs for full contractual obligations and
the assumed costs when these obligations were estimated.
Hence, underwriting risk is realized as unexpected
liability cash flows or unexpected change in the value of
insurance liabilities when the pricing and provisioning
assumptions on claims payments differ to the actual
payments.
Technical provisions and the economic value of insurance
liabilities always include a degree of uncertainty as
they are based on estimates of the size, timing and the
frequency of future claim payments. The uncertainty
is normally greater for new portfolios for which
comprehensive run off statistics are not yet available,
and for portfolios which include claims that take a long
time to settle. Workers’ compensation, Motor other
and Motor third party liability, personal Accident and
Liability insurance are examples of non-life products with
the latter characteristics. In principle, most of the Life
products have the latter characteristics embedded within
them also. Life insurance policies are also exposed to
the behavior of policyholders because policyholders can
change their premium payment intensity or cancel the
existing policy.
SAMPO GROUP’S RISKSAND CORE RISK
MANAGEMENT ACTIVITIES
IF GROUP
SAMPO GROUP’SSTRUCTURE ANDBUSINESS MODEL
TOPDANMARKGROUP
SAMPO GROUPCAPITALIZATION
MANDATUM LIFEGROUP
RISK CONSIDERATIONSAT SAMPO GROUP LEVEL
AND SAMPO PLCAPPENDICES
RISK MANAGEMENT REPORT 2019 103

Non-life Insurance Underwriting Risks
Non-life insurance underwriting risks are often divided
into premium and catastrophe risks and reserve risk
to separate the risks related to future claims of current
insurance contracts from already incurred claims as
illustrated in the graph Non-Life Insurance Underwriting
Risks.
Premium Risk and Catastrophe Risk
Premium risk relates to future claims resulting from
expected insured events which have not occurred by the
balance sheet date. The frequency, severity and timing of
insured events and hence future claims may differ from
those expected. As a result, the claims cost for future
claims exceeds the expected level and there is a loss or
adverse changes in the value of the insurance liabilities.
Catastrophe risk can be seen as an extreme case of
premium risk. It is the risk of extreme or exceptional
events, such as natural catastrophes where the pricing
and setting of provisioning assumptions include
significant uncertainty. These events may lead to
significant deviations between the actual claims and
the total expected claims resulting into a loss or adverse
changes in the value of insurance liabilities.
Changes in economic value of liabilities and technical provisions
Premium and catastrophe risksChanges in expected liability cash flows
resulting from:• Size and/or frequency of future claims related to
unexpired contracts being greater than expected• Timing of future claims payments related to
unexpired contracts differs from expected
Reserve riskChanges in expected liability cash flows
resulting from:• Size of claims payments related to already incurred
claims being greater than expected• Timing of claims payments differs from expected
Changes in the timing, frequency or severity of fires, motor accidents, windstorms, floods, thefts and other
insured eventsChanges in longevity, inflation components,
latent factors and precedents etc.
External driversTechnical and medical innovations, changes in climate, natural disasters,
economic environment, inflation, laws and regulations
Changes in market interest rates and regulatory discount rates
Non-Life Insurance Underwriting Risks
SAMPO GROUP’S RISKSAND CORE RISK
MANAGEMENT ACTIVITIES
IF GROUP
SAMPO GROUP’SSTRUCTURE ANDBUSINESS MODEL
TOPDANMARKGROUP
SAMPO GROUPCAPITALIZATION
MANDATUM LIFEGROUP
RISK CONSIDERATIONSAT SAMPO GROUP LEVEL
AND SAMPO PLCAPPENDICES
RISK MANAGEMENT REPORT 2019 104

Reserve Risk
Reserve risk relates to incurred claims, resulting from
insured events which have occurred at or prior to
the balance sheet date. The final amount, frequency
and timing of claims payments may differ from those
originally expected. As a result, technical provisions are
not sufficient to cover the cost for already incurred claims
and there is a loss or adverse changes in the value of
insurance liabilities.
Reserve risk includes revision risk, which is defined as the
risk of loss, or of adverse change in the value of insurance
and reinsurance liabilities, resulting from fluctuations in
the level, trend, or volatility of revision rates applied to
annuities, due to changes in the legal environment or in
the state of health of the person insured.
Life Insurance Underwriting Risks
The value of life insurance liabilities is sensitive to
underwriting risks and interest rates. Underwriting
risk includes biometric, policyholder behavior and
expense risks as presented in the graph Life Insurance
Underwriting Risks.
Biometric Risks
Biometric risks refer to the risk that the company has to
pay more mortality, disability or morbidity benefits than
expected, or the company has to keep paying pension
payments to the pension policy holders for a longer
period (longevity risk) than expected originally when
pricing the policy.
In life insurance, catastrophe events include – as in non-
life insurance – rare single events or a series of events,
usually over a short period of time and, albeit even less
frequently, longer lasting events. When a low frequency,
high severity event or series of single events lead to a
significant deviation in actual benefits and payments
from the total expected payments, an extreme case of
biometric risk (i.e. a catastrophe risk) has been realized.
SAMPO GROUP’S RISKSAND CORE RISK
MANAGEMENT ACTIVITIES
IF GROUP
SAMPO GROUP’SSTRUCTURE ANDBUSINESS MODEL
TOPDANMARKGROUP
SAMPO GROUPCAPITALIZATION
MANDATUM LIFEGROUP
RISK CONSIDERATIONSAT SAMPO GROUP LEVEL
AND SAMPO PLCAPPENDICES
RISK MANAGEMENT REPORT 2019 105

Changes in economic value of liabilities and technical provisions
Biometric risksChanges in expected liability
cash flows resulting from:• Actual pensions are being
paid for a longer time than expected
• Actual mortality, disability or morbidity rate is greater than expected
Expense riskChanges in expected liability
cash flows resulting from:• Amount of expenses incurred
is greater than expected• Timing of expenses incurred is
earlier than expected
Policyholder behavior risksChanges in expected liability
cash flows resulting from:• Actual rate of policy lapses
differs from expected• Rate of actual surrenders
differs from expected
Changes in longevity, mortality, morbidity and disability, or inaccuracy of used models
Changes in general expenses and/or direct underwriting costs
Changes in policyholders’ behavior
External driversEmerging infectious diseases, medical innovations, natural disasters,
changes in lifestyles, economic environment, laws, taxation and regulations
Changes in market interest rates and regulatory discount rates
Life Insurance Underwriting Risks Policyholder Behavior and Expense Risks
Policyholder behavior risks arise from the uncertainty
related to the behavior of policyholders. The policy -
holders have the right to cease paying premiums (lapse
risk) and may have a possibility to withdraw their policies
(surrender risk).
The company is also exposed to expense risk, which
arises from the fact that the timing and/or the amount of
expenses incurred differs from those expected at the time
of pricing. As a result, expense charges originally assumed
may not be enough to cover the realized expenses.
Discount Rate Risk in Technical Provisions
Discount rate risk in technical provisions is the main
risk affecting the adequacy of technical provisions. The
guaranteed interest rate in policies is fixed for the whole
policy period. Thus, if market interest rates and expected
investment returns fall, technical provisions may have to
be supplemented.
SAMPO GROUP’S RISKSAND CORE RISK
MANAGEMENT ACTIVITIES
IF GROUP
SAMPO GROUP’SSTRUCTURE ANDBUSINESS MODEL
TOPDANMARKGROUP
SAMPO GROUPCAPITALIZATION
MANDATUM LIFEGROUP
RISK CONSIDERATIONSAT SAMPO GROUP LEVEL
AND SAMPO PLCAPPENDICES
RISK MANAGEMENT REPORT 2019 106

Market Risks
In general, market risks refer to fluctuations in the
financial results and capital base caused by changes in
market values of financial assets and liabilities, as well as
by changes in the economic value of insurance liabilities.
The changes in market values and economic values are
caused by movements in underlying market variables
such as interest rates, inflation, foreign exchange rates,
credit spreads and share prices.
Furthermore, market risks also include the risk of
worsening market liquidity in terms of widening bid-ask
spreads and the risk of unexpected changes in the
repayment schedules of assets. In both cases the market
values of financial instruments in investment portfolios
may change.
The risks caused by changes in interest rates, foreign
exchange rates and inflation together with a general trend
of credit spreads and equity prices are defined as general
market risks and are managed by allocation limits and
other risk limits. Interest rate, inflation and currency
risks are balance sheet level market risks whereas trend
in spreads and equity prices relate to a larger extent to
assets.
The risk related to debt and equity instruments issued by
a specific issuer can be defined as issuer specific market
risk that is managed by issuer specific limits.
SAMPO GROUP’S RISKSAND CORE RISK
MANAGEMENT ACTIVITIES
IF GROUP
SAMPO GROUP’SSTRUCTURE ANDBUSINESS MODEL
TOPDANMARKGROUP
SAMPO GROUPCAPITALIZATION
MANDATUM LIFEGROUP
RISK CONSIDERATIONSAT SAMPO GROUP LEVEL
AND SAMPO PLCAPPENDICES
RISK MANAGEMENT REPORT 2019 107
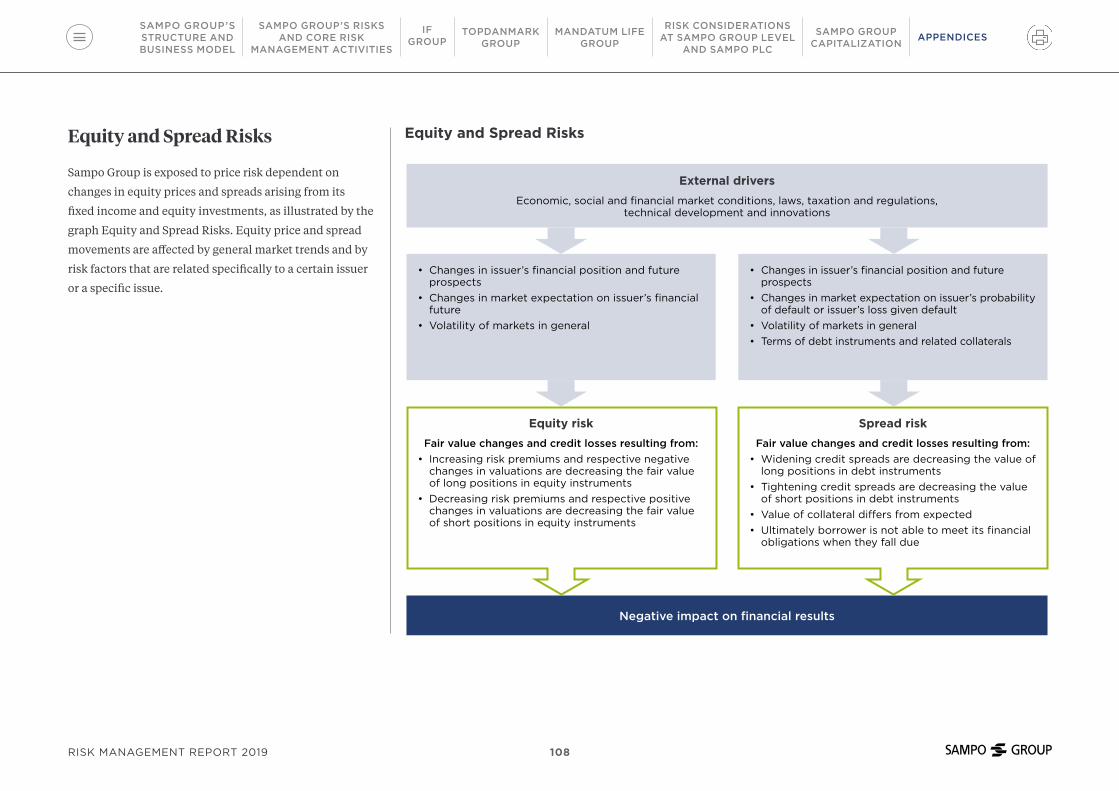
Equity and Spread Risks
Sampo Group is exposed to price risk dependent on
changes in equity prices and spreads arising from its
fixed income and equity investments, as illustrated by the
graph Equity and Spread Risks. Equity price and spread
movements are affected by general market trends and by
risk factors that are related specifically to a certain issuer
or a specific issue.
Negative impact on financial results
Equity riskFair value changes and credit losses resulting from:
• Increasing risk premiums and respective negative changes in valuations are decreasing the fair value of long positions in equity instruments
• Decreasing risk premiums and respective positive changes in valuations are decreasing the fair value of short positions in equity instruments
Spread riskFair value changes and credit losses resulting from:
• Widening credit spreads are decreasing the value of long positions in debt instruments
• Tightening credit spreads are decreasing the value of short positions in debt instruments
• Value of collateral differs from expected• Ultimately borrower is not able to meet its financial
obligations when they fall due
• Changes in issuer’s financial position and future prospects
• Changes in market expectation on issuer’s financial future
• Volatility of markets in general
• Changes in issuer’s financial position and future prospects
• Changes in market expectation on issuer’s probability of default or issuer’s loss given default
• Volatility of markets in general• Terms of debt instruments and related collaterals
External driversEconomic, social and financial market conditions, laws, taxation and regulations,
technical development and innovations
Equity and Spread Risks
SAMPO GROUP’S RISKSAND CORE RISK
MANAGEMENT ACTIVITIES
IF GROUP
SAMPO GROUP’SSTRUCTURE ANDBUSINESS MODEL
TOPDANMARKGROUP
SAMPO GROUPCAPITALIZATION
MANDATUM LIFEGROUP
RISK CONSIDERATIONSAT SAMPO GROUP LEVEL
AND SAMPO PLCAPPENDICES
RISK MANAGEMENT REPORT 2019 108

Balance Sheet Level Market Risks or ALM Risks
When changes in different market risk variables (interest
rates, inflation, foreign exchange rates) cause a change in
the fair values of investment assets and derivatives that
is of a different size than the respective change in the
economic value of the insurance liabilities, the company
is exposed to ALM risk. It has to be noted that the cash
flows of insurance liabilities are modelled estimates and
are therefore uncertain in relation to both their timing
and amount. This uncertainty is a central component of
ALM risk.
Interest Rate and Currency Risks
Many external drivers are affecting interest rates, infla-
tion, inflation expectations and foreign exchange rates as
illustrated by the graph Interest Rate and Currency Risks.
Currency risk can be divided into transaction and trans-
lation risk. Transaction risk refers to currency risk arising
from contractual cash flows in foreign currencies which
are related to insurance activities, investment operations
and foreign exchange transactions. Translation risk
refers to currency risk that may realize when balance
sheet values or measures such as SCRs expressed in base
currency are converted into other currencies.
Negative impact on financial results and solvency capital
Interest rate risk (nominal & real rate)Changes in fair values resulting from:
• The value of interest rate exposures decreases immediately
• The future investments are made at unfavorable interest rate levels
Currency riskChanges in fair values resulting from:
• The value of foreign currency transaction exposures decreases
• The base currency value of net investment in foreign subsidiaries decreases
Unfavorable changes in interest rates Unfavorable changes in foreign currency rates
External driversEconomic, social and financial market conditions, international trade flows, political decisions,
central bank actions, laws, taxation and regulations
Interest Rate and Currency Risks
SAMPO GROUP’S RISKSAND CORE RISK
MANAGEMENT ACTIVITIES
IF GROUP
SAMPO GROUP’SSTRUCTURE ANDBUSINESS MODEL
TOPDANMARKGROUP
SAMPO GROUPCAPITALIZATION
MANDATUM LIFEGROUP
RISK CONSIDERATIONSAT SAMPO GROUP LEVEL
AND SAMPO PLCAPPENDICES
RISK MANAGEMENT REPORT 2019 109

Liquidity Risks
Liquidity risk is the risk that the Group companies are,
due to a lack of available liquid funds or access to relevant
markets, unable to conduct their regular business
activities in accordance with the strategy, or in extreme
cases, are unable to settle their financial obligations when
they fall due.
The sources of liquidity risk in Sampo Group are either
internal or external by their nature. If the company’s
rating declines or if the company’s solvency otherwise
appears jeopardized, its ability to raise funding, buy
reinsurance cover or enter financial derivatives at a
reasonable price is endangered. Moreover, policyholders
may also not be willing to renew their policies because
of the company’s financial challenges or in the case of
reputational issues. If these risks, caused by internal
reasons, are realized together with general market
turmoil, which makes the selling of investment assets and
the refinancing of debt difficult, maintaining adequate
liquidity can be a challenge.
Inability to enter into transactions at reasonable terms or settle financial obligations endangers the ability to manage liquidity positions, risk exposures and capital structure according to strategy
Liquidity risk – Insurance liabilities
• Renewal rate of insurance policies is lower than expected
• Claim payments over short-term are clearly higher than expected
Liquidity risk – Derivatives and reinsurance
• Reinsurance is not available at reasonable terms or at all
• Financial derivatives are not available at reasonable terms or at all
Liquidity risk – Investment assets and funding
• Financing is not available at reasonable terms or at all
• Investment assets cannot be sold at reasonable prices or at all
• Policyholders’ behavior in general
• Changes in creditworthiness and reputation of the company
• Periodic concentration of large claims and simultaneous reinsurers’ insolvency
• Liability structure of the company
• Reinsurers’ behavior in general• Derivative counterparties’
behavior in general• Changes in creditworthiness of
the company• Liability structure of the
company
• Investors’ behavior in general• Market liquidity in general• Changes in creditworthiness
and funding needs of the company
• Investment portfolio structure of the company
External driversEconomic, social and financial market conditions, laws, taxation and regulations, market turbulences,
natural disasters and other catastrophic events
Liquidity Risks
SAMPO GROUP’S RISKSAND CORE RISK
MANAGEMENT ACTIVITIES
IF GROUP
SAMPO GROUP’SSTRUCTURE ANDBUSINESS MODEL
TOPDANMARKGROUP
SAMPO GROUPCAPITALIZATION
MANDATUM LIFEGROUP
RISK CONSIDERATIONSAT SAMPO GROUP LEVEL
AND SAMPO PLCAPPENDICES
RISK MANAGEMENT REPORT 2019 110

Counterparty Default Risks
Credit risk by definition comprises default, spread and
settlement risks. Default risk refers to losses arising from
occurred defaults of contractual counterparties (counter-
party risk) or debtors (issuer risk).
Counterparty Default Risk (“Counterparty Risk”) is one
type of consequential risk, which Sampo Group is exposed
to through its activities. In the case of counterparty risk,
the final loss depends on the positive mark-to-market
value of derivatives or reinsurance recoverables at the
time of default and on the recovery rate which is affected
by collaterals.
In the case of issuer risk the final loss depends on the
investor’s holding of the security or deposit at the time of
default, mitigated by the recovery rate.
Spread risk refers to losses resulting from changes in the
credit spreads of debt instruments and credit derivatives.
Credit spreads are affected when the market’s estimation
of the probability of defaults is changing. In essence,
credit spread is the market price of default risk which
is priced into the market value of the debt instrument.
Hence the debt instrument’s value should fall before the
event of default occurs. Because of these features, spread
risk, including also the default risk of debt instruments, is
categorized in Sampo Group under investment portfolio
market risks.
Settlement risk is realized when one party fails to
deliver the terms of a contract after the other party has
already delivered its part. Settlement risks are effectively
mitigated by using centralized settlement and clearing
systems by Sampo Group companies.
Negative impact on financial results
Default risk of derivative counterpartyCredit losses resulting from:
• Rapid increase in value of net exposure• Derivative counterparty is not able to post collateral
or pay settlement amounts when they fall due• Value of collateral differs from expected
Default risk of reinsurance counterpartyCredit losses resulting from:
• Increase in reinsurance recoverables• Reinsurer is not able to pay reinsurance
recoverables when they fall due
• Changes in counterparty creditworthiness• Terms of the instruments and collateral mechanism• Volatility of underlying instruments and collateral
markets
• Changes in counterparty creditworthiness• Terms of the agreement
External driversEconomic, social and financial market conditions, laws, taxation & regulations,
technical development and innovations, natural disasters and other catastrophic events
Counterparty Default Risks
SAMPO GROUP’S RISKSAND CORE RISK
MANAGEMENT ACTIVITIES
IF GROUP
SAMPO GROUP’SSTRUCTURE ANDBUSINESS MODEL
TOPDANMARKGROUP
SAMPO GROUPCAPITALIZATION
MANDATUM LIFEGROUP
RISK CONSIDERATIONSAT SAMPO GROUP LEVEL
AND SAMPO PLCAPPENDICES
RISK MANAGEMENT REPORT 2019 111

Operational Risks
Operational risk refers to the risk of loss resulting from
inadequate or failed processes or systems, from personnel
or from external events. This definition includes
compliance risk but excludes risks resulting from strategic
decisions. The risks may realize for instance because of:
• Internal misconduct;
• External misconduct;
• Insufficient human resources management;
• Insufficiencies in operating policies regarding
customers, products or business activities;
• Damage to physical property;
• Interruption of activities and system failures; or
• Defects in the operating process.
Materialized operational risks can cause an immediate
negative impact on the financial results due to additional
costs or loss of earnings. In the longer term, materialized
operational risks can lead to a loss of reputation and,
eventually, a loss of customers which endangers the
company’s ability to conduct business activities in
accordance with the strategy.
Compliance risk is the risk of legal or regulatory
sanctions, material financial losses or loss of reputation
resulting from a company’s failure to comply with laws,
regulations and administrative orders as applicable to its
Negative impact on financial results arising from immediate costs or loss of earnings and inability to conduct business activities in accordance with strategy due to loss of reputation and customers
Operative processesHigh cost or low quality of client services or internal processes resulting from:• Internal processes are not
working as expected• Client services are not working
as expected
Resource damagesDiscontinuity of operations resulting from:• Damage to personnel• Damage to physical property
or locations• Damage to or loss of data
Data and informationDeficiencies in decision-making and actions and non-compliance in reporting resulting from:• Inadequate, inaccurate or
untimely information and reporting
• Competence and integrity of human resources
• Hardware, software and data• Work processes
• Internal events, accidents, failures, misconduct etc.
• Source data integrity• Calculation procedures• Reporting procedures• Access to data and reports
External driversNatural disasters, other catastrophic events, epidemics, unauthorized or
criminal acts and technological developments
Operational Risks
activities. Compliance risk is usually the consequence of
internal misconduct and hence it can be seen as a part of
operational risk.
SAMPO GROUP’S RISKSAND CORE RISK
MANAGEMENT ACTIVITIES
IF GROUP
SAMPO GROUP’SSTRUCTURE ANDBUSINESS MODEL
TOPDANMARKGROUP
SAMPO GROUPCAPITALIZATION
MANDATUM LIFEGROUP
RISK CONSIDERATIONSAT SAMPO GROUP LEVEL
AND SAMPO PLCAPPENDICES
RISK MANAGEMENT REPORT 2019 112
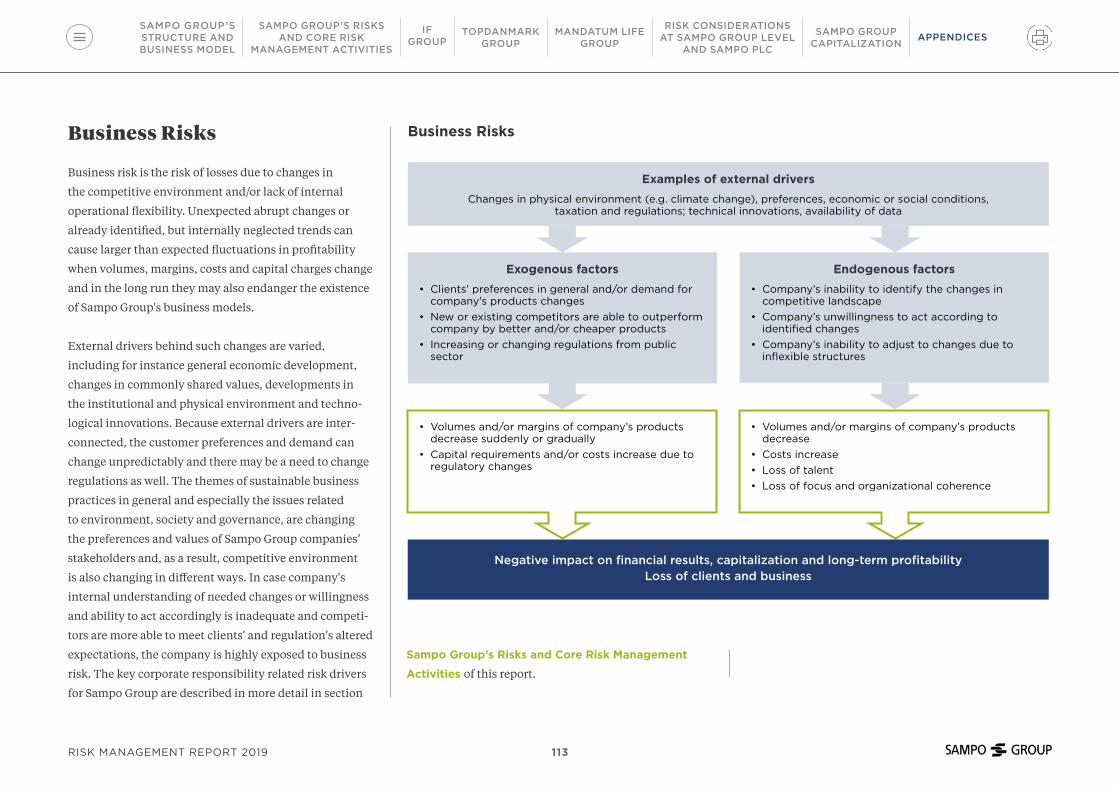
Business Risks
Business risk is the risk of losses due to changes in
the competitive environment and/or lack of internal
operational flexibility. Unexpected abrupt changes or
already identified, but internally neglected trends can
cause larger than expected fluctuations in profitability
when volumes, margins, costs and capital charges change
and in the long run they may also endanger the existence
of Sampo Group's business models.
External drivers behind such changes are varied,
including for instance general economic development,
changes in commonly shared values, developments in
the institutional and physical environment and techno-
logical innovations. Because external drivers are inter-
connected, the customer preferences and demand can
change unpredictably and there may be a need to change
regulations as well. The themes of sustainable business
practices in general and especially the issues related
to environment, society and governance, are changing
the preferences and values of Sampo Group companies’
stakeholders and, as a result, competitive environment
is also changing in different ways. In case company's
internal understanding of needed changes or willingness
and ability to act accordingly is inadequate and competi-
tors are more able to meet clients' and regulation's altered
expectations, the company is highly exposed to business
risk. The key corporate responsibility related risk drivers
for Sampo Group are described in more detail in section
Negative impact on financial results, capitalization and long-term profitability Loss of clients and business
• Volumes and/or margins of company’s products decrease suddenly or gradually
• Capital requirements and/or costs increase due to regulatory changes
• Volumes and/or margins of company’s products decrease
• Costs increase• Loss of talent• Loss of focus and organizational coherence
Exogenous factors• Clients’ preferences in general and/or demand for
company’s products changes• New or existing competitors are able to outperform
company by better and/or cheaper products• Increasing or changing regulations from public
sector
Endogenous factors• Company’s inability to identify the changes in
competitive landscape• Company’s unwillingness to act according to
identified changes• Company’s inability to adjust to changes due to
inflexible structures
Examples of external driversChanges in physical environment (e.g. climate change), preferences, economic or social conditions,
taxation and regulations; technical innovations, availability of data
Business Risks
Sampo Group’s Risks and Core Risk Management
Activities of this report.
SAMPO GROUP’S RISKSAND CORE RISK
MANAGEMENT ACTIVITIES
IF GROUP
SAMPO GROUP’SSTRUCTURE ANDBUSINESS MODEL
TOPDANMARKGROUP
SAMPO GROUPCAPITALIZATION
MANDATUM LIFEGROUP
RISK CONSIDERATIONSAT SAMPO GROUP LEVEL
AND SAMPO PLCAPPENDICES
RISK MANAGEMENT REPORT 2019 113

Due to the predominantly external nature of the drivers
of – and development in – the competitive environment,
managing business risks is the responsibility of the
executive level senior management. Proactive strategic
decision making is the central tool in managing business
risks, which relate to the competitive advantage. The
maintenance of internal operational flexibility – i.e. the
ability to adjust the business model and cost structure
when needed – is also an efficient tool in managing
business risks.
Business risks do not have the regulatory capital charge,
although they may be a material source of earnings
volatility. Because of this, business risk may have an effect
on the amount and structure of actual capital base, if
deemed prudent in existing business environment.
SAMPO GROUP’S RISKSAND CORE RISK
MANAGEMENT ACTIVITIES
IF GROUP
SAMPO GROUP’SSTRUCTURE ANDBUSINESS MODEL
TOPDANMARKGROUP
SAMPO GROUPCAPITALIZATION
MANDATUM LIFEGROUP
RISK CONSIDERATIONSAT SAMPO GROUP LEVEL
AND SAMPO PLCAPPENDICES
RISK MANAGEMENT REPORT 2019 114

Appendix 3: Selected Management Principles
These principles are followed as such in the subsidiaries
although there may be small differences in the principles
followed in Topdanmark.
Principles of Balance Sheet Management (ALM)
Risk factors that are affecting both sides of balance sheet
contribute considerably to economic values of insurance
liabilities, market value of assets, risks and capital need.
According to Sampo’s definitions ALM risks include
in addition to interest rate, inflation and FX risk also
liquidity risk and behavioral risks affecting maturities of
insurance policies and some asset classes. Risk definitions
related to ALM risks may be found in Appendix 2 Risk
Definitions.
ALM risk profiles are thoroughly analysed and considered
for instance when investment policies are designed,
insurance products are developed, and internal
capitalization targets are set.
In Sampo Group companies, insurance liabilities are the
starting point for the investment policy. Insurance liabili-
ties are modelled and analysed to form an understanding
of their expected future cash flows and their sensitivities
to changes in factors such as inflation, interest rates
and foreign exchange rates. Secondly, the solvency
position at a time and its target levels (rating-agency and
regulatory) and risk appetite define the general capacity
and willingness to take market risks and liquidity risk.
The stronger the solvency position and the higher the
risk appetite, the more the investment portfolio can
potentially differentiate from a portfolio replicating cash
flows of insurance liabilities. Sampo Group companies
manage their investment portfolios within the limits set
on Investment Policies daily as described in more detail at
section Principles of Investment Portfolio Management.
In Sampo Group, operational liquidity risk is managed
by the legal entities, which are responsible for liquidity
planning and maintaining adequate liquidity buffers.
Liquidity risk is monitored based on the expected cash
flows resulting from assets, liabilities and other business.
In the subsidiaries, the adequacy of liquidity buffers is
dependent on the underwriting cash flows. In the parent
company, the adequacy of liquidity buffers is dependent
also on potential strategic arrangements and strong
liquidity and capacity to generate more liquidity if needed
is generally preferred.
Since there is no unambiguous technique to quantify the
capital need for liquidity risk, it is not directly considered
in the internal capital need estimates. Thus, only the
interest rate, inflation and FX risks of the ALM risks are
accounted for in the capital need framework.
One form of liquidity risk is the access to markets when
needed. Sampo Group companies maintain good business
relationships with several creditworthy counterparties
which mitigate the risk that the Group is not able to enter
into reinsurance or derivative transactions when needed.
At the Group level Sampo plc monitors the ALM profiles
of the companies and may adjust its own risk profiles
to mitigate the risks at the Group level. Because of this
a significant part of Sampo’s debt is tied to short-term
interest rates. Hence, the risk profile of Sampo plc is
opposite to the subsidiaries’ risk profiles.
SAMPO GROUP’S RISKSAND CORE RISK
MANAGEMENT ACTIVITIES
IF GROUP
SAMPO GROUP’SSTRUCTURE ANDBUSINESS MODEL
TOPDANMARKGROUP
SAMPO GROUPCAPITALIZATION
MANDATUM LIFEGROUP
RISK CONSIDERATIONSAT SAMPO GROUP LEVEL
AND SAMPO PLCAPPENDICES
RISK MANAGEMENT REPORT 2019 115

Principles of Investment Portfolio Management and Control of Investment Activities
Investments (excluding Mandatum Life’s investments
covering unit-linked policies) are managed according
to the subsidiaries’ Investment Policies which are based
on insurance liabilities and solvency as described in the
previous section. In Sampo Group direct investments and
managers of collective investment assets are carefully
studied before entering into new investments or making
new commitments. This prudent person principle is
reflected in many different ways in companies' invest-
ment policies and specifically in requirements set for new
kind of investments or any non-routine investments by
their nature.
Sampo Group’s Chief Investment Officer is responsible
for managing investments within the limitations of the
Investment Policies prepared by the Group companies
and approved by the Group Companies’ Boards of
Directors. The insurance subsidiaries and the parent
company have a common Group-wide infrastructure for
investment management as well as for performance and
risk reporting which facilitates simultaneous company
and the Group level reporting. These create cost efficiency
in investment activities and also facilitate Group-wide
monitoring of portfolios.
Sampo Group has a thorough understanding of the
Nordic markets and issuers and consequently the
Group’s direct investments are mainly made in Nordic
securities. Mandatum Life’s direct investments are
mainly denominated in the euro and in companies
geographically located in Finland and selectively in other
countries. If has the major part of its direct investments
denominated in the Scandinavian currencies and their
respective countries. Through effective differentiation in
asset selection between companies, concentration risk is
proactively managed at the Group level.
Sampo Group prefers simple and matured instruments
and transparency. Hence, most of Sampo Group’s invest-
ments are in fixed income securities and listed equities
which are tradable and subject to daily mark-to-market
valuation. Moreover, Sampo Group has also some illiquid
investments in these asset classes – loan instruments
and private equity – for which market prices are not that
frequently available, but whose fair values can change
adversely when the financial strength or future prospects
of the issuer deteriorates, or the value of collateral
decreases. Sampo Group has tools in place to measure the
risks of these instruments as well.
In financial accounting, the investment portfolios are
reported on a fair value basis. These fair values are
determined either based on direct market quotes or by
using various valuation models. More information on the
valuation methods of the investment assets is presented
in Note 17 Determination and Hierarchy of Fair
Values (www.sampo.com/year2019) of Sampo Group’s
Financial Statements. Regarding Solvency II valuation
methods, there are some minor differences compared to
the IFRS standards. See Appendix 4 Profitability, Risks
and Capital for Solvency II Valuation Methods.
ESG in Investment Management and Operations
At Sampo Group it is believed that environmental,
social, and governance (“ESG”) issues have an impact
on the long-term performance, risks, and value of all
companies. Hence, taking ESG issues into consideration
in the investment process is a critical success factor and
an important mean to improve the risk-return profile of
investments.
The investment opportunities are carefully studied before
any investments are made and ESG issues are considered
in parallel with other factors affecting the risk-return ratio
of individual investments. Taking the ESG issues into
account in the investment analysis and decision-making
is a part of the work profile of every person who is
making investment decisions and analyzing investment
opportunities.
During 2019 Sampo Group strengthened the investment
policies of the Group companies by adding further
instructions on how to take the ESG issues into account
in the investment process. Depending on the asset
SAMPO GROUP’S RISKSAND CORE RISK
MANAGEMENT ACTIVITIES
IF GROUP
SAMPO GROUP’SSTRUCTURE ANDBUSINESS MODEL
TOPDANMARKGROUP
SAMPO GROUPCAPITALIZATION
MANDATUM LIFEGROUP
RISK CONSIDERATIONSAT SAMPO GROUP LEVEL
AND SAMPO PLCAPPENDICES
RISK MANAGEMENT REPORT 2019 116
class, different ESG strategies, such as ESG integration,
norm-based screening, sector-based screening, and active
ownership, are used. Sampo Group also signed the United
Nations Principles for Responsible Investment (“PRI”) in
2019.
More detailed information on responsible investment
management and operations in Sampo Group is available
in Sampo Group’s Corporate Responsibility Report which
will be published in May 2020.
Management of Equity and Spread Risks of Direct Investments
In Sampo Group, the selection of direct fixed income
and equity investments is based primarily on stock and
bond picking and secondarily on top-down allocation.
This investment style ensures that the portfolio includes
thoroughly analyzed investments with risk return ratios
internally considered to be adequate, although the
portfolio might not be necessarily as diversified as finance
or portfolio theory suggests.
The main steps in decision making, limit and monitoring
process are as follows:
• Potential investments are analyzed thoroughly. The
creditworthiness and future prospects of the issuer are
assessed together with collaterals and structural details
of the instruments. Although external credit ratings by
rating agencies and the opinions of analysts are used to
support the internal assessment, Sampo Group’s own
internal assessment is always the most important factor
in decision making.
• Investment transactions shall be executable on
short notice when an opportunity appears. This puts
pressure on authorizations and credit limit structures
and procedures. They must be simultaneously carried
out flexibly enough to facilitate fast decision making
regardless of instrument type, well-structured to
ensure that investment opportunities are assessed
prudently, considering the specific features and risks of
all investment types and able to restrict the maximum
exposure of a single name risk to a level that is within
the company’s risk appetite.
• Accumulated credit exposures over single names and
products are monitored regularly at the subsidiary level
and at the Group level to identify unwanted concentra-
tions. Credit exposures are reported, for instance, by
sectors and asset classes and within fixed income by
ratings.
Management of Indirect Investments
In addition to direct investments the collective
investment assets managed by third parties are used.
The external asset managers and collective investment
assets managed by them are selected centrally by the
same members of Sampo Group’s Investment Unit
for both wholly owned subsidiaries. In this selection
clearly defined procedures are followed to ensure the
integrity of asset managers and to make sure that these
investments do not overlap with direct investments. By
this way Sampo Group prevents unidentified or unwanted
concentrations.
These investments are mainly in other asset classes – real
estate, private equity and alternative credit funds – and in
different geographical areas than the direct investments
that are mainly in Nordic countries. These investments
are primarily used as a tool in tactical asset allocation
when seeking return and secondarily in order to increase
diversification. Sampo Group does not have Asset
Backed securities in its portfolios except some CDOs in
Topdanmark.
SAMPO GROUP’S RISKSAND CORE RISK
MANAGEMENT ACTIVITIES
IF GROUP
SAMPO GROUP’SSTRUCTURE ANDBUSINESS MODEL
TOPDANMARKGROUP
SAMPO GROUPCAPITALIZATION
MANDATUM LIFEGROUP
RISK CONSIDERATIONSAT SAMPO GROUP LEVEL
AND SAMPO PLCAPPENDICES
RISK MANAGEMENT REPORT 2019 117

Management of Currency Risk
In Sampo Group companies the net foreign currency
transaction exposure is considered as a separate asset
class and is managed within investment portfolio
activities as considered relevant by the company.
Open transaction risk positions are identified, measured
and managed separately by each Sampo Group company.
The net position in each currency consists of the
assets, liabilities and foreign exchange transactions
denominated in the particular currency. Mandatum Life
and Topdanmark have their liabilities only in their local
currency and hence their transaction exposures are net
of foreign currency assets and currency derivatives. In If
there are also foreign currency denominated liabilities.
At the Group level Sampo is also exposed to translation
risk, because the base currency of If is the Swedish krona
and for Topdanmark the base currency is the Danish
krone.
Use of Derivatives
In Sampo Group the main motive for use of derivatives
is their efficiency – better liquidity and tighter bid-ask
spreads – compared to cash instruments.
In Sampo Group derivatives are used mainly to adjust
risks at investment-portfolio level (spread and equity
risks) or at balance sheet level (interest rate, inflation
and currency risks). This adjusting can mean mitigating
or increasing of risks. From time to time risk profiles of
single transactions may be adjusted by derivatives as well.
The approved derivatives are listed in the companies’
investment policies. In case there is a need for a new kind
of derivative instrument the proposal is made for the
Board approval. This proposal includes analysis how the
effect of new instrument type is properly considered in
risk limits and other reporting.
In most of the cases, derivatives are booked as trading
derivatives at fair value through the profit and loss
statement in financial accounting and hedge accounting
is applied only seldom.
The counterparty risk related to derivatives is managed as
described in the counterparty risk section.
Control of Investment Activities
Daily Controlling of Activities in Wholly Owned Subsidiaries
Market risk control is separated from portfolio manage-
ment activities in two ways. Firstly, persons independent
from the Investment Unit prepare Investment Policies for
Board approval. Secondly, Middle Office units which are
independent of the Investment Unit measure risks and
performance, and control limits set in Investment Policies
daily.
Market risks and limits are also controlled by the
Investment Control Committee (“ICC”) in If and the Asset
and Liability Committees (“ALCOs”) in Mandatum Life
monthly at a minimum. These committees are respon-
sible for the control of investment activities within the
respective legal entity.
The ICC is responsible for monitoring the implementation
of and compliance with the Investment and Asset
Coverage Policies. The committee considers and proposes
changes to the policies. The Chairman is responsible for
the reporting of policy deviations and other issues dealt
with by the committee.
SAMPO GROUP’S RISKSAND CORE RISK
MANAGEMENT ACTIVITIES
IF GROUP
SAMPO GROUP’SSTRUCTURE ANDBUSINESS MODEL
TOPDANMARKGROUP
SAMPO GROUPCAPITALIZATION
MANDATUM LIFEGROUP
RISK CONSIDERATIONSAT SAMPO GROUP LEVEL
AND SAMPO PLCAPPENDICES
RISK MANAGEMENT REPORT 2019 118

Mandatum Life has two ALCOs, of which one controls the
segregated assets and liabilities and the other controls the
rest of Mandatum Life’s with profit assets and liabilities.
The ALCOs ensure that the investment activities are
conducted within the limits defined in the Investment
Policy as approved by the Board and monitors the
adequacy of liquidity, profitability and solvency capital
in relation to the risks in the balance sheet. The ALCOs
prepare proposals of Investment Policy to the Board of
Directors and report to the Board.
Group-Wide Monitoring Activities
The aggregated market risks and concentrations at
the Group level are controlled by the Group’s Audit
Committee quarterly at a minimum. Unlike underwriting
activities, the subsidiaries’ investment activities are
closely coordinated in many ways at the Group level as
follows:
• Their investment portfolios’ risk profiles are designed
and decided separately from each other, but their
risk profiles are coordinated to proactively prevent
potential concentrations. This principle is relevant for
Topdanmark as well.
• The persons responsible for managing the subsidiaries’
investments report directly to Sampo Group’s
Chief Investment Officer which ensures day-to-day
coordination. Topdanmark is taking care of its day-to-
day investments independently.
• IT systems in investment activities are common
throughout the Group, facilitating consistent analysis
and reporting of risks both at the company and at the
Group level. In regard to Topdanmark their investment
assets are taken into account in concentration
reporting, but otherwise they have separate reporting
processes.
• The same basic principles are primarily followed
in the investment activities of both wholly-owned
subsidiaries, although the risk level of If’s investment
portfolio is significantly lower than the risk level of
Mandatum Life’s investment portfolio due to different
features of their insurance liabilities. In Topdanmark
as well the insurance liabilities are the starting point to
investment risk profiles.
Principles of Operational Risks Management
The effects of operational risks have their underlying
causes in external and internal drivers. Operational risks
may be realized because of inadequate or failed processes
or systems, from personnel or from external events
(for further details, see Appendix 2 Risk Definitions
- Operational Risks). The Group companies have their
own specific risk sources which are causes of events
that may have negative impacts on different processes,
personnel or fixed assets.
In Sampo Group, the parent company sets the following
goals of operational risk management for its subsidiaries:
• To simultaneously ensure the efficiency and the quality
of operations
• To ensure that operations are compliant with laws and
regulations
• To ensure the continuity of business operations in
exceptional circumstances.
Each company is responsible for arranging its operational
risk management in line with the above-mentioned goals,
while also considering the specific features of its business
activities.
SAMPO GROUP’S RISKSAND CORE RISK
MANAGEMENT ACTIVITIES
IF GROUP
SAMPO GROUP’SSTRUCTURE ANDBUSINESS MODEL
TOPDANMARKGROUP
SAMPO GROUPCAPITALIZATION
MANDATUM LIFEGROUP
RISK CONSIDERATIONSAT SAMPO GROUP LEVEL
AND SAMPO PLCAPPENDICES
RISK MANAGEMENT REPORT 2019 119
Appendix 4: Profitability, Risks and Capital
Sampo Group operates under a holding company struc-
ture and the parent company does not have any business
activities of its own. Sampo Group’s business activities
are conducted in four separately managed independent
business areas, with each business area managing their
own risks and reserving sufficient capital to cover their
risks.
This structure implies that the parent company is
structurally subordinated. Hence, it is dependent on
business areas’ dividends that can be paid only after
business areas have met their own obligations. Thus, the
parent company prefers to maintain in its business areas a
balance between profits, risks and capital which supports
business areas’ ability to pay stable dividends after
servicing their own obligations.
The structure also implies that Sampo plc’s primary focus
is on the capitalization at the sub-group level and when
the sub-groups in terms of own funds are well-capitalized,
the Group should be well-capitalized. The latter may
not be true if the sub-groups are cross-capitalizing each
other, or the parent company is financially weak (highly
leveraged and has inadequate liquidity buffers) or profits
of the sub-groups are strongly and positively correlated.
In Sampo Group none of these three claims are true.
Hence, from Sampo Group’s perspective, the main
objectives are:
• Independent business areas generate a stable and
growing stream of profits and have adequate solvency
to ensure the continuity of normal business activities.
• The portfolio of separate business areas is stable. From
the Group’s perspective, a weak correlation of business
areas’ profits increasing the benefits of diversification
on a portfolio level is preferred.
• The Group’s parent company can provide liquidity for
the strategic arrangements and capital injections, if
needed. Hence, the parent company prefers a relatively
low leverage and adequate liquidity buffers to ensure its
ability to generate liquidity.
Over the years Sampo Group has disclosed its financial
information by segments and relevant risk and solvency
reporting by insurance sub-groups. Associated companies
have disclosed their respective reports independently.
Since Solvency II entered into force on 1 January 2016
Sampo Group has disclosed the Group-level solvency
calculated by Solvency II rules. In Solvency II Sampo plc
is defined as the ultimate parent of the Solvency II Group
and thus the operating insurance companies each report
separate figures to their local supervisors while If Group
Solvency II figures are not required to be disclosed
separately, but as part of Sampo Group Solvency II figures.
SAMPO GROUP’S RISKSAND CORE RISK
MANAGEMENT ACTIVITIES
IF GROUP
SAMPO GROUP’SSTRUCTURE ANDBUSINESS MODEL
TOPDANMARKGROUP
SAMPO GROUPCAPITALIZATION
MANDATUM LIFEGROUP
RISK CONSIDERATIONSAT SAMPO GROUP LEVEL
AND SAMPO PLCAPPENDICES
RISK MANAGEMENT REPORT 2019 120

Capitalization at the Sub-Group Level
As noted earlier, in Sampo Group the first priority is to
maintain a balance between profits, risks and capital in
each of the separate business areas.
In a nutshell, a balance between profits, risks and capital
means that the actual amount of capital – or Own Funds
(“OF”) in Solvency II terminology – is maintained over
risk-based capital need with a certain buffer; the size of
this buffer is dependent on many things but mainly on
expected profitability.
The graph Sampo Group Companies’ Capitalization
Framework illustrates Sampo’s approach to sub-group and
company-level capitalization.
The Solvency Capital Requirement (“SCR”) sets the
minimum level of capital at which a company is able to
conduct its business without regulatory intervention.
Regardless of whether the regulatory capital requirement
is calculated using the internal model or the standard
formula (“SF”), it reflects a 99.5 per cent confidence
level, i.e. the same probability of default as a BBB rating
from major rating agencies. If the company’s clients and
counterparties prefer a higher than BBB creditworthiness
from their insurance company, the level of capital must
always be higher than the SCR, to ensure the company’s
ability to serve its client base.
BufferFactors affecting the size of buffer:• Expected profits and market values• Business growth prospects• Capacity to issue capital instruments
Tier 3
Tier 2
Tier 1
Capital floorThe amount of capital floor is set as the highest of:• The regulatory capital requirement ”SCR”• The capital need according to a Group company’s
internal model• The amount of capital needed to satisfy the
chosen rating target
Capital requirements and needs Own funds
+
Sampo Group Companies’ Capitalization Framework
To serve its current clients, If is maintaining a Single A
rating which effectively implies that If’s capital floor – the
level to which it compares its actual capital – is higher
than the SCR. Mandatum Life and Topdanmark consider
the SCR to be an adequate capital floor. Topdanmark’s
Group solvency is calculated according to Solvency
II rules. Topdanmark uses a partial internal model to
calculate the non-life insurance risk and the volatility
adjustment when calculating technical provisions, which
are both approved by the Danish FSA. Mandatum Life
is also applying volatility adjustment when calculating
technical provisions for solvency purposes.
SAMPO GROUP’S RISKSAND CORE RISK
MANAGEMENT ACTIVITIES
IF GROUP
SAMPO GROUP’SSTRUCTURE ANDBUSINESS MODEL
TOPDANMARKGROUP
SAMPO GROUPCAPITALIZATION
MANDATUM LIFEGROUP
RISK CONSIDERATIONSAT SAMPO GROUP LEVEL
AND SAMPO PLCAPPENDICES
RISK MANAGEMENT REPORT 2019 121
There is a need to have a certain buffer between the
actual amount of capital and the capital floor defined by
the company, because risk exposures and profits evolve
continuously over time and capital can sometimes erode
rapidly due to stressed situations. An adequate buffer
gives time for the company to adjust its risks and capital
in times of stress and to maintain the balance between
risks and capital. An adequate buffer also gives confidence
to supervisors and counterparties (this being the other
motivation for the buffer).
In Sampo Group the management steers the balance
between SCR/rating agency capital target and OF through
their decisions on risk profiles, dividend payments,
capital instrument issuances and technical provisions. In
the long run, a sound profitability and satisfied clients are
the most important factors in maintaining an adequate
capitalization.
The following factors are the most material when the size
of buffer is considered in Sampo Group companies:
• The higher the level of expected profits and the lower
the volatility of profits and market value of balance
sheet, the less is the volatility of own funds and thus the
smaller is the buffer.
On a sub-group and company level, a target can also be
set for the capital structure. In general, Sampo Group is in
favour of strong capital structures and as a result Sampo
Group companies currently have, according to Solvency II
rules, room for new hybrid capital and subordinated debt
instruments in their balance sheets.
• If business is growing, the buffer is larger than in the
case of a run-off -business. For instance, in Mandatum
Life, capital consuming with profit business has already
been in a virtual run-off mode for years.
• More ability and capacity to issue Solvency II compliant
capital instruments means that a lower buffer is needed.
When the balance between profits, risks and capital is
found, the following three goals of Sampo Group are
simultaneously obtainable:
• The business activities can be conducted without
supervisory intervention.
• The business activities can be conducted with all
targeted client bases and the company has access
to financial and debt issuance markets at terms and
conditions implied by the company’s creditworthiness.
• The targeted dividends can be paid to shareholders in
the long run without endangering the balance between
risk and capital.
SAMPO GROUP’S RISKSAND CORE RISK
MANAGEMENT ACTIVITIES
IF GROUP
SAMPO GROUP’SSTRUCTURE ANDBUSINESS MODEL
TOPDANMARKGROUP
SAMPO GROUPCAPITALIZATION
MANDATUM LIFEGROUP
RISK CONSIDERATIONSAT SAMPO GROUP LEVEL
AND SAMPO PLCAPPENDICES
RISK MANAGEMENT REPORT 2019 122
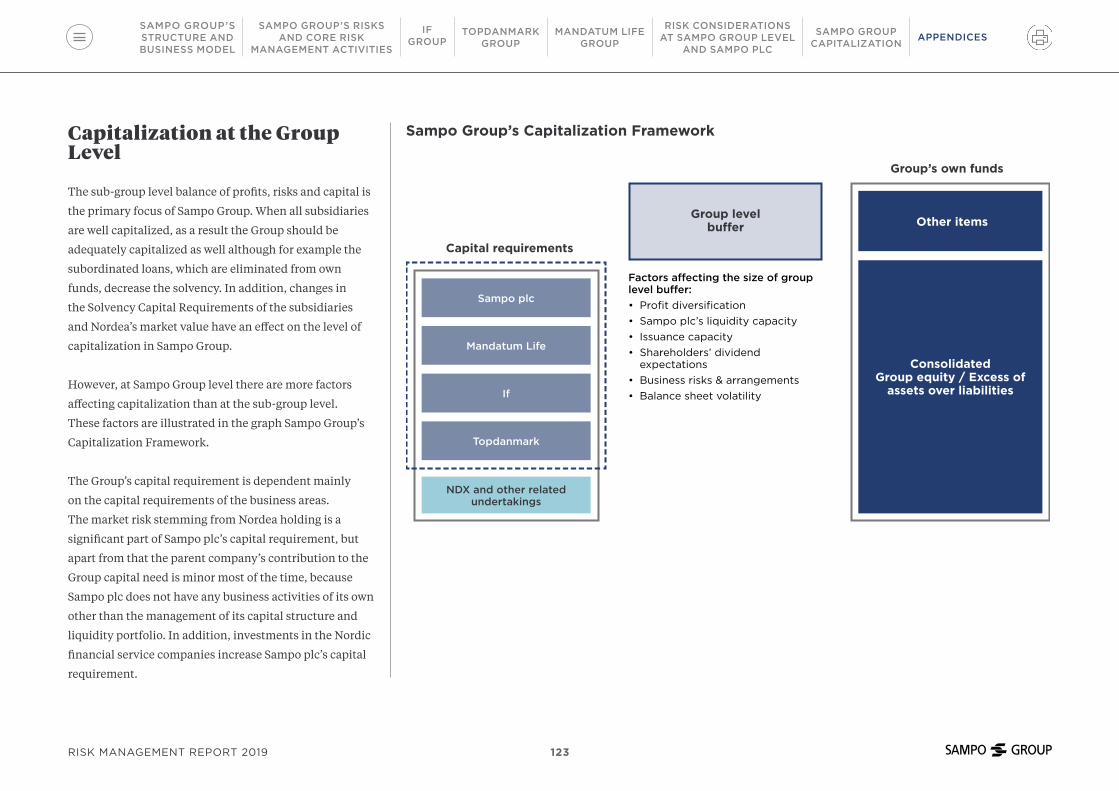
Capitalization at the Group Level
The sub-group level balance of profits, risks and capital is
the primary focus of Sampo Group. When all subsidiaries
are well capitalized, as a result the Group should be
adequately capitalized as well although for example the
subordinated loans, which are eliminated from own
funds, decrease the solvency. In addition, changes in
the Solvency Capital Requirements of the subsidiaries
and Nordea’s market value have an effect on the level of
capitalization in Sampo Group.
However, at Sampo Group level there are more factors
affecting capitalization than at the sub-group level.
These factors are illustrated in the graph Sampo Group’s
Capitalization Framework.
The Group’s capital requirement is dependent mainly
on the capital requirements of the business areas.
The market risk stemming from Nordea holding is a
significant part of Sampo plc’s capital requirement, but
apart from that the parent company’s contribution to the
Group capital need is minor most of the time, because
Sampo plc does not have any business activities of its own
other than the management of its capital structure and
liquidity portfolio. In addition, investments in the Nordic
financial service companies increase Sampo plc’s capital
requirement.
Capital requirements
Group’s own funds
Sampo plc
Mandatum Life
If
Topdanmark
NDX and other related undertakings
Group level buffer
Factors affecting the size of group level buffer:• Profit diversification• Sampo plc’s liquidity capacity• Issuance capacity • Shareholders’ dividend
expectations• Business risks & arrangements• Balance sheet volatility
Other items
Consolidated Group equity / Excess of
assets over liabilities
Sampo Group’s Capitalization Framework
SAMPO GROUP’S RISKSAND CORE RISK
MANAGEMENT ACTIVITIES
IF GROUP
SAMPO GROUP’SSTRUCTURE ANDBUSINESS MODEL
TOPDANMARKGROUP
SAMPO GROUPCAPITALIZATION
MANDATUM LIFEGROUP
RISK CONSIDERATIONSAT SAMPO GROUP LEVEL
AND SAMPO PLCAPPENDICES
RISK MANAGEMENT REPORT 2019 123

Diversification benefit exists at two levels, within the
companies and between the companies. The former is
included in the companies’ SCRs.
Conceptually, the Group’s own funds is the difference
between the market value of assets and liabilities plus
the subordinated liabilities. This difference has accrued
during the lifetime of the Group and it includes the
following main components:
• Accrued profits that have not been paid as dividends
over the years.
• Market value adjustment to the book values of assets
and liabilities.
• Issued capital and subordinated liabilities meeting
Solvency II requirements.
At the Group level, the capital requirement and own
funds are both exposed to foreign currency translation
risk. Translation risk may realize when the actual
capital and the capital needs of If and Topdanmark are
converted from their reporting currencies to the euro.
When the reporting currencies of If and Topdanmark
depreciate, the actual amount of the Group’s capital in
the euros decreases and the capital requirements of If and
Topdanmark will be lower in the euro terms. Translation
currency risk is monitored internally and its effect on
Sampo Group’s solvency on a going concern basis is
analyzed regularly. However, internally no capital need is
set for translation risk, because it is realized only when a
sub-group is divested.
The Group level buffer is the difference between the
amount of the Group’s own funds and the Group capital
requirement. In addition to the sub-group level factors
– expected profits and their volatility, business growth
prospects and ability to issue Solvency II compliant
capital instruments – there are Group level factors that are
also relevant when considering the size of the Group level
buffer. The most material Group level factors affecting the
size of the buffer are correlation of sub-groups’ reported
profits, volatility of the balance sheet due to fluctuations
in the market value of the equity portfolio and the insur-
ance liabilities, parent company’s capacity to generate
liquidity, probability of business risks and arrangements
and shareholders’ dividend expectations.
Regulatory Solvency Calculation Methods and the Group Solvency Position
Sampo Group’s capital requirement and amount of the
Group’s own funds are calculated by the Solvency II
directive as follows:
Sampo Group’s capital requirement is called Group SCR
and it is calculated in two phases:
• The capital requirements of other risks than FX risk and
concentration risk are calculated for the consolidated
Group including respective standard formula SCRs
of the parent company Sampo plc, If, Mandatum Life
and Topdanmark. The company SCRs may include the
simplifications and other options as applied by them.
The capital requirement of FX risk and concentration
risks are calculated based on Group-wide exposures
calculated separately for this purpose. Regarding FX
risk requirement also the translation risk exposures
related to the Swedish krona denominated equity of
If and DKK denominated equity of Topdanmark are
considered. Diversified capital requirement for the
consolidated Group SCR is then calculated from these
risk specific SCRs.
• Sampo plc’s share of the capital requirement of NDX
and other related undertakings, that are not a part of
the consolidated SCR, is added to the consolidated
Group capital requirement.
SAMPO GROUP’S RISKSAND CORE RISK
MANAGEMENT ACTIVITIES
IF GROUP
SAMPO GROUP’SSTRUCTURE ANDBUSINESS MODEL
TOPDANMARKGROUP
SAMPO GROUPCAPITALIZATION
MANDATUM LIFEGROUP
RISK CONSIDERATIONSAT SAMPO GROUP LEVEL
AND SAMPO PLCAPPENDICES
RISK MANAGEMENT REPORT 2019 124

The Group SCR considers diversification only within the
consolidated Group thus excluding the diversification
benefit related to NDX and to other related undertakings
that are not consolidated.
The Group’s own funds under Solvency II rules
is the excess of assets over liabilities including any
subordinated liabilities which may be called up to absorb
losses and minus own shares held directly. Assets and
liabilities are valued at market value and all intra-group
transactions are eliminated. The excess of assets over
liabilities is classified into tiers 1-3. The tiers reflect the
degree of loss absorbency of own funds in the event of a
winding up. Adjustments are made if all own funds are
not available or eligible at the Group level.
Sampo plc paid in August 2019 an extra dividend in the
form of Nordea shares, which took Sampo’s ownership in
Nordea under 20%. As a result, the treatment of Nordea
changed in the Solvency II calculations, and it is treated
as an equity investment in Sampo Group’s own funds
and SCR. In financial accounting Nordea remains an
associated company of Sampo.
The Group’s own funds and SCR are calculated by a
consolidation method. The consolidated Solvency II
Group consists of the insurance entities If, Mandatum Life
and Topdanmark, and the holding company Sampo plc.
Capital requirements of other related undertakings are
then added to the consolidated Group SCR, The Minimum
Consolidated Group SCR (“MCR”) is determined by adding
up the Solo MCRs of the insurance entities consolidated
for the Group SCR calculation.
SAMPO GROUP’S RISKSAND CORE RISK
MANAGEMENT ACTIVITIES
IF GROUP
SAMPO GROUP’SSTRUCTURE ANDBUSINESS MODEL
TOPDANMARKGROUP
SAMPO GROUPCAPITALIZATION
MANDATUM LIFEGROUP
RISK CONSIDERATIONSAT SAMPO GROUP LEVEL
AND SAMPO PLCAPPENDICES
RISK MANAGEMENT REPORT 2019 125

Appendix 5: Valuation for Solvency Purposes
Sampo Group Solvency II balance sheet is derived from
Sampo’s consolidated IFRS financial statements, which
are adjusted in accordance with Solvency II regulation.
The IFRS accounting principles “Summary of significant
accounting principles” are presented in Sampo Group’s
Financial Statements in Notes to the accounts
(www.sampo.com/year2019). A large majority of Sampo
Group’s assets are valued at fair value on the IFRS balance
sheet based on market values. No significant alternative
valuation methods are used. The fair values of financial
liabilities and properties are given in the notes to the IFRS
accounts.
The determination of the fair values is presented in
Sampo Group’s Financial Statements in Notes to the
accounts/Summary of significant accounting policies/Fair
value and Investment property and also in the notes Fair
values and Determination and hierarchy of fair values.
For comparison purposes the values derived from
Sampo’s consolidated IFRS financial statements are
mapped in accordance with the Solvency II balance sheet
presentation in the table Solvency II Adjustments, Sampo
Group, 31 December 2019. Only main rows are presented.
The currency used is the Group’s reporting currency,
the euro.
The scope of Sampo Group in the Solvency II framework
is the same as the scope used in Sampo Group’s financial
statement.
According to the Solvency II balance sheet the excess of
assets over liabilities for the Group per 31 December 2019
was EUR 1,838 million less than the respective IFRS figure.
On the asset side the main differences are due to the
different treatment of intangible assets and inclusion of
future undue premium receivables in technical provisions
instead of assets. On the liability side, there are material
differences related to technical provisions due to different
classification of some items and valuation principles.
These differences are discussed in the next sections.
SAMPO GROUP’S RISKSAND CORE RISK
MANAGEMENT ACTIVITIES
IF GROUP
SAMPO GROUP’SSTRUCTURE ANDBUSINESS MODEL
TOPDANMARKGROUP
SAMPO GROUPCAPITALIZATION
MANDATUM LIFEGROUP
RISK CONSIDERATIONSAT SAMPO GROUP LEVEL
AND SAMPO PLCAPPENDICES
RISK MANAGEMENT REPORT 2019 126

Solvency II AdjustmentsSampo Group, 31 December 2019
Assets, EURm IFRS value*Solvency II
value AdjustmentGoodwill, intangible assets and deferred acquisition cost 2,303 0 -2,303
Deferred tax assets 19 0 -19
Property, plant & equipment held for own use 295 296 1
Investments (other than unit-linked) 31,148 30,311 -838
Property other than for own use 611 645 34
Holdings in related undertakings 7,217 518 -6,699
Equities 2,940 8,768 5,828
Bonds 17,882 17,882 0
Collective investments undertakings 2,033 2,033 0
Derivatives 83 83 0
Deposits other than cash equivalents 382 382 0
Asset held for unit-linked contracts 12,984 12,984 0
Loans and mortgages 296 296 0
Reinsurance recoverables 288 250 -38
Non-life and health similar to non-life 278 240 -38
Life and health similar to life 10 10 0
Insurance and intermediaries receivables 1,471 490 -981
Reinsurance receivables 33 33 0
Receivables (trade, not insurance) 164 91 -73
Own shares (held directly) 0 129 129
Cash and cash equivalents 2,662 2,662 0
Any other assets, not elsewhere shown 273 179 -94
Total assets 51,939 47,721 -4,217
Liabilities, EURm IFRS valueSolvency II
value AdjustmentTechnical provisions – non-life 7,855 6,227 -1,629
Technical provisions – life 10,185 10,016 -169
Technical provisions – unit-linked 14,368 13,826 -542
Provisions other than technical provisions, Pension benefit obligations 132 132 0
Deferred tax liabilities 587 430 -157
Derivatives 169 169 0
Financial liabilities other than owed to credit institutions 3,583 3,773 190
Insurance and intermediaries payables 239 239 0
Reinsurance payables 35 29 -5
Payables (trade, not insurance) 454 385 -68
Subordinated liabilities 1,213 1,267 54
Any other liabilities, not elsewhere shown 577 524 -53
Total liabilities 39,396 37,017 -2,379
Excess of assets over liabilities 12,542 10,704 -1,838
* In IFRS Sampo’s financial assets consist of equity and debt instruments available for sale and fair value through profit/loss, derivatives and loans and receivables. Financial liabilities in IFRS consist of derivatives and other liabilities eg. subordinated liabilities and other debt securities in issue.
SAMPO GROUP’S RISKSAND CORE RISK
MANAGEMENT ACTIVITIES
IF GROUP
SAMPO GROUP’SSTRUCTURE ANDBUSINESS MODEL
TOPDANMARKGROUP
SAMPO GROUPCAPITALIZATION
MANDATUM LIFEGROUP
RISK CONSIDERATIONSAT SAMPO GROUP LEVEL
AND SAMPO PLCAPPENDICES
RISK MANAGEMENT REPORT 2019 127

Assets
In the Group Solvency II balance sheet goodwill,
intangible assets and deferred acquisition costs are valued
at zero.
While recognition of deferred taxes is consistent with the
IFRS accounts, Solvency II adjustments affect the carrying
values in the Solvency II balance sheet and thus give rise
to additional deferred tax effects. Solvency II valuation
decreased deferred tax assets by EUR 19 million and
deferred tax liabilities by EUR 157 million. The difference
is mainly due to elimination of certain assets (intangible
assets, etc.) and differences in the calculation of technical
provisions.
The carrying amounts of Sampo’s investment assets are
different in IFRS and Solvency II balance sheets due to
differences in the treatment of Nordea and properties.
Nordea is treated as an associated company under
IFRS while under Solvency II it is treated as an equity
investment. Thus the value of investments differ under
IFRS and Solvency II. Additionally, properties are valued
at fair value according to Solvency II valuation rules. This
increases the value of properties by EUR 35 million.
Loans and mortgages are valued at amortized cost, which
is not in line with the treatment for financial assets in
Solvency II. Sampo, however, considers the IFRS value to
be substantially commensurate with the fair value of the
loans.
Participations are reported in Sampo’s Solvency II consoli-
dated balance sheet using the adjusted equity method, or
where applicable, the IFRS equity method. Participations
refers to undertakings in which Sampo Group directly or
indirectly has significant influence, which is normally the
case when the shareholding amounts to a minimum of 20
per cent of the capital or voting rights for all shares in the
company.
Reinsurance recoverables represent the reinsurers’ share
of the best estimate, less expected counterparty default.
Consistently with technical provisions, these amounts are
calculated in line with the Solvency II requirements.
Under Solvency II the technical provisions should
fully consider all cash inflows and outflows. Therefore,
regarding the policies in force, the future premiums
expected but not yet due are not recognized as
receivables. Instead they are included in the premium
provision based on a best estimate, which differs from the
treatment under the IFRS, where premium receivables are
recognized in the balance sheet. Thus, receivables of EUR
981 million were reclassified from premium receivables
to insurance liabilities. Receivables in Solvency II relate
only to the amounts due for payments by policyholders,
insurers, and others linked to insurance business.
The adjustment of receivables (trade receivables, not
insurance receivables) relates to netting of receivable
amounts in relation to the Finnish medical malpractice
pool (“MMP”), public sector, which are treated as part
of the Solvency II best estimate technical provisions,
whereas in Sampo Group’s consolidated accounts the
MMP provision public sector is recognized as other assets
/ liabilities. Receivables of EUR 69 million are reclassified
from trade receivables to the insurance obligation.
In Solvency II Own Shares EUR 129 million are recognized
on balance sheet whereas in IFRS Own Shares are
deducted from Equity.
SAMPO GROUP’S RISKSAND CORE RISK
MANAGEMENT ACTIVITIES
IF GROUP
SAMPO GROUP’SSTRUCTURE ANDBUSINESS MODEL
TOPDANMARKGROUP
SAMPO GROUPCAPITALIZATION
MANDATUM LIFEGROUP
RISK CONSIDERATIONSAT SAMPO GROUP LEVEL
AND SAMPO PLCAPPENDICES
RISK MANAGEMENT REPORT 2019 128

Technical Provisions According to Solvency II in Sampo Group
In Solvency II, the value of technical provisions is equal to
the sum of a best estimate and a risk margin.
The Best Estimate is determined as follows:
• First, all expected future insurance liability cash flows
and cash flows related to the management and claims
handling costs of insurance liabilities are estimated by
the company at best effort basis based on recognized
actuarial and statistical techniques.
• Second, all of these cash flows are discounted by the
risk-free interest rate term structure as defined and
published by EIOPA.
The best estimate is calculated separately on a gross
basis, without deduction of the amounts recoverable from
reinsurance contracts, and on a net basis by considering
the ceded amount representing amounts recoverable from
reinsurance contracts.
The above calculations of the best estimate are done
separately for each currency the company has insurance
liabilities in and the currency specific discount curve as
defined by EIOPA is used. This risk-free term structure
is based on market rates that are adjusted by credit risk
adjustment and by volatility adjustment. The use of
volatility adjustment is optional. This routine is followed
up to the last liquid point of market rates as defined by
EIOPA and it is defined separately for different currencies.
The last liquid point is for example 20 years for the euro
and 10 years for the Swedish krona. From the last liquid
point and ahead, being the last point on the curve based
on market rates, the risk-free term structure is affected by
the Ultimate Forward Rate (“UFR”) as defined by EIOPA.
The future expected cash flows of insurance activities are
always estimates and hence their magnitude and timing
are uncertain by their nature. For this uncertainty, and to
arrive at a market consistent valuation of the liabilities,
a company must consider the capital allocated for the
run-off of the liabilities. Risk Margin is the cost of this
capital and it is determined as follows.
• It is assumed that a company is hedging the market
risk related to insurance liabilities entirely and is not
writing any new business. Then all expected future cash
flows of insurance activities match exactly with risk free
asset cash flows in same currencies as insurance related
cash flows.
• With the market risk SCR at zero and no new business
being written, the company’s SCR is related to the
insurance risk, reinsurance credit risk and operational
risk.
• Since no new business is written, the cash flows behind
the best estimate will run off to zero over time. Based
on these cash flows, the company calculates the future
values of the best estimate and the resulting SCRs over
the full depletion of the insurance liabilities.
• All the resulting future SCR values are discounted to
one present value with the risk free-rate as defined by
EIOPA.
• Finally, to get the risk margin, the cost for holding the
SCR until full run-off of the best estimate is calculated
by multiplying the sum of the future SCRs by 6 per
cent – the cost of capital given by EIOPA.
Conceptual Differences between Solvency II and IFRS Technical Provisions
The main conceptual differences between Solvency II and
IFRS Technical Provisions affecting Sampo Group are:
• In Solvency II a “true best estimate” is defined as the
mean of the full range of possible future outcomes of
insurance cash flows without any cash flow add-ons
based on prudency. The IFRS provisions may include
prudential assumptions when the cash flows are
estimated.
SAMPO GROUP’S RISKSAND CORE RISK
MANAGEMENT ACTIVITIES
IF GROUP
SAMPO GROUP’SSTRUCTURE ANDBUSINESS MODEL
TOPDANMARKGROUP
SAMPO GROUPCAPITALIZATION
MANDATUM LIFEGROUP
RISK CONSIDERATIONSAT SAMPO GROUP LEVEL
AND SAMPO PLCAPPENDICES
RISK MANAGEMENT REPORT 2019 129

• In Solvency II, all cash flows are discounted by EIOPA's
risk free interest rates whereas within the financial
accounting regime not all cash flows are discounted,
and when discounting, discount rates based on local
regulations are typically used.
• The inclusion of future insurance events into Technical
Provisions is fundamentally different in Solvency II
and in financial accounting. The following points listed
are illustrating these differences, but local financial
accounting rules may be different than the ones used as
examples here.
– Following the financial accounting rules, when an
insurance company writes a premium, the full written
premium is booked into the reserves at the moment
of the writing. This reserve is called the Unearned
Premium Reserve (“UPR”) and its conceptual purpose
is to cover future insurance events on the written
contracts. After the initial booking, the reserve is
released linearly into earnings during the lifetime of
the insurance contract – at the end of the contract
period there is no UPR left and if the claims and costs
related to the contract turned out to be lower than the
written premium, a profit has been recognized.
– The corresponding component in the Solvency II
Technical Provisions is called the Premium Provision
(“PP”). This account estimates all the future insur-
ance events and the corresponding best estimate cash
flows related to contracts in force.
– The PP has a lower value than the UPR account if
the written contract is estimated to be profitable.
The higher the estimated profitability, the bigger the
difference between the accounts.
– Effectively, the PP implicitly recognizes the estimated
profit of the contract via the difference between
the UPR and the PP already at the inception of the
contract. This means that the younger the contract,
the bigger the difference between the UPR and the
PP. As time goes by, both accounts decrease in value
and the absolute difference between them becomes
narrower and eventually diminishes as the contract
expires and both accounts reach zero. In reality,
neither item never reaches zero in an active insurance
company since new business is written continuously.
Assuming that a company would write an equal
amount of exactly equal business each day, the
difference between the items would remain constant
over time.
– When a policy is written but no premiums are due
yet, the whole premium is already booked as UPR in
financial accounting and a corresponding receivable
is booked on the asset side. In Solvency II, any
insurance receivables that are not yet due are netted
against the PP account. This effectively means that
the balance sheet shrinks in size when going from
financial accounting to Solvency II and that the
difference between the UPR and the PP is the biggest
when premiums are not yet due.
– In non-life business, the valuation difference between
the UPR and the PP is the most material difference
between the financial accounting and Solvency II
Technical Provisions.
• A risk margin over the Best Estimate is included in the
Solvency II Technical provisions.
The nature of technical provisions means that there is
always uncertainty associated with the calculations since
they inevitably involve assumptions about future events.
Main risk factors affecting the reserve risk are described
further in section Non-Life Insurance Underwriting Risks
in Appendix 2 Risk Definitions.
Sampo Group’s insurance companies present the
differences between IFRS and Solvency II Technical
provisions in the next sections. Calculation methods,
made assumptions and other decisions affecting the cash
flows are described in more detail.
SAMPO GROUP’S RISKSAND CORE RISK
MANAGEMENT ACTIVITIES
IF GROUP
SAMPO GROUP’SSTRUCTURE ANDBUSINESS MODEL
TOPDANMARKGROUP
SAMPO GROUPCAPITALIZATION
MANDATUM LIFEGROUP
RISK CONSIDERATIONSAT SAMPO GROUP LEVEL
AND SAMPO PLCAPPENDICES
RISK MANAGEMENT REPORT 2019 130
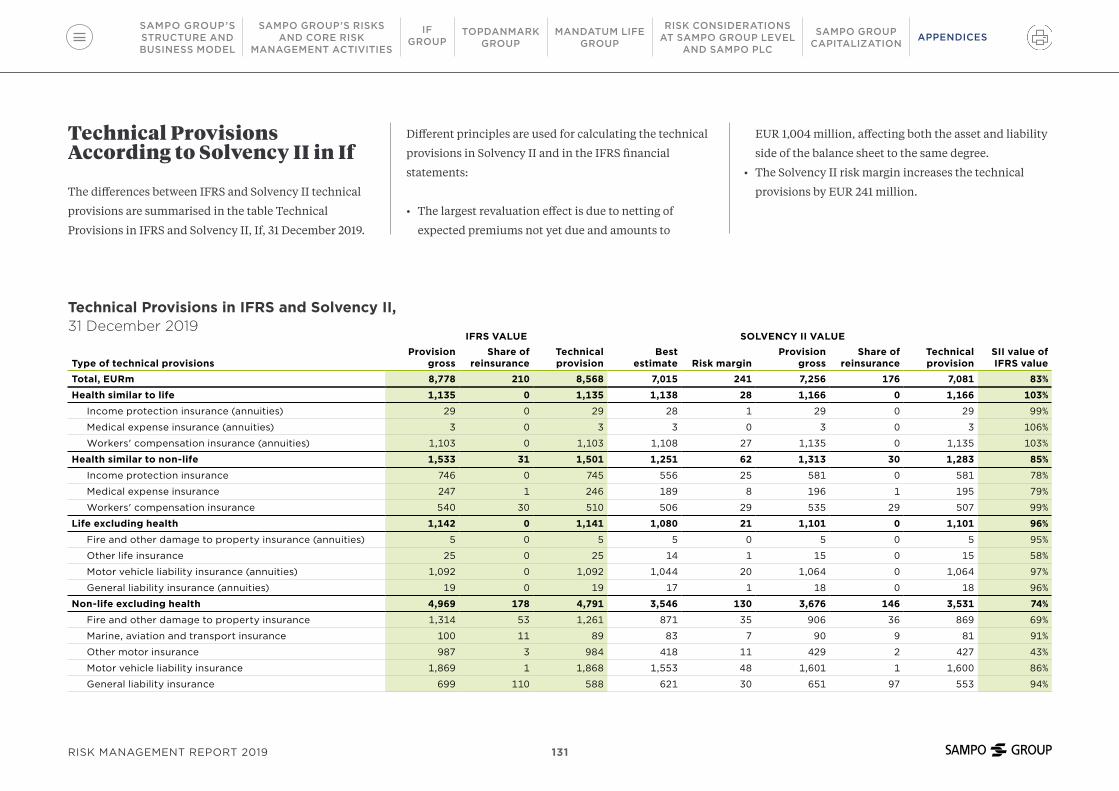
Technical Provisions According to Solvency II in If
The differences between IFRS and Solvency II technical
provisions are summarised in the table Technical
Provisions in IFRS and Solvency II, If, 31 December 2019.
Technical Provisions in IFRS and Solvency II,31 December 2019
IFRS VALUE SOLVENCY II VALUE
Type of technical provisionsProvision
grossShare of
reinsuranceTechnical provision
Best estimate Risk margin
Provision gross
Share of reinsurance
Technical provision
SII value of IFRS value
Total, EURm 8,778 210 8,568 7,015 241 7,256 176 7,081 83%
Health similar to life 1,135 0 1,135 1,138 28 1,166 0 1,166 103%
Income protection insurance (annuities) 29 0 29 28 1 29 0 29 99%
Medical expense insurance (annuities) 3 0 3 3 0 3 0 3 106%
Workers' compensation insurance (annuities) 1,103 0 1,103 1,108 27 1,135 0 1,135 103%
Health similar to non-life 1,533 31 1,501 1,251 62 1,313 30 1,283 85%
Income protection insurance 746 0 745 556 25 581 0 581 78%
Medical expense insurance 247 1 246 189 8 196 1 195 79%
Workers' compensation insurance 540 30 510 506 29 535 29 507 99%
Life excluding health 1,142 0 1,141 1,080 21 1,101 0 1,101 96%
Fire and other damage to property insurance (annuities) 5 0 5 5 0 5 0 5 95%
Other life insurance 25 0 25 14 1 15 0 15 58%
Motor vehicle liability insurance (annuities) 1,092 0 1,092 1,044 20 1,064 0 1,064 97%
General liability insurance (annuities) 19 0 19 17 1 18 0 18 96%
Non-life excluding health 4,969 178 4,791 3,546 130 3,676 146 3,531 74%
Fire and other damage to property insurance 1,314 53 1,261 871 35 906 36 869 69%
Marine, aviation and transport insurance 100 11 89 83 7 90 9 81 91%
Other motor insurance 987 3 984 418 11 429 2 427 43%
Motor vehicle liability insurance 1,869 1 1,868 1,553 48 1,601 1 1,600 86%
General liability insurance 699 110 588 621 30 651 97 553 94%
Different principles are used for calculating the technical
provisions in Solvency II and in the IFRS financial
statements:
• The largest revaluation effect is due to netting of
expected premiums not yet due and amounts to
EUR 1,004 million, affecting both the asset and liability
side of the balance sheet to the same degree.
• The Solvency II risk margin increases the technical
provisions by EUR 241 million.
SAMPO GROUP’S RISKSAND CORE RISK
MANAGEMENT ACTIVITIES
IF GROUP
SAMPO GROUP’SSTRUCTURE ANDBUSINESS MODEL
TOPDANMARKGROUP
SAMPO GROUPCAPITALIZATION
MANDATUM LIFEGROUP
RISK CONSIDERATIONSAT SAMPO GROUP LEVEL
AND SAMPO PLCAPPENDICES
RISK MANAGEMENT REPORT 2019 131
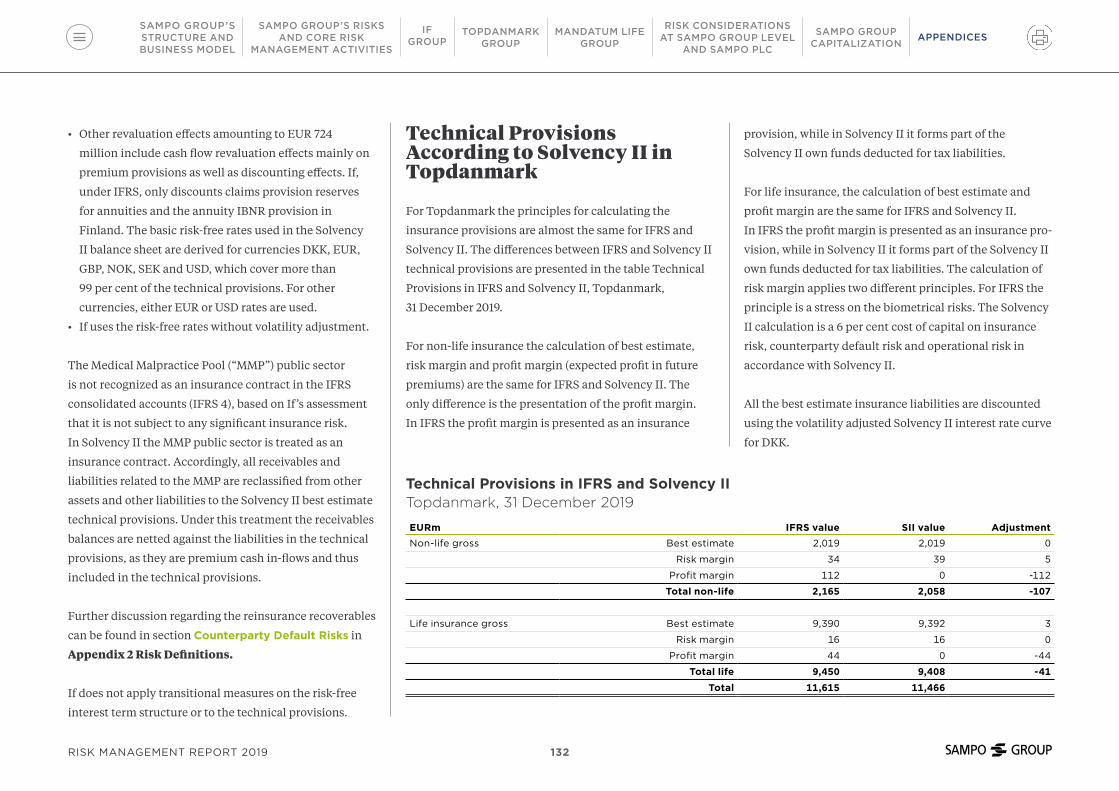
• Other revaluation effects amounting to EUR 724
million include cash flow revaluation effects mainly on
premium provisions as well as discounting effects. If,
under IFRS, only discounts claims provision reserves
for annuities and the annuity IBNR provision in
Finland. The basic risk-free rates used in the Solvency
II balance sheet are derived for currencies DKK, EUR,
GBP, NOK, SEK and USD, which cover more than
99 per cent of the technical provisions. For other
currencies, either EUR or USD rates are used.
• If uses the risk-free rates without volatility adjustment.
The Medical Malpractice Pool (“MMP”) public sector
is not recognized as an insurance contract in the IFRS
consolidated accounts (IFRS 4), based on If’s assessment
that it is not subject to any significant insurance risk.
In Solvency II the MMP public sector is treated as an
insurance contract. Accordingly, all receivables and
liabilities related to the MMP are reclassified from other
assets and other liabilities to the Solvency II best estimate
technical provisions. Under this treatment the receivables
balances are netted against the liabilities in the technical
provisions, as they are premium cash in-flows and thus
included in the technical provisions.
Further discussion regarding the reinsurance recoverables
can be found in section Counterparty Default Risks in
Appendix 2 Risk Definitions.
If does not apply transitional measures on the risk-free
interest term structure or to the technical provisions.
Technical Provisions According to Solvency II in Topdanmark
For Topdanmark the principles for calculating the
insurance provisions are almost the same for IFRS and
Solvency II. The differences between IFRS and Solvency II
technical provisions are presented in the table Technical
Provisions in IFRS and Solvency II, Topdanmark,
31 December 2019.
For non-life insurance the calculation of best estimate,
risk margin and profit margin (expected profit in future
premiums) are the same for IFRS and Solvency II. The
only difference is the presentation of the profit margin.
In IFRS the profit margin is presented as an insurance
provision, while in Solvency II it forms part of the
Solvency II own funds deducted for tax liabilities.
For life insurance, the calculation of best estimate and
profit margin are the same for IFRS and Solvency II.
In IFRS the profit margin is presented as an insurance pro-
vision, while in Solvency II it forms part of the Solvency II
own funds deducted for tax liabilities. The calculation of
risk margin applies two different principles. For IFRS the
principle is a stress on the biometrical risks. The Solvency
II calculation is a 6 per cent cost of capital on insurance
risk, counterparty default risk and operational risk in
accordance with Solvency II.
All the best estimate insurance liabilities are discounted
using the volatility adjusted Solvency II interest rate curve
for DKK.
Technical Provisions in IFRS and Solvency IITopdanmark, 31 December 2019
EURm IFRS value SII value AdjustmentNon-life gross Best estimate 2,019 2,019 0
Risk margin 34 39 5
Profit margin 112 0 -112
Total non-life 2,165 2,058 -107
Life insurance gross Best estimate 9,390 9,392 3
Risk margin 16 16 0
Profit margin 44 0 -44
Total life 9,450 9,408 -41
Total 11,615 11,466
SAMPO GROUP’S RISKSAND CORE RISK
MANAGEMENT ACTIVITIES
IF GROUP
SAMPO GROUP’SSTRUCTURE ANDBUSINESS MODEL
TOPDANMARKGROUP
SAMPO GROUPCAPITALIZATION
MANDATUM LIFEGROUP
RISK CONSIDERATIONSAT SAMPO GROUP LEVEL
AND SAMPO PLCAPPENDICES
RISK MANAGEMENT REPORT 2019 132

Technical Provisions According to Solvency II in Mandatum Life
To calculate Solvency II technical provision
Mandatum Life produces the cash flows of insurance
policies by using best estimate parameters and
assumptions and stochastic investment market scenarios
consistent with Solvency II discount rate. Stochastic
market scenarios are particularly needed for the valuation
of economic guarantees and policyholder options
embedded in insurance contracts. Probability weighted
present value of these cash flows is so called best estimate
liability. Solvency II technical provision is best estimate
liability plus risk margin.
The differences between IFRS and Solvency II technical
provisions with transitional measures are summarised in
the table Technical provisions in IFRS and Solvency II,
Mandatum Life, 31 December 2019.
Mandatum Life applies the transitional measures on
technical provisions for its Solvency II technical provision
regarding its original pension policies with 3.5 per cent
and 4.5 per cent guarantees. Also, a volatility adjustment
is applied when technical provisions are calculated. The
size of Solvency II liabilities with transitional measures
is EUR 11,374 million and EUR 11,826 million without
transitional measures. Hence the transitional measures
on technical provisions increase the amount of OF after
tax by EUR 361 million. Mandatum Life applies standard
Technical Provisions in IFRS and Solvency IIMandatum Life, 31 December 2019
EURm IFRS value Solvency II value AdjustmentTechnical provisions – life (excluding unit-linked) 3,925 3,765 160
Best estimate 3,572
Risk margin 193
Technical provisions – unit-linked 8,117 7,609 508
Best estimate 7,497
Risk margin 112
formula without undertaking-specific parameters or
simplified calculations.
Accounting principles of life insurance contracts
are presented in Sampo’s Annual Report/Financial
Statements/Notes to the accounts/Summary of significant
accounting policies/Life insurance business.
Other Liabilities
The effects of Solvency II valuation on Sampo’s other
liabilities than technical provisions are fairly limited,
consisting mainly of the valuation impact on financial
liabilities and payables balances related to the technical
provisions.
Other liabilities than technical provisions are valued by
discounting future cash flows with the government yield
plus calculated spread at inception. This increased the
amount of financial liabilities in Solvency II balance sheet
by EUR 190 million.
Deferred tax liabilities are discussed above in connection
with deferred tax assets.
The reclassification of medical malpractice pool public
sector from a service contract to an insurance contract
effect also payables balances. Payables of EUR 69 million
are reclassified from trade payables to the insurance
obligations.
Other provisions than technical provisions and
contingent liabilities do not give any additional rise
to either new liabilities being recognized for solvency
purposes or existing liabilities being recognized
differently to their financial statement recognition.
Provisions, pension benefits as well as contingent
liabilities and commitments including operating
leases are presented in Sampo’s Financial Statements
(www.sampo.com/year2019). There are no major
financial leasing arrangements in Sampo Group.
SAMPO GROUP’S RISKSAND CORE RISK
MANAGEMENT ACTIVITIES
IF GROUP
SAMPO GROUP’SSTRUCTURE ANDBUSINESS MODEL
TOPDANMARKGROUP
SAMPO GROUPCAPITALIZATION
MANDATUM LIFEGROUP
RISK CONSIDERATIONSAT SAMPO GROUP LEVEL
AND SAMPO PLCAPPENDICES
RISK MANAGEMENT REPORT 2019 133

Sampo plcFabianinkatu 2700100 Helsinki, Finland
Phone: +358 10 516 0100Business ID: 0142213-3
www.sampo.com @Sampo_plc @sampo_oyj sampo-plc
2019