international conference and of changing risks for natural
TRANSCRIPT

International Conference
Analysis and Management of Changing Risks for Natural Hazards 18‐19 November 2014 l Padua, Italy
DO3 ‐ 1
Abstract code: D03 Analysing changes in landslide risk using multi temporal landslide susceptibility and run-out modeling on a regional scale Haydar Hussin1, Lixia Chen1, Roxana Ciurean2, Cees van Westen1, Paola Reichenbach3
, Simone Sterlacchini4
1 Faculty of Geo-Information Science and Earth Observation (ITC), University of Twente, Enschede, Netherlands 2 Department of Geography and Regional Research, Geomorphic Systems and Risk Research Unit, University of Vienna, Vienna, Austria 3 CNR IRPI, via Madonna Alta 126, 06128 Perugia, Italy 4 CNR IDPA, Milano, Italy Corresponding author details: Haydar Hussin, Faculty of Geo-Information Science and Earth Observation (ITC), University of Twente, Enschede, Netherlands; email: [email protected] Keywords (10 words max): Landslide susceptibility, debris flows, run-out modeling, landslide risk assessment INTRODUCTION Landslide risk is not a static concept but changes continuously in time due to changes in triggering factors (e.g. climate change, earthquake occurrences, etc.), landslide conditional factors (e.g. land-use, geomorphology, etc.) and due to changes in elements at risk (e.g. location, vulnerability, value, etc.). The challenge of addressing the change in quantitative landslide risk requires the availability and application of multi-temporal data to recalculate the risk as it changes in time and space. In August of 2003 a major rainfall event triggered more than one thousand debris flows in the Fella River Basin (Eastern Italian Alps) destroying many houses and road networks with damages exceeding € 70 million. In this research we have modelled multi-temporal changes in landslide risk on a medium to regional scale by analysing the debris flow inventory from 1996 to 2011, using multi-temporal DEMs (pre- and post-2003 disaster) and creating multi-temporal hazard models for both triggering areas and landslide run-out. Landslide risk was assessed for four different periods: (1) pre-August 2003 disaster, (2) the August 2003 event, (3) post-August 2003 to 2011 and (4) smaller frequent events occurring between the entire 1996 and 2011 period. STUDY AREA The Fella River study area is 247 km2 in size and located in the Eastern Italian Alps (Fig 1). Land cover consists of predominately forested areas, followed by substantial areas of bare surface and grasslands, with the urban areas located along the valley bottoms and on alluvial fans (Malek et al., 2014). The geology is made up of Permian and Triassic rocks consisting of mainly dolomite, limestone and calcareous-marls. Quaternary deposits are found across the study area in the form of debris screes, glacial and alluvial deposits. The basin is structurally made up of two main valleys, the east-west Val Canale and the north-south Canal del Ferro, which are tectonically part of the Fella-Sava and Dogna fault lines, respectively. The elevation ranges from 400 to 2750 m.a.s.l., with a mean slope value of 33°. Multiple systems of monoclines, bends and faulting have caused extreme fracturing of bedrocks and outcropping of calcareous dolomitic sequences. This has led to the formation

International Conference
Analysis and Management of Changing Risks for Natural Hazards 18‐19 November 2014 l Padua, Italy
DO3 ‐ 2
of very steep talus and scree slopes producing large amounts of debris stored within many secondary streams and debris flow channels flowing towards the Fella River.
Figure 1.The Fella River Basin study area located in the North Eastern Italian Alps LANDSLIDE INVENTORY AND TEMPORAL PROBABILITY In this research we focus on debris flows that have caused the most severe damages to people and property, and for this reason being the landslide type with the highest risk in the Fella River area. The historic debris flow inventory was produced through the analysis of historic archives and interpretation of aerial and satellite imagery between 1996 and 2011 by the Italian Landslide
AVI (CNR-IRPI, 2014) and IFFI projects (ISPRA, 2014), the Geological Service of the Friuli-Venezia Giulia region (FVG) and landslide experts at University of Trieste. The inventory consists of 273 debris flow source area points and run-out polygons mainly located on the south and north facing slopes of the Val Canale valley. By using rainfall data available from 1976 to 2011, the return periods were determined for three different time periods using the extreme value distribution analysis. The pre-August 2003 disaster period consists of debris flows from 1996 is concidered a “moderate” event with a return period ranging between 25 to 100 years, the August 2003 disaster was classified as a “major” event with a return period ranging from 100 to 500 years. The post-August 2003 period consists of debris flows which occurred until 2011 and are concidered part of a “minor” event with a return period of 10 to 25 years. Finally the smaller “frequent” events occurring between 1996 and 2011 have a return period of 1 to 10 years. The range in the scenarios is based on the 80% confidence interval and as the return period becomes longer, the uncertainty increases. LANDSLIDE SUSCEPTIBILITY ASSESSMENT The Digital Elevation Model (DEM) of the Fella River Basin was acquired from airborne laser scanning by the Civil Protection of the Friuli-Venezia Giulia region in 2003. The DEM has a pixel resolution of 10 m, which is the pixel dimension used for all the causative factor maps and the susceptibility zonation. A second 10m DEM was available from a 2007 laser scanning of the area which was used for all post-2003 susceptibility and run-out modeling. According to a previous study (Hussin et al., 2013), five causative landslide factor maps (lithology, land-cover, altitude, plan curvature and slope) were used in the susceptibility analysis for debris flow initiation. The lithological map available at a scale of 1:150,000 was produced by the FVG Geological Service and originally contains more than 35 classes, which were reclassified in 8 classes. The land-cover map at 1:100,000 scale was developed by the CORINE land cover project and later updated by the MOLAND project . The map with more than 30 classes was generalized to 7 classes based on similarities in land cover types. Both geo-environmental factor maps were rasterized using a 10 m grid resolution. The three

International Conference
Analysis and Management of Changing Risks for Natural Hazards 18‐19 November 2014 l Padua, Italy
DO3 ‐ 3
factors derived from the DEM were classified into 10 quantile classes. The quantile classification has been applied in several landslide susceptibility studies (Castellanos Abella et al., 2008, Blahut et al., 2010b) and is useful to proportionately distribute rank-ordered data to better study the influence of factors on landslide occurrence. Once all factors were classified, they could then be used as input into the susceptibility model. The landslide susceptibility maps were modelled using the statistical Weights-of-Evidence (WofE) methodology. The WofE technique was originally developed for quantitative mineral potential mapping to predict the location of possible gold deposits (Bonham-Carter et al., 1988, Bonham-Carter et al., 1989). However, it has been successfully applied in many landslide susceptibility assessments (van Westen et al., 2003, Thiery et al., 2007, Süzen and Doyuran, 2004, Blahut et al., 2010b) and is based on the assumption that factors causing landslides in the past will determine the spatial occurrence of future landslide initiation in areas currently free of landslides. The WofE method also assumes independence between the different causative factors. A probabilistic Bayesian approach is applied to determine the conditional probability between the presence/absence of each causative factor and the presence/absence of a landslide. In this way, the influence of a landslide causative factor is weighted based on the occurrence of landslides in a certain explanatory variable class. By combining the positive and negative weights of the different factor maps, a final landslide susceptibility map is produced that contains the relative spatial probability of the occurrence of landslides.
Figure 2. Fella River debris flow susceptibility map of the “major” event return period with 5 equal area classes (VL: very low, L: low, M: medium, H: high, VH: very high). The calculation of weight tables for each factor and the subsequent susceptibility mapping was carried out using the Weights-of-Evidence Arc-SDM (Spatial Data Modeller) (Sawatzky et al., 2009) geoprocessing tools in ArcGIS 10. Arc-SDM Weights-of-Evidence tools were used within the Arc-GIS model builder and combined with the batch processing tool to automate the susceptibility modeling process. Finally, the susceptibility map was classified into 5 equal-area classes: very low (VL), low (L), medium (M), high (H), very high (VH) (Fig 2). Four different landslide susceptibility maps were produced using landslides from each return period scenario. The accuracy of the best performing susceptibility map (August 2003 “major” event) was 89.2%, based on the area under the success rate curve (AUSRC) and is concidered a good model performance value.
International Conference
Analysis and Management of Changing Risks for Natural Hazards 18‐19 November 2014 l Padua, Italy
DO3 ‐ 4
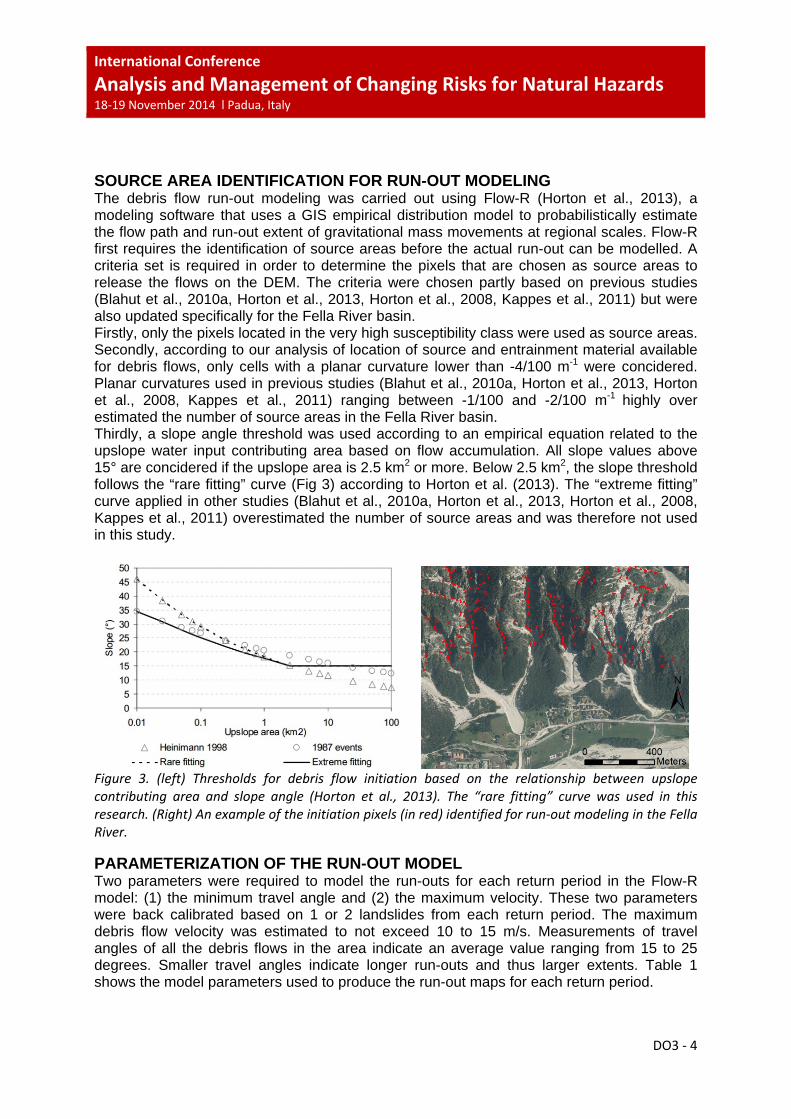
SOURCE AREA IDENTIFICATION FOR RUN-OUT MODELING The debris flow run-out modeling was carried out using Flow-R (Horton et al., 2013), a modeling software that uses a GIS empirical distribution model to probabilistically estimate the flow path and run-out extent of gravitational mass movements at regional scales. Flow-R first requires the identification of source areas before the actual run-out can be modelled. A criteria set is required in order to determine the pixels that are chosen as source areas to release the flows on the DEM. The criteria were chosen partly based on previous studies (Blahut et al., 2010a, Horton et al., 2013, Horton et al., 2008, Kappes et al., 2011) but were also updated specifically for the Fella River basin. Firstly, only the pixels located in the very high susceptibility class were used as source areas. Secondly, according to our analysis of location of source and entrainment material available for debris flows, only cells with a planar curvature lower than -4/100 m-1 were concidered. Planar curvatures used in previous studies (Blahut et al., 2010a, Horton et al., 2013, Horton et al., 2008, Kappes et al., 2011) ranging between -1/100 and -2/100 m-1 highly over estimated the number of source areas in the Fella River basin. Thirdly, a slope angle threshold was used according to an empirical equation related to the upslope water input contributing area based on flow accumulation. All slope values above 15° are concidered if the upslope area is 2.5 km2 or more. Below 2.5 km2, the slope threshold follows the “rare fitting” curve (Fig 3) according to Horton et al. (2013). The “extreme fitting” curve applied in other studies (Blahut et al., 2010a, Horton et al., 2013, Horton et al., 2008, Kappes et al., 2011) overestimated the number of source areas and was therefore not used in this study.
Figure 3. (left) Thresholds for debris flow initiation based on the relationship between upslope contributing area and slope angle (Horton et al., 2013). The “rare fitting” curve was used in this research. (Right) An example of the initiation pixels (in red) identified for run‐out modeling in the Fella River.
PARAMETERIZATION OF THE RUN-OUT MODEL Two parameters were required to model the run-outs for each return period in the Flow-R model: (1) the minimum travel angle and (2) the maximum velocity. These two parameters were back calibrated based on 1 or 2 landslides from each return period. The maximum debris flow velocity was estimated to not exceed 10 to 15 m/s. Measurements of travel angles of all the debris flows in the area indicate an average value ranging from 15 to 25 degrees. Smaller travel angles indicate longer run-outs and thus larger extents. Table 1 shows the model parameters used to produce the run-out maps for each return period.

International Conference
Analysis and Management of Changing Risks for Natural Hazards 18‐19 November 2014 l Padua, Italy
DO3 ‐ 5
Table 1 Parameters obtain from back analysis of landslides from each return period
Scenario (return period) Travel angle (°) Velocity (m/s) Major (100-500 yrs) 13 15
Moderate (25-100 yrs) 15 10 Minor (10-25 yrs) 17 8
Frequent (1-10 yrs) 20 5 Finally, source area points were added of past debris flow events from 4 different return periods which were determined from historic landslide and rainfall data. The 4 different return periods are: (1) 1-10 years (frequent events), (2) 10-25 years (minor events), (3) 25-100 years (moderate events) and (4) 100-500 years (major events). Therefore a total of 4 different source area maps were produced which included source areas from the different return periods and included all the points based on the criteria mentioned previously. LANDSLIDE HAZARD INTENSITY The outputs of the Flow-R run-out model were kinetic energy and maximum run-out probability maps for each scenario in 10m pixel resolution. The kinetic energy was not useful to use because the shift from maximum energy to zero at the debris fans was abrupt and unrealistic. Therefore, we decided to analyse the use of the run-out probability maps. However, due to the probabilities not being actual intensity values, methods were required to convert the probabilities into useful intensities for a quantitative hazard assessment at a regional scale. Two methods were used to transfer probability values into debris flow intensities: (1) transfer functions for probability vs. debris flow impact pressure and (2) the relationship between probability vs. debris flow height.
Figure 4. (Left) Flow‐R probability to impact pressure transfer functions for each return period (IP = impact pressure, Pr = probability). (Right) Impact pressures modelled at the Malborghetto village, Fella River area.
The first method is based on two factors: (1) the spatial distribution and variation of the probability values within the debris flow morphology (from the debris flow channels and transportation zones to the end of the deposit zones at the debris fans) and (2) the estimated impact pressures in the field based on damage assessments of past events. The maximum impact pressure found in the most extreme event with the longest return period (100-500y) was 35 KPa, which caused the total destruction of several houses. Therefore, the maximum impact pressure for all other return periods did not exceed 35 KPa and is concidered a cut-off value. Figure 4 shows the run-out probability – impact pressure transfer functions. As the severity for events with longer return periods increases, so does the impact pressure. Therefore, each return period is assigned a different transfer curve. A run-out probability of 0.5 gives an impact pressure of 35 KPa for a major event, while the same probability for a frequent event will have an impact pressure of 17.5 KPa.
International Conference
Analysis and Management of Changing Risks for Natural Hazards 18‐19 November 2014 l Padua, Italy
DO3 ‐ 6
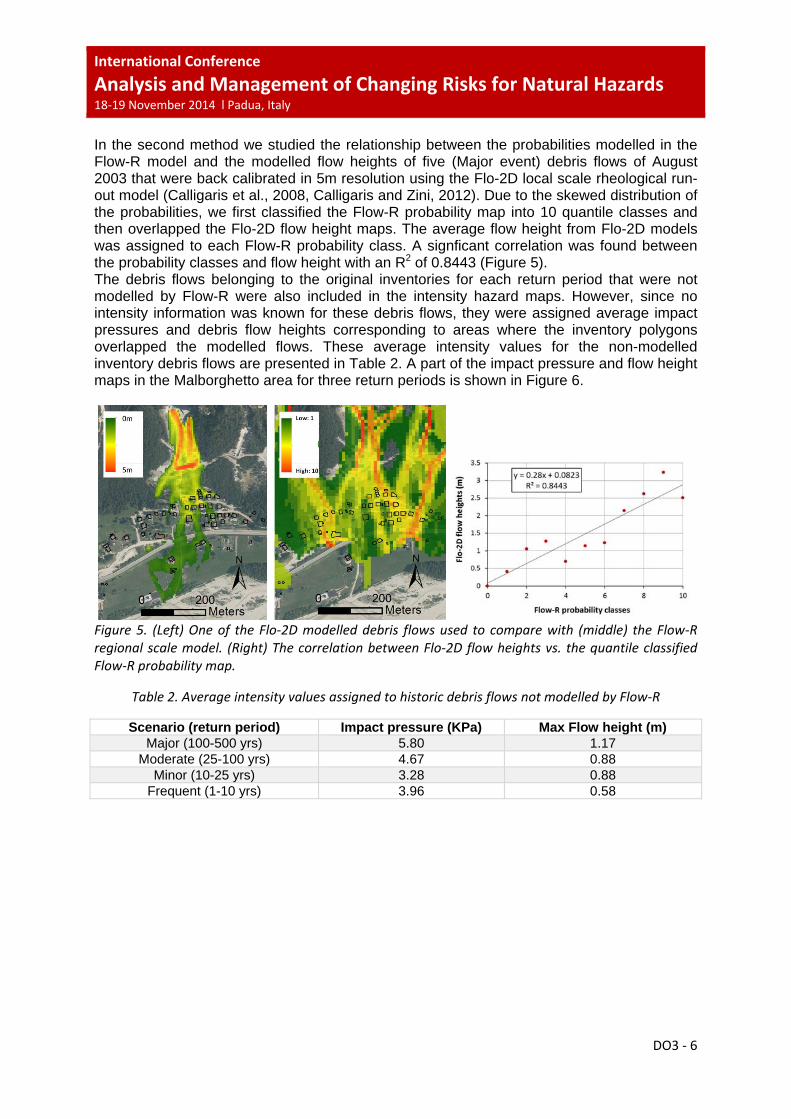
In the second method we studied the relationship between the probabilities modelled in the Flow-R model and the modelled flow heights of five (Major event) debris flows of August 2003 that were back calibrated in 5m resolution using the Flo-2D local scale rheological run-out model (Calligaris et al., 2008, Calligaris and Zini, 2012). Due to the skewed distribution of the probabilities, we first classified the Flow-R probability map into 10 quantile classes and then overlapped the Flo-2D flow height maps. The average flow height from Flo-2D models was assigned to each Flow-R probability class. A signficant correlation was found between the probability classes and flow height with an R2 of 0.8443 (Figure 5). The debris flows belonging to the original inventories for each return period that were not modelled by Flow-R were also included in the intensity hazard maps. However, since no intensity information was known for these debris flows, they were assigned average impact pressures and debris flow heights corresponding to areas where the inventory polygons overlapped the modelled flows. These average intensity values for the non-modelled inventory debris flows are presented in Table 2. A part of the impact pressure and flow height maps in the Malborghetto area for three return periods is shown in Figure 6.
Figure 5. (Left) One of the Flo‐2D modelled debris flows used to compare with (middle) the Flow‐R regional scale model. (Right) The correlation between Flo‐2D flow heights vs. the quantile classified Flow‐R probability map.
Table 2. Average intensity values assigned to historic debris flows not modelled by Flow‐R
Scenario (return period) Impact pressure (KPa) Max Flow height (m) Major (100-500 yrs) 5.80 1.17
Moderate (25-100 yrs) 4.67 0.88 Minor (10-25 yrs) 3.28 0.88
Frequent (1-10 yrs) 3.96 0.58
International Conference
Analysis and Management of Changing Risks for Natural Hazards 18‐19 November 2014 l Padua, Italy
DO3 ‐ 7
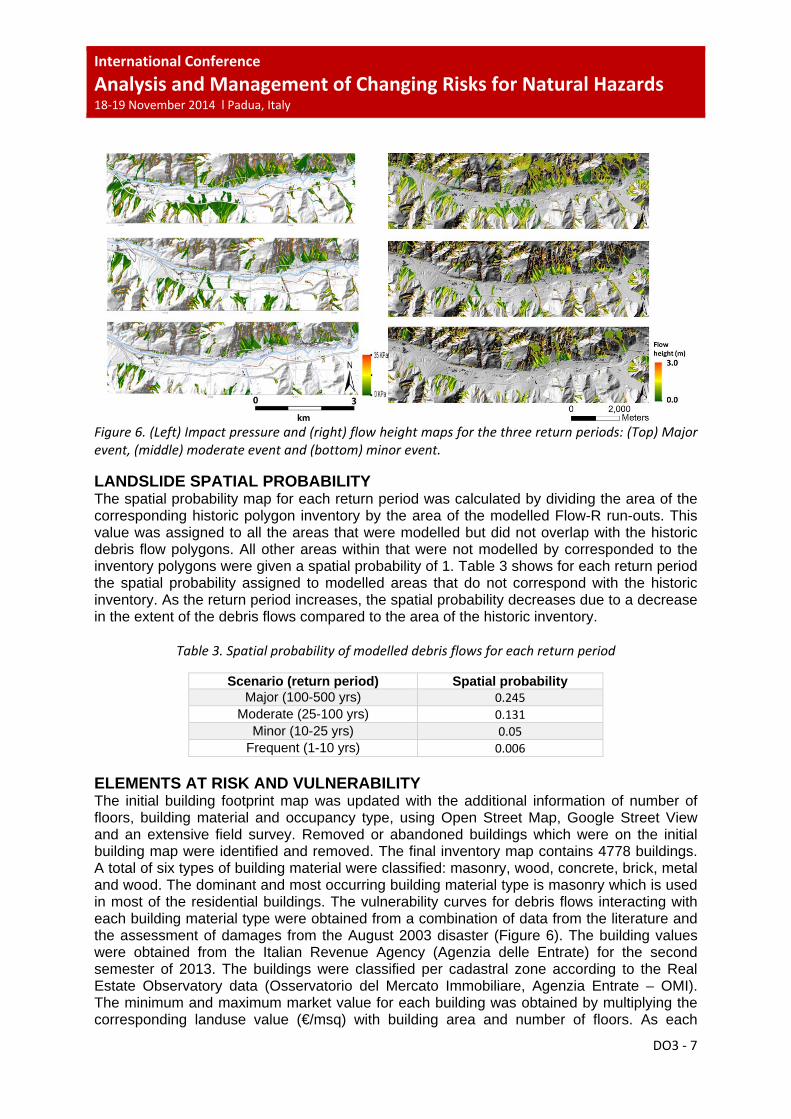
Figure 6. (Left) Impact pressure and (right) flow height maps for the three return periods: (Top) Major event, (middle) moderate event and (bottom) minor event.
LANDSLIDE SPATIAL PROBABILITY The spatial probability map for each return period was calculated by dividing the area of the corresponding historic polygon inventory by the area of the modelled Flow-R run-outs. This value was assigned to all the areas that were modelled but did not overlap with the historic debris flow polygons. All other areas within that were not modelled by corresponded to the inventory polygons were given a spatial probability of 1. Table 3 shows for each return period the spatial probability assigned to modelled areas that do not correspond with the historic inventory. As the return period increases, the spatial probability decreases due to a decrease in the extent of the debris flows compared to the area of the historic inventory.
Table 3. Spatial probability of modelled debris flows for each return period
Scenario (return period) Spatial probability Major (100-500 yrs) 0.245
Moderate (25-100 yrs) 0.131 Minor (10-25 yrs) 0.05
Frequent (1-10 yrs) 0.006 ELEMENTS AT RISK AND VULNERABILITY The initial building footprint map was updated with the additional information of number of floors, building material and occupancy type, using Open Street Map, Google Street View and an extensive field survey. Removed or abandoned buildings which were on the initial building map were identified and removed. The final inventory map contains 4778 buildings. A total of six types of building material were classified: masonry, wood, concrete, brick, metal and wood. The dominant and most occurring building material type is masonry which is used in most of the residential buildings. The vulnerability curves for debris flows interacting with each building material type were obtained from a combination of data from the literature and the assessment of damages from the August 2003 disaster (Figure 6). The building values were obtained from the Italian Revenue Agency (Agenzia delle Entrate) for the second semester of 2013. The buildings were classified per cadastral zone according to the Real Estate Observatory data (Osservatorio del Mercato Immobiliare, Agenzia Entrate – OMI). The minimum and maximum market value for each building was obtained by multiplying the corresponding landuse value (€/msq) with building area and number of floors. As each

International Conference
Analysis and Management of Changing Risks for Natural Hazards 18‐19 November 2014 l Padua, Italy
DO3 ‐ 8
building in the inventory has a minimum and a maximum value assigned, it was possible to calculate the variation in price for buildings grouped per value range.
Figure 7. Debris flow vulnerability curves for (left) debris flow heights and (right) debris flow impact pressures for 3 building material types.
RISK ANALYSIS The risk was finally calculated by multiplying the vulnerability with the spatial probability and the building values. The estimated number of buildings exposed and the estimated losses for each return period is shown in Table 4. According to the risk curve in Figure 8, the total annual risk for the impact pressure and flow height method is € 540,955.00 and € 957,073.00 respectively. Table 4 Number of buildings exposed to the debris flow hazard and the estimated losses for each return period and for the two different hazard intensity methods modelled
Scenario (return period) Nr. of buildings exposed by impact pressure method
Nr. of buildings exposed by flow height method
Major (100-500 yrs) 793 894 Moderate (25-100 yrs) 305 354
Minor (10-25 yrs) 104 137 Frequent (1-10 yrs) 7 13
Scenario (return period) Loss estimation using impact pressure method (€)
Loss estimation using flow height method (€)
Major (100-500 yrs) 8,419,805.00 13,814,077.00 Moderate (25-100 yrs) 2,099,087.00 2,534,626.00
Minor (10-25 yrs) 733,166.00 1,480,373.00 Frequent (1-10 yrs) 12,517.00 23,061.00

International Conference
Analysis and Management of Changing Risks for Natural Hazards 18‐19 November 2014 l Padua, Italy
DO3 ‐ 9
Figure 8. Risk curves (Probability of return period vs estimated losses) for both hazard intensity methods.
DISCUSSION AND CONCLUSIONS In this study, we have been able to convert probabilities of a regional scale landslide run-out model into estimated intensity values by studying the relationship between the outputs of the Flow-R regional scale model with that of the more accurate Flo-2D local scale model. There are uncertainties in this analysis, especially when comparing two different models that have different outputs and spatial resolutions. However, a significant correlation was found between the two models, which gave us the opportunity to further explore this method. Signficant differences were found in the number of exposed buildings and economic losses between the two different intensity methods used. The impact pressure transfer function method seems to underestimate the intensity interacting with the buildings when compared to the flow height method. This is most likely due to uncertainties in the transfer functions and due to the distribution of the Flow-R probabilities, which is heavily skewed to the very low probabilities when reaching the debris fans. This skewness in the Flow-R probability distribution throught-out the study area needs to be taken into account when attempting to make the step towards estimating the hazard intensity on a regional scale. The flow height correlation method does take the distribution into account by properly classifying the probability distribution and thankfully due to the number of debris flows (a total of five) that were modelled on the local scale using Flo-2D. These local scale models gave us a good representation to make the correlation with the regional scale model. A single debris flow run-out model on a local scale would not have been enough to make the correlation. When chronologically looking at the change in risk in time, we see that the risk before the August 2003 disaster is concidered to be “moderate” with an estimated loss ranging between € 2.0 and 2.5 million. When the August 2003 event occurs, the risk is increased by four folds, with a loss estimation of more than € 13 million just on building damages. This is due to the number of debris flows but also due to the severe magnitude of the event. Once the major disaster had passed, the estimated risk post-August 2003 was calculated to be even less than pre-disaster times, with an estimated maximum loss of € 1.48 million. This indicates the importance of calculating risk after a few years of a major event in order not to overestimate or exaggerate future expected losses. It is also natural that after a major disaster, it will take longer for the debris flow channels to recharge their sediment, thereby decreasing the risk after such an event. Finally, by modeling the post-August 2003 scenario using the latest 2007 DEM, we have included the new mitigation measures which directly affected the direction and intensity of the modelled debris flows. The recalculation of risk after the

International Conference
Analysis and Management of Changing Risks for Natural Hazards 18‐19 November 2014 l Padua, Italy
DO3 ‐ 10
implementation of risk reduction methods is therefore important to estimate the benefits of these measures and to further obtain a more accurate estimation of future losses. ACKNOWLEDGEMENTS This work has been carried out within the framework of two European FP7 funded projects: CHANGES - Changing Hydro-meteorological Risks as Analyzed by a New Generation of European Scientists (grant agreement No. 263953) and INCREO – Increasing Resilience through Earth Observation (grant agreement No. 312461). Special thanks go to Dr. Simone Frigerio (CNR-IRPI, Padova) for data compilation and organization and to Dr. Chiara Calligaris (University of Trieste) for sharing her landslide models and expert knowledge on the area. REFERENCES BLAHUT, J., HORTON, P., STERLACCHINI, S. & JABOYEDOFF, M. 2010a. Debris flow hazard modelling
on medium scale: Valtellina di Tirano, Italy. Nat. Hazards Earth Syst. Sci., 10, 2379‐2390. BLAHUT, J., VAN WESTEN, C. J. & STERLACCHINI, S. 2010b. Analysis of landslide inventories for
accurate prediction of debris‐flow source areas. Geomorphology, 119, 36‐51. BONHAM‐CARTER, G. F., AGTERBERG, F. P. & WRIGHT, D. F. 1988. Integration of geological datasets
for gold exploration in Nova Scotia. Photogrammetric Engineering and Remote Sensing, 54, 1585‐1592.
BONHAM‐CARTER, G. F., AGTERBERG, F. P. & WRIGHT, D. F. Weights of evidence modelling: a new approach to mapping mineral potential. In: AGTERBERG, D. F. & BONHAM‐CARTER, G. F., eds. Statistical Applications in Earth Sciences, 1989 Ottowa. Geological Survey of Canada.
CALLIGARIS, C., BONIELLO, M. A. & ZINI, L. 2008. Debris flow modelling in Julian Alps using FLO‐2D. In: DE WRACHIEN, D., BREBBIA, C. A. & LENZI, M. A. (eds.) Monitoring, simulation, prevention and remediation of dense and debris flows II. Southhampton, UK: Witpress.
CALLIGARIS, C. & ZINI, L. 2012. Debris Flow Phenomena: A Short Overview? In: DAR, I. A. (ed.) Earth Sciences. Croatia: INTECH.
CASTELLANOS ABELLA, E. A., DE JONG, S. M., VAN WESTEN, C. J. & VAN ASCH, T. W. J. 2008. Multi ‐ scale landslide risk assessment in Cuba. ITC PhD Dissertation 154, . ITC Enschede, University of Utrecht, Utrecht.
CNR‐IRPI. 2014. AVI Project [Online]. Available: http://avi.gndci.cnr.it/en/archivi/frane_en.htm. HORTON, P., JABOYEDOFF, M. & BARDOU, E. 2008. Debris flow susceptibility mapping at a regional
scale. 4th Canadian Conference on Geohazards, 399‐406. HORTON, P., JABOYEDOFF, M., RUDAZ, B. & ZIMMERMANN, M. 2013. Flow‐R, a model for
susceptibility mapping of debris flows and other gravitational hazards at a regional scale. Nat. Hazards Earth Syst. Sci., 13, 869‐885.
HUSSIN, H. Y., ZUMPANO, V., STERLACCHINI, S., REICHENBACH, P., BÃLTEANU, D., MICU, M., BORDOGNA, G. & CUGINI, M. 2013. Comparing the predictive capability of landslide susceptibility models in three different study areas using the Weights of Evidence technique. Geophysical Research Abstracts, Vol. 15, EGU2013‐12701‐1.
ISPRA. 2014. The IFFI project (Inventory of Landslide Phenomena in Italy) [Online]. Available: http://www.isprambiente.gov.it/en/projects/iffi‐project.
KAPPES, M. S., MALET, J. P., REMAÎTRE, A., HORTON, P., JABOYEDOFF, M. & BELL, R. 2011. Assessment of debris‐flow susceptibility at medium‐scale in the Barcelonnette Basin, France. Nat. Hazards Earth Syst. Sci., 11, 627‐641.
MALEK, Ž., SCOLOBIG, A. & SCHRÖTER, D. 2014. Understanding Land Cover Changes in the Italian Alps and Romanian Carpathians Combining Remote Sensing and Stakeholder Interviews. Land, 3, 52‐73.

International Conference
Analysis and Management of Changing Risks for Natural Hazards 18‐19 November 2014 l Padua, Italy
DO3 ‐ 11
SAWATZKY, D. L., RAINES, G. L., BONHAM‐CARTER, G. F. & LOONEY, C. G. 2009. Spatial Data Modeller (SDM): ArcMAP 9.3 geoprocessing tools for spatial data modelling using weights of evidence, logistic regression, fuzzy logic and neural networks [Online]. Available: http://arcscripts.esri.com/details.asp?dbid=15341.
SÜZEN, M. L. & DOYURAN, V. 2004. Data driven bivariate landslide susceptibility assessment using geographical information systems: a method and application to Asarsuyu catchment, Turkey. Engineering Geology, 71, 303‐321.
THIERY, Y., MALET, J. P., STERLACCHINI, S., PUISSANT, A. & MAQUAIRE, O. 2007. Landslide susceptibility assessment by bivariate methods at large scales: Application to a complex mountainous environment. Geomorphology, 92, 38‐59.
VAN WESTEN, C. J., RENGERS, N. & SOETERS, R. 2003. Use of Geomorphological Information in Indirect Landslide Susceptibility Assessment. Natural Hazards, 30, 399‐419.