balancing risks in a changing market
TRANSCRIPT

Author:
Digitally Transforming the Mortgage Banking Industry (Amazon #1 Best Selling New Release, February 2018)
Strategically Transforming the Mortgage Banking Industry (Amazon #1 Best Selling New Release, October 2018)
Disruptive Fintech: The Coming Wave of Innovation (coming October 2019, published by De Gruyter Press)
Balancing Risks in a Changing Market

Balancing Risks in a Changing MarketData Driven Strategy and Leadership
Our time together today:
• Risk Management, Quality Assurance and Fraud Prevention from a Data Driven Perspective
• Strategic Transformation in Risk Management as an Ongoing Response
• Examples Generally and Industry Specific for Your Consideration
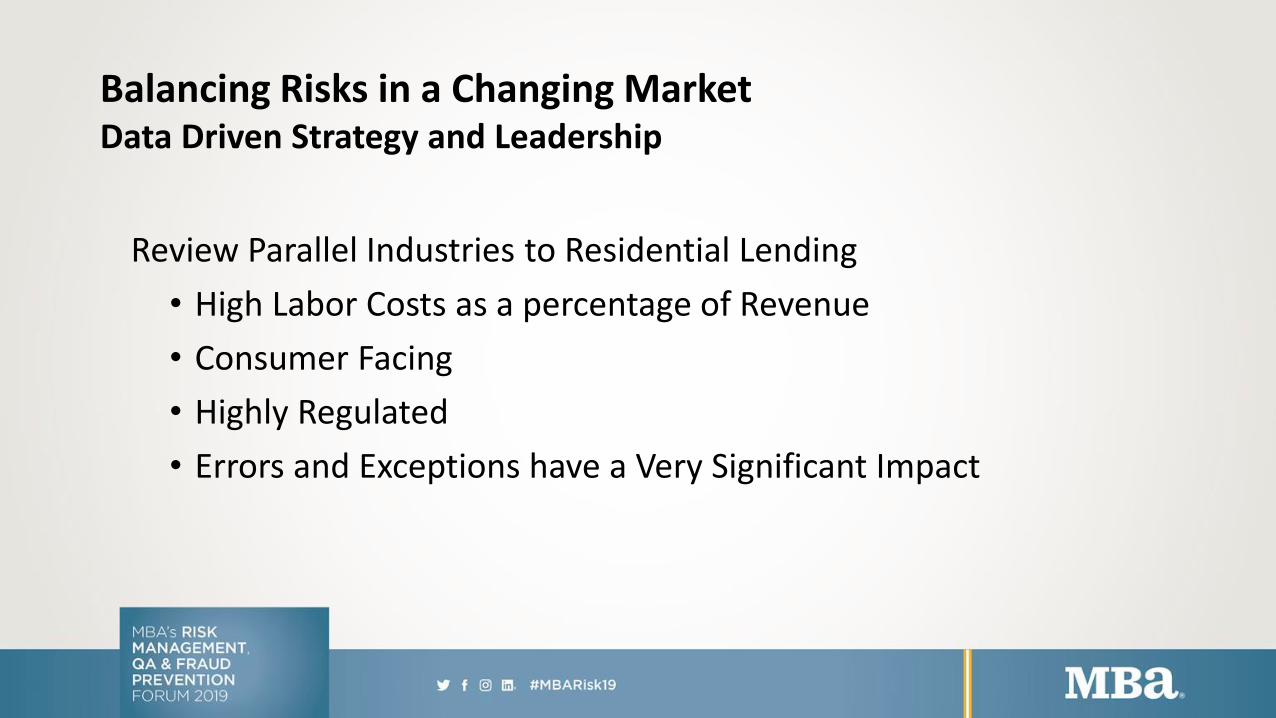
Balancing Risks in a Changing MarketData Driven Strategy and Leadership
Review Parallel Industries to Residential Lending
• High Labor Costs as a percentage of Revenue
• Consumer Facing
• Highly Regulated
• Errors and Exceptions have a Very Significant Impact


Balancing Risks in a Changing Market
Review Parallel Industries
• High Labor Costs as a percentage of Revenue
• Consumer Facing
• Highly Regulated
Strategic Responses
• Highly Data Driven
• Tight Operational and Cost Controls based on Data
• Reduction of Very High Cost Error(s)

Balancing Risks in a Changing Market
Partial list of Data Sources:
• Full Authority Digital Engine Controls (FADEC)
• Aircraft Communication Addressing and Reporting System (ACARS)
• Flight Data Recorder (‘Black Box’)
• Electronic Flight Instrument System (EFIS)
• Automatic Dependent Surveillance-Broadcast (ADS-B)
Risk Management Results: 4,000 flights a day, 3.2 million miles of flight per day, 3,000+ data points collected every 5 seconds… Consistent Profitability, Superior Safety Record. Data=Safety and Efficiency

Balancing Risks in a Changing Market

Balancing Risks in a Changing Market

Balancing Risks in a Changing Market
Results of Data Driven Strategy and Leadership:
• Lowest Cost per Win, Consistently
• Most Competitive Team for Dollar of Salary
• Consistently Identifies Undervalued Assets
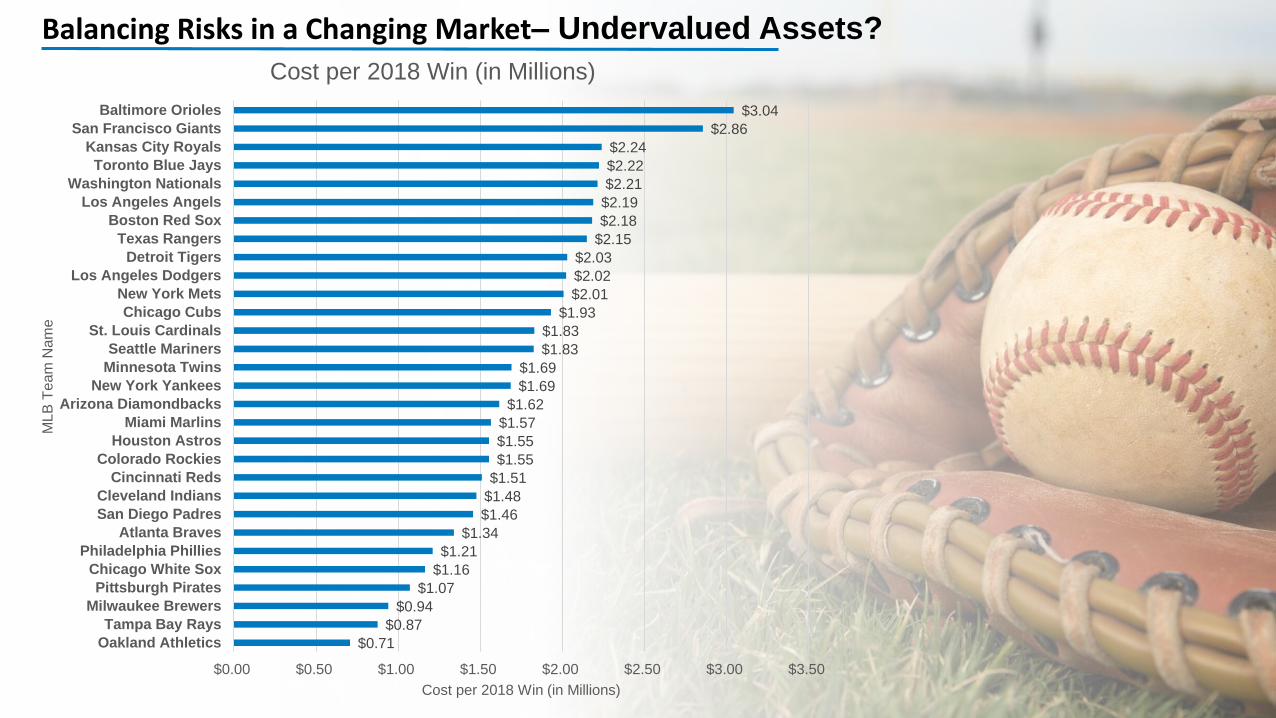
Balancing Risks in a Changing Market– Undervalued Assets?
$0.71
$0.87
$0.94
$1.07
$1.16
$1.21
$1.34
$1.46
$1.48
$1.51
$1.55
$1.55
$1.57
$1.62
$1.69
$1.69
$1.83
$1.83
$1.93
$2.01
$2.02
$2.03
$2.15
$2.18
$2.19
$2.21
$2.22
$2.24
$2.86
$3.04
$0.00 $0.50 $1.00 $1.50 $2.00 $2.50 $3.00 $3.50
Oakland Athletics
Tampa Bay Rays
Milwaukee Brewers
Pittsburgh Pirates
Chicago White Sox
Philadelphia Phillies
Atlanta Braves
San Diego Padres
Cleveland Indians
Cincinnati Reds
Colorado Rockies
Houston Astros
Miami Marlins
Arizona Diamondbacks
New York Yankees
Minnesota Twins
Seattle Mariners
St. Louis Cardinals
Chicago Cubs
New York Mets
Los Angeles Dodgers
Detroit Tigers
Texas Rangers
Boston Red Sox
Los Angeles Angels
Washington Nationals
Toronto Blue Jays
Kansas City Royals
San Francisco Giants
Baltimore Orioles
Cost per 2018 Win (in Millions)
ML
B T
eam
Na
me
Cost per 2018 Win (in Millions)

Balancing Risks in a Changing Market
TeamFinal Standings (Division Champ in Tan)
Payroll (in Millions) 2018 Wins
Cost per Win (in Millions)
Baltimore Orioles $143.09 47 $3.04 Kansas City Royals $129.92 58 $2.24 Chicago White Sox $72.18 62 $1.16 Miami Marlins $98.64 63 $1.57 Detroit Tigers $129.92 64 $2.03 San Diego Padres $96.13 66 $1.46 Cincinnati Reds $101.19 67 $1.51 Texas Rangers $144.00 67 $2.15 Toronto Blue Jays $162.32 73 $2.22 San Francisco Giants $208.51 73 $2.86 New York Mets $154.61 77 $2.01 Minnesota Twins $131.91 78 $1.69 Philadelphia Phillies $96.85 80 $1.21 Los Angeles Angels $175.10 80 $2.19 Pittsburgh Pirates $87.88 82 $1.07 Arizona Diamondbacks $132.50 82 $1.62 Washington Nationals $181.59 82 $2.21 St. Louis Cardinals $161.01 88 $1.83 Seattle Mariners $162.48 89 $1.83 Tampa Bay Rays AL East 3rd Place $78.73 90 $0.87 Atlanta Braves NL East Champ $120.54 90 $1.34 Cleveland Indians AL Central Champ $134.35 91 $1.48 Colorado Rockies NL West Wild Card $141.34 91 $1.55 Los Angeles Dodgers World Series Loss $186.14 92 $2.02 Chicago Cubs NL Central Wild Card $183.46 95 $1.93 Milwaukee Brewers NL Central Champ $90.24 96 $0.94 Oakland Athletics AL Wild Card (Lost) $68.53 97 $0.71 New York Yankees AL East Wild Card $168.54 100 $1.69 Houston Astros AL West Champ $160.04 103 $1.55 Boston Red Sox World Series Win $235.65 108 $2.18

Balancing Risks in a Changing Market: Undervalued? Overvalued?
Team
Final Standings (Division Champ in Tan)
Payroll (in Millions)
2018 Wins
Cost per Win (in Millions)
Tampa Bay Rays AL East 3rd Place $78.73 90 $0.87 Atlanta Braves NL East Champ $120.54 90 $1.34 Cleveland Indians AL Central Champ $134.35 91 $1.48 Colorado Rockies NL West Wild Card $141.34 91 $1.55 Los Angeles Dodgers World Series Loss $186.14 92 $2.02 Chicago Cubs NL Central Wild Card $183.46 95 $1.93 Milwaukee Brewers NL Central Champ $90.24 96 $0.94 Oakland Athletics AL Wild Card (Lost) $68.53 97 $0.71 New York Yankees AL East Wild Card $168.54 100 $1.69 Houston Astros AL West Champ $160.04 103 $1.55 Boston Red Sox World Series Win $235.65 108 $2.18

Balancing Risks in a Changing Market


MLB Digital Properties, and all content are either owned by or licensed to Major League Baseball, and are used herein as educational examples of data driven decision making.

$2,350 of UAW® Labor
Source: Digitally Transforming the Mortgage Banking Process ©
Cost of Labor to Produce:
A Car
Balancing Risks in a Changing Market – In Mortgage Banking
Versus
$2,400 of Lender Labor
Cost of Labor to Produce:
Retail Loan File

Components of Cost to Produce – Not Sustainable
Loan Production Expenses: 2015 2016 2017 2018Sales & Prod Support Personnel $2,690 38.20% $2,711 37.60% $2,971 36.80% $3,552 42.91%
Fulfillment Personnel 2,009 28.50% 2,091 29.00% 2,376 29.40% 2,565 30.99%
Occupancy and Equipment 380 5.40% 358 5.00% 435 5.40% 491 5.93%
Technology-Related Expenses 131 1.90% 141 2.00% 172 2.10% 199 2.40%
Outsourcing and Prof Fee 286 4.10% 260 3.60% 264 3.30% 272 3.29%
Other Operating Expenses 1,156 16.40% 1,252 17.40% 1,303 16.10% 1,293 15.62%
Direct Loan Production Expenses 6,652 94.40% 6,812 94.50% 7,521 93.00% 7,780 93.98%
Corporate Allocation 394 5.60% 396 5.50% 562 7.00% 498 6.02%
Total Cost to Produce $7,046 100.00% $7,208 100.00% $8,083 100.00% $8,278 100.00%

•
•
•
•
•
•
•
•
•

How Can Data Driven Decisioning Improve Results Mortgage Lending?
Baseball• At Bats
• Batting Tendencies
• Pitch Count
• Pitch Location
• Situational Statistics
• History back to 1910’s
• 2010 Expanded Data
sets
Lending• Loan Quality
• Exceptions
• Actors (Who Creates
Exceptions)
• Segmentation
Loan
Actor
Branch
Ops
• Coach to Improve Results
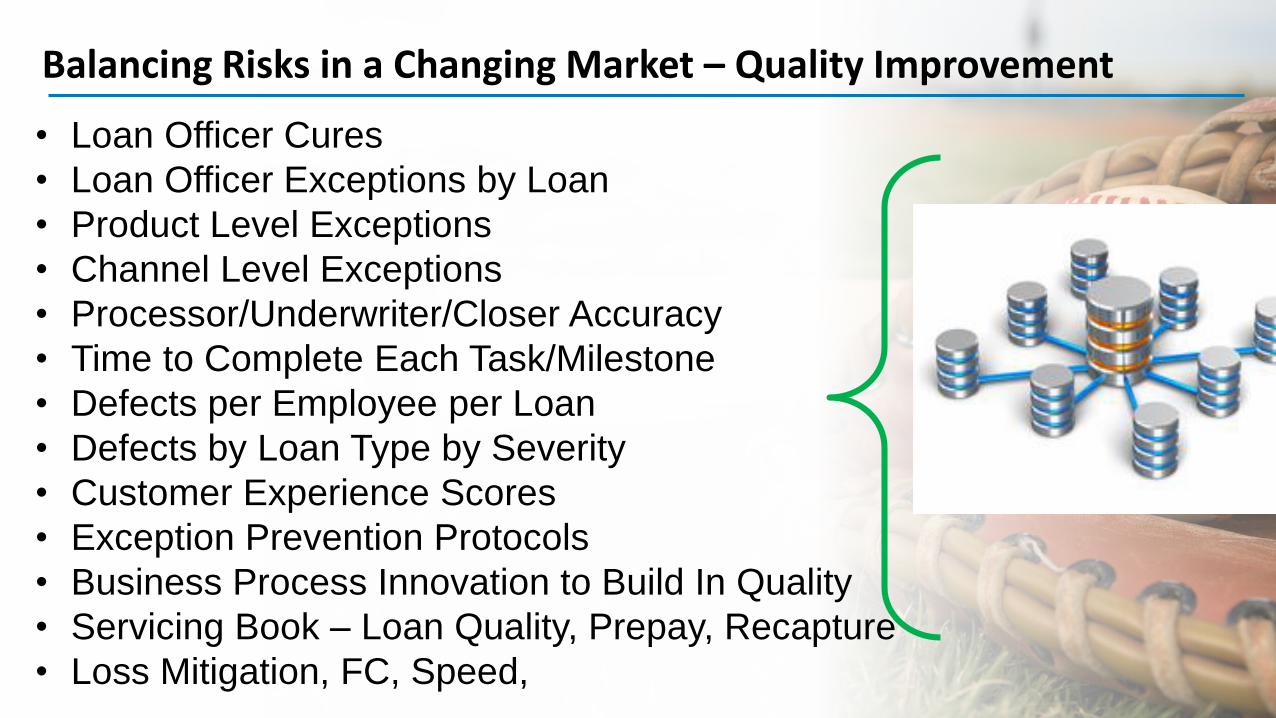
Balancing Risks in a Changing Market – Quality Improvement
• Loan Officer Cures
• Loan Officer Exceptions by Loan
• Product Level Exceptions
• Channel Level Exceptions
• Processor/Underwriter/Closer Accuracy
• Time to Complete Each Task/Milestone
• Defects per Employee per Loan
• Defects by Loan Type by Severity
• Customer Experience Scores
• Exception Prevention Protocols
• Business Process Innovation to Build In Quality
• Servicing Book – Loan Quality, Prepay, Recapture
• Loss Mitigation, FC, Speed,

Balancing Risks in a Changing Market – Delinquency Analysis

Balancing Risks in a Changing Market - Actor Analysis
Video Example to be inserted.

Get In the Game! :
• Develop Strategies to Harness the
Undervalued Assets in Your Company
• Creatively Deploy Solutions to Identify Quality
Improvement and Cost Reduction Opportunities
• Exhibit Thought Leadership in Harnessing Data
and Technology to Increase Loan Quality
Call to Action: Balancing Risks in a Changing Market

Author:
Digitally Transforming the Mortgage Banking Industry (Amazon #1 Best Selling New Release, February 2018)
Strategically Transforming the Mortgage Banking Industry (Amazon #1 Best Selling New Release, October 2018)
Disruptive Fintech: The Coming Wave of Innovation (coming October 2019, published by De Gruyter Press)
Balancing Risks in a Changing Market