international journal of engineering (ije) volume (1) issue (2)
DESCRIPTION
TRANSCRIPT


Editor in Chief Dr. Kouroush Jenab
International Journal of Engineering (IJE) Book: 2008 Volume 1, Issue 2
Publishing Date: 30-08-2007
Proceedings
ISSN (Online): 1985-2312
This work is subjected to copyright. All rights are reserved whether the whole or
part of the material is concerned, specifically the rights of translation, reprinting,
re-use of illusions, recitation, broadcasting, reproduction on microfilms or in any
other way, and storage in data banks. Duplication of this publication of parts
thereof is permitted only under the provision of the copyright law 1965, in its
current version, and permission of use must always be obtained from CSC
Publishers. Violations are liable to prosecution under the copyright law.
IJE Journal is a part of CSC Publishers
http://www.cscjournals.org
©IJE Journal
Published in Malaysia
Typesetting: Camera-ready by author, data conversation by CSC Publishing
Services – CSC Journals, Malaysia
CSC Publishers

Table of Contents
Volume 2, Issue 1, July/ August 2007.
Pages
1 - 11
12 - 23
24 - 33
An Optimization Methodology (DEA Analysis)
Jibendu Kumar Mantri, Sasanka Sekhar Panigrahi, Tushar
Kanti Tripathy, P.Gahan
Development and Simulation of a Task Assignment Model for
Multirobot Systems
B.B.Biswal, B.B.Choudhury
Automating Measurement for Software Process Models using
Attribute Grammar Rules Rodziah Atan, Abdul Azim Abd. Ghani, Mohd. Hasan Selamat, Ramlan Mahmod
International Journal of Engineering, (IJE) Volume (1) : Issue (2)

Author(s) Name : J. K. Mantri , S. S. Panigrahi, T. K. Tripathy, P.Gahan,
International Journal of Engineering, Volume (1) : Issue (2) 1
An Optimization Methodology (DEA Analysis) : A Case Study in Similipal
Jibendu Kumar Mantri [email protected] Reader, Deptt. Of Comp.Sc & Applications, North Orissa University, Baripada, Orissa, India Phone (M) 09438084141
Sasanka Sekhar Panigrahi [email protected] Deptt. Of Comp.Sc & Applications, North Orissa University, Baripada, Orissa, India Phone (M)-09437573427
Tushar Kanti Tripathy [email protected] HOD, Deptt. of Mathematics & Computer Science M.P.C.(Auto.) College, Baripada, Orissa, India Phone (M)-09437161736
P.Gahan [email protected] Prof. & H.O.D, Deptt. Of Business Administration, Sambalpur University, Sambalpur, Orissa, India Phone (M) 09437348150
Abstract
In the growing face of deforestation, conservation is the only way to save forest and its precious wild animals, from the human encounter. “Project Tiger “(1973) at Similipal is a welcome step on the direction of tiger conservation, whose population is on the verge of extinction. For the proper protection, preservation and propagation of tiger and forest in the Similipal Tiger Reserve (STR) funds have been allocated from time to time by central govt., state govt. & various NGOs of national and international repute. The responsibility of managing the earmarked fund rests with the management of STR. This paper observes the interrelationship of funds with the trend of tiger population & other variables by using suitable econometric model. Some standard results have been explained. Also it examines the level of efficiency of fund utilization for eight financial years taking the help of Data Envelopment Analysis (DEA). Key words: Similipal Tiger Reserve, Regression Analysis, Multi Layer Perception, Data Envelopment Analysis, Decision Making Unit.

Author(s) Name : J. K. Mantri , S. S. Panigrahi, T. K. Tripathy, P.Gahan,
International Journal of Engineering, Volume (1) : Issue (2) 2
1. INTRODUCTION “Forest” plays a significant role in the development of a country. Perhaps it is the only substitute which maintains the atmospheric balance between man and universe[11]. It made positive contribution to the state income, tribal and rural development and forest based industries[10]. In the growing face of deforestation, wilderness protection is a growing necessity for modern societies, and this is particularly true for areas where population density is extremely high[5] like India. “Project Tiger” (1973) at Similipal is a welcome step on the direction of tiger conservation, whose population is on the verge of extinction. Similipal, the 8
th Biosphere Reserve (1994) of
India is situated in the biotic province, Chhotanagpur plateau in the heart of the erstwhile Mayurbhanj State. It is a symbol of honor for the people of Orissa. It is emotionally attached as a place of religious sanctity & cultural assimilation [6]. Similipal is a perennial source of livelihood to the villagers living in more than twelve hundred villages in its periphery. The northern part of Orissa blessed with many perennial rivers originating from Similipal, which maintains the ground water table in the eastern part of India and regulates the rainfall in the region. It is not only a compact mass of hills & forests, streams and rivers but it is the lifeline of millions of people living in eastern part of India [8]. For the proper protection, preservation and propagation of forests & its wild animals in the STR funds has been allocated time to time by central govt., state govt. & various NGOs of national and international repute. The management should channelise these funds consciously so that maximum return can be achieved. The main objective of this paper is to explore two basic questions:
I. How far the expenditure per annum and the trend of tiger population & other related variables are inter-related or inter-dependent on each other.
II. How efficiently the fund allocated has been utilized. To deal with the first objective, help of regression analysis with data of eight financial years has been taken. Making a close observation of R
2 (i.e. the residual sum of squares), which measures
the proportion of the variation in the dependent variable accounted for by the explanatory variable(s) and the adjusted R
2, which measures R
2 adjusted for the df (i.e. degree of freedom)
associated with the sums of squares, the conclusion has been drawn.
So far as the second objective is concerned, this paper incorporates DEA (i.e. Data Envelopment Analysis), one of the best methodologies to evaluate efficiency of non-profitable zones.
2. OBJECTIVES Throughout the study, we use data obtained from the office of the Field Director, STR and the website of Similipal Reserve. Tiger census of the reserve has not been done annually, rather in irregular basis. Also year of accounting, period of tourist visit to the reserve & census year of tiger population have some mismatch. To sort out these inconvenience we made minor adjustments. The number of tiger carried forward from the previous census report to the next years for which census report is unavailable. In total we consider eight samples. Though the sample size is not very high, still prediction on the light of the study is quite convincing. Among the five variables studied here (i.e. NT, NTI, EXP, TPT, EPT) EXP appears the most exogenous and directly controllable. To some extent NT (i.e. Number of Tourist) is also controllable. The management of STR always tried to restrict tourists of Indian & Foreign origin to a manageable level, which can be shown from the figure given in table-1.

Author(s) Name : J. K. Mantri , S. S. Panigrahi, T. K. Tripathy, P.Gahan,
International Journal of Engineering, Volume (1) : Issue (2) 3
Year Indian Foreign Total
1980-81 5979 39 6018
1981-82 4632 36 4668
1982-83 5601 46 5647
1983-84 7270 34 7304
1984-85 5078 23 5101
1985-86 8414 35 8450
1986-87 8458 44 8500
1987-88 11248 54 11302
1988-89 14994 51 15045
1989-90 15176 81 15257
1990-91 14002 88 14090
1991-92 12579 87 12656
1992-93 19260 72 19332
1993-94 17493 132 17625
1994-95 16908 148 17056
1995-96 20236 134 20370
1996-97 21133 140 21273
1997-98 24413 161 24574
1998-99 19377 163 19540
1999-00 13403 84 13487
2000-01 22166 105 22271
2001-02 22508 146 22654
2002-03 21651 172 21823
2003-04 17125 192 17317
2004-05 19401 171 19573
TABLE 1: Tourists to Similipal
Source : www.projecttiger.nic.in/similipal.html
3. ECONOMETRIC MODEL An econometric model can be configured as a perception to predict tiger population trend using related variables. However, the activation function used with Multi Layer Perception (MLP) is a sigmoid function. Therefore, a similar econometric model will be a regression model[7]. Fig-1 illustrates the model.
l
β0
Yi
Output (Dependent Variable) Inputs
(Independent Variables)
X1
X2
X3
Xn
β2
β1
β3
βn

Author(s) Name : J. K. Mantri , S. S. Panigrahi, T. K. Tripathy, P.Gahan,
International Journal of Engineering, Volume (1) : Issue (2) 4
(Fig-1: Econometric model)
The mathematical representation of this econometric model is
FIGURE 1: Econometric model
The mathematical representation of this econometric model (Fig.1) is
yi = β0 + β1 x1+ β2 x2 + ------ + βi xi + ei (6.1)
It is assumed that the random component has a normal distribution with mean zero and variance δ
2. Equation (6.1) can be simplified as [2]
where ei ~ � n (0, δ2). The objective of this regression problem is to find the coefficients βi that
minimize the sum of squared errors,
To find the coefficient for the model, a data set that includes the independent variables and associated known values of the dependent variable is needed.
3.1 Empirical Results Taking all the related variables as static NTI varies directly with the EXP. The trend line shown in fig-2 strongly recommended the positive relationship.
n yi (x) = β0 + ∑ βi xi + ei (6.2)
i=1
1 l n 2
yi (x) = − ∑ [yi - ∑ βi xi ] (6.3) 2 i=1 i=1

Author(s) Name : J. K. Mantri , S. S. Panigrahi, T. K. Tripathy, P.Gahan,
International Journal of Engineering, Volume (1) : Issue (2) 5
Relationship of No. of Tiger and Exp.
0
20
40
60
80
100
120
140
160
180
200
97 98 99 100 101 102
No. of Tiger
Exp
en
dit
ure
trendline
FIGURE 2
However, as one of the our objectives is to evaluate interdependency of variables, regression analysis of the form (6.1) can be re-written in the form Y= aX1
b1 X2
b2 X3
b3 X4
b4 (6.4)
Where Y is NTI, and a, b1, b2, b3, b4 are the parameters of the equation. Each exogenous variable has a significant effect on NTI as shown in table-2.
Variable Variable Correlation Variable Variable Correlation
NTI NTI NTI NTI Exp
Exp NT TPT EPT NT
0.5973579 -0.371804 -0.423316 0.5798011 -0.02643
Exp Exp NT NT TPT
TPT EPT TPT EPT EPT
-0.06443 0.9996948 0.9983827 -0.01806 -0.05531
TABLE 2 : Correlation Summary
The actual linear regression equation is
NTI=99.12(EXP)
.082(NT)
.005(TPT)
-.51(EPT)
-8.77 (6.5)
Variable Mean Standard
Deviation Regression Coefficient
Standard Error
t Prob.>│t│
NTI Constant
Exp NT TPT EPT
99.25
97.805 20154.88 203.125
0.9832501
1.164965
39.32392 3510.505 36.57258 0.3875597
Dependent 98.72707 0.2199304 0.004390 -0.430534 -22.0288
Variable 1.679101 0.4252266 0.002541 0.2474729 42.44359
58.79758 0.5172075 1.727404 -1.73972 -0.519014
0.000010 0.6407273 0.1825463 0.180286 0.6396084
Se = 0.6265025 R-square = 0.89871 R-adjusted = 0.76367

Author(s) Name : J. K. Mantri , S. S. Panigrahi, T. K. Tripathy, P.Gahan,
International Journal of Engineering, Volume (1) : Issue (2) 6
TABLE 3: Regression Summary
Using the table:3 with NTI as the dependent variable provided a very good fit, with R-square(R
2
measures the proportion of the variation in the dependent variable accounted for by the explanatory variable(s) ) value of 0.89871 and an adjusted R-squared (the term adjusted means adjusted for the df i.e. degree of freedom associated with the sums of squares) value of 0.76367. Analysis of variance for the above model has been shown in table-4.
Source Degree of
Freedom Sum of Square
Mean Square F Value Prob.>F
Regression Error Total
4 3 7
10.44847 1.177516 11.62599
2.612118 0.3925053
6.654989 0.0756863
TABLE 4: Analysis of Variance
Prediction & residual analysis on the basis of eq (6.5) has been sited on Table-5, which shows a very little deviation of predicted value & the actual data.
Number Actual Prediction Std. Dev. Prediction
Residual % Residual Standardized Residual
1 2 3 4 5 6 7 8
98 98 99 99 99 99 101 101
98.3176 98.51984 99.17167 99.41219 99.26794 99.50827 101.2841 101.4429
0.5651977 0.3460571 0.5723393 0.311497 0.4259256 0.4226389 0.5989521 0.6202983
-0.317596 -0.519844 -0.171669 -0.412193 -0.267944 -0.508270 -0.284080 -0.442947
-0.323031 -0.527654 -0.173102 -0.414630 -0.269920 -0.510781 -0.280478 -0.436646
-0.774357 -1.26747 -0.418559 -1.00500 -0.653296 -1.23925 -0.692639 -1.07998
TABLE 5: Prediction and Residual Analysis
Standard deviation of prediction fluctuates in between 0.31 to 0.62. The deviation can be shown from table-5. The eq (6.5) can be represented as NTI = 99.12418+ 0.082434EXP+ 0.0051838NT- 0.5111402TPT -8.775664EPT (6.6)
Another regression analysis of the form Y= a X1
b1 X2
b2 (6.7)
can be considered to study the relationship among the variables , with NT as the dependent variable, and EXP & NTI as the independent variables. Here other independent variables included in (6.5) are droped for better observation of interdependency among the said variables.
4. DEA Data Envelopment Analysis (DEA) is a new technique developed in operation research and management science over the last two decades for measuring efficiency of Decision Making

Author(s) Name : J. K. Mantri , S. S. Panigrahi, T. K. Tripathy, P.Gahan,
International Journal of Engineering, Volume (1) : Issue (2) 7
Units (DMUs) in the public and private sectors. It has been extensively applied in performance evalution and benchmarking of schools, hospitals, banks etc.[4] . DEA is a multi-factor productivity analysis model for measuring the relative efficiencies of a homogenous set of decision making units(DMUs). The efficiency score in the presence of multiple input and output factors is defined as Weighted sum of outputs
Efficiency = --------------------------------- (7.1) Weighted sum of inputs
4.1 Mathematical Model Given a set of n units, each operating with m inputs and s outputs, let yrj be the amount of r
th
output from unit j, and xij be the amount of the i
th input to the j
th unit. The relative efficiency of a
particular unit is obtained by the optimal values of the objective function in the following fractional linear program [9].
Model 1: subject to The decision variables u = ( i u1, u2,…,ur,…,us ) and v = ( v1,v2,…vi,…,vm )are respectively the weights given to the outputs and to the m inputs. To obtain the relative efficiencies of all the units, the model is solved n times , for one unit at time. Model1 allows for great weight flexibility and the weights are restricted to the extent that they should not be zero. To make the efficiency of any unit not greater than one, Model1 gets converted in to Model 2. Model 2:
s ∑ uryrj0 r=1 max h j0 (u, v) = m ∑ vixij0 i=1
s m ∑ uryrj - ∑ vixij ≤ 0 j = 1,2,3…..,n r=1 i=1
ur,vi ≥ Є, ∀ r,i

Author(s) Name : J. K. Mantri , S. S. Panigrahi, T. K. Tripathy, P.Gahan,
International Journal of Engineering, Volume (1) : Issue (2) 8
subject to
The above problem is run n-times in identifying the relative efficiency scores of all the DMUs. Each DMU selects input and output weights that maximize its efficiency score. But in general, a DMU is said to be efficient if it obtains score of 1 and a score of less than 1 implies that it is less efficient.
4.2 Empirical Results Model:2 of DEA is run over all eight years(1998-2005). Performance of STR taking three outputs (NT,NTI and TPT) and three inputs (EPT,EXP and EPSK). The values of inputs and outputs are sited in table:6.
Year NT(u1) NTI(u2) TPT(u3) EPT(v1) Exp(v2) EPSK(v3)
1998 (DMU1) 24.574 98 0.25076 50.3061 49.3 1.7927
1999 (DMU2) 19.54 98 0.19939 69.0306 67.65 2.46
2000 (DMU3) 13.487 99 0.13623 85.8081 84.95 3.0891
2001 22.271 99 0.22496 84.1515 83.31 3.0295
m
∑ vixij0 =1
i=1
s m
∑ uryrj - ∑ vixij ≤ 0 j = 1,2,…,n
r=1 i=1
ur,vi ≥ Є , ∀ r,i
s
max h j0 = ∑ uryrj0
r=1

Author(s) Name : J. K. Mantri , S. S. Panigrahi, T. K. Tripathy, P.Gahan,
International Journal of Engineering, Volume (1) : Issue (2) 9
(DMU4)
2002 (DMU5) 22.654 99 0.22883 128.0909 126.81 4.6113
2003 (DMU6) 21.823 99 0.22043 119.5556 118.36 4.304
2004 (DMU7) 17.317 101 0.17146 78.7129 79.5 2.8909
2005 (DMU8) 19.573 101 0.19379 170.8515 172.56 6.2749
TABLE 6 : Values of outputs and inputs for DEA
NB: NT :no. of tourist (in '000), NTI :no. of Tiger, TPT :Tourist per Tiger (in '000), EPSK: Expenditure per square Kilometer (in '000, input), Exp :Total Expenditure (in lakhs,input), EPT : Expenditure per Tiger (in '000, input)
Weights and efficiencies of DMUs are given on table:7. by observing the efficiencies (i.e. hj0 ) of various DMU it can be concluded that DMU1 is the most efficient unit which indicates efficient use of funds in year 1998(ignoring time lage effect). Efficiencies of DMU4,DMU5,DMU6 and DMU8 are near unity. But DMU3 has the lowest efficiency level among eight DMUs, indicating average performance in year 2000.
DMU U1 U2 U3 V1 V2 V3 h
1 0.00968 0.00775 0.01047 0.019878 0.020284 0.557818 1 2 0.0077 0.00775 0.00833 0.014486 0.014782 0.406504 0.91162 3 0.00531 0.00783 0.00569 0.011654 0.011772 0.323719 0.84756 4 0.00877 0.00783 0.00939 0.011883 0.012003 0.330087 0.9726 5 0.00892 0.00783 0.00955 0.007807 0.007886 0.216859 0.97943 6 0.0086 0.00783 0.0092 0.008364 0.008449 0.232342 0.96488 7 0.00682 0.00799 0.00716 0.012704 0.012579 0.345913 0.92632 8 0.00771 0.00799 0.00809 0.005853 0.005795 0.159365 0.95947
TABLE 7: weights and efficiencies of DMUs
For the conceptual understanding of the principle behind DEA, we consider only two outputs i.e. TPT and EPT. The performance of all DMUs in terms ofn these two outputs has been depicted in fig.3. one can note that DMU5 and DMU1 lie at the extreme end of the graph. In DEA terminology those two units are said to be the most efficient units.

Author(s) Name : J. K. Mantri , S. S. Panigrahi, T. K. Tripathy, P.Gahan,
International Journal of Engineering, Volume (1) : Issue (2) 10
D E A F r o n t i e r
0
0 .2
0 .4
0 .6
0 .8
1
1 .2
1 .4
0 1 0 0 2 0 0 3 0 0
T P T
EP
T
FIGURE 3: DEA frontier analysis considering only two outputs
5.CONCLUSION AND FUTURE WORK The findings of the study shows that the trend of tiger population basically depends on
the amount of fund allocated. Other variables considered on this paper also have close
relation with the trend of expenditure. However, so far as the efficiency score on the basis
of DEA is concerned, for most of the years the allocated funds have been properly
utilized.
As conservation of forest has far bearing effect on environmental scenario of the locality,
inclusion of benefits accrues to the environment (viz. less air pollution, less fluctuation of
climate, proper water table maintenance etc.) may be included as another output variable
in discussed model, which will certainly enhance the confidence level of the result drawn.
But due to unavailability of numerical equivalent data we are compel to restrain ourselves
to do so. Hence any future work on this line may highlight above-mentioned
environmental benefits as single variable or multiple variables considering each one
independently.
Efficiency frontier
DMU5
DMU1
DMU3
A
B DMU4
Author(s) Name : J. K. Mantri , S. S. Panigrahi, T. K. Tripathy, P.Gahan,
International Journal of Engineering, Volume (1) : Issue (2) 11
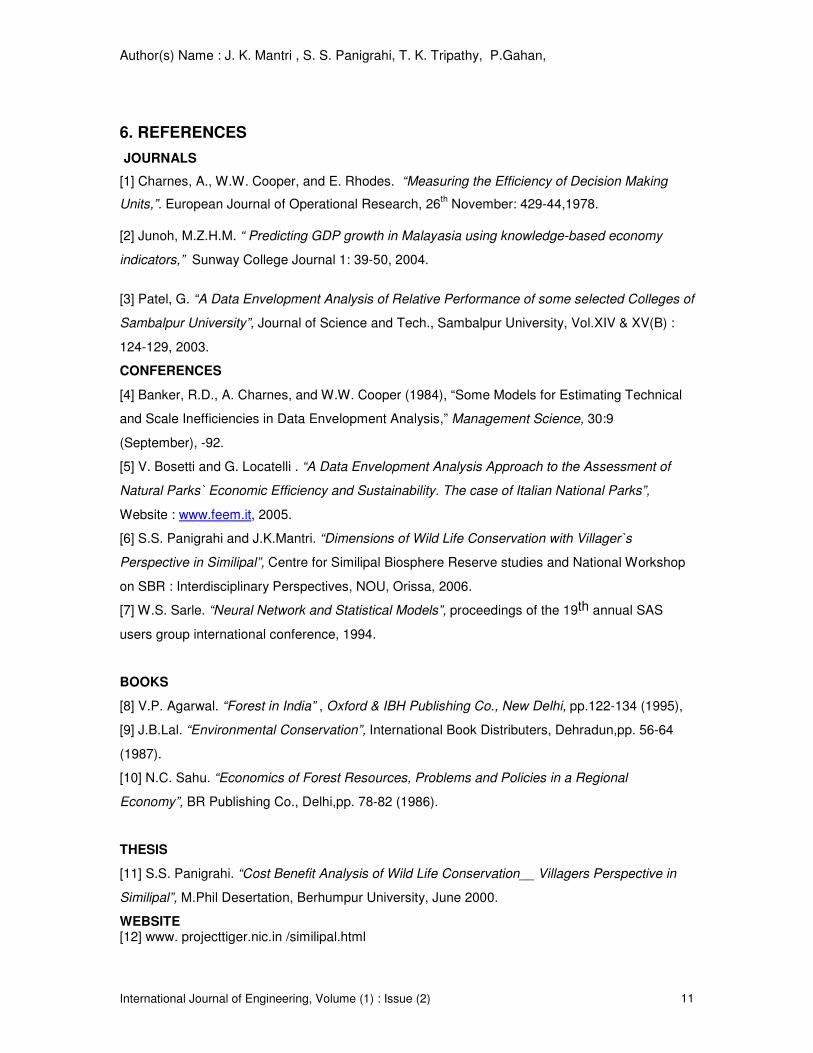
6. REFERENCES
JOURNALS
[1] Charnes, A., W.W. Cooper, and E. Rhodes. “Measuring the Efficiency of Decision Making
Units,”. European Journal of Operational Research, 26th November: 429-44,1978.
[2] Junoh, M.Z.H.M. “ Predicting GDP growth in Malayasia using knowledge-based economy
indicators,” Sunway College Journal 1: 39-50, 2004.
[3] Patel, G. “A Data Envelopment Analysis of Relative Performance of some selected Colleges of
Sambalpur University”, Journal of Science and Tech., Sambalpur University, Vol.XIV & XV(B) :
124-129, 2003.
CONFERENCES
[4] Banker, R.D., A. Charnes, and W.W. Cooper (1984), “Some Models for Estimating Technical
and Scale Inefficiencies in Data Envelopment Analysis,” Management Science, 30:9
(September), -92.
[5] V. Bosetti and G. Locatelli . “A Data Envelopment Analysis Approach to the Assessment of
Natural Parks` Economic Efficiency and Sustainability. The case of Italian National Parks”,
Website : www.feem.it, 2005.
[6] S.S. Panigrahi and J.K.Mantri. “Dimensions of Wild Life Conservation with Villager`s
Perspective in Similipal”, Centre for Similipal Biosphere Reserve studies and National Workshop
on SBR : Interdisciplinary Perspectives, NOU, Orissa, 2006.
[7] W.S. Sarle. “Neural Network and Statistical Models”, proceedings of the 19th annual SAS
users group international conference, 1994.
BOOKS
[8] V.P. Agarwal. “Forest in India” , Oxford & IBH Publishing Co., New Delhi, pp.122-134 (1995),
[9] J.B.Lal. “Environmental Conservation”, International Book Distributers, Dehradun,pp. 56-64
(1987).
[10] N.C. Sahu. “Economics of Forest Resources, Problems and Policies in a Regional
Economy”, BR Publishing Co., Delhi,pp. 78-82 (1986).
THESIS
[11] S.S. Panigrahi. “Cost Benefit Analysis of Wild Life Conservation__ Villagers Perspective in
Similipal”, M.Phil Desertation, Berhumpur University, June 2000.
WEBSITE [12] www. projecttiger.nic.in /similipal.html

B.B.Biswal and B.B.Choudhury
International Journal of Engineering, Volume (1) : Issue (2) 12
Development and Simulation of a Task Assignment Model for Multirobot Systems
B.B.Biswal [email protected] Professor, Department of Mechanical Engineering National Institute of Technology, Rourkela 769008, India B.B.Choudhury [email protected] Ph.D Scholar, Department of Mechanical Engineering National Institute of Technology, Rourkela 769008, India
Abstract
Multirobot systems (MRS) hold the promise of improved performance and increased fault tolerance for large-scale problems. A robot team can accomplish a given task more quickly than a single agent by executing them concurrently. A team can also make effective use of specialists designed for a single purpose rather than requiring that a single robot be a generalist. Multirobot coordination, however, is a complex problem. An empirical study is described in the present paper that sought general guidelines for task allocation strategies. Different task allocation strategies are identified, and demonstrated in the multi-robot environment. A simulation study of the methodology is carried out in a simulated grid world. The results show that there is no single strategy that produces best performance in all cases, and that the best task allocation strategy changes as a function of the noise in the system. This result is significant, and shows the need for further investigation of task allocation strategies. Keywords: Multirobot, task allocation, allocation strategies, auction algorithms
1. INTRODUCTION
The study of MRS has received increased attention in the recent years. This is not surprising as continually improving technology has made the deployment of MRS consisting of increasingly larger number of robots possible. It is obvious that, at least in some important respects, multiple robots will be superior to a single robot in achieving a given task. Potential advantages of MRS over a SRS (Single robot systems) include reduction of total system cost by employing multiple simple and cheap robots as opposed to a single, complex and expensive robots. Furthermore, the inherent complexity of certain task environment may require the use of multiple robots as the demand for capability is quite substantial to be met by a single robot. Finally, multiple robots are assumed to increase system robustness by taking advantage of inherent parallelism and redundancy. Multirobot teamwork is a complex problem consisting of task division, task allocation, coordination, and communication. The most significant concept in multi-robot systems is cooperation. It is only through cooperative task performance that the superiority of robot groups

B.B.Biswal and B.B.Choudhury
International Journal of Engineering, Volume (1) : Issue (2) 13
can be demonstrated. The cooperation of robots in a group can be classified into two categories of implicit cooperation and explicit cooperation. In the implicit cooperation case each robot performs individual tasks, while the collection of these tasks is toward a unified mission. This type of group behavior is also called asynchronous cooperation, as it requires no synchronization in time or space. The explicit cooperation is the case where robots in a team work synchronously with respect to time or space in order to achieve a goal. One example of such cooperation is transportation of heavy objects by multiple robots, each having to contribute to the lifting and moving of the object. This task requires the robots to be positioned suitably with respect to each other and to function simultaneously. Regardless of the type of cooperation, the goal of the team must be transformed in to tasks to be allocated to the individual robots. There is no general theory of task allocation in uncertain multi-robot domains. In this paper, an attempt is made to empirically derive some guidelines for selecting task allocation strategies for multi-robot systems with implicit cooperation. The explored strategies are individualistic in that they do not involve explicit cooperation and negotiation among the robots. However, they are a part of a large class approaches that produce coherent and efficient cooperative behavior. Given the empirical nature of this work and the scope of the problem addressed, these guidelines are necessarily incomplete, though they provide useful insight. The choice of task allocation strategy is far from trivial and that no optimal task allocation strategy exists for all domains. It can be very difficult to identify the optimal task allocation strategy even for a particular task. These results are derived through the use of a framework developed for understanding the task allocation problem, which illustrates a common approach to decomposing the problem. The approach presented in this paper can be advantageously used in real-world problems.
2. RELATED WORK
Multirobot systems are becoming increasingly more capable and the types of achievable applications for teams of robots are becoming progressively more complex. Many approaches to multirobot coordination rely on a mechanism for task allocation to determine an efficient assignment of tasks to robots. However, existing techniques do not fully consider the complexity of the tasks to be allocated. For the most part, tasks are assumed to be atomic units that can be performed by one or more robots on the team. In practice, this usually means that tasks are either acquired from a central planner that decomposes the mission goals, or that tasks are specified as input by a system user. In any case, existing task allocation algorithms consider the tasks only in terms of the level of description provided by the user or the planner. Another main issue in task allocation is the study of multi-robot systems in hardware with small population sizes (e.g., under twenty), versus the study of issues in multi-agents systems in simulation with large population sizes. It should be noted that the effects of team size and its scaling are integral issues in robot group studies, and the reliability of the simulation results remains to be seen. One main issue in task allocation is the division of the tasks into homogeneous and heterogeneous tasks. Goldberg and Mataric [1, 2, 3] studied homogeneous and heterogeneous task allocation for a foraging task, namely trash collection. Their implementation ranges from homogenous system where all robots have the same task to a grouping, which divides the robots in different groups, and each group is assigned to do a different task. They use inference, spatial, and temporal parameters to evaluate different methods. The results show that although the grouping system is suitable for reducing interference, the best performance is obtained through homogenous task allocation, i.e., the fastest collection of trash than others. In another work, Parker [4] showed that augmenting homogenous task allocation by making robots more team-aware, results in systems that are substantially more efficient. Dudek et al. [5] worked out a general taxonomy to characterize multi-agent systems, consisting of the number of agents, communication (range, bandwidth and topology), reconfigurability, processing mechanism, and differentiation.

B.B.Biswal and B.B.Choudhury
International Journal of Engineering, Volume (1) : Issue (2) 14
Berstas [6] presents an algorithm that can be utilized in task allocation in multi-robot applications, especially suitable for parallel computation. This approach attempts to find the best assignment between tasks and users, while maximizing the total benefit. It iterates between users and during iteration it tries to assign a task to a user who offers the most. The majority of multirobot systems that utilize an explicit task allocation mechanism assume either that a static set of tasks is given to the system as input [7, 8, 9, 10], or that tasks arrive dynamically, either from external [8, 9] or internal [11, 12] sources. In any case, such approaches search for an efficient assignment of the current task set to robots, assuming that all tasks are indivisible. When this type of mechanism is applied to complex tasks, a robot assigned a task can decompose it and then execute the resulting simple tasks [7]. In reality, however, it may be beneficial to allocate subcomponents of these tasks to more than one, and generally the preferred task decomposition will depend on the subtask assignments. Therefore, treating tasks as atomic entities during allocation is not always prudent. A common alternative among systems that explicitly handle complex tasks is a two-stage approach: first decompose all tasks and then distribute the resulting set of subtasks [12, 13, 14]. The main drawback of this approach is that task decomposition is performed without knowledge of the eventual task allocation; therefore the cost of the final plan cannot be fully considered. Since there is no backtracking, costly mistakes in the central decompositions cannot be rectified. In some instances, the central plan is left intentionally vague, which allows for a limited amount of flexibility in modifying it later. For example, in GOFER Project [14], the central planner produces a general plan structure for which individual robots can later instantiate some variables; while in the "mapping algorithm” of Simmons et al. [11], is an on-line approach to likelihood maximization that uses hill climbing to find maps that are maximally consistent with sensor data and odometry. Ostergaard and Mataric [15] propose an algorithm for task allocation that assigns tasks dynamically to a suitable and capable robot. Task allocation is dynamic and happens on a needed basis. Task allocation is one of the main problems in multirobot systems. Guerrero and Oliver[16] propose a methodology to allocate tasks in a multirobot systems by considering among other factors, to get a good task allocation, and to take into account the physical interference effects between robots, that is, when two or more robots want to access to the same point at the same time. Lian and Murray [17] discuss a design methodology of cooperative trajectory generation for multi-robot systems. The trajectory of achieving cooperative tasks, i.e., with temporal constraints, is constructed by a nonlinear trajectory generation (NTG) algorithm. In this paper three scenarios of robot tasking from home base to target position. Stenz and Dias [18] implement task allocation as a free market system. Some of the important features of this approach are dynamical task allocation, group learning, and minimum communication dependability. Shen, Tzeng and Liu [19] implement workflow modelers, during workflow design and specify the performers of a task by their organizational role. However, during workflow enactment, numerous agents with different skills and expertise may share the same role in an organization, making it hard to select appropriate individuals based merely on the assignment relation between a role and a task. The Alliance approach [20] is focused on small to medium size robot teams. It is a fault-tolerant, behavior-based architecture that assigns tasks dynamically. Its behavior-based controller uses different sets of behavior for different tasks. This architecture assumes a heterogeneous team of robots. Each robot needs to run an Alliance process as a requirement in order to cooperate. Each task consists of a target location that needs to be visited by a robot. The objective of the allocation is to minimize the total cost, that is, the sum of the travel costs of all robots for visiting a target and finding an optimal allocation is an NP-hard problem, even in known environments. The PRIM ALLOCATION [21], is a simple and fast approximate algorithm for allocating targets to robots which provably computes allocations whose total cost is at most twice as large as the optimal total cost. Skrzypczyk [22] discusses a problem of planning and coordination in a multi robot system and considers a team of robots that performs a global task in a human-made workspace of complex structure. A hybrid architecture of the team motion control system is considered in the work. The system is split into two layers: the planner module and the behavior based collision free motion controller that is designed to perform several elementary navigation tasks. The role of the planner is to plan and coordinate execution of elementary tasks by individual agents to obtain performance of global task. The method of

B.B.Biswal and B.B.Choudhury
International Journal of Engineering, Volume (1) : Issue (2) 15
elementary tasks planning based on N-person game. An algorithm of multi robot workspace exploration is presented as an example of application of the proposed method. Simulation of the algorithm is carried out, and its result is presented and discussed in the paper. Mosteo and Montano[23] discuss a novel approach in networked robotics for optimal allocation with interchangeable objective functions, from minimizing the worst-case cost of any agent in a multi-robot team in time-critical missions, to minimizing the team usage of resources. They propose a general model for flexible mission planning, using hierarchical task networks as descriptive framework, the multiple traveling salesmen as optimization model, and distributed simulated annealing for solution search in very large solution spaces. This proposal does not discard viable solutions, hence the optimal one for the model may be eventually found. Boneschanscher [24] presents a task assigner for a flexible assembly cell (FAC) incorporating multiple robots and a transport system. The FAC can assemble a wide range of products in small batches. Parts are fed on pallets and assembled on fixtures, which both can route through the cell. The FAC has a limited buffer capacity. The task assigner determines a schedule for each batch, with minimum assembly time as the main objective. Task assignment is done for a limited time horizon, using a goal directed search. The time horizon is determined by the limited buffer capacity of the FAC. While assigning tasks to resources in the cell, the task assigner determines an appropriate assembly sequence and allocates tools such as grippers to workstations in the cell. It is evident that the allocation strategy is not a generalist but is situation driven. The present method attempts to develop and implement a suitable model for an implicit cooperation environment based upon the capability of the candidates to handle the tasks.
3. DYNAMIC TASK ASSIGNMENT
In the context of multi-robot coordination, dynamic task allocation can be viewed as the selection of appropriate actions [25] for each robot at each point in time so as to achieve the completion of the global task by the team as a whole. From a global perspective, in multi-robot coordination, action selection is based on the mapping from the combined robot state space to the combined robot action space. For homogeneous robots, it is the mapping;
S
|R| → A
|R|
where, S is the state space of a robot, |R| is the number of robots, and A is the set of actions available to a robot [26]. In practice, even with a small number of robots, this is an extremely high-dimensional mapping, a key motivation for decomposing and distributing control. Based on
FIGURE 1: Evaluation Criteria
Work list task task task
task
required skills
task relationships (task task)
skill set
capability (task workers)

B.B.Biswal and B.B.Choudhury
International Journal of Engineering, Volume (1) : Issue (2) 16
the approach introduced in [27], the task allocation problem is decomposed into the following three steps:
1. each robot bids on a task based on its perceived fitness to perform the task; 2. an auctioning mechanism decides which robot gets the task; 3. the winning robot’s controller performs one or more actions to execute the task. The above decomposition is aimed at constructing a general formulation for the multi-robot coordination problem. In this formulation, a bidding function determines each robot’s ability to perform a task based on that robot’s state. Next, the task allocation mechanism determines which robot should perform a particular task based on the bids. Finally, the robot controllers determine appropriate actions for each robot, based on the robot’s current task engagement. This partitioning, as illustrated in Figure 1, serves two purposes: it reduces the dimensionality of the coordination problem, and it reduces the amount of inter-robot communication required. We now have the mapping
B|R||T |
→ T |R|
Instead of mapping, namely from all robots’ bids B for all tasks T to a task assignment for each robot, this overall mapping is called the task allocation strategy for the system as a whole. The overall mapping is treated here as a global, centralized process (as depicted in Figure 2), but distributed auctioning mechanisms [27, 28], blackboard algorithms [29], and cross-inhibition of behaviors [30] are some validated methods for distributing the task allocation function. In this methodology, the focus is on what the task allocation function should be, rather than on how it should be distributed. The above framework is a general way that dynamic task allocation for multi-robot systems can be formulated.
3.1 Auction Algorithm The auction algorithm is an intuitive method for solving the classical assignment problems. It outperforms substantially its main competitors for important types of problems, both in theory and practice, and is also naturally well suited for parallel computation. In the process, the user submits jobs to the auctioneer to start the process. An auctioneer is responsible for submitting and monitoring jobs on the user’s behalf. The auctioneer creates an auction and sets additional parameters of the auction such as job length, the quantity of auction rounds, the reserve price and the policy to be used. The auctioneer informs the robots (Robot-1, Robot-2 and Robot-3) that an auction is about to start. Then, the auctioneer creates a call for proposals, sets its initial price, and broadcasts calls to all the robots (Robot-1, Robot-2 and Robot-3). Robots formulate bids for selling a service to the user to execute the job. The robots evaluate the proposal; they decide not to bid because the price offered is below what they are willing to charge for the service. This makes the auctioneer to increase the price and send a new call for proposal with this increase in
Fitness
Fitness
Fitness
Engagement Action Robot state
Action
Action Engagement
Engagement
Actions affect the environment
E
Bidding
?
B |T|
T A
Control Task Allocation
(B|T ||R → T |R|)
Sensing
E
nvironm
ent
Robot state
Robot state
S
FIGURE 2: Reducing the Dimensionality of Multi-Robot Coordination

B.B.Biswal and B.B.Choudhury
International Journal of Engineering, Volume (1) : Issue (2) 17
the price. Meanwhile, the auctioneer keeps updating the information about the auction. In the second round, Robots are decided to bid. The auctioneer clears the auction according to the policy specified beforehand. Once the auction clears, it informs the outcome to the user and the robots. The flowchart for the process is presented in Figure 3.
The algorithm described here can be utilized in task allocation in multi-robot applications, and is particularly suitable for parallel computation. This approach attempts to find the best assignment between tasks and robots, while maximizing the total benefit. It iterates between robots and in
Auctioneer increases
the bid price
Yes
No Is accepted by any
Robot(s)
Start
Auctioneer creates an
auction
User, Auctioneer, Robot1, Robot2
and Robot3
User submits job to
Auctioneer
Broadcasts call for proposals to Robot1, Robot2 and Robot3
Stop
Auctioneer compares the bid values & decides the
Winner
Robots send the bid values to Auctioneer
Auctioneer broadcasts auction results to
FIGURE 3: Flowchart of the Auction for Task Allocation

B.B.Biswal and B.B.Choudhury
International Journal of Engineering, Volume (1) : Issue (2) 18
each iterations tries to assign a task to a robot who offers the most. In consecutive iterations, other robots may bid for other tasks and if more than one bids are available for the same task, it will increase the cost of task until finally just one task-robot pair match takes place, (iterative improvement). The iteration terminates when all robots are pleased with their match, otherwise an unhappy robot will bid higher for another task and this process will continue. Although auction algorithm may have some similarities to the free market approach, there is a little difference. One difference is that in the free market approach, agents can cooperate in order to gain a maximum profit for all of them, however in the auction algorithm every robot is considered rival. Another dissimilarity is that the auction algorithm uses an exclusive mathematical model for all the applications, while the free market approach does not. In addition, the free market technique is based on the collection of heterogeneous agents, while in the auction algorithm the robot set is homogeneous. 3.2 Task Allocation Strategies The dynamic task allocation problem, i.e., the mapping from bids to tasks, can be performed in numerous ways. The focus is limited here to Markovian systems, where the task allocation mapping for a given robot is based on the mapping between that robot’s current task assignments and every other robot’s current bid on each task, to the given robot’s new task assignment, as shown in Figure 4. Given each robot’s bid on each task and each robot’s current task engagement, each robot’s new task assignment need to be determined. The effects of two key aspects of distributed control, commitment and coordination, on performance are explored. Given the large space of possibilities, only the extreme cases of each: no commitment and full commitment, and no coordination and full coordination are considered. The combination of these extremes results in four task allocation strategies as shown in Figure 5. Along the commitment axis, a fully committed strategy meant a robot would complete its assigned task before considering any new engagements, while a fully opportunistic strategy allowed a robot to drop an ongoing engagement at any time in favor of a new one. Along the coordination axis, the uncoordinated (individualistic) strategy meant each robot performed based on its local information, while a coordinated strategy simply implemented mutual exclusion, so only one robot could be assigned to a task, and no redundancies were allowed. It is noted that this notion of coordination is simple, and it is not intended to represent explicit cooperation and coordination strategies (i.e., the fixed time-cost was 0). During the process three new tasks appear every twelve time-steps at random positions on the grid. The tasks are structured so that one robot is sufficient for completion of an individual task assignment.
Thus, mutual exclusion is the simplest yet effective form of coordination. As an example, the fully committed mutually exclusive strategy is as follows:
1. If a robot is currently engaged in a task, and its bid on that task is greater than zero, remove the row and column of the bid from the table, and set the robot’s new assignment to its current one. 2. Find the highest bid in the remaining table. Assign the corresponding robot to the corresponding task. Remove the row and column of the bid from the table.
Commitment � Coordination�
Individual Mutually Exclusive
Commitment Strategy.1 Strategy.2
Opportunity Strategy.3 Strategy.4
Current engagement
Bids A B C D New
engagement
A R1 6 4 2 5 ?
-- R2 4 1 0 3 ?
C R3 7 2 3 2 ?
FIGURE 4: An Example Task Allocation Scenario
FIGURE 5: The Four Task Allocation Strategies

B.B.Biswal and B.B.Choudhury
International Journal of Engineering, Volume (1) : Issue (2) 19
3. Repeat from step 2 until there are no more bids. In case of individualistic (uncoordinated) strategies, the same algorithm is run on a separate table for each robot. In the opportunistic (uncommitted) case, step 1 above is skipped.
4. GRID WORLD EXPERMENTAL FRAME WORK
A simplified version of the above described multi-robot task in a grid world is illustrated in Figure 6. As the base case of the grid world implementation, a 10×10 grid inhabited by 10 robots is considered. Robots bid on tasks depending on their capability (expressed by a number) to those tasks. The bid was set to 20 − d, where d is the Manhattan distance to the task. In each time-step, any robot assigned to a particular task selects that task. When a robot selects a task, that task goes off the list and new tasks are added to it. In order to explore the parameter space of the task, we focused on commitment and coordination. In the context of emergency handling, commitment means that robots stay focused on a single task, until the task is over. The opposite, opportunism, means that robots can switch tasks, if for example another task is found with greater intensity or priority. In the experiments, coordination is linked to communication, namely the ability of robots to communicate about who should service which tasks, as opposed to individ-ualism, where robots have no awareness of each other. Communication is used to prevent multiple robots from trying to accomplish the same task; robots inhibit others from engaging in the same task. The goal is to reduce interference among robots, and to prevent loss of coverage in some areas because all the robots rush to perform task in another area. Deciding the level of commitment and collaboration are key aspects of the multi-robot task allocation problem. Four experiments were designed resulting from the combinations in varying the two parameters, coordination and commitment. The results of the grid world simulation are presented in Figure 7. On one axis we test commitment versus opportunism, and on the other we test individualism versus mutual exclusion.
R T
R
R
R
T
T
Strategy: I,O I,C M,O M,C
Results: 980 1045 435 722
FIGURE 7: Results from Base Case Grid World
FIGURE 6: An Example 10 x 10 Grid World with Four Robots and Three Tasks.

B.B.Biswal and B.B.Choudhury
International Journal of Engineering, Volume (1) : Issue (2) 20
5. BLACK BOARD ALGORITHM
In order to ensure reasonable scalability and robustness, communication among the robots is done through a "blackboard"[29]. To simulate experiments with inter-robot communication, each robot sends its relevant state information to the blackboard, and the blackboard information is read by all the robots. In the case of no communication, the blackboard just contains information from one robot (itself). The information on the blackboard is the current engagement of each robot. Intuitively, if all robots have the same blackboard information available and execute the same algorithm, they should all come to the same conclusion as to which robot should pursue which task. To facilitate validation of the experiments, all parameters are held constant, except the way the information on the blackboard is handled. The algorithm for deciding on the allocation of the tasks to individual robots is as follows: Step 1: All robots engaged in a task cannot have their engagement set to “none” Step 2: In case of commitment, all entries in the blackboard for robots already pursuing a task is set to zero, along with all entries for task already being pursued. In case of opportunism, this step is skipped. Step 3: The highest non-zero score in the table is checked, and the robot corresponding to this entry is assigned to the task corresponding to this entry.
TABLE 1: Quantitative Results
This algorithm has the effect that in the case of commitment robots keep themselves engaged in pursuing an task until it is fixed, while in the case of opportunism, robots keep switching engagement.
6. DISCUSSION
The grid world results are interesting if they actually represent real world system behavior. The fact that the best performing task allocation strategy changes as we vary noise parameters in the grid world implies that it can be very difficult to decide apriori which task allocation strategy should be used in a given task for any real world implementation. The quantitative results of the experiments are presented in Table 1. The experiments clearly show that the opportunistic strategy worked significantly better than the commitment-based strategy. This might be because the time to reach a task was significantly larger than the time to complete a task, once a robot was there. This choice of parameters favors opportunism over commitment since the former effectively uses the presence of robots near emergencies by harnessing them immediately. In other regions of the parameter space of the emergency handling task (e.g., where the ratio of time-to-reach-task to time-to-complete-task is small) opportunism might not be as effective. The present study excluded the case where several robots would be required to do a task in a cooperative fashion, a regime in which performance might improve with commitment.
Results Individual Mutual Exclusion
2063 1 2325 2
2016 2 1919 1
Commitment 1786 2 2008 1
1087 0 2061 2
928 0 1406 1
1078 0
Opportunism
1917 0
1322 0
B.B.Biswal and B.B.Choudhury
International Journal of Engineering, Volume (1) : Issue (2) 21
The four task allocation strategies we examined are extreme, in that they take into consideration only the complete presence or absence of commitment and coordination in the given context. Arguably, the best strategy for any particular task would most likely be a carefully balanced compromise. However, as stated previously, the goal of this work was not to attempt to find the best strategy (which is necessarily task- and parameter-specific), but rather to gain some insight into task allocation in general. The four strategies we explored provide a reasonable span of strategy space and provide leading insights for further study. In practice, the robot capability ratings can be obtained from the databases. Therefore, one can automatically select appropriate candidate for a given task by using the proposed matching procedure and databases.
7. CONCLUSION
The paper describes an empirical study that sought general guidelines for task allocation strategies in systems of multiple cooperating robots. Four distinct task allocation strategies are identified that aim at studying tradeoffs between commitment and coordination. The data from the simulations show that there is no single strategy that produces best performance in all cases, and that the best task allocation strategy changes as a function of the noise in the system. This result is significant, and shows the need for further investigation of task allocation strategies. The described work is a small step toward the larger goal of principled analysis and synthesis of multi-robot coordination strategies for complex and uncertain domains, such as space exploration. The entire exercise has relevance to real world distributed robotic systems.
8. REFERENCES
1. Goldberg, D. and Mataric, M. J. “Robust behavior-based control for distributed multi-robot collection tasks”. In T. Balch and L.E. Parker (Eds.) Robot Teams: From Diversity to Polymorphism, 2000
2. Goldberg, D. and Mataric, M.J. “Design and evaluation of robust behavior-based controllers for distributed multi-robot collection tasks”. USC Institute for Robotics and Intelligent Systems Technical Report IRIS-00-387(2000)
3. D. Goldberg and M. J. Mataric, “Interference as a tool for designing and evaluation of robust behavior-based controllers”. In Proceedings of the AAAI-97, Providence, Rhode Island, July, 637-642, 1997
4. Parker, L. E.. L-ALLIANCE: “A Mechanism for adaptive action selection in heterogeneous Multi-Robot teams”, ORNL/TM-13000 (1995)
5. G. Dudek, M. Jenkin, E. Milios, and D. Wilkes. “A taxonomy for swarm robots”. In Proceedings of the IEEE/RSJ International conference on Intelligent Robotics and Systems, 441-447, 1993
6. D. P. Bertsekas. “Auction algorithms for network flow problems: A tutorial introduction”.
Computational Optimization and Applications, 7-66, (1992)
7. S. S. C. Botelho and R. Alami. “M+: A scheme for multi-robot cooperation through negotiated task allocation and achievement”. In Proceedings of the International Conference on Robotics and Automation, 1999
8. M. B. Dias. TraderBots: “A new paradigm for robust and efficient multirobot coordination in dynamic environments”. Ph.D thesis, Robotics Institute, Carnegie Mellon University, January 2004.

B.B.Biswal and B.B.Choudhury
International Journal of Engineering, Volume (1) : Issue (2) 22
9. B. P. Gerkey and M. J. Mataric. Sold!: “Auction methods for multi-robot control”. IEEE Transactions on Robotics and Automation Special Issue on multi-robot Systems, 18(5), 2002
10. M. Golfarelli, D. Maio, and S. Rizzi. “A task-swap negotiation protocol based on the contract net paradigm”. Technical Report 005-97, CSITE (Research Center for Informatics and Telecommunication Systems), University of Bologna (1997)
11. R. Simmons, D. Apfelbaum, W. Burgard, D. Fox, S. Thrun, and H. Younes. “Coordination for multi-robot exploration and mapping”. In Proceedings of the National Conference on Artificial Intelligence, 2000
12. R. Zlot, A. Stentz, M. B. Dias, and S. Thayer. “Multi-robot exploration controlled by a market economy”. In Proceedings of the International Conference on Robotics and Automation, 2002
13. R. Aylett and D. Barnes. “A multi-robot architecture for planetary rovers”. In Proceedings of the 5th
ESA Workshop on Advanced Space Technologies for Robotics and Automation, 1998
14. P. Caloud, W. Choi, J.-C. Latombe, C. L. Pape, and M. Yim. “Indoor automation with many mobile robots”. In Proceedings of the International Workshop on Intelligent Robotics and Systems (IROS), 1990
15. E. Ostergaard, and M.J. Mataric. “Distributed multi-robot task allocation for emergency handling”. In Proceedings of International Conference on Intelligent Robots and Systems, 2001
16. J. Guerrero and G. Oliver.”Physical interference impact in multi-robot task allocation auction methods”. In Proceedings of IEEE Workshop on Distributed Intelligent Systems. pp.19-24, 2006
17. F.Li Lian and R. Murray. “Cooperative task planning of multi-robot systems with temporal constraints”, In Proceedings of International Conference on Robotics & Automation, 2003
18. A. Stentz, and M.B. Dias. “A free market architecture for coordinating multiple robots”. Carnegie Mellon Robotics Institute Tech Report CMU-RI-TR-99-42, December. (1999)
19. M. Shen, G.H.Tzeng and D.R.Liu . “Multi-criteria task assignment in workflow management systems”. In Proceedings of the 36th Hawaii International Conference on System Sciences, 2002
20. L.E. Parker. “ALLIANCE: architecture for fault tolerant multi-robot cooperation”. In Proceedings of IEEE Transactions on Robotics and Automation, Vol. 14, No. 2, 220-240, 1998
21. M. G. Lagoudakis, M. Berhault, S. Koenig, P. Keskinocak and A.J. Kleywegt, “Simple auctions with performance guarantees for multi-robot task allocation”. In Proceedings of IEEEIRSI International Conference on Intelligent Robots and Systems, 2004
22. K.Skrzypczyk. “Game theory based task planning in multi robot systems”. In proceedings of 16th
European Simulation Symposium, 2004
23. A. R. Mosteo and Luis Montano.“Simulated annealing for multi-robot hierarchical task allocation with flexible constraints and objective functions”. Workshop on Network Robot Systems: Toward Intelligent Robotic Systems Integrated with Environments”. IROS, 2006

B.B.Biswal and B.B.Choudhury
International Journal of Engineering, Volume (1) : Issue (2) 23
24. N. Boneschanscher, “Task assignment for a small batch flexible manufacturing assembly cell incorporating multiple robots”. In Proceedings of IEEE, 1990
25. Maes, P. “Modeling adaptive autonomous agents”. Artificial Life, I, 1(2),135-162, 1994
26. Mataric, M.J., Sukhatme, G.S., et al. “Multirobot Task Allocation in uncertain Environment”.Autonomous Robots, Vol. 14, 255-263, 2003
27. Gerkey,B.and Mataric, M.J. “Principled communication for dynamic multi-robot task allocation”. Experimental Robotics VII, LNCIS 271, D. Rus and S. Singh (Eds.), Springer-Verlag: Berlin, 353-362,2001
28. M.B.Dias, and A.T.Stentz, “A free market architecture for distributed control of a multirobot system”. In Proceedings of the 6th International Conference on Intelligent Autonomous Systems (IAS-6), 115— 122, 2000
29. Corkill, D.D. “Blackboard systems”. AI Expert, 6(9), 40-47, 1991
30. B.Werger, and M.Mataric, “Broadcast of local eligibility for multi-target observation”. In
Proceedings of the 5th International Symposium on Distributed Autonomous Robotic Systems (DARS), Knoxville, TN, Oct. 4-6, 347-356, 2000

Rodziah Atan, Abdul Azim Abd. Ghani, Mohd. Hasan Selamat, Ramlan Mahmod
International Journal of Engineering, Volume (1) : Issue (2) 24
Automating Measurement for Software Process Models using Attribute Grammar Rules
Rodziah Atan Information Systems Department [email protected] Faculty of Computer Science and Information Technology University Putra of Malaysia Serdang 43400, Selangor, Malaysia
Abdul Azim Abd. Ghani Information Systems Department [email protected] Faculty of Computer Science and Information Technology University Putra of Malaysia Serdang 43400, Selangor, Malaysia
Mohd. Hasan Selamat Information Systems Department [email protected] Faculty of Computer Science and Information Technology University Putra of Malaysia Serdang 43400, Selangor, Malaysia
Ramlan Mahmod Multimedia Department [email protected] Faculty of Computer Science and Information Technology University Putra of Malaysia Serdang 43400, Selangor, Malaysia
Abstract
The modelling concept is well accepted in software engineering discipline. Some software models are built either to control the development stages, to measure program quality or to serve as a medium that gives better understanding of the actual software systems. Software process modelling nowadays has reached a level that allow software designs to be transformed into programming languages, such as architecture design language and unified modelling language. This paper described the adaptation of attribute grammar approach in measuring software process model. A tool, called Software Process Measurement Application was developed to enable the measurement accordingly to specified attribute grammar rules. A context-free grammar to read the process model is depicted from IDEF3 standard, and rules were attached to enable the measurement metrics calculation. The measurement metric values collected were used to aid in determining the decomposing and structuring of processes for the proposed software systems.
Keywords: Software process modelling, Process measurement, Attribute grammar rules.
1. INTRODUCTION
Developing reliable software within time scheduled and cost estimated is a difficult task for many software development companies. Any flaws or late delivery of a system means a great deal for many individuals involved. It is indeed vital to produce reliable software right on schedule to avoid inconveniences for the developers, vendors and users. The software community places great hope
Rodziah Atan, Abdul Azim Abd. Ghani, Mohd. Hasan Selamat, Ramlan Mahmod
International Journal of Engineering, Volume (1) : Issue (2) 25
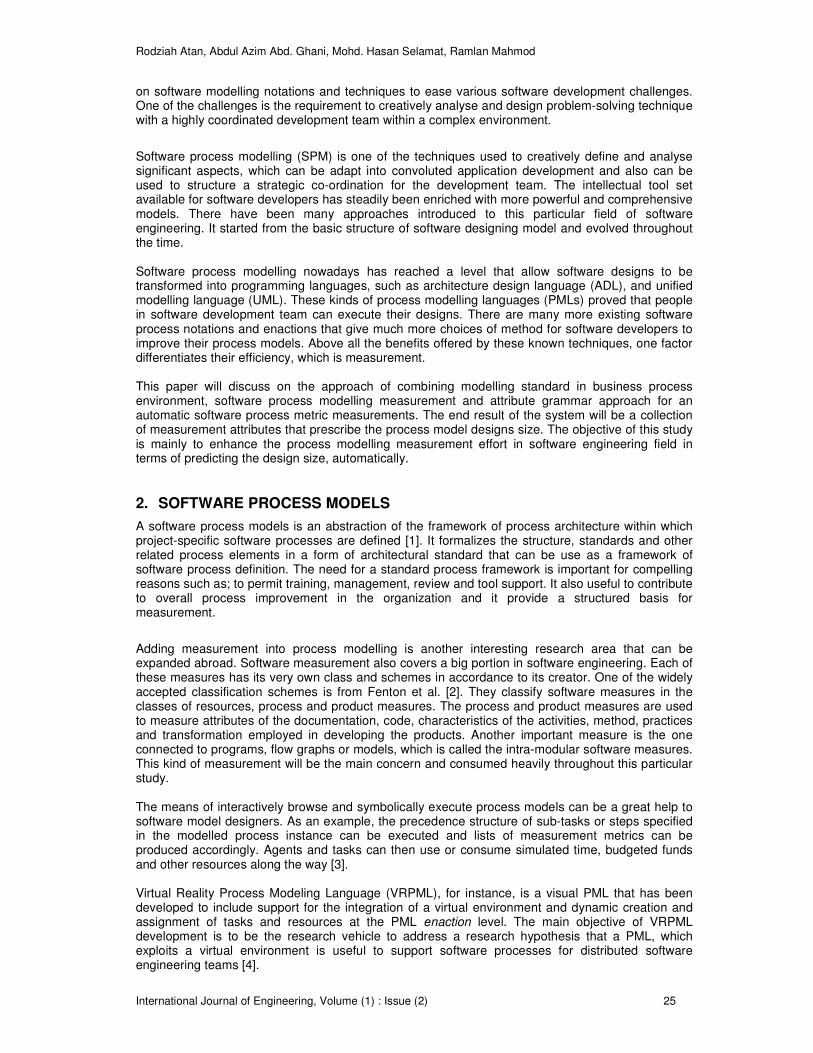
on software modelling notations and techniques to ease various software development challenges. One of the challenges is the requirement to creatively analyse and design problem-solving technique with a highly coordinated development team within a complex environment.
Software process modelling (SPM) is one of the techniques used to creatively define and analyse significant aspects, which can be adapt into convoluted application development and also can be used to structure a strategic co-ordination for the development team. The intellectual tool set available for software developers has steadily been enriched with more powerful and comprehensive models. There have been many approaches introduced to this particular field of software engineering. It started from the basic structure of software designing model and evolved throughout the time. Software process modelling nowadays has reached a level that allow software designs to be transformed into programming languages, such as architecture design language (ADL), and unified modelling language (UML). These kinds of process modelling languages (PMLs) proved that people in software development team can execute their designs. There are many more existing software process notations and enactions that give much more choices of method for software developers to improve their process models. Above all the benefits offered by these known techniques, one factor differentiates their efficiency, which is measurement.
This paper will discuss on the approach of combining modelling standard in business process environment, software process modelling measurement and attribute grammar approach for an automatic software process metric measurements. The end result of the system will be a collection of measurement attributes that prescribe the process model designs size. The objective of this study is mainly to enhance the process modelling measurement effort in software engineering field in terms of predicting the design size, automatically.
2. SOFTWARE PROCESS MODELS
A software process models is an abstraction of the framework of process architecture within which project-specific software processes are defined [1]. It formalizes the structure, standards and other related process elements in a form of architectural standard that can be use as a framework of software process definition. The need for a standard process framework is important for compelling reasons such as; to permit training, management, review and tool support. It also useful to contribute to overall process improvement in the organization and it provide a structured basis for measurement.
Adding measurement into process modelling is another interesting research area that can be expanded abroad. Software measurement also covers a big portion in software engineering. Each of these measures has its very own class and schemes in accordance to its creator. One of the widely accepted classification schemes is from Fenton et al. [2]. They classify software measures in the classes of resources, process and product measures. The process and product measures are used to measure attributes of the documentation, code, characteristics of the activities, method, practices and transformation employed in developing the products. Another important measure is the one connected to programs, flow graphs or models, which is called the intra-modular software measures. This kind of measurement will be the main concern and consumed heavily throughout this particular study.
The means of interactively browse and symbolically execute process models can be a great help to software model designers. As an example, the precedence structure of sub-tasks or steps specified in the modelled process instance can be executed and lists of measurement metrics can be produced accordingly. Agents and tasks can then use or consume simulated time, budgeted funds and other resources along the way [3].
Virtual Reality Process Modeling Language (VRPML), for instance, is a visual PML that has been developed to include support for the integration of a virtual environment and dynamic creation and assignment of tasks and resources at the PML enaction level. The main objective of VRPML development is to be the research vehicle to address a research hypothesis that a PML, which exploits a virtual environment is useful to support software processes for distributed software engineering teams [4].

Rodziah Atan, Abdul Azim Abd. Ghani, Mohd. Hasan Selamat, Ramlan Mahmod
International Journal of Engineering, Volume (1) : Issue (2) 26
The VRPML exploits virtual environment at PML enactment level, which allows work context for a particular activity to be defined and later be opened as a workspace in a virtual environment [5]. The said activity will later be enabled using the task-centred mapping whereby each activity in a software process corresponds to a room in a virtual environment [6]. Figure 1 shows an example workspace in VRPML system.
FIGURE 1: Example Workspace
A role specific process model (i.e. view) might be developed to formalise process models, which leads to different views of the processes. Because the roles collaborate, some information is common in views of different roles. Thus the software process models related to several roles should be integrated in order to allow for better coordination on basis of a consistent and less redundant software process models. Such an explicit representation of processes performed by multiple roles is called a comprehensive software process model. Comprehensive software process model can be used to represent important processes of a software development project. In this case, it serves as a basis of a central information system to guide, coordinate, and support the different roles. Developing software systems is not an easy task. Many software systems face the risks of having flaws and malfunctions. Errors found during delivering the software system is highly potential been caused by the failure while coding the system, or it should be happening while designing the product. Repairing the ‘completed’ software system costs a lot. The best opportunity for short-term software cost reduction is to eliminate rework or fixing defects, which is more than 33 percent of developing new software systems [7].
The problem of reworking a software system can be avoided by tackling the problem far before the system is developed. How is it possible? Some would answer by strictly outlined the system requirements, or choosing the programming approach that flawless, or employ a highly competent programmers. Another question will arise, is the approach really going to ensure that the system is error free? The second question should be harder to answer than the first one. Software process modelling and process definition is not a new topic of interest in software engineering community. The said quality and productivity of software often can be improved by a well defined and managed processes, together with estimated and measured results of designed processes. Software process modelling and definition offered many benefits to the practitioners. It supported many objectives such as facilitating human understanding and communications, support process management and to provide automated execution support.
ActivityName = Activity A, 2, ActivityType = General Purpose, Role = DsgnEngr AssignedEngineer = Unspecified, Artefact = Design Document, Path/Url for Modified Design, Read, Path/Url for tool, Artefact = Requirement Change, Path/Url for Req. Change, Read, Path/Url for tool, Artefact = Source Code, Path/Url for Source Code, Read/Write, Path/Url for tool, Tool = Email Program, Email, Path/Url for tool, Transition = D, Transition Done, Non-Decomposable, 5, Description = Put the description of the activity here.

Rodziah Atan, Abdul Azim Abd. Ghani, Mohd. Hasan Selamat, Ramlan Mahmod
International Journal of Engineering, Volume (1) : Issue (2) 27
The prototype tool described in this paper use a context-free grammar to read the process model, which was adapted from part of Backus-Naur Form (BNF) of the process definition standard used – the IDEF3 standard. The proposed prototype is able to count process models’ measurement metrics, which can be exploit to measure physical decomposition and structuring strategy of software systems’ designs.
3. PROCESS MODELLING TECHNIQUE
The prototype tool that was created, called the Software Process Model Measurement Application (SPMA) used a modelling technique which was adapted from Integrated Definition for Process Description Capture (IDEF3) [4] standard approach. Integrated Definition (IDEF) is a set of standardized methods for structuring and refining functional overview of an environment [8]. Starting from IDEF0 up to IDEF14, all these methods are highly consumed by many organizations and companies intending to upgrade the functional flow of their working environments. The specific IDEF3 or the Integrated Definition method for Process Description Capture can be used independently or combined with other family members’ methods for documentation, analysis and improvement. IDEF3 is a description of the real world in a form of model structure.
Features and functions defined in this standard were highly employed by business process engineers in order to enhance the capability of their business process workflow settings. IDEF3 is divided into two parts of representing the knowledge acquisition of a process, namely process-centred and object-centred strategies. These two main categories of IDEF3 are for the flexibility of the users to model their environments in which one approach they know best. This research used the process-centred strategy to solve its complexity. The reason to choose IDEF3 process-centred strategy for process modelling is based on its organized way on modelling processes with temporal, causal and logical relation within a scenario of a modelled environment. Figure 2 shows the framework for SPMA model.
FIGURE 2: SPMA model framework
Although there exist many process modeling measurement applications, they usually have their very own measuring elements acting as additional features for their knowledge procurement for particular cases that they handled. In conjunction to this, SPMA fashioned its very own technique that collaborate business process modeling into software models development and process measurement. The software flow design which is created using IDEF3 method is converted into context free language that reads and interpret the whole process model design prior to analysis and measurement summary. Attribute grammar element is also essential to SPMA model. It works as an agent that follow the flow of particular measurement metrics that has been assigned to the processes. The analysis of the attribute flow is then summarized and output a list of measurement attributes related to the software
R a w P ro c e s s M o d e lin g D e s ig n
T ra n s fo r m In to ID E F 3 M o d e l D e s ig n
M o d e l D e s ig n to ID E F 3 C o n te x t -f re e L a n g u a g e
S o f tw a re
P ro c e s s
M e a s u r e m e n t
A p p lic a t io n
S y s te m
O u tp u t - P ro c e s s M o d e l M e a s u r e m e n t A ttr ib u te s

Rodziah Atan, Abdul Azim Abd. Ghani, Mohd. Hasan Selamat, Ramlan Mahmod
International Journal of Engineering, Volume (1) : Issue (2) 28
process design. Some of the attributes examined are such as the process depth level, number of related sub-processes and the type of the design which basically horizontal or vertical.
3.1 SPMA Environment
As depicted from Figure 2, the process flow diagram created in IDEF3 structure should then be converted into IDEF3 language. The language consists of statements describing the declarations of sub processes, single processes, functional and junction statements and some other attributes such as the identifiers and the information flows either getting in the process or out from the processes, accordingly to IDEF3 structural design. Figure 3 shows an example of IDEF3 process-centred process schematic view of the scenario for material purchase process.
XX
O b ta in
A c co u n t
M a n a g er ’s
a p p ro v a l
1 .1 .8 O b ta in
au th o riza tio n
s ig n a tu re
1 .1 .9
S u b m it
s ig n ed
P u rc h a se
R eq u e st
1 .1 .1 0
R eq u e st
m a te r ia l
1 .1 .7
R e q u es t
m a te ria l
1
X X
Id e n tify
c u rre n t
su p p lie r
3
E v a lu a te
b id s
5
R e q u e st
b id s
4
Id e n tity
p o ten tia l
su p p lie rs
2 O rd e r
r eq u e st
m a te ria ls
6
FIGURE 3: IDEF3 process model scenario The idea of integrating software process modelling with business process modelling diagramming technique is a niche to this study. The stated design as shown in Figure 3 alone cannot be executed to produce lines of measurement attributes unless it is converted into a form that can be read automatically to produce specific metrics’ calculation. This is the reason why the design has to be converted into context–free grammar form as shown in Figure 4, called the IDEF3-SPMA language.
FIGURE 4: IDEF3-SPMA language 3.2 Software Process Measurement There are many existing effort of researches to deal with software process modelling, but there is still a lacking of process model measurement. Some of the examples are like Bassili and Weiss
<spmadl> : <dll> | error ‘\n’ <dll> : PROCESS IDENT’;’ <subprocesses> END <subprocesses> : <subprocess_spec> | <subprocesses> <subprocess_spec> <subprocess_spec> : PROC IDENT io_data’;’ <dl>
END_PROC <dl> : <sub_proc> | <bool_proct> | <sing_proc> | <dl><sub_proc> | <dl><bool_proc> | <dl><sing_proc> <sub_proc> : IDENT <io_data> ASSIGN CALL ‘{‘IDENT’}’’;’ | IDENT <io_data> ASSIGN SUB ‘{‘IDENT’}’’;’ <bool_proc> : <junction><io_data> ‘{‘<subjunc>’}’’;’

Rodziah Atan, Abdul Azim Abd. Ghani, Mohd. Hasan Selamat, Ramlan Mahmod
International Journal of Engineering, Volume (1) : Issue (2) 29
(1984) [9], whom consider the measurement process and its validation, but do not couple the measurement process with software process. Pfleeger and McGowan (1990) [10], associated sets of measures with the levels of the CMM, but do not define nor use it. The study use attribute grammar (AG) approach to measure process models. AG was selected because of its specification and automatic construction of language-based editors. Attribute grammar also provides a formal yet intuitive notation for specifying a static semantics of programming languages and has been variously used for constructing compiler generator systems. This unique characteristic of AG benefited much for this research. Each semantic rule associated with a production rule either defines a synthesized attribute of the syntactic construct named on the left-hand side (lhs) or to define an inherited attribute of a syntactic construct on the right-hand side (rhs) of the production. In order to describe the occurrences of synthesising or inheriting attribute, shown in Figure 5 is an example of attribute grammar description specification.
FIGURE 5: An attribute grammar description specification
3.3 IDEF3-SPMA Language
Formal definition of IDEF3-SPMA language is developed in order to give users a precise description of how to create acceptable design input as well as providing the instructors a reference model. There are two phases of language definition; the syntax definition and semantic description. A set of production rules is used to specify the syntax of IDEF3-SPMA language. Each production specifies the manner in which a particular syntactic category (e.g. a clause) can be formed. Syntactic categories have names, which are used in productions and are distinguished from names and reserved words in the language. The syntactic categories can be mixed in productions with terminal symbols, which are actual symbols of the language itself. Thus, by following the productions until terminal symbols are reached, the set of legal programs can be derived. IDEF3-SPMA language is small and it has 14 described production rules, as follows; 1. <spmadl> ::= <dll> 2. <dll> ::= PROCESS <ident>’;’ <subprocesses> END 3. <subprocesses> ::= /*empty*/ | <subprocess_spec>
| <subprocess_spec> <subprocesses> 4. <subprocess_spec> ::= PROC <ident> <io_data>’;’ <dl> END_PROC 5. <dl> ::= <sub_proc> | <bool_proc> | <sing_proc> | <dl> <sub_proc> | <dl> <bool_proc> | <dl> <sing_proc> 6. <sub_proc> ::= <ident> <io_data> ASSIGN CALL ‘{‘<ident>’}’’;’ | <ident> <io_data> ASSIGN SUB ‘{‘<proc_list>’}’’;’
(1) <numb> ::= ‘one’
[VAL↑numb = VAL 1] | etc (2) <summ> ::= <numb>
[VAL↑summ = VAL↑numb] | <numb> “plus” <summ>
[VAL↑numb + VAL↑summ] | <expr> (3) <subtr> ::= <numb> ‘minus’ <numb>
[VAL↑subtr = VAL↑numb - VAL↑numb (4) <comp> ::= <subtr> | <summ> (5) <br_comp> ::= ‘(‘<comp>’)’
[VAL↑br_comp = VAL↑comp] (6) <expr> ::= <br_comp>
[VAL↑expr = VAL↑br_comp | ‘minus’ <br_comp>
[VAL↑expr = - VAL↑br_comp]
The attribute grammar notation illustrates simple
addition and subtraction arithmetic operations. This
grammar assumes that all values are in integers and just
involving only synthesised attributes. The bold text
constitutes a context-free grammar for the language’s
expressions. The attributes involved are VAL↑summ,
VAL↑numb, VAL↑subtr, VAL↑comp, VAL↑br_comp
and VAL↑expr.
(1)the value of VAL↑numb is initially been set to ‘one’
or other integer numbers. In production
(4) the value of VAL↑comp depends on either the
operation is subtr of sum. The VAL↑summ in
production
(2) is obtained from the operation rule of ‘the
synthesised numb attribute value plus the synthesised
summ attribute value’ (VAL↑numb ‘+’ VAL↑summ).

Rodziah Atan, Abdul Azim Abd. Ghani, Mohd. Hasan Selamat, Ramlan Mahmod
International Journal of Engineering, Volume (1) : Issue (2) 30
7. <bool_proc> ::= <junction> <io_data> ‘{‘<subjunc>’}’’;’ 8. <subjunc> ::= ‘[‘<proc_list>’]’ <io_data>’,’ CALL ‘{‘<ident>’}’’;’ 9. <junction> ::= AND | OR | XOR 10. <sing_proc> ::= <ident> ASSIGN ‘{‘’}’’;’ | <ident> <io_data> ASSIGN ‘{‘’}’’;’ 11. <proc_list> ::= <ident> | <proc_list>’,’ <ident> | <proc_list>’,’ <junction> ‘(‘<proc_list>’)’’,’ <ident> 12. <io_data> ::= ‘(‘<var_inout>’)’ 13. <var_inout> ::= <ident> <iodata> | <var_inout>’,’ <ident> <iodata> 14. <iodata> ::= IN | OUT | INOUT The defined IDEF3-SPMA language is able to gather and summarize information from the input process design. Source code metric definition using attribute grammar can be produced directly from the input source code. Design metric should have representation, which is able to abstractly show the process design at the early stage of the development. To this extend, the representation used is the design language specification.
4. IDEF3-SPMA INTERPRETER
The IDEF3 language is compiled using a C routine that was created using Flex and Bison tool. Flex and Bison are tools that can be used to help write compilers and interpreters or any program whose input has a well-defined structure [10]. Flex reads a specification file containing regular expressions for pattern matching. Diagram in Figure 6 shows the interpreter function of SPMA model during its execution.
Source
code
input
lexical
analyser
parser common
metrics
format
character
string
request
tokens
pass
tokens
output
FIGURE 6: Interpreter function in SPMA model
Measurement within this study circles the area of process part of the system. The basic objective of the measurement is to measure the level of integration among the processes, the relationship between the stated unit of behaviors (UOBs) and the counts of hierarchy and UOBs used within a specified system or subsystems. AGs have a clear distinction between inherited and synthesized attributes, together with grammars that are quite visible [11].
5. SPMA EXECUTION
To execute SPMA tool, there are four stages of operation that should be followed sequentially, as described before. The first one is to get a problem or a requirement of a system, then the user must represent the process model in IDEF3 description before moving on to stage three, i.e. converting the representation into IDEF3-SPMA language accordingly to the defined syntax rules. After that, if there is no syntax error found in the input lines, SPMA tool executes and read the input to calculate its measurement metrics determined by the system. Figures 7 through 10 show the interfaces in SPMA model execution.

Rodziah Atan, Abdul Azim Abd. Ghani, Mohd. Hasan Selamat, Ramlan Mahmod
International Journal of Engineering, Volume (1) : Issue (2) 31
FIGURE 7: Choosing file function in SPMA model
Figure 7 show the case where user clicks on Open operation where a popup Open window will appear. User can search and select existing input file from the window.
FIGURE 8: Compile function in SPMA model
Figure 8 depicted the second interface option in SPMA which is the Compile function. The operations are necessary each time before executing the system. This is to ensure that the parser and analyser used are the most current ones. The three compilation stages are the Flex, Bison and GCC.

Rodziah Atan, Abdul Azim Abd. Ghani, Mohd. Hasan Selamat, Ramlan Mahmod
International Journal of Engineering, Volume (1) : Issue (2) 32
FIGURE 9: Execute function in SPMA model
Once a user tries to compile the analyser and parser, a popup message will appear (shown in Figure 9), to verify that the user is intentionally compiling the lexical analyser and the parser. Users just have to click on Yes or No to confirm on their action.
FIGURE 10: Output file generated by SPMA model If the input design has error/s, a message error will appear telling there has been an error inside the input file and correction is needed. For an error free file, the users can open the output file (Figure 10) using the names they have defined before. Other characteristic of this language-based metrics calculation tool is that it provides suggestions or advises for the users. The appropriate advice will be appended to the output file in terms of clarifying the meanings of the stated list of output. Advice in this context means to narrate the metric values and define what’s “Good” with the produced metric values [12]. Based on survey to six software analysts and process design experts (expert here means more than 10 years of experience in software design and development), the process model design size produced by this study is divided into three categories. Corresponding advices are given to define the “Good” out of the size value produced. The advices for the three categories are defined as follows:
1. Small: This category is for designs with size ranged from 1 to 300 elements in process
structure. The advice given to this range is “This design falls into small model design category. The design can be implemented by three (3) persons per team within four (4) months.

Rodziah Atan, Abdul Azim Abd. Ghani, Mohd. Hasan Selamat, Ramlan Mahmod
International Journal of Engineering, Volume (1) : Issue (2) 33
2. Medium: This category is for designs with size ranged from 301 to 1000 elements in process structure. The advice given to this range is “This design falls into medium model design category. The design can be implemented by three (3) persons per team within eight (8) months.
3. Large: This category is for designs with size ranged from 1000 and above elements in process structure. The advice given to this range is “This design falls into large model design category. The design can be implemented by three (3) persons per team within sixteen (16) months.
A set of questionnaire was used to gather expert view to validate the categories listed above.
6. CONCLUSION
The method is hoped to be able to facilitate process modelling environment with an executable measuring tool which can be used and ported anywhere. The executable software process model measurement tool will beneficial to software design analyst whom responsible to create a reliable, extensible and logical designs of software systems. The suitability between both business and software process models showed that there is not much difference between them as they were referring to the same set of process modelling objectives.
7. REFERENCES
1. W. S. Humphrey, “The Software Engineering Process: Definition and Scope”. In Proceedings of the 4
th International Conference on Software Engineering: Representing and Enacting the
Software Process, ACM, 1988 2. N. E. Fenton and S. L. Pfleeger, “Software Metrics: A Rigorous & Practical Approach”, 2
nd
Edition, PWS Publishing Company, pp. 21-79 (1997) 3. P. Mi, and W. Scacchi, “A Knowledge –Based Environment for Modelling and Simulating
Software Engineering Processes”, IEEE Transition Knowledge and Data Engineering, 2(3):283-294,1990
4. K. Z. Zamli, “Supporting Software Processes for Distributed Software Engineering Teams” PhD
Thesis. School of Computing Science, The University of Newcastle Upon Tyne, 2003 5. K. Z. Zamli, N. A. M. Isa, "Modeling and Enacting Software Processes: The How and Why
Questions", Technical Journal PPKEE, 10(1), 2004 6. J. C. Doppke, D. Heimbigner, and A. L. Wolf, “Software process and Execution within Virtual
Environments”, ACM Transactions on Software Engineering and Methodology, 7(1) 1997 7. R. B. Grady, “Successful Software Process Improvement”, Prentice-Hall, (1997) 8. R. J. Mayer, et al., “Information Integration for Concurrent Engineering (IICE): IDEF3 Process
Description Capture Method Report”, Interim Technical Report for Period April 1992 – September 1995, (1995)
9. R. A. Frost, “Constructing Programs as Executable Attribute Grammars”, The Computer Journal,
35(4) (1992) 10. T. Mason, and D .Bough, “UNIX Programming Tools: lex & yacc”, O’Reilly & Association Inc.,
(1990) 11. A. A. A. Ghani, “On Software Metrics Definition, Automated Data Collection and Related
Standard Issues”, PhD Thesis, University of Strathclyde, 1993 12. L. L. Westfall, “Seven Steps to Designing a Software Metric”, Benchmark QA: White Papers.
http://www.benchmarkqa.com/index_resources_whitepapers.htm. Accessed on 13th January 2006
