international journal of scientific & technology …...sketch geological map of nigeria showing...
TRANSCRIPT
INTERNATIONAL JOURNAL OF SCIENTIFIC & TECHNOLOGY RESEARCH VOLUME 6, ISSUE 08, AUGUST 2017 ISSN 2277-8616
415 IJSTR©2017 www.ijstr.org
Geology, Mineralogy And Geochemistry 0f Koton-Karfe Oolitic Iron Ore Deposit, Bida Basin. Kogi
State, Nigeria
A. Imrana, Dr.I.V Haruna
ABSTRACT: Geochemical investigation of koton karfe Oolitic iron ore was carried out in order to provide comprehensive data on the geochemical and mineralogical composition. The investigation involved mineral phase analysis, major elements and grade determination. Result the XRF analysis shows high Iron (Fe2O3) content ranging from 63.46% to 74.38%. Aluminum (Al2O3) and silica (SiO2) contents are also fairly high ranging from 7.60% - 16.85% and 7.81% -18.55% respectively. Phosphorous content ranges from 0.89% - 1.20% and sulfur content between 0.07% - 0.26%. In addition, the ores contain other impurities such as CaO, MgO, TiO2 and MnO which exist in considerable negligible amounts. Petrographic studies revealed that most samples contain Goethite as the major Iron ore mineral with some minor amount of Hematite and Quartz as the gangue mineral. The quality of this ore was compared to generalized world standards and ores from other parts of Nigeria and other nations. This comparison shows that Koton Karfe Oolitic iron ore is of low grade with average grade of 47.43% and contain high percentages of gangue (silicates and Aluminum), impurities and deleterious elements, phosphorous and sulphur which are all above the permissible limit.
————————————————————
1. INTRODUCTION Classification of any deposit is usually the first criteria to employ before any processing takes place. To achieve this, the quantity, grade, densities, shape, and physical characteristics are determined. Such determination allows appropriate application of technical and economic parameters to support production planning and evaluation of the economic viability of deposits. In proposing a model for the formation of minette-type ironstones [1], opined that iron which had concentrated initially on continents were later subjected to deep weathering and erosion in a warm, humid climatic regime. The lateritic soils and ooids were then transferred into a shallow marine environment, either by flooding during transgression or by erosion during regression, to be reworked and concentrated in fluvio-deltaic or littoral settings. Unlike the relatively simple processes invoked to explain the formation of bog ores, ironstones appear to require a combination of specific environmental conditions, as well as a variety of processes (including oxidation–reduction, diagenesis, mechanical sedimentation, and microbial activity), to form substantial deposits. [2] Iron is the most abundant rock forming element and composes about 5% of the Earth's Crust. The most importantly used iron-bearing minerals from which iron compounds can be extracted includes: hematite, Fe2O3 (70% Fe); magnetite, Fe3O4 (72% Fe) and of much less importance: limonite, 2Fe2O3·3H2O (60% Fe); siderite, FeCO3 (48.3% Fe); pyrite, FeS2 (46.6% Fe) [3], where these iron percentages are in their pure states.
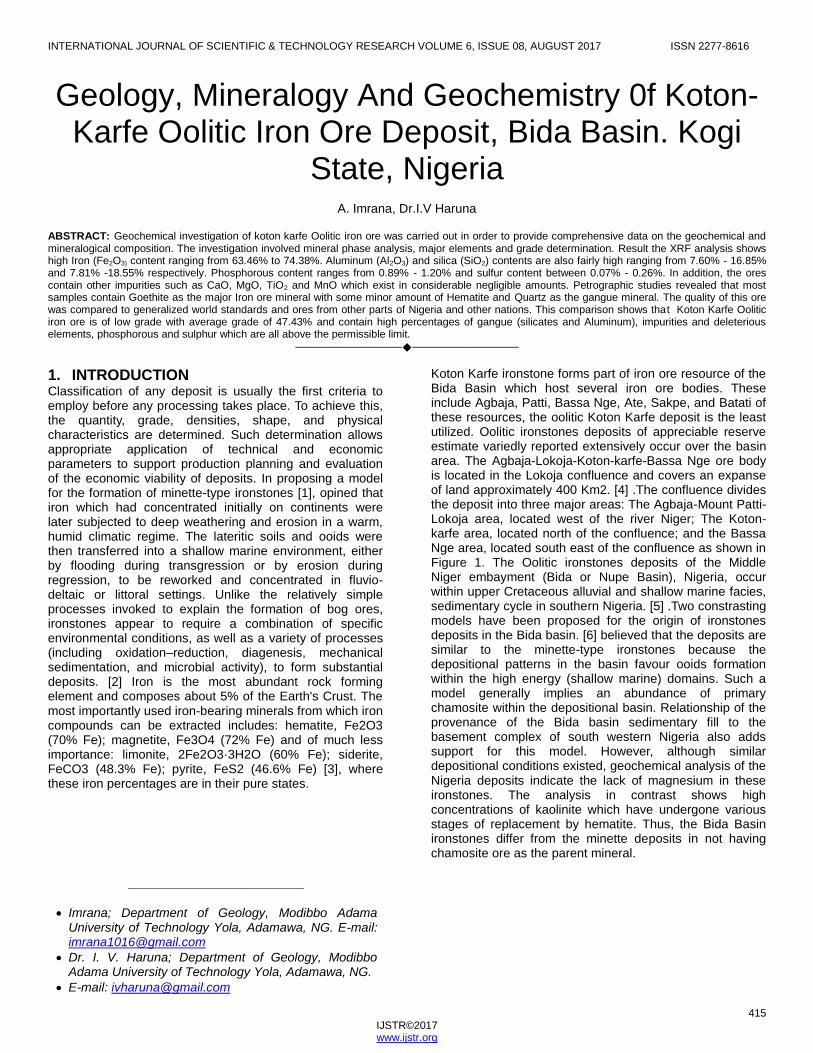
Koton Karfe ironstone forms part of iron ore resource of the Bida Basin which host several iron ore bodies. These include Agbaja, Patti, Bassa Nge, Ate, Sakpe, and Batati of these resources, the oolitic Koton Karfe deposit is the least utilized. Oolitic ironstones deposits of appreciable reserve estimate variedly reported extensively occur over the basin area. The Agbaja-Lokoja-Koton-karfe-Bassa Nge ore body is located in the Lokoja confluence and covers an expanse of land approximately 400 Km2. [4] .The confluence divides the deposit into three major areas: The Agbaja-Mount Patti-Lokoja area, located west of the river Niger; The Koton-karfe area, located north of the confluence; and the Bassa Nge area, located south east of the confluence as shown in Figure 1. The Oolitic ironstones deposits of the Middle Niger embayment (Bida or Nupe Basin), Nigeria, occur within upper Cretaceous alluvial and shallow marine facies, sedimentary cycle in southern Nigeria. [5] .Two constrasting models have been proposed for the origin of ironstones deposits in the Bida basin. [6] believed that the deposits are similar to the minette-type ironstones because the depositional patterns in the basin favour ooids formation within the high energy (shallow marine) domains. Such a model generally implies an abundance of primary chamosite within the depositional basin. Relationship of the provenance of the Bida basin sedimentary fill to the basement complex of south western Nigeria also adds support for this model. However, although similar depositional conditions existed, geochemical analysis of the Nigeria deposits indicate the lack of magnesium in these ironstones. The analysis in contrast shows high concentrations of kaolinite which have undergone various stages of replacement by hematite. Thus, the Bida Basin ironstones differ from the minette deposits in not having chamosite ore as the parent mineral.
_________________________
Imrana; Department of Geology, Modibbo Adama University of Technology Yola, Adamawa, NG. E-mail: [email protected]
Dr. I. V. Haruna; Department of Geology, Modibbo Adama University of Technology Yola, Adamawa, NG.
E-mail: [email protected]
INTERNATIONAL JOURNAL OF SCIENTIFIC & TECHNOLOGY RESEARCH VOLUME 6, ISSUE 08, AUGUST 2017 ISSN 2277-8616
416 IJSTR©2017 www.ijstr.org
Fig 1.Sketch Geological Map of Nigeria Showing the Location of Koton Karfe Iron Ore Deposit. Akande et al (2005)
INTERNATIONAL JOURNAL OF SCIENTIFIC & TECHNOLOGY RESEARCH VOLUME 6, ISSUE 08, AUGUST 2017 ISSN 2277-8616
417 IJSTR©2017 www.ijstr.org
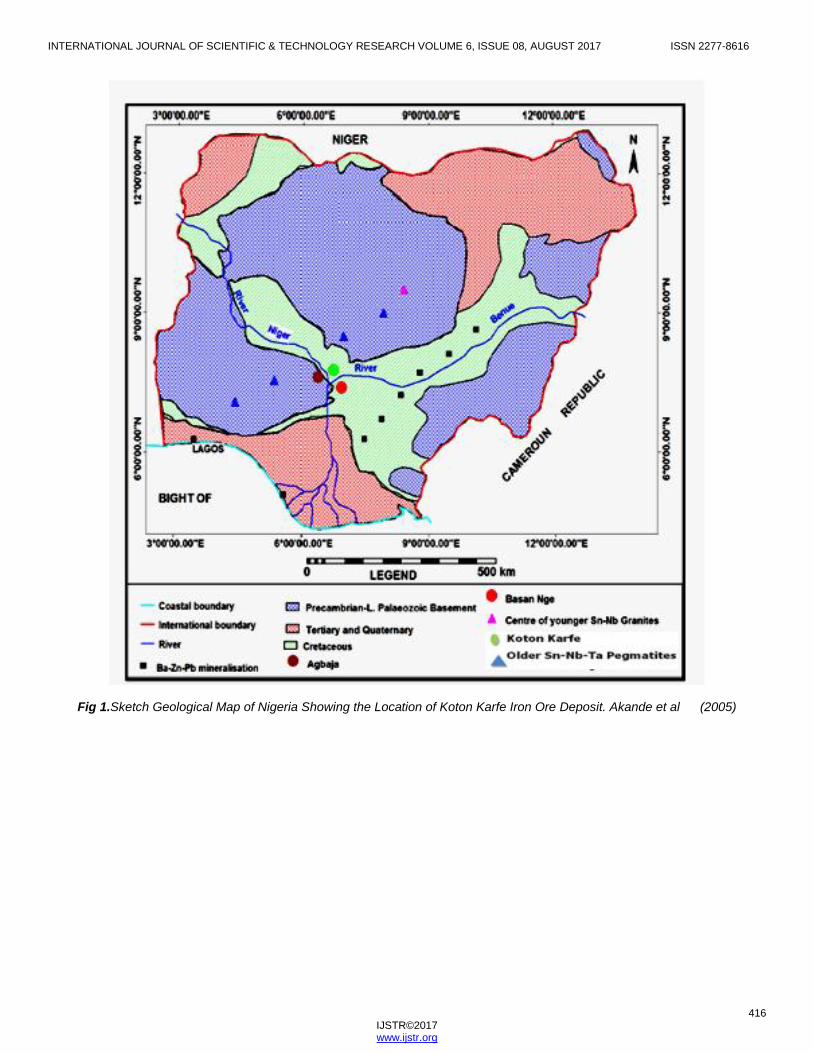
Fig2. Topographical map of the study area with sample location (Nigerian Geological Agency 2013)
2. MATERIALS AND METHODS.
Sample Collection and Analysis. Geological mapping was carried out by detailed traversing of the study area, critically observing the different formation and exposures, along Koton Karfe – Onzo- Osuku axis. Offsets were made from place to place along the traverse on either side into the bush for investigation. Also, dry river channels, footpaths, ridge tops and their steep slopes were carefully traversed. A total of forty (40) samples were collected with the aid of geological hammer and chisel, which were labeled with masking tape and marker. Representative samples from the area of study were coded and sent for geochemical and petrographic analysis. For geochemical analysis, Ten (10) representative samples were sent to National Steel Raw Materials Exploration Agency, Kaduna Geochemical Analysis. For Mineralogical analysis, representative samples were prepared in the Department of Geology, Modibbo Adama University of Technology, Yola for petrographic studies. At the NSRMEA, the sample were crushed and ground using the Denver crusher (JC - 300) and ball milling machine (GMO85) respectively and mixed with polyvinyl alcohol (PVA) binder then pressed into a pellet using a 10 ton press. The analytical data were analysed using sequential XRF with Win XRF software. A blank and certified reference material was analyzed with the sample to ascertain accuracy of the result. Petrographic analysis was performed on eight samples of the iron ore. This was done by studying the thin section under a petrographic microscope
3. RESULT AND DISCUSSION
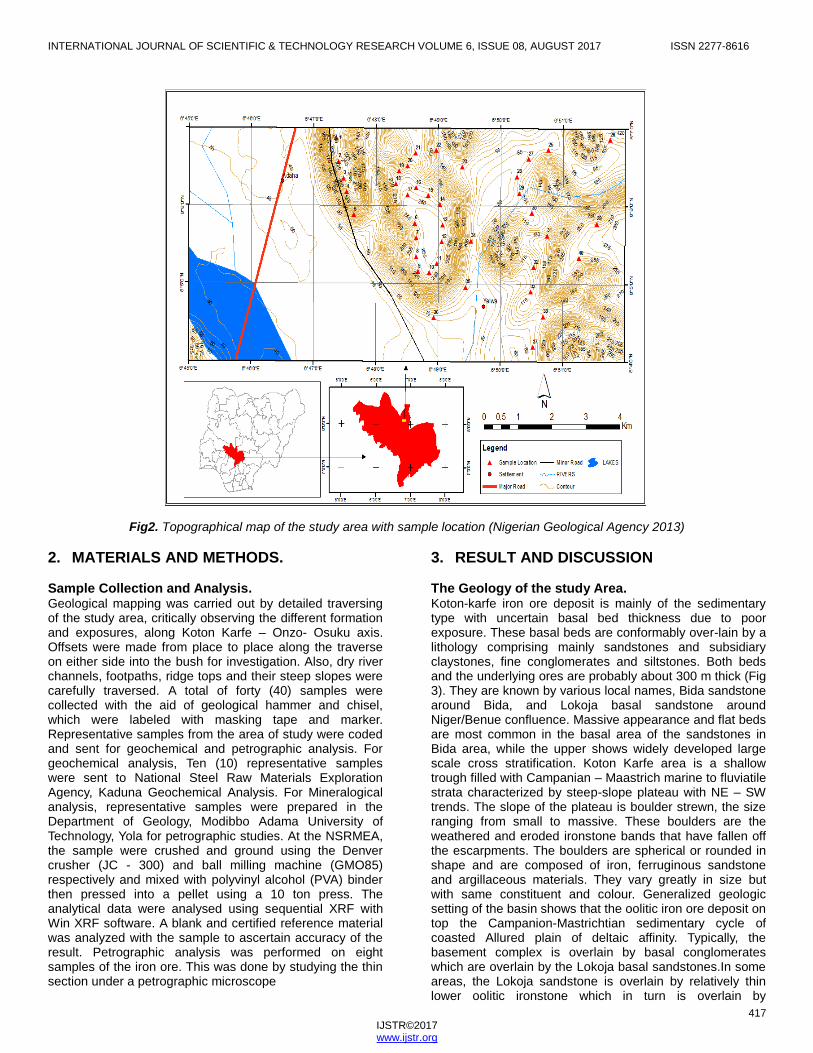
The Geology of the study Area. Koton-karfe iron ore deposit is mainly of the sedimentary type with uncertain basal bed thickness due to poor exposure. These basal beds are conformably over-lain by a lithology comprising mainly sandstones and subsidiary claystones, fine conglomerates and siltstones. Both beds and the underlying ores are probably about 300 m thick (Fig 3). They are known by various local names, Bida sandstone around Bida, and Lokoja basal sandstone around Niger/Benue confluence. Massive appearance and flat beds are most common in the basal area of the sandstones in Bida area, while the upper shows widely developed large scale cross stratification. Koton Karfe area is a shallow trough filled with Campanian – Maastrich marine to fluviatile strata characterized by steep-slope plateau with NE – SW trends. The slope of the plateau is boulder strewn, the size ranging from small to massive. These boulders are the weathered and eroded ironstone bands that have fallen off the escarpments. The boulders are spherical or rounded in shape and are composed of iron, ferruginous sandstone and argillaceous materials. They vary greatly in size but with same constituent and colour. Generalized geologic setting of the basin shows that the oolitic iron ore deposit on top the Campanion-Mastrichtian sedimentary cycle of coasted Allured plain of deltaic affinity. Typically, the basement complex is overlain by basal conglomerates which are overlain by the Lokoja basal sandstones.In some areas, the Lokoja sandstone is overlain by relatively thin lower oolitic ironstone which in turn is overlain by
INTERNATIONAL JOURNAL OF SCIENTIFIC & TECHNOLOGY RESEARCH VOLUME 6, ISSUE 08, AUGUST 2017 ISSN 2277-8616
418 IJSTR©2017 www.ijstr.org
argillaceous Patti Formation which may be lignite bearing. The upper oolitic ironstone, which is the main iron ore bed in this area, overlies the argillaceous layer. Laterite is seen to cover the iron ore in some parts. The petrology shows the iron ore to be made up of two (2) components, the element and the matrix. The former being the oolites and pisolites, and the later made of clay, silt sand,
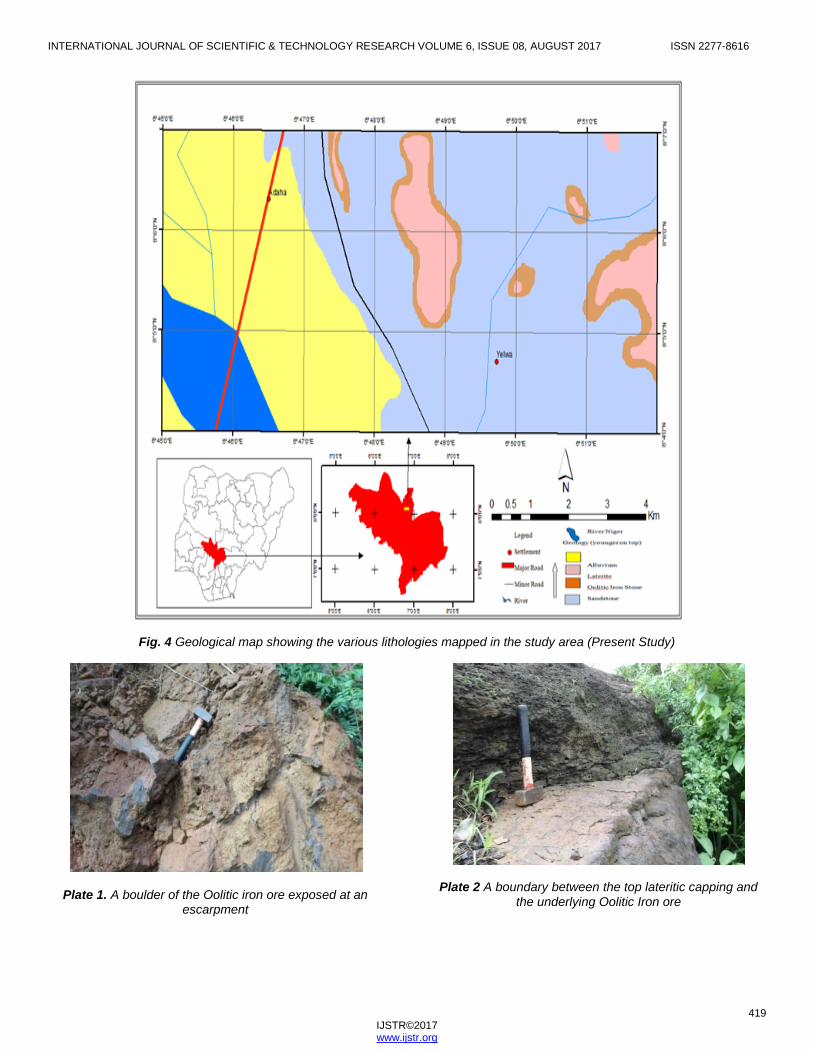
carbonaceous and ferruginous matters. The stratigraphy clearly shows the depositional environment at Koton-Karfe to be basin type. Geological Section of Koton-Karfe Iron Ore Deposit is shown in Fig.3 and the rock unit mapped in the area. Alluvial Deposit, sandstone, oolitic iron ore, Lateritic Soil (fig 4)
Fig 3 Sectional views of the koton karfe plateau and the surrounding mesas (NSRMEA 2014)
Sandstone The sandstone of this area consists of iron, clay and some silica forming the lower part of the plateaux. It acts as an interface between the alluvium and the oolitic iron ore. This residual soil is slightly weathered and reddish brown in colour. The silica content has been leached out and may contain soil rich enough to constitute an ore of iron, aluminum or magnesium
Oolitic Iron Ore The oolitic iron ore in the study area can be divided into three sections based on weathering pattern. The lower part is underlain by cobbles, which itself is overlain by boulders and carpets of iron ore, forming the capping, at the top (Plate IV (a), IV (b), and IV (c)). The types of iron ore recognized in this area are the oolitic and the pisolitic ore.
The oolitic ore are more prominent with spherical to sub – spherical ooids of about 0.20-0.9 mm. The ore comprises of compact, brown, red to grey ironstones.
Hard Lateritic Capping The lateritic soil of this area consists of iron and some silica forming the upper most part of the plateaux. Just like the sandstone layer, this lateritic cap is slightly weathered and reddish brown in colour and the silica content has also been leached out (Plate I Plate II and Plate III) Alluvial Deposit This is a detrital deposit found at the flood plains of rivers Niger and Benue and consists of sand, silt, silt stone, clay and organic matters
INTERNATIONAL JOURNAL OF SCIENTIFIC & TECHNOLOGY RESEARCH VOLUME 6, ISSUE 08, AUGUST 2017 ISSN 2277-8616
419 IJSTR©2017 www.ijstr.org
Fig. 4 Geological map showing the various lithologies mapped in the study area (Present Study)
Plate 1. A boulder of the Oolitic iron ore exposed at an escarpment
Plate 2 A boundary between the top lateritic capping and
the underlying Oolitic Iron ore

INTERNATIONAL JOURNAL OF SCIENTIFIC & TECHNOLOGY RESEARCH VOLUME 6, ISSUE 08, AUGUST 2017 ISSN 2277-8616
420 IJSTR©2017 www.ijstr.org
Plate 3 (a)
Plate 3 (b)
Plate 3 A hand specimen of the Oolitic iron ore showing the spherical to sub – spherical ooids
GEOCHEMISTRY
Chemical Analysis The result of X-ray fluorescence analysis of Koton karfe oolitic ironstone is shown in Table 1 The analytical data shows high Fe2O3 content ranging from 63.46% to 74.38% Aluminum and silica contents are also high ranging from 7.60% - 16.85% and 7.81% -18.55% respectively. Phosphorous content which ranges from 0.89% - 1.20% and sulfur content between 0.07% - 0.26% seem to be metallurgically high and unacceptable for high quality iron and steel production. In addition, the ores contain impurities such as CaO, MgO, TiO2 and MnO which exist in considerably negligible amounts. Distribution patterns of the geochemical elements (Wt %) in the samples are plotted in Fig 5 (a-j))
Table 1 Chemical composition (Wt %) of the Koton Karfe Oolitic Iron Ore
Compound (in Wt %)
Sample SiO2 TiO2 Al2O3 Fe2O3 Fetolal MnO MgO CaO P2O5 SO3 Total
1 16.20 0.261 12.60 69.28 48.45 0.16 0.34 0.14 1.20 0.26 100.14 2 18.32 0.323 11.10 68.58 47.96 0.073 0.073 0.15 0.95 0.11 99.69 3 17.01 0.383 11.70 68.87 48.17 0.110 0.22 0.23 0.96 0.12 99.45 4 7.81 0.313 13.59 66.54 46.54 0.08 0.21 0.21 0.90 0.12 99.77 5 13.50 0.311 17.60 66.66 46.62 0.171 0.17 0.16 0.87 0.20 99.64 6 18.49 0.348 14.30 65.06 45.50 0.094 0.12 0.18 0.90 0.07 99.56 7 12.15 0.401 11.00 74.38 49.78 0.19 0.18 0.21 1.20 0.19 99.90 8 15.53 0.279 13.82 68.46 45.83 0.13 0.28 0.19 1.00 0.09 99.78 9 18.55 0.256 12.43 66.82 46.73 0.08 0.18 0.15 0.96 0.13 99.56 10 17.25 0.299 16.85 63.46 44.38 0.16 0.27 0.16 0.89 0.21 99.55 Average 16.98 0.279 12.49 67.81 47.43 0.125 0.20 0.178 0.98 0.15

INTERNATIONAL JOURNAL OF SCIENTIFIC & TECHNOLOGY RESEARCH VOLUME 6, ISSUE 08, AUGUST 2017 ISSN 2277-8616
421 IJSTR©2017 www.ijstr.org
(Oxides)
Fig.5 (a) Distribution patterns of the geochemical elements (Wt %) in sample 1
(Oxides)
Fig 5(b) Distribution patterns of the geochemical elements (Wt %) in sample 2
(Oxides)
Fig 5(c) Distribution patterns of the geochemical elements (Wt %) in sample 3
(Oxides)
Fig 5(d) Distribution patterns of the geochemical elements (Wt %) in sample 4
(Oxides)
Fig 5(e) Distribution patterns of the geochemical elements (Wt %) in sample 5
(Oxides)
Fig 5(f) Distribution patterns of the geochemical elements (Wt %) in sample 6
(Oxides)
Fig 5(g) Distribution patterns of the geochemical elements (Wt %) in sample 7
(Oxides)
Fig5 (h) Distribution patterns of the geochemical elements (Wt %) in sample 8
0
20
40
60
80
0
20
40
60
80
0
20
40
60
80
010203040506070
010203040506070
010203040506070
0
20
40
60
80
0
20
40
60
80

INTERNATIONAL JOURNAL OF SCIENTIFIC & TECHNOLOGY RESEARCH VOLUME 6, ISSUE 08, AUGUST 2017 ISSN 2277-8616
422 IJSTR©2017 www.ijstr.org
(Oxides)
Fig 5(i) Distribution patterns of the geochemical elements (Wt %) in sample 9
(Oxides)
Fig 5(j) Distribution patterns of the geochemical elements (Wt %) in sample 10
Interpretation of Geochemical Result The quality of raw iron ores and its viability for commercial exploitation is mainly determined by its chemical composition and when compared with other exploited and exported iron ores in the world. Table 3 shows the results of the total chemical analysis of Koton Karfe iron ore in weight percentages. The most important elements and components of consideration in iron ores are the content of Fe, gangue (SiO2 and Al2O3) and contaminants such as phosphorous and sulfur. In addition, the ores contain other impurities such as MnO, MgO, TiO2 and CaO, which exist in considerably negligible amounts. Alumina, sulphur, and phosphorous represent contaminations in the steel making process and are specific targets during iron ore beneficiation [7]. For commercial viability, iron ores should preferably have high Fe contents and low impurity element contents, in order to justify the investment during exploitation. In the world practice, no minimum standards have been set for iron, silica, alumina, calcium, and magnesium percentages in commercial iron ores, although certain generalizations can be made [8]. However, for classification and evaluation of quality and grade, the raw iron ores can be divided into three basic classes depending on the total Fe content: (i) high-grade iron ores with a total Fe content above 65%, (ii) medium- or average-grade ores with varied Fe contents in the range of 62–64%, and (iii) low-grade ores with Fe contents below 58%. The generalized contents of the most important elements in raw iron ores used in assessing iron ore quality are given in Table 2.
Table 2 Generalized Percentages of Elements of Major Interest in Assessing Iron Ore Quality [8]
Components Total Fe SiO2 A2lO3 Phosphorous Sulphur
Content (mass %)
Low(L) Medium(M) High(H) <6
3-4
0.05-0.07
0.1
<58 62-64 >65
Grade Determination To understand and assess the quality and grade of Koton Karfe Oolitic iron ore, the contents of the major elements in this ore were compared with the composition of extracted ores from other nations. Among the biggest iron ore producing nations are China, Brazil, Australia, India, Russia, and the USA. To determine the grade, the iron oxide (Fe2O3) has to be converted to elemental state of iron (Fe total). To achieve this, value of the oxide content is multiplied by its conversion factor. From the result of Koton karfe oolitic ironstone in Table 3 Fe2O3 content ranges from 63.46% to 74.38% with an average of 67.81%. The conversion is explain below. Fe wt=55.847g O wt =15.999g Molecular weight of Fe2O3 =2(55.847) + 3 (15.999) =159.69g/mol For the iron (Fe total) proportion = Fe2/ Fe2O3 =2(55.847l/159.69 = 111.694
159.69⁄
=0.6994 Therefore, the average of Fe2O3 (67.81%) when multiply by the conversion factor the average percentage grade of Fe i.e grade of Fe= 67.81×0.6994 = 47.43% (Grade) From this calculation, koton Karfe oolitic iron ore is of low grade using the generalized percentages of element of major interest (Dobbins and Burnet 1982) in assessing its iron ore quality. SiO2 content between 7.81% -18.55% in Koton Karfe is higher than the generalized percentage of < 6 % [8]. Based on the analysis of SiO2 contents, it may be concluded that the iron ores from Koton karfe deposit cannot serve well as a good raw material for steel production but rather good for cast iron production. The major effect of silicon is to promote the formation of grey iron. Grey iron is less brittle and easier to finish than white iron. It is preferred for casting purposes for this reason. Turner [9] reported that silicon also reduces shrinkage and
0
20
40
60
80
0
10
20
30
40
50
60
70
INTERNATIONAL JOURNAL OF SCIENTIFIC & TECHNOLOGY RESEARCH VOLUME 6, ISSUE 08, AUGUST 2017 ISSN 2277-8616
423 IJSTR©2017 www.ijstr.org
the formation of blowholes, thus lowering the number of bad castings. Phosphorus makes steel brittle, even at concentrations of as little as 0.6%. Bog ore often has a high phosphorus content [10].The strength and hardness of iron increases with the concentration of phosphorus as low as 0.05% phosphorus in wrought iron makes it as hard as medium carbon steel. Phosphorous content of Koton Karfe is between 0.89% - 1.20% that supersedes the recommended values of 0.05–0.07% Aluminium oxide increases the viscosity of the slag [11]. High aluminium will also make it more difficult to tap off the liquid slag during production. Aluminium in Koton Karfe iron ore is high in concentration with ranges between 7.60% - 16.85%. This is higher than the permissible level of 3-4% set for direct iron production without prior beneficiation. Sulfur dissolves readily in both liquid and solid iron at the temperatures present in iron smelting. The effects of even small amounts of sulfur are immediate and serious [10]. Small cracks on hot iron can cause the object to fail during use. The degree of failure is in direct proportion to the amount of sulfur present. According to [9], good foundry iron should have less than 0.15% sulfur. In Koton Karfe iron ore, sulfur content ranges between 0.07% - 0.26% which seem to be metallurgically high and unacceptable for high quality iron and steel production.
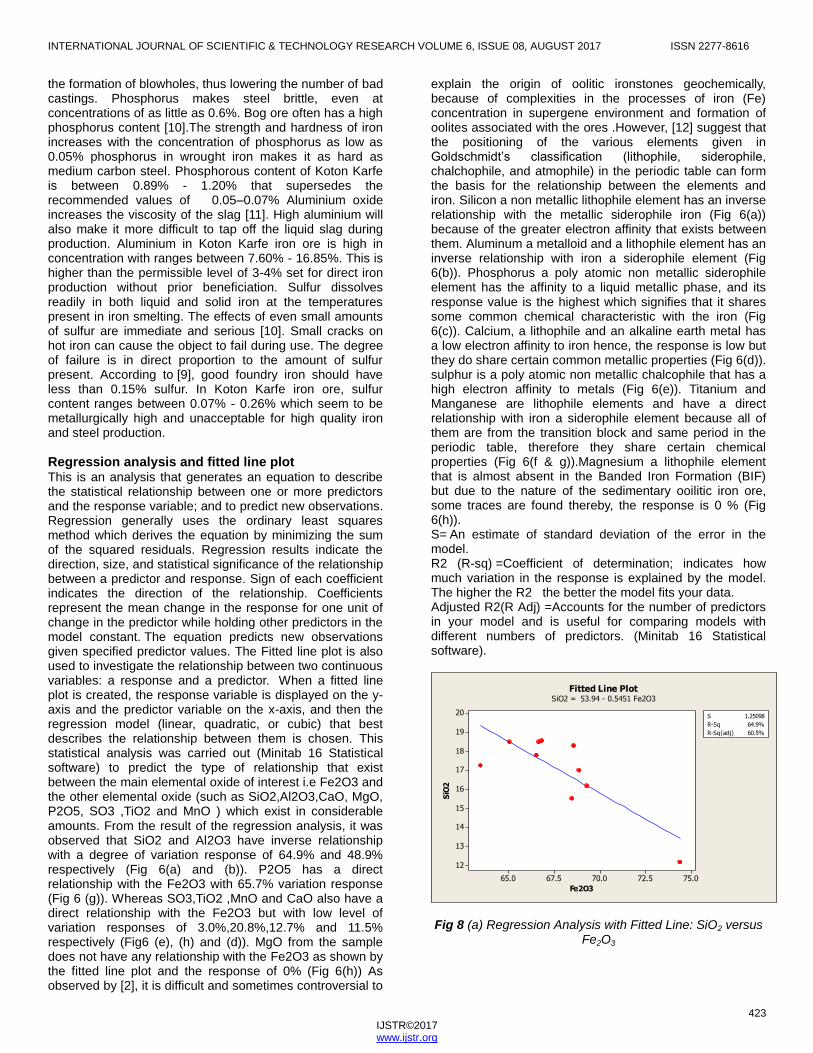
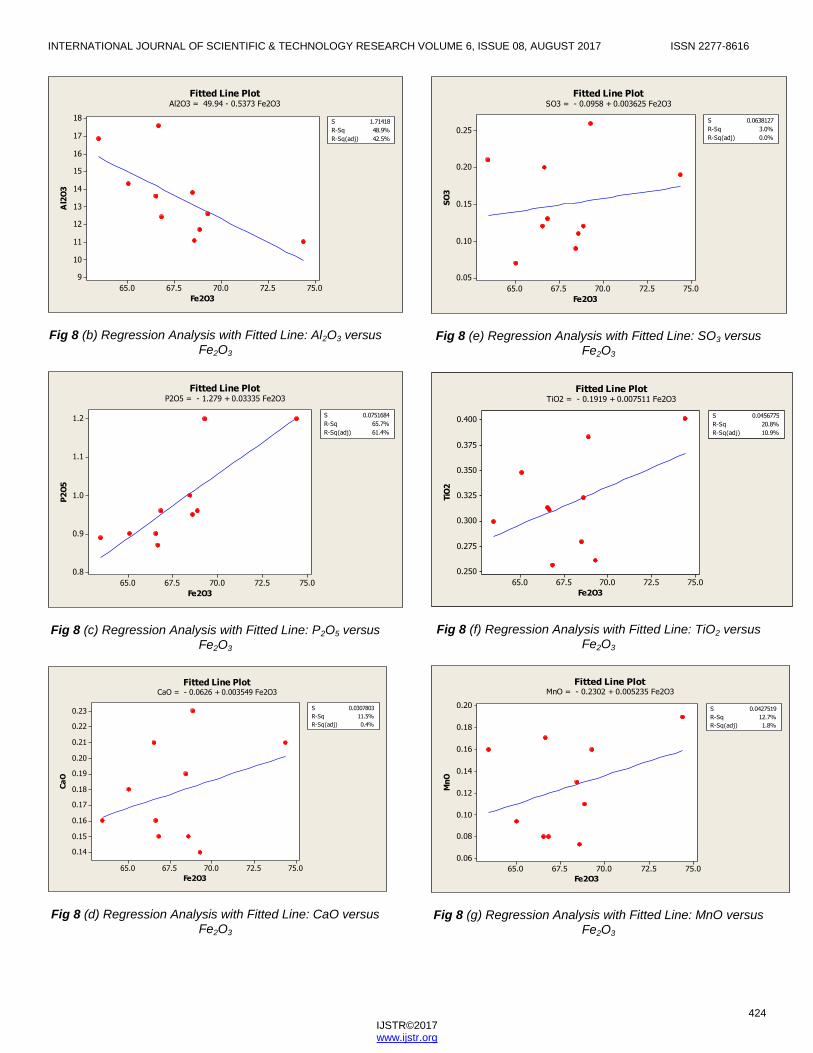
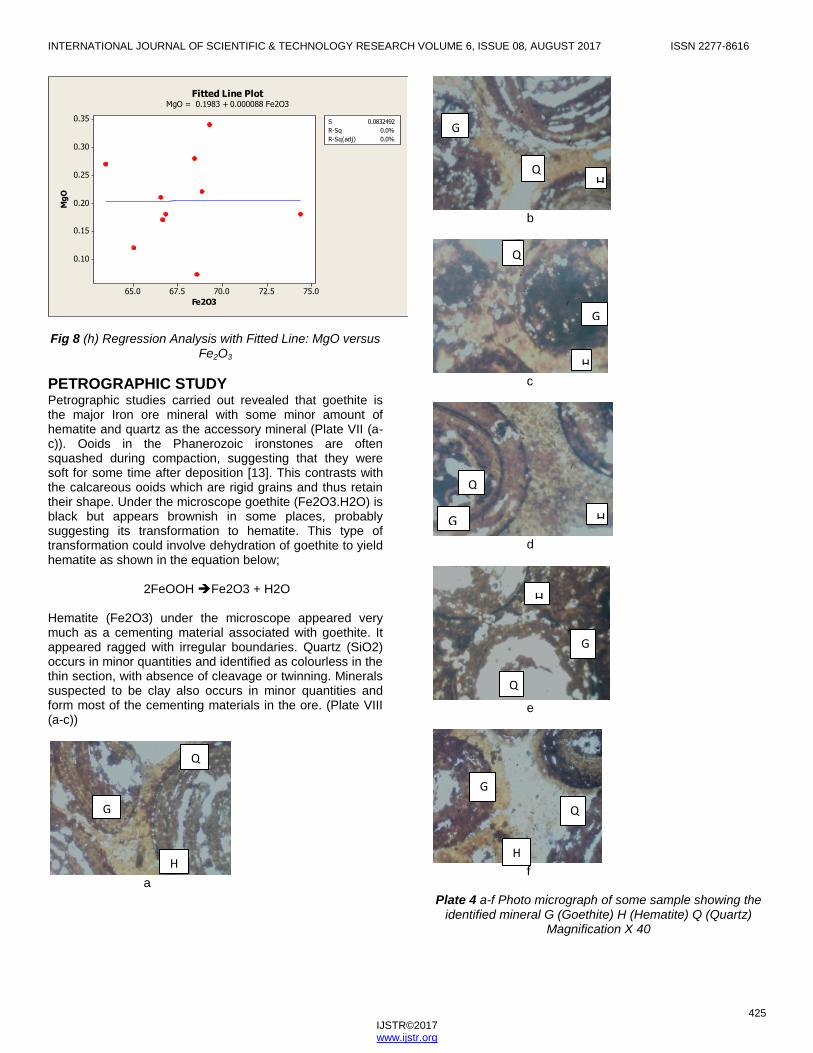
Regression analysis and fitted line plot This is an analysis that generates an equation to describe the statistical relationship between one or more predictors and the response variable; and to predict new observations. Regression generally uses the ordinary least squares method which derives the equation by minimizing the sum of the squared residuals. Regression results indicate the direction, size, and statistical significance of the relationship between a predictor and response. Sign of each coefficient indicates the direction of the relationship. Coefficients represent the mean change in the response for one unit of change in the predictor while holding other predictors in the model constant. The equation predicts new observations given specified predictor values. The Fitted line plot is also used to investigate the relationship between two continuous variables: a response and a predictor. When a fitted line plot is created, the response variable is displayed on the y-axis and the predictor variable on the x-axis, and then the regression model (linear, quadratic, or cubic) that best describes the relationship between them is chosen. This statistical analysis was carried out (Minitab 16 Statistical software) to predict the type of relationship that exist between the main elemental oxide of interest i.e Fe2O3 and the other elemental oxide (such as SiO2,Al2O3,CaO, MgO, P2O5, SO3 ,TiO2 and MnO ) which exist in considerable amounts. From the result of the regression analysis, it was observed that SiO2 and Al2O3 have inverse relationship with a degree of variation response of 64.9% and 48.9% respectively (Fig 6(a) and (b)). P2O5 has a direct relationship with the Fe2O3 with 65.7% variation response (Fig 6 (g)). Whereas SO3,TiO2 ,MnO and CaO also have a direct relationship with the Fe2O3 but with low level of variation responses of 3.0%,20.8%,12.7% and 11.5% respectively (Fig6 (e), (h) and (d)). MgO from the sample does not have any relationship with the Fe2O3 as shown by the fitted line plot and the response of 0% (Fig 6(h)) As observed by [2], it is difficult and sometimes controversial to
explain the origin of oolitic ironstones geochemically, because of complexities in the processes of iron (Fe) concentration in supergene environment and formation of oolites associated with the ores .However, [12] suggest that the positioning of the various elements given in Goldschmidt’s classification (lithophile, siderophile, chalchophile, and atmophile) in the periodic table can form the basis for the relationship between the elements and iron. Silicon a non metallic lithophile element has an inverse relationship with the metallic siderophile iron (Fig 6(a)) because of the greater electron affinity that exists between them. Aluminum a metalloid and a lithophile element has an inverse relationship with iron a siderophile element (Fig 6(b)). Phosphorus a poly atomic non metallic siderophile element has the affinity to a liquid metallic phase, and its response value is the highest which signifies that it shares some common chemical characteristic with the iron (Fig 6(c)). Calcium, a lithophile and an alkaline earth metal has a low electron affinity to iron hence, the response is low but they do share certain common metallic properties (Fig 6(d)). sulphur is a poly atomic non metallic chalcophile that has a high electron affinity to metals (Fig 6(e)). Titanium and Manganese are lithophile elements and have a direct relationship with iron a siderophile element because all of them are from the transition block and same period in the periodic table, therefore they share certain chemical properties (Fig 6(f & g)).Magnesium a lithophile element that is almost absent in the Banded Iron Formation (BIF) but due to the nature of the sedimentary ooilitic iron ore, some traces are found thereby, the response is 0 % (Fig 6(h)). S= An estimate of standard deviation of the error in the model. R2 (R-sq) =Coefficient of determination; indicates how much variation in the response is explained by the model. The higher the R2 the better the model fits your data. Adjusted R2(R Adj) =Accounts for the number of predictors in your model and is useful for comparing models with different numbers of predictors. (Minitab 16 Statistical software).
Fig 8 (a) Regression Analysis with Fitted Line: SiO2 versus Fe2O3
75.072.570.067.565.0
20
19
18
17
16
15
14
13
12
Fe2O3
SiO
2
S 1.25098
R-Sq 64.9%
R-Sq(adj) 60.5%
Fitted Line PlotSiO2 = 53.94 - 0.5451 Fe2O3
INTERNATIONAL JOURNAL OF SCIENTIFIC & TECHNOLOGY RESEARCH VOLUME 6, ISSUE 08, AUGUST 2017 ISSN 2277-8616
424 IJSTR©2017 www.ijstr.org
Fig 8 (b) Regression Analysis with Fitted Line: Al2O3 versus Fe2O3
Fig 8 (c) Regression Analysis with Fitted Line: P2O5 versus Fe2O3
Fig 8 (d) Regression Analysis with Fitted Line: CaO versus Fe2O3
Fig 8 (e) Regression Analysis with Fitted Line: SO3 versus Fe2O3
Fig 8 (f) Regression Analysis with Fitted Line: TiO2 versus Fe2O3
Fig 8 (g) Regression Analysis with Fitted Line: MnO versus Fe2O3
75.072.570.067.565.0
18
17
16
15
14
13
12
11
10
9
Fe2O3
Al2
O3
S 1.71418
R-Sq 48.9%
R-Sq(adj) 42.5%
Fitted Line PlotAl2O3 = 49.94 - 0.5373 Fe2O3
75.072.570.067.565.0
1.2
1.1
1.0
0.9
0.8
Fe2O3
P2
O5
S 0.0751684
R-Sq 65.7%
R-Sq(adj) 61.4%
Fitted Line PlotP2O5 = - 1.279 + 0.03335 Fe2O3
75.072.570.067.565.0
0.23
0.22
0.21
0.20
0.19
0.18
0.17
0.16
0.15
0.14
Fe2O3
Ca
O
S 0.0307803
R-Sq 11.5%
R-Sq(adj) 0.4%
Fitted Line PlotCaO = - 0.0626 + 0.003549 Fe2O3
75.072.570.067.565.0
0.25
0.20
0.15
0.10
0.05
Fe2O3
SO
3
S 0.0638127
R-Sq 3.0%
R-Sq(adj) 0.0%
Fitted Line PlotSO3 = - 0.0958 + 0.003625 Fe2O3
75.072.570.067.565.0
0.400
0.375
0.350
0.325
0.300
0.275
0.250
Fe2O3
TiO
2
S 0.0456775
R-Sq 20.8%
R-Sq(adj) 10.9%
Fitted Line PlotTiO2 = - 0.1919 + 0.007511 Fe2O3
75.072.570.067.565.0
0.20
0.18
0.16
0.14
0.12
0.10
0.08
0.06
Fe2O3
Mn
O
S 0.0427519
R-Sq 12.7%
R-Sq(adj) 1.8%
Fitted Line PlotMnO = - 0.2302 + 0.005235 Fe2O3
INTERNATIONAL JOURNAL OF SCIENTIFIC & TECHNOLOGY RESEARCH VOLUME 6, ISSUE 08, AUGUST 2017 ISSN 2277-8616
425 IJSTR©2017 www.ijstr.org
Fig 8 (h) Regression Analysis with Fitted Line: MgO versus Fe2O3
PETROGRAPHIC STUDY Petrographic studies carried out revealed that goethite is the major Iron ore mineral with some minor amount of hematite and quartz as the accessory mineral (Plate VII (a-c)). Ooids in the Phanerozoic ironstones are often squashed during compaction, suggesting that they were soft for some time after deposition [13]. This contrasts with the calcareous ooids which are rigid grains and thus retain their shape. Under the microscope goethite (Fe2O3.H2O) is black but appears brownish in some places, probably suggesting its transformation to hematite. This type of transformation could involve dehydration of goethite to yield hematite as shown in the equation below; 2FeOOH Fe2O3 + H2O Hematite (Fe2O3) under the microscope appeared very much as a cementing material associated with goethite. It appeared ragged with irregular boundaries. Quartz (SiO2) occurs in minor quantities and identified as colourless in the thin section, with absence of cleavage or twinning. Minerals suspected to be clay also occurs in minor quantities and form most of the cementing materials in the ore. (Plate VIII (a-c))
a
b
c
d
e
f
Plate 4 a-f Photo micrograph of some sample showing the identified mineral G (Goethite) H (Hematite) Q (Quartz)
Magnification X 40
75.072.570.067.565.0
0.35
0.30
0.25
0.20
0.15
0.10
Fe2O3
Mg
O
S 0.0832492
R-Sq 0.0%
R-Sq(adj) 0.0%
Fitted Line PlotMgO = 0.1983 + 0.000088 Fe2O3
Q H
G
H
Q
G
H
G
Q
H
Q
G
H
G
Q
G
H
Q
Q
Q
INTERNATIONAL JOURNAL OF SCIENTIFIC & TECHNOLOGY RESEARCH VOLUME 6, ISSUE 08, AUGUST 2017 ISSN 2277-8616
426 IJSTR©2017 www.ijstr.org
4. CONCLUSION Koton Karfe oolitic iron ore has an average grade of 47.43% and high percentages of gangue (silica and Alumina), impurities and deleterious elements of phosphorous and sulphur above permissible limit for commercial exploitation. Therefore the Koton Karfe iron ore occurrence is of low grade.The petrographic studies revealed that the Koton Karfe iron ore contain goethite as the major iron ore mineral with some appreciable amount of hematite and little quartz as the gangue mineral This work only gives an insight into the geochemistry and mineralogy of Koton Karfe iron ore and therefore should be regarded as preliminary and since the samples were collected mostly from exposed boulders and beds, more detailed investigation is recommended.
References [1]. Siehl, A. and Thein, J. (1989) Minette-type
ironstones. In T.P. Young and W.E.G. Taylor (eds), Phanerozoic Ironstones. Geological Society London, Special Publication, 46, 175–93.
[2]. Young, T.P. and Taylor, G.W.E. (1989) Phanerozoic
Ironstones. Geological Society London, Special Publication 46, 247 pp.
[3]. Braide, S.P., (1992). Geological Development,
Origin and Energy Mineral Resources potential of Lokoja formation in the Southern Bida Basin. Journal of Mining and Geology., 28, p. 33-44
[4]. Uwadiale, G. G. O. O. (1984). Beneficiation study
of Agbaja Iron Ore, Nigeria. Ph. D Thesis, University of Strathclyde, Glasgow
[5]. Ladipo, K.O, Akande, and S.O. Arno, M. (1994).
Genesis of Oolitic Ironstones from the Middle Niger Sedimentary Basin. Evidence from sedimentological, ore microscopic and Geochemical studies. Journal of Mining and Geology vol.30 1994 No.2, p.161-168.
[6]. Adeleye, D. R. (1973). Origin of ironstones, an
example from the Middle Niger Valley, Nigeria. Journal Sedimentary. Petrology. 43, p.309-727
[7]. Guider J. W. (1981). ―Iron ore beneficiation—key to
modern steelmaking,‖ Mining Engineering, vol. 33, no. 4, pp. 410–413,
[8]. Dobbins M. S. and Burnet G,( 1982.) ―Production of
an iron ore concentrate from the iron-rich fraction of power plant fly ash,‖ Resources and Conservation, vol. 9, pp. 231–242,
[9]. Turner, T. (1900). The Metallurgy of Iron (2nd ed.),
Charles Griffin & Company, Limited [10]. Gordon, Robert B. (1996), American Iron 1607-
1900, The Johns Hopkins University Press [11]. Rosenqvist, Terkel (1983), Principles of Extractive
Metallurgy, McGraw-Hill Book Company
[12]. Guilford C. Mackenzie W. S. (1980) Atlas of rock-
forming minerals in thin sections. [13]. Ben Othman, D., W. M. White and J. Patchett.
1989. The geochemistry of marine sediments,island arc magma genesis, and crust-mantle recycling. Earth Planet. Sci. Lett. 94:1-21
[14]. Baba, A.A, Adekola, F.A and Folashade A.O.
(2005). Quantitative Leaching of a Nigerian Iron Ore in Hydrochloric Acid: Journal of Applied Sciences and Environment Management, 9(3), 15 – 20.
[15]. Garba Usman (1999): Research and Development
efforts at NMDC Jos, towards arresting the decline fortunes of the Nigerian metallurgical Industry.10th Annual Conference, Jos, Nigeria pp.14 – 16.
[16]. Semukaaya R.,( 2007.) Characterisation of Muko
Iron Ore Deposits for Iron and Steel Production, Makerere University Library, Kampala, Uganda,
[17]. Abimbola, A.F., (1994). Mineralogical and
Geochemical studies of Agbaja Ironstone formation, Nupe Basin, Central Nigeria. Unpublished Ph.D. Thesis, University of Ibadan, Ibadan. Nigeria.
[18]. Adeleye, D.R. (1989). The Geology of the middle
Niger Basin, In: Kogbe, C.A., (Ed.), Geology of Nigeria, Second Ed. Elizabethan Publishing Co., Lagos, p. 283-287
[19]. Akande, S.O., Ojo O.J, Erdtmann, B.D., Hetenyi,
M., (2005). Paleoenvironments, organic petrology and Rock-Eval studies on source rock facies of the lower maastrichtian Patti formation, southern Bida Basin, Nigeria. Journal of African Earth Sciences 41(2005) p.394-406