international market selection of parfois
TRANSCRIPT

A Work Project, presented as part of the requirements for the Award of a Master Degree in Economics / Finance /Management from the NOVA – School of Business and Economics.
International Market Selection of Parfois
Direct Research Project for the Masters in Management
Marta Guedes, 2331
09/2016
A Project carried out on the Master in Management course, under the supervision of Emanuel Gomes

Direct Research Work Project for the Masters in Management – Marta Guedes
1
Abstract Parfois has been internationalizing into many countries and would like to continue growing.
This study focuses on the IMS of Parfois, comparing countries from the all around the world, in a
quantitative analysis at first, followed by a qualitative analysis. The purpose of the project is to help
Parfois select the optimal market for expansion. Through semi structured interviews, literature research,
and country clustering and ranking methods South Korea was selected as the best market for expansion,
followed by Israel.
Keywords: International Market Selection, Internationalization, International Expansion, Parfois
Table of Contents Abstract ................................................................................................................................................................. 1
Introduction ........................................................................................................................................................... 2
Literature Review ................................................................................................................................................. 3
Methodology ........................................................................................................................................................ 7
Module 1: Company’s Strategic Position .......................................................................................................... 8
Company Strategic Analysis .......................................................................................................................... 8
Analysis External Environment ................................................................................................................... 12
S.W.O.T Matrix ............................................................................................................................................. 14
Global Readiness ........................................................................................................................................... 14
Module 2: The Search for Global Markets...................................................................................................... 15
Macro Level Criteria Selection & Data Collection .................................................................................... 15
In-depth market analysis ............................................................................................................................... 20
The Best Target market ................................................................................................................................. 23
Conclusion & Recommendations .................................................................................................................... 23
Limitations & Implications ............................................................................................................................... 24
References ........................................................................................................................................................... 25
Appendix I – Countries where Parfois currently operates ............................................................................. 26
Appendix II – Global Readiness....................................................................................................................... 27
Appendix III – Tables for Country Clustering ................................................................................................ 28
Appendix IV – Tables for Country Ranking................................................................................................... 37
Appendix V – Market and Company Sales Potential .................................................................................... 44
Appendix VI – Tables Country Entry Conditions .......................................................................................... 45
Direct Research Work Project for the Masters in Management – Marta Guedes
2
Introduction Expanding internationally is an extremely important strategic decision for every company that
wants to go global. Managing the internationalization process involves three important steps - where,
when and how. Indeed, a firm needs to select the location to which it wishes to expand (where), defined
the international location timing (when), and finally the select the international entry mode (how)
(Welch & Luostarinen, 1998).
The Portuguese fashion retail company Parfois - Barata & Ramilo S.A, more commonly known
as only Parfois, has had an interesting and successful internationalization process. Parfois was founded
in 1994 by Manuela Medreiros in Oporto, when she noticed that there was a gap in the demand and
supply of women fashion accessories, having an ambition since the first day to open more than one
store. Parfois is already present in more than 50 stores, opening more than 100 stores per year, most of
them opening in international markets. In terms of sales, Parfois had an average annual growth of 30%
since 2011 and wants to keep growing at this rate for 5 more years. Parfois had a success almost
instantly in Portugal where it started to expand internally at an extremely high rate. Interestingly, Parfois’
first international expansion presented itself in 2002, to Saudi Arabia, almost “by chance” as the current
CEO of Parfois stated (Marques, 2015). Indeed, it was due to the initiative of a business man who was
looking for a European brand to open a store in Saudi Arabia that the brand made the leap across
borders, and later in the same year it expanded to its neighboring country, Spain. Parfois had three big
phases of growth: the first one since it was founded in 1994 until 2001, the second since 2001 where it
started to expand abroad until 2006/2007 and from 2006/2007 to the present where the expansion
process turned into professionalized process. The first phase was characterized by growing immensely
in Portugal, in the second phase, as already mentioned above, Parfois was merely to reacting to request
from abroad to open stores, taking advantage of as many opportunities to expand as possible, and in the
third phase it all changed when Parfois stopped expanding abroad by reacting to requests, and instead
started to actively search for new countries to expand. Also, Parfois’ been decreasing the number of
Direct Research Work Project for the Masters in Management – Marta Guedes
3
countries entered per year and decided to enter fewer countries and consolidate its position in each
market in order to obtain a high market share.
Therefore, the aim of this project is to define the international market selection (IMS) for
Parfois. By taking into consideration that, in most circumstances, a large number of export opportunities
exist, and only a limited number can be explored due to scarce resources (Papadopoulos and Denis,
1988), Parfois would benefit from a study to shed some light into the most promising ones. Through the
IMS research that will be presented, Parfois will be able to decide on which market they should invest
their scarce resources to generate the most potential growth and revenue. Hence this project adds value
to Parfois as it provides a clear analysis and compares different markets in order to select the optimal
country to expand. This project will have three stages in order to reach the best target market for Parfois:
Analysis of Parfois’ strategic position;
Search for global markets where the various potential markets in a macro view;
In-depth analysis of the most promising potential markets.
Moreover, Parfois has its method of entering a new country already established by expanding
with a franchise partner. Parfois has its own stores in only very few countries (Portugal, Spain, France
and Poland. Thus, my work project will be focused on finding the optimal country for Parfois to expand
with a franchise partner. This paper will begin with a review of the relevant IMS literature followed by
an analysis with the aid of the GMMSO4 software and finally a conclusion and set of proposed
recommendations.
Literature Review The internationalization process of firms has been one of the most frequently researched topics
in international marketing over the past 40 years (Fletcher, 2001). According to Welch and Luostarinen
(1988), internationalization is “the process of increasing involvement in international operations” and it
can be perceived as a part of the ongoing strategy process of most business firms (Melin, 1992). This
internationalization process has three main dimensions corresponding to three simple questions, which a
firm must respond to when planning an international expansion: what, where and how (Welch &

Direct Research Work Project for the Masters in Management – Marta Guedes
4
Luostarinen, 1998). International Market Selection (IMS) - the “where” – aims to determine the relative
attractiveness and potential of markets within a considered set, prior to the final in-depth assessment of
the most appealing one(s) for expansion (Reid, 1981). IMS is the first and most important step in export
strategy (Root, 1994; Kay, 1993; O’Farrell & Wood, 1994) (Papadopoulos & Denis, 1988) and
effective market choice is a strategic decision that affects export performance (Ayal & Zif, 1978; Chetty
& Hamilton, 1993).
Following the literature in IMS there are several different methods to determine how the IMS
should be done. Papadopoulos and Denis (1988) summarized the literature on IMS methods up until the
late 1980s, where they classified over 40 proposed international market selection models into two broad
types of approaches – qualitative approaches and quantitative approaches. On one side there is the
qualitative approach or the descriptive approach, which focus on rigorous and systematic gathering and
analysis of qualitative information about one or a handful of potential country markets. According to
Papadopoulos and Denis (1988), qualitative approaches typically start by establishing objectives and
constraints which are used to identify a short list of countries for further consideration. Other studies
focus more on the nature, appropriateness and sources of qualitative information that could be used as
input to the IMS process. Although being systematic, approach has been criticized by being subject of
the potentially biased perceptions of those who provide information (Papadopoulos and Denis 1988:39)
and are subjective assessments can be largely inaccurate (Vogel, 1976). Moreover, qualitative
approaches are restricted by their nature to considering a limit of countries. Given this limitation
Douglas, Craig and Keegan (1982) suggested the adoption of a screening procedure of secondary data
to determine which countries to investigate in depth. This screening procedure is exactly what IMS
quantitative approaches do by using more formalized statistical analyses and comparing secondary of
various markets, thus making it possible to compare significantly larger number of countries. Indeed, the
quantitative approach is by nature a normative IMS model where the decision process is structured and
formalized including various statistical methods to analyze large amounts of secondary statistical data

Direct Research Work Project for the Masters in Management – Marta Guedes
5
about many or all foreign markets, in order to determine the potential of the target markets, also
described as the quantitative/statistical approach (Papadopoulos & Denis, 1988). Furthermore,
Papadopoulos and Denis (1988) divided the quantitative models into two categories: market grouping
methods which clusters countries on the basis of similarity, and market estimation methods which aim at
differentiating markets in the basis of their potential.
Market grouping or country clustering methods yield a group of countries with similar
commercial, economic, political and cultural dimensions. This method suggests that the most attractive
markets for a firm are the ones which most closely resemble the markets already penetrated
(Papadopoulos and Denis, 1988). The first significant quantitative approach of country clustering was
made by Liander, Terpstar, Yoshino, and Sherbini, who grouped countries according to their similarity
in industrial and economic development. Many other approaches have been studies ever since studied,
including grouping countries by cultural, political, socioeconomic and religious indicators (Sethi, 1971)
or clustering countries with highly favor environment for the pursuit of a global market strategy
(Huszagh, Fox & Day, 1985). Creating country clusters would help managers compare similar countries
and it also provides information regarding possible synergies among countries. Nevertheless, the
clustering approach has been repeatedly criticized by its exclusive reliance on aggregate, macro
indicators, neglecting specific-product/service market indicators (Cavusgil & Nevin, 1981; Douglas &
Craig, 1983; Papadopoulos & Denis, 1988). Yet, considering that these indicators are not readily
available as secondary data and requires extensively and costly market research, Cavusgil et al. (2003)
proposed that the use of these indicators is only appropriate when a reduced set of countries has been
identified, thus being more useful in the later stages of the market opportunity analysis.
In the second category, market estimation methods, foreign markets are evaluated on the basis
of one or several criteria in order to measure aggregate market potential and attractiveness, and those
which yield the highest score are selected (Sakarya et al., 2007; Papadopoulos and Denis, 1988). The
criteria used in this category vary across methods and repeatedly include indicators such wealth, size,

Direct Research Work Project for the Masters in Management – Marta Guedes
6
growth, competition and access indicators (Sakarya et al., 2007). The main objections to indexing are
similar to the criticisms of clustering – lack of product specificity in the indicators (Papadopoulos and
Denis, 1988). However, it is important to keep in mind that the index should only be used for initial
country screening, and not for final selection purposes (Cavusgil, Kiyak, & Yeniyurt, 2004) Moreover,
the quantitative approach has been criticized as it assumes a static environment and methodological
problems due to data availability. Cavusgil et al. (2004) combined these two quantitative methods of
country clustering and country ranking in order to create one very strong method for country screening
which should be the first step of IMS. Indeed, country clustering helps managers identify which markets
are akin to their domestic market and clusters of nations where similar international marketing strategies
can be used, and country ranking helps managers determine which countries are most attractive for
investment. Thus, by combining these two methods the manager can identify a reduced set, or sets, of
potentially attractive markets with meaningful similarities. Hence, a manager can take the cluster of
nations they deem most advantageous for their company and apply the ranking to determine which of
these countries will be of top priority for them.
All the same, the systematic approach has been criticized as it describes how the decision
process should be made instead of how decisions are actually made (Bazerman, 1986). This is further
evidenced by several studies which have concluded that firms generally do not adopt a systematic
approach (Cavusgil, 1985; Cavusgil & Godiwalla, 1982; Kobrin, 1979; Kobrin, Basek, Blank, &
LaPalombara, 1980). An unsystematic approach is also discussed in the literature (Anderson & Buvik,
2002), where is to describe how firms actually behave when selecting a foreign market. Some authors
have explained that most firms don’t use the systematic approach due to the decision-makers’ limited
information-processing capacity (Piercy, 1982), while others have noted that many firms are expanding
internationally on an opportunistic basis (cf. Bilkey, 1978; Bradley, 1995) – method used by Parfois in
its early expansion years. Moreover, the most well-known hypothesis is that firms enter new markets
with lowest psychic distance first (Johanson & Wiedersheim-Paul, 1975; Johanson & Vahlne, 1990).
Direct Research Work Project for the Masters in Management – Marta Guedes
7
For this project, the method used will be extremely similar to the one developed by Cavusgil,
Kiyak, & Yeniyurt (2004) and Papadopoulos et al. (2002) as they provide a concrete and practical way
of clustering, ranking and ultimately selecting the best market based on the criteria specific to Parfois.
Methodology According to Saunders (2007), the two main methodologies are primary and secondary data
collection. Whereas the first refers to the original analysis of data and the second is the re-analysis of
existing data. In the first phase, the primary data collection, I had the chance to interview several
employees of Parfois. I conducted four formal interviews to the Parfois current CEO since 2007, Sérgio
Marques, and to the three directors in charge of international expansion. The international expansion in
Parfois in sub-divided into three areas regarding geographical location, having Filipe Correia in charge
of the brand expansion outside Europe, Claudia Delgado in charge of the Portuguese and Spanish
markets, and Marco Almeida in charge of the remaining Europe. The interviews to Sérgio Marques and
to Filipe Correia where presential, and the remaining two were conducted over Skype. Moreover, while
I was in Rio Tinto I was given a tour to Parfois headquarters and new storehouse, where I was able to
understand how the logistics worked and had informal interviews with the logistics director, Nuno
Fontes. These interviews were semi-structured interviews as they contain questions and a list of themes
to be covered, but questions may be disregarded or added according to requirement and the object of the
research (Saunders, 2007). The third stage was to use the all gathered data and analyze it with the help of
the GMMSO4 software. The GMMSO, as defined on their own website “is a research and strategic
planning management tool designed to help your company enter or expand its presence into foreign
markets”. This software was used mainly to structure the analysis in order for it to be clear and concise
and come to logical conclusions. In order to analyze and create the country clustering and ranking, all
the indicators were standardized into z-scores. This is necessary because the data contain measures with
considerably different scales, hence in order to minimize the scale effects and to avoid any implicit
weighting, the variables were standardized. In addition, the indicators with negative factor loadings were

Direct Research Work Project for the Masters in Management – Marta Guedes
8
reversed to ensure that the averages were precise in representing the factors. Table 1 below lists all the
indicators/indexes used and their source.
Table 1 - Variables and sources of data used in analyses
Variable/Index Source
Inflation Rate International Monetary Fund, IMF Data Mapper 2016
Exchange Rates European Commission, InforEuro 2016
Economic Freedom Index The Heritage Foundation, 2016
Ease of Doing Business Index The World Bank, 2015
Worldwide Governance Indicators The World Bank, 2014
Human Development Index United Nations, Human Development Report 2014
Logistics Performance Index The World Bank, 2016
Urban Population The World Bank, World Development Indicatores 2016
Electricity Production Central Intelligence Agency, CIA World Fact Book 2016
Energy Consumption Growth Rate The World Bank, World Development Indicatores 2013/14
Real GDP Growth Rate International Monetary Fund, IMF Data Mapper 2015/16
Urban Population Growth Rate The World Bank, World Development Indicatores 2014/15
Percentage of Urban Population The World Bank, World Development Indicatores 2015
GNI per capita PPP The World Bank, World Development Indicatores 2014
Private Consumption as Percentage of GDP The World Bank, World Development Indicatores 2015
Exports as Percentage of GDP The World Bank, World Development Indicatores 2015
Portugal Exports Value The Observatory of Economic Complexity
Population Distribution by Income Pew Research Center
Female population by five-year age group United Nations, World Population Prospects: The 2015 Revision
Local Purchasing Power Index Numbeo
For the purpose of this project only Modules 1, 2 and sections of 3 were used as Parfois already
had the entry mode defined and the Marketing Plan was out of the scope of the project. The process of
applying the software to the project was simply inputting the data collected into the pre-constructed
tables and frameworks.
Module 1: Company’s Strategic Position
Company Strategic Analysis
Company Background
Manuela Medeiros founded Parfois in 1994 with the vison to create a brand of "exceptional and
irresistible fashion accessories, affordable to everyone", in a time when fashion accessories were still not
the focus of fashion retailers in Portugal. Parfois sells a wide range of products and relies on its own
design, always pursuing the latest worldwide trends. The main goal of Parfois is to become the reference
brand for neo-traditional and trendy women, offering consistently good value for money in a wide and
dynamic range of fashion accessories, within a pleasant space that can enhance the buying experience.
The company's headquarter is located in Rio Tinto, close to Oporto, where the majority of the logistic

Direct Research Work Project for the Masters in Management – Marta Guedes
9
activities take places. The company has two own teams of design in Oporto and in Barcelona and most
of its production is made by subcontractors in China and Honk Kong in order to insure affordable and
competitive prices. Parfois supply chain is one of its core competencies as it distinguishes a firm in the
marketplace and provides potential access to a wide variety of markets.
Sérgio Marques, Parfois CEO, stated that the success and differentiation of the company are in
the design, quality, price, variety and speed with which its products hit the stores. Furthermore, Parfois is
always on the vanguard of fashion and supply the latest trends to their consumers. One of its unique
resources is the variety and speed with which its products hit the stores, which is also extremely
important considering that Parfois business level strategy is strongly focused on the concept of fast
fashion. Indeed, each season the unique team of Parfois’ designers design and develop 3 500 SKU's,
thus being able to have different items in stores every week, giving the consumer an excuse to visit the
store often. According to Parfois, 70% of their customers visit the store at least twice a month and 36%
visit the store at least once a week, showing that the fast fashion concept is paying off. The second
differentiating factor which gives Parfois a competitive advantage over many of its competitors is the
shopping experience provided by the stores: the large spaces, simple, clean and bright decoration, and
the dynamism of the store and the showcases.
International Involvement Since the opening of the first store in the street in Oporto, Parfois started to expand internally by
opening new stores in shopping malls all over Portugal. At present, Parfois has 618 stores worldwide in
51 countries. When expanding internationally, Parfois uses two main strategies: either a direct entry
where they open their own stores as well as franchising stores or by a franchising partner only.
Currently, Parfois is only present in four countries with own stores (Portugal, Spain, France and Poland),
having about 60% of their stores franchised.
Parfois had three big phases of growth. The first phase, from 1994 up until 2002, was
characterized by growing immensely nationally. During this phase Parfois started to grow alongside
with the expansion of the network of Sonae Group's shopping centers in the 90s opening new stores in

Direct Research Work Project for the Masters in Management – Marta Guedes
10
these shopping centers. The international expansion phase began in 2002, when a third party showed
interest in opening a store in Saudi Arabia. At the time the company had no intention to expand abroad
but after some reflection and analysis decided to take the opportunity. Later in the same year, Parfois
decided to expand to Spain thus requiring a more formal international expansion strategy. After
expanding to these two countries, Parfois spent three years consolidating its brand in the countries
already present instead of further expanding abroad. It is not only until 2005 that Parfois opened new
stores in the United Arab Emirates, France and Kuwait. The opening of these new stores helped Parfois
to further consolidate the brand in the Middle East and in Western Europe. It is not only until 2007 when
Parfois enters the phase in which they are today, where it actively searches for new countries markets.
Given this active search for markets to expand to, in 2007 Parfois took a big leap and decided to make a
great investment internationally and expanded to five countries. The international expansion kept at the
high pace ever since and this phase is truly market by a rapid international growth, where Parfois
expanded on average to 5 new countries every year from 2007 until 2015, in a total of almost 200 stores.
Figure 1 – Parfois International Expansion thought time (Source: Parfois.com and information provided by Parfois)
Figure 1 shows the international expansion of Parfois thought the years-. Interestingly, it is only
in 2012 that Parfois makes the jump to the Latin America, after expanding to Asia (they expanded to the
Philippines in 2010) and Africa (the firm expanded to Angola in 2007). Moreover, Brazil was the last
country the firm entered in Latin America, which goes against the theory that firms expand first to the
countries where they have lowest psychic distance. Furthermore, only very recently they expanded to

Direct Research Work Project for the Masters in Management – Marta Guedes
11
Italy and Germany. This may be due to the high costs incurred in these more developed countries, where
rents are higher. It is also important to state that one of the most important things to Parfois when
opening a store is their location. Indeed, they always focus on opening stores where there is high
visibility and flow of people. Due to this fact, finding the correct franchising partner is imperative so that
the stores can be placed at the perfect locations. According to this strategy of raising brand visibility,
Parfois has the strategy of opening stores in the airports in order to increase their visibility and brand
awareness to tourist all around the world - in the UK their only store is in the Stansted Airport, they also
have a store in the Lisbon, Munich and Madrid airport.
In addition to the countries where Parfois has a physical store, the company also has an online
store which is available in 26 countries enabling Parfois to reach 8 countries where it has no physical
presence, notably Denmark, Finland, Greece, the Netherlands, Lithuania, Luxembourg, Monaco and
Sweden. Moreover, recently Parfois’ strategy has been to solidify their presence in the current markets,
France and Italy, where they already has about 230 stores, and France (26 stores). This justifies why the
rate of expansion to new countries decreased in the last few years.
Although Parfois operates in several countries very different from each other, the bulk of the
collection has to serve for every country in order to have a brand identity. They do not design and
develop products just because it would fit the needs of a certain country unless it fits the brand image.
Hence, most of the product offer is common to all markets. Nevertheless, when a certain market has a
specific need they try to adjust their offer to satisfy that need, but always staying in their style.
Target Market Profile Parfois' end users are urban and modern young women, early adopters and followers highly
sensitive to the latest fashion trends, price-conscious. Regarding the age group, it can be considered very
broad, but focused on women from 20 to 40 years old. Parfois target market in foreign countries is
extremely similar to the domestic market. Nevertheless, one of the characteristics of the Portuguese
market which allowed for Parfois' success was the impulsive nature of women as a shopping habit, due
to the concept of fast fashion and the fast replacement and rotation of products in store. Moreover, as

Direct Research Work Project for the Masters in Management – Marta Guedes
12
mentioned before, most of Parfois' collections are identical in all markets, and they only adjust their offer
to a certain market if it fits its brand image. Another important factor to take into consideration is the
shopping pattern of behavior which may differ from market to market.
Analysis External Environment
Pestel Analysis
Political: Parfois is a well-known brand that has
business in different countries around the world. On the
most emerging countries where Parfois operates, the
strict government rules results on an extremely high
risks for the business. Therefore, before entering on an
emerging country revenue must be measure against the
risk of entering on that market. Moreover, Parfois
manufactures its products abroad hence it is subject to
custom duties
Economical: Companies should take into consideration
the forecasted economic growth of a market before
enter in it. Interest rates and inflation should also be
taken under consideration since a small variation on,
for example, the exchange rate of a country may cause
a great increase on the importing and exporting costs.
Moreover, one of the market characteristics Parfois
values is the economic growth potential and intensity
because Parfois always has the intention of opening
more than one store per country.
Social: The social factors that seem to excel on the
fashion industry are the spending habits of potential
customers that are elastic to the economic stability. In
Parfois’ case, it’s mandatory to know the demand
spending patterns, as well as what will the fashion
trends of the market are in the short-term future.
Technological: On the fashion industry, new and
breakthrough technologies are used mainly only for
efficiency reasons. Parfois is always aware of the new
technologies trying to reduce costs so it can produce
better products that are more competitive in the market.
Moreover, technology has been changing the way
everyone does almost everything, even the way we
shop. This brings new and different competitors to the
industry and forces companied to be always adapting.
Environmental: Raising concerns regarding
environment can highly impact Parfois operations.
New laws and enforcements are being set regarding
renewable energies, energy efficiency and reducing
waste.
Legal: Before entering a new market, Parfois must
cover all legal obligations. As a company, being aware
of all legal formalities ensures that the company is
operating accordingly to the country’s law in order to
avoid legal problems which might be costly and
endangers the firm’s reputation. Moreover, legal cost
such as taxes and labor costs can highly impact profit
margins.
Direct Research Work Project for the Masters in Management – Marta Guedes
13
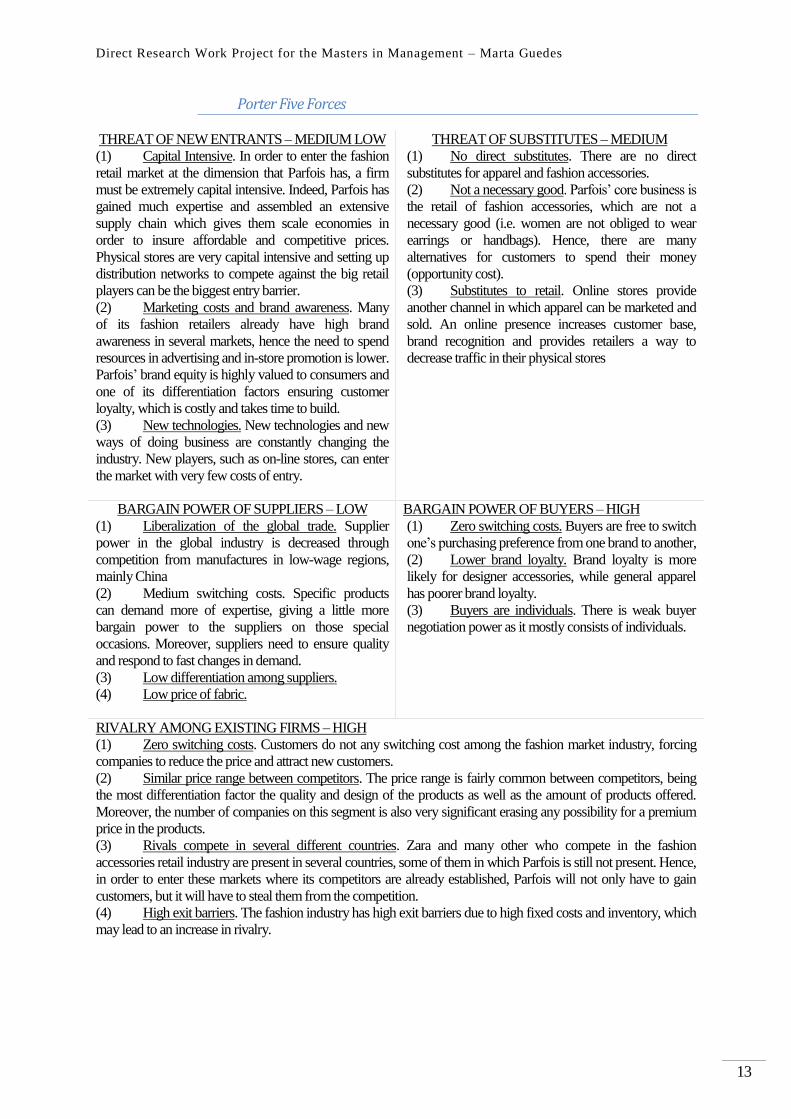
Porter Five Forces
THREAT OF NEW ENTRANTS – MEDIUM LOW
(1) Capital Intensive. In order to enter the fashion
retail market at the dimension that Parfois has, a firm
must be extremely capital intensive. Indeed, Parfois has
gained much expertise and assembled an extensive
supply chain which gives them scale economies in
order to insure affordable and competitive prices.
Physical stores are very capital intensive and setting up
distribution networks to compete against the big retail
players can be the biggest entry barrier.
(2) Marketing costs and brand awareness. Many
of its fashion retailers already have high brand
awareness in several markets, hence the need to spend
resources in advertising and in-store promotion is lower.
Parfois’ brand equity is highly valued to consumers and
one of its differentiation factors ensuring customer
loyalty, which is costly and takes time to build.
(3) New technologies. New technologies and new
ways of doing business are constantly changing the
industry. New players, such as on-line stores, can enter
the market with very few costs of entry.
THREAT OF SUBSTITUTES – MEDIUM
(1) No direct substitutes. There are no direct
substitutes for apparel and fashion accessories.
(2) Not a necessary good. Parfois’ core business is
the retail of fashion accessories, which are not a
necessary good (i.e. women are not obliged to wear
earrings or handbags). Hence, there are many
alternatives for customers to spend their money
(opportunity cost).
(3) Substitutes to retail. Online stores provide
another channel in which apparel can be marketed and
sold. An online presence increases customer base,
brand recognition and provides retailers a way to
decrease traffic in their physical stores
BARGAIN POWER OF SUPPLIERS – LOW
(1) Liberalization of the global trade. Supplier
power in the global industry is decreased through
competition from manufactures in low-wage regions,
mainly China
(2) Medium switching costs. Specific products
can demand more of expertise, giving a little more
bargain power to the suppliers on those special
occasions. Moreover, suppliers need to ensure quality
and respond to fast changes in demand.
(3) Low differentiation among suppliers.
(4) Low price of fabric.
BARGAIN POWER OF BUYERS – HIGH
(1) Zero switching costs. Buyers are free to switch
one’s purchasing preference from one brand to another,
(2) Lower brand loyalty. Brand loyalty is more
likely for designer accessories, while general apparel
has poorer brand loyalty.
(3) Buyers are individuals. There is weak buyer
negotiation power as it mostly consists of individuals.
RIVALRY AMONG EXISTING FIRMS – HIGH
(1) Zero switching costs. Customers do not any switching cost among the fashion market industry, forcing
companies to reduce the price and attract new customers.
(2) Similar price range between competitors. The price range is fairly common between competitors, being
the most differentiation factor the quality and design of the products as well as the amount of products offered.
Moreover, the number of companies on this segment is also very significant erasing any possibility for a premium
price in the products.
(3) Rivals compete in several different countries. Zara and many other who compete in the fashion
accessories retail industry are present in several countries, some of them in which Parfois is still not present. Hence,
in order to enter these markets where its competitors are already established, Parfois will not only have to gain
customers, but it will have to steal them from the competition.
(4) High exit barriers. The fashion industry has high exit barriers due to high fixed costs and inventory, which
may lead to an increase in rivalry.

Direct Research Work Project for the Masters in Management – Marta Guedes
14
S.W.O.T Matrix
STRENGTHS
(1) Price-quality ratio. The products offered by
Parfois have the perfect balance between quality and
price – they have the design and intrinsic quality, while
maintaining an affordable price, hence providing the
best "value and fashion for money". Indeed, Parfois
differentiates itself from many other fashion accessory
brands such as Accessorize and Claire’s by offering
products with much higher quality at affordable prices.
(2) Modern and minimalistic store design. Parfois
store design is extremely modern and simple, (3) Fast-changing collections. Considering that
Parfois target market is women highly sensitive to
fashion trends, having new products in store every week
is an incredibly strength. Indeed, Parfois product offer
goes well beyond its competitors (4) New high-tech logistics center. In order for
Parfois to satisfy all its current demand it just moved all
its logistic operations to a new warehouse where they
do most of the shipping of its product to their
worldwide stores, the quality control check and several
other activities. This new warehouse is equipped with
the newest technology and allows Parfois to be more
efficient.
WEAKNESSES
(1) Logistically restrained. Parfois is still
logistically restrained by its team of designers and its
supply chain and currently it can only satisfy the
demand in one continent, as being present in both
would imply different product lines and double the
inventory, and logistically Parfois is not prepared for it.
Indeed, when asked if Australia could be a possible
target market for expansion Parfois CEO clearly stated
that it would be logistically impossible. (2) Financial restrictions. Parfois is still in a
development phase, thus although the existing profits
are increasing at an extraordinary high rate, the ability
for it to raise funds in order to open new stores and
expand to new countries is still limited, especially when
compared to their main competitors (3) Brand image closely tagged with competitors.
According to Parfois’ CEO the firms biggest competitor
is Zara given that it has not only the same target market
as Parfois and it also follows the concept of high
fashion by having new products in stores every week
and also a clean and simple store visual.
OPPORTUNITIES
(1) Parfois does not compete directly with
strongest competitors. One of Parfois’ competitive
advantage is the fact that there are not many company's
which focus of the merchandise of high quality women
accessories at an affordable price that target the same
consumer. Indeed, most of Parfois’ competitors do not
have as core business the retail of fashion accessories,
thus giving Parfois a strategic advantage, thus their
offering of fashion accessories is considerably lower
than Parfois.
(2) Expansion to different markets. Parfois is
expanding to new markets where its main competitors
are still not there, thus giving them incumbents
advantages
THREATS
(1) Competitors are starting to increase their offer
of accessories. Competitors have been increasing their
offerings of fashion accessories, hence threatening
Parfois strategic position. (2) New non-conventional and technological
players. Technology has changed the way everyone
does almost everything, even the way we shop.
Nowadays there are stores that only operate online,
such as Asos, or in the social networks. Hence, if
Parfois wants to keep its market share it must take
advantages of these new opportunities. In fact, Parfois
already has an online store and it is also present in the
social networks, but their online store is only available
in 26 countries.
Global Readiness
Before analyzing the target markets for which Parfois should expand to, it is extremely
important to ask the question of whether the company should further expand internationally. Parfois has
been having a rapid expansion, however its main focus currently is to solidify its position in the
countries where it already operates and expand to fewer and more strategic markets per year , thus still
having international expansion as part of their strategy. Moreover, Parfois wants to maintain its sales

Direct Research Work Project for the Masters in Management – Marta Guedes
15
growth rate of 30% a year and so new markets will have to be explored, given that Parfois has a great
influence in the Portuguese and Spanish market and these are almost saturated. Hence, the company
should continue to expand abroad in order to maintain growth, but select the international market in
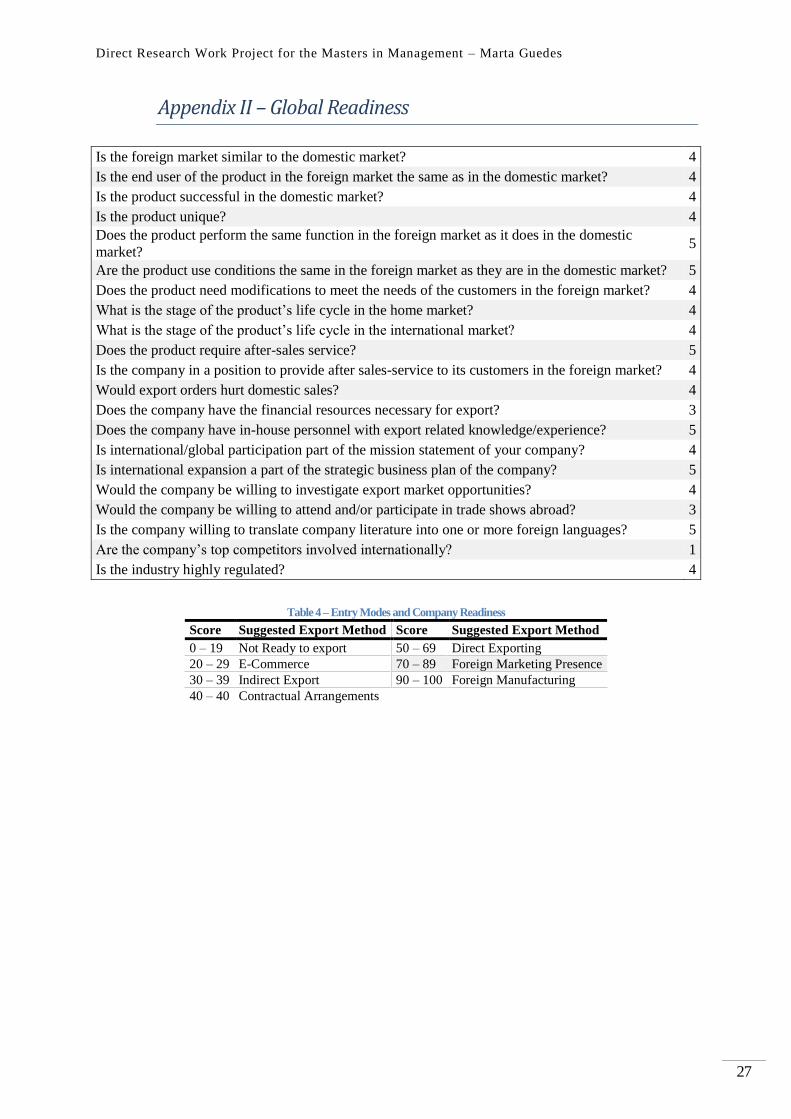
order to efficiently allocate resources. Based upon Parfois’ score of 87 out of 110 (79%), the GMMSO
software suggested preceding with the following entry modes: Foreign Marketing Presence: Foreign
Sales Branch, Foreign Sales/Marketing Subsidiary or Company Owned Retail Store(s). (for data
inputted in the GMMSO4 Software consult Appendix II – Global Readiness)
Module 2: The Search for Global Markets
Having established that Parfois should further expand internationally, a search for global market
is going to be performed. This module is going to be divided in three sub-sections: a Macro Level
Criteria Selection & Data Collection; In-depth market analysis; and The Best Target market.
Macro Level Criteria Selection & Data Collection
In this sub-section, the approach of Cavusgil, Kiyak, & Yeniyurt, 2004 will be followed by
combining a country clustering and a country ranking analysis.
Country Clustering
As already discussed in the Literature Review, country clustering yields a group of countries
with similar commercial, economic, political, and cultural dimensions. These similarities not only help
managers compare the countries, but also provide information on possible synergies among markets
(Cavusgil, Kiyak, & Yeniyurt, 2004). This is an important exercise for Parfois considering that as
analyzed before, the firm usually focuses on similar countries. The goal in this section is therefore to
cluster countries that are as similar as possible taking in consideration four dimensions: economic
stability, governance, human development, and logistics performance.
The first dimension, economic stability, is extremely important in order to determine is a certain
market has excessive fluctuations in its macroeconomic, and hence low risk associated with it. This
dimension is composed of two indicators and two indexes: Inflation rate, exchange rate volatility,
economic freedom index, and ease of doing business index. Low and stable inflation is a great indicator
Direct Research Work Project for the Masters in Management – Marta Guedes
16
of economically stability and creates the necessary conditions for sustainable long-term growth.
Exchange rate volatility measures the risk of a certain economy, given that volatile exchange rates make
international trade and investment decisions more difficult, it increases transaction costs and reduces the
gains to international trade, which creates uncertainty for the exporter's earnings. In an economically free
society, individuals are free to work, produce, consume, and invest how they please, and governments
allow labor, capital, and goods to move freely, and refrain from coercion or constraint of liberty beyond
the extent necessary to protect and maintain liberty itself. As a proxy for this dimension the Economic
Freedom Index (EFI) was used. This index measures economic freedom based on 10 quantitative and
qualitative factors, grouped into four broad categories of economic freedom: rule of law; limited
government; regulatory efficiency; and open markets. The ease of Doing Business Index (DB) is based
on the study of laws and regulations in order to establish the optimal level of business regulation. A high
ease of doing business ranking means the regulatory environment is more conducive to the starting and
operation of a local firm, hence it an extremely important index for this project. This index ranks a
nation based on the average of 10 sub-indices: starting a business, dealing with construction permits,
getting electricity, registering property, getting credit, protecting minority investors, paying taxes, trading
across borders, enforcing contracts, and resolving insolvency.
Governance consists of the traditions and institutions by which authority in a country is
exercised and good governance has been closely linking to successful development (Kaufmann &
Kraay, 2002). In order to measure the governance dimension, a proxy of the Worldwide Governance
Indicators was used, as it already aggregates six important indicators of governance. These six indicators
are: voice and accountability, political stability and absence of violence/terrorism, government
effectiveness, regulatory quality, rule of law, and control of corruption. This dimension has a high
correlation with the latter one (0.71), considering that good governance in highly conductive to
economic stability. The third dimension, human development, was measured using The Human
Development Index (HDI), as it is already a very complete and widely used index. Human development
Direct Research Work Project for the Masters in Management – Marta Guedes
17
is defined as the process of enlarging people’s freedoms and opportunities and improving their well-
being. The HDI measures key dimensions of human development: a long and healthy life, being
knowledgeable and have a decent standard of living. The health dimension is assessed by life
expectancy at birth; the education dimension is measured by mean of years of schooling for adults aged
25 years and more and expected years of schooling for children of school entering age. The standard of
living dimension is measured by gross national income per capita. Lastly, the fourth dimension in the
cluster analysis is the logistics performance. This dimension was included in the cluster analysis given to
the fact that logistics performance is extremely important to Parfois, given that its market strategy is
highly based on fast fashion and thus it must ship new products to every store around the world very
often. Accordingly, the Logistics Performance Index (LPI) was used to measure the performance along
the logistics supply chain within a country. The LPI measures the efficiency of customs and border
management clearance, the quality of trade and transport infrastructure, the ease of arranging
competitively priced shipments, the competence and quality of logistics services—trucking, forwarding,
and customs brokerage, the ability to track and trace consignments, and the frequency with which
shipments reach consignees within scheduled or expected delivery times
Once all the secondary data was retrieved, the indicators had to be standardized in order to be
comparable and transferable. Indeed, Hair, Anderson, Tatham, and Black (1995) point out that factor
scores are unique to a particular set of data and are not replicable in other studies. Therefore, for each of
the indicators each variable was transformed into z scores. This is necessary because the data contain
measures with considerably different scales, thus in order to minimize the scale effects and to avoid any
implicit weighting, the variables were standardized. In addition, those with negative factor loadings
(inflation rate, exchange rate volatility and DB) were reversed to ensure that the averages were precise in
representing the factors.
The clusters were developed with the help of the NCSS Statistical software to create
hierarchical clusters. Initially all countries in the world were selected to be studies and form clusters and
Direct Research Work Project for the Masters in Management – Marta Guedes
18
information was gathered from publicly available secondary data sources. However, due to missing
data, a number of countries had to be filtered out, leaving a final set of 126 countries. Moreover, Parfois
already operated in several countries, so these had to be taken out of the study as they would not be
available for Parfois to expand to. This reduced the country set by another 45 countries, leaving the total
sample with 81 countries. As mentioned before, Parfois is not able to satisfying the demand in both
continents as it would imply different product lines and double the inventory, and logistically Parfois is
not prepared for it. This diminished the set of available countries by 25. In the end, the set of countries
where Parfois could possibly expand to was 56, which are presented in clusters in the table below.
The first cluster contains the countries with lowest ratings in the dimensions described above,
and cluster six contains the countries with highest classification. The results from the country clustering
were extremely interesting wen taking into consideration the countries where Parfois had already
expanded to. Cluster 4 had a total of 21 countries initially, from which 16 Parfois was already present. If
the countries in the Southern Hemisphere are subtracted, as they are not admissible for Parfois, we can
see that from the 20 possible countries for which Parfois could expand, it already entered 16,
corresponding to 80% of the countries in the cluster. Hence it is obvious that this cluster is the one with
most desirability to Parfois, and it should be the one considered for international expansion. Moreover,
although cluster 5 is composed of countries with highest classification in the dimensions, these are also
the countries where competition is higher and more intense, and thus not as attractive for Parfois.
Indeed, Parfois is only present in 25% of the possible markets.
Country Ranking The second principal method for identifying target markets is to rank countries on some
meaningful indicators of market potential. This approach complement country clustering because while
clustering identifies markets in terms of macro similarities, it does not indicate which countries may be
more attractive for trade or investment purposes. Hence, the objective of ranking is to order countries on
the basis of aggregate market potential (Cavusgil, Kiyak, & Yeniyurt, 2004).
Direct Research Work Project for the Masters in Management – Marta Guedes
19
Cavusgil, Kiyak, & Yeniyurt, 2004 created a set of seven dimensions meant to evaluate market
potential. In this study the seven dimensions were market size, market growth rate, market intensity,
commercial infrastructure/access to customer, market receptivity, free market structure and country risk.
From these seven indicators, three were already partially or fully included in the market clustering
method, specifically commercial infrastructure/access to customer which was measured by the Logistics
Preformance Index (LPI); free market structure which was partly evaluated in economic stability by the
Economic Freedom Index; and country risk which is a proxy for the governemnt dimension in the
country cluster method. This ranking method used in this project is extremely similar to the approach
recommended in Cavusgil, Kiyak, & Yeniyurt, 2004, however the dimensions described above which
were already present in country clustering were not included in the country ranking and some
dimensions suffered small modifications. Hence, the approach used for country ranking in this project
has a total of four dimensions: market size; market growth; market intensity; and market receptivity. The
data was retrieved from publicly available secondary data sources, as it is presented in Table 1.
The first dimension, market size, used the exact same indicators as in the Cavusgil, Kiyak, &
Yeniyurt, 2004 apprach: urban population and electric production. In the market growth dimension an
extra indicator was included: urban population growth rate. The third dimension of this approach,
market intensity, was composed by three measures: percentage of urban population, GNI per capita
PPP, and private consumprion as percentage of GDP. Finaly, the market receptivity was also very
similar to the one in the Cavusgil, Kiyak, & Yeniyurt, 2004, however, instead of U.S. imports per capita
the indicator used was the Portugal Export Value per country, since the firm in question is Portuguese.
The weights given to each dimension was 30 % for all except for market receptivity which only
weighted 10% was it is considered the least important. Again, the set of countries had to be reduced due
to the lack of compleate secondary information regarding all markets. Due to this, the final set of
admissible countries fow Parfois’ expansion was 41.

Direct Research Work Project for the Masters in Management – Marta Guedes
20
Final Approach: Country Clustering and Country Ranking
Both approaches presented above have their advantages and disadvantages. Indeed, country
clustering groups countries regarding their similarity but does not reveal much about market potential.
On the other hand, country ranking identifies the most attractive markets but does not help the manager
understand similarities and differences among them. Therefore, using only one method may lead to
suboptimal decisions (Cavusgil, Kiyak, & Yeniyurt, 2004). Hence, by combining these two methods,
one has more information and thus can reach a better decision.
Table 2 – Country Cluster and Country Ranking
Cluster 1 Rank Cluster 2 Rank Cluster 3 Rank Cluster 4 Rank Cluster 5 Rank
Nicaragua 26 India 4 China 1 Iceland 23 United
States 2
Niger 30 Mongolia 14 Malaysia 10 Korea South 33 Singapore 3
Cameroon 37 El Salvador 67 Mexico 22 Israel 45 Japan 12
Togo 42 Kazakhstan 73 Turkey 25 Lithuania 90 Norway 16
Nigeria 52 Bosnia and
Herzegovina 102 Thailand 56
Switzerland 17
Ghana 53 Trinidad and
Tobago 111 Costa Rica 57
Netherlands 18
Cambodia 62
Montenegro 74
Canada 24
Benin 63
Jamaica 81
Sweden 46
Bangladesh 64
Greece 104
Denmark 55
Pakistan 66
Finland 88
Senegal 95
Nepal 97
Presented above is the final approach which combines the two methods above. As mentioned
before, Cluster 4 is the most attractive to Parfois and hence the chosen countries for the in-depth analysis
are going to be the three counties with highest ranking from cluster 4: Iceland, South Korea and Israel.
In-depth market analysis
Having the Macro Level Criteria Selection & Data Collection done, it is important to analyze
the chosen markets on an in-depth basis. In this sub-section the market and sales potential of Parfois will
be analyses, as well as the competitive analysis and country entry conditions
Market and sales potential
An important part of the market analysis is determining the market sales potential. In order to do
so the field of three countries was narrowed down to two, the Korea Rep. and Israel. These were chosen
because they were clearly the most favorable markets for Parfois after considering the various criteria
and using the GMMSO software to run the numbers. The following table shows the calculations done to

Direct Research Work Project for the Masters in Management – Marta Guedes
21
calculate total market potential. The number of potential customers uses the percentage of urban
population and total female population of aged from 20 to 40 as its base number given that it is Parfois
target market. Parfois states in their web-site that at least 70% of their customers visit the store twice a
month, and that 36% visit it every week. Hence, the average customer visits the store an average of 2,84
times a months, which multiplied by twelve gives us the 34,08 times a year. Moreover, Parfois’ website
was analyzed in order to determine the average price of its products, which yielded an average of 10,56€
(prices according to the Portuguese market). In regards to the products purchased by visit, an assumption
was made that each customer buys two products. (See Appendix V – Market and Company Sales
Potential for clarity)
Table 3 – Market and Company Sales Potential
Market and Company Sales Potential Iceland Korea, Rep. Israel
No. potential (eligible/qualified) consumers 42.523 5.029.383 866.208
Frequency of purchase on an annual basis 34,08 34,08 34,08
Shopping expenditure 26,07 33,48 32,08
Total market potential 37.777.130 5.739.038.820 946.931.448
Desired Market Share 1,2% 1,2% 1,2%
Company Sales Potential 453.326 68.868.466 11.363.177
Competitive Analysis
As already mentioned thought this project, Parfois’ major competitor is Zara (according to
Sérgio Marques, Parfois’ CEO). The reasoning behind this is that Zara offers a similar product price
level with good quality, the store environment is also simple and clean, and it also follows the concept of
fast fashion by Fashion accessory industry considering that most consumers view Zara as a clothing
store and not accessories staying current to the newest trends. Nevertheless, Parfois still has the
competitive advantage as Parfois offer of accessories is extensively larger. Similar to Zara, Parfois also
has to compete against Mango and H&M, however these are further away from the differentiating
factors of Parfois and have the same down-side of Zara. Moreover, there are also fashion accessories
only brands present in the market, such as Accessorize and Misako, however the quality of their
products are inferior to Parfois and their target market isn’t the same. Moreover, these brands are not in
the markets selected for analysis, thus they are not part of the competition in them.
Direct Research Work Project for the Masters in Management – Marta Guedes
22
Both countries have fierce competition, as was expected considering its size. Indeed, Zara,
H&M and Mango are already present in both South Korea. Indeed, Zara has 43 stores in Korea (20
stores in Seoul alone) and 23 in Israel, H&M has 26 stores in South Korea and 19 in Israel and Mango
has 16 in Israel and 7 in South Korea. Moreover, there are also strong internal competitors in both
markets. Stylenanda is a South Korean store with 28 physical stores in the country and in Israel there is a
national firm called Castro, which has a very strong market position, owning a total of 148 all over
Israel. These stores sell both clothing and accessories, although it is not its core business, thus giving
Parfois a strategic advantage in this area.
Country Entry Conditions
The entry conditions are an extremely important factor to have in consideration when entering a
new market. Resorting to the Ease of Doing Business, Korea ranks the 4th place, thus meaning that the
regulatory environment in South Korea is the 4th most conducive to the starting and operation of a local
firm. Israel falls behind to the 53rd place, mainly due to the low scores in four dimensions: registering
property, paying taxes, dealing with construction permits, and dealing with construction permits, where
the country where the country has scores below average, ranking in the bottom half. Regarding the
Logistic Performance Index, Korea ranks 24th and Israel 26
th, being in the top 20% countries. (the
complete tables with each index dimension and score for the selected countries are presented in
Appendix VI – Tables Country Entry Conditions)
Regarding corporate tax, in Israel, capital gains are subject to the standard corporate tax rate.
Dividends from foreign sources are subject to a 25% tax with a credit for foreign withholding tax, and in
certain circumstances, at the standard corporate tax rate on the grossed up dividend with a credit granted
on all foreign taxes paid by the direct and second tier subsidiary on the dividend and the income from
which it is distributed. In Korea Rep. the corporate tax rate is 11% (including 10% of local income tax)
up to 200 million Korean Won (158 612 Euros), 22% (including 10% of local income tax) over 200
million to 20 billion Korean Won and 24.2% (including 10% of local income tax) over 20 billion
Korean Won (KPMG International Cooperative, 2016). Hence the maximum tax rate in Korea is lower

Direct Research Work Project for the Masters in Management – Marta Guedes
23
than in Israel. On the other hand, Korea’s Labor Freedom score is much lower than Israel, ranking the
country in 130 out of 178 countries analyzed, while Israel ranks 66th. Overall, the entry conditions are
favorable in both countries, with a slight emphasis in South Korea.
The Best Target market
Considering this in-depth analysis, the market most appropriate market for Parfois’ expansion
was selected with the aid of the GMMSO software: the final chosen market selected was South Korea.
There are several reasons behind this choice, being the most important one the fact that Parfois’ sales
potential is 6 times higher in South Korea than in Israel, however the amount of stores of close
international competitor stores (Zara, Mango and H&M) is only twice as high in South Korea.
Moreover, Israel has a national competitor – Castro – extremely influent with 148 stores in the country
(three times more stores as Zara, Mango and H&M together). Moreover, the conditions of entry of
extremely similar in both countries, with a slight incline for South Korea.
Conclusion & Recommendations In conclusion, this work project attempts to provide insight into the International Market
Selection process for a growing firm which needs to allocate its resources efficiently by providing a
practical example of this IMS process for Parfois. The paper began with a literature review that
underpinned the theory behind IMS practices. This was followed by the methodology chapter which
explained how the analysis was developed. Module 3 was composed of two parts: the Macro level
analysis and the In-depth analysis. The macro level analysis followed the approach of Cavusgil, Kiyak,
& Yeniyurt, 2004 by using the country clustering and ranking methods togther. Then the in-depth
analysis was conducted with the aid of the GMMSO software.
My recommendation for Parfois is to first focus on the cluster markets they wish to enter, only
passing to the successive cluster once the first is saturated. The clusters resultant from this study might
be different than the “real” Parfois ones, taking into consideration that they lacked product specific
indicators, not all information was available, and the weight of each criteria may differ. Nevertheless, the
cluster analysis conducted in this paper demonstrated that Parfois has a clear preference for cluster 4,
Direct Research Work Project for the Masters in Management – Marta Guedes
24
followed by cluster 3 and 2, and thus Parfois should pay close attention to these clusters’ markets,
especially the ones with higher market potential marking (such as China, Malaysia, México, Greece and
India).
Limitations & Implications There are several aspects of the study which limited the results and give some directions for future
research. Firstly important data was necessary but unobtainable as it is private company information, thus an
internal analysis might lead to other results. Several assumptions and estimates were made in order to fill the
gap when there was missing information which might be wrong and thus alter the results. Moreover, several
potential target markets had to be removed from the study due to lack of information in the macro level
analysis. Obviously this has severe implications, as the “optimal” target market may not have been analyzed.

Direct Research Work Project for the Masters in Management – Marta Guedes
25
References
Andersen, O. (1993). On the Internationalization Process of Firms: A Critical Analysis. Journal of International
Business Studies, 24(2), 209-231.
Anderson, O., & Buvik, A. (2002). Firms' internationalization and alternative approaches to the international
customer/market selection. International Business Review, 11(3), 347-363.
Cavusgil, S. T., Kiyak, T., & Yeniyurt, S. (2004). Complementary approaches to preliminary foregn market
opportunity assessment: Country clustering and country ranking. Industrial Marketing Management,
33(7), 607-617.
Central Intelligence Agency. (2016). CIA World Fact Book. Retrieved June 2016, from
https://www.cia.gov/library/publications/the-world-factbook/
European Comission. (2016). InforEuro. Retrieved September 2016, from
http://ec.europa.eu/budget/contracts_grants/info_contracts/inforeuro/index_en.cfm
Gaston-Breton, C., & Martín, O. M. (2011). International market selection and segmentation: a two-stage model.
International Marketing Review, 28(3), 267-290.
International Monetary Fund. (2016, April). IMF Data Mapper. World Economic Outlook. Retrieved June 16,
2016, from http://www.imf.org/external/datamapper/index.php
Kaufmann, D., & Kraay, A. (2002, November). Growth Without Governance. World Bank Policy Research
Working Paper.
KPMG International Cooperative. (2016). Corporate tax rates table. Retrieved September 2016, from
https://home.kpmg.com/xx/en/home/services/tax/tax-tools-and-resources/tax-rates-online/corporate-tax-
rates-table.html
Kumar, V., Stam, A., & Joachimsthaler, E. A. (1994). An interactive multicriteria approach to identifying potential
foreign markets. Journal of International Marketing, 29-52.
Küster, I., & Vila, N. (2002). The market orientation-innovation-success relationship: The role of
internationalization strategy. Innovation, 13(1), 36-54.
Liander, B., Terpstra, V., Yoshino, M., & Sherbini, A. (1967). Comparative analysis for international marketing.
Marques, S. (2015, 11 17). Entrevista ao CEO Parfois. (A. P. Metelo, Interviewer)
Melin, L. (1992). Internationalization as a Strategy Process. Strategic Management Jornal, 13, 99-118.
O'Farrell, P. N., & Wood, P. A. (1994). International market selection by business service firms: key conceptual
and methodological issues. International Business Review, 3(3), 243-261.
Pangarkar Lin Yuan, N. (2009). Location in Internationalization Strategy: Determinants and Consequences.
Multinational Business Review, 17(2), 37-68.
Papadopoulos, N., & Denis, J.-E. (1988). Inventory, Taxonomy and assessment of methods for international
market selection. International Marketing Review, 5(3).
Papadopoulos, N., & Martín, O. M. (2011). International market selection and segmentation: perspectives and
challenges. International Marketing Review, 28(2), 132-149.
Parfois. (n.d.). Retrieved 7 5, 2016, from http://www.parfois.com/
S. Welch, L., & Luostarinen, R. (1988). Internationalization: Evolution of a Concept. Journal of General
Management, 14(2), 34-53.
Sakarya, S., Eckman, M., & Hyllegard, K. H. (2007). Market selection for international expansion: Assessing
opportunities in emerging markets. International Marketing Review, 24(2), 208-238.
Simoes, A. (2014). The Observatory of Economic Complexity. Retrieved August 2016, from
http://atlas.media.mit.edu/en/
The Heritage Foundation. (2016). Index of Economic Freedom. Retrieved June 2016, from
http://www.heritage.org/index/
The World Bank. (2014). The Worldwide Governance Indicators. Retrieved June 2016, from
www.govindicators.org
The World Bank. (2015, June). Doing Business. Retrieved June 2016, from http://www.doingbusiness.org/
The World Bank. (2016). Logistics Preformance Indicators. Retrieved June 2016, from http://lpi.worldbank.org/
The World Bank. (2016, July). World Development Indicators. Retrieved August 2016, from
http://data.worldbank.org/data-catalog/world-development-indicators
United Nations. (2014). Human Development Report. Retrieved June 2016, from
http://hdr.undp.org/en/content/human-development-index-hdi
Direct Research Work Project for the Masters in Management – Marta Guedes
26
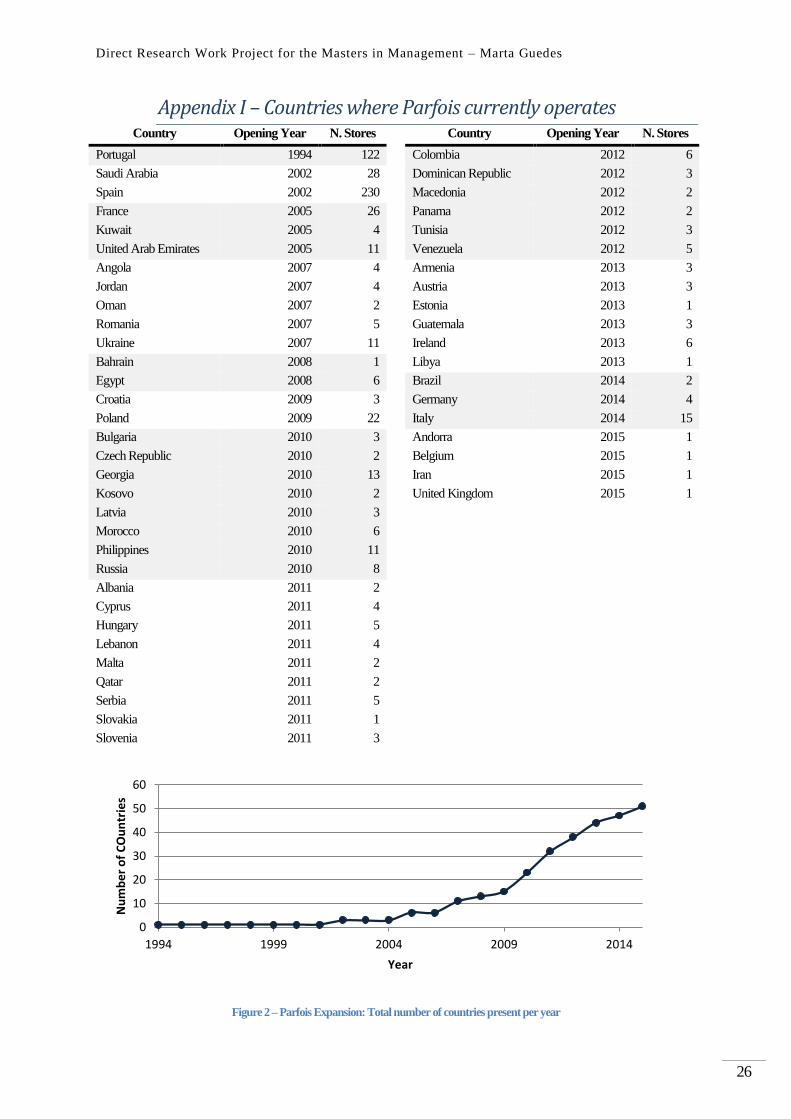
Appendix I – Countries where Parfois currently operates Country Opening Year N. Stores Country Opening Year N. Stores
Portugal 1994 122 Colombia 2012 6
Saudi Arabia 2002 28 Dominican Republic 2012 3
Spain 2002 230 Macedonia 2012 2
France 2005 26 Panama 2012 2
Kuwait 2005 4 Tunisia 2012 3
United Arab Emirates 2005 11 Venezuela 2012 5
Angola 2007 4 Armenia 2013 3
Jordan 2007 4 Austria 2013 3
Oman 2007 2 Estonia 2013 1
Romania 2007 5 Guatemala 2013 3
Ukraine 2007 11 Ireland 2013 6
Bahrain 2008 1 Libya 2013 1
Egypt 2008 6 Brazil 2014 2
Croatia 2009 3 Germany 2014 4
Poland 2009 22 Italy 2014 15
Bulgaria 2010 3 Andorra 2015 1
Czech Republic 2010 2 Belgium 2015 1
Georgia 2010 13 Iran 2015 1
Kosovo 2010 2 United Kingdom 2015 1
Latvia 2010 3
Morocco 2010 6
Philippines 2010 11
Russia 2010 8
Albania 2011 2
Cyprus 2011 4
Hungary 2011 5
Lebanon 2011 4
Malta 2011 2
Qatar 2011 2
Serbia 2011 5
Slovakia 2011 1
Slovenia 2011 3
Figure 2 – Parfois Expansion: Total number of countries present per year
0
10
20
30
40
50
60
1994 1999 2004 2009 2014
Nu
mb
er
of
CO
un
trie
s
Year
Direct Research Work Project for the Masters in Management – Marta Guedes
27
Appendix II – Global Readiness
Is the foreign market similar to the domestic market? 4
Is the end user of the product in the foreign market the same as in the domestic market? 4
Is the product successful in the domestic market? 4
Is the product unique? 4
Does the product perform the same function in the foreign market as it does in the domestic
market? 5
Are the product use conditions the same in the foreign market as they are in the domestic market? 5
Does the product need modifications to meet the needs of the customers in the foreign market? 4
What is the stage of the product’s life cycle in the home market? 4
What is the stage of the product’s life cycle in the international market? 4
Does the product require after-sales service? 5
Is the company in a position to provide after sales-service to its customers in the foreign market? 4
Would export orders hurt domestic sales? 4
Does the company have the financial resources necessary for export? 3
Does the company have in-house personnel with export related knowledge/experience? 5
Is international/global participation part of the mission statement of your company? 4
Is international expansion a part of the strategic business plan of the company? 5
Would the company be willing to investigate export market opportunities? 4
Would the company be willing to attend and/or participate in trade shows abroad? 3
Is the company willing to translate company literature into one or more foreign languages? 5
Are the company’s top competitors involved internationally? 1
Is the industry highly regulated? 4
Table 4 – Entry Modes and Company Readiness
Score Suggested Export Method Score Suggested Export Method
0 – 19 Not Ready to export 50 – 69 Direct Exporting
20 – 29 E-Commerce 70 – 89 Foreign Marketing Presence
30 – 39 Indirect Export 90 – 100 Foreign Manufacturing
40 – 40 Contractual Arrangements
Direct Research Work Project for the Masters in Management – Marta Guedes
28
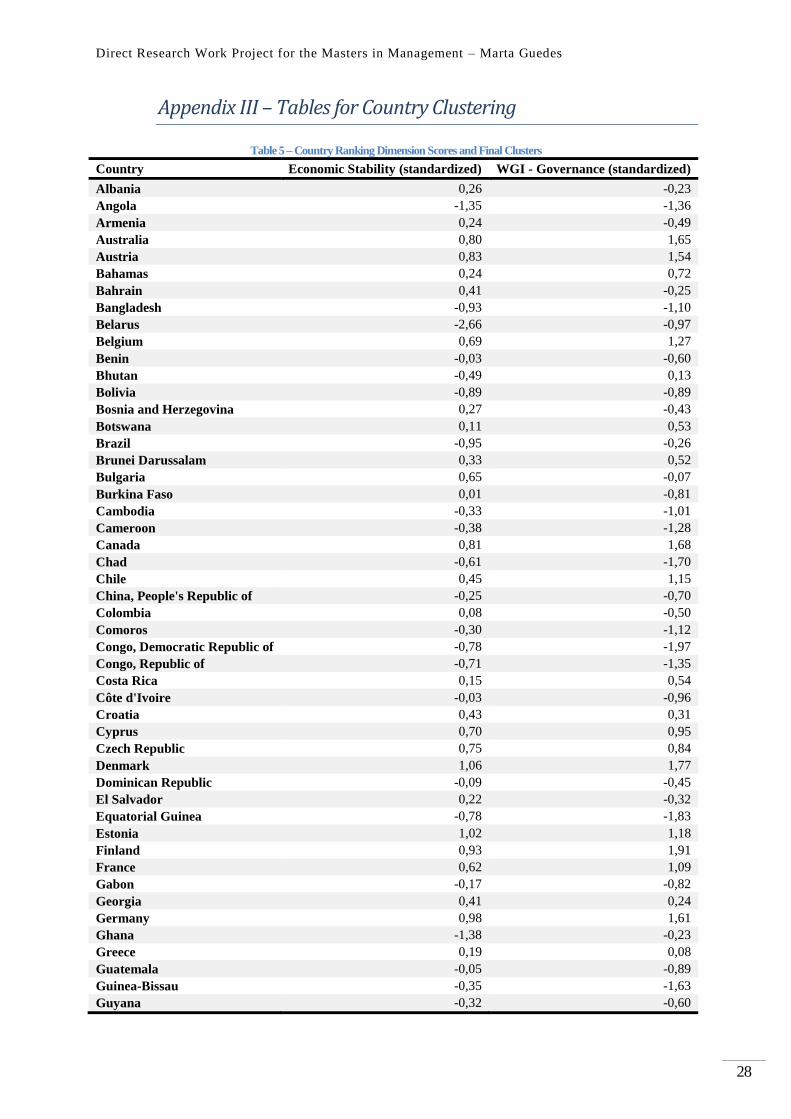
Appendix III – Tables for Country Clustering
Table 5 – Country Ranking Dimension Scores and Final Clusters
Country Economic Stability (standardized) WGI - Governance (standardized)
Albania 0,26 -0,23
Angola -1,35 -1,36
Armenia 0,24 -0,49
Australia 0,80 1,65
Austria 0,83 1,54
Bahamas 0,24 0,72
Bahrain 0,41 -0,25
Bangladesh -0,93 -1,10
Belarus -2,66 -0,97
Belgium 0,69 1,27
Benin -0,03 -0,60
Bhutan -0,49 0,13
Bolivia -0,89 -0,89
Bosnia and Herzegovina 0,27 -0,43
Botswana 0,11 0,53
Brazil -0,95 -0,26
Brunei Darussalam 0,33 0,52
Bulgaria 0,65 -0,07
Burkina Faso 0,01 -0,81
Cambodia -0,33 -1,01
Cameroon -0,38 -1,28
Canada 0,81 1,68
Chad -0,61 -1,70
Chile 0,45 1,15
China, People's Republic of -0,25 -0,70
Colombia 0,08 -0,50
Comoros -0,30 -1,12
Congo, Democratic Republic of -0,78 -1,97
Congo, Republic of -0,71 -1,35
Costa Rica 0,15 0,54
Côte d'Ivoire -0,03 -0,96
Croatia 0,43 0,31
Cyprus 0,70 0,95
Czech Republic 0,75 0,84
Denmark 1,06 1,77
Dominican Republic -0,09 -0,45
El Salvador 0,22 -0,32
Equatorial Guinea -0,78 -1,83
Estonia 1,02 1,18
Finland 0,93 1,91
France 0,62 1,09
Gabon -0,17 -0,82
Georgia 0,41 0,24
Germany 0,98 1,61
Ghana -1,38 -0,23
Greece 0,19 0,08
Guatemala -0,05 -0,89
Guinea-Bissau -0,35 -1,63
Guyana -0,32 -0,60

Direct Research Work Project for the Masters in Management – Marta Guedes
29
Country Economic Stability (standardized) WGI - Governance (standardized)
Haiti -1,07 -1,53
Hong Kong SAR 0,99 1,51
Hungary 0,50 0,40
Iceland 0,71 1,49
India -0,74 -0,54
Indonesia -0,57 -0,45
Iran -1,86 1,55
Ireland 1,08 0,56
Israel 0,52 0,32
Italy 0,51 -0,16
Jamaica -0,12 1,39
Japan 0,53 1,36
Jordan 0,06 -0,30
Kazakhstan -0,48 -0,72
Kenya -0,50 -0,86
Korea, Republic of 0,66 0,68
Kuwait -0,06 -0,40
Latvia 0,87 0,70
Lebanon -0,13 -1,07
Lesotho -0,76 -0,43
Liberia -1,22 -1,11
Lithuania 1,02 0,81
Luxembourg 0,75 1,74
Macedonia, FYR 0,79 -0,05
Madagascar -0,77 -1,09
Malaysia 0,45 0,39
Maldives -0,42 -0,35
Mali -0,07 -1,15
Malta 0,46 1,03
Mexico 0,15 -0,47
Mongolia -0,48 -0,28
Montenegro 0,57 -0,04
Morocco 0,26 -0,50
Mozambique -0,94 -0,82
Namibia -0,41 0,11
Nepal -0,91 -0,98
Netherlands 0,91 1,74
New Zealand 0,91 1,93
Nicaragua -0,48 -0,81
Niger -0,22 -1,01
Nigeria -1,49 -1,56
Norway 0,60 1,81
Oman 0,32 0,06
Pakistan -0,74 -1,39
Panama 0,17 -0,06
Papua New Guinea -0,73 -0,79
Philippines -0,09 -0,43
Poland 0,68 0,80
Portugal 0,73 0,88
Qatar 0,30 0,49
Romania 0,52 0,00
Russian Federation -1,11 -0,96
Rwanda 0,11 -0,23
Direct Research Work Project for the Masters in Management – Marta Guedes
30
Country Economic Stability (standardized) WGI - Governance (standardized)
São Tomé and Príncipe -0,58 -0,61
Saudi Arabia 0,00 -0,48
Senegal -0,04 -0,31
Serbia 0,18 -0,15
Singapore 1,20 1,62
Slovakia 0,73 0,63
Slovenia 0,57 0,76
South Africa -0,33 0,04
Spain 0,77 0,69
Sweden 0,87 1,78
Switzerland 0,88 1,89
Tajikistan -0,82 -1,32
Thailand 0,28 -0,53
Togo -0,22 -1,13
Trinidad and Tobago -0,21 -0,11
Turkey -0,33 -0,33
Uganda -0,55 -0,92
Ukraine -2,79 -1,12
United Arab Emirates 0,54 0,59
United Kingdom 0,79 1,47
United States 0,82 1,19
Uruguay -0,33 0,77
Zambia -1,03 -0,51
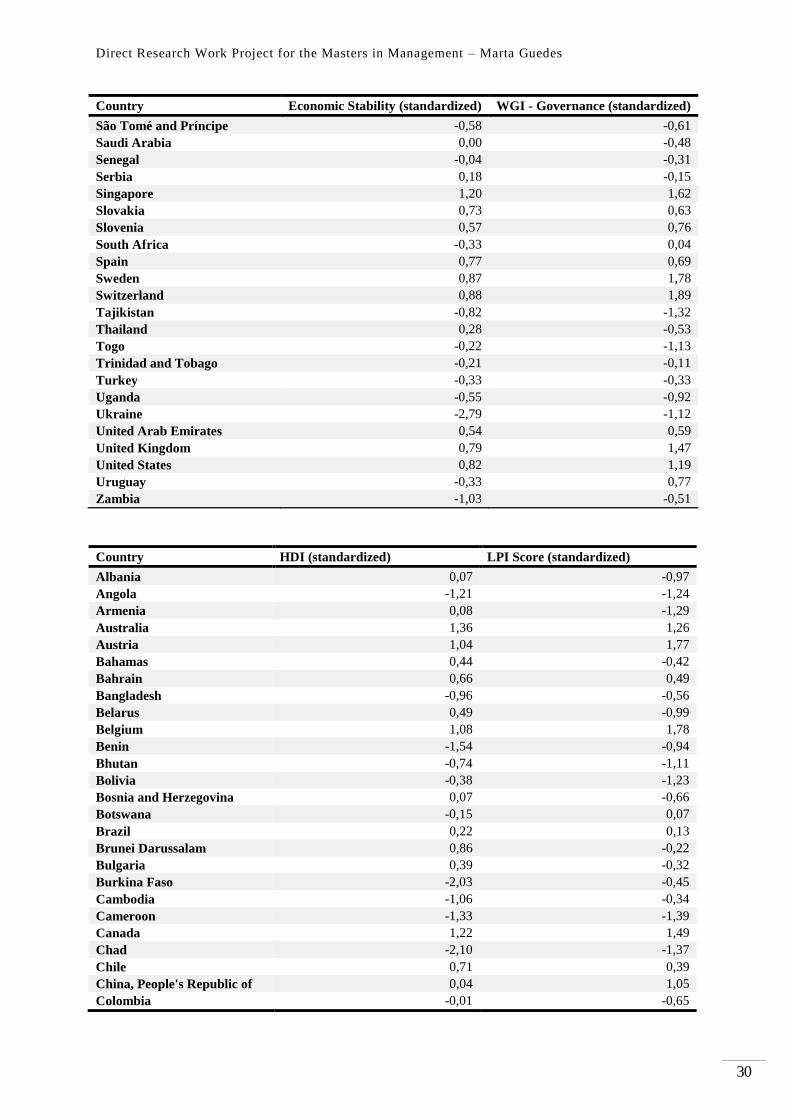
Country HDI (standardized) LPI Score (standardized)
Albania 0,07 -0,97
Angola -1,21 -1,24
Armenia 0,08 -1,29
Australia 1,36 1,26
Austria 1,04 1,77
Bahamas 0,44 -0,42
Bahrain 0,66 0,49
Bangladesh -0,96 -0,56
Belarus 0,49 -0,99
Belgium 1,08 1,78
Benin -1,54 -0,94
Bhutan -0,74 -1,11
Bolivia -0,38 -1,23
Bosnia and Herzegovina 0,07 -0,66
Botswana -0,15 0,07
Brazil 0,22 0,13
Brunei Darussalam 0,86 -0,22
Bulgaria 0,39 -0,32
Burkina Faso -2,03 -0,45
Cambodia -1,06 -0,34
Cameroon -1,33 -1,39
Canada 1,22 1,49
Chad -2,10 -1,37
Chile 0,71 0,39
China, People's Republic of 0,04 1,05
Colombia -0,01 -0,65

Direct Research Work Project for the Masters in Management – Marta Guedes
31
Country HDI (standardized) LPI Score (standardized)
Comoros -1,39 -0,69
Congo, Democratic Republic
of -0,83 -1,02
Congo, Republic of -1,83 -1,02
Costa Rica 0,29 -0,58
Côte d'Ivoire -1,65 -0,66
Croatia 0,61 0,24
Cyprus 0,82 -0,01
Czech Republic 0,95 1,07
Denmark 1,29 1,31
Dominican Republic -0,04 -0,61
El Salvador 0,07 -0,48
Equatorial Guinea -0,86 -1,83
Estonia 0,89 0,57
Finland 1,03 1,47
France 1,06 1,44
Gabon -0,24 -1,33
Georgia 0,21 -1,07
Germany 1,24 1,98
Ghana -0,90 -0,56
Greece 0,92 0,37
Guatemala -0,60 -0,86
Guinea-Bissau -1,92 -1,03
Guyana -0,54 -0,55
Haiti -1,51 -2,09
Hong Kong SAR 1,20 1,72
Hungary 0,68 0,68
Iceland 1,14 0,55
India -0,72 0,67
Indonesia -0,24 -0,05
Iran 0,28 -0,66
Ireland 1,24 1,26
Israel 1,10 1,05
Italy 0,97 1,22
Jamaica -0,02 -0,99
Japan 1,08 1,56
Jordan 0,17 -0,08
Kazakhstan 0,43 -0,42
Kenya -1,10 0,52
Korea, Republic of 1,13 1,15
Kuwait 0,61 0,23
Latvia 0,62 0,52
Lebanon 0,31 -0,47
Lesotho -1,43 -1,58
Liberia -1,86 -1,31
Lithuania 0,75 1,01
Luxembourg 1,09 1,96
Macedonia, FYR 0,17 -0,81
Madagascar -1,34 -1,39
Malaysia 0,37 0,68
Maldives -0,09 -0,81
Mali -1,92 -0,82
Malta 0,75 0,10

Direct Research Work Project for the Masters in Management – Marta Guedes
32
Country HDI (standardized) LPI Score (standardized)
Mexico 0,22 0,16
Mongolia 0,04 -0,81
Montenegro 0,52 -1,02
Morocco -0,59 -0,55
Mozambique -1,94 -0,53
Namibia -0,59 -0,44
Nepal -1,10 -1,02
Netherlands 1,28 1,91
New Zealand 1,23 0,62
Nicaragua -0,57 -0,77
Niger -2,37 -0,73
Nigeria -1,32 -0,61
Norway 1,42 1,17
Oman 0,46 0,36
Pakistan -1,16 -0,14
Panama 0,37 0,54
Papua New Guinea -1,37 -0,81
Philippines -0,34 -0,24
Poland 0,77 0,68
Portugal 0,69 0,65
Qatar 0,82 0,96
Romania 0,46 -0,03
Russian Federation 0,49 -0,71
Rwanda -1,51 -0,03
São Tomé and Príncipe -1,06 -1,10
Saudi Arabia 0,74 0,24
Senegal -1,62 -1,10
Serbia 0,32 -0,40
Singapore 1,22 1,83
Slovakia 0,78 0,54
Slovenia 1,01 0,28
South Africa -0,35 1,25
Spain 0,99 1,17
Sweden 1,18 1,93
Switzerland 1,33 1,59
Tajikistan -0,61 -1,54
Thailand 0,03 0,41
Togo -1,51 -0,63
Trinidad and Tobago 0,32 -0,99
Turkey 0,26 0,67
Uganda -1,52 0,05
Ukraine 0,17 -0,44
United Arab Emirates 0,73 1,51
United Kingdom 1,18 1,72
United States 1,24 1,59
Uruguay 0,46 -0,06
Zambia -0,86 -0,94
Country Total Score Cluster
Albania -0,22 2
Angola -1,29 1

Direct Research Work Project for the Masters in Management – Marta Guedes
33
Country Total Score Cluster
Armenia -0,37 2
Australia 1,27 5
Austria 1,30 5
Bahamas 0,24 3
Bahrain 0,33 3
Bangladesh -0,89 1
Belarus -1,03 1
Belgium 1,21 5
Benin -0,78 1
Bhutan -0,55 1
Bolivia -0,85 1
Bosnia and Herzegovina -0,19 2
Botswana 0,14 3
Brazil -0,22 2
Brunei Darussalam 0,37 3
Bulgaria 0,16 3
Burkina Faso -0,82 1
Cambodia -0,68 1
Cameroon -1,09 1
Canada 1,30 5
Chad -1,45 1
Chile 0,67 4
China, People's Republic of 0,04 3
Colombia -0,27 2
Comoros -0,88 1
Congo, Democratic Republic
of -1,15 1
Congo, Republic of -1,23 1
Costa Rica 0,10 3
Côte d'Ivoire -0,82 1
Croatia 0,40 3
Cyprus 0,62 4
Czech Republic 0,90 4
Denmark 1,36 5
Dominican Republic -0,30 2
El Salvador -0,13 2
Equatorial Guinea -1,32 1
Estonia 0,92 4
Finland 1,34 5
France 1,05 4
Gabon -0,64 1
Georgia -0,05 3
Germany 1,45 5
Ghana -0,77 1
Greece 0,39 3
Guatemala -0,60 1
Guinea-Bissau -1,23 1
Guyana -0,50 2
Haiti -1,55 1
Hong Kong SAR 1,36 5
Hungary 0,57 4
Iceland 0,97 4
India -0,33 2

Direct Research Work Project for the Masters in Management – Marta Guedes
34
Country Total Score Cluster
Indonesia -0,33 2
Iran -0,17 2
Ireland 1,04 4
Israel 0,75 4
Italy 0,63 4
Jamaica 0,07 3
Japan 1,13 5
Jordan -0,04 3
Kazakhstan -0,30 2
Kenya -0,48 2
Korea, Republic of 0,90 4
Kuwait 0,09 3
Latvia 0,68 4
Lebanon -0,34 2
Lesotho -1,05 1
Liberia -1,37 1
Lithuania 0,90 4
Luxembourg 1,39 5
Macedonia, FYR 0,02 3
Madagascar -1,15 1
Malaysia 0,47 3
Maldives -0,42 2
Mali -0,99 1
Malta 0,59 4
Mexico 0,02 3
Mongolia -0,38 2
Montenegro 0,01 3
Morocco -0,35 2
Mozambique -1,06 1
Namibia -0,33 2
Nepal -1,00 1
Netherlands 1,46 5
New Zealand 1,17 5
Nicaragua -0,66 1
Niger -1,08 1
Nigeria -1,25 1
Norway 1,25 5
Oman 0,30 3
Pakistan -0,86 1
Panama 0,26 3
Papua New Guinea -0,92 1
Philippines -0,27 2
Poland 0,73 4
Portugal 0,74 4
Qatar 0,64 4
Romania 0,24 3
Russian Federation -0,57 1
Rwanda -0,41 2
São Tomé and Príncipe -0,84 1
Saudi Arabia 0,13 3
Senegal -0,77 1
Serbia -0,01 3
Singapore 1,47 5

Direct Research Work Project for the Masters in Management – Marta Guedes
35
Country Total Score Cluster
Slovakia 0,67 4
Slovenia 0,66 4
South Africa 0,15 3
Spain 0,91 4
Sweden 1,44 5
Switzerland 1,42 5
Tajikistan -1,07 1
Thailand 0,05 3
Togo -0,87 1
Trinidad and Tobago -0,24 2
Turkey 0,06 3
Uganda -0,73 1
Ukraine -1,04 1
United Arab Emirates 0,84 4
United Kingdom 1,29 5
United States 1,21 5
Uruguay 0,21 3
Zambia -0,83 1
Table 6 – Country cluster analysis for all the countries where data for all the indicators were available
Cluster 1 Cluster 2 Cluster 3 Cluster 4 Cluster 5
Haiti Burkina Faso Iran Hungary Japan
Chad Benin El Salvador Malta New Zealand
Liberia Ghana Georgia Cyprus Belgium
Equatorial Guinea Senegal Jordan Italy United States
Angola Uganda Serbia Qatar Norway
Nigeria Cambodia Montenegro Slovenia Australia
Guinea-Bissau Nicaragua Mexico Slovakia United
Kingdom
Congo, Rep. of Gabon Macedonia Chile Austria
Madagascar Guatemala China, People's
Rep. Latvia Canada
Congo, Dem. Rep. Russian Fed. Thailand Poland Finland
Cameroon Bhutan Turkey Portugal Hong Kong
SAR
Niger Guyana Jamaica Israel Denmark
Tajikistan Kenya Kuwait United Arab
Emirates Luxembourg
Mozambique Maldives Costa Rica Lithuania Switzerland
Lesotho Rwanda Saudi Arabia Czech Rep. Sweden
Ukraine Mongolia Botswana Korea, Rep. of Germany
Belarus Armenia South Africa Spain Netherlands
Nepal Morocco Bulgaria Estonia Singapore
Mali Lebanon Uruguay Iceland
Papua New Guinea Namibia Romania Ireland
Bangladesh India Bahamas France
Comoros Indonesia Panama
Togo Dominican Rep. Oman
Pakistan Kazakhstan Bahrain
Bolivia Philippines Brunei
Darussalam
São Tomé and Colombia Greece

Direct Research Work Project for the Masters in Management – Marta Guedes
36
Príncipe
Zambia Trinidad and Tobago Croatia
Côte d'Ivoire Albania Malaysia
Brazil
Bosnia and
Herzegovina
Country cluster analysis for all the countries where data for all the indicators were available. Countries in
bolt are the ones where Parfois is already present and in red are the inadmissible ones.
Table 7 – Country cluster analysis for all the countries where data for all the indicators were available, minus the ones where Parfois is
already present and the inadmissible countries
Cluster 1 Cluster 2 Cluster 3 Cluster 4 Cluster 5
Haiti Burkina Faso El Salvador Israel Japan
Chad Benin Montenegro Lithuania United States
Liberia Ghana Mexico Korea, Rep. of Norway
Nigeria Senegal China, People's Rep. Iceland Canada
Guinea-Bissau Cambodia Thailand
Finland
Cameroon Nicaragua Turkey
Hong Kong SAR
Niger Bhutan Jamaica
Denmark
Tajikistan Guyana Costa Rica
Luxembourg
Belarus Mongolia Bahamas
Switzerland
Nepal India Brunei Darussalam
Sweden
Mali Kazakhstan Greece
Netherlands
Bangladesh Trinidad and Tobago Malaysia
Singapore
Togo Bosnia and Herzegovina
Pakistan
Côte d'Ivoire

Direct Research Work Project for the Masters in Management – Marta Guedes
37
Appendix IV – Tables for Country Ranking
Country Market
Size
Market Size
Rank
Market
Growth
Market Growth
Rank
China 8,22 1 1,23 6
United States 4,18 2 -0,21 69
India 2,89 3 0,79 17
Qatar -0,29 75 0,47 29
Singapore -0,26 58 -0,19 68
Malaysia -0,11 31 1,11 7
Germany 0,45 8 -0,49 81
Japan 1,07 6 -0,60 90
United Arab Emirates -0,21 42 0,12 43
Mongolia -0,31 98 1,36 4
Niger -0,31 88 2,30 1
Brazil 1,08 4 -0,38 78
France 0,40 10 -0,56 86
United Kingdom 0,23 13 -0,34 75
Congo Democratic Republic of the -0,14 33 1,31 5
Albania -0,32 103 0,86 13
South Sudan -0,32 102 1,74 3
Spain 0,09 19 -1,08 107
Norway -0,20 39 0,30 37
Ethiopia -0,22 43 1,83 2
Mexico 0,45 9 -0,17 67
Belgium -0,21 41 -0,38 79
Bahrain -0,31 95 0,55 25
Guatemala -0,28 65 0,80 16
Cameroon -0,25 53 0,95 10
Turkey 0,17 16 0,03 49
Indonesia 0,59 7 0,44 32
Nicaragua -0,31 86 0,56 24
Canada 0,30 12 -0,36 76
Switzerland -0,25 50 -0,11 61
Kuwait -0,26 61 -0,13 64
Iceland -0,32 99 0,11 46
Oman -0,29 74 0,75 19
Nigeria 0,18 14 0,64 21
Australia -0,03 27 -0,13 63
Korea South 0,30 11 -0,32 73
Dominican Republic -0,27 63 0,30 36
Mozambique -0,27 62 0,97 9
Togo -0,31 96 0,78 18
Bolivia -0,28 70 0,66 20
Kenya -0,26 57 1,09 8
Bangladesh 0,02 21 0,87 12
Chile -0,19 37 0,00 53
Netherlands -0,17 36 -0,58 88
Jordan -0,28 69 -0,12 62
Ghana -0,24 47 0,80 15
Vietnam -0,07 28 0,61 22

Direct Research Work Project for the Masters in Management – Marta Guedes
38
Country Market
Size
Market Size
Rank
Market
Growth
Market Growth
Rank
Benin -0,30 83 0,92 11
Ireland -0,29 77 -0,02 54
Lebanon -0,29 73 -0,11 60
Russia 1,07 5 -0,92 103
New Zealand -0,28 66 0,01 52
Thailand -0,02 25 0,46 30
Pakistan 0,16 17 0,35 35
Philippines -0,02 26 0,46 31
Cambodia -0,31 91 0,85 14
Israel -0,24 48 -0,17 66
Paraguay -0,26 59 0,40 33
Honduras -0,30 79 0,18 41
Kyrgyzstan -0,31 87 0,12 45
Costa Rica -0,30 81 0,16 42
Sweden -0,16 35 -0,36 77
Kazakhstan -0,21 40 0,57 23
Saudi Arabia 0,01 23 -0,25 70
Estonia -0,32 100 0,05 47
Gabon -0,32 108 0,52 27
Uruguay -0,30 84 -0,31 71
Peru -0,16 34 0,03 48
Colombia -0,08 29 -0,02 55
Iran 0,18 15 -0,10 57
Denmark -0,28 67 -0,52 83
Congo Republic of the -0,31 93 0,51 28
South Africa 0,05 20 -0,10 58
Panama -0,31 89 0,18 40
Sudan -0,25 51 0,26 38
Egypt 0,01 22 -0,11 59
Morocco -0,19 38 0,12 44
Algeria -0,13 32 0,36 34
Ecuador -0,26 56 0,22 39
El Salvador -0,30 82 -0,54 85
Slovakia -0,29 76 -0,32 74
Austria -0,25 52 -0,56 87
Nepal -0,30 78 0,54 26
Jamaica -0,32 106 -0,31 72
Montenegro -0,33 111 -0,53 84
Poland -0,09 30 -0,47 80
Georgia -0,31 92 -0,14 65
Czechia -0,23 45 -0,61 92
Senegal -0,29 72 0,02 50
Armenia -0,31 97 -0,52 82
Italy 0,12 18 -1,12 108
Hungary -0,27 64 -0,59 89
Portugal -0,25 55 -0,60 91
Finland -0,25 54 -0,94 104
Latvia -0,32 104 -0,67 95
Lithuania -0,32 101 -0,92 101
Serbia -0,28 68 -0,62 93
Azerbaijan -0,28 71 0,01 51
Moldova -0,32 105 -0,85 99
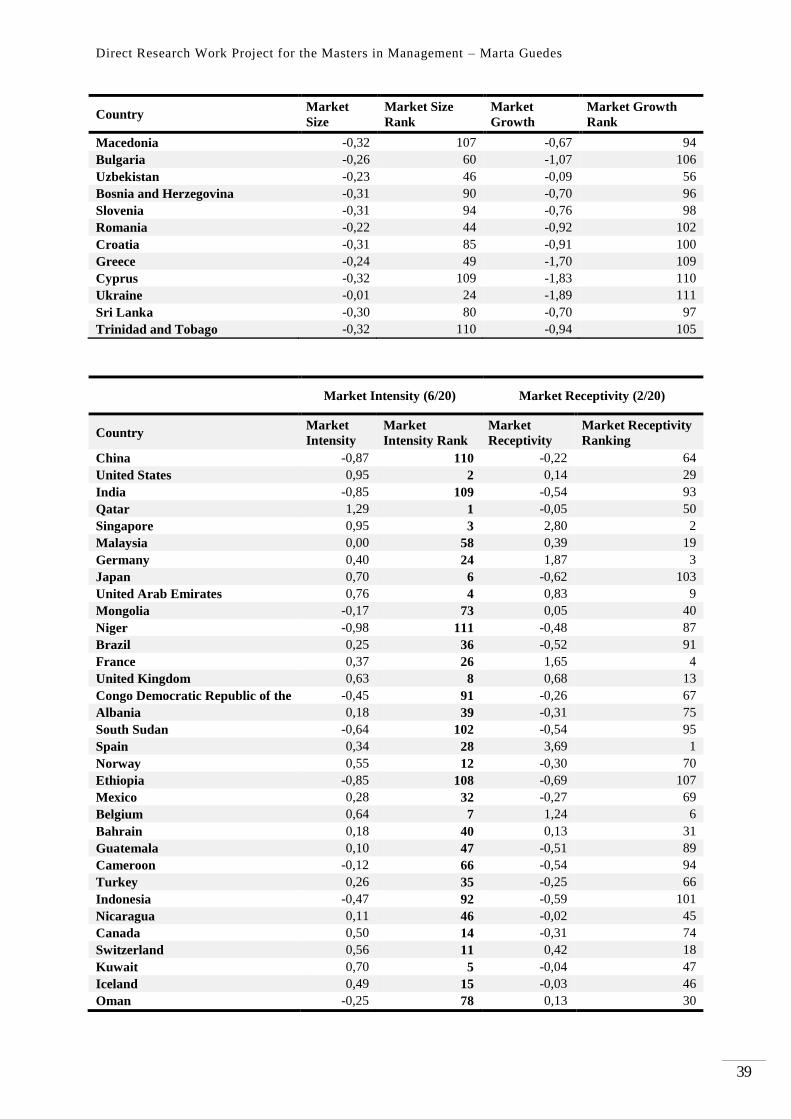
Direct Research Work Project for the Masters in Management – Marta Guedes
39
Country Market
Size
Market Size
Rank
Market
Growth
Market Growth
Rank
Macedonia -0,32 107 -0,67 94
Bulgaria -0,26 60 -1,07 106
Uzbekistan -0,23 46 -0,09 56
Bosnia and Herzegovina -0,31 90 -0,70 96
Slovenia -0,31 94 -0,76 98
Romania -0,22 44 -0,92 102
Croatia -0,31 85 -0,91 100
Greece -0,24 49 -1,70 109
Cyprus -0,32 109 -1,83 110
Ukraine -0,01 24 -1,89 111
Sri Lanka -0,30 80 -0,70 97
Trinidad and Tobago -0,32 110 -0,94 105
Market Intensity (6/20) Market Receptivity (2/20)
Country Market
Intensity
Market
Intensity Rank
Market
Receptivity
Market Receptivity
Ranking
China -0,87 110 -0,22 64
United States 0,95 2 0,14 29
India -0,85 109 -0,54 93
Qatar 1,29 1 -0,05 50
Singapore 0,95 3 2,80 2
Malaysia 0,00 58 0,39 19
Germany 0,40 24 1,87 3
Japan 0,70 6 -0,62 103
United Arab Emirates 0,76 4 0,83 9
Mongolia -0,17 73 0,05 40
Niger -0,98 111 -0,48 87
Brazil 0,25 36 -0,52 91
France 0,37 26 1,65 4
United Kingdom 0,63 8 0,68 13
Congo Democratic Republic of the -0,45 91 -0,26 67
Albania 0,18 39 -0,31 75
South Sudan -0,64 102 -0,54 95
Spain 0,34 28 3,69 1
Norway 0,55 12 -0,30 70
Ethiopia -0,85 108 -0,69 107
Mexico 0,28 32 -0,27 69
Belgium 0,64 7 1,24 6
Bahrain 0,18 40 0,13 31
Guatemala 0,10 47 -0,51 89
Cameroon -0,12 66 -0,54 94
Turkey 0,26 35 -0,25 66
Indonesia -0,47 92 -0,59 101
Nicaragua 0,11 46 -0,02 45
Canada 0,50 14 -0,31 74
Switzerland 0,56 11 0,42 18
Kuwait 0,70 5 -0,04 47
Iceland 0,49 15 -0,03 46
Oman -0,25 78 0,13 30
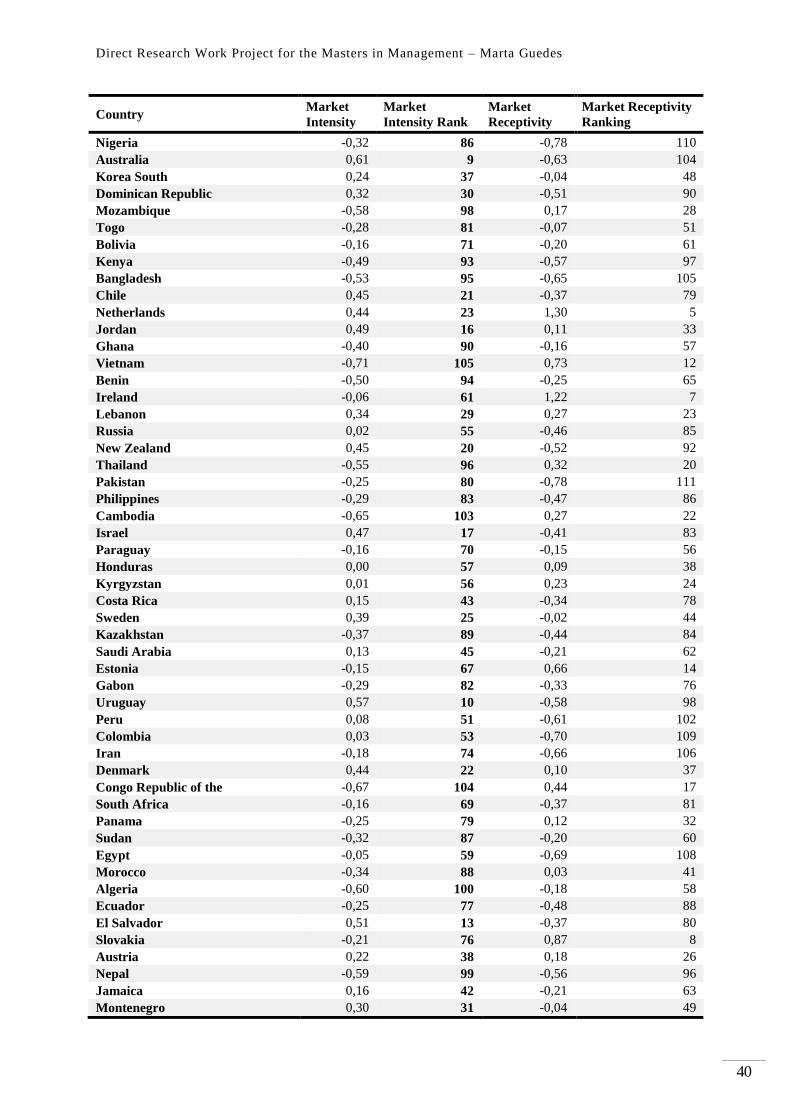
Direct Research Work Project for the Masters in Management – Marta Guedes
40
Country Market
Intensity
Market
Intensity Rank
Market
Receptivity
Market Receptivity
Ranking
Nigeria -0,32 86 -0,78 110
Australia 0,61 9 -0,63 104
Korea South 0,24 37 -0,04 48
Dominican Republic 0,32 30 -0,51 90
Mozambique -0,58 98 0,17 28
Togo -0,28 81 -0,07 51
Bolivia -0,16 71 -0,20 61
Kenya -0,49 93 -0,57 97
Bangladesh -0,53 95 -0,65 105
Chile 0,45 21 -0,37 79
Netherlands 0,44 23 1,30 5
Jordan 0,49 16 0,11 33
Ghana -0,40 90 -0,16 57
Vietnam -0,71 105 0,73 12
Benin -0,50 94 -0,25 65
Ireland -0,06 61 1,22 7
Lebanon 0,34 29 0,27 23
Russia 0,02 55 -0,46 85
New Zealand 0,45 20 -0,52 92
Thailand -0,55 96 0,32 20
Pakistan -0,25 80 -0,78 111
Philippines -0,29 83 -0,47 86
Cambodia -0,65 103 0,27 22
Israel 0,47 17 -0,41 83
Paraguay -0,16 70 -0,15 56
Honduras 0,00 57 0,09 38
Kyrgyzstan 0,01 56 0,23 24
Costa Rica 0,15 43 -0,34 78
Sweden 0,39 25 -0,02 44
Kazakhstan -0,37 89 -0,44 84
Saudi Arabia 0,13 45 -0,21 62
Estonia -0,15 67 0,66 14
Gabon -0,29 82 -0,33 76
Uruguay 0,57 10 -0,58 98
Peru 0,08 51 -0,61 102
Colombia 0,03 53 -0,70 109
Iran -0,18 74 -0,66 106
Denmark 0,44 22 0,10 37
Congo Republic of the -0,67 104 0,44 17
South Africa -0,16 69 -0,37 81
Panama -0,25 79 0,12 32
Sudan -0,32 87 -0,20 60
Egypt -0,05 59 -0,69 108
Morocco -0,34 88 0,03 41
Algeria -0,60 100 -0,18 58
Ecuador -0,25 77 -0,48 88
El Salvador 0,51 13 -0,37 80
Slovakia -0,21 76 0,87 8
Austria 0,22 38 0,18 26
Nepal -0,59 99 -0,56 96
Jamaica 0,16 42 -0,21 63
Montenegro 0,30 31 -0,04 49

Direct Research Work Project for the Masters in Management – Marta Guedes
41
Country Market
Intensity
Market
Intensity Rank
Market
Receptivity
Market Receptivity
Ranking
Poland -0,06 62 0,10 34
Georgia -0,17 72 0,00 42
Czechia -0,06 60 0,77 11
Senegal -0,30 84 -0,31 72
Armenia 0,27 34 -0,31 73
Italy 0,27 33 0,10 35
Hungary -0,12 65 0,82 10
Portugal 0,16 41 -0,27 68
Finland 0,46 19 -0,19 59
Latvia 0,05 52 0,20 25
Lithuania 0,13 44 0,63 15
Serbia 0,02 54 -0,07 52
Azerbaijan -0,58 97 -0,37 82
Moldova 0,09 49 0,17 27
Macedonia -0,08 63 0,10 36
Bulgaria 0,09 48 0,32 21
Uzbekistan -0,63 101 -0,59 99
Bosnia and Herzegovina -0,12 64 -0,14 54
Slovenia -0,31 85 0,47 16
Romania -0,21 75 -0,12 53
Croatia -0,16 68 -0,14 55
Greece 0,47 18 -0,34 77
Cyprus 0,34 27 0,06 39
Ukraine 0,08 50 0,00 43
Sri Lanka -0,77 106 -0,59 100
Trinidad and Tobago -0,81 107 -0,31 71
Country Total Country Ranking Score Total Rank
China 2,55 1
United States 1,49 2
India 0,80 3
Qatar 0,43 4
Singapore 0,43 5
Malaysia 0,34 6
Germany 0,30 7
Japan 0,29 8
United Arab Emirates 0,28 9
Mongolia 0,27 10
Niger 0,26 11
Brazil 0,23 12
France 0,23 13
United Kingdom 0,22 14
Congo Democratic Republic of
the 0,19 15
Albania 0,19 16
South Sudan 0,18 17
Spain 0,17 18
Norway 0,16 19
Ethiopia 0,16 20

Direct Research Work Project for the Masters in Management – Marta Guedes
42
Country Total Country Ranking Score Total Rank
Mexico 0,14 21
Belgium 0,14 22
Bahrain 0,14 23
Guatemala 0,14 24
Cameroon 0,12 25
Turkey 0,11 26
Indonesia 0,11 27
Nicaragua 0,11 28
Canada 0,10 29
Switzerland 0,10 30
Kuwait 0,09 31
Iceland 0,08 32
Oman 0,07 33
Nigeria 0,07 34
Australia 0,07 35
Korea South 0,06 36
Dominican Republic 0,05 37
Mozambique 0,05 38
Togo 0,05 39
Bolivia 0,05 40
Kenya 0,04 41
Bangladesh 0,04 42
Chile 0,04 43
Netherlands 0,04 44
Jordan 0,04 45
Ghana 0,03 46
Vietnam 0,02 47
Benin 0,01 48
Ireland 0,01 49
Lebanon 0,01 50
Russia 0,00 51
New Zealand 0,00 52
Thailand 0,00 53
Pakistan 0,00 54
Philippines 0,00 55
Cambodia -0,01 56
Israel -0,02 57
Paraguay -0,02 58
Honduras -0,03 59
Kyrgyzstan -0,03 60
Costa Rica -0,03 61
Sweden -0,04 62
Kazakhstan -0,05 63
Saudi Arabia -0,05 64
Estonia -0,06 65
Gabon -0,06 66
Uruguay -0,07 67
Peru -0,08 68
Colombia -0,09 69
Iran -0,10 70
Denmark -0,10 71
Congo Republic of the -0,10 72

Direct Research Work Project for the Masters in Management – Marta Guedes
43
Country Total Country Ranking Score Total Rank
South Africa -0,10 73
Panama -0,10 74
Sudan -0,11 75
Egypt -0,12 76
Morocco -0,12 77
Algeria -0,13 78
Ecuador -0,13 79
El Salvador -0,14 80
Slovakia -0,16 81
Austria -0,16 82
Nepal -0,16 83
Jamaica -0,16 84
Montenegro -0,17 85
Poland -0,18 86
Georgia -0,19 87
Czechia -0,19 88
Senegal -0,20 89
Armenia -0,20 90
Italy -0,21 91
Hungary -0,21 92
Portugal -0,24 93
Finland -0,24 94
Latvia -0,26 95
Lithuania -0,27 96
Serbia -0,27 97
Azerbaijan -0,29 98
Moldova -0,31 99
Macedonia -0,31 100
Bulgaria -0,34 101
Uzbekistan -0,34 102
Bosnia and Herzegovina -0,35 103
Slovenia -0,37 104
Romania -0,42 105
Croatia -0,43 106
Greece -0,47 107
Cyprus -0,54 108
Ukraine -0,54 109
Sri Lanka -0,59 110
Trinidad and Tobago -0,65 111
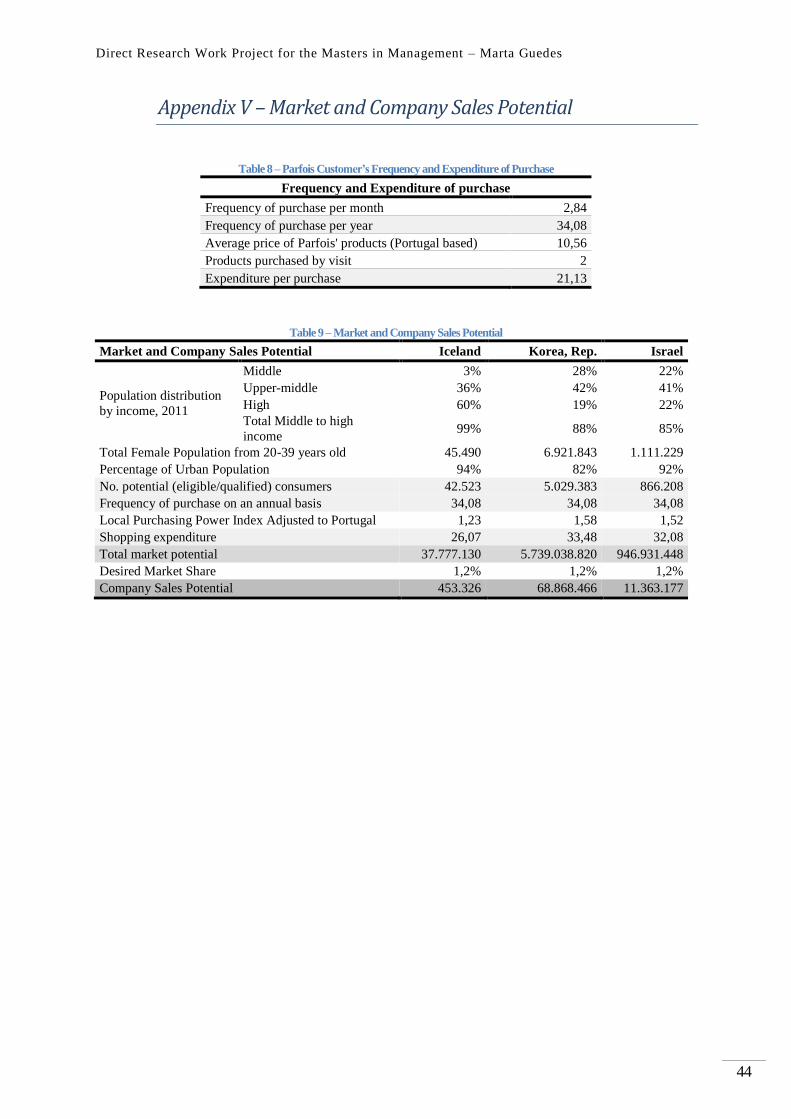
Direct Research Work Project for the Masters in Management – Marta Guedes
44
Appendix V – Market and Company Sales Potential
Table 8 – Parfois Customer’s Frequency and Expenditure of Purchase
Frequency and Expenditure of purchase
Frequency of purchase per month 2,84
Frequency of purchase per year 34,08
Average price of Parfois' products (Portugal based) 10,56
Products purchased by visit 2
Expenditure per purchase 21,13
Table 9 – Market and Company Sales Potential
Market and Company Sales Potential Iceland Korea, Rep. Israel
Population distribution
by income, 2011
Middle 3% 28% 22%
Upper-middle 36% 42% 41%
High 60% 19% 22%
Total Middle to high
income 99% 88% 85%
Total Female Population from 20-39 years old 45.490 6.921.843 1.111.229
Percentage of Urban Population 94% 82% 92%
No. potential (eligible/qualified) consumers 42.523 5.029.383 866.208
Frequency of purchase on an annual basis 34,08 34,08 34,08
Local Purchasing Power Index Adjusted to Portugal 1,23 1,58 1,52
Shopping expenditure 26,07 33,48 32,08
Total market potential 37.777.130 5.739.038.820 946.931.448
Desired Market Share 1,2% 1,2% 1,2%
Company Sales Potential 453.326 68.868.466 11.363.177

Direct Research Work Project for the Masters in Management – Marta Guedes
45
Appendix VI – Tables Country Entry Conditions
Table 10 – Ease of Doing Business Index Dimension rankings for the selected countries
Index Dimensions Rank Korea, Rep. Rank Israel Rank
Starting a Business 23 56
Dealing with Construction Permits 28 96
Getting Electricity 1 91
Registering Property 40 127
Getting Credit 42 42
Protecting Minority Investors 8 8
Paying Taxes 29 103
Trading Across Borders 31 58
Enforcing Contracts 2 77
Resolving Insolvency 4 29
Ease of Doing Business Rank 4 53
Table 11 – Logistics Performance Index Dimension ranking for the selected countries
LPI Dimensions Rank Korea, Rep. Israel
Customs 29 23
Infrastructure 19 29
International shipments 26 36
Logistics competence 24 27
Tracking & tracing 24 26
Timeliness 21 10
LPI Score 24 26
Table 12 Economic Freedom Index Dimension ranking for the selected countries
Economic Freedom Index Korea, South Israel
Property Rights 28 25
Freedom from Corruption 44 37
Fiscal Freedom 119 163
Gov't Spending 88 136
Business Freedom 7 59
Labor Freedom 130 66
Monetary Freedom 39 23
Trade Freedom 99 8
Investment Freedom 49 10
Financial Freedom 3 18
2016 EFI Rank 27 35

Direct Research Work Project for the Masters in Management – Marta Guedes
46